benchmark-problem instances for static scheduling of task graphs with communication delays on...
TRANSCRIPT
Computers & Operations Research 33 (2006) 2155–2177www.elsevier.com/locate/cor
Benchmark-problem instances for static scheduling of task graphswith communication delays on homogeneous multiprocessor
systems
Tatjana Davidovica,∗, Teodor Gabriel Crainicb,c
aMathematical Institute, Serbian Academy of Science and Arts, Kneza Mihaila 35, 11000 Belgrade, Serbia and MontenegrobDepartement management et technologie, École des sciences de la gestion, Université du Québec à Montréal, Canada
cCentre de recherche sur les transports, Université de Montréal, Canada
Available online 1 February 2005
Abstract
Scheduling program tasks on processors is at the core of the efficient use of multiprocessor systems. Most task-scheduling problems are known to be NP-Hard and, thus, heuristics are the method of choice in all but the simplestcases. The utilization of acknowledged sets of benchmark-problem instances is essential for the correct comparisonand analysis of heuristics. Yet, such sets are not available for several important classes of scheduling problems,including multiprocessor scheduling problem with communication delays (MSPCD) where one is interested inscheduling dependent tasks onto homogeneous multiprocessor systems, with processors connected in an arbitraryway, while explicitly accounting for the time required to transfer data between tasks allocated to different processors.We propose test-problem instances for the MSPCD that are representative in terms of number of processors, type ofmultiprocessor architecture, number of tasks to be scheduled, and task graph characteristics (task execution times,communication costs, and density of dependencies between tasks). Moreover, we define our task-graph generatorsin a way appropriate to ensure that the corresponding problem instances obey the theoretical principles recentlyproposed in the literature.� 2005 Elsevier Ltd. All rights reserved.
Keywords: Multiprocessor systems; Task scheduling; Communication delays; Benchmark-problem instances
∗ Corresponding author.E-mail addresses: [email protected] (T. Davidovic), [email protected] (T.G. Crainic).
0305-0548/$ - see front matter � 2005 Elsevier Ltd. All rights reserved.doi:10.1016/j.cor.2005.01.005
2156 T. Davidovic, T.G. Crainic / Computers & Operations Research 33 (2006) 2155–2177
1. Introduction
Scheduling program modules (tasks) for execution on a set of processors is at the core of the efficient useof multiprocessor systems and is being studied for over 40 years now [1]. Most task scheduling problemsare known to be NP-Hard [2,3]. There are only a few special cases that can be solved to optimality inpolynomial time [4–6]. For all the other problem variants, heuristics have been mainly proposed [7–11](see [12,13] for recent surveys on these topics).
We are particularly interested in the problem of scheduling dependent tasks onto homogeneous multi-processor systems with processors connected in an arbitrary way, while explicitly accounting for the timerequired to transfer data between the tasks allocated to different processors. We refer to this variant of taskscheduling problem as the multiprocessor scheduling problem with communication delays (MSPCD).
It is generally difficult to analyze and compare the performance of heuristics, even when they address thesame scheduling problem variant. On the one hand, theoretical performance measures are difficult to comeby. On the other hand, the experimental analysis is hampered by the fact that most papers propose new testinstances and report performance results for these examples only. The utilization of acknowledged setsof benchmark-problem instances (e.g., the OR Library at http://mscmga.ms.ic.ac.uk/info.html) to reportcomputational results contributes to alleviate this issue. Such sets of benchmark-problem instances are notavailable for all classes of scheduling problems, however. Thus, very few benchmark-problem instanceshave been proposed for task scheduling on multiprocessor systems [14–16]. Moreover, it turns out thatthese problems are often addressing particular multiprocessor architectures, do not involve communicationdelays, and are not very challenging with respect to some other parameters of the problem. There is thusthe need for a more complete and challenging set of benchmark-problem instances.
The objective of this paper is to propose benchmark-problem instances for the MSPCD that are rep-resentative in terms of number of processors, type of multiprocessor architecture, number of tasks tobe scheduled, and task graph characteristics (task execution times, communication costs, and density ofdependencies between tasks). We show that the problem sets we propose overcome most of the drawbacksdisplayed by other sets of test problems available in the literature. Moreover, task-graph generators aredefined such that the corresponding problem instances obey the principles proposed recently by Hall andPosner [17].
The scheduling heuristics used to evaluate the proposed test-problem instances, as well as those presentin the literature and related to the MSPCD, provide a fair representation of the main heuristic approaches:breath/depth first search, explicit/implicit treatment of communications, priority/dependency-based se-lection of tasks, minimization/maximization of the number of processors used, and so on. We may thusnot only confirm the well-known fact that there are “easy” and “hard” graphs for each heuristic but, mostimportantly, to explain how scheduling results depend on the task graph and the characteristics of themultiprocessor system.
To sum up, the main contributions of the paper are: (1) a critical analysis of existing test-problem setsfor scheduling problems related to the MSPCD; (2) new sets of benchmark-task graphs for the MSPCD,a problem variant not yet directly considered in the literature, with parameter variations that ensurea fair evaluation of scheduling algorithms; and (3) the experimental analysis of the proposed sets ofbenchmark-problem instances.
The paper is organized as follows. The MSPCD scheduling problem is described in Section 2, togetherwith the scheduling heuristics used for experimental evaluations. Section 3 reviews the literature andanalyzes the existing sets of test-problem instances, indicating weaknesses and pointing to the need for
T. Davidovic, T.G. Crainic / Computers & Operations Research 33 (2006) 2155–2177 2157
new problem sets. The benchmark-problem instances that we propose are described in the next section,together with the corresponding task graph generators. Section 5 presents an experimental analysis ofthese sets. Section 6 concludes the paper.
2. Multiprocessor scheduling problem with communication delays
In this section, we first recall the graph-based combinatorial formulation of the MSPCD problem. Wethen describe the characteristics of the scheduling heuristics used to evaluate the sets of test-probleminstances.
The tasks to be scheduled are represented by a directed acyclic graph (DAG) [11,18,19] defined by atuple G = (T , E, C, L), where T = {t1, . . . , tn} denotes the set of tasks; E = {eij|ti , tj ∈ T } representsthe set of precedence/communication edges; C = {cij|eij ∈ E} denotes the set of edge communicationcosts; and L = {l1, . . . , ln} represents the set of task computation times (execution times, lengths). Thecommunication cost cij ∈ C corresponds to the amount of data transferred between tasks ti and tj whenexecuted on different processors. When both tasks are assigned to the same processor, the communicationcost equals zero. The set E defines precedence relations between tasks. A task cannot be executed unlessall its predecessors have completed their execution and all relevant data is available. Task preemption andredundant executions are not allowed in the problem version considered in this paper.
The multiprocessor system M is assumed to contain p identical processors with their own local memo-ries. Processors communicate by exchanging messages through bidirectional links of equal capacity. Thearchitecture is modelled by a distance matrix [7,18]. The element (k, l) of the distance matrix D=[dkl]p×p
equals the minimum number of links connecting the nodes pk and pl . The distance matrix is thus sym-metric with zero diagonal elements. We also assume that each processor constituting the multiprocessorsystem has I/O processing units for all communication links so that computations and communicationscan be performed simultaneously.
The scheduling of DAG G onto M consists in determining a processor index and starting-time instantfor each task inG in such a way as to minimize a given objective function.An often used objective function(that we use in this paper as well) represents the completion time of the scheduled task graph (also referredto as makespan, response time or schedule length). The starting time of a task ti is determined by thecompletion times of its predecessors and the amount of time needed to transfer the associated data fromthe processors executing these predecessors to the processor that executes the task ti . The communicationtime between tasks ti and tj , executed on processors pk and pl , respectively, may be calculated as
�kl
ij = cijdklccr,
where ccr is architecture-dependent and represents the communication-to-computation-ratio, defined asthe ratio between the transfer time of a unit of data and the time required to perform a single computationaloperation. (Note that this definition characterizes the multiprocessor architecture; ccr is thus differentfrom the CCR parameter of Kwok and Ahmad [15,20], which is defined as the ratio between the totalcommunication and computation times for the given task graph and thus corresponds to a characterizationof the task graph.) When l = k, dkl = 0 implying that �kl
ij = 0.
Scheduling problems are NP-Hard in most cases [2,3] and are usually addressed by using heuristicmethods in all but the simplest cases. This is also the case for task-graph scheduling problems in general
2158 T. Davidovic, T.G. Crainic / Computers & Operations Research 33 (2006) 2155–2177
[7–11] and, in particular, for the MSPCD problem for which a linear programming formulation displaysn6 variables [21].
Most heuristic methods proposed for task-scheduling problems are based on some priority-orderingscheme and include two phases: task ordering and task-to-processor allocation. Heuristic methods maythen be classified according to the order of these two phases [13,22]. A first class of heuristics starts bysorting the tasks according to some priority scheme, followed by the second phase where each task isassigned to the processor which is selected by some scheduling rule. Heuristics that belong to the secondclass, first assign tasks to processors, while the actual schedule, i.e., the definition of the order among tasksand the starting time for each task, is performed during the second phase. For commodity of presentation,we refer to the two classes as list-scheduling and clustering heuristics. The difference between the twoclasses is that the former orders all tasks according to specified priorities prior to assignment, while thelatter first generates subsets of tasks and then orders each subset separately.
Both types of algorithms involve heuristic rules for the task ordering and assignment phases. Task pri-orities may be defined based on task execution times, communication requirements, number of successortasks, and so on. Several criteria may be combined and considered simultaneously. The heuristic taskassignment rule may be breath first, when mutually independent tasks are considered, or depth first inwhich case one examines tasks along paths in the task graph. Scheduling problems and algorithms mayalso be distinguished according to the role associated to the number of processors: one may either use allthe processors available or attempt to minimize the number of processors used.
We selected a set of heuristics that reflect these methodological approaches and used them to investigatethe characteristics of different sets of benchmark-problem instances proposed in the literature as well asour own. Four list-scheduling and two clustering heuristics represent our choice.
The first list-scheduling heuristic is denoted CPES and is a modification of the dynamic level scheduling(DLS) heuristic [11]. The basic idea of DLS is to calculate static task priorities based on the critical path(CP) method and use them to order the tasks and then, to modify them during the scheduling phase toreflect the partial schedules already generated (the best (task, processor) pair is selected for scheduling).The dynamic update of priorities improves somewhat the performance of the scheduling phase, but italso increases its computational burden significantly. Therefore, we decided to use only static, CP-basedpriorities. Notice that the calculation of the critical path does not involve communication times, becausethese depend upon the final task-to-processor assignment and schedule. Thus, only task execution timesli are considered. An earliest start (ES) heuristic is used for scheduling, meaning that one computes thestarting time st(ti , pk) for each task ti and processor pk , the task being allocated to the processor withthe smallest associated starting time value [18].
We also implemented the DeClustering (DC) list-scheduling algorithm [18]. The first phase is basedon a CP-based priority list, which defines a sequential order of execution (i.e., the order of tasks when allassigned to a single processor). In the second phase, tasks are moved one by one to the other availableprocessors for as long as it improves the current schedule. This approach proved very efficient for densetask graphs for which most heuristics yield solutions with large number of idle time intervals due tointer-process data exchanges, resulting in longer parallel execution times than the sequential one [18,22].
The literature hints that the CP rule might not be efficient when communication times are involved[7,12,22]. Consequently, we also implemented two variants of the previous methods, LPTES and LPTDC,which make use of the largest processing time (LPT) [23] rule to build the priority list of the first phase.
The preferred path selection (PPS) [24] and the load balancing with minimized communications(LBMC) [10] are the two clustering heuristics that we implemented. The main idea of the second method
T. Davidovic, T.G. Crainic / Computers & Operations Research 33 (2006) 2155–2177 2159
is to cluster tasks in the first phase such that processor loads are balanced and inter-processor communi-cations are minimized. The PPS method builds paths through the given DAG such that a task is includedin the path if at least one of its predecessors already belongs to the path. For a task, the path containingthe highest number of predecessors is identified as preferred. Preferred paths are then used to determineclusters. Both methods include a second phase to compute the actual schedules on each processor.
Let us summarize here the differences among the selected scheduling algorithms: CPES is a greedybreath-first heuristics, while PPS performs a depth-first search {or chaining [7]}. LBMC explicitly consid-ers the minimization of communications, while DC includes communication times to improve upon thesequential schedule. Moreover, while CPES and DC aim to minimize the number of processors, LBMCand PPS are using all available processors. Thus, the selected procedures cover the main schedulingheuristic designs and were used in all the experiments reported in this paper.
3. Existing problem sets
Most papers describing benchmark-problem instances for scheduling problems consider simpler casesthan MSPCD, such as DAGs without communication costs or completely connected multiprocessorarchitectures. Thus, only a few sets of test-problem instances may be found in the literature that aresomewhat related to the MSPCD. We review these efforts in this section. Our goal is to qualify theirusefulness to benchmark heuristics for the MSPCD. We base our evaluation both on experimental resultsand on the criteria proposed by Hall and Posner [17].
Hall and Posner [17] addressed the issue of the generation of representative test-problem instances foranalyzing and comparing heuristic algorithms for scheduling problems. They pointed out the need forsets of test problems that address a given scheduling problem variant but are independent of the problemcharacteristics, and may thus be used for a fair evaluation of corresponding algorithms. Hall and Posnerdefined principles that representative sets of test examples should satisfy. They illustrated these principlesby describing the generation process of test problems for two scheduling problems: the minimization ofthe maximum tardiness with release dates, and the minimization of the weighted completion times withdeadlines. These problems are more complex than the MSPCD. We thus assume that the principles andproperties proposed by Hall and Posner hold for this simpler case. The principles that should governthe generation of test-problem instances are: (1) Purpose, the generated examples must be functionalfor the analysis and comparison of algorithms for the given scheduling problem; (2) Comparability,examples should not depend on any characteristic of the experimental environment; (3) Unbiasedness,the generation process should avoid incorporation of any problem characteristic; and (4) Reproducibility,the generation process should be simple and clear so as to be easily repeated for the generation of newadequate data. The generation procedure should display the following properties: (1) variety, the problemgenerator must create a wide range of problem instances; (2) relevance, i.e., create test instances thatmodel real world situations; (3) and (4) scale and size invariance to ensure that the results will not dependon problem instance size; (5) when identical types of input are treated in a similar manner, the generationprocedure satisfies the regularity property; (6)–(8) describability, efficiency, and parsimony to guaranteethat the generation procedure is easy to describe, easy and efficient to implement, use and replicate and,finally, that only parameters that may affect the analysis are varied. The relations between principles andproperties are explained in [17]. In the following, we characterize existing sets of problem instances withrespect to them.

2160 T. Davidovic, T.G. Crainic / Computers & Operations Research 33 (2006) 2155–2177
Coll et al. [14] proposed a set of problems of relatively small sizes with no communication delays.Moreover, scheduling results are available for completely connected heterogeneous multiprocessor sys-tems only. Therefore, these test-problem instances are not appropriate for MSPCD.
A similar conclusion is reached relative to the very large set of problem instances proposed by Tobitaand Kasahara [16]. The problem-instance generators satisfy most of the principles and properties of [17](the parsimony criterion does not appear to be strictly enforced). Communication delays and arbitrarymultiprocessor architecture were not considered, however, which make these test-problem instances notsuitable for MSPCD. (Appendix B presents scheduling results using the selected heuristics on some ofthese problem instances.)
According to the authors’knowledge, Kwok andAhmad [15] proposed the only existing sets of probleminstances closely related to the problem addressed in this paper. They considered the communicationdelays. Multiprocessor architecture was assumed to be completely connected, however.
Kwok and Ahmad [15] collected 15 scheduling algorithms proposed in the literature and generatedseveral sets of test instances to compare them. The authors divided the scheduling algorithms into fivesomewhat homogeneous groups and compared the algorithms within groups. The five groups of algorithmswere classified as SRC (scheduling restricted graphs), TDB (task duplication based), UNC (unboundednumber of clusters), BNP (bounded number of (completely connected) processors), and APN (arbitraryprocessor networks). APN is thus the only group of algorithms that appears suitable for MSPCD but, itwas not analyzed in details in [15].
Test instances were also partitioned into groups. Not all scheduling algorithms were applied to allgroups. The proposed groups of task graphs were PSG (peer set graph containing small-sized graphs col-lected from the literature), RGBOS (random graphs with branch-and-bound obtained optimal solutions),RGPOS (random graphs with preselected optimal solutions), RGNOS (random graphs with not-knownoptimal solutions), and TG (traced graphs, representing real-world applications). PSG and TG containgraphs of particular structure (e.g., triangle- or diamond-like) and their characteristics, scheduling envi-ronment, and results were not detailed. Therefore, we focus our analysis on the remaining three groups,RGBOS, RGPOS, and RGNOS, that consider communication delays, even though results were reportedfor completely connected processor networks only. The set of scheduling algorithms that considers APNcan be applied to these instances. All the scheduling algorithms we implemented can be classified asAPN, some being similar to those used in [15] (e.g., DLS and DC).
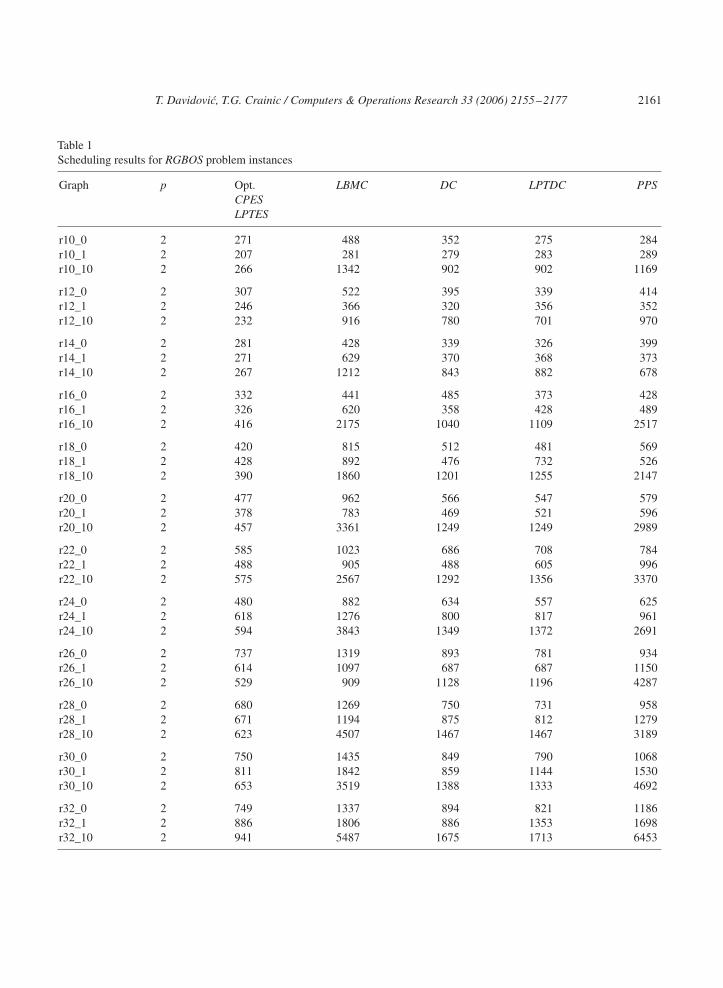
The RGBOS set of test examples contains 36 graphs, 3 graphs with different values for the CCRparameter (0, 1, and 10) for each of the 12 DAG sizes corresponding to a number of tasks n ranging from10 to 32 by increment of 2. Optimal solutions for these small examples were determined by using anA∗ enumeration algorithm [25]. The heuristic results reported in [15] for scheduling these task graphson a 2-processor system displayed 1–8% deviations from the optimum. The results obtained using theheuristics we selected are given in Table 1. CPES and LPTES always yielded optimal solutions. Probleminstances are identified in Table 1 with the letter “r” (for “random”), followed by the number of tasks andthe value of the CCR parameter.
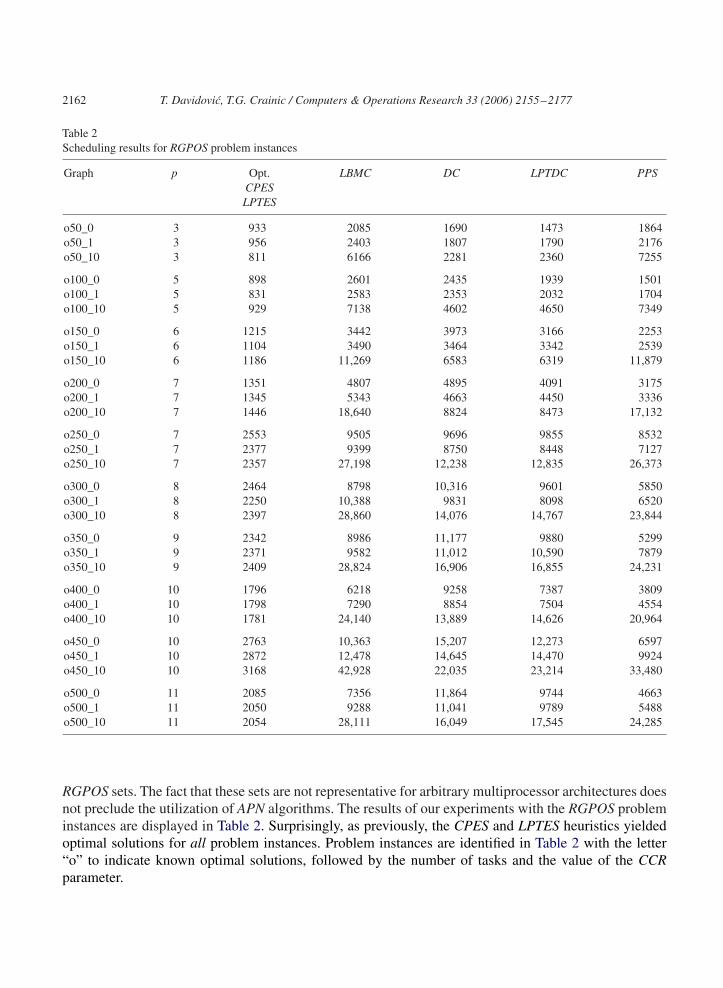
The second group of test-problem instances, RGPOS, consists of 30 instances with the preselectedoptimal solution for completely connected multiprocessor systems. For these examples, n ranges from50 to 500 by an increment of 50 and for each n, the same three values were used for the CCR parameter.Scheduling results were reported for 11 scheduling algorithms with an average deviation from the optimumof 2–15%. The optimal solutions were obtained only in a few cases. Surprisingly, in the [15] study, mostscheduling algorithms from the APN group were not applied to the test instances from the RGBOS and
T. Davidovic, T.G. Crainic / Computers & Operations Research 33 (2006) 2155–2177 2161
Table 1Scheduling results for RGBOS problem instances
Graph p Opt. LBMC DC LPTDC PPSCPESLPTES
r10_0 2 271 488 352 275 284r10_1 2 207 281 279 283 289r10_10 2 266 1342 902 902 1169
r12_0 2 307 522 395 339 414r12_1 2 246 366 320 356 352r12_10 2 232 916 780 701 970
r14_0 2 281 428 339 326 399r14_1 2 271 629 370 368 373r14_10 2 267 1212 843 882 678
r16_0 2 332 441 485 373 428r16_1 2 326 620 358 428 489r16_10 2 416 2175 1040 1109 2517
r18_0 2 420 815 512 481 569r18_1 2 428 892 476 732 526r18_10 2 390 1860 1201 1255 2147
r20_0 2 477 962 566 547 579r20_1 2 378 783 469 521 596r20_10 2 457 3361 1249 1249 2989
r22_0 2 585 1023 686 708 784r22_1 2 488 905 488 605 996r22_10 2 575 2567 1292 1356 3370
r24_0 2 480 882 634 557 625r24_1 2 618 1276 800 817 961r24_10 2 594 3843 1349 1372 2691
r26_0 2 737 1319 893 781 934r26_1 2 614 1097 687 687 1150r26_10 2 529 909 1128 1196 4287
r28_0 2 680 1269 750 731 958r28_1 2 671 1194 875 812 1279r28_10 2 623 4507 1467 1467 3189
r30_0 2 750 1435 849 790 1068r30_1 2 811 1842 859 1144 1530r30_10 2 653 3519 1388 1333 4692
r32_0 2 749 1337 894 821 1186r32_1 2 886 1806 886 1353 1698r32_10 2 941 5487 1675 1713 6453
2162 T. Davidovic, T.G. Crainic / Computers & Operations Research 33 (2006) 2155–2177
Table 2Scheduling results for RGPOS problem instances
Graph p Opt. LBMC DC LPTDC PPSCPESLPTES
o50_0 3 933 2085 1690 1473 1864o50_1 3 956 2403 1807 1790 2176o50_10 3 811 6166 2281 2360 7255
o100_0 5 898 2601 2435 1939 1501o100_1 5 831 2583 2353 2032 1704o100_10 5 929 7138 4602 4650 7349
o150_0 6 1215 3442 3973 3166 2253o150_1 6 1104 3490 3464 3342 2539o150_10 6 1186 11,269 6583 6319 11,879
o200_0 7 1351 4807 4895 4091 3175o200_1 7 1345 5343 4663 4450 3336o200_10 7 1446 18,640 8824 8473 17,132
o250_0 7 2553 9505 9696 9855 8532o250_1 7 2377 9399 8750 8448 7127o250_10 7 2357 27,198 12,238 12,835 26,373
o300_0 8 2464 8798 10,316 9601 5850o300_1 8 2250 10,388 9831 8098 6520o300_10 8 2397 28,860 14,076 14,767 23,844
o350_0 9 2342 8986 11,177 9880 5299o350_1 9 2371 9582 11,012 10,590 7879o350_10 9 2409 28,824 16,906 16,855 24,231
o400_0 10 1796 6218 9258 7387 3809o400_1 10 1798 7290 8854 7504 4554o400_10 10 1781 24,140 13,889 14,626 20,964
o450_0 10 2763 10,363 15,207 12,273 6597o450_1 10 2872 12,478 14,645 14,470 9924o450_10 10 3168 42,928 22,035 23,214 33,480
o500_0 11 2085 7356 11,864 9744 4663o500_1 11 2050 9288 11,041 9789 5488o500_10 11 2054 28,111 16,049 17,545 24,285
RGPOS sets. The fact that these sets are not representative for arbitrary multiprocessor architectures doesnot preclude the utilization of APN algorithms. The results of our experiments with the RGPOS probleminstances are displayed in Table 2. Surprisingly, as previously, the CPES and LPTES heuristics yieldedoptimal solutions for all problem instances. Problem instances are identified in Table 2 with the letter“o” to indicate known optimal solutions, followed by the number of tasks and the value of the CCRparameter.

T. Davidovic, T.G. Crainic / Computers & Operations Research 33 (2006) 2155–2177 2163
The performance of the CPES and LPTES heuristics cannot be explained by their design or intrinsicqualities. Our experience shows, for example, that the results obtained by CPES can deviate by morethan 100% from the optimum [26,27]. We thus analyzed the task graphs in the two sets and noticed thatthey all display very similar edge (connection) densities. The edge density of a graph, �, is defined asthe number of edges divided by the number of edges of a completely connected graph with the samenumber of nodes (i.e., � = |E|/n(n − 1)/2). For RGBOS, � varies from 30% to 40%, while for graphs inRGPOS, the value of � is between 4% and 10%. To conclude, both sets contain only sparse task graphs,with RGPOS graphs containing almost independent tasks.
Further analysis shows that, in fact, the two sets of problem instances violate several properties requiredby Hall and Posner [17]. Thus, variety is not ensured because the graph density does not vary anddifferences in multiprocessor architectures are not accounted for. Indeed, only one multiprocessor system,with fixed number of completely connected processors, is considered for each size n. Relevance is notprovided either, since only completely connected multiprocessor systems are considered. Regularity isalso violated for RGPOS examples since the structure of the task graphs and the optimal solutions ispredetermined. It may thus be easy to define scheduling procedures that will always generate optimalschedules. Consequently, the RGBOS and RGPOS sets of problem instances proposed in [15] are notadequate to benchmark algorithms for the MSPCD problem.
A note on the behavior of the other heuristics on these two sets. As can be seen from Tables 1 and 2,LBMC and PPS displayed the worst performance. The main issue with LBMC is the poor approximationduring clustering of the communication delays that are generated by assigning tasks to clusters. Simpleheuristics, such as considering the maximum inter-task communication delay [10] or the weighted sumof communication delays, do not seem to work. As for the PPS heuristic, it was originally designed forfine-grained task execution times and communication delays, which is not the case here.
The third set of problem instances proposed in [15] that could be used for heuristics designed forgeneral networks is the set RGNOS composed of 250 random task graphs generated similarly to the onesin RGBOS, but with number of tasks in the same range as for the RGPOS set. The authors provided verylittle information regarding this set and the APN algorithms. Neither optimal solutions, nor best-knownsolutions were provided and the number of processors was not specified either. Comparisons are thusvery difficult to undertake. We applied the selected heuristics, however, to the subset of 50 tasks withCCR = 1.0 with p = 2. The relative behavior of the heuristics is similar to that observed previously.Complete results may be obtained as indicated in Appendix B. It is worth noticing that the density ofthe task graphs in RGNOS is again very low, varying from 8% to 15%. As for the properties required by[17], RGNOS does not violate relevance and regularity, but variety is still not satisfied since only sparsegraphs were generated.
4. New sets of benchmark problem instances
We propose two new sets of task graphs for analyzing and comparing scheduling heuristics addressingthe MSPCD problem. The first is composed of randomly generated DAGs. The generation proceduresand the parameters settings (e.g., edge density) are such that the rules and principles of [17] are enforced.The second set contains task graphs with known optimal solutions for given multiprocessor architectures.In this section, we describe both the problem instances and the corresponding task graph generators forthe two sets. The task graphs may be obtained from the authors as indicated in the Appendix A.
2164 T. Davidovic, T.G. Crainic / Computers & Operations Research 33 (2006) 2155–2177
Two generators were built for the first set of problem instances. The first produces task graphs withgiven heights and widths (i.e., with preselected number of “layers” and tasks within a layer; it should benoted, however, that we do not enforce the multi-layer design). Such task graphs display a predeterminedlevel of parallelism and are thus suitable for experimentations involving different multiprocessor systemarchitectures. The generator also allows to control the input parameters that affect other characteristicsof the task graphs, such as granularity, the CCR factor [15], and the density.
The second generator yields task graphs with preselected densities. One thus overcomes the maindrawback of the sets proposed in [15]. Task execution times and communication delays are determinedrandomly according to given input parameters. One may generate several graphs for the same inputparameter values.The randomness of the procedure ensures that the resulting graphs are different, however.
Several input parameters are the same for the two generators: number of graphs to be generated, numberof tasks within each task graph, maximum value of task duration (execution time), and maximum value ofcommunication delay. The maximum number of levels (height) in each graph and the maximum numberof successors for each task are specific for the first generator, while the density of the generated taskgraphs appears only for the second. The actual values for these parameters are determined randomlyduring the generation process for each particular task graph that is generated. Because no assumptionsare made during the generation process regarding the problem-specific parameters, these generators obeythe principles proposed in [17].
These two generators were used to build the first set of test examples. It consists of 180 random taskgraphs with n ∈ {50, 100, 200, 300, 400, 500} and � ∈ {20, 40, 50, 60, 80}. For each (n, �) combination,we generated six graphs with different combinations of the parameters controlling the task computationtime and communication requirements. Three task graphs of the same size were obtained by the firstgenerator, the other three by the second. For each n, there are thus 30 task graphs with the same numberof tasks, while for each �, there are 36 graphs with the same density. The proposed task graphs do notdepend on the multiprocessor architecture. They can be scheduled to arbitrary multiprocessor systems.
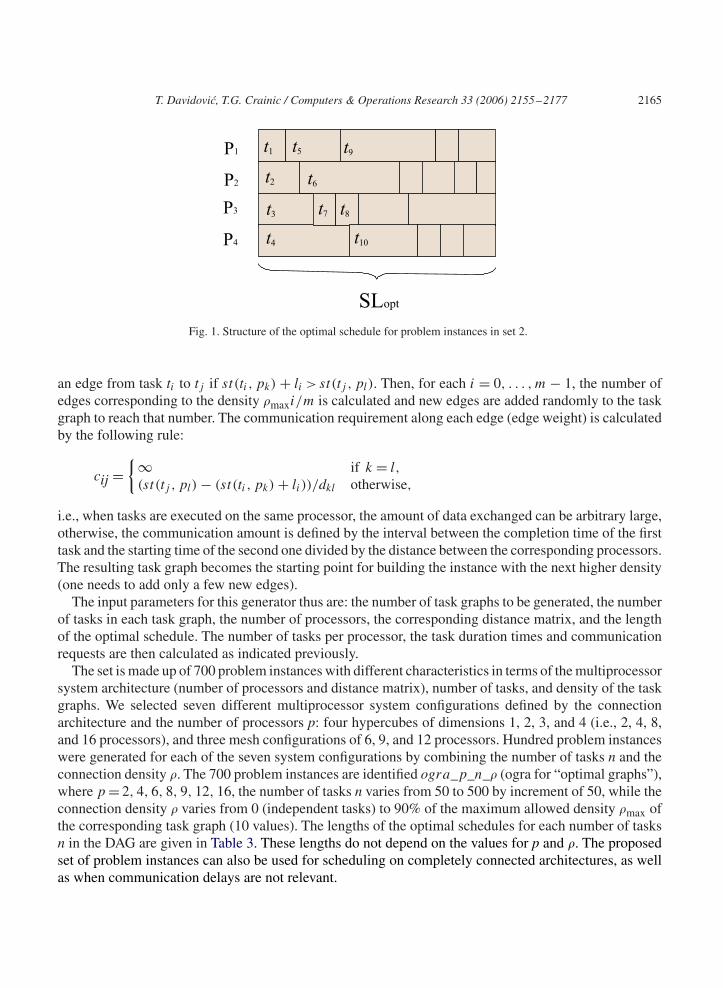
We also propose a new set of randomly generated test instances with known-optimal solutions thatovercomes some of the limitations of [15]. A number of graphs m (set here to 10) is generated for eachcombination of input parameters: multiprocessor architecture, defined by the number of processors p andthe distance matrix Dp×p, number of tasks n, and length of the optimal schedule SLopt. All m graphscontain the same number of tasks, and the duration of any particular task ti is the same within all graphs.The m graphs are differentiated through their respective number of edges represented by the edge density�. The generation process proceeds as follows. For each group of m graphs, an optimal schedule of lengthSLopt is generated first, such that approximately the same number of tasks xk (±10%) is allocated toeach processor pk . The optimal solution is obtained when all tasks are “well packed”, without idle timeintervals between tasks. Moreover, task durations are generated such that all processors complete theirexecutions at the same time SLopt. Task durations are determined randomly, using a uniform distributionof mean equal to SLopt/xk (±10%). Tasks are then numbered according to their starting times: the firsttask on the first processor obtains number 1, the first task on the second processor obtains number 2,and so on; p + 1 will be the number of the second task with the smallest starting time (regardless ofthe index of the corresponding processor); p + 2 will be associated to the task that is the next one tobegin its execution (the task could be on the same processor if the previous one has a small duration); etc.Fig. 1 illustrates the structure of the optimal schedule obtained by this procedure.
Precedence relations among tasks are defined by adding edges to the graph and assigning communica-tion loads to these edges. The maximum allowed density �max is calculated first, because there cannot be
T. Davidovic, T.G. Crainic / Computers & Operations Research 33 (2006) 2155–2177 2165
Fig. 1. Structure of the optimal schedule for problem instances in set 2.
an edge from task ti to tj if st(ti , pk) + li > st(tj , pl). Then, for each i = 0, . . . , m − 1, the number ofedges corresponding to the density �maxi/m is calculated and new edges are added randomly to the taskgraph to reach that number. The communication requirement along each edge (edge weight) is calculatedby the following rule:
cij ={∞ if k = l,
(st(tj , pl) − (st(ti , pk) + li))/dkl otherwise,
i.e., when tasks are executed on the same processor, the amount of data exchanged can be arbitrary large,otherwise, the communication amount is defined by the interval between the completion time of the firsttask and the starting time of the second one divided by the distance between the corresponding processors.The resulting task graph becomes the starting point for building the instance with the next higher density(one needs to add only a few new edges).
The input parameters for this generator thus are: the number of task graphs to be generated, the numberof tasks in each task graph, the number of processors, the corresponding distance matrix, and the lengthof the optimal schedule. The number of tasks per processor, the task duration times and communicationrequests are then calculated as indicated previously.
The set is made up of 700 problem instances with different characteristics in terms of the multiprocessorsystem architecture (number of processors and distance matrix), number of tasks, and density of the taskgraphs. We selected seven different multiprocessor system configurations defined by the connectionarchitecture and the number of processors p: four hypercubes of dimensions 1, 2, 3, and 4 (i.e., 2, 4, 8,and 16 processors), and three mesh configurations of 6, 9, and 12 processors. Hundred problem instanceswere generated for each of the seven system configurations by combining the number of tasks n and theconnection density �. The 700 problem instances are identified ogra_p_n_� (ogra for “optimal graphs”),where p = 2, 4, 6, 8, 9, 12, 16, the number of tasks n varies from 50 to 500 by increment of 50, while theconnection density � varies from 0 (independent tasks) to 90% of the maximum allowed density �max ofthe corresponding task graph (10 values). The lengths of the optimal schedules for each number of tasksn in the DAG are given in Table 3. These lengths do not depend on the values for p and �. The proposedset of problem instances can also be used for scheduling on completely connected architectures, as wellas when communication delays are not relevant.

2166 T. Davidovic, T.G. Crainic / Computers & Operations Research 33 (2006) 2155–2177
Table 3Optimal schedule lengths for random task graphs
n 50 100 150 200 250 300 350 400 450 500
SLopt 600 800 1000 1200 1400 1600 1800 2000 2200 2400
The test instances of this second set do not satisfy all properties proposed in [17]: the second andthird properties are not satisfied because the multiprocessor architecture and the structure of the final(optimal) schedule are pre-specified. The set of problem instances may still be quite useful, however, forthe estimation of the solution quality offered by the given heuristic.
5. Analysis of scheduling results on the new problem sets
In this section, we report and analyze results of applying the selected heuristics to the two sets of taskgraphs introduced in the previous section. The quality of the heuristic solutions is examined relative tothe task graph characteristics and the multiprocessor architecture: number of tasks n, edge density �,number of processors p, interconnection architecture, and communication delay. It is worth emphasizingthat our objective is not the comparison of scheduling heuristics, but rather the illustration of the valueof the proposed sets of problem instances as benchmarks. We therefore emphasize the characteristics ofthe test examples with respect to parameter variations and algorithm behavior.
The hypercube is a widely used multiprocessor architecture. We thus experimented with one-, two-,and three-dimensional hypercubes, i.e., we set p = 2, 4, 8. The distance matrix for 3-D hypercube is
D =
⎡⎢⎢⎢⎢⎢⎢⎢⎢⎢⎣
0 1| 1 2| 1 2 2 31 0| 2 1| 2 1 3 21 2 0 1| 2 3 1 22 1 1 0| 3 2 2 11 2 2 3 0 1 1 22 1 3 2 1 0 2 12 3 1 2 1 2 0 13 2 2 1 2 1 1 0
⎤⎥⎥⎥⎥⎥⎥⎥⎥⎥⎦
.
For p=2 and 4 the respective distance matrices are represented by the corresponding upper left blocksof matrix D. To show that the proposed problem instances may be used even in extreme cases, we alsoconsidered completely connected architectures and systems with negligible communication delays.
We first present the results on the first set of problem instances (Set 1), which contains random taskgraphs with no known optimal solutions. The complete set of results is too large to be included in thepaper. Only average results are presented. The complete set of results may be obtained from the authorsas indicated in Appendix B.
Table 4 displays comparison results of scheduling onto 1-D, 2-D, and 3-D hypercube networks withsignificant communication delays. The first column indicates the number of tasks and the second displaysthe number of processors. Averages over 30 test instances of equal size are presented in the next columns:column three displays the average best known result (scheduling length), while the remaining six columns

T. Davidovic, T.G. Crainic / Computers & Operations Research 33 (2006) 2155–2177 2167
Table 4Scheduling results for Set 1 problems: Hypercube multiprocessor systems and significant communication delays
n p Av. best. Percentage of deviation
CPES LPTES DC LPTDC PPS LBMC
50 2 517.47 22.21 27.71 40.85 41.10 54.86 70.6450 4 500.47 19.55 25.37 42.35 40.50 64.38 104.0950 8 537.43 11.30 16.26 32.62 30.84 63.22 115.81
100 2 1128.97 16.73 21.97 36.91 37.31 45.28 70.10100 4 1071.87 16.24 21.75 71.47 40.68 52.97 102.52100 8 1129.80 10.13 14.91 34.10 33.38 49.37 115.28
200 2 2355.57 12.63 18.10 29.11 31.46 38.90 64.44200 4 2261.43 10.57 15.43 31.42 32.42 42.18 92.88200 8 2349.03 6.40 10.65 26.50 27.57 41.84 111.30
300 2 3586.10 9.77 14.40 25.78 28.60 35.80 62.43300 4 3396.83 9.07 14.08 29.65 31.91 42.33 94.23300 8 3497.17 5.72 10.45 25.93 27.08 42.11 113.81
400 2 4835.76 9.45 13.84 28.44 30.63 33.60 61.88400 4 4620.33 8.33 12.83 32.02 33.15 37.69 89.96400 8 4759.20 5.06 9.23 28.18 29.10 36.39 110.39
500 2 6071.00 8.81 13.00 25.26 27.96 33.27 60.93500 4 5784.63 7.93 12.29 28.85 30.43 37.07 91.60500 8 5940.50 5.05 9.08 25.40 26.90 36.76 112.14
contain average percentage deviations from the best schedule reported in the third column. In most cases,the best solution was obtained by CPES. Among the other heuristics, LPTES, DC, and LPTDC generatedbetter solutions than CPES in a few cases, although, on average, they do not perform well. In the following,we focus on illustrating how variations in the characteristics of the proposed problem instances (due toparameter variation during generation) induce the appropriate variations in algorithm behavior, thusshowing the interest of the proposed set of problems for the evaluation of heuristics for the MSPCDproblem.
The figures in Table 4 illustrate the dependency of the scheduling results on the number of processors.As expected, for breath-first heuristics, such as CPES and LPTES, which try to minimize the number ofprocessors used, the deviations decrease when the number of processors increases. The opposite trendmay be observed for the other heuristics, which may be explained by the additional communicationburden corresponding to a larger number of processors. Fig. 2 illustrates the performance of the heuristicsin terms of deviations from the optimal schedule length, for n = 200 and various graph densities. Thesame behavior may be observed for the other values of n. To make for a clearer presentation, LPT-based

2168 T. Davidovic, T.G. Crainic / Computers & Operations Research 33 (2006) 2155–2177
0
5
10
15
20
25
30
20 30 40 50 60 70 80
%de
v.
density
CPES solution deviations
p=2p=4p=8
0
20
40
60
80
100
120
20 30 40 50 60 70 80
%de
v.
density
DC solution deviations
p=2p=4p=8
102030405060708090
100110120
20 30 40 50 60 70 80
%de
v.
density
PPS solution deviations
p=2p=4p=8
40
60
80
100
120
140
160
180
200
20 30 40 50 60 70 80
%de
v.
density
LBMC solution deviationsp=2p=4p=8
Fig. 2. Solution deviations for task graphs with n = 200 with communication delays scheduled onto hypercube networks.
heuristics are not included, since LPTES and LPTDC display a behavior similar to that of CPES and DC,respectively. The results displayed in Fig. 2 indicate that the performance of all heuristics increases withthe density of the task graphs (i.e., the respective deviations from the best known solutions decrease). Thismeans that sparse task graphs are generally harder to address by scheduling heuristics, while it is easierfor more dense graphs. The results also illustrate the previously noted relations between the number ofprocessors and the quality of the solution obtained by each heuristic: the performance of CPES improveswith the number of processors, while it decreases for the other heuristics.
Tables 5 and 6 display scheduling results for completely connected networks of processors (for p = 2,the hypercube and the complete interconnection network of processors are the same system) and for DAGswithout communication delays, respectively. Most previous conclusions hold for these extreme cases aswell. It might be noteworthy, however, that the PPS and LBMC heuristics display different behaviorsrelative to the number of processors: the quality of solution degrades when this number decreases. Theirgeneral performance is so poor, however, that this observation cannot be considered definitive. Work isrequired to improve these heuristics but this is beyond the scope of the current paper.
An important observation is that, on average, the best solution (Column 3) does not improve when moreprocessors are added. An analysis of the detailed results indicates that some improvement is achieved forsparse-task graphs, while the degradation in solution quality is observed for dense ones. It appears thatdense graphs do not benefit from adding processors to multiprocessor systems due to the time spent waitingfor predecessor tasks to complete their execution and transferring data between related tasks scheduledon different processors. Moreover, the ES-based heuristics, which often perform best, do not aim to useall processors. Consequently, in most cases, they produce exactly the same schedule even though the

T. Davidovic, T.G. Crainic / Computers & Operations Research 33 (2006) 2155–2177 2169
Table 5Results for Set 1 for completely interconnected systems and significant communication delays
n p Av. best Percentage of deviation
CPES LPTES DC LPTDC PPS LBMC
50 4 595.90 0.15 4.38 19.57 17.35 26.35 52.0250 8 596.67 0.00 0.00 19.42 17.19 20.57 48.96
100 4 1235.43 0.06 4.73 22.29 20.92 23.30 56.82100 8 1233.80 0.06 4.60 22.45 16.71 17.63 51.60
200 4 2481.00 0.00 4.44 19.64 20.38 22.31 57.09200 8 4279.93 0.00 4.15 19.69 20.49 16.91 52.68
300 4 3667.10 0.00 4.71 19.81 21.20 23.44 60.77300 8 3660.57 0.00 4.64 20.02 21.42 17.70 68.73
400 4 4956.97 0.00 4.37 22.56 23.39 20.92 58.25400 8 4951.30 0.00 3.97 22.63 23.53 15.22 53.34
500 4 6187.80 0.00 3.97 20.11 21.56 20.98 59.09500 8 6181.90 0.00 3.85 20.22 21.68 15.87 54.24
number of available processors increases. The same conclusions hold for the problem instances withoutcommunication delays.
The detailed results for the 700 random test instances with known optimal solutions (Set 2) are presentedin [28]. In this section, we summarize these results and present a limited number of illustrative examplesusing the CPES heuristic.
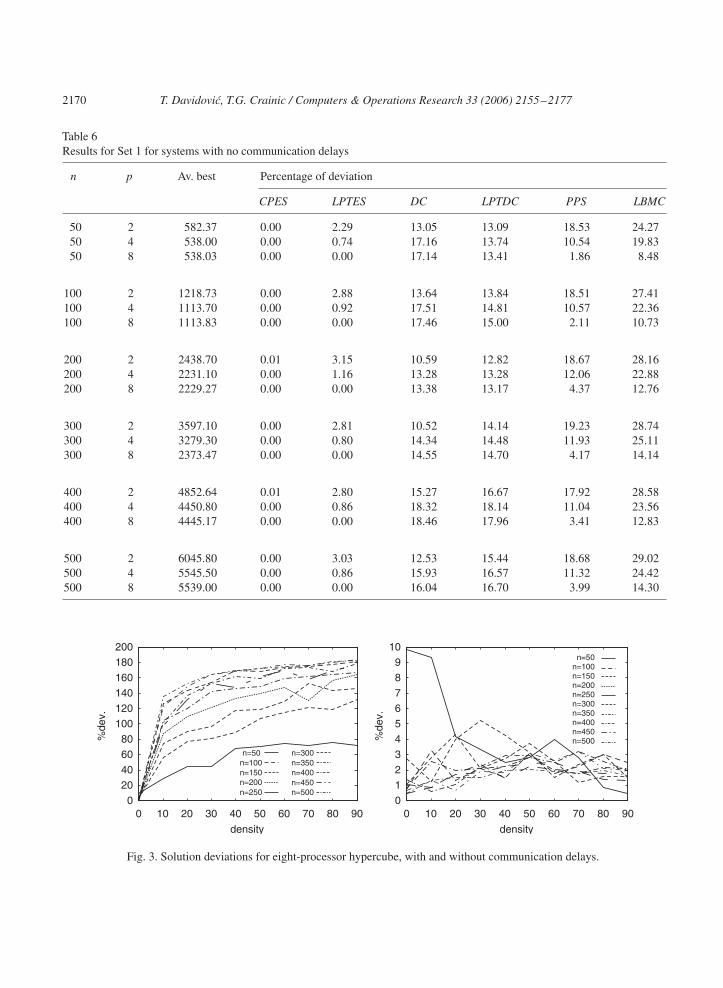
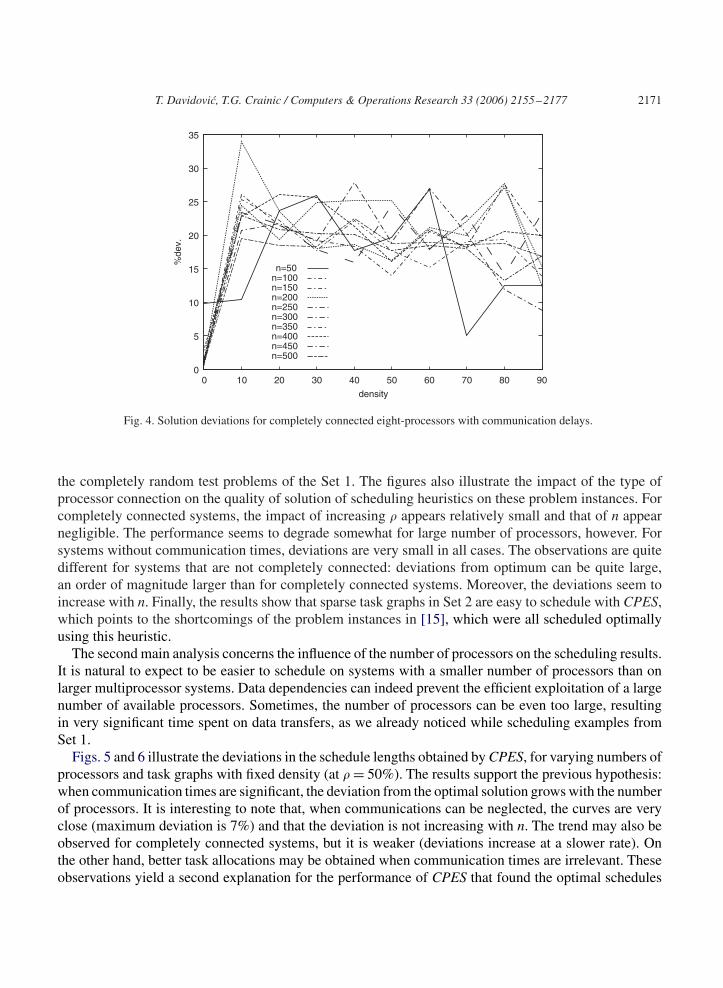
We first analyze the influence of the edge (communication) density on the solution quality. Sincethe results for each p are similar, we display in Figs. 3 and 4 the results for p = 8 only. Each figuredisplays 10 curves, one for each n, showing the change in the deviation from the optimal solutionwhen � increases. Two multiprocessor architectures with fixed number of processors p were considered:Connected according to a given interconnection structure (mesh or hypercube), and completely connected.We also distinguished between cases with and without communication delays. In the latter case, theinterconnection network does not play any role. Consequently, three cases exist only (and three graphsare displayed) for each p: Particular interconnection network with and without communication delays(Fig. 3), and complete interconnection network with communication delays (Fig. 4). An exception is thecase p = 2 since the particular and the complete connections are the same and only two cases have to beanalyzed.
As illustrated in Figs. 3 and 4, the deviation from the optimal solution generally grows with � whencommunication times are significant. This emphasizes the fact that the problem instances of the Set 2,due to their special structure used to provide known optimal solutions, behave quite differently form
2170 T. Davidovic, T.G. Crainic / Computers & Operations Research 33 (2006) 2155–2177
Table 6Results for Set 1 for systems with no communication delays
n p Av. best Percentage of deviation
CPES LPTES DC LPTDC PPS LBMC
50 2 582.37 0.00 2.29 13.05 13.09 18.53 24.2750 4 538.00 0.00 0.74 17.16 13.74 10.54 19.8350 8 538.03 0.00 0.00 17.14 13.41 1.86 8.48
100 2 1218.73 0.00 2.88 13.64 13.84 18.51 27.41100 4 1113.70 0.00 0.92 17.51 14.81 10.57 22.36100 8 1113.83 0.00 0.00 17.46 15.00 2.11 10.73
200 2 2438.70 0.01 3.15 10.59 12.82 18.67 28.16200 4 2231.10 0.00 1.16 13.28 13.28 12.06 22.88200 8 2229.27 0.00 0.00 13.38 13.17 4.37 12.76
300 2 3597.10 0.00 2.81 10.52 14.14 19.23 28.74300 4 3279.30 0.00 0.80 14.34 14.48 11.93 25.11300 8 2373.47 0.00 0.00 14.55 14.70 4.17 14.14
400 2 4852.64 0.01 2.80 15.27 16.67 17.92 28.58400 4 4450.80 0.00 0.86 18.32 18.14 11.04 23.56400 8 4445.17 0.00 0.00 18.46 17.96 3.41 12.83
500 2 6045.80 0.00 3.03 12.53 15.44 18.68 29.02500 4 5545.50 0.00 0.86 15.93 16.57 11.32 24.42500 8 5539.00 0.00 0.00 16.04 16.70 3.99 14.30
02040
6080
100120140
160180200
0 10 20 30 40 50 60 70 80 90
%de
v.
density
n=50n=100n=150n=200n=250
n=300n=350n=400n=450n=500
012
34567
89
10
0 10 20 30 40 50 60 70 80 90
%de
v.
density
n=50n=100n=150n=200n=250n=300n=350n=400n=450n=500
Fig. 3. Solution deviations for eight-processor hypercube, with and without communication delays.
T. Davidovic, T.G. Crainic / Computers & Operations Research 33 (2006) 2155–2177 2171
0
5
10
15
20
25
30
35
0 10 20 30 40 50 60 70 80 90
%de
v.
density
n=50n=100n=150n=200n=250n=300n=350n=400n=450n=500
Fig. 4. Solution deviations for completely connected eight-processors with communication delays.
the completely random test problems of the Set 1. The figures also illustrate the impact of the type ofprocessor connection on the quality of solution of scheduling heuristics on these problem instances. Forcompletely connected systems, the impact of increasing � appears relatively small and that of n appearnegligible. The performance seems to degrade somewhat for large number of processors, however. Forsystems without communication times, deviations are very small in all cases. The observations are quitedifferent for systems that are not completely connected: deviations from optimum can be quite large,an order of magnitude larger than for completely connected systems. Moreover, the deviations seem toincrease with n. Finally, the results show that sparse task graphs in Set 2 are easy to schedule with CPES,which points to the shortcomings of the problem instances in [15], which were all scheduled optimallyusing this heuristic.
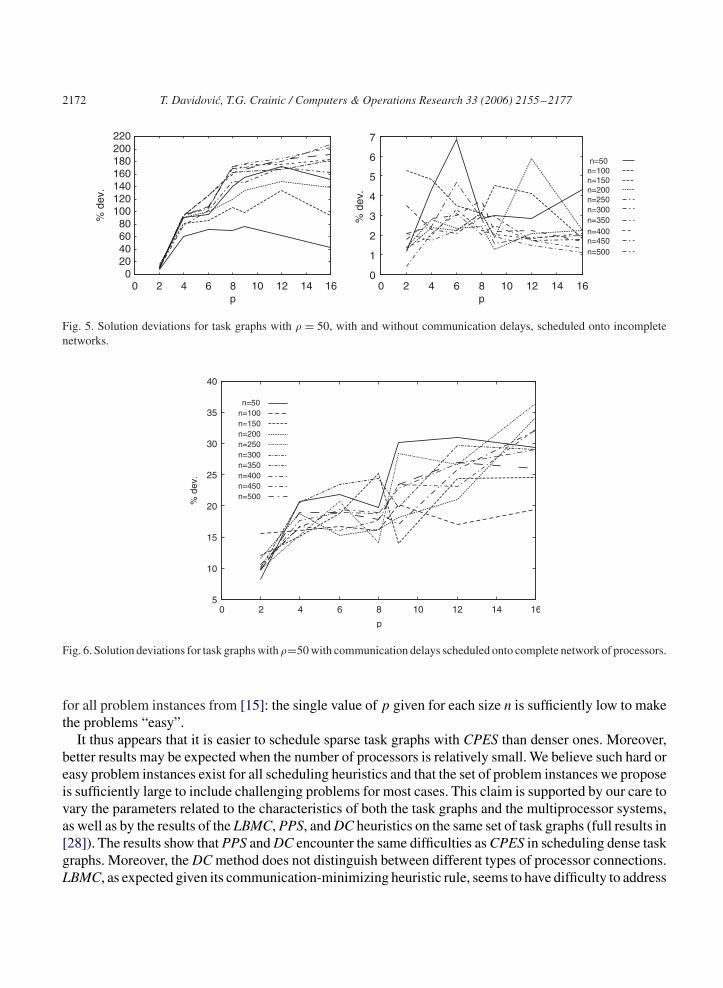
The second main analysis concerns the influence of the number of processors on the scheduling results.It is natural to expect to be easier to schedule on systems with a smaller number of processors than onlarger multiprocessor systems. Data dependencies can indeed prevent the efficient exploitation of a largenumber of available processors. Sometimes, the number of processors can be even too large, resultingin very significant time spent on data transfers, as we already noticed while scheduling examples fromSet 1.
Figs. 5 and 6 illustrate the deviations in the schedule lengths obtained by CPES, for varying numbers ofprocessors and task graphs with fixed density (at � = 50%). The results support the previous hypothesis:when communication times are significant, the deviation from the optimal solution grows with the numberof processors. It is interesting to note that, when communications can be neglected, the curves are veryclose (maximum deviation is 7%) and that the deviation is not increasing with n. The trend may also beobserved for completely connected systems, but it is weaker (deviations increase at a slower rate). Onthe other hand, better task allocations may be obtained when communication times are irrelevant. Theseobservations yield a second explanation for the performance of CPES that found the optimal schedules
2172 T. Davidovic, T.G. Crainic / Computers & Operations Research 33 (2006) 2155–2177
020406080
100120140160180200220
0 2 4 6 8 10 12 14 16
% d
ev.
p
0
1
2
3
4
5
6
7
0 2 4 6 8 10 12 14 16
% d
ev.
p
n=50n=100n=150n=200n=250n=300n=350n=400n=450n=500
Fig. 5. Solution deviations for task graphs with � = 50, with and without communication delays, scheduled onto incompletenetworks.
5
10
15
20
25
30
35
40
0 2 4 6 8 10 12 14 16
% d
ev.
p
n=50n=100n=150n=200n=250n=300n=350n=400n=450n=500
Fig. 6. Solution deviations for task graphs with �=50 with communication delays scheduled onto complete network of processors.
for all problem instances from [15]: the single value of p given for each size n is sufficiently low to makethe problems “easy”.
It thus appears that it is easier to schedule sparse task graphs with CPES than denser ones. Moreover,better results may be expected when the number of processors is relatively small. We believe such hard oreasy problem instances exist for all scheduling heuristics and that the set of problem instances we proposeis sufficiently large to include challenging problems for most cases. This claim is supported by our care tovary the parameters related to the characteristics of both the task graphs and the multiprocessor systems,as well as by the results of the LBMC, PPS, and DC heuristics on the same set of task graphs (full results in[28]). The results show that PPS and DC encounter the same difficulties as CPES in scheduling dense taskgraphs. Moreover, the DC method does not distinguish between different types of processor connections.LBMC, as expected given its communication-minimizing heuristic rule, seems to have difficulty to address

T. Davidovic, T.G. Crainic / Computers & Operations Research 33 (2006) 2155–2177 2173
sparse task graphs (except for independent tasks where it acts like the LPT method). We notice a decreasein the solution deviations when the density of task graphs increases. For all heuristics, the deviations tendto increase with the number of processors, except for LBMC and PPS that seem to handle more easilythe 4-D hypercube (p = 16) than the 12-processor mesh when communications are significant.
The complete set of test instances with known optimal solution is quite large and it may not be necessaryto use all the examples in all cases. According to our analysis, at least one of the two parameters p and� should be varied, however. This can reduce the size of the set by an order of magnitude (either 70or 100 examples need to be evaluated, depending on which parameter is varied, p or �). Based on theexperiments with the six constructive heuristics, we concluded that p and � are equivalent, in the sense ofthe insight their variation provides to the user. It is up to the user to decide which one to vary. We believethis conclusion holds for other methods as well.
6. Conclusion
In this paper, we propose two new sets of benchmark-problem instances for scheduling dependent tasksonto different multiprocessor architectures, not necessarily completely connected, taking into accountcommunication delays (MSPCD). The first set includes completely random instances and may be usedfor any multiprocessor architecture. It is theoretically sound and general. The second set includes probleminstances with known optimal solutions for specific processor interconnection networks. The generatorsare also described and made available.
Several representative heuristics were used to evaluate the sets of problems instances in the literatureas well as the ones we propose. We analyzed the dependency of the deviation of the heuristic solutionfrom the best known or the optimal one on several parameters: task graph density, communication delay,number of processors and connections between them. These parameters play a significant role in thequality of heuristic solutions and should be varied when scheduling heuristics are tested to ensure afair evaluation. We noticed that communication delays are significantly degrading the performance ofthe scheduling heuristics. Regarding the multiprocessor architecture, it is of course easier to scheduleonto completely connected processors but this is not always possible. Therefore, the type of processorinterconnection should also be varied. For the other two parameters, number of processors and task graphdensity, at least one of them should be varied in order to objectively evaluate the efficiency of a particularscheduling heuristic. The sets of problem instances we propose provide this variation.
The MSPCD is a difficult and important problem class. The test-problem instances we propose bridgea gap in the literature by providing a theoretically sound and experimentally comprehensive frameworkfor the fair evaluation of heuristics for the MSPCD.
Acknowledgements
This work was partially supported by NSF of Serbia, Grant no. 1583, under project “Mathematicaloptimization models and methods with applications”. Funding for this work has also been provided bythe Natural Sciences and Engineering Council of Canada, through its Research Grant program, and bythe Fonds F.C.A.R. of the Province of Québec.
2174 T. Davidovic, T.G. Crainic / Computers & Operations Research 33 (2006) 2155–2177
Appendix A. Description of task graph files
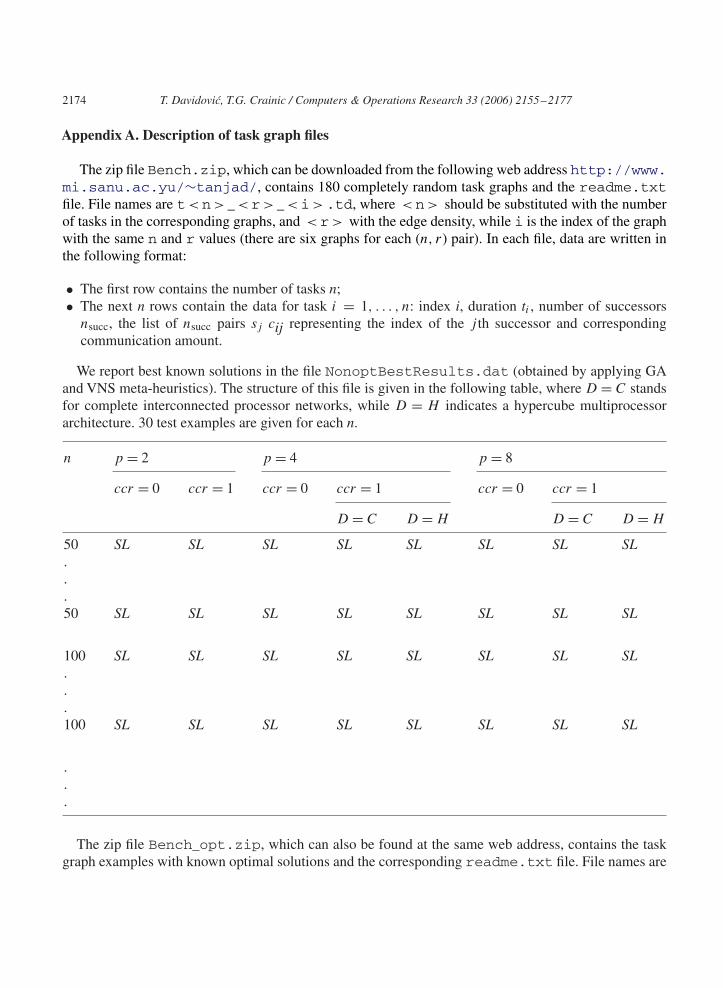
The zip file Bench.zip, which can be downloaded from the following web address http://www.mi.sanu.ac.yu/∼tanjad/, contains 180 completely random task graphs and the readme.txtfile. File names are t< n> _ < r> _ < i> .td, where < n> should be substituted with the numberof tasks in the corresponding graphs, and < r> with the edge density, while i is the index of the graphwith the same n and r values (there are six graphs for each (n, r) pair). In each file, data are written inthe following format:
• The first row contains the number of tasks n;• The next n rows contain the data for task i = 1, . . . , n: index i, duration ti , number of successors
nsucc, the list of nsucc pairs sj cij representing the index of the j th successor and correspondingcommunication amount.
We report best known solutions in the file NonoptBestResults.dat (obtained by applying GAand VNS meta-heuristics). The structure of this file is given in the following table, where D = C standsfor complete interconnected processor networks, while D = H indicates a hypercube multiprocessorarchitecture. 30 test examples are given for each n.
n p = 2 p = 4 p = 8
ccr = 0 ccr = 1 ccr = 0 ccr = 1 ccr = 0 ccr = 1
D = C D = H D = C D = H
50 SL SL SL SL SL SL SL SL...50 SL SL SL SL SL SL SL SL
100 SL SL SL SL SL SL SL SL...100 SL SL SL SL SL SL SL SL
.
.
.
The zip file Bench_opt.zip, which can also be found at the same web address, contains the taskgraph examples with known optimal solutions and the corresponding readme.txt file. File names are
T. Davidovic, T.G. Crainic / Computers & Operations Research 33 (2006) 2155–2177 2175
ogra< n> _ < r> _ < p> .td, where n and r have the same meaning as in the previous case, while< p> should be substituted with the number of processors for which the optimal solution is given.
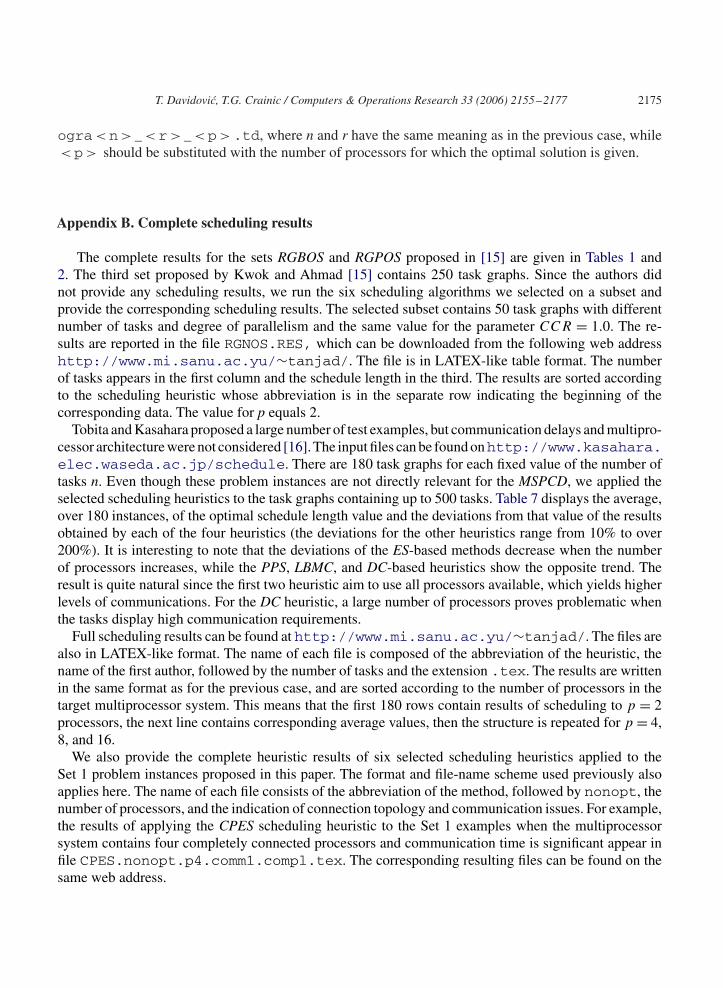
Appendix B. Complete scheduling results
The complete results for the sets RGBOS and RGPOS proposed in [15] are given in Tables 1 and2. The third set proposed by Kwok and Ahmad [15] contains 250 task graphs. Since the authors didnot provide any scheduling results, we run the six scheduling algorithms we selected on a subset andprovide the corresponding scheduling results. The selected subset contains 50 task graphs with differentnumber of tasks and degree of parallelism and the same value for the parameter CCR = 1.0. The re-sults are reported in the file RGNOS.RES, which can be downloaded from the following web addresshttp://www.mi.sanu.ac.yu/∼tanjad/. The file is in LATEX-like table format. The numberof tasks appears in the first column and the schedule length in the third. The results are sorted accordingto the scheduling heuristic whose abbreviation is in the separate row indicating the beginning of thecorresponding data. The value for p equals 2.
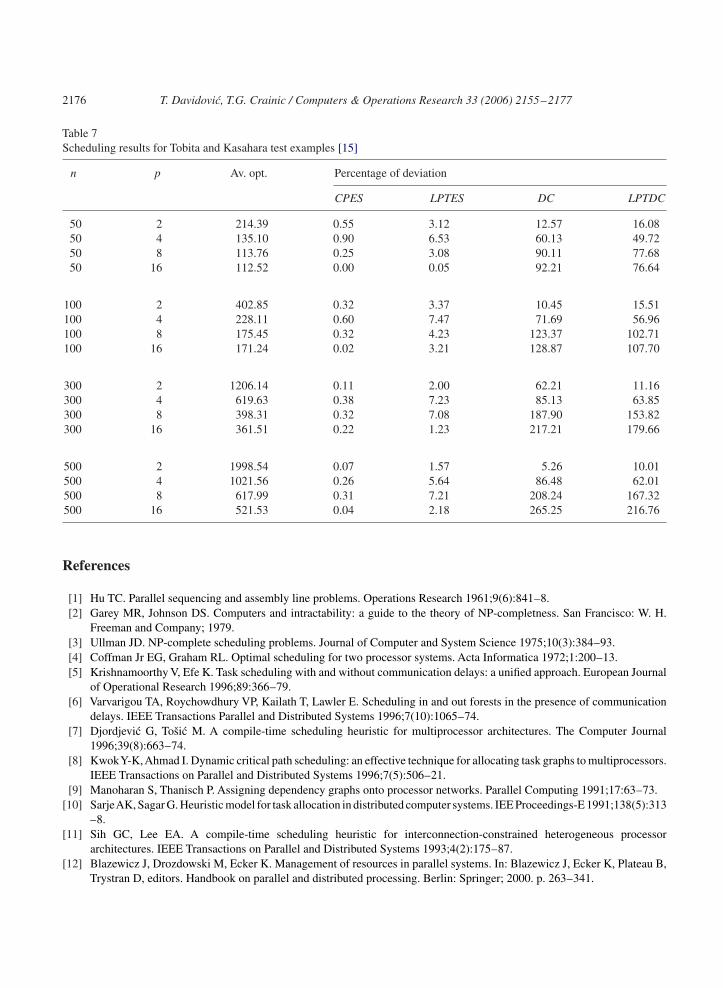
Tobita and Kasahara proposed a large number of test examples, but communication delays and multipro-cessor architecture were not considered [16].The input files can be found onhttp://www.kasahara.elec.waseda.ac.jp/schedule. There are 180 task graphs for each fixed value of the number oftasks n. Even though these problem instances are not directly relevant for the MSPCD, we applied theselected scheduling heuristics to the task graphs containing up to 500 tasks. Table 7 displays the average,over 180 instances, of the optimal schedule length value and the deviations from that value of the resultsobtained by each of the four heuristics (the deviations for the other heuristics range from 10% to over200%). It is interesting to note that the deviations of the ES-based methods decrease when the numberof processors increases, while the PPS, LBMC, and DC-based heuristics show the opposite trend. Theresult is quite natural since the first two heuristic aim to use all processors available, which yields higherlevels of communications. For the DC heuristic, a large number of processors proves problematic whenthe tasks display high communication requirements.
Full scheduling results can be found at http://www.mi.sanu.ac.yu/∼tanjad/. The files arealso in LATEX-like format. The name of each file is composed of the abbreviation of the heuristic, thename of the first author, followed by the number of tasks and the extension .tex. The results are writtenin the same format as for the previous case, and are sorted according to the number of processors in thetarget multiprocessor system. This means that the first 180 rows contain results of scheduling to p = 2processors, the next line contains corresponding average values, then the structure is repeated for p = 4,8, and 16.
We also provide the complete heuristic results of six selected scheduling heuristics applied to theSet 1 problem instances proposed in this paper. The format and file-name scheme used previously alsoapplies here. The name of each file consists of the abbreviation of the method, followed by nonopt, thenumber of processors, and the indication of connection topology and communication issues. For example,the results of applying the CPES scheduling heuristic to the Set 1 examples when the multiprocessorsystem contains four completely connected processors and communication time is significant appear infile CPES.nonopt.p4.comm1.compl.tex. The corresponding resulting files can be found on thesame web address.
2176 T. Davidovic, T.G. Crainic / Computers & Operations Research 33 (2006) 2155–2177
Table 7Scheduling results for Tobita and Kasahara test examples [15]
n p Av. opt. Percentage of deviation
CPES LPTES DC LPTDC
50 2 214.39 0.55 3.12 12.57 16.0850 4 135.10 0.90 6.53 60.13 49.7250 8 113.76 0.25 3.08 90.11 77.6850 16 112.52 0.00 0.05 92.21 76.64
100 2 402.85 0.32 3.37 10.45 15.51100 4 228.11 0.60 7.47 71.69 56.96100 8 175.45 0.32 4.23 123.37 102.71100 16 171.24 0.02 3.21 128.87 107.70
300 2 1206.14 0.11 2.00 62.21 11.16300 4 619.63 0.38 7.23 85.13 63.85300 8 398.31 0.32 7.08 187.90 153.82300 16 361.51 0.22 1.23 217.21 179.66
500 2 1998.54 0.07 1.57 5.26 10.01500 4 1021.56 0.26 5.64 86.48 62.01500 8 617.99 0.31 7.21 208.24 167.32500 16 521.53 0.04 2.18 265.25 216.76
References
[1] Hu TC. Parallel sequencing and assembly line problems. Operations Research 1961;9(6):841–8.[2] Garey MR, Johnson DS. Computers and intractability: a guide to the theory of NP-completness. San Francisco: W. H.
Freeman and Company; 1979.[3] Ullman JD. NP-complete scheduling problems. Journal of Computer and System Science 1975;10(3):384–93.[4] Coffman Jr EG, Graham RL. Optimal scheduling for two processor systems. Acta Informatica 1972;1:200–13.[5] Krishnamoorthy V, Efe K. Task scheduling with and without communication delays: a unified approach. European Journal
of Operational Research 1996;89:366–79.[6] Varvarigou TA, Roychowdhury VP, Kailath T, Lawler E. Scheduling in and out forests in the presence of communication
delays. IEEE Transactions Parallel and Distributed Systems 1996;7(10):1065–74.[7] Djordjevic G, Tošic M. A compile-time scheduling heuristic for multiprocessor architectures. The Computer Journal
1996;39(8):663–74.[8] KwokY-K,Ahmad I. Dynamic critical path scheduling: an effective technique for allocating task graphs to multiprocessors.
IEEE Transactions on Parallel and Distributed Systems 1996;7(5):506–21.[9] Manoharan S, Thanisch P. Assigning dependency graphs onto processor networks. Parallel Computing 1991;17:63–73.
[10] SarjeAK, Sagar G. Heuristic model for task allocation in distributed computer systems. IEE Proceedings-E 1991;138(5):313–8.
[11] Sih GC, Lee EA. A compile-time scheduling heuristic for interconnection-constrained heterogeneous processorarchitectures. IEEE Transactions on Parallel and Distributed Systems 1993;4(2):175–87.
[12] Blazewicz J, Drozdowski M, Ecker K. Management of resources in parallel systems. In: Blazewicz J, Ecker K, Plateau B,Trystran D, editors. Handbook on parallel and distributed processing. Berlin: Springer; 2000. p. 263–341.
T. Davidovic, T.G. Crainic / Computers & Operations Research 33 (2006) 2155–2177 2177
[13] Pinedo M. Scheduling theory, algorithms and systems. 2nd ed., Englewood Cliffs, NJ: Prentice-Hall; 2002.[14] Coll PE, Ribeiro CC, de Sousa CC. Test instances for scheduling unrelated processors under precedence constraints.
http://www-di.inf.puc-rio.br/∼celso/grupo/readme.ps; 2002.[15] Kwok Y-K, Ahmad I. Benchmarking and comparison of the task graph scheduling algorithms. Journal of Parallel and
Distributed Computing 1999;59(3):381–422.[16] Tobita T, Kasahara H. A standard task graph set for fair evaluation of multi-processor scheduling algorithms. Journal of
Scheduling 2002;5(5):379–94.[17] Hall NG, Posner ME. Generating experimental data for computational testing with machine scheduling applications.
Operations Research 2001;49:854–65.[18] Davidovic T. Exhaustive list-scheduling heuristic for dense task graphs. YUJOR 2000;10(1):123–36.[19] Kwok Y-K, Ahmad I. Bubble scheduling: a quasi-dynamic algorithm for static allocation of tasks to parallel architectures.
In: Proceedings of the seventh IEEE symposium of parallel and distributed processing (SPDP’95). Dallas, TX, USA, 1995.p. 36–43.
[20] Kwok Y-K, Ahmad I. Efficient scheduling of arbitrary task graphs to multiprocessors using a parallel genetic algorithm.Journal of Parallel and Distributed Computing 1997;47:58–77.
[21] Davidovic T, Maculan N, Mladenovic N. Mathematical programming formulation for the multiprocessor schedulingproblem with communication delays. In: Mladenovic N, Dugošija DJ, editors. Proceedings of the Yugoslav symposium onoperations research. Herceg-Novi, 2003. p. 331–4.
[22] Khan AA, McCreary CL, Jones MS. A comparison of multiprocessor scheduling heuristics. In: Siegel HJ, editor.Proceedings of the eighth international symposium on parallel processing. Cancùn, Mexico: IEEE Computer Society;1994. p. 243–50.
[23] Chen B. A note on lpt scheduling. Operations Research Letters 1993;14:139–42.[24] Malloy BA, Lloyd EL, Soffa ML. Scheduling DAG’s for asynchronous multiprocessor execution. IEEE Transactions
Parallel and Distributed Systems 1994;5(5):498–508.[25] Ahmad I, Kwok Y-K. Optimal and near-optimal allocation of precedence-constrained tasks to parallel processors: defying
the high complexity using effective search technique. In: Proceedings of the 1998 international conference on parallelprocessing, 1998. p. 424–31.
[26] Davidovic T, Hansen P, Mladenovic N. Scheduling by VNS: Experimental analysis. In: Minic S, Borovic S, Petrovic N,editors. Proceedings of the Yugoslav symposium on operations research, SYM-OP-IS 2001. Beograd, 2001. p. 319–22.
[27] Davidovic T, Hansen P, Mladenovic N. Variable neighborhood search for multiprocessor scheduling problem withcommunication delays. In: de Sousa JP, editor. Proceedings of the MIC’2001, fourth metaheuristic international conference.Porto, Portugal, 2001. p. 737–41.
[28] Davidovic T, Crainic TG. New benchmarks for static task scheduling on homogeneous multiprocessor systems withcommunication delays. Publication CRT-2003-04, Centre de Recherche sur les Transports, Université de Montréal, 2003.