belt conveyor program adds automatic design of … · - 1 - belt conveyor program adds automatic...
TRANSCRIPT

- 1 -
BELT CONVEYOR PROGRAM ADDS AUTOMATIC DESIGN OF TRUSSES, BENTS AND TOWERS
RECOGNIZING THAT STEEL STRUCTURE USUALLY COMPRISES 70% OF COST!
CREATIVE ENGINEERING USA Windows™ compatible Programs assist users, vendors, engineers, maintenance departments etc. to quickly design belt conveyor systems that are safe, well designed and economic. WINBELT.EXE or its legacy DOS version has been providing real time optimization of belt conveyors worldwide since 1985. Belt tensions under running,
acceleration, deceleration and stopped belt conditions are applied directly to the efficient use, spillage control, failure reduction, specification and cost estimate of all components including belt, idlers, pulleys, shafts, gear reducers and motors. Prices for erected conveyors are displayed based on several types of support structure. ESTIMATE.EXE and HAULPLAN.EXE, business development Programs, enable rapid feasibility studies, estimates and predict qualification of proposed material handling systems in terms of Internal Rate of Return and Modified Internal Rate of Return countering uncertainty, assisting financing, avoiding “dead dogs” and identifying market opportunities.
NEW TRUSS.EXE, BENT.EXE and TOWER.EXE Programs have easy to use
interface enabling job estimators to real time optimize and control estimating of entire projects. This avoids the “too many fingers in the pie” conundrum that all too frequently results in delays, ineffectual design and lost orders. Losses that can easily top Millions. BELTHELP.pdf, 125 page expanded help instruction explains new features While within WINBELT.EXE keying F1 function key provides immediate help.
August 25, 2011
- 2 -
TABLE OF CONTENTS
EDIT CHAPTER TITLE PAGE SUPPORTING
FIND APPROX. PROGRAM (Ctrl+F)
A1A WINBELT INTRODUCTION PAGE 3 WINBELT
A1B SEPARATING “LIVE” FROM “DEAD” DOGS PAGE 5 ESTIMATE
A1C POWER MARKETING PAGE 6 ESTIMATE
A1D POWER CONTRACTOR & A/E/C SALES PAGE 9 WINBUILDIT
A2D POWER EQUIPMENT & REAL ESTATE SALES PAGE 12 WINBUILDIT
A3D UNIVERSAL IRR & MIRR CALCULATOR PAGE 13 WINBUILDIT
A4D POWER SALES SINGLE USE BUILDINGS PAGE 14 WINBUILDIT
A5D POWER SALES MULTI USE BUILDINGS PAGE 15 WINBUILDIT
A6D SELECT OILFIELD OPPORTUNITIES PAGE 16 WINBUILDIT
A7D SELECT MINING OPPORTUNITIES PAGE 17 WINBUILDIT
A2A HELP SYSTEM PAGE 18 WINBELT
A3A HELPFUL HINTS PAGE 21 WINBELT
A4A INSTALLATION PAGE 22 WINBELT
A5A NAVIGATING THE MENU BAR PAGE 23 WINBELT
A6A WINBELT STEP BY STEP PAGE 26 WINBELT
C1C WINBELT SAMPLE FIELD DATA PAGE 36 WINBELT
C1D WRITE / EDIT - OVERVIEW - PAGE 38 WINBELT
C2A PARAMETERS GENERAL PAGE 39 WINBELT
C2B WRITING PARAMETERS PAGE 43 WINBELT
C3A SECTION WRITING INTRODUCTION PAGE 46 WINBELT
C3B SECTIONS DATA ENTRY DESCRIPTIONS PAGE 49 WINBELT
C3C SECTIONS WRITING EXAMPLE PAGE 54 WINBELT
C3D RETURN SIDE CONVEYING PAGE 59 WINBELT
C4B DRIVE ARRANGEMENT PAGE 60 WINBELT
C5B SHAFTS AND PULLEYS - PART 1 PAGE 93 WINBELT
C6B SHAFTS AND PULLEYS - PART 2 PAGE 67 WINBELT
C6A SHAFT FACTORS PAGE 70 WINBELT
C7A PRICE MULTIPLIERS PAGE 71 WINBELT
D1A COMPUTE / DISPLAY PAGE 73 WINBELT
D2A WINBELT CONVEYOR ANALYSIS PAGE 91 WINBELT
D3A AUTOMATIC OPTIMIZATION PAGE 92 WINBELT
D4A OPTIMIZATION PURPOSE PAGE 93
D6A OPTIMIZATION STRATEGIES PAGE 99 WINBELT
D7A COST OPTIMIZATION PAGE 113 WINBELT
D8A PULLEY ARRANGEMENT OPTIMIZATION PAGE 115 WINBELT
F5A DETERMINE PRICE MULTIPLIERS PAGE 116 WINBELT
F6A DETERMINING RETURN-ON-INVESTMENT PAGE 117 WINBELT
J1A ESTIMATOR PROGRAM PAGE 118 ESTIMATE
K2A HAULPLAN PAGE 120 HAULPLAN
K3A BELT CONVEYOR TRUSSES/BRIDGES PAGE 124 CTRUSS
K4A BELT, CONVEYOR BENTS PAGE 127 CBENT
K5A TOWERS, TRANSFER, UNLOADING PAGE 131 CTOWER
A1D COMPLEX SUPPORT STRUCTURES PAGE 9 WINBUILDIT
L1A APPENDIX PAGE 134 WINBELT
L2B BLANK WINBELT DATA FORMS PAGE 135 WINBELT
- 3 -
A1A
WINBELT INTRODUCTION Belt conveyor problems and litigation cost industry $Billions, families lose breadwinners.
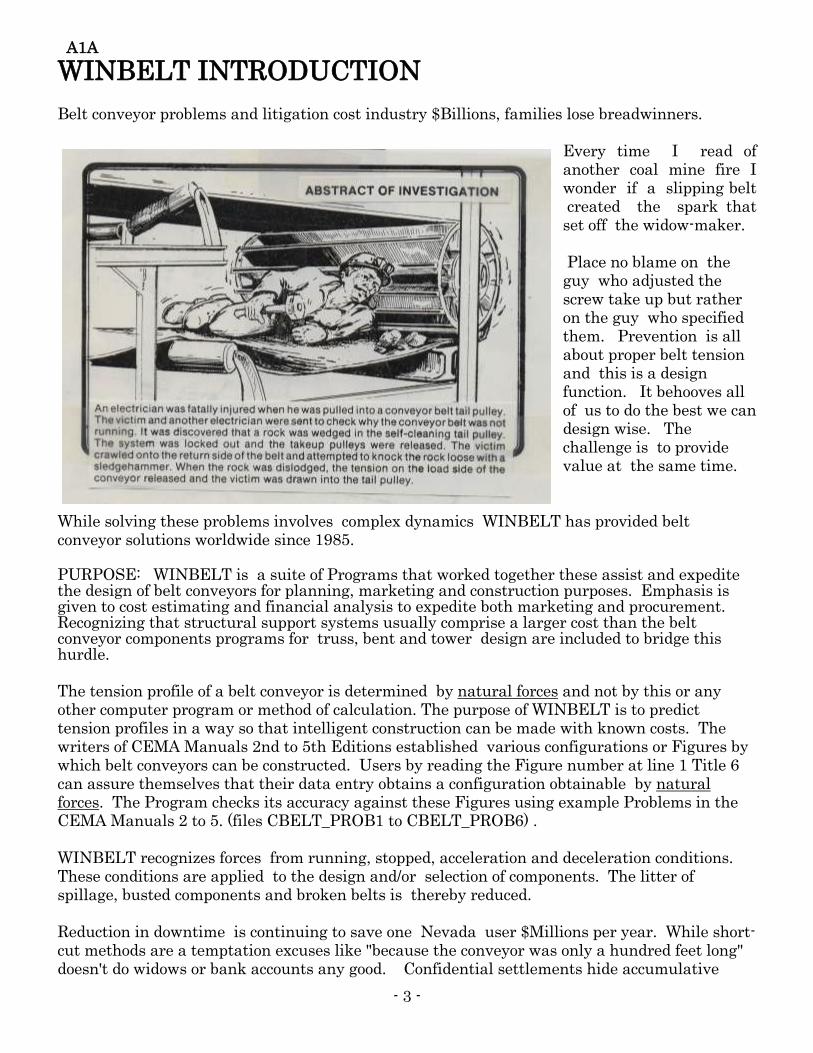
Every time I read of another coal mine fire I wonder if a slipping belt created the spark that set off the widow-maker. Place no blame on the guy who adjusted the screw take up but rather on the guy who specified them. Prevention is all about proper belt tension and this is a design function. It behooves all of us to do the best we can design wise. The challenge is to provide value at the same time.
While solving these problems involves complex dynamics WINBELT has provided belt conveyor solutions worldwide since 1985. PURPOSE: WINBELT is a suite of Programs that worked together these assist and expedite the design of belt conveyors for planning, marketing and construction purposes. Emphasis is given to cost estimating and financial analysis to expedite both marketing and procurement. Recognizing that structural support systems usually comprise a larger cost than the belt conveyor components programs for truss, bent and tower design are included to bridge this hurdle. The tension profile of a belt conveyor is determined by natural forces and not by this or any other computer program or method of calculation. The purpose of WINBELT is to predict tension profiles in a way so that intelligent construction can be made with known costs. The writers of CEMA Manuals 2nd to 5th Editions established various configurations or Figures by which belt conveyors can be constructed. Users by reading the Figure number at line 1 Title 6 can assure themselves that their data entry obtains a configuration obtainable by natural forces. The Program checks its accuracy against these Figures using example Problems in the CEMA Manuals 2 to 5. (files CBELT_PROB1 to CBELT_PROB6) . WINBELT recognizes forces from running, stopped, acceleration and deceleration conditions. These conditions are applied to the design and/or selection of components. The litter of spillage, busted components and broken belts is thereby reduced. Reduction in downtime is continuing to save one Nevada user $Millions per year. While short-cut methods are a temptation excuses like "because the conveyor was only a hundred feet long" doesn't do widows or bank accounts any good. Confidential settlements hide accumulative
- 4 -
losses in the $Billions! The financial and credit crisis of 2008 brings home the realization that belt conveyors are in reality a "capitalistic tool"! They are never bought because they are pretty but rather because they provide a "return on investment" WINBELT responds to this emphasis by rating belt conveyors in terms of their Internal Rate of Return and Modified Internal Rate of Return result. By applying these metrics belt conveyors are better able to compete for investment. Using these terms investors, bankers, engineers, purchasing agents and marketers speak a common language. In 1990 HAULPLAN was developed to facilitate marketing to open pit mines. In 2009 this capability was added to WINBELT. The in-seconds 5 input calculator enables both users and marketers to assess the value of belt conveyors in terms bankers understand. The process of marketing and procurement of belt conveyors benefits. AAL_WINBELT and AAD_WINBELT Programs are License and demonstration versions of the same WINBELT belt conveyor design and estimating program. Other Programs listed at the Table of Contents augment capabilities. WINBELT borrows code from the original CREATIVE BELT CONVEYOR DESIGN & ESTIMATING PROGRAM in use worldwide since 1982. COMPATIBILITY - Requires Microsoft XP Professional, Vista or 7 Home Premium operating systems. All Program components must be located in a folder named C:\WINBELT. Determine functionality on your computer free with AAD_WINBELT. Licensed version requires activation. End of Subject
- 5 -
A1B
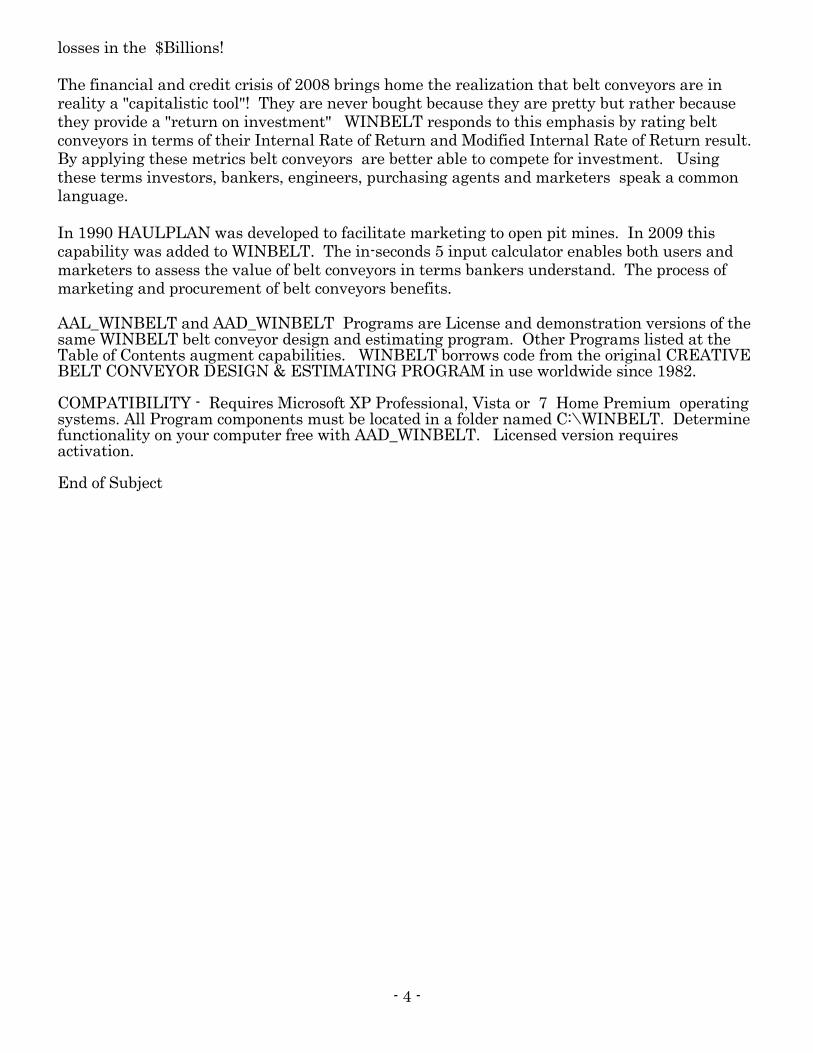
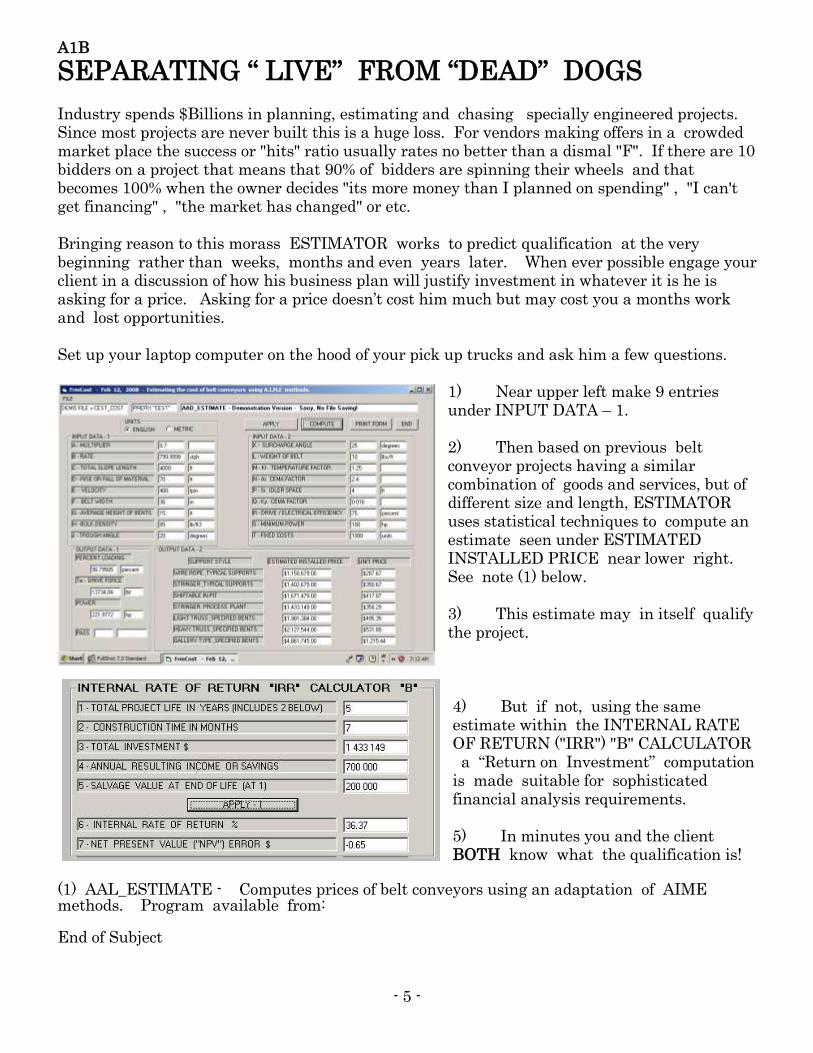
SEPARATING “ LIVE” FROM “DEAD” DOGS Industry spends $Billions in planning, estimating and chasing specially engineered projects. Since most projects are never built this is a huge loss. For vendors making offers in a crowded market place the success or "hits" ratio usually rates no better than a dismal "F". If there are 10 bidders on a project that means that 90% of bidders are spinning their wheels and that becomes 100% when the owner decides "its more money than I planned on spending" , "I can't get financing" , "the market has changed" or etc. Bringing reason to this morass ESTIMATOR works to predict qualification at the very beginning rather than weeks, months and even years later. When ever possible engage your client in a discussion of how his business plan will justify investment in whatever it is he is asking for a price. Asking for a price doesn’t cost him much but may cost you a months work and lost opportunities. Set up your laptop computer on the hood of your pick up trucks and ask him a few questions.
1) Near upper left make 9 entries under INPUT DATA – 1. 2) Then based on previous belt conveyor projects having a similar combination of goods and services, but of different size and length, ESTIMATOR uses statistical techniques to compute an estimate seen under ESTIMATED INSTALLED PRICE near lower right. See note (1) below. 3) This estimate may in itself qualify the project. 4) But if not, using the same estimate within the INTERNAL RATE OF RETURN ("IRR") "B" CALCULATOR a “Return on Investment” computation is made suitable for sophisticated financial analysis requirements. 5) In minutes you and the client BOTH know what the qualification is!
(1) AAL_ESTIMATE - Computes prices of belt conveyors using an adaptation of AIME methods. Program available from: End of Subject
- 6 -
A1C
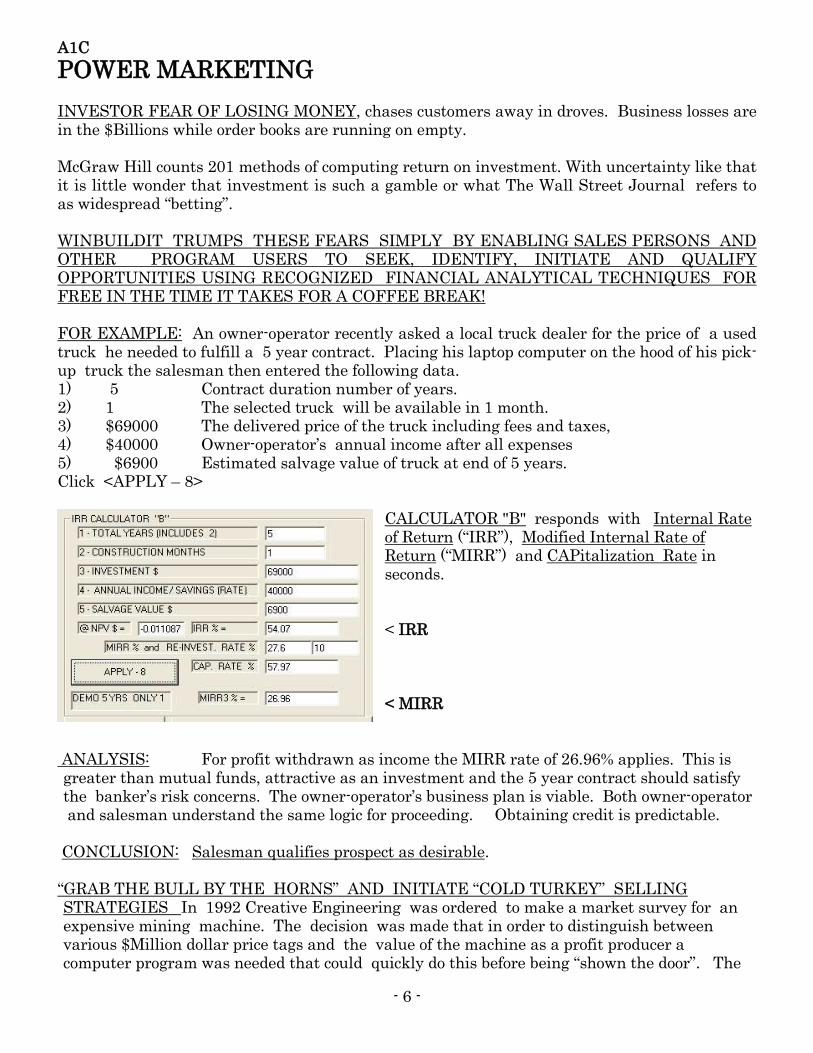
POWER MARKETING INVESTOR FEAR OF LOSING MONEY, chases customers away in droves. Business losses are in the $Billions while order books are running on empty. McGraw Hill counts 201 methods of computing return on investment. With uncertainty like that it is little wonder that investment is such a gamble or what The Wall Street Journal refers to as widespread “betting”. WINBUILDIT TRUMPS THESE FEARS SIMPLY BY ENABLING SALES PERSONS AND OTHER PROGRAM USERS TO SEEK, IDENTIFY, INITIATE AND QUALIFY OPPORTUNITIES USING RECOGNIZED FINANCIAL ANALYTICAL TECHNIQUES FOR FREE IN THE TIME IT TAKES FOR A COFFEE BREAK! FOR EXAMPLE: An owner-operator recently asked a local truck dealer for the price of a used truck he needed to fulfill a 5 year contract. Placing his laptop computer on the hood of his pick-up truck the salesman then entered the following data. 1) 5 Contract duration number of years. 2) 1 The selected truck will be available in 1 month. 3) $69000 The delivered price of the truck including fees and taxes, 4) $40000 Owner-operator’s annual income after all expenses 5) $6900 Estimated salvage value of truck at end of 5 years. Click <APPLY – 8>
CALCULATOR "B" responds with Internal Rate of Return (“IRR”), Modified Internal Rate of Return (“MIRR”) and CAPitalization Rate in seconds. < IRR < MIRR
ANALYSIS: For profit withdrawn as income the MIRR rate of 26.96% applies. This is greater than mutual funds, attractive as an investment and the 5 year contract should satisfy the banker’s risk concerns. The owner-operator’s business plan is viable. Both owner-operator and salesman understand the same logic for proceeding. Obtaining credit is predictable.
CONCLUSION: Salesman qualifies prospect as desirable. “GRAB THE BULL BY THE HORNS” AND INITIATE “COLD TURKEY” SELLING STRATEGIES In 1992 Creative Engineering was ordered to make a market survey for an expensive mining machine. The decision was made that in order to distinguish between various $Million dollar price tags and the value of the machine as a profit producer a computer program was needed that could quickly do this before being “shown the door”. The
- 7 -
program turned out to be HAULPLAN (K2A). Used during a “cold turkey” foray to 12 Northern Nevada Gold Mines the offer of a “free mine plan feasibility study” gained entry past guards to 11 successful calls on mine managers averaging 3 hours each. 2 likely prospects were identified but what the mine managers quickly discovered was they could also real-time optimize a mine’s plan to an INTERNAL RATE OF RETURN result which recognizes share-holder value as the target. Or, as one mine engineer put it; “The Program did in 2 seconds what just took me 2 months”. The foray definitely proved worthwhile. The marketing campaign took on defined objectives.
Soon WINBUILDIT was written to address a wider market. In addition to Internal Rate of Return (“IRR”), Modified Internal Rate of Return (“MIRR”) and Capitalization Rate (“Cap. Rate”) were added. This puts in the hands of a field sales person a tool by which he or she can predict the likelihood of a sale based on the economic advantage to the client and in terms banks understand. Those of us who have spent months wishing for a crystal ball will understand that advantage. CONFIDENCE IN METHOD IS ESSENTIAL. WINBUILDIT A) Gives close attention to how the client’s business plan justifies the investment. B) Uses feasibility methods acceptable to financial analysts. C) Uses return on investment methods acceptable to financial analysts. D) Single code enables real-time optimization to maximize client profitability. E) Solves credit problems at the very beginning in a way bankers understand. F) Simultaneous sharing of primary qualification data reduces “guessing” . G) Predicts management decisions frequently hidden by inept subordinates. H) Helps those managers incapable of making reasoned decisions.
I) I) Interprets risk in terms of IRR and MIRR ranges. THE DOOR DOOR OPENER “free mine plan feasibility study” got us in but the focus quickly changed to
“optimizing share-holder value” A door opener expressing IRR can be created by watching a firms operation from afar and then asking advice from the prospect on “how to correct it” will all of a sudden make you realize what the purpose of your call really is. This is the fun of real-time optimization.
“HUSTLING BUSINESS” may not be your forte’ and may even sound like a dirty word but
bankruptcy is an ugly alternative. You are now either a “road warrior” or broke! During the Great Depression Henry J Kaiser’s admonished “Find a need and fill it” But, to keep your head above water you must apply imagination and initiative to identify and act on opportunities. Do not expect clients to walk in through your front door. Develop in your mind the outline of an idea that can benefit each prospect. Use Winbuildit to attach value to it. Develop a short plausible explanation such as; “free feasibility study” to give purpose and value to your call and as a means of getting past the front door. A WINBUILDIT output will support your purpose. Don’t forget, clients need your help!
APPLYING WINBUILDIT directly with the client begins with an explanation of the vision and business plan. You then enter the details and then Click <Compute> and results similar to those above will be displayed. Out of this the client will know and the user should be able to predict what the qualification is by comparing IRR and MIRR interest rates to other investments, optimizations, or common stocks. Real-time optimization finds the best result in seconds. ADDITIONAL INFORMATION on Internal Rate of Return (“IRR”) and Modified Internal Rate

- 8 -
of Return (“MIRR”) can be learned by Googling the underlined text on the internet. This is a complex subject but what WINBUILDIT does essentially is to bring financial methods used by heavy, mine, oil and manufacturing industries to the street. This paper presents only one of many capabilities. Visit our web sites for more information. www.winbuildit.com www.beltconveyor.com www.suverkrop.com End of Subject
- 9 -
A1D
WINBUILDIT
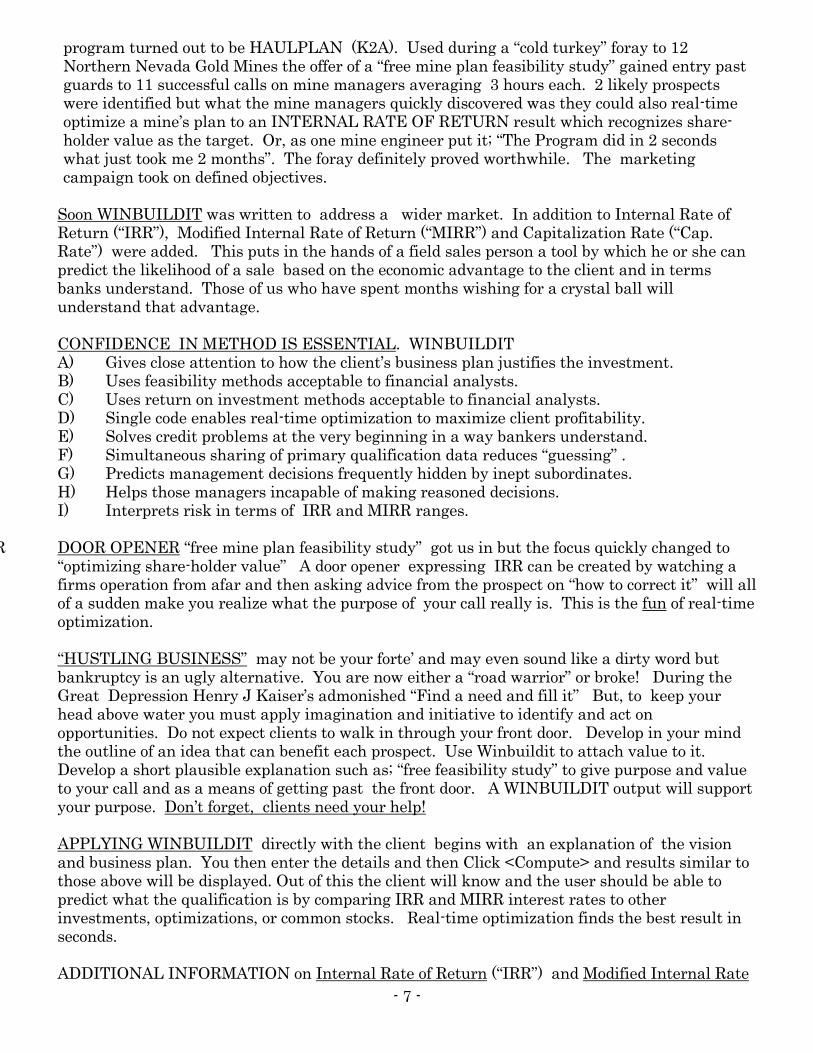
WINBUILDIT’S SEVEN CALCULATORS HELP JUSTIFY BELT CONVEYORS OR ANY OTHER INVESTMENT. A/E/C firms and clients waste $Billions on rejected building proposals and inefficient buildings. One Architect explained; “it just takes a long time to straighten out the can of worms”. That “long time” (of iteration) prevents the real-time optimization needed to maximize feasibility, win the order, provide direction and cost control over subsequent finalization. WINBUILDIT combines planning, automatic structural design, estimating and the clients business plan. Real-time optimization enables clients to model business plans to find affordable qualification. INTERNAL RATE OF RETURN, MODIFIED INTERNAL RATE OF RETURN and CAPITALIZATION RATE establish feasibility in terms clients, managers, investors and banks understand. Estimating, bidding, project sorting and taking marketing initiatives follow in minutes. Structural feasibility comes first. The 3-D image as seen to the right confirms data entry. Over-stressed members are in red. All major member sizes are tabulated.
- 10 -
WINBUILDIT slashes these costs by integrating automatic structural design with the clients business plan and an ARSMeansJ Square Foot Costs@ based relational data base. This moves the end to the beginning and qualifies buildings using internal rate of return and modified internal rate of return all in the time it takes for a coffee break.
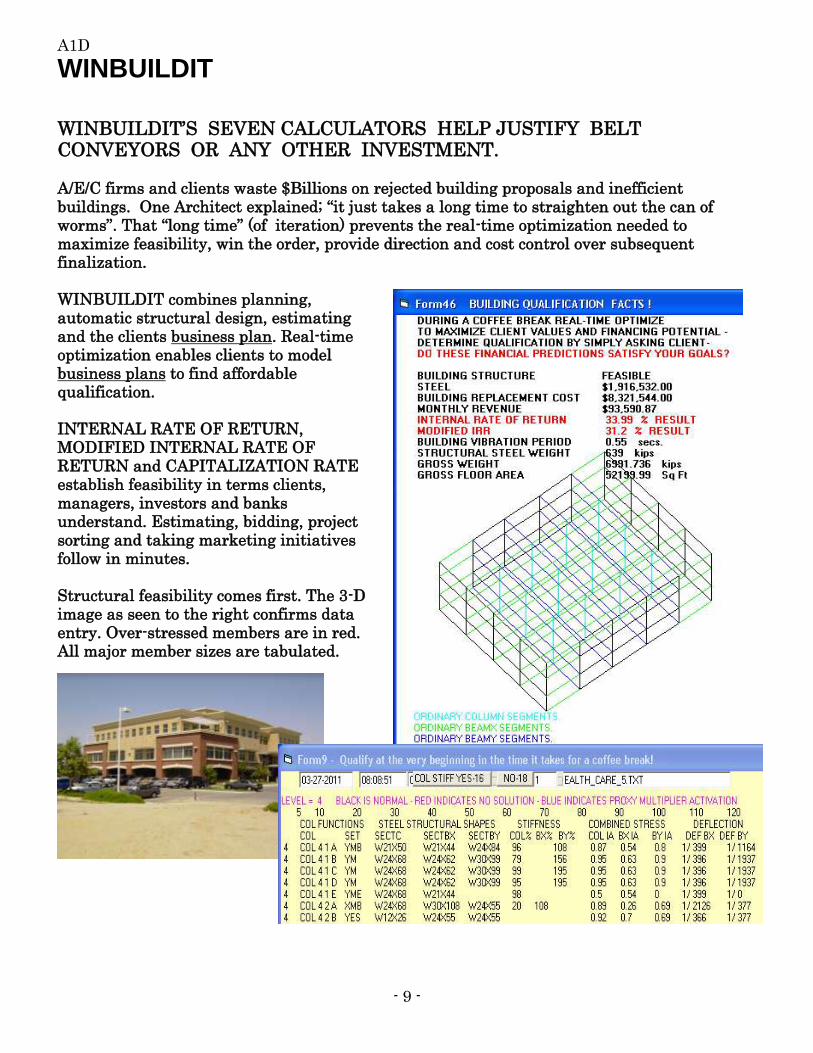
This makes it possible to ask the client at the very first meeting: "CONSIDERING RISKS DO THESE DATA QUALIFY PROJECT?"
In the time it takes for a coffee break client and an architectural salesman sketch a building concept and then enter basic parameters plus the clients business plan into WINBUILDIT.
Click compute and WINBUILDIT calculates and tabulates all steel structural shapes. The cost of this item and costs added from a relational data base compatible with “RSMeanstm Square Foot Costs” provides a total price.
Displayed data includes Internal Rate of Return and Modified Internal Rate of Return.
These metrics enable a client and his or her banker to instantly know what the qualification is by comparing interest rates and risk to that of common stocks, bonds, other investments or options of the same building concept! The Program user with access to the same information is not left in the “dark” but can predict the likelihood of qualification from the same data. 1) Resolving qualification on day one separates "live" from "dead" prospects at little cost and provides a jump on competition. Where zoning, environmental, financing, property rights or other restrictions may prevent construction the advantage is of limiting A/E/C costs until other issues are resolved. In the case of speculative ventures avoiding financially unworthy projects is certainly advantageous. 2) WINBUILDIT'S short execution time enables the client to be present during the real-time-optimization process. Only he or she can decide if and when the “numbers” qualify. After first display client will likely choose to edit for improved results or lower cost. At the other extreme, where the client is "pushing" to place an order, then the user needs to have his or her facts straight to prevent losing his or her shirt.
- 11 -
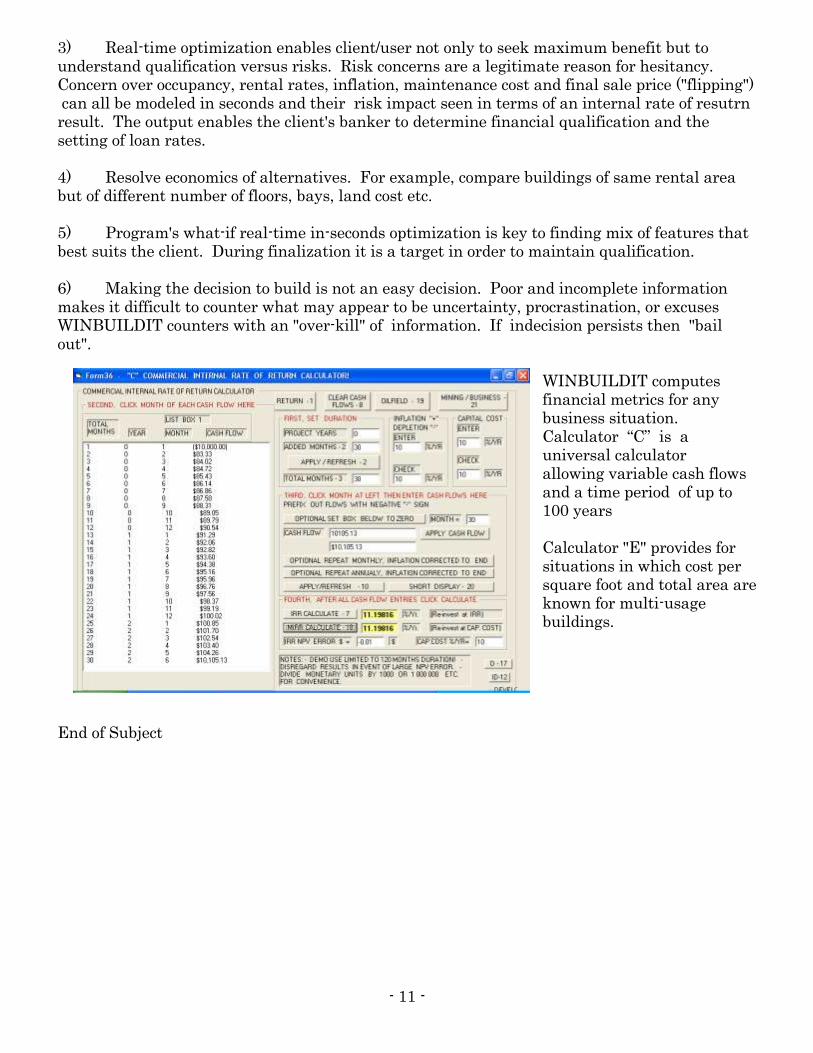
3) Real-time optimization enables client/user not only to seek maximum benefit but to understand qualification versus risks. Risk concerns are a legitimate reason for hesitancy. Concern over occupancy, rental rates, inflation, maintenance cost and final sale price ("flipping") can all be modeled in seconds and their risk impact seen in terms of an internal rate of resutrn result. The output enables the client's banker to determine financial qualification and the setting of loan rates. 4) Resolve economics of alternatives. For example, compare buildings of same rental area but of different number of floors, bays, land cost etc. 5) Program's what-if real-time in-seconds optimization is key to finding mix of features that best suits the client. During finalization it is a target in order to maintain qualification. 6) Making the decision to build is not an easy decision. Poor and incomplete information makes it difficult to counter what may appear to be uncertainty, procrastination, or excuses WINBUILDIT counters with an "over-kill" of information. If indecision persists then "bail out".
WINBUILDIT computes financial metrics for any business situation. Calculator “C” is a universal calculator allowing variable cash flows and a time period of up to 100 years Calculator "E" provides for situations in which cost per square foot and total area are known for multi-usage buildings.
End of Subject
- 12 -
A2D
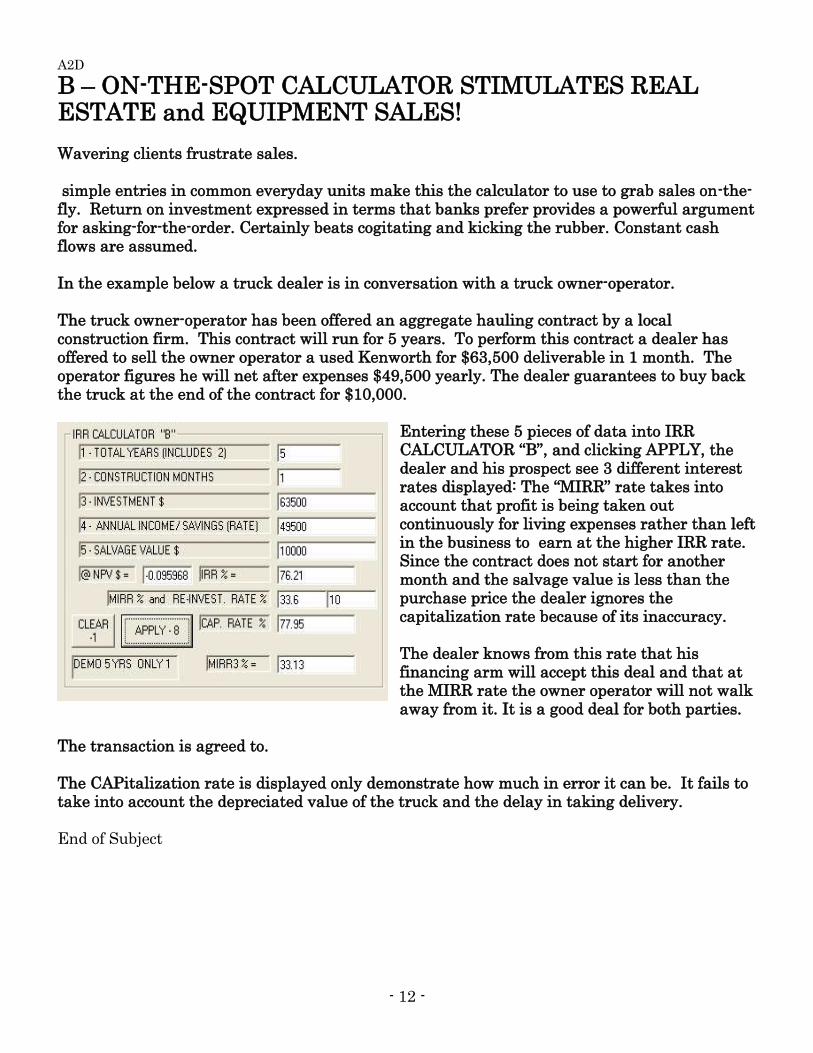
B – ON-THE-SPOT CALCULATOR STIMULATES REAL ESTATE and EQUIPMENT SALES! Wavering clients frustrate sales. simple entries in common everyday units make this the calculator to use to grab sales on-the-fly. Return on investment expressed in terms that banks prefer provides a powerful argument for asking-for-the-order. Certainly beats cogitating and kicking the rubber. Constant cash flows are assumed. In the example below a truck dealer is in conversation with a truck owner-operator. The truck owner-operator has been offered an aggregate hauling contract by a local construction firm. This contract will run for 5 years. To perform this contract a dealer has offered to sell the owner operator a used Kenworth for $63,500 deliverable in 1 month. The operator figures he will net after expenses $49,500 yearly. The dealer guarantees to buy back the truck at the end of the contract for $10,000.
Entering these 5 pieces of data into IRR CALCULATOR “B”, and clicking APPLY, the dealer and his prospect see 3 different interest rates displayed: The “MIRR” rate takes into account that profit is being taken out continuously for living expenses rather than left in the business to earn at the higher IRR rate. Since the contract does not start for another month and the salvage value is less than the purchase price the dealer ignores the capitalization rate because of its inaccuracy. The dealer knows from this rate that his financing arm will accept this deal and that at the MIRR rate the owner operator will not walk away from it. It is a good deal for both parties.
The transaction is agreed to. The CAPitalization rate is displayed only demonstrate how much in error it can be. It fails to take into account the depreciated value of the truck and the delay in taking delivery. End of Subject
- 13 -
A3D
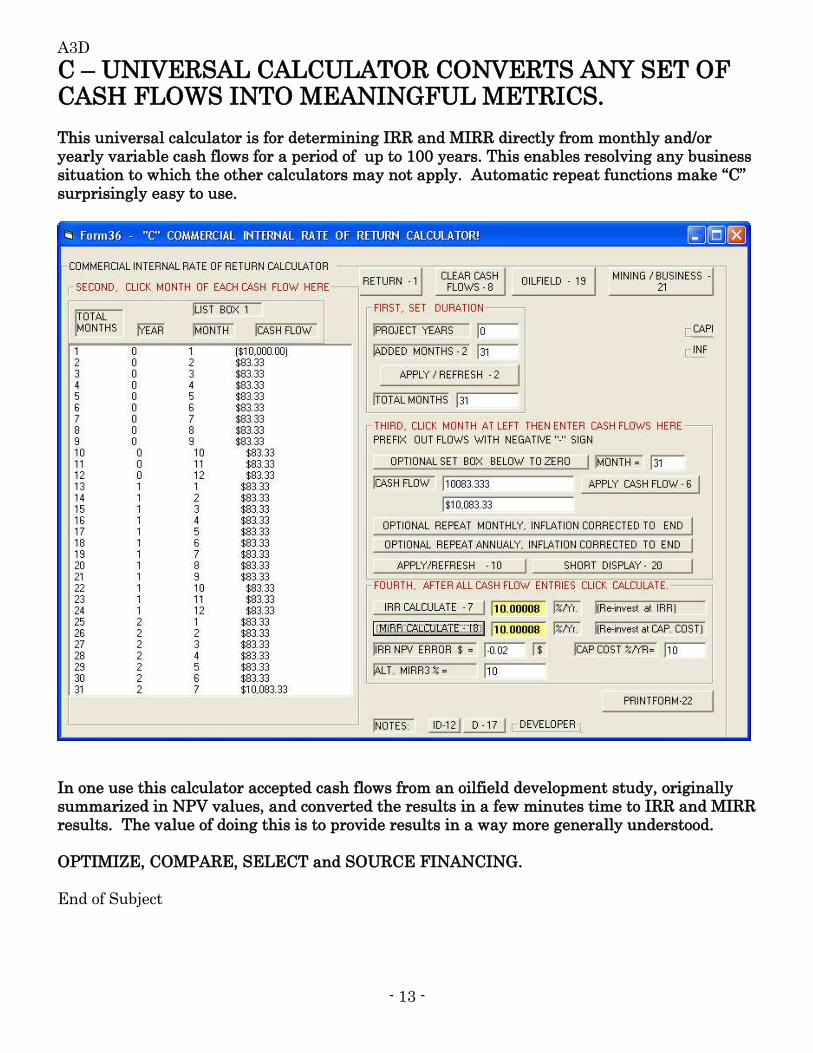
C – UNIVERSAL CALCULATOR CONVERTS ANY SET OF CASH FLOWS INTO MEANINGFUL METRICS. This universal calculator is for determining IRR and MIRR directly from monthly and/or yearly variable cash flows for a period of up to 100 years. This enables resolving any business situation to which the other calculators may not apply. Automatic repeat functions make “C” surprisingly easy to use.
In one use this calculator accepted cash flows from an oilfield development study, originally summarized in NPV values, and converted the results in a few minutes time to IRR and MIRR results. The value of doing this is to provide results in a way more generally understood. OPTIMIZE, COMPARE, SELECT and SOURCE FINANCING. End of Subject
- 14 -
A4D
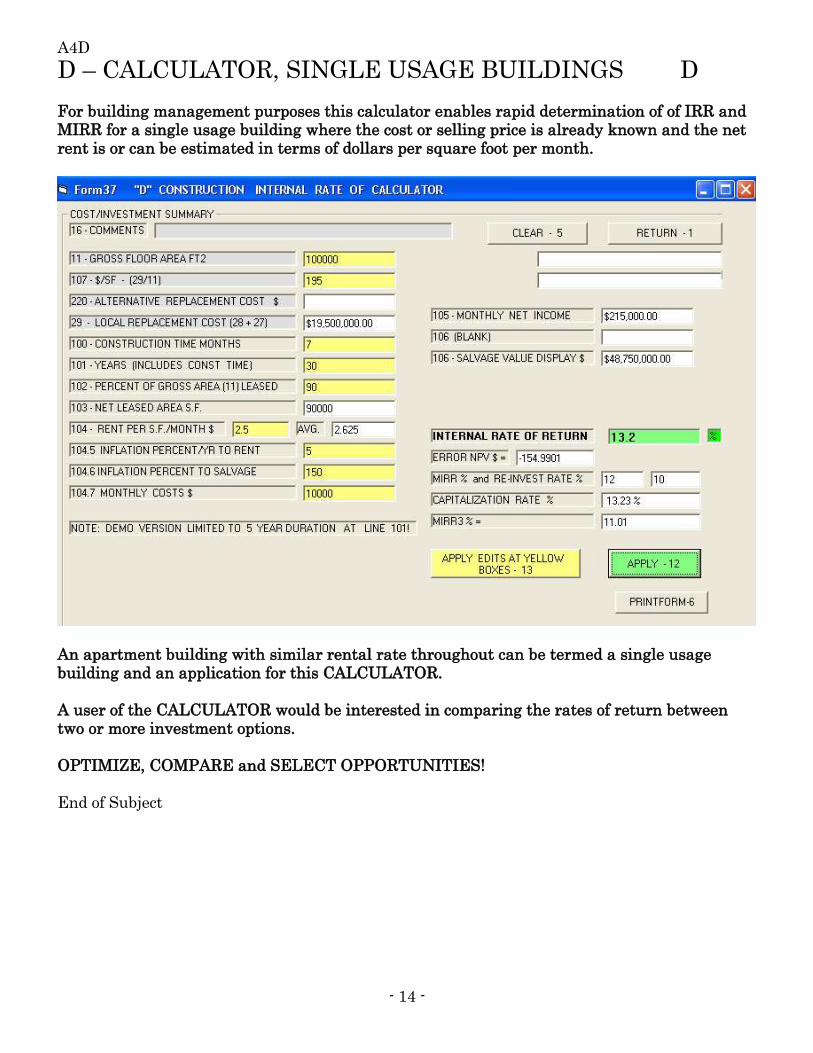
D – CALCULATOR, SINGLE USAGE BUILDINGS D For building management purposes this calculator enables rapid determination of of IRR and MIRR for a single usage building where the cost or selling price is already known and the net rent is or can be estimated in terms of dollars per square foot per month.
An apartment building with similar rental rate throughout can be termed a single usage building and an application for this CALCULATOR. A user of the CALCULATOR would be interested in comparing the rates of return between two or more investment options. OPTIMIZE, COMPARE and SELECT OPPORTUNITIES! End of Subject

- 15 -
A5D
E – CALCULATOR, MULTI-USAGE BUILDINGS E Is similar to D except it accommodates multi-usage buildings such as those that might combine stores, hotel and condominium residential units in a single structure. Enables rapid resolution of IRR and MIRR for a multi usage building where the cost or selling price is known and the net rent is or can be estimated in terms of dollars per square foot per month.
Calculator can be used for space planning, optimizing return and comparing alternative investments. OPTIMIZE, COMPARE and SELECT OPPORTUNITIES! End of Subject
- 16 -
A6D
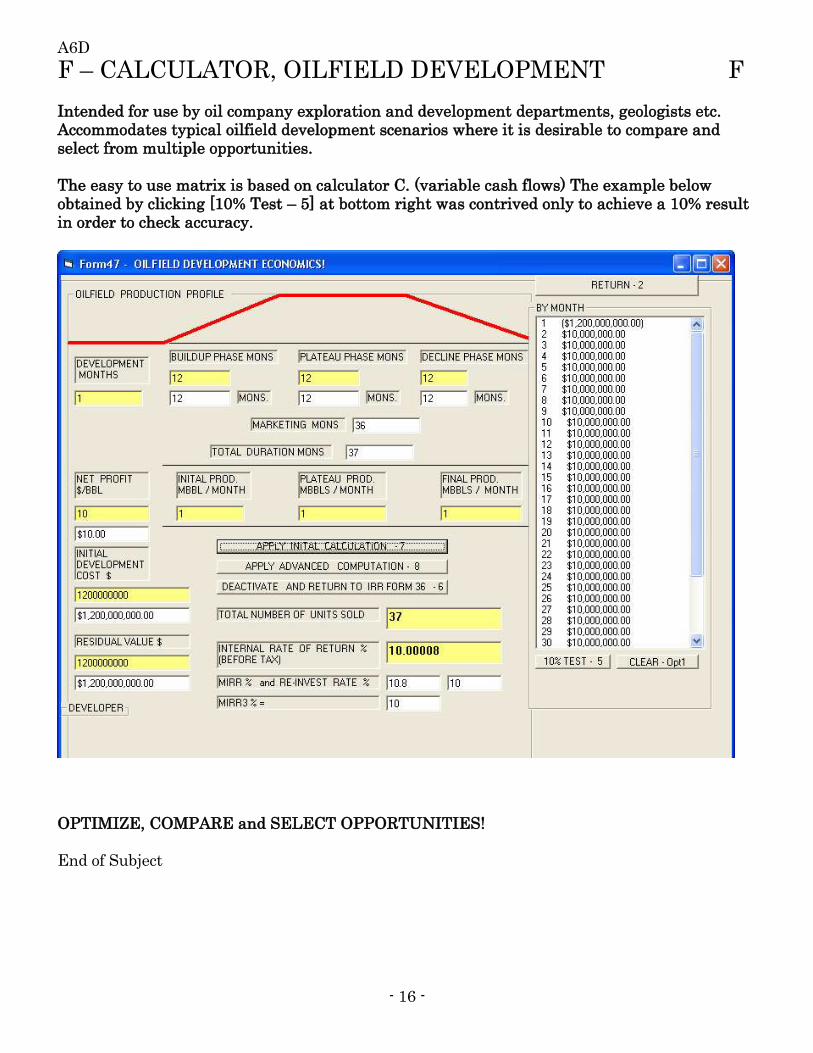
F – CALCULATOR, OILFIELD DEVELOPMENT F Intended for use by oil company exploration and development departments, geologists etc. Accommodates typical oilfield development scenarios where it is desirable to compare and select from multiple opportunities. The easy to use matrix is based on calculator C. (variable cash flows) The example below obtained by clicking [10% Test – 5] at bottom right was contrived only to achieve a 10% result in order to check accuracy.
OPTIMIZE, COMPARE and SELECT OPPORTUNITIES! End of Subject
- 17 -
A7D
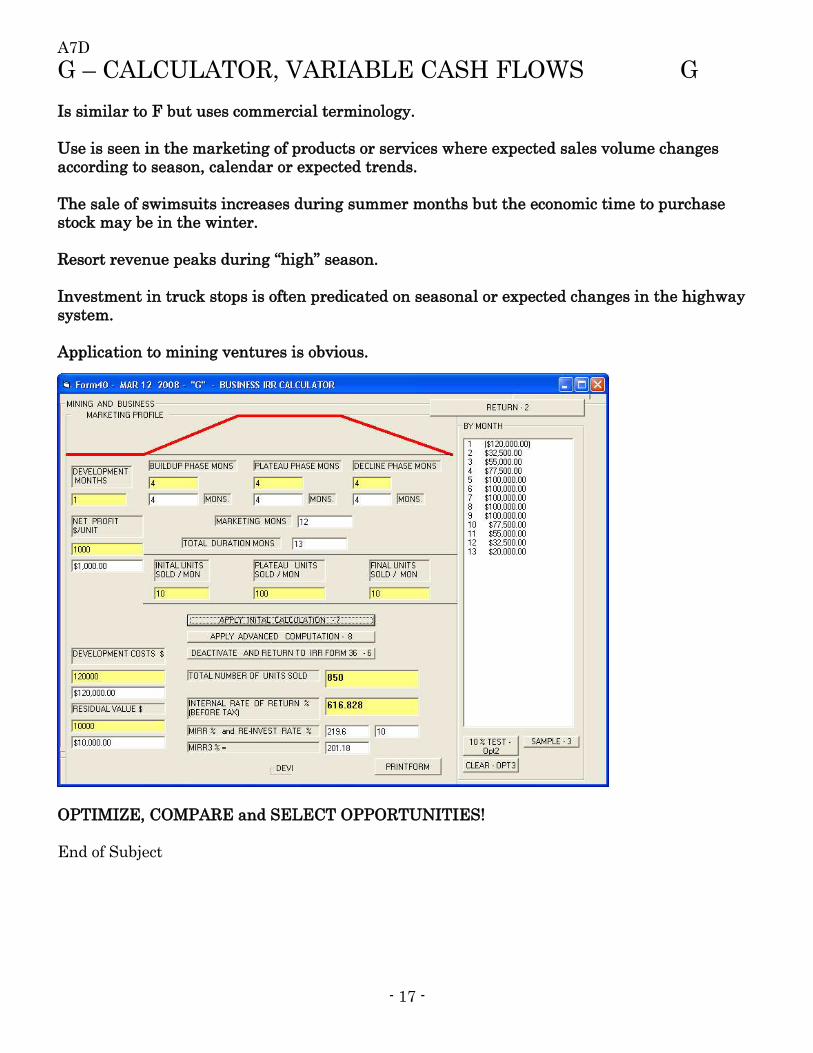
G – CALCULATOR, VARIABLE CASH FLOWS G Is similar to F but uses commercial terminology. Use is seen in the marketing of products or services where expected sales volume changes according to season, calendar or expected trends. The sale of swimsuits increases during summer months but the economic time to purchase stock may be in the winter. Resort revenue peaks during “high” season. Investment in truck stops is often predicated on seasonal or expected changes in the highway system. Application to mining ventures is obvious.
OPTIMIZE, COMPARE and SELECT OPPORTUNITIES! End of Subject
- 18 -
A2A
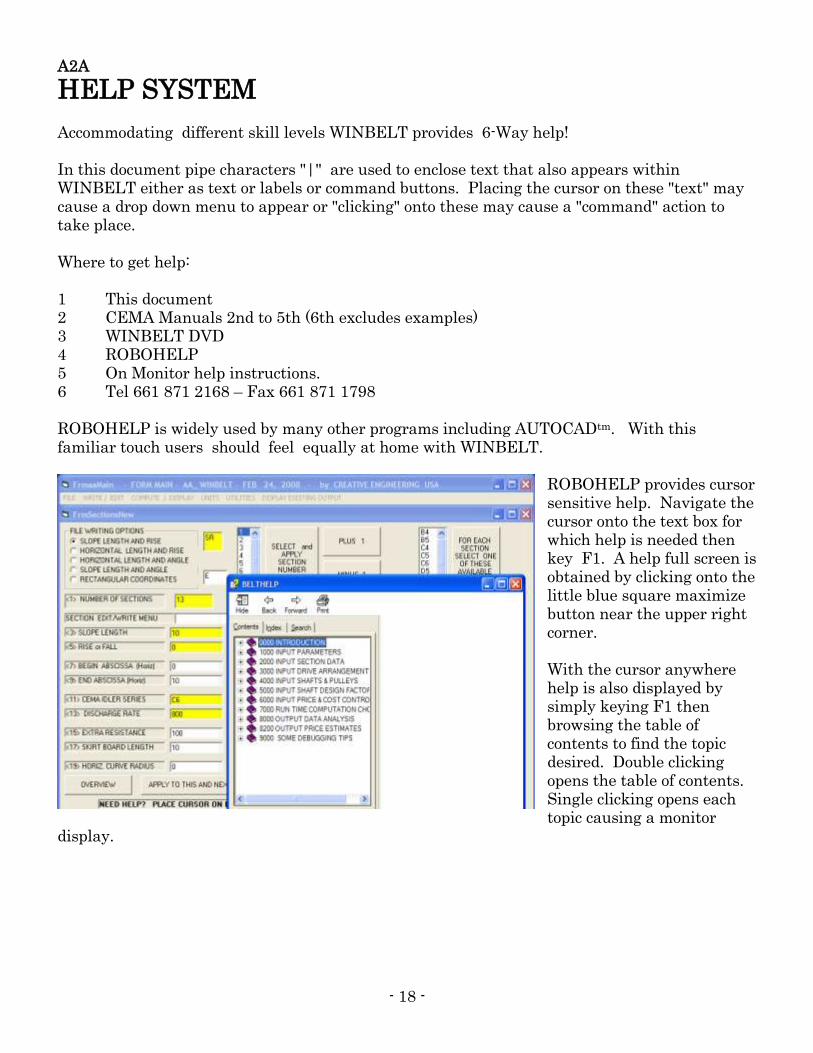
HELP SYSTEM Accommodating different skill levels WINBELT provides 6-Way help! In this document pipe characters "|" are used to enclose text that also appears within WINBELT either as text or labels or command buttons. Placing the cursor on these "text" may cause a drop down menu to appear or "clicking" onto these may cause a "command" action to take place. Where to get help: 1 This document 2 CEMA Manuals 2nd to 5th (6th excludes examples) 3 WINBELT DVD 4 ROBOHELP 5 On Monitor help instructions. 6 Tel 661 871 2168 – Fax 661 871 1798 ROBOHELP is widely used by many other programs including AUTOCADtm. With this familiar touch users should feel equally at home with WINBELT.
ROBOHELP provides cursor sensitive help. Navigate the cursor onto the text box for which help is needed then key F1. A help full screen is obtained by clicking onto the little blue square maximize button near the upper right corner. With the cursor anywhere help is also displayed by simply keying F1 then browsing the table of contents to find the topic desired. Double clicking opens the table of contents. Single clicking opens each topic causing a monitor
display.
- 19 -
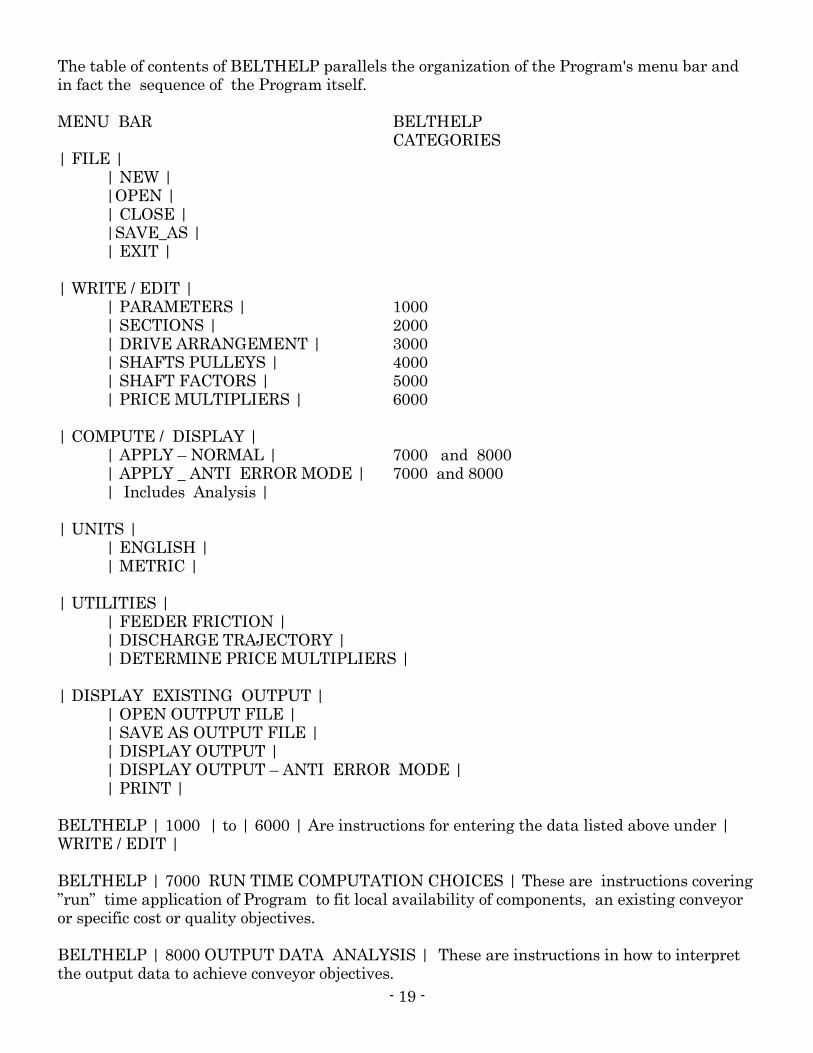
The table of contents of BELTHELP parallels the organization of the Program's menu bar and in fact the sequence of the Program itself. MENU BAR BELTHELP
CATEGORIES | FILE | | NEW | |OPEN | | CLOSE | |SAVE_AS | | EXIT | | WRITE / EDIT |
| PARAMETERS | 1000 | SECTIONS | 2000 | DRIVE ARRANGEMENT | 3000 | SHAFTS PULLEYS | 4000 | SHAFT FACTORS | 5000 | PRICE MULTIPLIERS | 6000
| COMPUTE / DISPLAY | | APPLY – NORMAL | 7000 and 8000
| APPLY _ ANTI ERROR MODE | 7000 and 8000 | Includes Analysis |
| UNITS | | ENGLISH | | METRIC | | UTILITIES | | FEEDER FRICTION | | DISCHARGE TRAJECTORY | | DETERMINE PRICE MULTIPLIERS | | DISPLAY EXISTING OUTPUT | | OPEN OUTPUT FILE | | SAVE AS OUTPUT FILE | | DISPLAY OUTPUT | | DISPLAY OUTPUT – ANTI ERROR MODE | | PRINT | BELTHELP | 1000 | to | 6000 | Are instructions for entering the data listed above under | WRITE / EDIT | BELTHELP | 7000 RUN TIME COMPUTATION CHOICES | These are instructions covering ”run” time application of Program to fit local availability of components, an existing conveyor or specific cost or quality objectives. BELTHELP | 8000 OUTPUT DATA ANALYSIS | These are instructions in how to interpret the output data to achieve conveyor objectives.

- 20 -
These multiple HELP approaches make learning WINBELT easier than you think. Opening the help topic for full screen viewing simply requires clicking onto the blue square maximize button at the upper right of the BELTHELP display. When help is longer than one page access to specific help needed may require placing the cursor on the slider bar at the right, holding the mouse button down while moving the cursor up or down. Return to immediate program by simply clicking the red X close button in the upper right corner. End of Subject

- 21 -
A3A
HELPFUL HINTS FILE WRITING RULES 1 SAVE TIME BY USING AN EXISTING FILE AS A TEMPLATE. Practice doing this
using one of the demo files. After opening a template file be sure to immediately save it under another name. Avoid saving files you value in the C:\WINBELT folder. These files are destroyed with each update. Name another folder for your own belt conveyor files.
2 YOU MUST WRITE OR EDIT ENTRIES IN ALL 6 CATEGORIES AT WRITE / EDIT. It
is OK to use default choices for shaft factors or price multipliers but be sure to click APPLY before returning to menu bar.
3 Always consider yellow or red background items a must. End of Subject

- 22 -
A4A
INSTALLATION REQUIREMENTS WINBELT has been used on computers with Microsoft 95, 98, 2000-NT, XP-Professional and 7 Home Premium systems. Difficulties have been encountered with some computers not having recent upgrades. The ANTI ERROR MODE, noted on the menu bar, may assist in some cases. Installation on computers with 2000-NT have been troublesome where the software has not been recently upgraded. No complaints have been heard from VISTA users as of 2009. INSTALLATION The basic instruction for installing the WINBELT folder is: Remove any earlier WINBELT folder that may have been previously installed. Copy and paste the WINBELT folder (from within the CREATIVE_DEMO or CREATIVE folder on the furnished CD) to your C: drive. This copy MUST be to the root directory of the C: drive in order for the ROBOHELP system to function. End of Subject
- 23 -
A5A
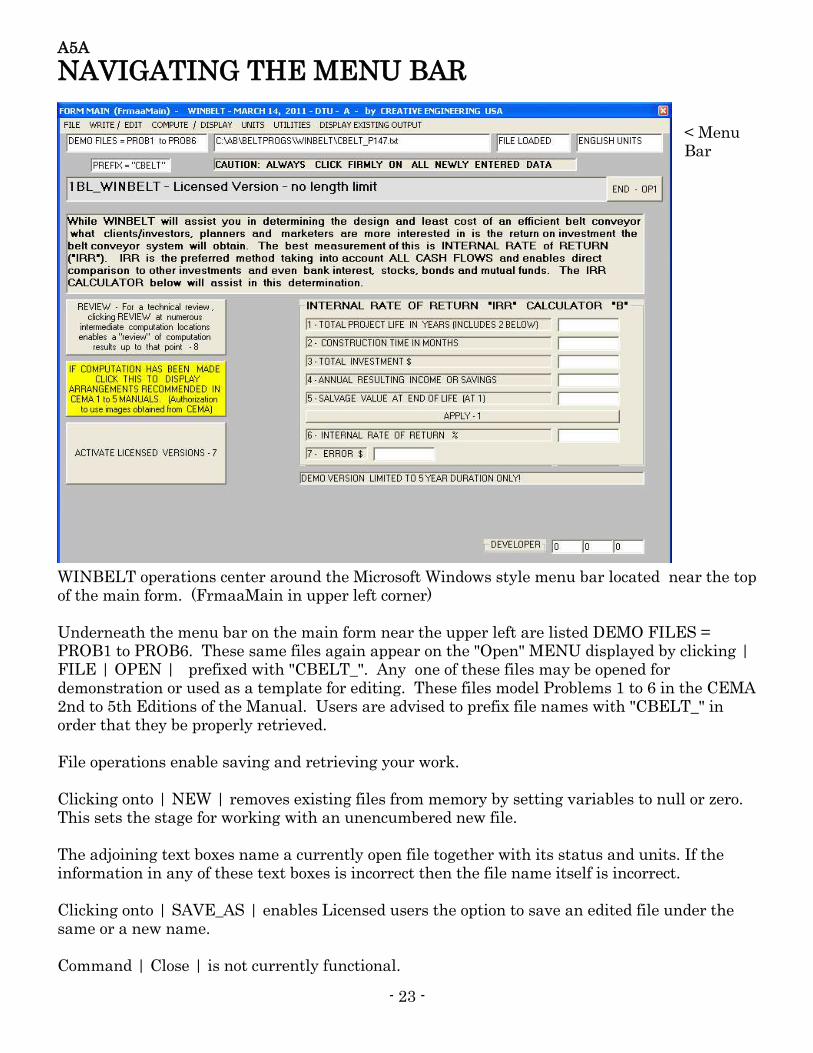
NAVIGATING THE MENU BAR < Menu Bar
WINBELT operations center around the Microsoft Windows style menu bar located near the top of the main form. (FrmaaMain in upper left corner) Underneath the menu bar on the main form near the upper left are listed DEMO FILES = PROB1 to PROB6. These same files again appear on the "Open" MENU displayed by clicking | FILE | OPEN | prefixed with "CBELT_". Any one of these files may be opened for demonstration or used as a template for editing. These files model Problems 1 to 6 in the CEMA 2nd to 5th Editions of the Manual. Users are advised to prefix file names with "CBELT_" in order that they be properly retrieved. File operations enable saving and retrieving your work. Clicking onto | NEW | removes existing files from memory by setting variables to null or zero. This sets the stage for working with an unencumbered new file. The adjoining text boxes name a currently open file together with its status and units. If the information in any of these text boxes is incorrect then the file name itself is incorrect. Clicking onto | SAVE_AS | enables Licensed users the option to save an edited file under the same or a new name. Command | Close | is not currently functional.

- 24 -
Clicking onto | EXIT | is a valid means for returning to the "desk top". Within WINBELT writing new files or editing existing files works from within the commands under | WRITE / EDIT |. | WRITE / EDIT | | WRITE / EDIT | PARAMETERS | are variables that apply to the whole conveyor. | WRITE / EDIT |SECTIONS | define the profile and variables specific to each section. | WRITE / EDIT |DRIVE ARRANGEMENT | variables define the main drive and take-up arrangement. | WRITE / EDIT |SHAFT AND PULLEY | variables describes each pulley and shaft assembly. | WRITE / EDIT | SHAFT FACTORS | variables cover shaft design standards and type of steel used. | WRITE / EDIT |PRICE MULTIPLIERS | enables prices displayed to properly reflect local purchase cost or selling price. For optimization purposes default price multipliers are useful but for commercial purposes should be adjusted to properly reflect users local cost. Procedure for adjusting price multipliers is available at | UTILITIES | DETERMINE PRICE MULTIPLIERS | | COMPUTE / DISPLAY | | COMPUTE / DISPLAY | APPLY - NORMAL | initiates the computation process and causes display in the preferred format. (Recommended) | COMPUTE / DISPLAY | APPLY - ANTI ERROR MODE | causes display in a mode that may be more compatible with older operating systems or operating systems that have not had the benefit of recent upgrades. Use of this should be initiated only if an error first occurs with | APPLY - NORMAL | above. (Not Recommended) | UNITS | Selection of units is made by clicking onto either | UNITS | ENGLISH (IMPERIAL) | or | UNITS | METRIC |. | UTILITIES | | UTILITIES | FEEDER FRICTION | This routine facilitates determination of feeder resistance based on B. F. Goodrich methods. This additional resistance occurs whenever the feed onto a belt, usually from a hopper, is regulated by the cross sectional area of a gated opening and the speed of the belt. The frictional resistance is largely a function of the length of the feed arrangement along the belt. The resistance or friction force determined by this routine is input at | SECTIONS | <15> EXTRA RESISTANCE | for the section in which the feeder arrangement is located.
- 25 -
This determination is not required where material is falling freely onto the belt such as occurs at the discharge from another belt conveyor. | UTILITIES | DISCHARGE TRAJECTORY | This utility uses CEMA methods to assist in the determination of discharge trajectories. | UTILITIES | DETERMINE PRICE MULTIPLIERS | This utility assists in the determination of price multipliers in order that the prices output at TITLES 1, 19 and 21 reflect the users intent. This a "teaching tool". Multpliers determined are not automatically entered in conveyor files. Determined multipliers must be entered in belt conveyor files as appropriate or be included in a template file for automatic inclusion. | DISPLAY EXISTING OUTPUT | | DISPLAY EXISTING OUTPUT | OPEN OUTPUT FILE | This command enables opening (displaying) an available output file. Since this is an "OUTPUT FILE" the name of the input file will not appear in the text boxes below the tool bar. | DISPLAY EXISTING OUTPUT | SAVE AS OUTPUT DATA | Output data in memory (Titles 1 to 22) may be saved to file. When action is taken to open the file it will appear with files prefixed with "CBELT_" so be sure to give the output file a distinguishing name but also prefixed with the same "CBELT_". Something like "CBELT_PROB4_OUTPUT" | DISPLAY EXISTING OUTPUT | DISPLAY OUTPUT | This command enables display of output in memory that may have been temporarily lost. | DISPLAY EXISTING OUTPUT | DISPLAY OUTPUT - ANTI ERROR MODE | Execute if | DISPLAY EXISTING OUTPUT | DISPLAY OUTPUT | is not functional. | DISPLAY EXISTING OUTPUT | PRINT | Execute if a hardcopy is desired. If an exact hardcopy or "snapshot" of a Windows Screen is desired we recommend: Fullshot by Inbit Inc., End of Subject

- 26 -
A6A
WINBELT STEP BY STEP This subject is provided to enable new users to visualize the entire design process provided by WINBELT. Detailed instructions are supplied elsewhere. To assist in accessing this when applicable the Ctrl+F access combination of letters is provided within following parenthesis ().
FORMMAIN is the opening form of WINBELT. The Microsoft style tool bar is the control center for activities. From it new files may be written, edited, saved, opened and reviewed. (A5A) INPUT 1) PARAMETERS form - Size and speed of a belt conveyor is directly related to its volumetric capacity. The first 6 inputs at this form enable an easy reading of percent loading. Overloading the volumetric capacity of a belt conveyor is a common and costly error. Therefore these 6 inputs set the stage for a successful conveyor by initiating the critical thinking process into “how is the conveyor fed?” (C2A, C2B) INPUT 2) SECTIONS form - Tension varies along the belt line. Program enables dividing the conveyor into up to 49 sections. This enables reading tension at various points in order to optimize idler space, reduce spillage and economically and safely design pulley shafts based on accurate tension determinations. Sections may be written in 5 different combinations to suit user habits and how information is received. (C3A, C3B, C3C)
INPUT 3) DRIVE ARRANGEMENT form. Program allows for both dual and single pulley drives. Integration of these within a single program code enables real time optimization of the whole. (C4B)
- 27 -
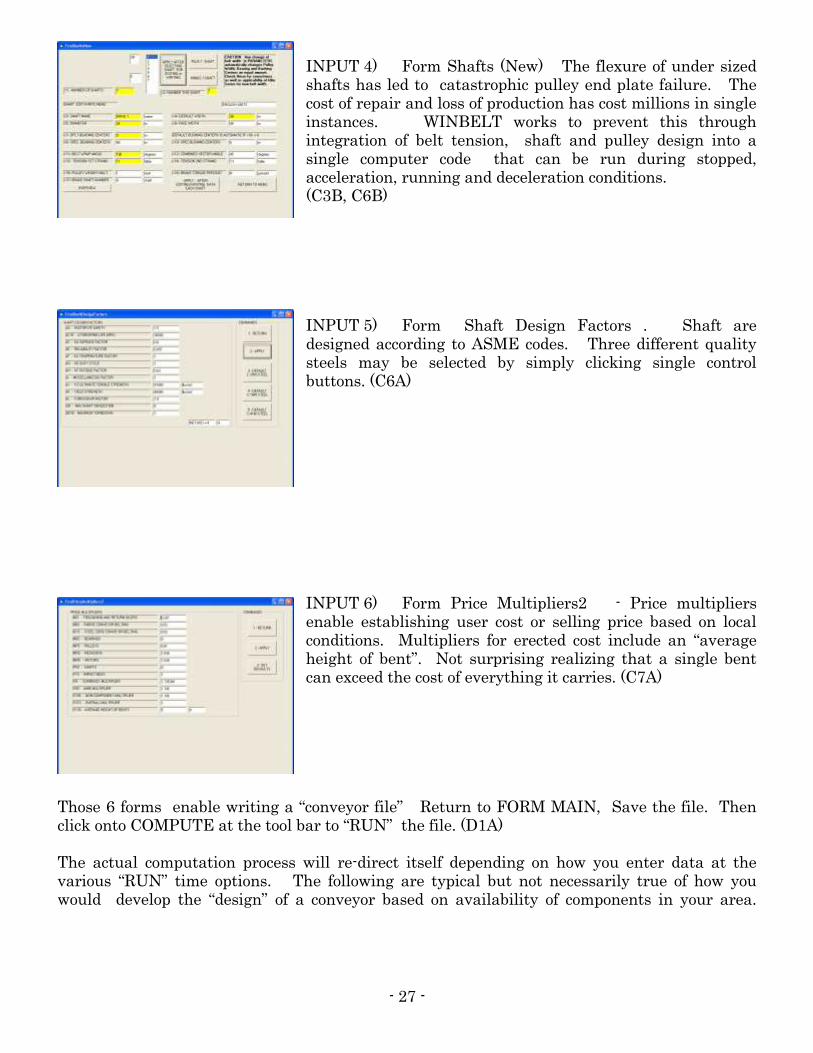
INPUT 4) Form Shafts (New) The flexure of under sized shafts has led to catastrophic pulley end plate failure. The cost of repair and loss of production has cost millions in single instances. WINBELT works to prevent this through integration of belt tension, shaft and pulley design into a single computer code that can be run during stopped, acceleration, running and deceleration conditions. (C3B, C6B)
INPUT 5) Form Shaft Design Factors . Shaft are designed according to ASME codes. Three different quality steels may be selected by simply clicking single control buttons. (C6A)
INPUT 6) Form Price Multipliers2 - Price multipliers enable establishing user cost or selling price based on local conditions. Multipliers for erected cost include an “average height of bent”. Not surprising realizing that a single bent can exceed the cost of everything it carries. (C7A)
Those 6 forms enable writing a “conveyor file” Return to FORM MAIN, Save the file. Then click onto COMPUTE at the tool bar to “RUN” the file. (D1A) The actual computation process will re-direct itself depending on how you enter data at the various “RUN” time options. The following are typical but not necessarily true of how you would develop the “design” of a conveyor based on availability of components in your area.
- 28 -
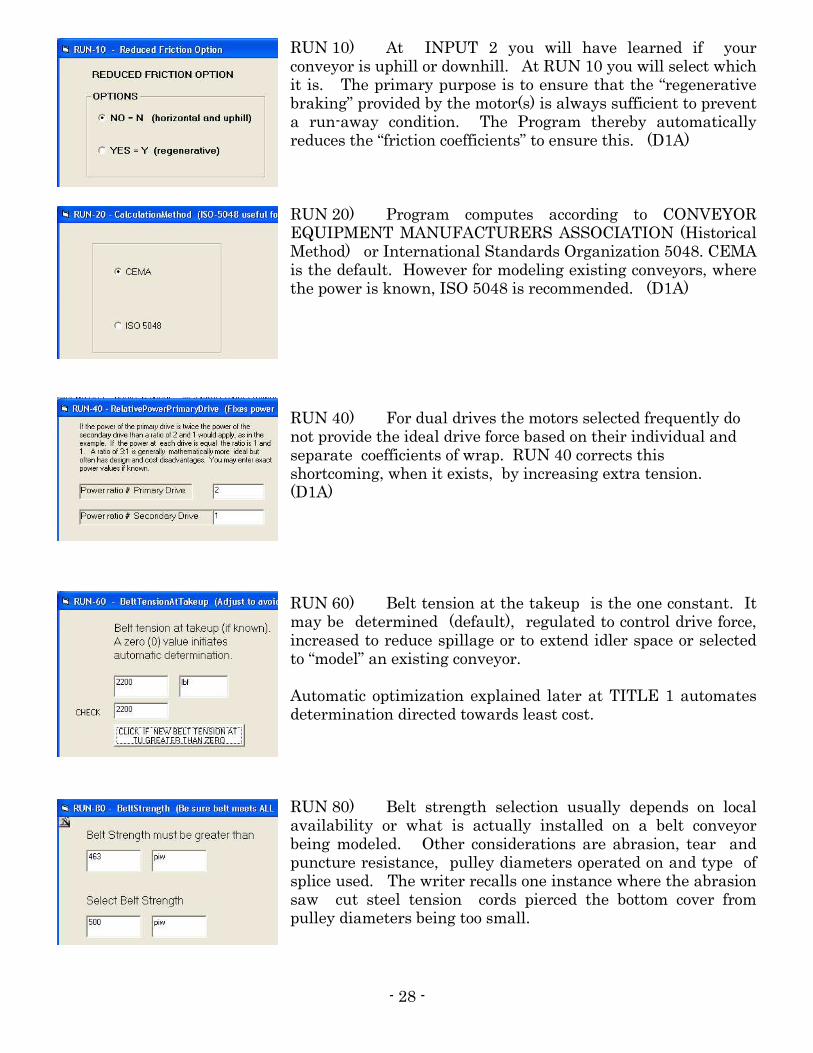
RUN 10) At INPUT 2 you will have learned if your conveyor is uphill or downhill. At RUN 10 you will select which it is. The primary purpose is to ensure that the “regenerative braking” provided by the motor(s) is always sufficient to prevent a run-away condition. The Program thereby automatically reduces the “friction coefficients” to ensure this. (D1A) RUN 20) Program computes according to CONVEYOR EQUIPMENT MANUFACTURERS ASSOCIATION (Historical Method) or International Standards Organization 5048. CEMA is the default. However for modeling existing conveyors, where the power is known, ISO 5048 is recommended. (D1A)
RUN 40) For dual drives the motors selected frequently do not provide the ideal drive force based on their individual and separate coefficients of wrap. RUN 40 corrects this shortcoming, when it exists, by increasing extra tension. (D1A)
RUN 60) Belt tension at the takeup is the one constant. It may be determined (default), regulated to control drive force, increased to reduce spillage or to extend idler space or selected to “model” an existing conveyor. Automatic optimization explained later at TITLE 1 automates determination directed towards least cost.
RUN 80) Belt strength selection usually depends on local availability or what is actually installed on a belt conveyor being modeled. Other considerations are abrasion, tear and puncture resistance, pulley diameters operated on and type of splice used. The writer recalls one instance where the abrasion saw cut steel tension cords pierced the bottom cover from pulley diameters being too small.
- 29 -
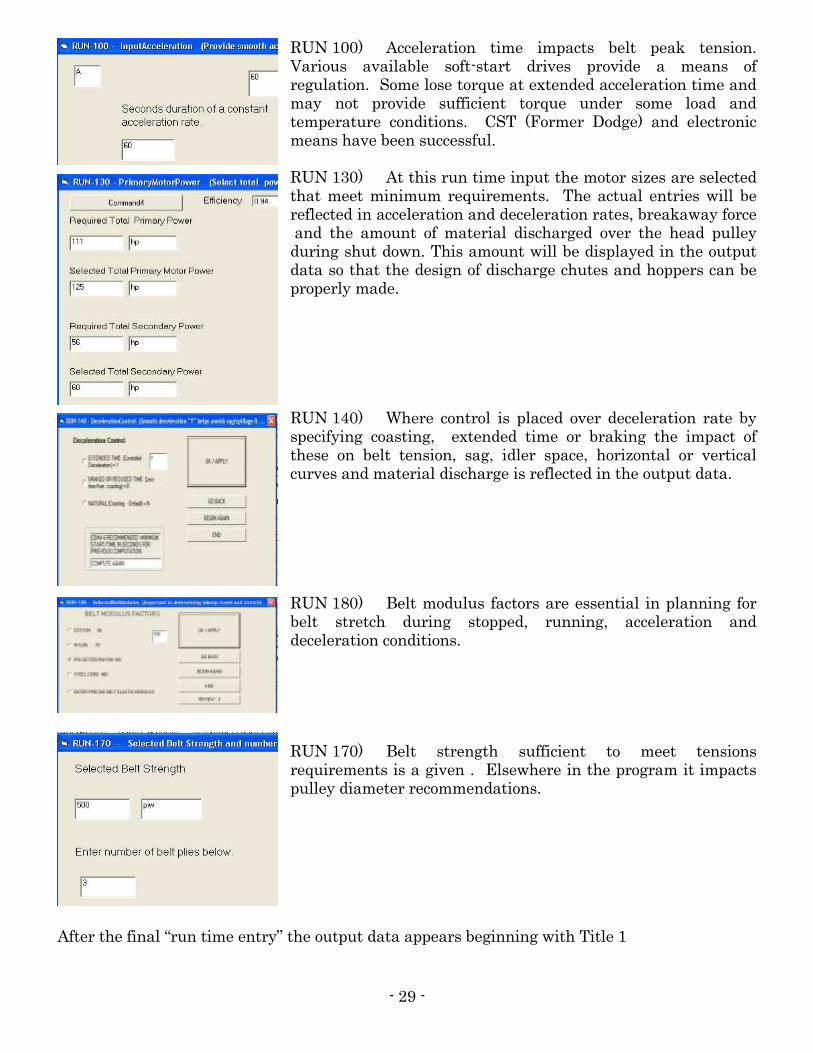
RUN 100) Acceleration time impacts belt peak tension. Various available soft-start drives provide a means of regulation. Some lose torque at extended acceleration time and may not provide sufficient torque under some load and temperature conditions. CST (Former Dodge) and electronic means have been successful. RUN 130) At this run time input the motor sizes are selected that meet minimum requirements. The actual entries will be reflected in acceleration and deceleration rates, breakaway force and the amount of material discharged over the head pulley during shut down. This amount will be displayed in the output data so that the design of discharge chutes and hoppers can be properly made. RUN 140) Where control is placed over deceleration rate by specifying coasting, extended time or braking the impact of these on belt tension, sag, idler space, horizontal or vertical curves and material discharge is reflected in the output data. RUN 180) Belt modulus factors are essential in planning for belt stretch during stopped, running, acceleration and deceleration conditions. RUN 170) Belt strength sufficient to meet tensions requirements is a given . Elsewhere in the program it impacts pulley diameter recommendations.
After the final “run time entry” the output data appears beginning with Title 1
- 30 -
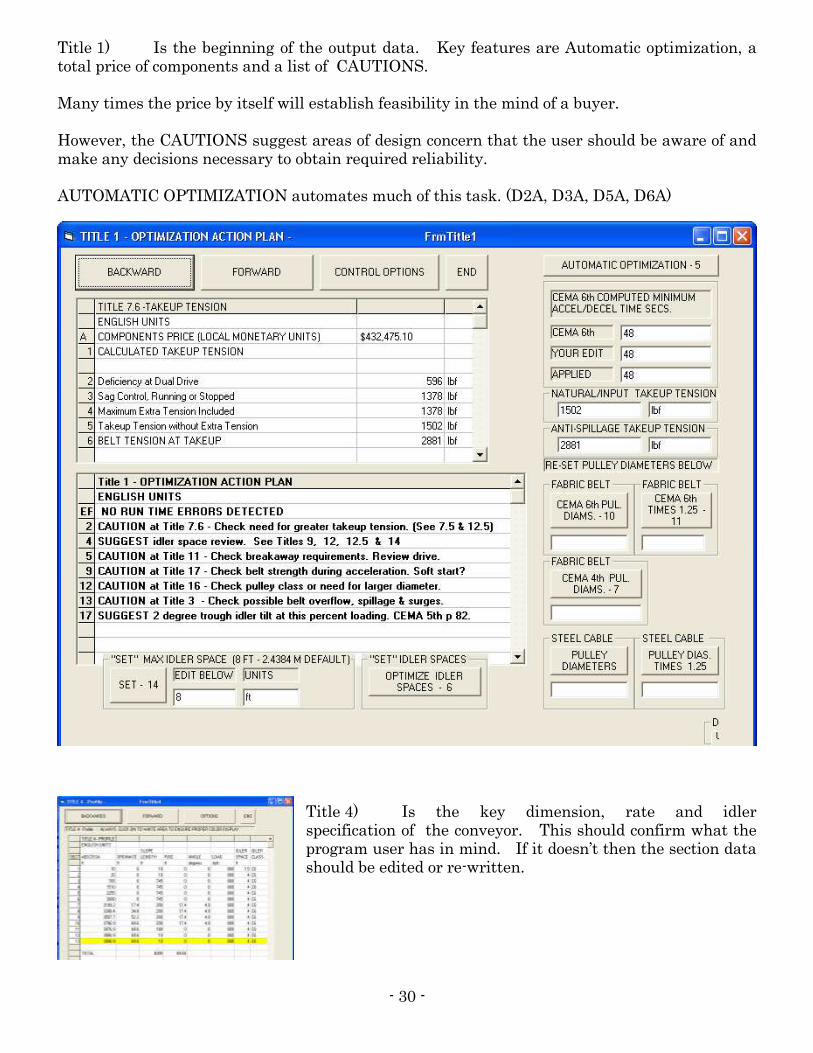
Title 1) Is the beginning of the output data. Key features are Automatic optimization, a total price of components and a list of CAUTIONS. Many times the price by itself will establish feasibility in the mind of a buyer. However, the CAUTIONS suggest areas of design concern that the user should be aware of and make any decisions necessary to obtain required reliability. AUTOMATIC OPTIMIZATION automates much of this task. (D2A, D3A, D5A, D6A)
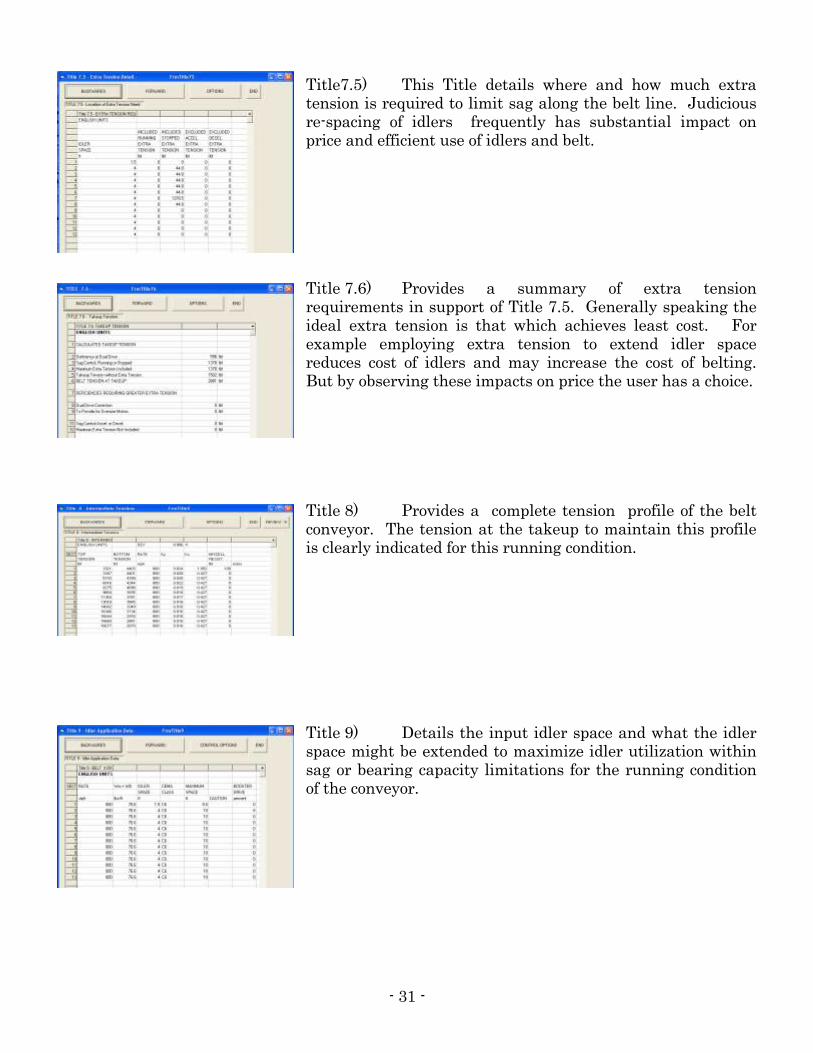
Title 4) Is the key dimension, rate and idler specification of the conveyor. This should confirm what the program user has in mind. If it doesn’t then the section data should be edited or re-written.
- 31 -
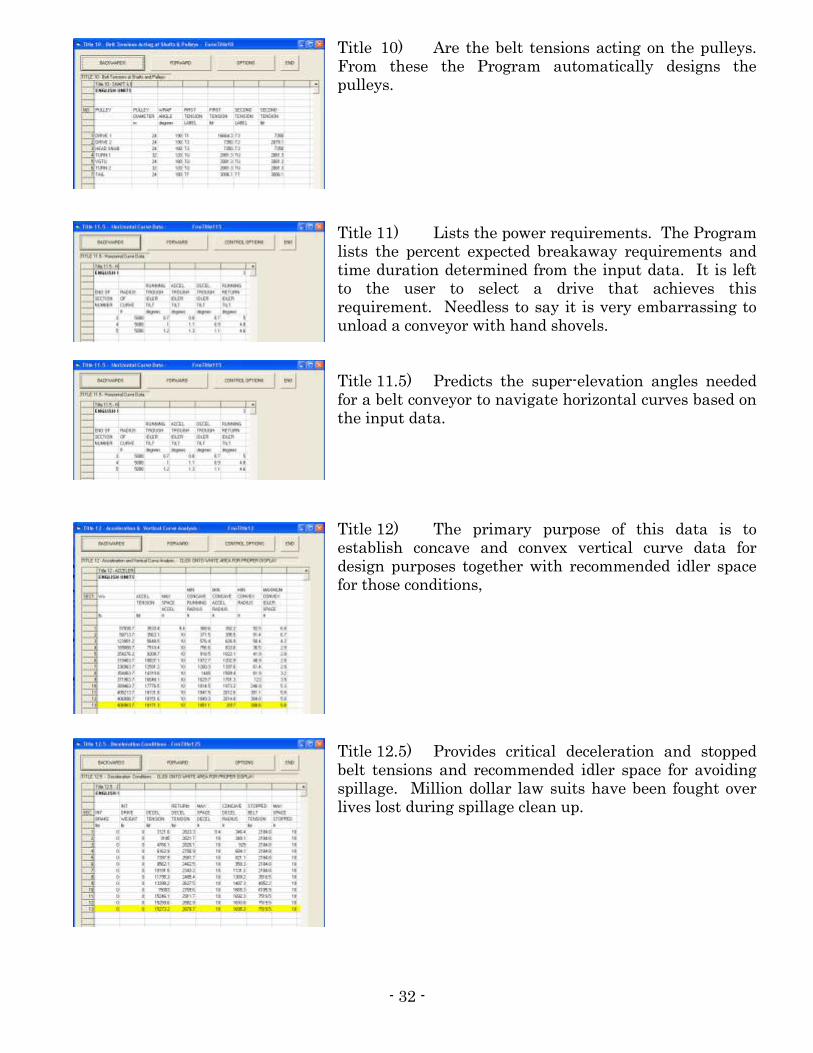
Title7.5) This Title details where and how much extra tension is required to limit sag along the belt line. Judicious re-spacing of idlers frequently has substantial impact on price and efficient use of idlers and belt.
Title 7.6) Provides a summary of extra tension requirements in support of Title 7.5. Generally speaking the ideal extra tension is that which achieves least cost. For example employing extra tension to extend idler space reduces cost of idlers and may increase the cost of belting. But by observing these impacts on price the user has a choice.
Title 8) Provides a complete tension profile of the belt conveyor. The tension at the takeup to maintain this profile is clearly indicated for this running condition.
Title 9) Details the input idler space and what the idler space might be extended to maximize idler utilization within sag or bearing capacity limitations for the running condition of the conveyor.
- 32 -
Title 10) Are the belt tensions acting on the pulleys. From these the Program automatically designs the pulleys. Title 11) Lists the power requirements. The Program lists the percent expected breakaway requirements and time duration determined from the input data. It is left to the user to select a drive that achieves this requirement. Needless to say it is very embarrassing to unload a conveyor with hand shovels. Title 11.5) Predicts the super-elevation angles needed for a belt conveyor to navigate horizontal curves based on the input data.
Title 12) The primary purpose of this data is to establish concave and convex vertical curve data for design purposes together with recommended idler space for those conditions, Title 12.5) Provides critical deceleration and stopped belt tensions and recommended idler space for avoiding spillage. Million dollar law suits have been fought over lives lost during spillage clean up.
- 33 -
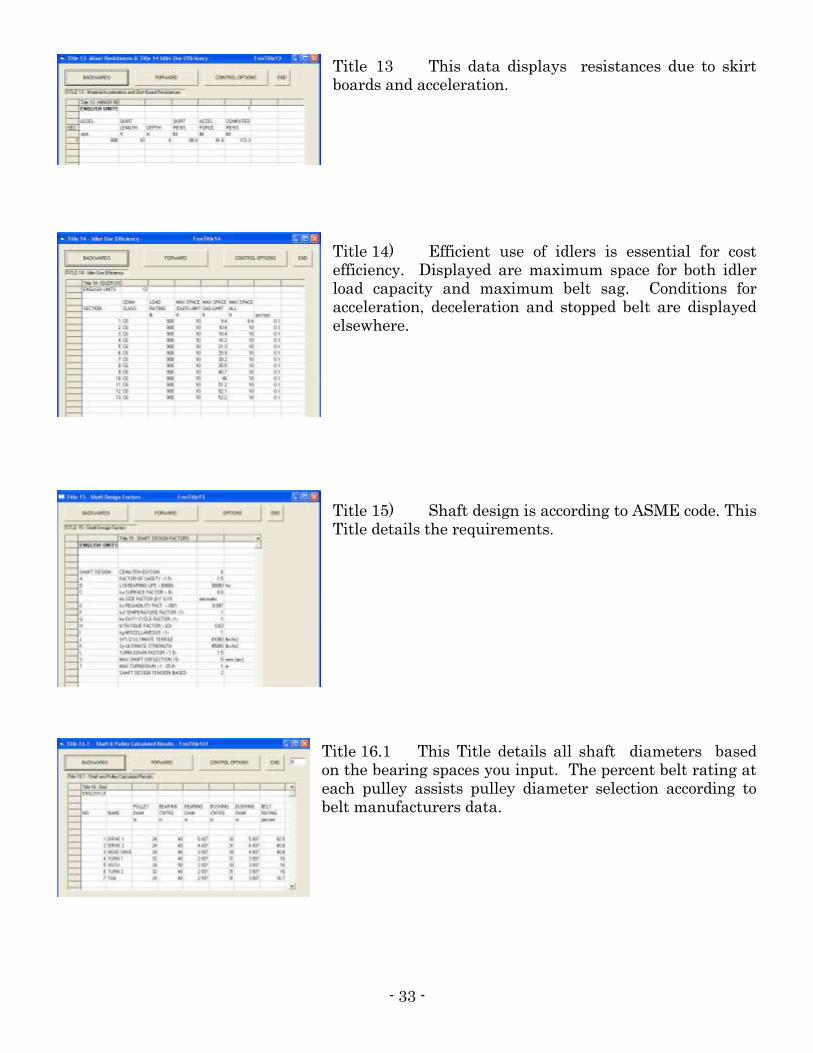
Title 13 This data displays resistances due to skirt boards and acceleration.
Title 14) Efficient use of idlers is essential for cost efficiency. Displayed are maximum space for both idler load capacity and maximum belt sag. Conditions for acceleration, deceleration and stopped belt are displayed elsewhere.
Title 15) Shaft design is according to ASME code. This Title details the requirements.
Title 16.1 This Title details all shaft diameters based on the bearing spaces you input. The percent belt rating at each pulley assists pulley diameter selection according to belt manufacturers data.
- 34 -
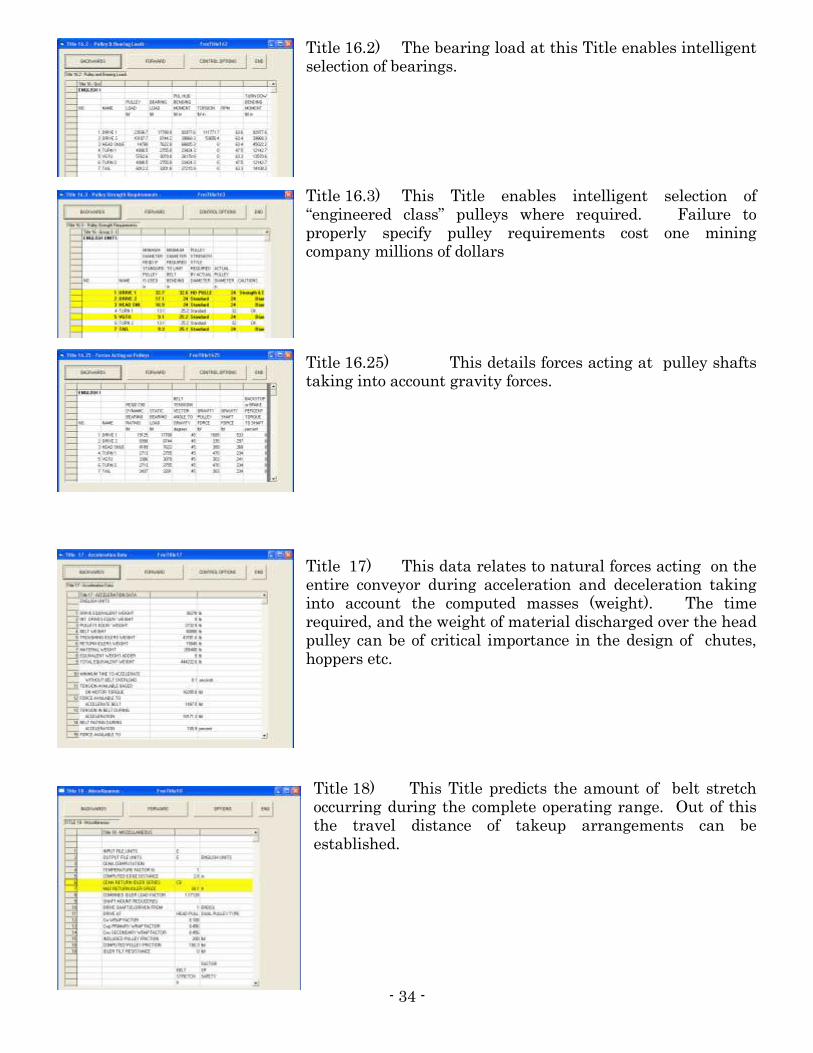
Title 16.2) The bearing load at this Title enables intelligent selection of bearings. Title 16.3) This Title enables intelligent selection of “engineered class” pulleys where required. Failure to properly specify pulley requirements cost one mining company millions of dollars Title 16.25) This details forces acting at pulley shafts taking into account gravity forces.
Title 17) This data relates to natural forces acting on the entire conveyor during acceleration and deceleration taking into account the computed masses (weight). The time required, and the weight of material discharged over the head pulley can be of critical importance in the design of chutes, hoppers etc.
Title 18) This Title predicts the amount of belt stretch occurring during the complete operating range. Out of this the travel distance of takeup arrangements can be established.
- 35 -
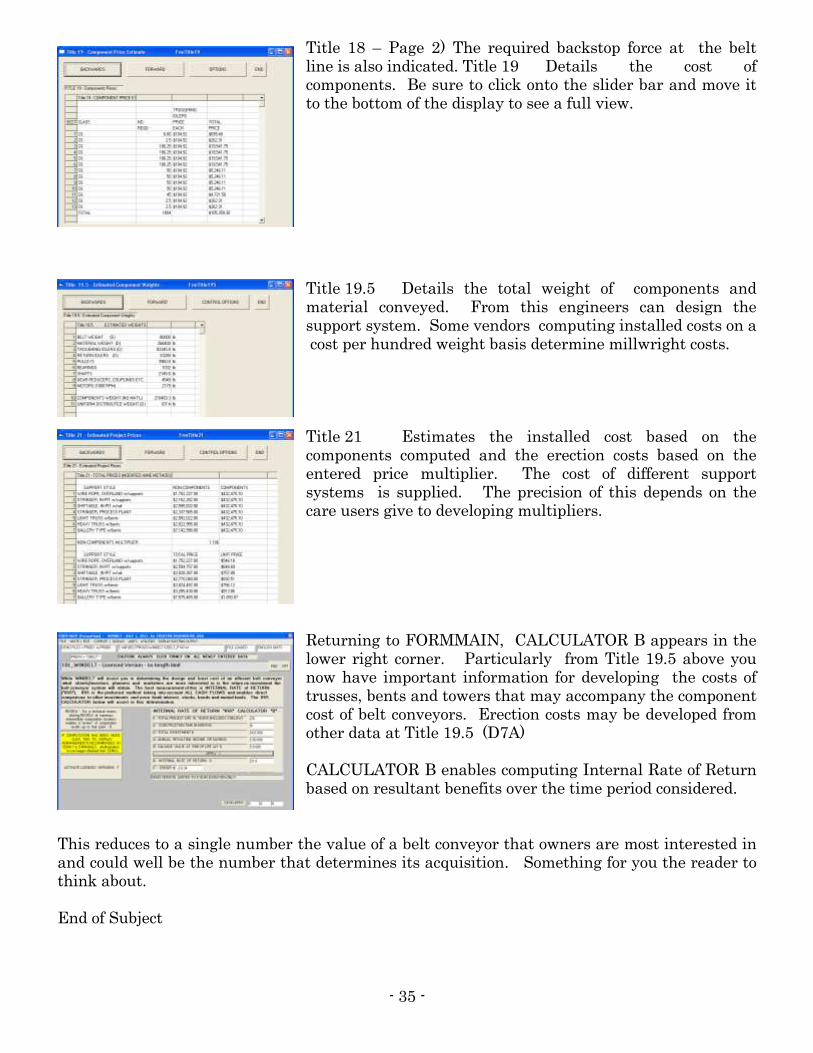
Title 18 – Page 2) The required backstop force at the belt line is also indicated. Title 19 Details the cost of components. Be sure to click onto the slider bar and move it to the bottom of the display to see a full view.
Title 19.5 Details the total weight of components and material conveyed. From this engineers can design the support system. Some vendors computing installed costs on a cost per hundred weight basis determine millwright costs. Title 21 Estimates the installed cost based on the components computed and the erection costs based on the entered price multiplier. The cost of different support systems is supplied. The precision of this depends on the care users give to developing multipliers.
Returning to FORMMAIN, CALCULATOR B appears in the lower right corner. Particularly from Title 19.5 above you now have important information for developing the costs of trusses, bents and towers that may accompany the component cost of belt conveyors. Erection costs may be developed from other data at Title 19.5 (D7A) CALCULATOR B enables computing Internal Rate of Return based on resultant benefits over the time period considered.
This reduces to a single number the value of a belt conveyor that owners are most interested in and could well be the number that determines its acquisition. Something for you the reader to think about. End of Subject
- 36 -
C1C
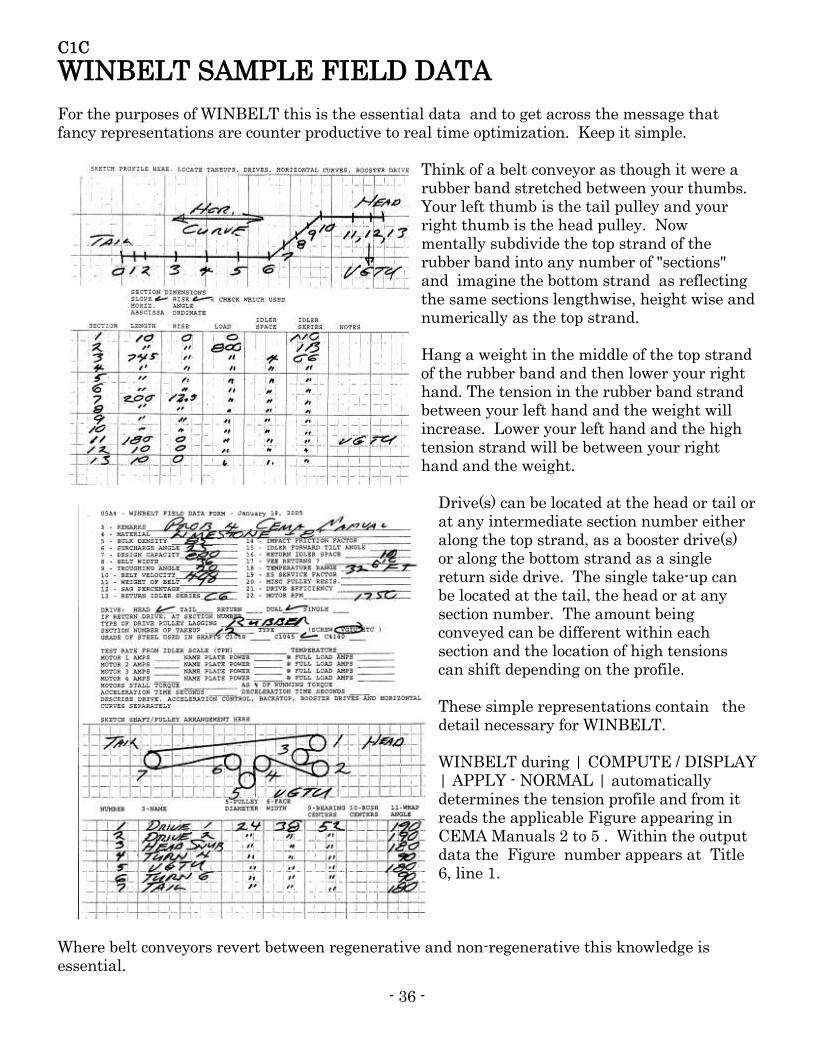
WINBELT SAMPLE FIELD DATA For the purposes of WINBELT this is the essential data and to get across the message that fancy representations are counter productive to real time optimization. Keep it simple.
Think of a belt conveyor as though it were a rubber band stretched between your thumbs. Your left thumb is the tail pulley and your right thumb is the head pulley. Now mentally subdivide the top strand of the rubber band into any number of "sections" and imagine the bottom strand as reflecting the same sections lengthwise, height wise and numerically as the top strand. Hang a weight in the middle of the top strand of the rubber band and then lower your right hand. The tension in the rubber band strand between your left hand and the weight will increase. Lower your left hand and the high tension strand will be between your right hand and the weight.
Drive(s) can be located at the head or tail or at any intermediate section number either along the top strand, as a booster drive(s) or along the bottom strand as a single return side drive. The single take-up can be located at the tail, the head or at any section number. The amount being conveyed can be different within each section and the location of high tensions can shift depending on the profile. These simple representations contain the detail necessary for WINBELT. WINBELT during | COMPUTE / DISPLAY | APPLY - NORMAL | automatically determines the tension profile and from it reads the applicable Figure appearing in CEMA Manuals 2 to 5 . Within the output data the Figure number appears at Title 6, line 1.
Where belt conveyors revert between regenerative and non-regenerative this knowledge is essential.

- 37 -
To help users adapt to this methodology and to facilitate transferring data into WINBELT the WINBELT FIELD DATA FORM is useful. Simplicity is its virtue. Whether the data is being taken from an existing conveyor or being prepared for a new conveyor this form assists the data entry process into sections at Chapters C3A to C3C or Shafts and Pulleys at Chapter C5B But this does not preclude other representations either mental or formalized. End of Subject

- 38 -
C1D
WRITE / EDIT – OVERVIEW These instructions augment those available by keying the F1 help key. The process of using WINBELT is incorporated in the Menu Bar. FILE, WRITE/EDIT, COMPUTE / DISPLAY, UNITS, UTILITIES, DISPLAY EXISTING OUTPUT. Translation = Write or edit a file, save it, compute it and then analyze the reults. Where possible this document explains the theory, describes the input and then lists the necessary key-strokes need by way of example. As a further assist the Chapter headings parallel those used for the WINBELT DVD. End of Subject

- 39 -
C2A
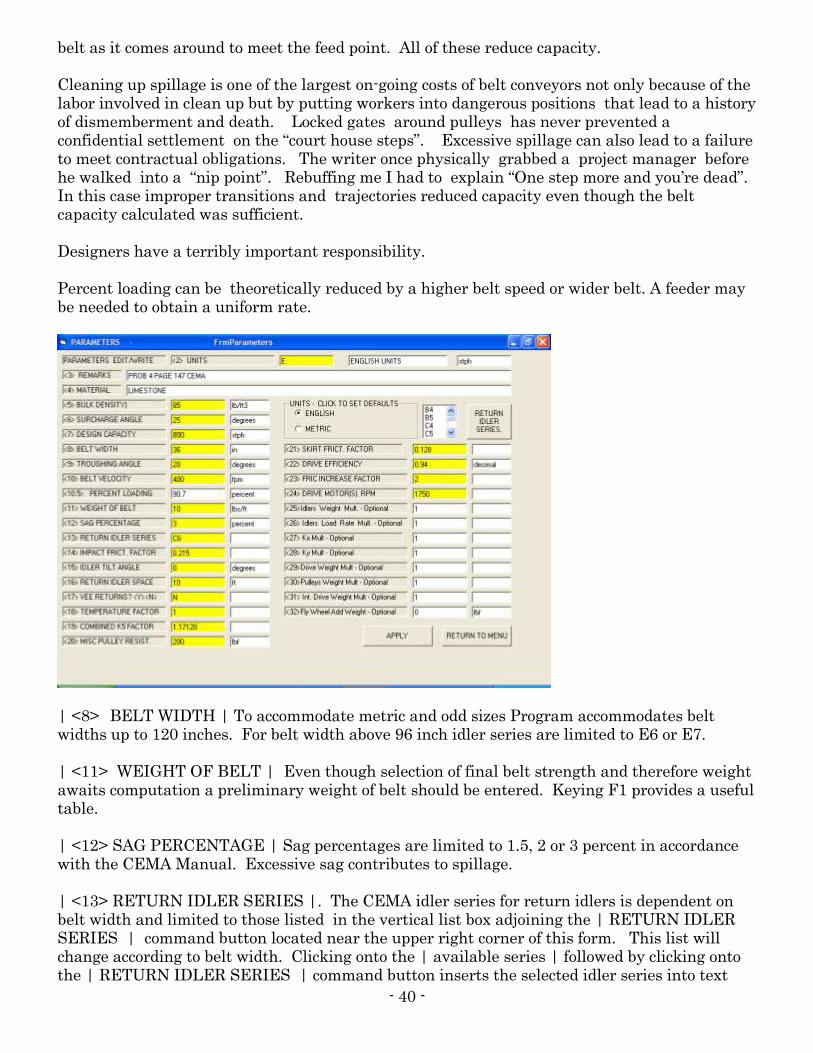
PARAMETERS GENERAL Parameters are design factors that apply to the whole conveyor. These should be written first to ensure proper order of data entry. Take particular note of any change in width. Click | WRITE/EDIT | PARAMETERS | to begin the file writing process at at FormaaMain HELP related to each text box is obtained by positioning the cursor on the selected text box and keying F1. UNITS - CLICK TO SET DEFAULTS, English or metric units choice can be set or reset in the box labeled UNITS near center top. Units can be changed at any time for convenience of each persons preference. When units are changed adjoining descriptions change at the same time. Units can also be reset directly from the menu bar at | UNITS |. Help for filling in all parameters is available at F1 Help Key. Parameters: | <3> REMARKS | | <4> MATERIAL | are optional. The content of these do not enter into the computation. However, text entered appears at the header of the hardcopy output along with date and time appearing just below. Since these impact the appearance of the presentation you may wish to identify company name, location, conveyor number etc.
Parameters: | <5> BULK DENSITY | | <6> SURCHARGE ANGLE | | <7> DESIGN CAPACITY | | <8> BELT WIDTH | | <9> TROUGHING ANGLE > | | <10> BELT VELOCITY > | Are the most essential relationships of every conveyor. By clicking |APPLY |near lower right the theoretical | <10.5>
PERCENT LOADING | of the conveyor represented by these parameters is displayed. This is the moment for the designer to put on his or her thinking cap! This first computation enables checking the theoretical validity of the data just entered and provides an opportunity to change the design to a more acceptable configuration. Theoretical capacity is reduced by misaligned belt, feed not centered or feed not in line with belt, feed not uniform (too much black belt), material with too much oversize, insufficient tension for idler space, belt slippage, incorrect belt speed, belt too steep, and belt not full width, or perhaps an error in one of the parameters. Sometimes forgotten is the importance of centering the return
- 40 -
belt as it comes around to meet the feed point. All of these reduce capacity. Cleaning up spillage is one of the largest on-going costs of belt conveyors not only because of the labor involved in clean up but by putting workers into dangerous positions that lead to a history of dismemberment and death. Locked gates around pulleys has never prevented a confidential settlement on the “court house steps”. Excessive spillage can also lead to a failure to meet contractual obligations. The writer once physically grabbed a project manager before he walked into a “nip point”. Rebuffing me I had to explain “One step more and you’re dead”. In this case improper transitions and trajectories reduced capacity even though the belt capacity calculated was sufficient. Designers have a terribly important responsibility. Percent loading can be theoretically reduced by a higher belt speed or wider belt. A feeder may be needed to obtain a uniform rate.
| <8> BELT WIDTH | To accommodate metric and odd sizes Program accommodates belt widths up to 120 inches. For belt width above 96 inch idler series are limited to E6 or E7. | <11> WEIGHT OF BELT | Even though selection of final belt strength and therefore weight awaits computation a preliminary weight of belt should be entered. Keying F1 provides a useful table. | <12> SAG PERCENTAGE | Sag percentages are limited to 1.5, 2 or 3 percent in accordance with the CEMA Manual. Excessive sag contributes to spillage. | <13> RETURN IDLER SERIES |. The CEMA idler series for return idlers is dependent on belt width and limited to those listed in the vertical list box adjoining the | RETURN IDLER SERIES | command button located near the upper right corner of this form. This list will change according to belt width. Clicking onto the | available series | followed by clicking onto the | RETURN IDLER SERIES | command button inserts the selected idler series into text
- 41 -
box | <13> RETURN IDLER SERIES |. Carry side idlers are specified in the section data. | <14> IMPACT FRICT. FACTOR |. Increasingly Impact beds are used in lieu of impact idlers. Placement of the impact bed and its length are determined at | WRITE / EDIT | SECTIONS | | <3> SLOPE LENGTH |. Assistance in this entry is made at BELTHELP by keying F1. An advantage of impact beds over impact idlers is that wear can be seen and therefore life span predicted. Failure is gradual rather than sudden. Linear support of the belt (lengthwise) at this crucial point tends to reduce spillage by maintaining better contact between belt and the skirt rubber. | <15> IDLER TILT ANGLE |. Acceptable idler tilt angles are either 0 or 2 degrees. Some idler manufacturers build in a 2 degree tilt. The same belt aligning effect can also be accomplished by placing flat steel washers between the support stringers (to obtain a near 2 degree forward tilt) and the base of the idler at or near the hold down bolts farthest from the head pulley. Program computes added friction due to tilting based on international methods. This method aligns the belt automatically similar to the way camber and toe in angles correct automotive steering. Cost advantages relating to increased capacity and maintenance reduction outweigh increased energy requirement. | <16> RETURN IDLER SPACE |. While 10 feet or 3 meters is a popular return idler space additional information on this subject is provided by keying F1. Out of round or dirty flat return idlers sometimes induce belt vibration (flapping). At | Title 14 | for any section when the | rps/cps | is near 1, .5 or .3 the likelihood of this is increased. Changing idler space in the offending section reduces this tendency. After computation view | TITLE 18 | MAXimum RETURN IDLER SPACE |based on idler load capacity taking into account the above comment at | Title 14 |. | <17> VEE RETURNS <Y><N> |. Belt alignment is essential to obtaining full capacity. To a large extent this depends on how well the return belt is aligned before it comes around to meet the point at which the belt is being fed. Vee returns are particularly effective in doing this. Better yet vee returns given the 2 degree tilt treatment. In one case of which the writer is aware the improvement in capacity by replacing conventional flat return idlers with Vee returns eliminated a dispute over contractual obligations. | Title 18 | Maximum RETURN IDLER SPACE | is displayed. I am not aware of and don't visualize return belt vibration happening with Vee Return Idlers. Return belt cleaning may be more critical with Vee Return Idlers. However, if a "turn-over scheme" is embodied to reduce the belt cleaning need the belt centering tendencies of the Vee Returns is largely lost. The writer suggests a fine horizontal adjustment of the bearings supporting the turn pulley nearest the tail pulley be included in the design to steer the belt onto the tail pulley. | <18> TEMPERATURE FACTOR |. Temperature factor takes into account increase in friction at low temperatures. Program user should also run Program for winter condition to better ensure breakaway. Downhill conveyors should also be run for maximum high temperature to obtain least retarding friction condition. | <19> COMBINED K5 FACTOR |. Combined K5 factor covers various service factors. Assistance at obtaining a K5 factor is available at F1 help. | <20> MISCELLANEOUS PULLEY RESISTANCE |. Pulley and belt cleaner friction can be
- 42 -
entered here. A computed pulley friction is provided at | Title 18 | 16 COMPUTED PULLEY FRICTION | in the output data. The writer frequently enters 200 pounds and then edits the value based on the | TITLE 18 | COMPUTED PULLEY FRICTION |. Friction for belt cleaners can be entered here or at| SECTIONS | <15> EXTRA RESISTANCE |for the section in which that resistance occurs In the case of output data for file CBELT_P147 the 200 pounds entered for MISC. PULLEY RESIST. is not too different from the 161.9 pounds computed and displayed at Title 18. Properly the 200 pounds resistance should be edited to the 161.9 pounds computed. | <21> SKIRT FRICTION FACTOR |. works in conjunction with | SECTIONS | <17> SKIRT BOARD LENGTH | and | SECTIONS | <18> MATERIAL HEIGHT AT SKIRT | entered for the | SECTIONS | <2> NUMBER THIS SECTION | in which it occurs. F1 help provides specific values for different materials. | <22> DRIVE EFFICIENCY | is calculated by multiplying together the decimal efficiencies of each individual drive component. Tables and help for doing this are available by keying F1. The value is then entered here. |<23> FRICTION INCREASE FACTOR | is like a safety factor. It is intended to account for the increased friction at breakaway. F1 help provides assistance on this. 1.4 is commonly used. 2 is a conservative value. Users should assure themselves that starting equipment selected can provide the increased torque necessary at "breakaway". (The 2 factor tends to correspond to the starting torque increase at starting of some electric motors while the 1.4 is not unlike the increase available by some controlled starting equipment.) Failure to account for this isn't damaging but the need to unload the conveyor by hand shoveling can be embarrassing. | <24> DRIVE MOTOR(S) RPM |. Within the program assists in computation of inertia for the drive system. | <25> | to | <32> | These parameters automatically take a default value and are usually ignored. Certain technical use, however, may suggest modification. After all Parameters have been entered click | APPLY | and then | RETURN TO MENU |. Licensees should always save immediate work. End of Subject
- 43 -
C2B
WRITING PARAMETERS Previous chapter C2A pertains to parameter considerations. This chapter parallels the same information but uses an actual example in an effort to embody the mental process. NOTE: The 2nd to 5th Editions of the CEMA Manual include example Problems. The 6th Edition of the CEMA Manual confirms "historical" methods of tension by reference. [ include .jpg of desktop notes ] For this example we will be using Problem 4 in CEMA MANUALS 2 to 5. WINBELT DATA FORM enables arranging the data into convenient "desk top notes" for convenient data entry into WINBELT. Click | WRITE / EDIT | PARAMETERS | <3> and <4> These data entries are for your convenience and do not enter the computation. To activate yellow backgrounds it may be necessary to click the APPLY command located near the bottom right. Throughout the Program yellow designates entries that should receive your attention. | <5> BULK DENSITY | = 85. First click onto English Units and then enter 85 as the bulk density at <5>. Always make sure to click the mouse at each entry. In this instance the entry value itself is obtained from the specifications in the CEMA Manual as well as the WINBELT DATA FORM. Within AA_WINBELT cursor sensitive help is displayed by keying F1 after positioning the cursor within any input data text box. Bulk density is given as ranging from 85 to 90. 85 is less conservative from a volumetric standpoint which is better related to how the belt is filled. Notice while we are looking at this data that for Limestone the angle of repose is given as 38 degrees. Keep that number momentarily in your memory. To return to data entry from help click onto the X in the upper right corner. | <6> SURCHARGE ANGLE | = 25 At F1 (BELTHELP) VIEW 1060 FLOWABILITY under column for 25 degree angle of surcharge. Angle of repose is the slope angle of material at rest. Angle of surcharge is taken when material is subject to vibration such as on a belt conveyor. | <7> DESIGN CAPACITY | = 800 tons per hour. Taken from data form. | <8> BELT WIDTH | = 36 inches. Taken from data form. | <9> TROUGHING ANGLE | = 20 degrees. Taken from the data form.
- 44 -
|<10> BELT VELOCITY | = 400 fpm. Taken from data form. Click | APPLY | command button, lower right of monitor. | <10.5> PERCENT LOADING | = 90.7 percent. Result of calculation This is an important decision point. Program user must review, if only mentally, the circumstances of how the belt conveyor is being fed and assure him or herself that the feed method will not cause an overflow under any condition. Parameters <5> to <10> must provide a satisfactory answer at <10.5> before proceeding. Irregular or misaligned feed are frequent problems. | <11> WEIGHT OF BELT | = 10 lbs/ft. Weight of belt is given in the conveyor specifications or from F1 help. | <12> SAG PERCENTAGE | = 3 percent. Allowable sag percentage is obtained by keying F1. For 20 degree troughing angle and max lump size a 3 % maximum sag percentage is allowed. | <13> RETURN IDLER SERIES | = C6. Return idler series is entered by clicking onto desired idler series in the list box located near the upper right corner of the form and then clicking onto the adjacent command button labeled RETURN IDLER SERIES. Idlers listed are limited to those available for the belt width entered in the text box at 8, belt width. Return idler selection is usually made to be the same as the troughing idlers on the carry side. If there is a question as to what series to choose then make an arbitrary selection and after computation apply | AUTOMATIC OPTMIZATION | features at Title 1 to make an economic based choice. At the bottom of this form (FrmSectionsNew) there is a command for making a blanket change. | <14> IMPACT FRICT. FACTOR | = .215. Ultra High Molecular Weight materials are commonly used on the friction surface of impact beds. A friction factor of .215 was obtained from one manufacturer for this material supporting a rubber belt. This information is also provided at BELTHELP by keying F1. | <15> IDLER TILT ANGLE | = 0, degrees. A forward tilt of troughing and vee return idlers is advised for improved belt training. The argument for this is provided at BELTHELP. However, no tilting is indicated in the specification so 0 is entered. The writer is a strong advocate of tilting having seen it gain capacity that avoided $litigation. | <16> RETURN IDLER SPACE | = 10, ft. The 10 foot space for return idlers is taken from the specifications. | <17> VEE RETURNS? <Y><N> | = N. No vee returns are specified so N in capital letters is entered or left blank to take the N default. The writer is a strong advocate of Vee Returns. A disadvantage is that under some conditions material may build up on the rolls. | <18> TEMPERATURE FACTOR | = 1. From BELTHELP we learn that for ambient temperatures above freezing a Kt factor of 1 is applicable. | <19> COMBINED K5 FACTOR | = 1.17. Using information in BELTHELP we develop a K5 factor of 1.17.
- 45 -
| <20> MISCELLANEOUS RESISTANCE | = 200, lbf. BELTHELP provides assistance on this force. | <21> SKIRT FRICT. FACTOR | = .128. From BELTHELP we learn that for limestone a friction factor of .128 is suitable. | <22> DRIVE EFFICIENCY | = .94. At BELTHELP assuming a .94 efficiency for "V" belts and Sheaves in combination with double reduction torque arm reducers with a .97 efficiency a .91 efficiency is obtained by multiplying these numbers together. .91 is entered. Efficiencies are expressed as a decimal number. | <23> FRIC INCREASE FACTOR | = 1.4. Based on BELTHELP. | <24> DRIVE MOTOR(S) RPM | = 1750. Based on motor availability. | <25> to <32> | These entries are available for technical use where required. Click | APPLY | located near lower right corner of form and return to menu. Licensed users save file. End of Subject
- 46 -
C3A
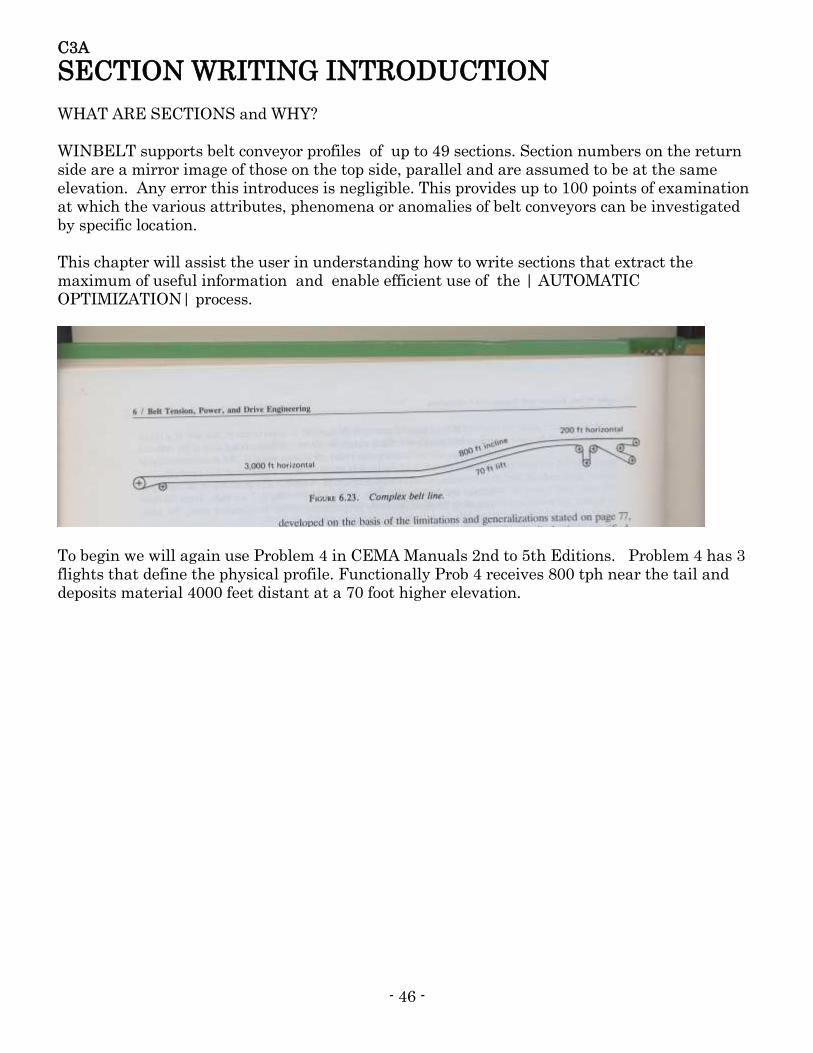
SECTION WRITING INTRODUCTION WHAT ARE SECTIONS and WHY? WINBELT supports belt conveyor profiles of up to 49 sections. Section numbers on the return side are a mirror image of those on the top side, parallel and are assumed to be at the same elevation. Any error this introduces is negligible. This provides up to 100 points of examination at which the various attributes, phenomena or anomalies of belt conveyors can be investigated by specific location. This chapter will assist the user in understanding how to write sections that extract the maximum of useful information and enable efficient use of the | AUTOMATIC OPTIMIZATION| process.
To begin we will again use Problem 4 in CEMA Manuals 2nd to 5th Editions. Problem 4 has 3 flights that define the physical profile. Functionally Prob 4 receives 800 tph near the tail and deposits material 4000 feet distant at a 70 foot higher elevation.
- 47 -
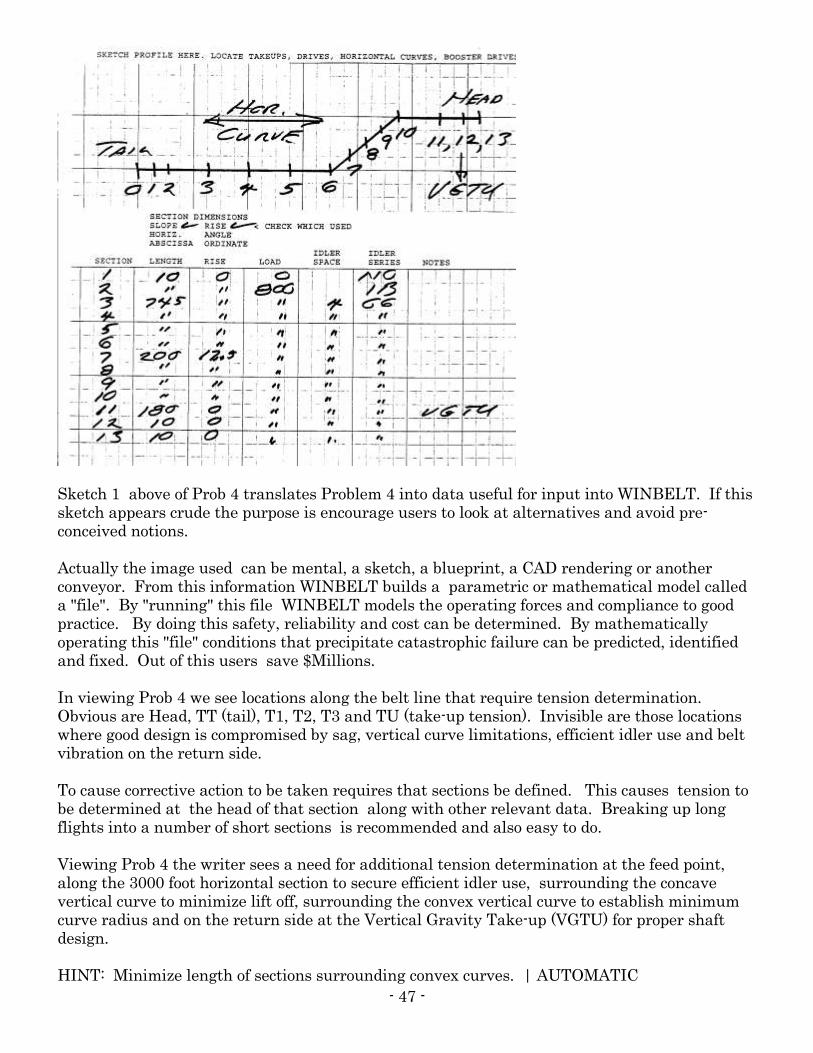
Sketch 1 above of Prob 4 translates Problem 4 into data useful for input into WINBELT. If this sketch appears crude the purpose is encourage users to look at alternatives and avoid pre-conceived notions. Actually the image used can be mental, a sketch, a blueprint, a CAD rendering or another conveyor. From this information WINBELT builds a parametric or mathematical model called a "file". By "running" this file WINBELT models the operating forces and compliance to good practice. By doing this safety, reliability and cost can be determined. By mathematically operating this "file" conditions that precipitate catastrophic failure can be predicted, identified and fixed. Out of this users save $Millions. In viewing Prob 4 we see locations along the belt line that require tension determination. Obvious are Head, TT (tail), T1, T2, T3 and TU (take-up tension). Invisible are those locations where good design is compromised by sag, vertical curve limitations, efficient idler use and belt vibration on the return side. To cause corrective action to be taken requires that sections be defined. This causes tension to be determined at the head of that section along with other relevant data. Breaking up long flights into a number of short sections is recommended and also easy to do. Viewing Prob 4 the writer sees a need for additional tension determination at the feed point, along the 3000 foot horizontal section to secure efficient idler use, surrounding the concave vertical curve to minimize lift off, surrounding the convex vertical curve to establish minimum curve radius and on the return side at the Vertical Gravity Take-up (VGTU) for proper shaft design. HINT: Minimize length of sections surrounding convex curves. | AUTOMATIC

- 48 -
OPTIMIZATION | automatically limits idler space on each side of these. A simple sketch helps keep track of the process. Looking at the first 3000 ft long horizontal flight the writer visualizes a 10 foot transition at the tail followed by a 10 foot loading section. This leaves 2980 feet to the working point of the first vertical curve. Recognizing the problem of belt "lift off" at vertical curves there is a need to "capture" tension at both ends of the vertical curve plus a need to examine idler space along the 2980 foot long run. The 2980 feet is arbitrarily divided into 4 equal spaces of 745 feet. Equal spacing expedites file writing. No effort is made exactly match vertical curve dimensions to any particular radius. A vertical curve is represented by a working point. Vertical curve radii recommendations are a product of the calculation which is yet to come. The following 800 foot inclined flight rising 70 feet is arbitrarily divided into 4 equal sections 200 long each rising 17.5 feet. Tension at the first of these sections contributes to "lift off" calculations at the concave curve while "minimum bending" radius calculation at the upper convex curve is taken from the section ending at the vertical curve working point. The Program output data provides an advisory on the limiting radii for concave and convex curves at Title 12. The final 200 feet is divided into one 180 feet section followed by 2 sections 10 feet long ending at the head pulley. These final short sections "capture" the tension at the VGTU. The final result is 13 sections. The finalized results are those of Sketch 1 End of Subject
- 49 -
C3B
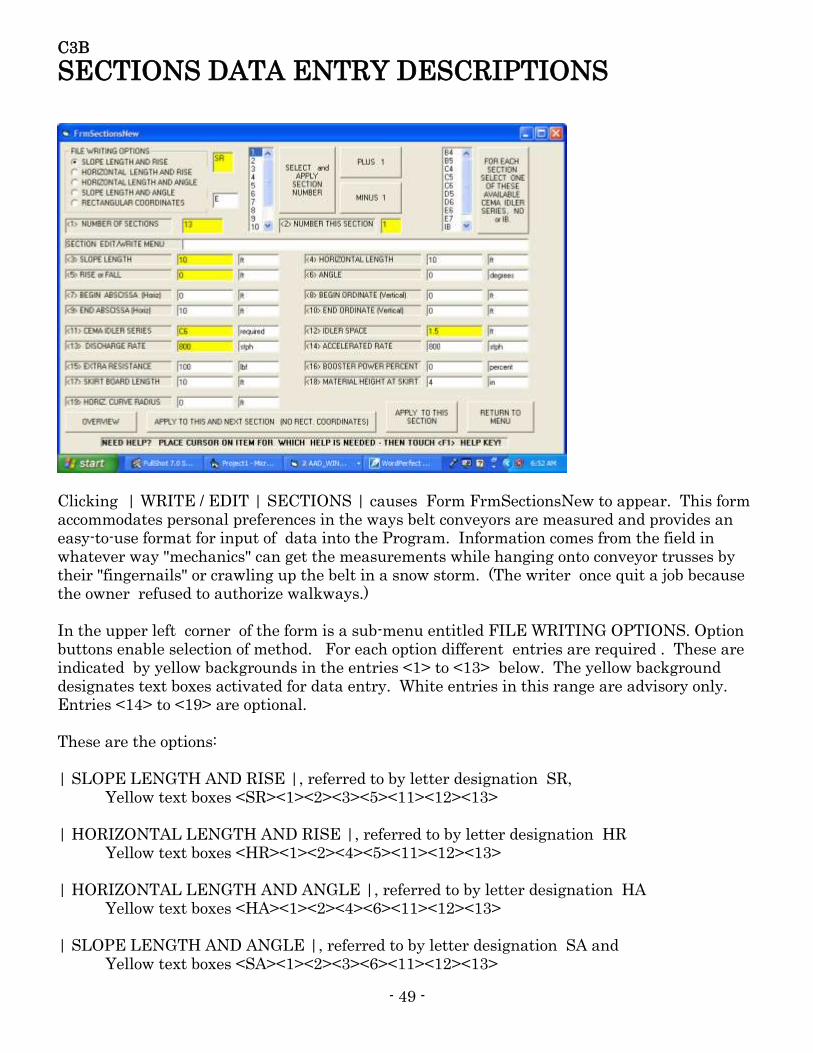
SECTIONS DATA ENTRY DESCRIPTIONS
Clicking | WRITE / EDIT | SECTIONS | causes Form FrmSectionsNew to appear. This form accommodates personal preferences in the ways belt conveyors are measured and provides an easy-to-use format for input of data into the Program. Information comes from the field in whatever way "mechanics" can get the measurements while hanging onto conveyor trusses by their "fingernails" or crawling up the belt in a snow storm. (The writer once quit a job because the owner refused to authorize walkways.) In the upper left corner of the form is a sub-menu entitled FILE WRITING OPTIONS. Option buttons enable selection of method. For each option different entries are required . These are indicated by yellow backgrounds in the entries <1> to <13> below. The yellow background designates text boxes activated for data entry. White entries in this range are advisory only. Entries <14> to <19> are optional. These are the options: | SLOPE LENGTH AND RISE |, referred to by letter designation SR, Yellow text boxes <SR><1><2><3><5><11><12><13> | HORIZONTAL LENGTH AND RISE |, referred to by letter designation HR Yellow text boxes <HR><1><2><4><5><11><12><13> | HORIZONTAL LENGTH AND ANGLE |, referred to by letter designation HA Yellow text boxes <HA><1><2><4><6><11><12><13> | SLOPE LENGTH AND ANGLE |, referred to by letter designation SA and Yellow text boxes <SA><1><2><3><6><11><12><13>

- 50 -
| RECTANGULAR COORDINATES |, referred to by letter designation R. Yellow text boxes, Section 1 <R><1><2><7><8><9><10><11><12><13> Yellow text boxes, Following Sections <R><1><2><9><10><11><12><13> STEP 1 Selection of | FILE WRITING OPTIONS | is made by clicking onto the little white option button to the left of the desired | FILE WRITING OPTIONS |. If the proper letter designation does not immediately appear in the adjoining yellow text box then click another option and then re-click the desired option. STEP 2 | <1> NUMBER OF SECTIONS | establishes the total number of top side sections to be written. While you may change the number of sections later, if need be, normally you will not change or enter it again. Your desk top sketch, such as Sketch 1, is useful for this . Observe the vertical list box near center top. A number representing each section appears in this. STEP 3 | <2> NUMBER THIS SECTION | appears in the yellow text box immediately to the right of this label. This is the immediate or active section to which data can be written. There are several ways in which | <2> NUMBER THIS SECTION | can be selected. A) | <2> NUMBER THIS SECTION | can be selected by clicking onto any number in the left vertical list box and then clicking the adjoining command button entitled |SELECT and APPLY SECTION NUMBER |. B) | <2> NUMBER THIS SECTION | can be selected by clicking onto one of the command buttons labeled | PLUS 1 |or | MINUS 1 | located near top center. These command buttons increment the "active" | <2> NUMBER THIS SECTION | in the indicated direction. The number indicated in the vertical list box will not change. C) | <2> NUMBER THIS SECTION | will also increment by clicking the command bar near the bottom center of the screen labeled, "APPLY TO THIS AND NEXT SECTION (NO RECT. COORDINATES)" More on this powerful tool later STEP 4 - Having established which section data is being written to then perform the following: TEXT BOXES <3> TO <13> MUST RECEIVE DATA IF BACKGROUND COLOR IS YELLOW. WHITE TEXT BOXES <3> TO <13> ARE ADVISORY. ENTRIES <14> TO <19> ARE OPTIONAL | <3> SLOPE LENGTH | (of section) | <4> HORIZONTAL LENGTH | (of section) Accuracy is obtained by keeping these lengths reasonably short in order to identify anomalies. Where there are booster drives lengths approaching zero may be used in order to accurately
- 51 -
capture specific belt tensions along the belt line for shaft design. | <5> RISE or FALL |, positive or negative of section. On a horizontal conveyor section this will always be zero | <6> ANGLE |of section , positive or negative, zero if horizontal. | <7> BEGIN ABSCISSA horiz |, used for beginning horizontal coordinate for section 1, usually zero but not necessarily. | <8> BEGIN ORDINATE |, used for beginning elevation for section 1, usually zero. | <9> END ABSCISSA |, ending horizontal coordinate of immediate section measured from <7> BEGIN ABSCISSA. |<10> END ORDINATE |, end elevation for immediate section. Measured from <8> BEGIN ORDINATE. |<11> CEMA IDLER SERIES |. This entry is obtained by keying one of the entries in the vertical list box near the top right of the form and then clicking the adjoining command button labeled "FOR EACH SECTION........." Do not attempt to edit the yellow text box <11> directly. Where CEMA designations are not locally available users may compare catalog shaft and roller diameter sizes to obtain a CEMA equivalent. Impact beds (IB) and no idlers (NO) are valid entries. Higher CEMA idler series enjoy greater shell thickness extending service life. Program provides at Title 1, | AUTOMATIC OPTIMIZATION |, means for determining most cost efficient idler series choice. From this information a blanket change of idler series can then be quickly made at | WRITE / EDIT | PARAMETERS |. | <12> IDLER SPACE |, Enter idler space. For a first entry this can be the idler manufacturers or CEMA'S recommendation such as 4 ft. After computation examine the results at Titles 9, 12, 12.5 and 14 and readjust for greater efficiency, safety and cost savings. Program uses slope length for idler space if NO or IB has been entered at <11>. After computation Programs AUTOMATIC OPTIMIZATION feature enables an automatic resetting of all idler spaces to suit the actual running, acceleration, deceleration, stopped and convex curve requirements. | <13> DISCHARGE RATE |. Material discharged from a conveyor section is not necessarily the same rate as the material received at the beginning of the section. (If tripped or plowed off) This distinction enables a more accurate allocation of miscellaneous friction causes including those of <14>,<15>,<17> and <18>. Material friction allowed for at <15> can often be the greater resistance. A routine for estimating this is available at the menu bar | UTILITIES | FEEDER FRICTION |. After making this separate calculation the value is separately entered at | <15> EXTRA RESISTANCE |in the section in which it occurs. | <14> ACCELERATED RATE.| This rate accounts for material being accelerated from 0 speed to belt speed within any section. In most conveyors this occurs in a section near the tail. If there are several feed points the Program user must select the feed point or combination of feed points that creates the greatest friction. If the material is dropping freely on the conveyor then only skirt board resistance <17><18> need be allowed for rather than that contemplated by <15>.
- 52 -
|<15> EXTRA RESISTANCE | occurs in event of plows, trippers or where the belt speed in conjunction with a gate type opening comprises a feeder. Belt feeder resistance can be determined at | FrmaaMain | Menu Bar | Utilities | FEEDER FRICTION | | <16> BOOSTER DRIVE PERCENT | An entry here, greater than zero, causes the Program to assume there is a booster drive at the termination of this section. Similar entries can be made at other sections enabling multiple booster drives. Total power expressed as 100 percent includes all main drive and booster motors. The actual percent relationships may be achieved with commercial motors sizes using the total name plate power available at each drive. The actual force applied by any booster drive to the belt must not cause excessive sag downstream in either loaded or unloaded conditions. Load cells under the bearings of the outbound pulley of the booster drive have sometimes been used to effect this control but not always without some degree of "audible" hunting or entire success. The writer considers linking conventional conveyors a more reliable alternative. Program entries result in costs that do not include complex controls unless original comparisons included those controls. Taking this into account a choice can be made based on costs but for final design always use a competent consultant (1). |<17) SKIRT BOARD LENGTH |. This is the length of skirt boards which is not necessarily the length of the section. A length greater than the section length is admissable. |<18> MATERIAL HEIGHT AT SKIRT |. This is the height of material at the skirt boards. A common estimate is 10% of belt width. Skirt boards generally occur only at the feed point near the tail. If the skirted area is "flooded" and the material not in free fall then <15> should be used. |<19> HORIZ. CURVE RADIUS |. Entering a radius at any section causes calculation of idler super elevation angles for running, acceleration and deceleration conditions. The output is advisory and does not impact any other display. The program computes and displays at |Title 11.5 | in the output data the angles of super-elevation that must be provided for the tension and load at the specified section. The super-elevation angles listed are advisory and have no impact on other computations. Section numbers need not correspond to actual horizontal curve length. Other loading conditions including no loading require different angles. Compromise or guide rolls are sometimes required. Key F1 for additional information. It is usual to enter radii at adjoining sections extending beyond the actual curvature. COMMAND BUTTONS ACROSS BOTTOM OF FORM | APPLY TO THIS AND NEXT SECTION (NO RECT COORDINATES) | This powerful command bar is used when the data to be entered in the next section is identical to the data in memory displayed for the immediate section. This command bar can be clicked repeatedly but observe |<2> NUMBER THIS SECTION | to keep track of sections entered. The availability of this capability recommends keeping sections of equal length. | APPLY TO THIS SECTION |. This command bar records immediate data into memory. Proceed to the next section by clicking | PLUS 1 | | OVERVIEW |- After data for all sections is entered clicking | OVERVIEW | ne ar bottom left of FrmSectionsNew displays a form similar to that displayed at | Title 4 | of the computed output data. This gives Program users an opportunity to check for errors. On entry click | APPLY |and to return to editing click | RETURN TO EDITING.

- 53 -
Return to FrmaaMain by clicking | RETURN TO MENU | command button near bottom right of FrmSectionsNew. Licensed users save intermediate data. | RETURN TO MENU | End of Subject
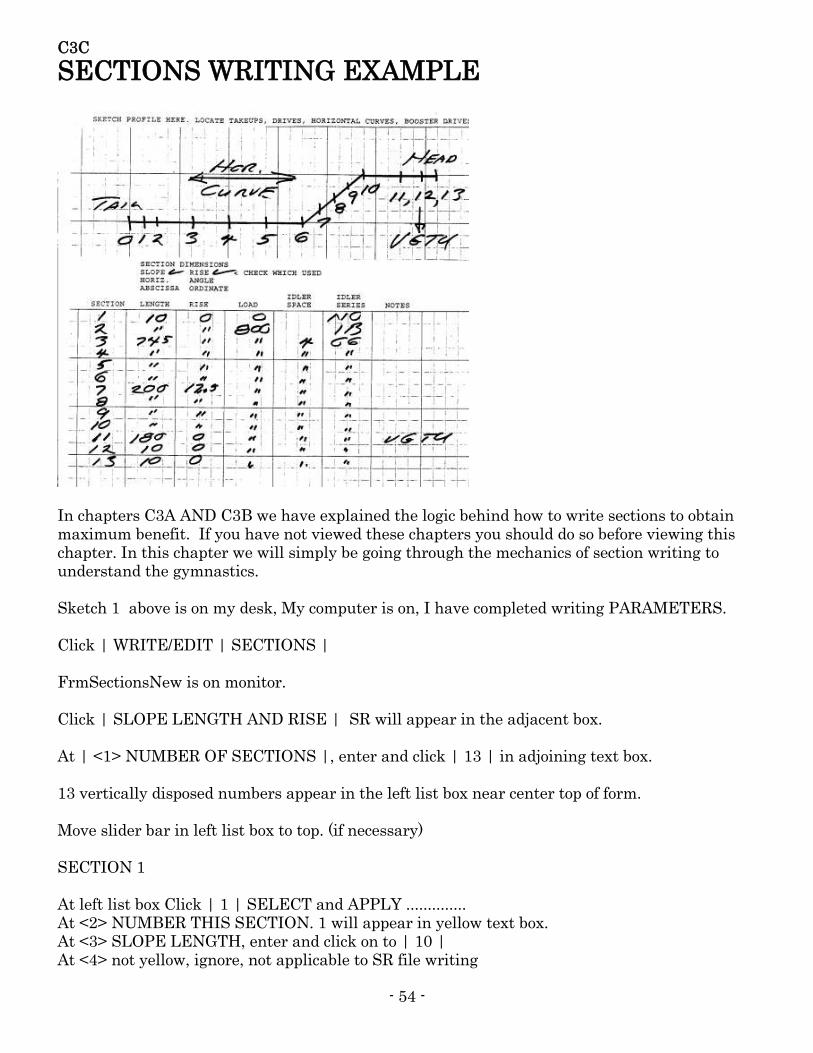
- 54 -
C3C
SECTIONS WRITING EXAMPLE
In chapters C3A AND C3B we have explained the logic behind how to write sections to obtain maximum benefit. If you have not viewed these chapters you should do so before viewing this chapter. In this chapter we will simply be going through the mechanics of section writing to understand the gymnastics. Sketch 1 above is on my desk, My computer is on, I have completed writing PARAMETERS. Click | WRITE/EDIT | SECTIONS | FrmSectionsNew is on monitor. Click | SLOPE LENGTH AND RISE | SR will appear in the adjacent box. At | <1> NUMBER OF SECTIONS |, enter and click | 13 | in adjoining text box. 13 vertically disposed numbers appear in the left list box near center top of form. Move slider bar in left list box to top. (if necessary) SECTION 1 At left list box Click | 1 | SELECT and APPLY .............. At <2> NUMBER THIS SECTION. 1 will appear in yellow text box. At <3> SLOPE LENGTH, enter and click on to | 10 | At <4> not yellow, ignore, not applicable to SR file writing
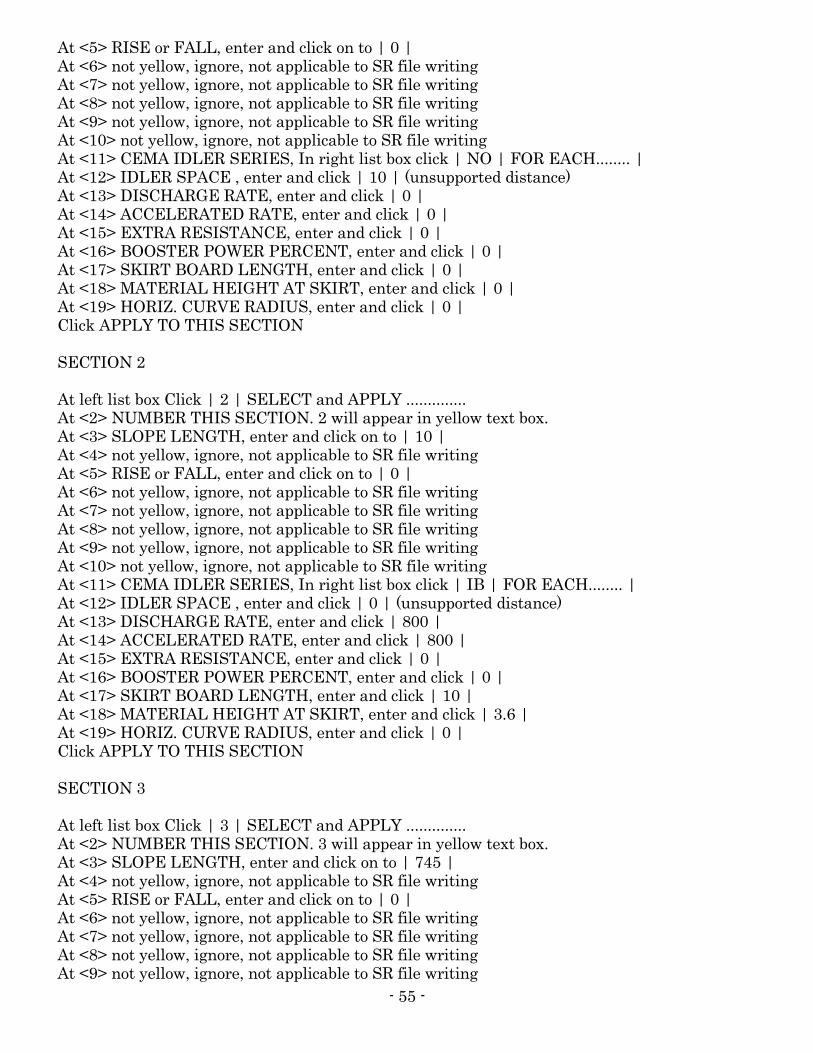
- 55 -
At <5> RISE or FALL, enter and click on to | 0 | At <6> not yellow, ignore, not applicable to SR file writing At <7> not yellow, ignore, not applicable to SR file writing At <8> not yellow, ignore, not applicable to SR file writing At <9> not yellow, ignore, not applicable to SR file writing At <10> not yellow, ignore, not applicable to SR file writing At <11> CEMA IDLER SERIES, In right list box click | NO | FOR EACH........ | At <12> IDLER SPACE , enter and click | 10 | (unsupported distance) At <13> DISCHARGE RATE, enter and click | 0 | At <14> ACCELERATED RATE, enter and click | 0 | At <15> EXTRA RESISTANCE, enter and click | 0 | At <16> BOOSTER POWER PERCENT, enter and click | 0 | At <17> SKIRT BOARD LENGTH, enter and click | 0 | At <18> MATERIAL HEIGHT AT SKIRT, enter and click | 0 | At <19> HORIZ. CURVE RADIUS, enter and click | 0 | Click APPLY TO THIS SECTION SECTION 2 At left list box Click | 2 | SELECT and APPLY .............. At <2> NUMBER THIS SECTION. 2 will appear in yellow text box. At <3> SLOPE LENGTH, enter and click on to | 10 | At <4> not yellow, ignore, not applicable to SR file writing At <5> RISE or FALL, enter and click on to | 0 | At <6> not yellow, ignore, not applicable to SR file writing At <7> not yellow, ignore, not applicable to SR file writing At <8> not yellow, ignore, not applicable to SR file writing At <9> not yellow, ignore, not applicable to SR file writing At <10> not yellow, ignore, not applicable to SR file writing At <11> CEMA IDLER SERIES, In right list box click | IB | FOR EACH........ | At <12> IDLER SPACE , enter and click | 0 | (unsupported distance) At <13> DISCHARGE RATE, enter and click | 800 | At <14> ACCELERATED RATE, enter and click | 800 | At <15> EXTRA RESISTANCE, enter and click | 0 | At <16> BOOSTER POWER PERCENT, enter and click | 0 | At <17> SKIRT BOARD LENGTH, enter and click | 10 | At <18> MATERIAL HEIGHT AT SKIRT, enter and click | 3.6 | At <19> HORIZ. CURVE RADIUS, enter and click | 0 | Click APPLY TO THIS SECTION SECTION 3 At left list box Click | 3 | SELECT and APPLY .............. At <2> NUMBER THIS SECTION. 3 will appear in yellow text box. At <3> SLOPE LENGTH, enter and click on to | 745 | At <4> not yellow, ignore, not applicable to SR file writing At <5> RISE or FALL, enter and click on to | 0 | At <6> not yellow, ignore, not applicable to SR file writing At <7> not yellow, ignore, not applicable to SR file writing At <8> not yellow, ignore, not applicable to SR file writing At <9> not yellow, ignore, not applicable to SR file writing
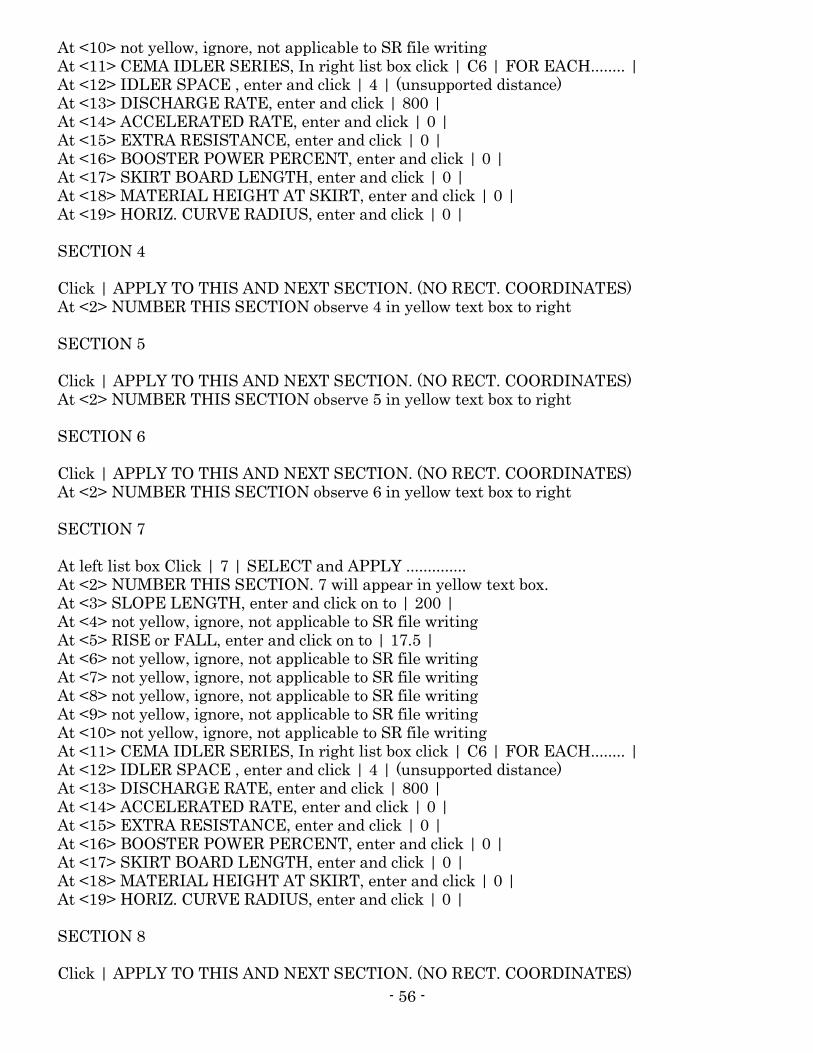
- 56 -
At <10> not yellow, ignore, not applicable to SR file writing At <11> CEMA IDLER SERIES, In right list box click | C6 | FOR EACH........ | At <12> IDLER SPACE , enter and click | 4 | (unsupported distance) At <13> DISCHARGE RATE, enter and click | 800 | At <14> ACCELERATED RATE, enter and click | 0 | At <15> EXTRA RESISTANCE, enter and click | 0 | At <16> BOOSTER POWER PERCENT, enter and click | 0 | At <17> SKIRT BOARD LENGTH, enter and click | 0 | At <18> MATERIAL HEIGHT AT SKIRT, enter and click | 0 | At <19> HORIZ. CURVE RADIUS, enter and click | 0 | SECTION 4 Click | APPLY TO THIS AND NEXT SECTION. (NO RECT. COORDINATES) At <2> NUMBER THIS SECTION observe 4 in yellow text box to right SECTION 5 Click | APPLY TO THIS AND NEXT SECTION. (NO RECT. COORDINATES) At <2> NUMBER THIS SECTION observe 5 in yellow text box to right SECTION 6 Click | APPLY TO THIS AND NEXT SECTION. (NO RECT. COORDINATES) At <2> NUMBER THIS SECTION observe 6 in yellow text box to right SECTION 7 At left list box Click | 7 | SELECT and APPLY .............. At <2> NUMBER THIS SECTION. 7 will appear in yellow text box. At <3> SLOPE LENGTH, enter and click on to | 200 | At <4> not yellow, ignore, not applicable to SR file writing At <5> RISE or FALL, enter and click on to | 17.5 | At <6> not yellow, ignore, not applicable to SR file writing At <7> not yellow, ignore, not applicable to SR file writing At <8> not yellow, ignore, not applicable to SR file writing At <9> not yellow, ignore, not applicable to SR file writing At <10> not yellow, ignore, not applicable to SR file writing At <11> CEMA IDLER SERIES, In right list box click | C6 | FOR EACH........ | At <12> IDLER SPACE , enter and click | 4 | (unsupported distance) At <13> DISCHARGE RATE, enter and click | 800 | At <14> ACCELERATED RATE, enter and click | 0 | At <15> EXTRA RESISTANCE, enter and click | 0 | At <16> BOOSTER POWER PERCENT, enter and click | 0 | At <17> SKIRT BOARD LENGTH, enter and click | 0 | At <18> MATERIAL HEIGHT AT SKIRT, enter and click | 0 | At <19> HORIZ. CURVE RADIUS, enter and click | 0 | SECTION 8 Click | APPLY TO THIS AND NEXT SECTION. (NO RECT. COORDINATES)
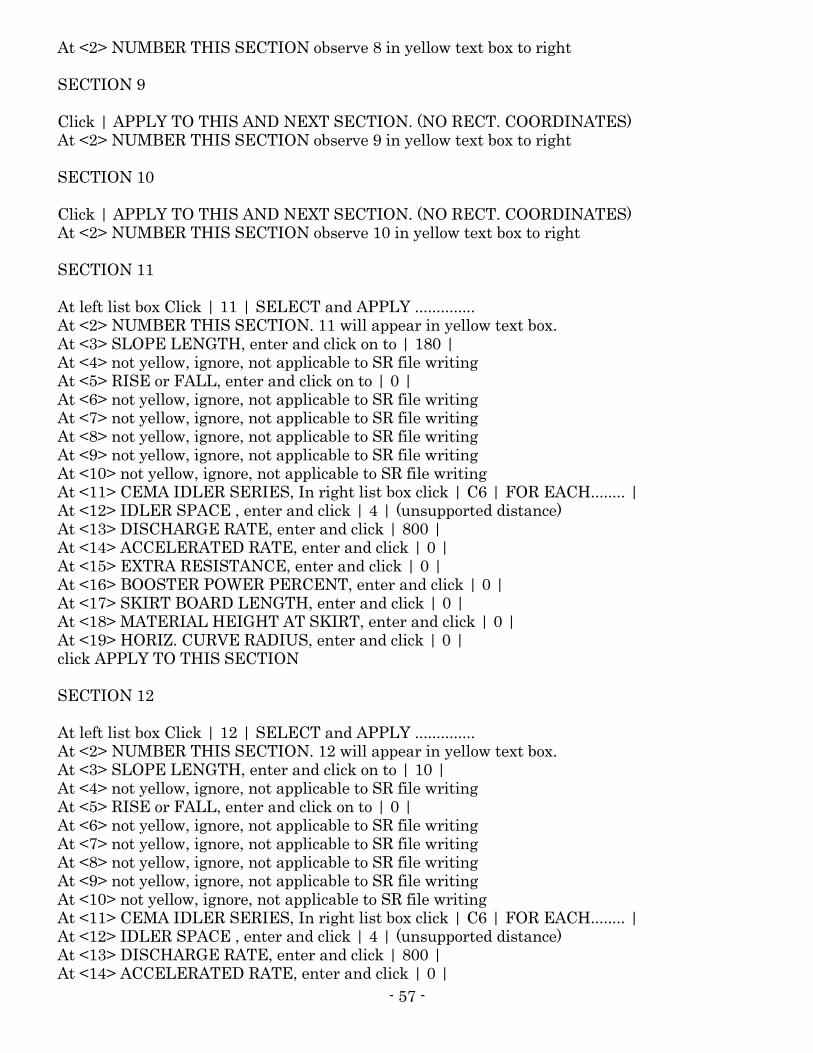
- 57 -
At <2> NUMBER THIS SECTION observe 8 in yellow text box to right SECTION 9 Click | APPLY TO THIS AND NEXT SECTION. (NO RECT. COORDINATES) At <2> NUMBER THIS SECTION observe 9 in yellow text box to right SECTION 10 Click | APPLY TO THIS AND NEXT SECTION. (NO RECT. COORDINATES) At <2> NUMBER THIS SECTION observe 10 in yellow text box to right SECTION 11 At left list box Click | 11 | SELECT and APPLY .............. At <2> NUMBER THIS SECTION. 11 will appear in yellow text box. At <3> SLOPE LENGTH, enter and click on to | 180 | At <4> not yellow, ignore, not applicable to SR file writing At <5> RISE or FALL, enter and click on to | 0 | At <6> not yellow, ignore, not applicable to SR file writing At <7> not yellow, ignore, not applicable to SR file writing At <8> not yellow, ignore, not applicable to SR file writing At <9> not yellow, ignore, not applicable to SR file writing At <10> not yellow, ignore, not applicable to SR file writing At <11> CEMA IDLER SERIES, In right list box click | C6 | FOR EACH........ | At <12> IDLER SPACE , enter and click | 4 | (unsupported distance) At <13> DISCHARGE RATE, enter and click | 800 | At <14> ACCELERATED RATE, enter and click | 0 | At <15> EXTRA RESISTANCE, enter and click | 0 | At <16> BOOSTER POWER PERCENT, enter and click | 0 | At <17> SKIRT BOARD LENGTH, enter and click | 0 | At <18> MATERIAL HEIGHT AT SKIRT, enter and click | 0 | At <19> HORIZ. CURVE RADIUS, enter and click | 0 | click APPLY TO THIS SECTION SECTION 12 At left list box Click | 12 | SELECT and APPLY .............. At <2> NUMBER THIS SECTION. 12 will appear in yellow text box. At <3> SLOPE LENGTH, enter and click on to | 10 | At <4> not yellow, ignore, not applicable to SR file writing At <5> RISE or FALL, enter and click on to | 0 | At <6> not yellow, ignore, not applicable to SR file writing At <7> not yellow, ignore, not applicable to SR file writing At <8> not yellow, ignore, not applicable to SR file writing At <9> not yellow, ignore, not applicable to SR file writing At <10> not yellow, ignore, not applicable to SR file writing At <11> CEMA IDLER SERIES, In right list box click | C6 | FOR EACH........ | At <12> IDLER SPACE , enter and click | 4 | (unsupported distance) At <13> DISCHARGE RATE, enter and click | 800 | At <14> ACCELERATED RATE, enter and click | 0 |

- 58 -
At <15> EXTRA RESISTANCE, enter and click | 0 | At <16> BOOSTER POWER PERCENT, enter and click | 0 | At <17> SKIRT BOARD LENGTH, enter and click | 0 | At <18> MATERIAL HEIGHT AT SKIRT, enter and click | 0 | At <19> HORIZ. CURVE RADIUS, enter and click | 0 | SECTION 13 Click | APPLY TO THIS AND NEXT SECTION. (NO RECT. COORDINATES) At <2> NUMBER THIS SECTION observe 13 in yellow text box to right The next step is to check to make sure data has been correctly entered. Click onto command button entitled OVERVIEW near the bottom left corner of the form. At form Title 4 - Profile click APPLY. A quick check are the TOTALS at the bottom of the Form. For Prob 4 the total length should be 4000 feet followed by a rise of 70 feet. Licensed users of Program should save their work. End of Subject

- 59 -
C3D
RETURN SIDE CONVEYING Contact Creative Engineering for assistance.
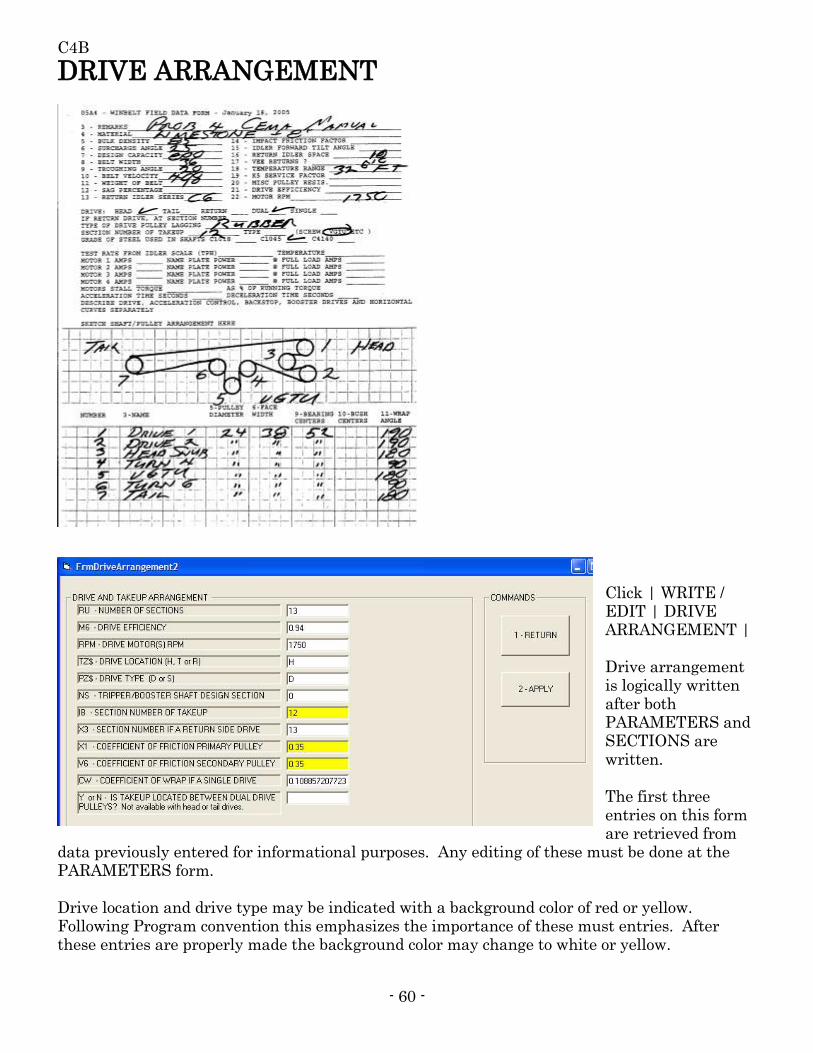
- 60 -
C4B
DRIVE ARRANGEMENT
Click | WRITE / EDIT | DRIVE ARRANGEMENT | Drive arrangement is logically written after both PARAMETERS and SECTIONS are written. The first three entries on this form are retrieved from
data previously entered for informational purposes. Any editing of these must be done at the PARAMETERS form. Drive location and drive type may be indicated with a background color of red or yellow. Following Program convention this emphasizes the importance of these must entries. After these entries are properly made the background color may change to white or yellow.
- 61 -
Prob 4 indicates a head drive. At | TZ$ DRIVE LOCATION (H, T, or R) | enter and click | H | Any additional booster drive(s) are accounted for in "SECTIONS". Logic: Head and Return side drives are best for non-regenerative conveyors. Which to use is based on convenience and cost. Tail and near tail return side drives find use for regenerative conveyors and conveyors where application tends to prevent the other types of arrangements. Programs cost output and component availability provides direction. Prob 4 has a dual type drive. ( 2 drive pulleys) At | PZ$ DRIVE TYPE (D or S) | enter and click | D | Logic: Historically dual drives obtain advantages from lower belt tension and cost. However, with the advent of stronger lower cost belt materials, idler savings obtained by a greater space between idlers and ceramic lagging these assertions are disputed. Modeling of alternatives and applying WINBELT'S cost analysis can resolve the matter. At | NS TRIPPER/BOOSTER SHAFT DESIGN SECTION | enter and click | 0 | Logic: Program determines tension at any designated top-side location as a preliminary to shaft design for any shafts using the tension designators related to that section. Useable designations for shaft design are: TP = peak tension. Equivalent to T1 if a booster drive. TP2 equivalent to T2 if a booster drive. TP3 equivalent to T3 if a dual booster drive. Since this is a rarely used function only 1 location is provided but the same tensions can be used for multiple booster drives. For other locations re-set this section number and rerun or accept design of worst condition for standardization. To ensure that pricing is correct be sure to enter each pulley even though each pulley will use same tension designation. At | IB SECTION NUMBER OF TAKE-UP | enter and click | 12 | Logic: In Prob 4 this sets the VGTU 10 feet behind the head pulley (on the return side) and accepts the take-up tension at that location for shaft design. If a take-up location occurs at the head use T2 or T3 tension designators. If the tail pulley or another pulley near the tail is the take-up pulley use section 1 for tension designation. Should section be a heavily loaded feed section then set it as section 2 and create a short transition section as 1. At | X3 SECTION NUMBER IF A RETURN SIDE DRIVE | enter and click | 0 | Logic: This creates location of a return side drive if | TZ$ DRIVE LOCATION (H , T or R) | = R. Be sure that take-up is located on the low tension side of it. On a conveyor that can be both regenerative and non-regenerative this may require some experimentation with cost being the final judge. At | X1 COEFFICIENT OF FRICTION PRIMARY PULLEY | enter and click | .35 | and At | V6 COEFFICIENT OF FRICTION SECONDARY PULLEY | enter and click | .35 |
- 62 -
Logic: Program departs from conventional practice of asking for Coefficient of Wrap. Introduction of ceramic lagging strongly suggested this. Click F1 help for more explanation. At | Cw COEFFICIENT OF WRAP IF A SINGLE DRIVE | click | 0 | Logic: Refer to F1 help for additional information. If ceramic lagging is being used on a single pulley obtain values from manufacturer. At | Y or N IS TAKE-UP LOCATED BETWEEN DUAL DRIVE PULLEYS?| click | N | Logic: This entry was introduced to investigate a possibility that users may wish to consider. The advantage of placing a take-up at the T3 tension location to reduce variances in tension between various conditions. Doing this may reduce the need for extra tension to reduce spillage during one or other of these conditions. On the down side is the cost of constructing a take-up that operates at a higher tension. However, in the case of conveyors that alternate between regenerative and non-regenerative operation this could be preferred . In any event, cost should dictate consideration. At conclusion of entries click | 2-APPLY | 1-RETURN | and Licensed users save. End of Subject
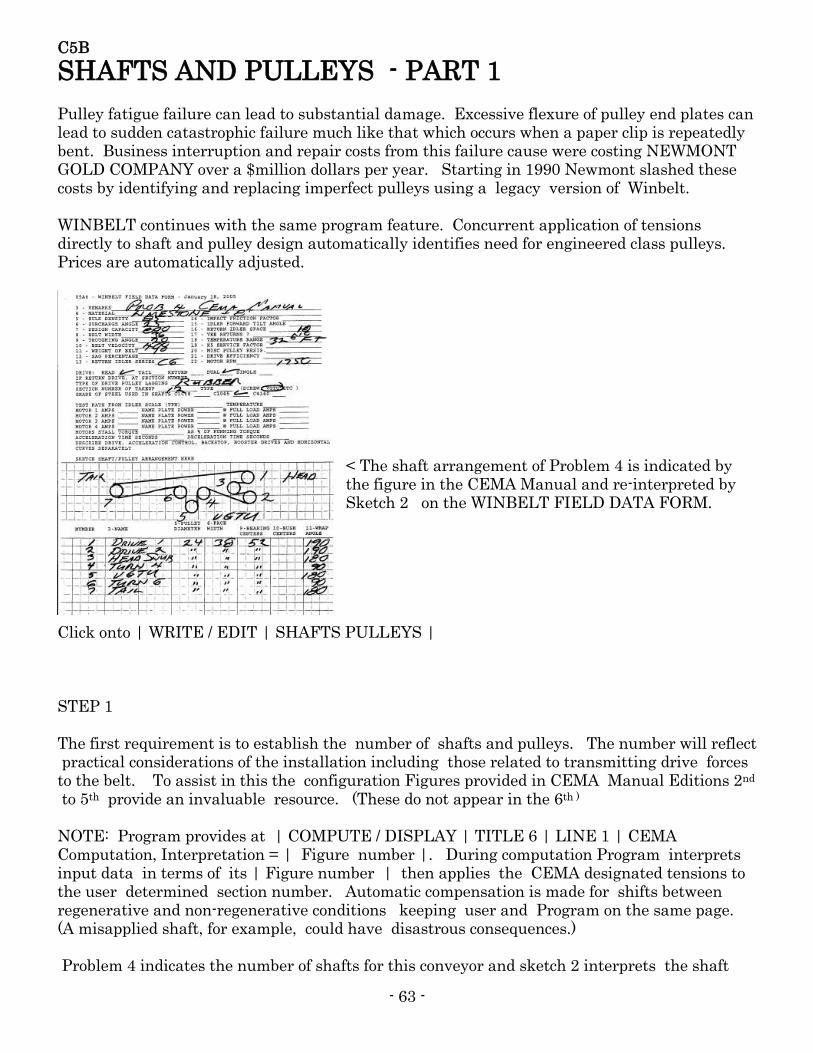
- 63 -
C5B
SHAFTS AND PULLEYS - PART 1 Pulley fatigue failure can lead to substantial damage. Excessive flexure of pulley end plates can lead to sudden catastrophic failure much like that which occurs when a paper clip is repeatedly bent. Business interruption and repair costs from this failure cause were costing NEWMONT GOLD COMPANY over a $million dollars per year. Starting in 1990 Newmont slashed these costs by identifying and replacing imperfect pulleys using a legacy version of Winbelt. WINBELT continues with the same program feature. Concurrent application of tensions directly to shaft and pulley design automatically identifies need for engineered class pulleys. Prices are automatically adjusted.
< The shaft arrangement of Problem 4 is indicated by the figure in the CEMA Manual and re-interpreted by Sketch 2 on the WINBELT FIELD DATA FORM.
Click onto | WRITE / EDIT | SHAFTS PULLEYS | STEP 1 The first requirement is to establish the number of shafts and pulleys. The number will reflect practical considerations of the installation including those related to transmitting drive forces to the belt. To assist in this the configuration Figures provided in CEMA Manual Editions 2nd to 5th provide an invaluable resource. (These do not appear in the 6th )
NOTE: Program provides at | COMPUTE / DISPLAY | TITLE 6 | LINE 1 | CEMA Computation, Interpretation = | Figure number |. During computation Program interprets input data in terms of its | Figure number | then applies the CEMA designated tensions to the user determined section number. Automatic compensation is made for shifts between regenerative and non-regenerative conditions keeping user and Program on the same page. (A misapplied shaft, for example, could have disastrous consequences.) Problem 4 indicates the number of shafts for this conveyor and sketch 2 interprets the shaft
- 64 -
arrangement of Problem 4 into useable input data. For accuracy of price data all shafts must be included but more important in order for defects and limitations to be identified and applied the shaft data must be entered. Include in the number of shafts any booster drives. STEP 1 At | <1> NUMBER OF SHAFTS | enter and click | ? | This establishes the number of shafts and causes a number representing each shaft to be inserted in the vertical list box above. Data must be entered for each shaft/pulley. As a preliminary each shaft/pulley into which data is to be entered must be identified beforehand. By clicking | shaft number in vertical list box |. The immediate shaft is identified in: | <2> NUMBER THIS SHAFT | ? | SHAFT 1 At | VERTICAL LIST BOX | Click | 1 | APPLY AFTER SELECTING SHAFT FOR EDITING OR WRITING | Click | Shaft 1 is always | DRIVE 1 |, the first drive shaft. If the drive is of a dual pulley type then shaft 2 is always | DRIVE 2 |, the second drive shaft. Numbering and sequence of all other shafts is immaterial. | <2> NUMBER THIS SHAFT | "?" |appears in text box to right. This occurs automatically. At |<3> SHAFT NAME | "DRIVE 1" | automatically appears for shaft 1 This can't be edited. At |<4> DEFAULT WIDTH | ? | click | This becomes a default Conventionally default width of pulley exceeds belt width according to tables accessed by keying F1. In the case of wide base idlers or belt turn over schemes width will or should be greater. Default width need be entered only once and when a specific pulley width needs to be greater that width can be entered at | <6> FACE WIDTH | ? | for the specific shaft that requires a greater width. At | <5> DIAMETER (pulley) | ? | click | Except in the case of modeling existing conveyors establishing pulley diameters before computation is not logical because tensions have yet to be computed. However, the writer has the habit of using 24 inch diameter and then editing later. The Program provides at Title 1 a command to RE-SET PULLEY DIAMETERS to various standards and belt fabrics. This is suitable for correcting the design of new conveyors. For checking the design of existing conveyors look to the recommendations of Title 16_3 in the output data.
- 65 -
At |<6> FACE WIDTH | accept default at <4> or edit | click | Entry for face width at <6> overrides the default width at <4> whenever a positive number is entered . At | <7> DF'LT BEARING CENTERS | “?” | click | Default bearing centers entered at <7> becomes the entry at SPEC. BEARING CENTERS at <9> in event the entry at <9> is zero. Conditions at each shaft can be drastically different. Chutes around the head and conditions at other pulleys can be different in order to fit structure and mechanical requirements. The Program user may account for these by entering a value at <9>. At | <9> SPEC. BEARING CENTERS | ? | click | See explanation at <7>. At | <10> SPEC. BUSHING CENTERS | ? |click| The program automatically computes BUSHING CENTERS based on popular QD, Taperlock and catalog pulley sizes if this entry is 0 (zero). Program users can check final results at | Title 16.1 | BUSHING C'NTRS |. Automatic computation is overridden by a positive entry at <10>. Entry of 0 is a proper first entry. At | <11> BELT WRAP ANGLE | ? | click | Wrap angle is important to computation of shaft bending and coefficient of Wrap in the case of dual drives. A fair accuracy is recommended. At |<12> COMBINED VECTOR ANGLE | 45 | click | This entry was created to take into account pulley and shaft weight in computation of shaft size (in addition to belt tension). Studies suggest that shaft deflection tended to minimize the importance of this and an entry of 45 degrees responded sufficiently to the requirement. 45 degrees is the default. At | <13> TENSION 1ST STRAND|? | click | For shaft 1 this is always automatically "T1" tension. For shaft 2 in the case of a dual drive it is always T3 For all other cases it is a user option. This includes booster drives. At |<14> TENSION 2ND STRAND |? | click | For shaft 1 in the case of a single drive this is always automatically "T2" For shaft 1 in the case of a dual drive this is always automatically "T3" For shaft 2 in the case of a dual drive this is always automatically "T2" For all other cases it is a user option including booster drives. At <15> PULLEY WEIGHT MULT. | 1 | click |

- 66 -
Computed Pulley and Shaft gravity forces are displayed in the output data at | Title 16.25. | Should the sum of these be incorrect this multiplier can be used to make an approximate correction. At | <16> BRAKE TORQUE PERCENT | ? | click | At | Title 17 | line 26 | is displayed if specified the brake force (Teb) required at the belt line to achieve the input conditions. At the entry of <16> a percentage of this force can be applied at 1/2 the pulley diameter at <5> that results in an additional torque at the shaft specified at <17>. At <17> BRAKE SHAFT NUMBER | ? | click | This is the shaft designated as the brake shaft. Only one brake shaft can be specified. Command labels at bottom of FrmShaftsNew. Always | APPLY - AFTER EDITING/WRITING DATA EACH SHAFT | click |. Always click | OVERVIEW |after writing data into all shafts. Correct by editing each shaft. | RETURN TO MENU | License users | FILE | SAVE_AS | End of Subject
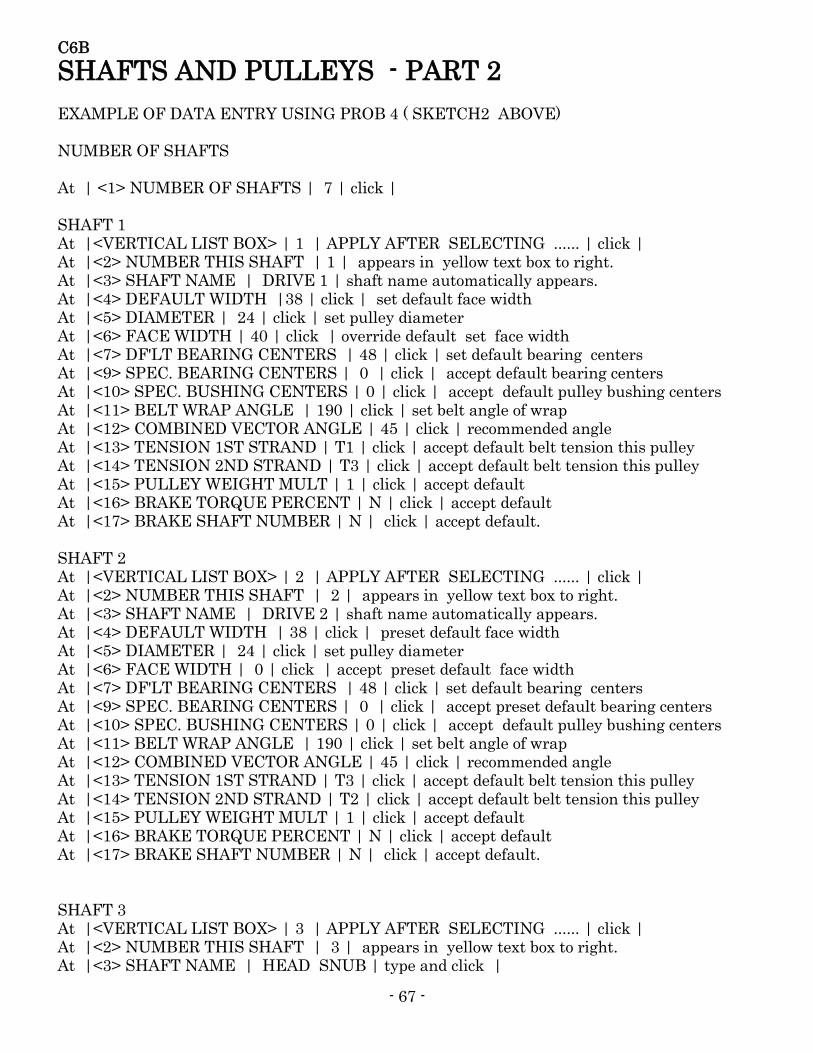
- 67 -
C6B
SHAFTS AND PULLEYS - PART 2 EXAMPLE OF DATA ENTRY USING PROB 4 ( SKETCH2 ABOVE) NUMBER OF SHAFTS At | <1> NUMBER OF SHAFTS | 7 | click | SHAFT 1 At |<VERTICAL LIST BOX> | 1 | APPLY AFTER SELECTING ...... | click | At |<2> NUMBER THIS SHAFT | 1 | appears in yellow text box to right. At |<3> SHAFT NAME | DRIVE 1 | shaft name automatically appears. At |<4> DEFAULT WIDTH |38 | click | set default face width At |<5> DIAMETER | 24 | click | set pulley diameter At |<6> FACE WIDTH | 40 | click | override default set face width At |<7> DF'LT BEARING CENTERS | 48 | click | set default bearing centers At |<9> SPEC. BEARING CENTERS | 0 | click | accept default bearing centers At |<10> SPEC. BUSHING CENTERS | 0 | click | accept default pulley bushing centers At |<11> BELT WRAP ANGLE | 190 | click | set belt angle of wrap At |<12> COMBINED VECTOR ANGLE | 45 | click | recommended angle At |<13> TENSION 1ST STRAND | T1 | click | accept default belt tension this pulley At |<14> TENSION 2ND STRAND | T3 | click | accept default belt tension this pulley At |<15> PULLEY WEIGHT MULT | 1 | click | accept default At |<16> BRAKE TORQUE PERCENT | N | click | accept default At |<17> BRAKE SHAFT NUMBER | N | click | accept default. SHAFT 2 At |<VERTICAL LIST BOX> | 2 | APPLY AFTER SELECTING ...... | click | At |<2> NUMBER THIS SHAFT | 2 | appears in yellow text box to right. At |<3> SHAFT NAME | DRIVE 2 | shaft name automatically appears. At |<4> DEFAULT WIDTH | 38 | click | preset default face width At |<5> DIAMETER | 24 | click | set pulley diameter At |<6> FACE WIDTH | 0 | click | accept preset default face width At |<7> DF'LT BEARING CENTERS | 48 | click | set default bearing centers At |<9> SPEC. BEARING CENTERS | 0 | click | accept preset default bearing centers At |<10> SPEC. BUSHING CENTERS | 0 | click | accept default pulley bushing centers At |<11> BELT WRAP ANGLE | 190 | click | set belt angle of wrap At |<12> COMBINED VECTOR ANGLE | 45 | click | recommended angle At |<13> TENSION 1ST STRAND | T3 | click | accept default belt tension this pulley At |<14> TENSION 2ND STRAND | T2 | click | accept default belt tension this pulley At |<15> PULLEY WEIGHT MULT | 1 | click | accept default At |<16> BRAKE TORQUE PERCENT | N | click | accept default At |<17> BRAKE SHAFT NUMBER | N | click | accept default. SHAFT 3 At |<VERTICAL LIST BOX> | 3 | APPLY AFTER SELECTING ...... | click | At |<2> NUMBER THIS SHAFT | 3 | appears in yellow text box to right. At |<3> SHAFT NAME | HEAD SNUB | type and click |
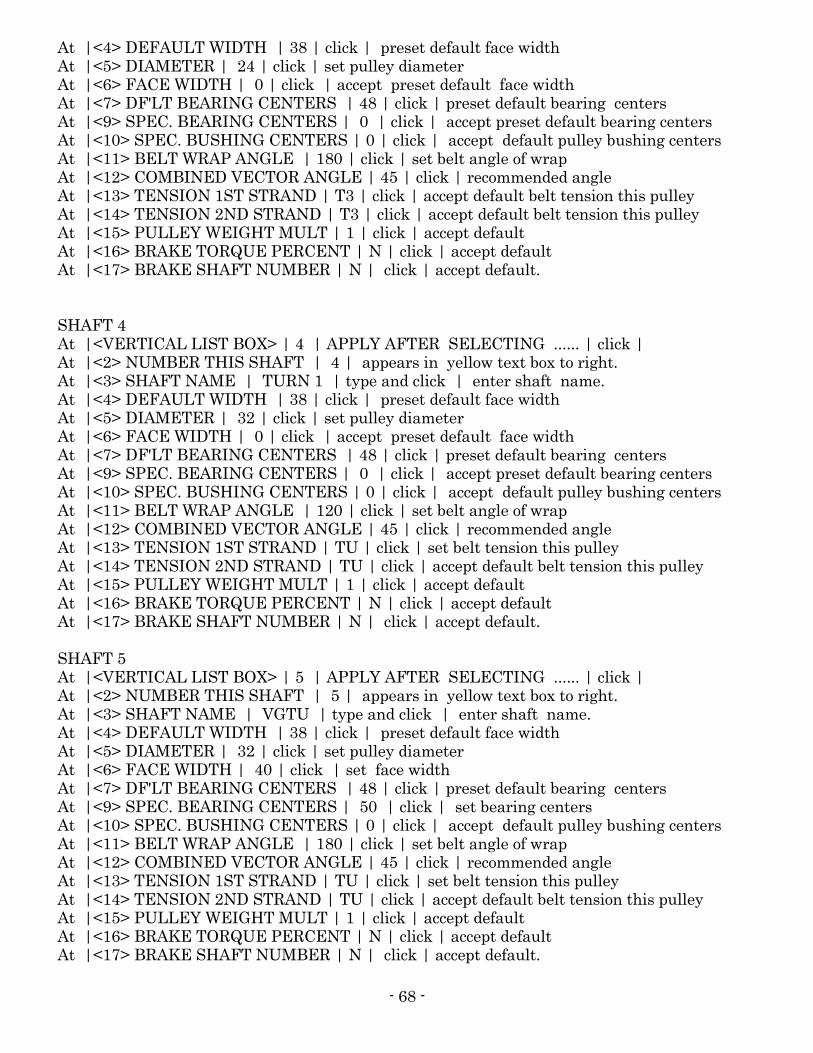
- 68 -
At |<4> DEFAULT WIDTH | 38 | click | preset default face width At |<5> DIAMETER | 24 | click | set pulley diameter At |<6> FACE WIDTH | 0 | click | accept preset default face width At |<7> DF'LT BEARING CENTERS | 48 | click | preset default bearing centers At |<9> SPEC. BEARING CENTERS | 0 | click | accept preset default bearing centers At |<10> SPEC. BUSHING CENTERS | 0 | click | accept default pulley bushing centers At |<11> BELT WRAP ANGLE | 180 | click | set belt angle of wrap At |<12> COMBINED VECTOR ANGLE | 45 | click | recommended angle At |<13> TENSION 1ST STRAND | T3 | click | accept default belt tension this pulley At |<14> TENSION 2ND STRAND | T3 | click | accept default belt tension this pulley At |<15> PULLEY WEIGHT MULT | 1 | click | accept default At |<16> BRAKE TORQUE PERCENT | N | click | accept default At |<17> BRAKE SHAFT NUMBER | N | click | accept default. SHAFT 4 At |<VERTICAL LIST BOX> | 4 | APPLY AFTER SELECTING ...... | click | At |<2> NUMBER THIS SHAFT | 4 | appears in yellow text box to right. At |<3> SHAFT NAME | TURN 1 | type and click | enter shaft name. At |<4> DEFAULT WIDTH | 38 | click | preset default face width At |<5> DIAMETER | 32 | click | set pulley diameter At |<6> FACE WIDTH | 0 | click | accept preset default face width At |<7> DF'LT BEARING CENTERS | 48 | click | preset default bearing centers At |<9> SPEC. BEARING CENTERS | 0 | click | accept preset default bearing centers At |<10> SPEC. BUSHING CENTERS | 0 | click | accept default pulley bushing centers At |<11> BELT WRAP ANGLE | 120 | click | set belt angle of wrap At |<12> COMBINED VECTOR ANGLE | 45 | click | recommended angle At |<13> TENSION 1ST STRAND | TU | click | set belt tension this pulley At |<14> TENSION 2ND STRAND | TU | click | accept default belt tension this pulley At |<15> PULLEY WEIGHT MULT | 1 | click | accept default At |<16> BRAKE TORQUE PERCENT | N | click | accept default At |<17> BRAKE SHAFT NUMBER | N | click | accept default. SHAFT 5 At |<VERTICAL LIST BOX> | 5 | APPLY AFTER SELECTING ...... | click | At |<2> NUMBER THIS SHAFT | 5 | appears in yellow text box to right. At |<3> SHAFT NAME | VGTU | type and click | enter shaft name. At |<4> DEFAULT WIDTH | 38 | click | preset default face width At |<5> DIAMETER | 32 | click | set pulley diameter At |<6> FACE WIDTH | 40 | click | set face width At |<7> DF'LT BEARING CENTERS | 48 | click | preset default bearing centers At |<9> SPEC. BEARING CENTERS | 50 | click | set bearing centers At |<10> SPEC. BUSHING CENTERS | 0 | click | accept default pulley bushing centers At |<11> BELT WRAP ANGLE | 180 | click | set belt angle of wrap At |<12> COMBINED VECTOR ANGLE | 45 | click | recommended angle At |<13> TENSION 1ST STRAND | TU | click | set belt tension this pulley At |<14> TENSION 2ND STRAND | TU | click | accept default belt tension this pulley At |<15> PULLEY WEIGHT MULT | 1 | click | accept default At |<16> BRAKE TORQUE PERCENT | N | click | accept default At |<17> BRAKE SHAFT NUMBER | N | click | accept default.
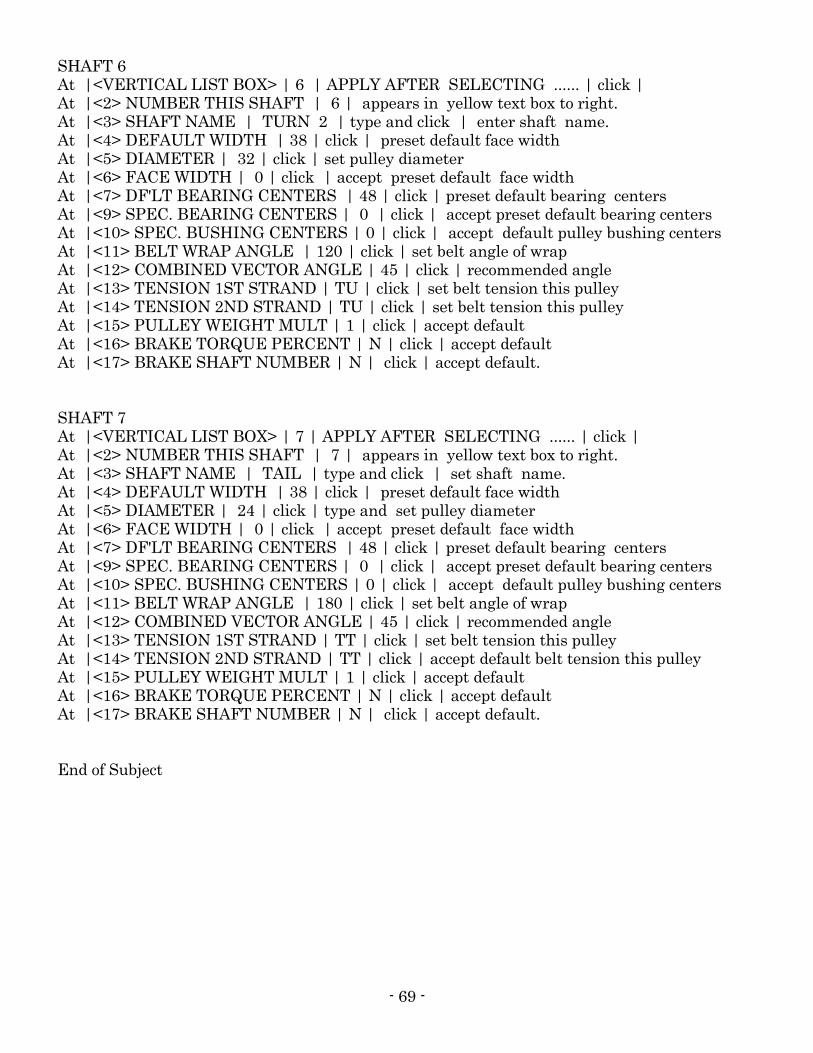
- 69 -
SHAFT 6 At |<VERTICAL LIST BOX> | 6 | APPLY AFTER SELECTING ...... | click | At |<2> NUMBER THIS SHAFT | 6 | appears in yellow text box to right. At |<3> SHAFT NAME | TURN 2 | type and click | enter shaft name. At |<4> DEFAULT WIDTH | 38 | click | preset default face width At |<5> DIAMETER | 32 | click | set pulley diameter At |<6> FACE WIDTH | 0 | click | accept preset default face width At |<7> DF'LT BEARING CENTERS | 48 | click | preset default bearing centers At |<9> SPEC. BEARING CENTERS | 0 | click | accept preset default bearing centers At |<10> SPEC. BUSHING CENTERS | 0 | click | accept default pulley bushing centers At |<11> BELT WRAP ANGLE | 120 | click | set belt angle of wrap At |<12> COMBINED VECTOR ANGLE | 45 | click | recommended angle At |<13> TENSION 1ST STRAND | TU | click | set belt tension this pulley At |<14> TENSION 2ND STRAND | TU | click | set belt tension this pulley At |<15> PULLEY WEIGHT MULT | 1 | click | accept default At |<16> BRAKE TORQUE PERCENT | N | click | accept default At |<17> BRAKE SHAFT NUMBER | N | click | accept default. SHAFT 7 At |<VERTICAL LIST BOX> | 7 | APPLY AFTER SELECTING ...... | click | At |<2> NUMBER THIS SHAFT | 7 | appears in yellow text box to right. At |<3> SHAFT NAME | TAIL | type and click | set shaft name. At |<4> DEFAULT WIDTH | 38 | click | preset default face width At |<5> DIAMETER | 24 | click | type and set pulley diameter At |<6> FACE WIDTH | 0 | click | accept preset default face width At |<7> DF'LT BEARING CENTERS | 48 | click | preset default bearing centers At |<9> SPEC. BEARING CENTERS | 0 | click | accept preset default bearing centers At |<10> SPEC. BUSHING CENTERS | 0 | click | accept default pulley bushing centers At |<11> BELT WRAP ANGLE | 180 | click | set belt angle of wrap At |<12> COMBINED VECTOR ANGLE | 45 | click | recommended angle At |<13> TENSION 1ST STRAND | TT | click | set belt tension this pulley At |<14> TENSION 2ND STRAND | TT | click | accept default belt tension this pulley At |<15> PULLEY WEIGHT MULT | 1 | click | accept default At |<16> BRAKE TORQUE PERCENT | N | click | accept default At |<17> BRAKE SHAFT NUMBER | N | click | accept default. End of Subject
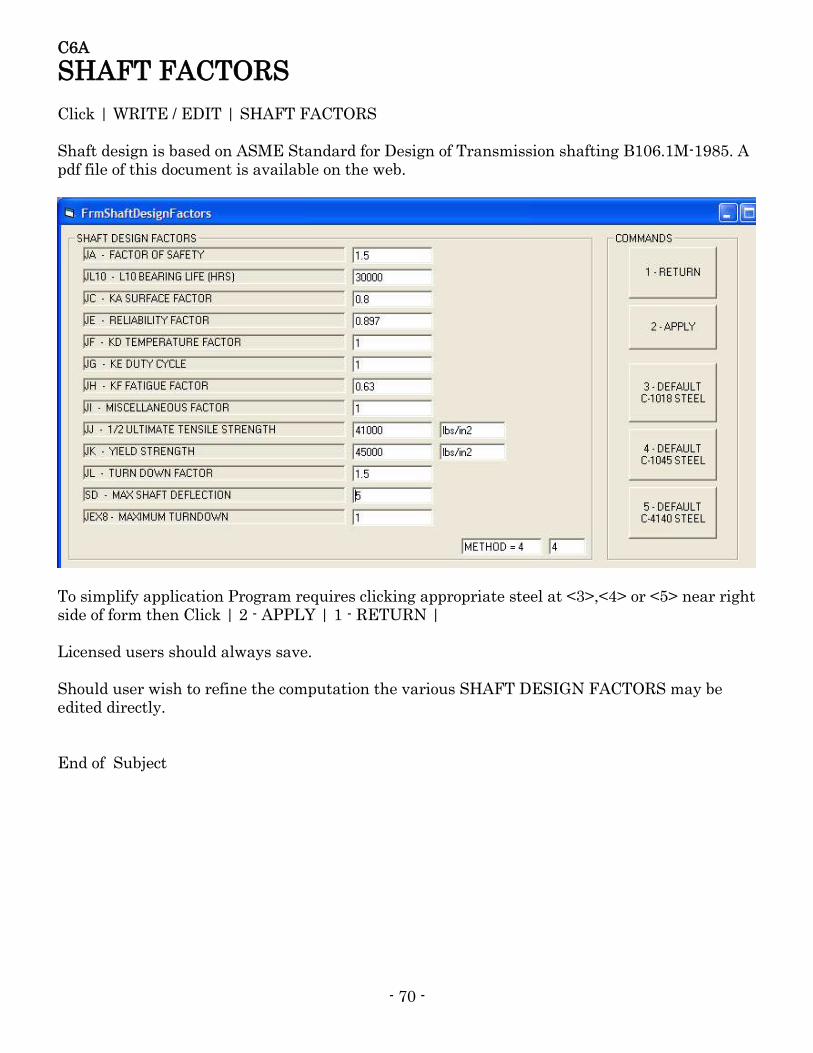
- 70 -
C6A
SHAFT FACTORS Click | WRITE / EDIT | SHAFT FACTORS Shaft design is based on ASME Standard for Design of Transmission shafting B106.1M-1985. A pdf file of this document is available on the web.
To simplify application Program requires clicking appropriate steel at <3>,<4> or <5> near right side of form then Click | 2 - APPLY | 1 - RETURN | Licensed users should always save. Should user wish to refine the computation the various SHAFT DESIGN FACTORS may be edited directly. End of Subject
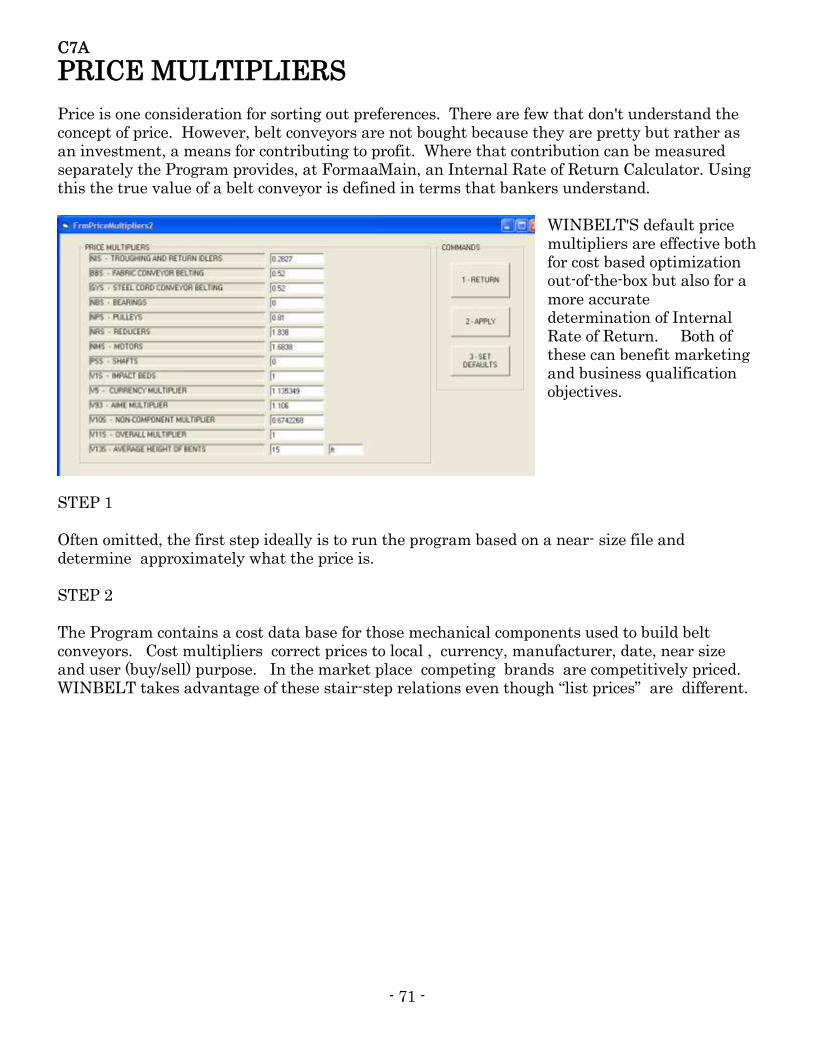
- 71 -
C7A
PRICE MULTIPLIERS Price is one consideration for sorting out preferences. There are few that don't understand the concept of price. However, belt conveyors are not bought because they are pretty but rather as an investment, a means for contributing to profit. Where that contribution can be measured separately the Program provides, at FormaaMain, an Internal Rate of Return Calculator. Using this the true value of a belt conveyor is defined in terms that bankers understand.
WINBELT'S default price multipliers are effective both for cost based optimization out-of-the-box but also for a more accurate determination of Internal Rate of Return. Both of these can benefit marketing and business qualification objectives.
STEP 1 Often omitted, the first step ideally is to run the program based on a near- size file and determine approximately what the price is. STEP 2 The Program contains a cost data base for those mechanical components used to build belt conveyors. Cost multipliers correct prices to local , currency, manufacturer, date, near size and user (buy/sell) purpose. In the market place competing brands are competitively priced. WINBELT takes advantage of these stair-step relations even though “list prices” are different.
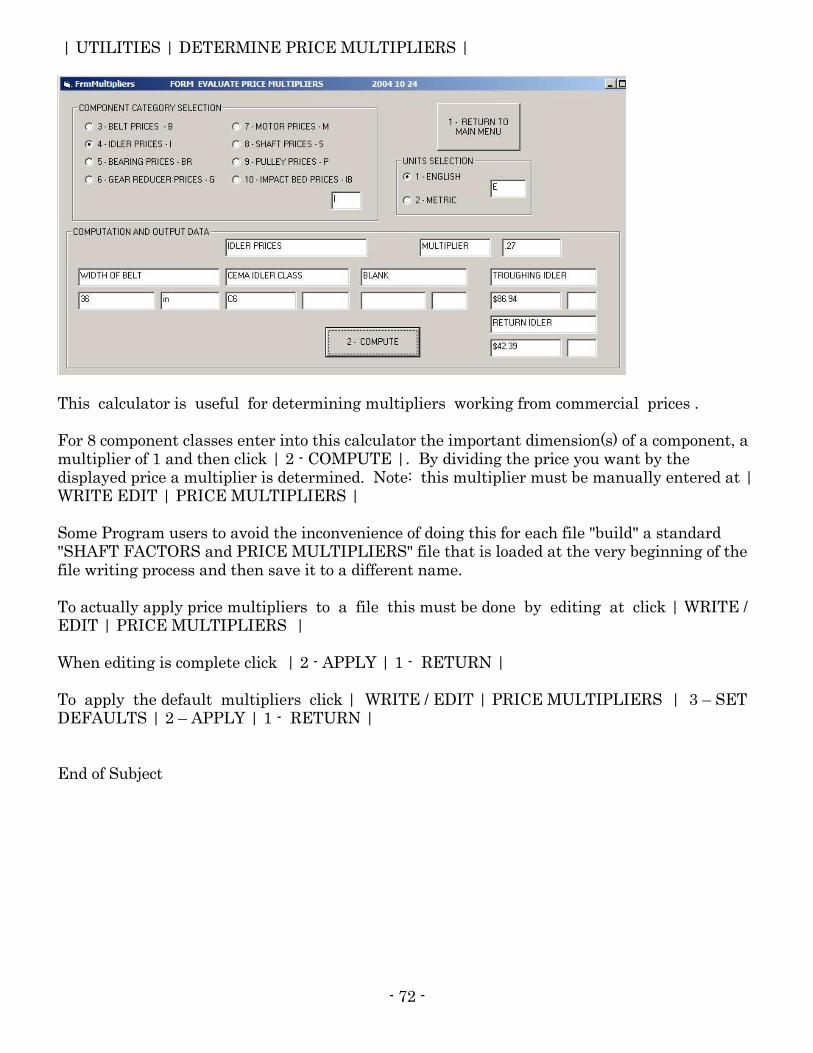
- 72 -
| UTILITIES | DETERMINE PRICE MULTIPLIERS |
This calculator is useful for determining multipliers working from commercial prices . For 8 component classes enter into this calculator the important dimension(s) of a component, a multiplier of 1 and then click | 2 - COMPUTE |. By dividing the price you want by the displayed price a multiplier is determined. Note: this multiplier must be manually entered at | WRITE EDIT | PRICE MULTIPLIERS | Some Program users to avoid the inconvenience of doing this for each file "build" a standard "SHAFT FACTORS and PRICE MULTIPLIERS" file that is loaded at the very beginning of the file writing process and then save it to a different name. To actually apply price multipliers to a file this must be done by editing at click | WRITE / EDIT | PRICE MULTIPLIERS | When editing is complete click | 2 - APPLY | 1 - RETURN | To apply the default multipliers click | WRITE / EDIT | PRICE MULTIPLIERS | 3 – SET DEFAULTS | 2 – APPLY | 1 - RETURN | End of Subject

- 73 -
D1A
COMPUTE / DISPLAY To computer programmers the term “RUN” means to execute a Program. However, belt conveyor design includes many dependent variables to fit local circumstances so “RUN” becomes a step by step and often iterative process to achieve design, cost and return on investment goals. “Short cuts” expedite the process. To make a SHORTCUT click onto any blank space on the desktop then click| New | Shortcut | Type the location of the item ( C:\WINBELT\AAD_WINBELT.EXE) | Next | Finish | To open a file for “running” execute one of the following: WITH SHORTCUT Click | START | AAD_WINBELT | OPEN | FILE | OPEN | {file name} | OPEN | COMPUTE/DISPLAY | APPLY - NORMAL | WITHOUT SHORTCUT Click | START | My Computer | Local Disk (C:) | Explore | WINBELT | EXPLORE | AAD_WINBELT | OPEN | FILE | OPEN | {file name} | OPEN | COMPUTE/DISPLAY | APPLY - NORMAL | The monitor first displays:
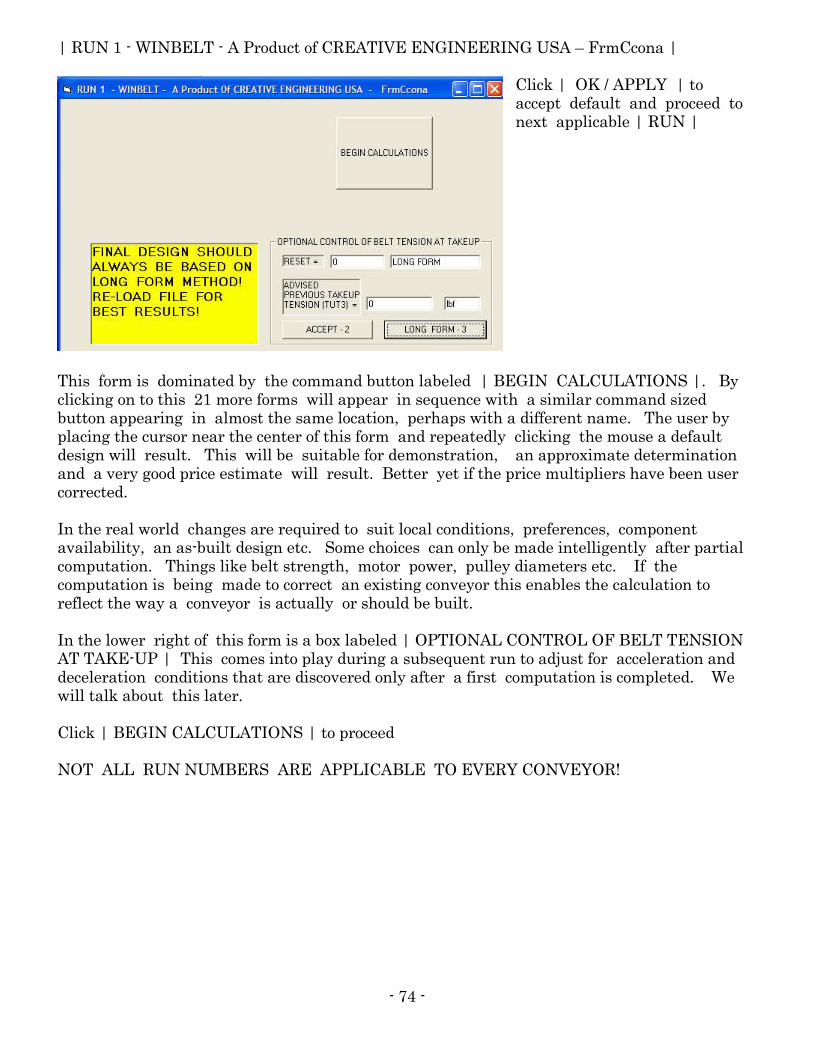
- 74 -
| RUN 1 - WINBELT - A Product of CREATIVE ENGINEERING USA – FrmCcona |
Click | OK / APPLY | to accept default and proceed to next applicable | RUN |
This form is dominated by the command button labeled | BEGIN CALCULATIONS |. By clicking on to this 21 more forms will appear in sequence with a similar command sized button appearing in almost the same location, perhaps with a different name. The user by placing the cursor near the center of this form and repeatedly clicking the mouse a default design will result. This will be suitable for demonstration, an approximate determination and a very good price estimate will result. Better yet if the price multipliers have been user corrected. In the real world changes are required to suit local conditions, preferences, component availability, an as-built design etc. Some choices can only be made intelligently after partial computation. Things like belt strength, motor power, pulley diameters etc. If the computation is being made to correct an existing conveyor this enables the calculation to reflect the way a conveyor is actually or should be built. In the lower right of this form is a box labeled | OPTIONAL CONTROL OF BELT TENSION AT TAKE-UP | This comes into play during a subsequent run to adjust for acceleration and deceleration conditions that are discovered only after a first computation is completed. We will talk about this later. Click | BEGIN CALCULATIONS | to proceed NOT ALL RUN NUMBERS ARE APPLICABLE TO EVERY CONVEYOR!
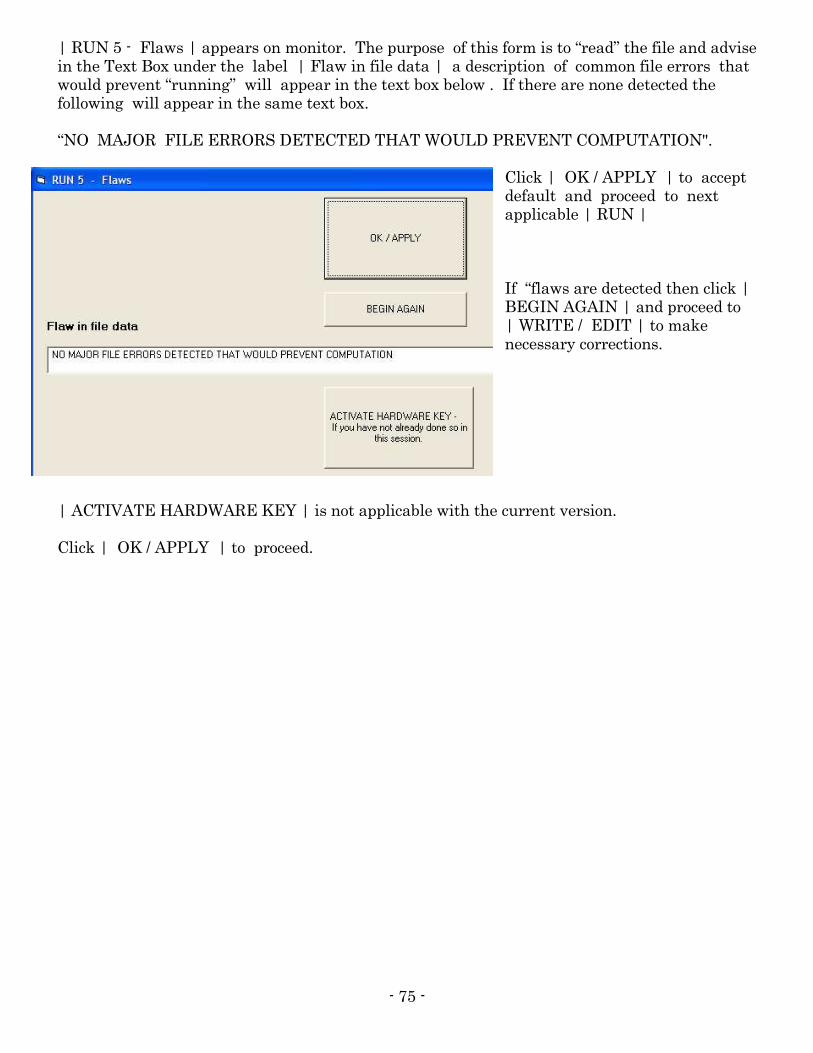
- 75 -
| RUN 5 - Flaws | appears on monitor. The purpose of this form is to “read” the file and advise in the Text Box under the label | Flaw in file data | a description of common file errors that would prevent “running” will appear in the text box below . If there are none detected the following will appear in the same text box. “NO MAJOR FILE ERRORS DETECTED THAT WOULD PREVENT COMPUTATION".
Click | OK / APPLY | to accept default and proceed to next applicable | RUN | If “flaws are detected then click | BEGIN AGAIN | and proceed to | WRITE / EDIT | to make necessary corrections.
| ACTIVATE HARDWARE KEY | is not applicable with the current version. Click | OK / APPLY | to proceed.
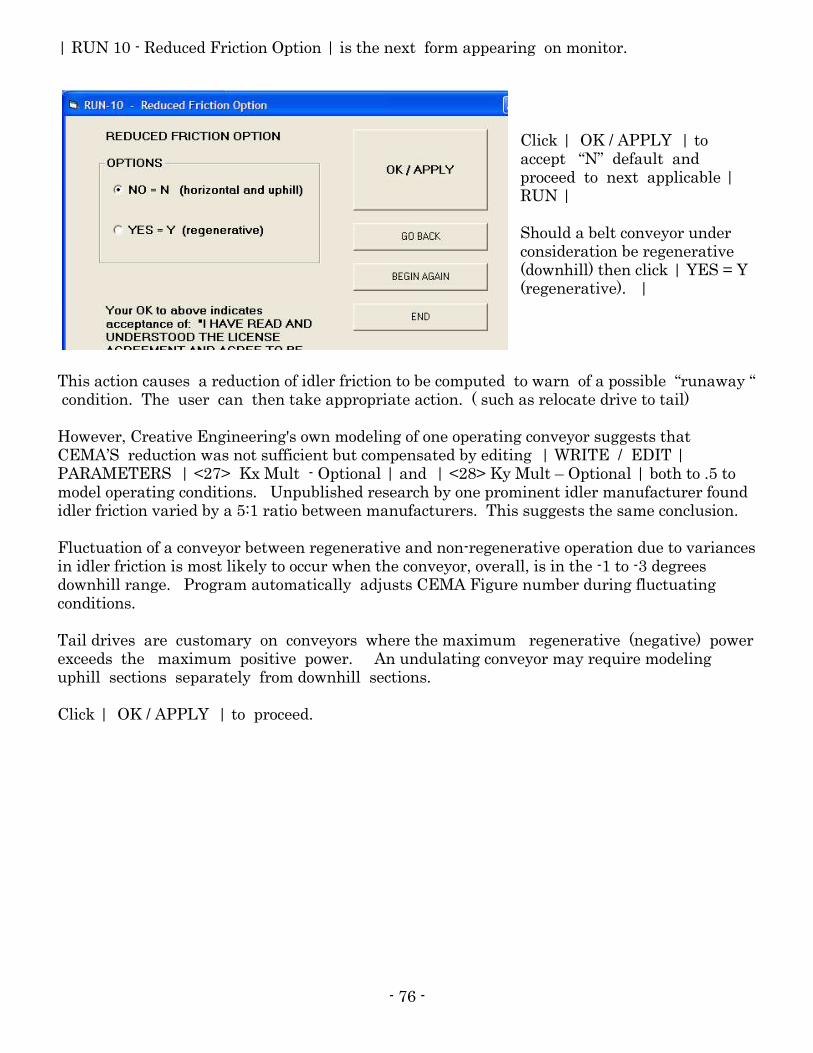
- 76 -
| RUN 10 - Reduced Friction Option | is the next form appearing on monitor.
Click | OK / APPLY | to accept “N” default and proceed to next applicable | RUN | Should a belt conveyor under consideration be regenerative (downhill) then click | YES = Y (regenerative). |
This action causes a reduction of idler friction to be computed to warn of a possible “runaway “ condition. The user can then take appropriate action. ( such as relocate drive to tail) However, Creative Engineering's own modeling of one operating conveyor suggests that CEMA’S reduction was not sufficient but compensated by editing | WRITE / EDIT | PARAMETERS | <27> Kx Mult - Optional | and | <28> Ky Mult – Optional | both to .5 to model operating conditions. Unpublished research by one prominent idler manufacturer found idler friction varied by a 5:1 ratio between manufacturers. This suggests the same conclusion. Fluctuation of a conveyor between regenerative and non-regenerative operation due to variances in idler friction is most likely to occur when the conveyor, overall, is in the -1 to -3 degrees downhill range. Program automatically adjusts CEMA Figure number during fluctuating conditions. Tail drives are customary on conveyors where the maximum regenerative (negative) power exceeds the maximum positive power. An undulating conveyor may require modeling uphill sections separately from downhill sections. Click | OK / APPLY | to proceed.
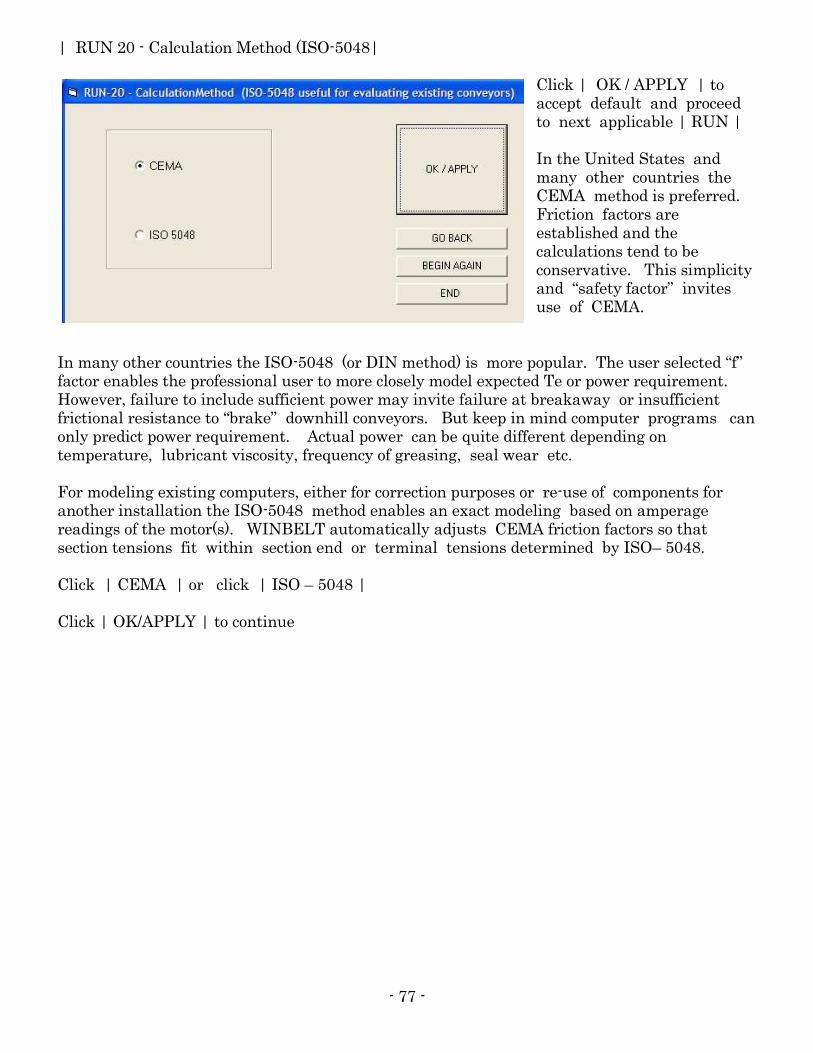
- 77 -
| RUN 20 - Calculation Method (ISO-5048|
Click | OK / APPLY | to accept default and proceed to next applicable | RUN | In the United States and many other countries the CEMA method is preferred. Friction factors are established and the calculations tend to be conservative. This simplicity and “safety factor” invites use of CEMA.
In many other countries the ISO-5048 (or DIN method) is more popular. The user selected “f” factor enables the professional user to more closely model expected Te or power requirement. However, failure to include sufficient power may invite failure at breakaway or insufficient frictional resistance to “brake” downhill conveyors. But keep in mind computer programs can only predict power requirement. Actual power can be quite different depending on temperature, lubricant viscosity, frequency of greasing, seal wear etc. For modeling existing computers, either for correction purposes or re-use of components for another installation the ISO-5048 method enables an exact modeling based on amperage readings of the motor(s). WINBELT automatically adjusts CEMA friction factors so that section tensions fit within section end or terminal tensions determined by ISO– 5048. Click | CEMA | or click | ISO – 5048 | Click | OK/APPLY | to continue
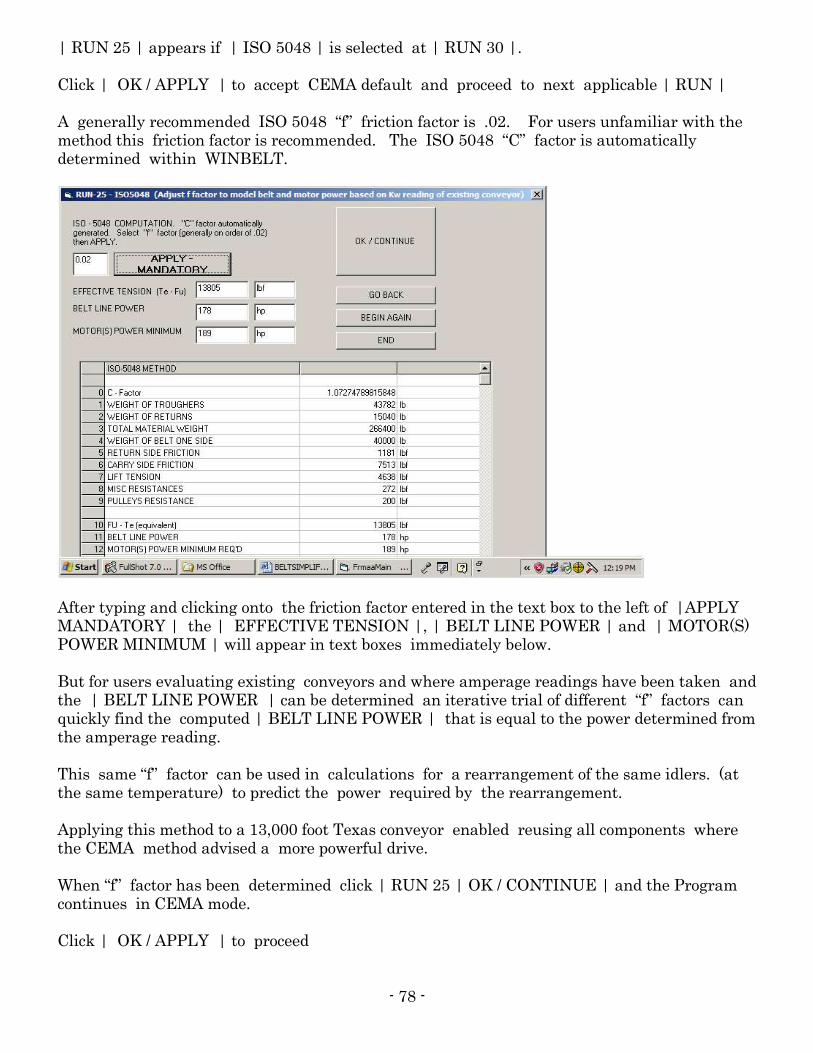
- 78 -
| RUN 25 | appears if | ISO 5048 | is selected at | RUN 30 |. Click | OK / APPLY | to accept CEMA default and proceed to next applicable | RUN | A generally recommended ISO 5048 “f” friction factor is .02. For users unfamiliar with the method this friction factor is recommended. The ISO 5048 “C” factor is automatically determined within WINBELT.
After typing and clicking onto the friction factor entered in the text box to the left of |APPLY MANDATORY | the | EFFECTIVE TENSION |, | BELT LINE POWER | and | MOTOR(S) POWER MINIMUM | will appear in text boxes immediately below. But for users evaluating existing conveyors and where amperage readings have been taken and the | BELT LINE POWER | can be determined an iterative trial of different “f” factors can quickly find the computed | BELT LINE POWER | that is equal to the power determined from the amperage reading. This same “f” factor can be used in calculations for a rearrangement of the same idlers. (at the same temperature) to predict the power required by the rearrangement. Applying this method to a 13,000 foot Texas conveyor enabled reusing all components where the CEMA method advised a more powerful drive. When “f” factor has been determined click | RUN 25 | OK / CONTINUE | and the Program continues in CEMA mode. Click | OK / APPLY | to proceed
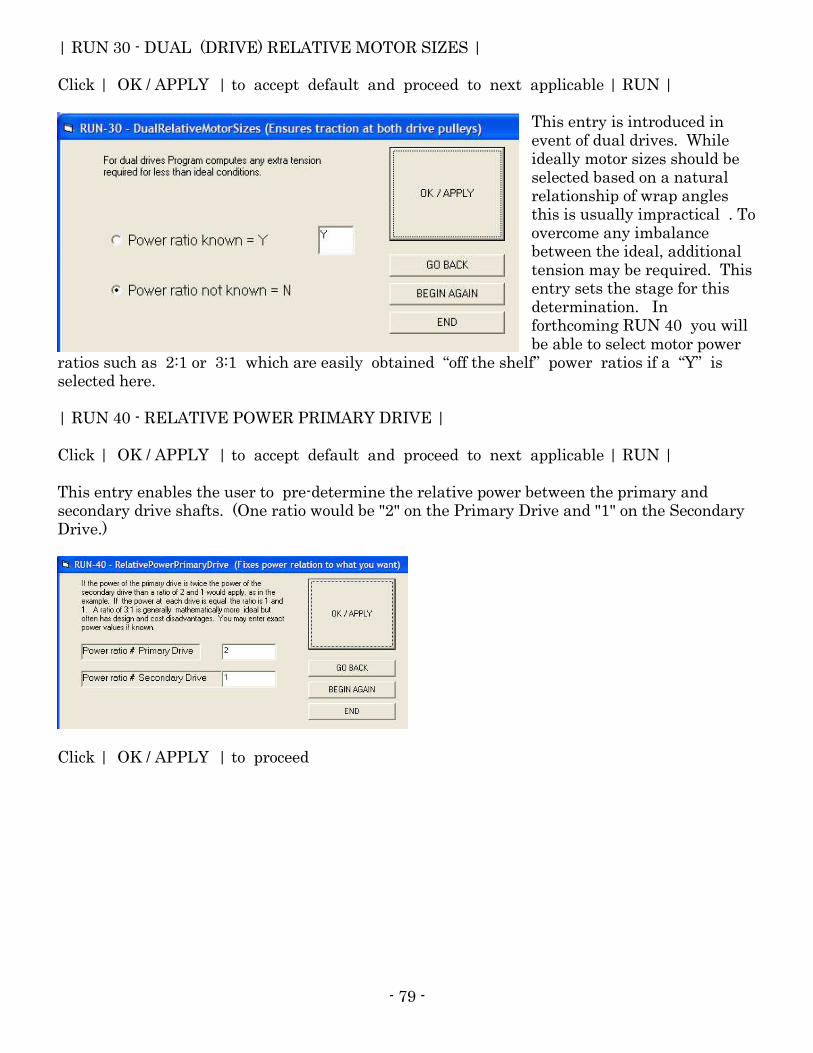
- 79 -
| RUN 30 - DUAL (DRIVE) RELATIVE MOTOR SIZES | Click | OK / APPLY | to accept default and proceed to next applicable | RUN |
This entry is introduced in event of dual drives. While ideally motor sizes should be selected based on a natural relationship of wrap angles this is usually impractical . To overcome any imbalance between the ideal, additional tension may be required. This entry sets the stage for this determination. In forthcoming RUN 40 you will be able to select motor power
ratios such as 2:1 or 3:1 which are easily obtained “off the shelf” power ratios if a “Y” is selected here. | RUN 40 - RELATIVE POWER PRIMARY DRIVE | Click | OK / APPLY | to accept default and proceed to next applicable | RUN | This entry enables the user to pre-determine the relative power between the primary and secondary drive shafts. (One ratio would be "2" on the Primary Drive and "1" on the Secondary Drive.)
Click | OK / APPLY | to proceed
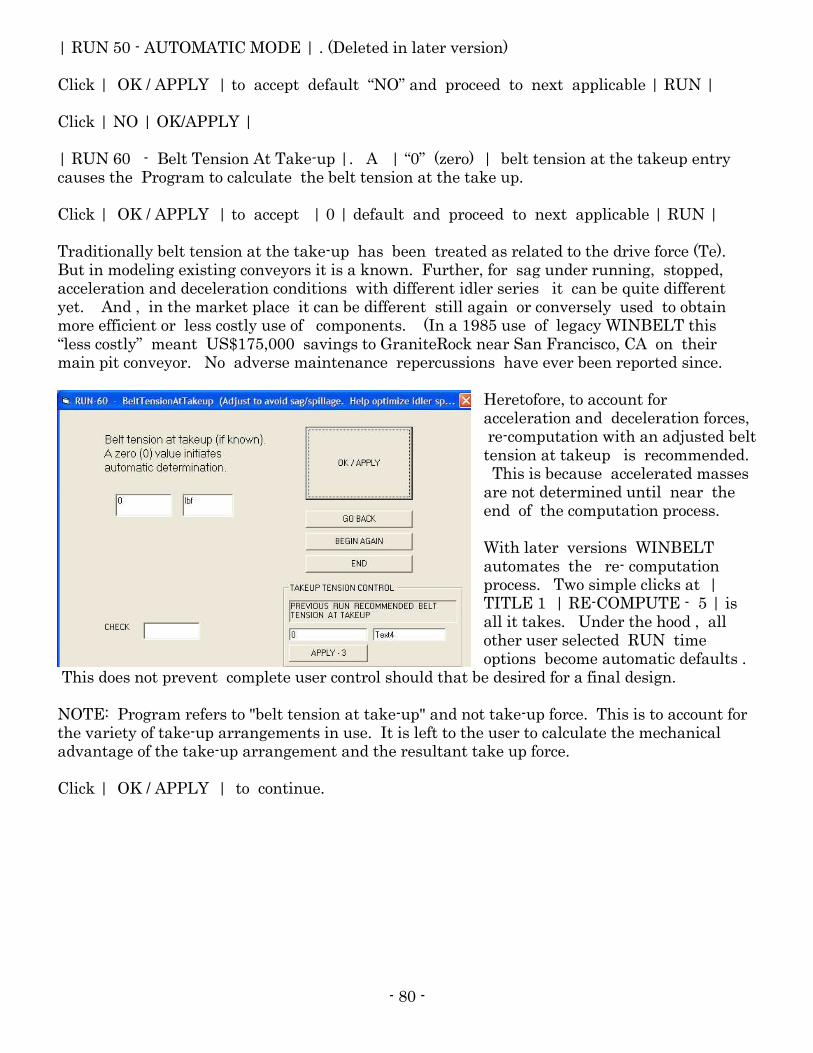
- 80 -
| RUN 50 - AUTOMATIC MODE | . (Deleted in later version) Click | OK / APPLY | to accept default “NO” and proceed to next applicable | RUN | Click | NO | OK/APPLY | | RUN 60 - Belt Tension At Take-up |. A | “0” (zero) | belt tension at the takeup entry causes the Program to calculate the belt tension at the take up. Click | OK / APPLY | to accept | 0 | default and proceed to next applicable | RUN | Traditionally belt tension at the take-up has been treated as related to the drive force (Te). But in modeling existing conveyors it is a known. Further, for sag under running, stopped, acceleration and deceleration conditions with different idler series it can be quite different yet. And , in the market place it can be different still again or conversely used to obtain more efficient or less costly use of components. (In a 1985 use of legacy WINBELT this “less costly” meant US$175,000 savings to GraniteRock near San Francisco, CA on their main pit conveyor. No adverse maintenance repercussions have ever been reported since.
Heretofore, to account for acceleration and deceleration forces, re-computation with an adjusted belt tension at takeup is recommended. This is because accelerated masses are not determined until near the end of the computation process. With later versions WINBELT automates the re- computation process. Two simple clicks at | TITLE 1 | RE-COMPUTE - 5 | is all it takes. Under the hood , all other user selected RUN time options become automatic defaults .
This does not prevent complete user control should that be desired for a final design. NOTE: Program refers to "belt tension at take-up" and not take-up force. This is to account for the variety of take-up arrangements in use. It is left to the user to calculate the mechanical advantage of the take-up arrangement and the resultant take up force. Click | OK / APPLY | to continue.
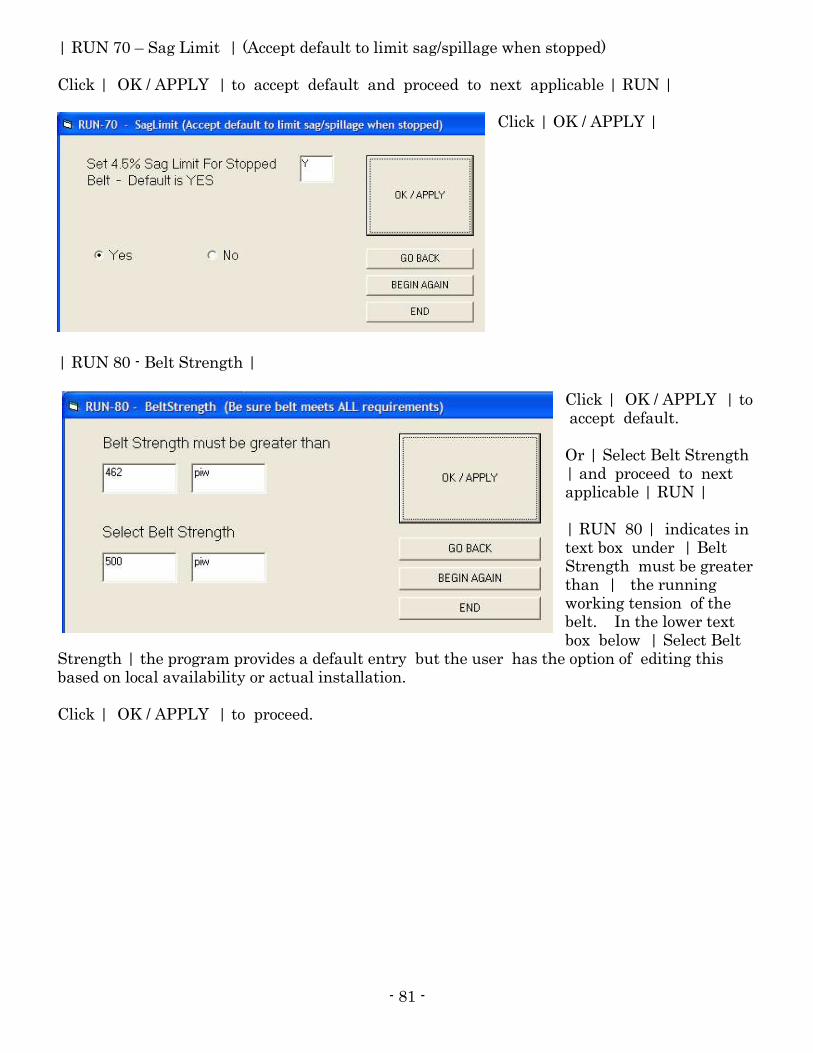
- 81 -
| RUN 70 – Sag Limit | (Accept default to limit sag/spillage when stopped) Click | OK / APPLY | to accept default and proceed to next applicable | RUN |
Click | OK / APPLY |
| RUN 80 - Belt Strength |
Click | OK / APPLY | to accept default. Or | Select Belt Strength | and proceed to next applicable | RUN | | RUN 80 | indicates in text box under | Belt Strength must be greater than | the running working tension of the belt. In the lower text box below | Select Belt
Strength | the program provides a default entry but the user has the option of editing this based on local availability or actual installation. Click | OK / APPLY | to proceed.
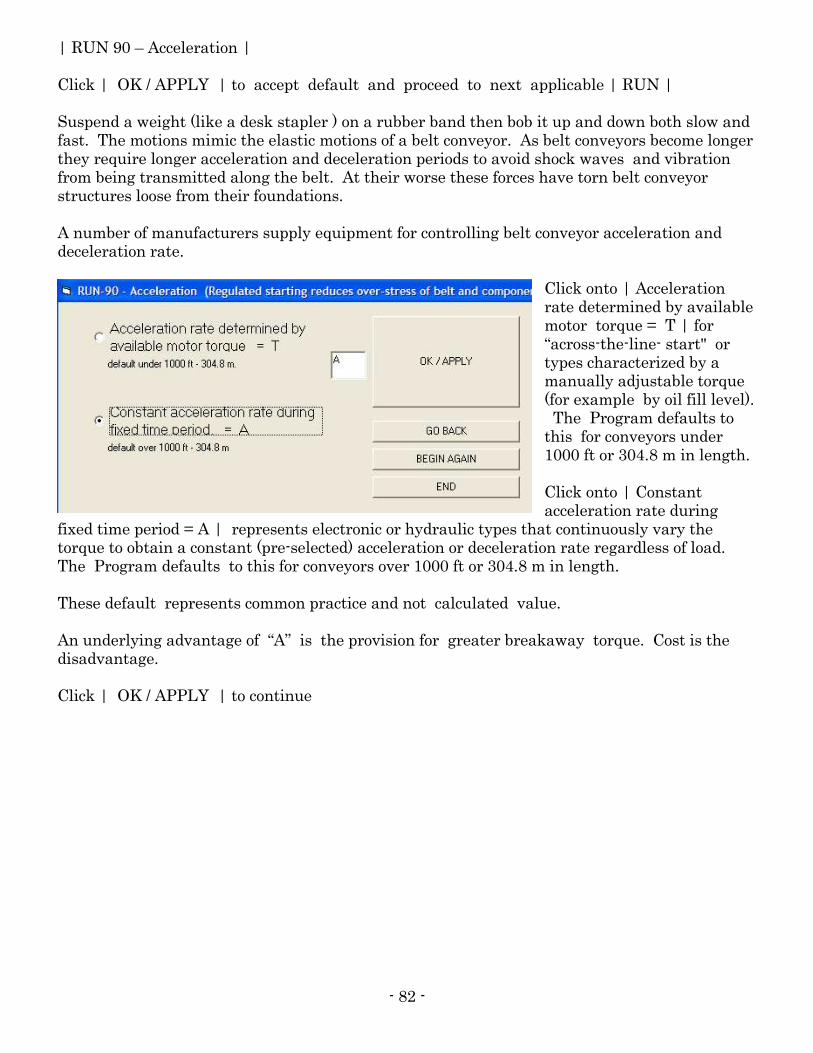
- 82 -
| RUN 90 – Acceleration | Click | OK / APPLY | to accept default and proceed to next applicable | RUN | Suspend a weight (like a desk stapler ) on a rubber band then bob it up and down both slow and fast. The motions mimic the elastic motions of a belt conveyor. As belt conveyors become longer they require longer acceleration and deceleration periods to avoid shock waves and vibration from being transmitted along the belt. At their worse these forces have torn belt conveyor structures loose from their foundations. A number of manufacturers supply equipment for controlling belt conveyor acceleration and deceleration rate.
Click onto | Acceleration rate determined by available motor torque = T | for “across-the-line- start" or types characterized by a manually adjustable torque (for example by oil fill level). The Program defaults to this for conveyors under 1000 ft or 304.8 m in length. Click onto | Constant acceleration rate during
fixed time period = A | represents electronic or hydraulic types that continuously vary the torque to obtain a constant (pre-selected) acceleration or deceleration rate regardless of load. The Program defaults to this for conveyors over 1000 ft or 304.8 m in length. These default represents common practice and not calculated value. An underlying advantage of “A” is the provision for greater breakaway torque. Cost is the disadvantage. Click | OK / APPLY | to continue
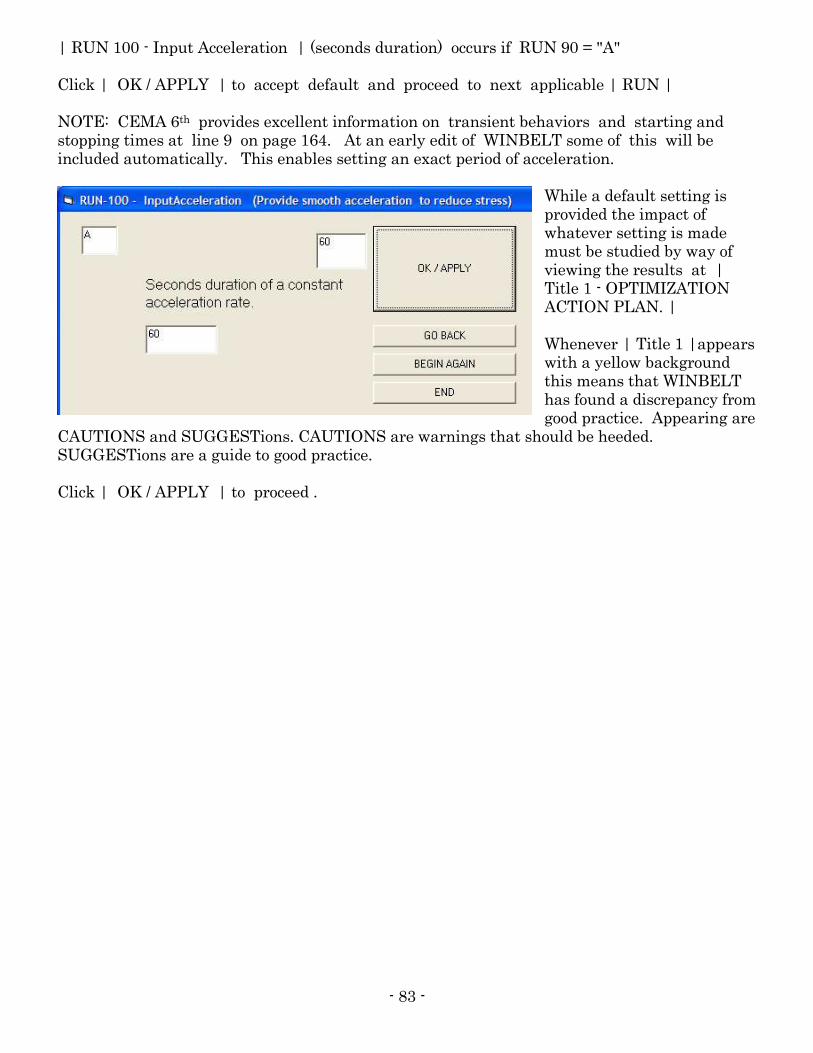
- 83 -
| RUN 100 - Input Acceleration | (seconds duration) occurs if RUN 90 = "A" Click | OK / APPLY | to accept default and proceed to next applicable | RUN | NOTE: CEMA 6th provides excellent information on transient behaviors and starting and stopping times at line 9 on page 164. At an early edit of WINBELT some of this will be included automatically. This enables setting an exact period of acceleration.
While a default setting is provided the impact of whatever setting is made must be studied by way of viewing the results at | Title 1 - OPTIMIZATION ACTION PLAN. | Whenever | Title 1 |appears with a yellow background this means that WINBELT has found a discrepancy from good practice. Appearing are
CAUTIONS and SUGGESTions. CAUTIONS are warnings that should be heeded. SUGGESTions are a guide to good practice. Click | OK / APPLY | to proceed .
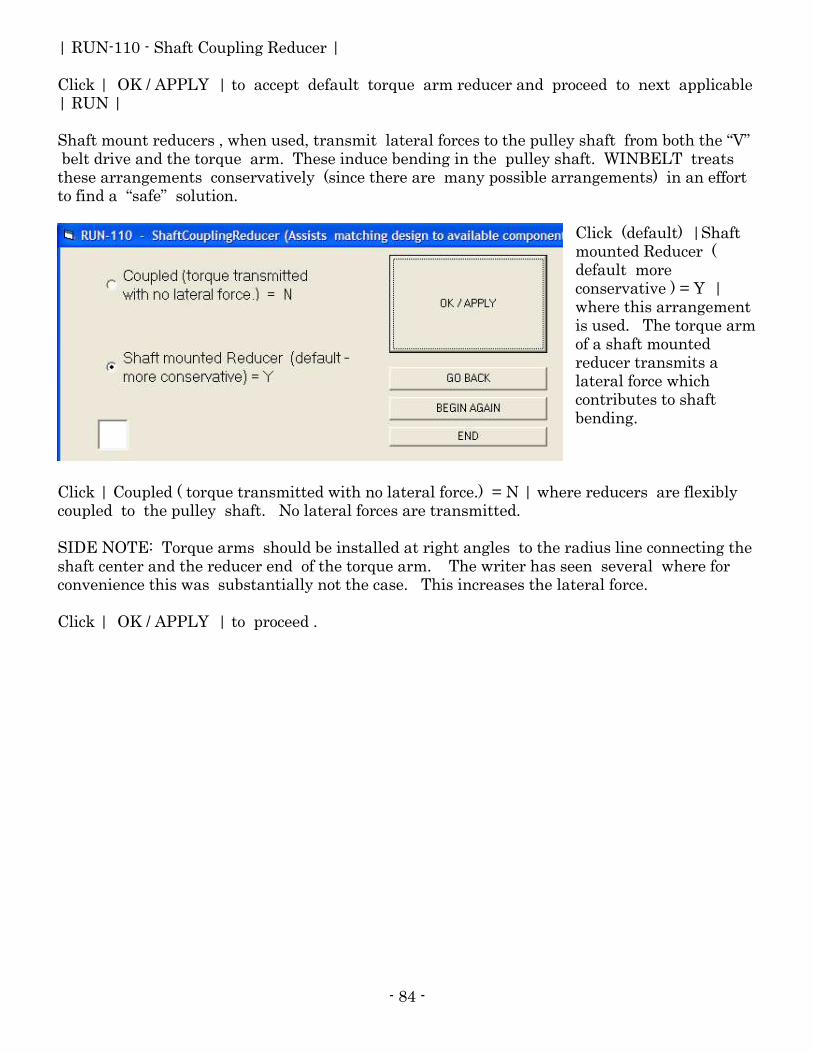
- 84 -
| RUN-110 - Shaft Coupling Reducer | Click | OK / APPLY | to accept default torque arm reducer and proceed to next applicable | RUN | Shaft mount reducers , when used, transmit lateral forces to the pulley shaft from both the “V” belt drive and the torque arm. These induce bending in the pulley shaft. WINBELT treats these arrangements conservatively (since there are many possible arrangements) in an effort to find a “safe” solution.
Click (default) |Shaft mounted Reducer ( default more conservative ) = Y | where this arrangement is used. The torque arm of a shaft mounted reducer transmits a lateral force which contributes to shaft bending.
Click | Coupled ( torque transmitted with no lateral force.) = N | where reducers are flexibly coupled to the pulley shaft. No lateral forces are transmitted. SIDE NOTE: Torque arms should be installed at right angles to the radius line connecting the shaft center and the reducer end of the torque arm. The writer has seen several where for convenience this was substantially not the case. This increases the lateral force. Click | OK / APPLY | to proceed .
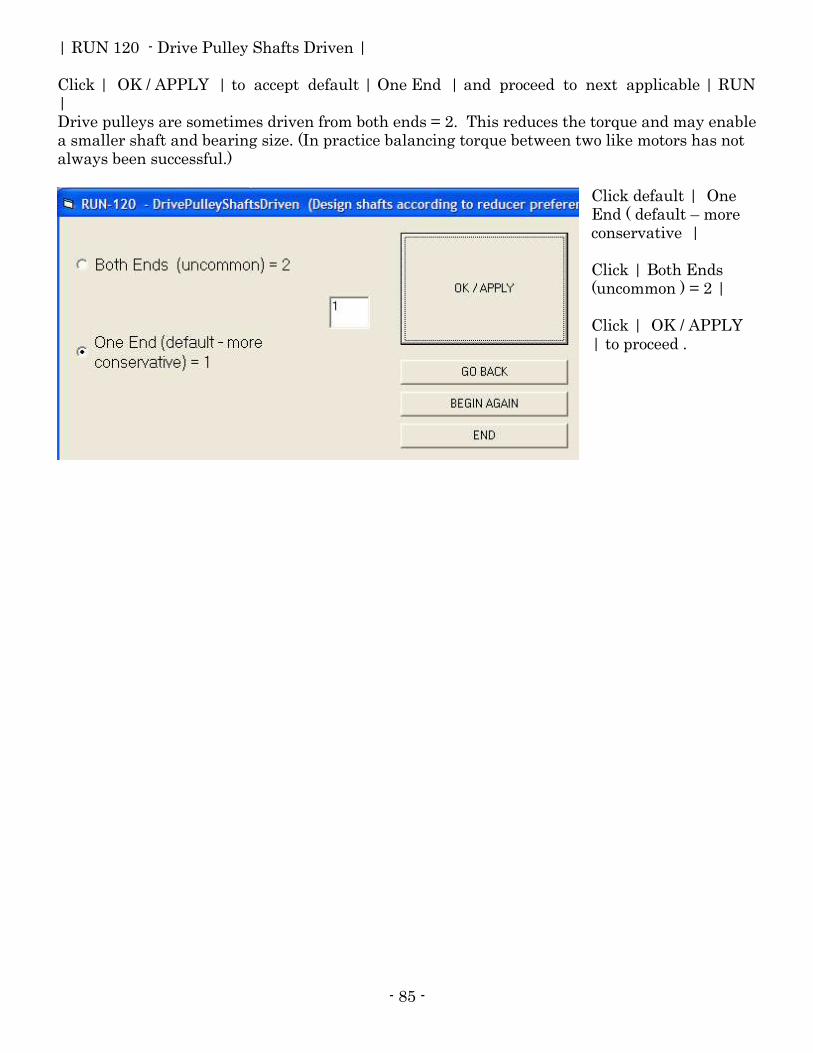
- 85 -
| RUN 120 - Drive Pulley Shafts Driven | Click | OK / APPLY | to accept default | One End | and proceed to next applicable | RUN | Drive pulleys are sometimes driven from both ends = 2. This reduces the torque and may enable a smaller shaft and bearing size. (In practice balancing torque between two like motors has not always been successful.)
Click default | One End ( default – more conservative | Click | Both Ends (uncommon ) = 2 | Click | OK / APPLY | to proceed .
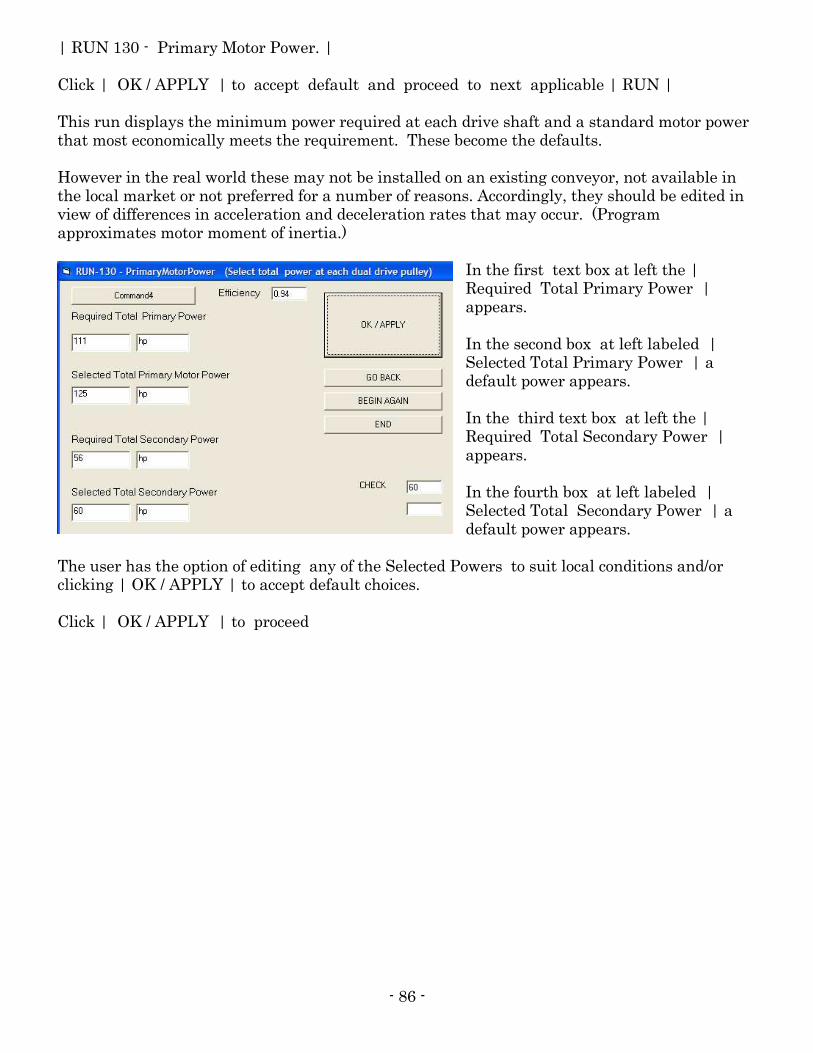
- 86 -
| RUN 130 - Primary Motor Power. | Click | OK / APPLY | to accept default and proceed to next applicable | RUN | This run displays the minimum power required at each drive shaft and a standard motor power that most economically meets the requirement. These become the defaults. However in the real world these may not be installed on an existing conveyor, not available in the local market or not preferred for a number of reasons. Accordingly, they should be edited in view of differences in acceleration and deceleration rates that may occur. (Program approximates motor moment of inertia.)
In the first text box at left the | Required Total Primary Power | appears. In the second box at left labeled | Selected Total Primary Power | a default power appears. In the third text box at left the | Required Total Secondary Power | appears. In the fourth box at left labeled | Selected Total Secondary Power | a default power appears.
The user has the option of editing any of the Selected Powers to suit local conditions and/or clicking | OK / APPLY | to accept default choices. Click | OK / APPLY | to proceed
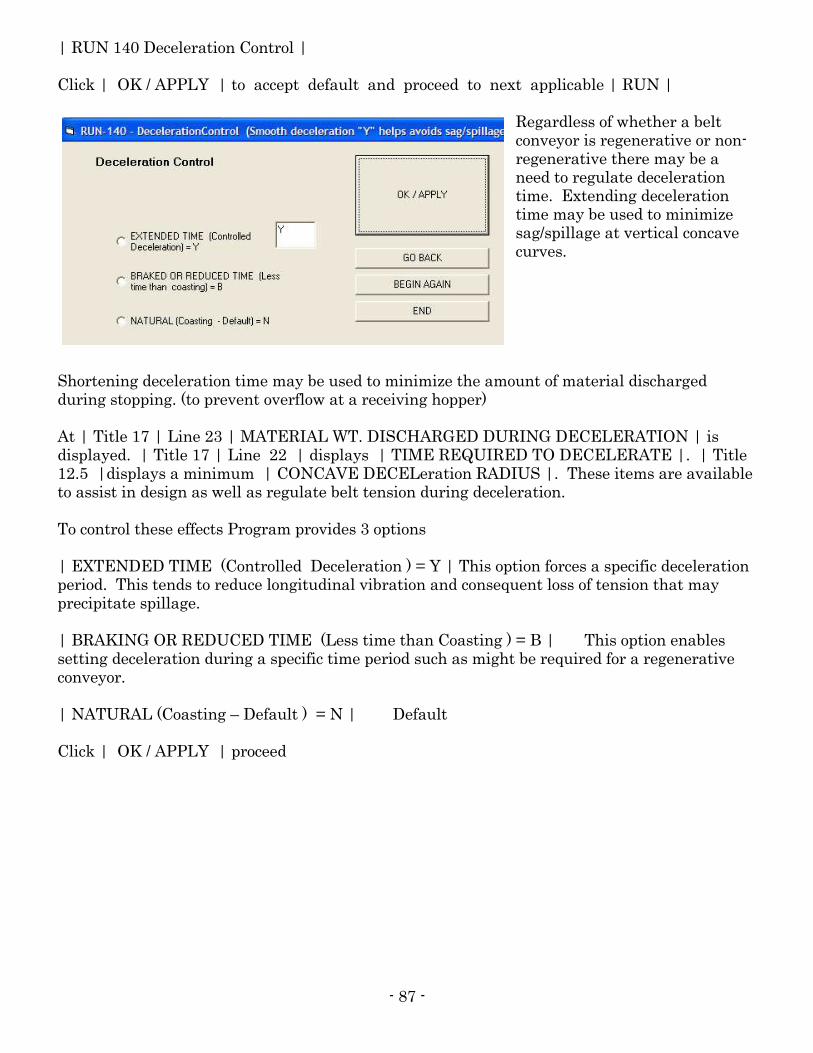
- 87 -
| RUN 140 Deceleration Control | Click | OK / APPLY | to accept default and proceed to next applicable | RUN |
Regardless of whether a belt conveyor is regenerative or non-regenerative there may be a need to regulate deceleration time. Extending deceleration time may be used to minimize sag/spillage at vertical concave curves.
Shortening deceleration time may be used to minimize the amount of material discharged during stopping. (to prevent overflow at a receiving hopper) At | Title 17 | Line 23 | MATERIAL WT. DISCHARGED DURING DECELERATION | is displayed. | Title 17 | Line 22 | displays | TIME REQUIRED TO DECELERATE |. | Title 12.5 |displays a minimum | CONCAVE DECELeration RADIUS |. These items are available to assist in design as well as regulate belt tension during deceleration. To control these effects Program provides 3 options | EXTENDED TIME (Controlled Deceleration ) = Y | This option forces a specific deceleration period. This tends to reduce longitudinal vibration and consequent loss of tension that may precipitate spillage. | BRAKING OR REDUCED TIME (Less time than Coasting ) = B | This option enables setting deceleration during a specific time period such as might be required for a regenerative conveyor. | NATURAL (Coasting – Default ) = N | Default Click | OK / APPLY | proceed
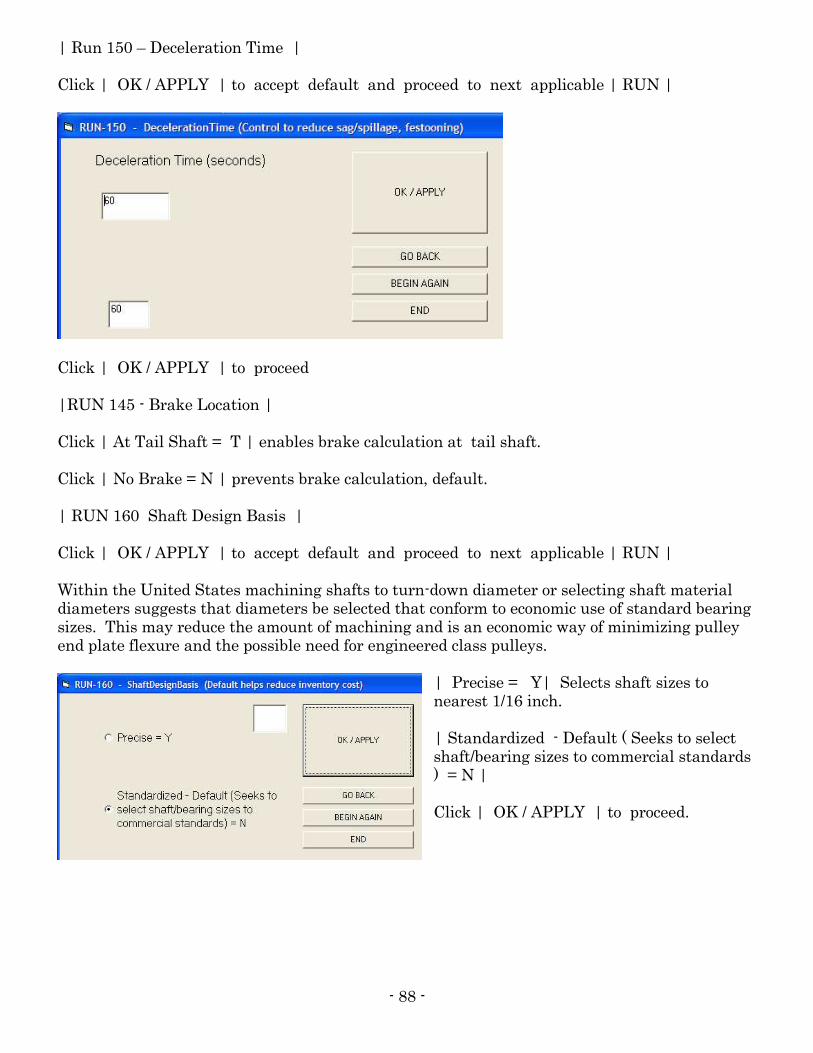
- 88 -
| Run 150 – Deceleration Time | Click | OK / APPLY | to accept default and proceed to next applicable | RUN |
Click | OK / APPLY | to proceed |RUN 145 - Brake Location | Click | At Tail Shaft = T | enables brake calculation at tail shaft. Click | No Brake = N | prevents brake calculation, default. | RUN 160 Shaft Design Basis | Click | OK / APPLY | to accept default and proceed to next applicable | RUN | Within the United States machining shafts to turn-down diameter or selecting shaft material diameters suggests that diameters be selected that conform to economic use of standard bearing sizes. This may reduce the amount of machining and is an economic way of minimizing pulley end plate flexure and the possible need for engineered class pulleys.
| Precise = Y| Selects shaft sizes to nearest 1/16 inch. | Standardized - Default ( Seeks to select shaft/bearing sizes to commercial standards ) = N | Click | OK / APPLY | to proceed.
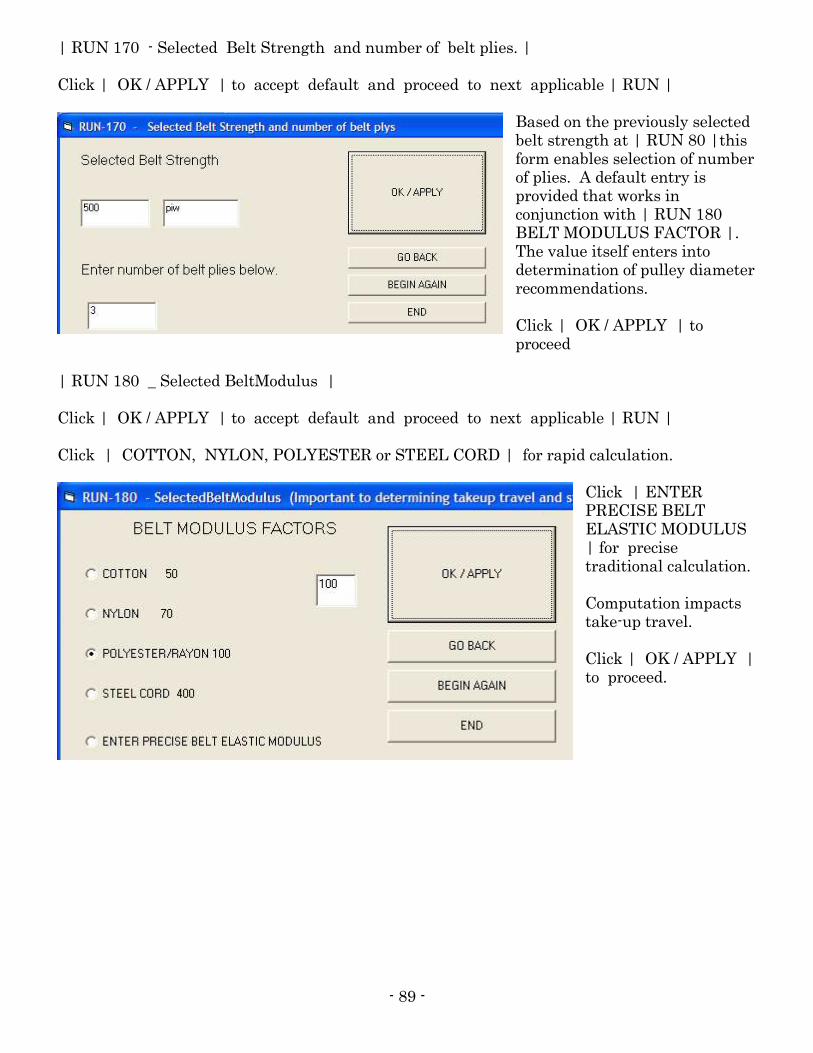
- 89 -
| RUN 170 - Selected Belt Strength and number of belt plies. | Click | OK / APPLY | to accept default and proceed to next applicable | RUN |
Based on the previously selected belt strength at | RUN 80 |this form enables selection of number of plies. A default entry is provided that works in conjunction with | RUN 180 BELT MODULUS FACTOR |. The value itself enters into determination of pulley diameter recommendations. Click | OK / APPLY | to proceed
| RUN 180 _ Selected BeltModulus | Click | OK / APPLY | to accept default and proceed to next applicable | RUN | Click | COTTON, NYLON, POLYESTER or STEEL CORD | for rapid calculation.
Click | ENTER PRECISE BELT ELASTIC MODULUS | for precise traditional calculation. Computation impacts take-up travel. Click | OK / APPLY | to proceed.
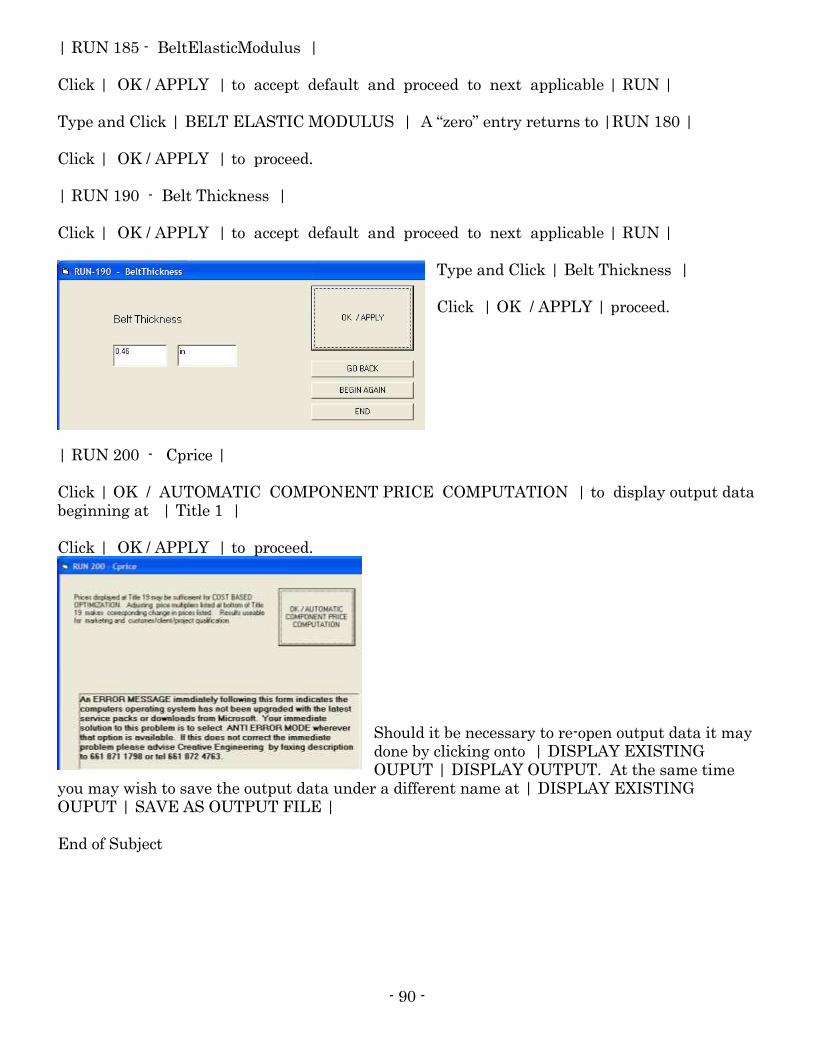
- 90 -
| RUN 185 - BeltElasticModulus | Click | OK / APPLY | to accept default and proceed to next applicable | RUN | Type and Click | BELT ELASTIC MODULUS | A “zero” entry returns to |RUN 180 | Click | OK / APPLY | to proceed. | RUN 190 - Belt Thickness | Click | OK / APPLY | to accept default and proceed to next applicable | RUN |
Type and Click | Belt Thickness | Click | OK / APPLY | proceed.
| RUN 200 - Cprice | Click | OK / AUTOMATIC COMPONENT PRICE COMPUTATION | to display output data beginning at | Title 1 | Click | OK / APPLY | to proceed.
Should it be necessary to re-open output data it may done by clicking onto | DISPLAY EXISTING OUPUT | DISPLAY OUTPUT. At the same time
you may wish to save the output data under a different name at | DISPLAY EXISTING OUPUT | SAVE AS OUTPUT FILE | End of Subject
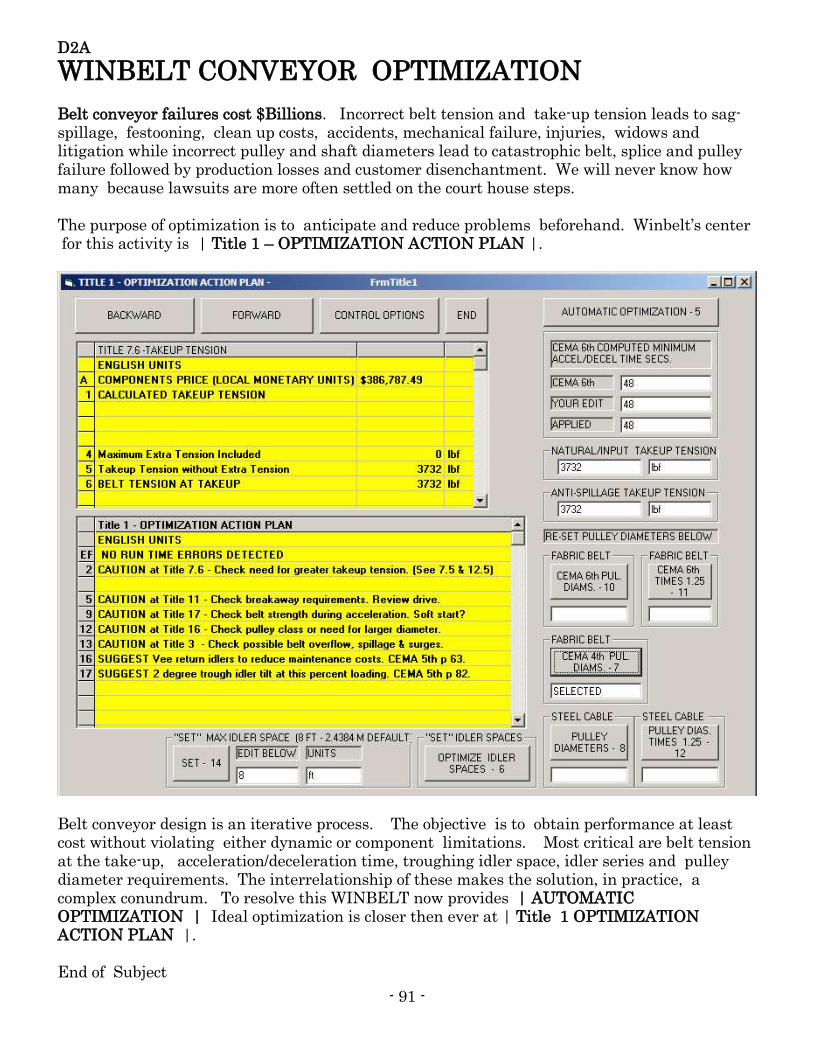
- 91 -
D2A
WINBELT CONVEYOR OPTIMIZATION Belt conveyor failures cost $Billions. Incorrect belt tension and take-up tension leads to sag-spillage, festooning, clean up costs, accidents, mechanical failure, injuries, widows and litigation while incorrect pulley and shaft diameters lead to catastrophic belt, splice and pulley failure followed by production losses and customer disenchantment. We will never know how many because lawsuits are more often settled on the court house steps. The purpose of optimization is to anticipate and reduce problems beforehand. Winbelt’s center for this activity is | Title 1 – OPTIMIZATION ACTION PLAN |.
Belt conveyor design is an iterative process. The objective is to obtain performance at least cost without violating either dynamic or component limitations. Most critical are belt tension at the take-up, acceleration/deceleration time, troughing idler space, idler series and pulley diameter requirements. The interrelationship of these makes the solution, in practice, a complex conundrum. To resolve this WINBELT now provides | AUTOMATIC OPTIMIZATION | Ideal optimization is closer then ever at | Title 1 OPTIMIZATION ACTION PLAN |. End of Subject
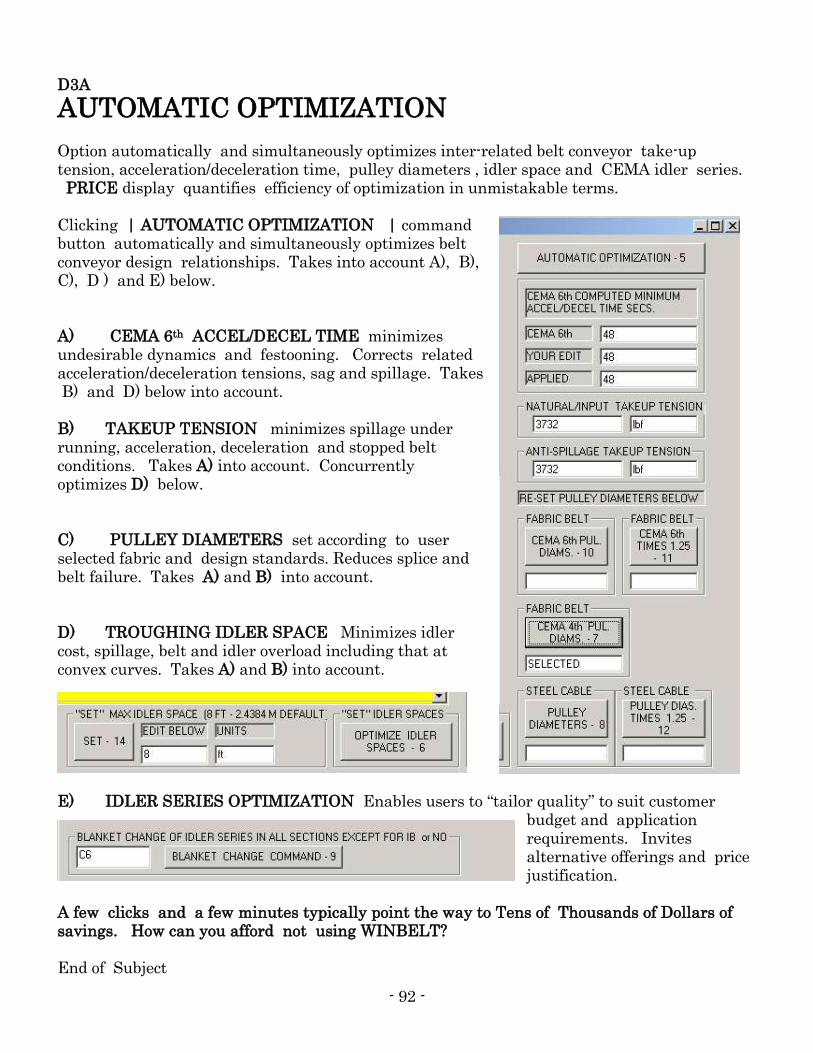
- 92 -
D3A
AUTOMATIC OPTIMIZATION Option automatically and simultaneously optimizes inter-related belt conveyor take-up tension, acceleration/deceleration time, pulley diameters , idler space and CEMA idler series. PRICE display quantifies efficiency of optimization in unmistakable terms. Clicking | AUTOMATIC OPTIMIZATION | command button automatically and simultaneously optimizes belt conveyor design relationships. Takes into account A), B), C), D ) and E) below. A) CEMA 6th ACCEL/DECEL TIME minimizes undesirable dynamics and festooning. Corrects related acceleration/deceleration tensions, sag and spillage. Takes B) and D) below into account. B) TAKEUP TENSION minimizes spillage under running, acceleration, deceleration and stopped belt conditions. Takes A) into account. Concurrently optimizes D) below. C) PULLEY DIAMETERS set according to user selected fabric and design standards. Reduces splice and belt failure. Takes A) and B) into account. D) TROUGHING IDLER SPACE Minimizes idler cost, spillage, belt and idler overload including that at convex curves. Takes A) and B) into account.
E) IDLER SERIES OPTIMIZATION Enables users to “tailor quality” to suit customer
budget and application requirements. Invites alternative offerings and price justification.
A few clicks and a few minutes typically point the way to Tens of Thousands of Dollars of savings. How can you afford not using WINBELT? End of Subject
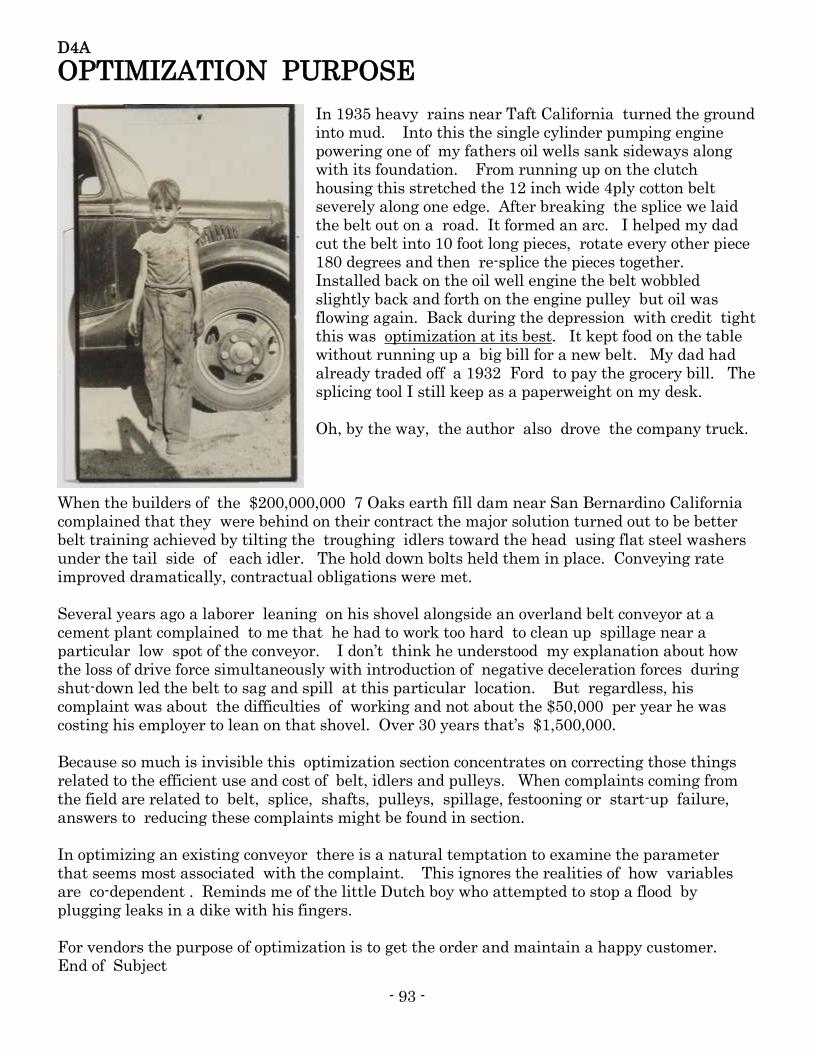
- 93 -
D4A
OPTIMIZATION PURPOSE
In 1935 heavy rains near Taft California turned the ground into mud. Into this the single cylinder pumping engine powering one of my fathers oil wells sank sideways along with its foundation. From running up on the clutch housing this stretched the 12 inch wide 4ply cotton belt severely along one edge. After breaking the splice we laid the belt out on a road. It formed an arc. I helped my dad cut the belt into 10 foot long pieces, rotate every other piece 180 degrees and then re-splice the pieces together. Installed back on the oil well engine the belt wobbled slightly back and forth on the engine pulley but oil was flowing again. Back during the depression with credit tight this was optimization at its best. It kept food on the table without running up a big bill for a new belt. My dad had already traded off a 1932 Ford to pay the grocery bill. The splicing tool I still keep as a paperweight on my desk. Oh, by the way, the author also drove the company truck.
When the builders of the $200,000,000 7 Oaks earth fill dam near San Bernardino California complained that they were behind on their contract the major solution turned out to be better belt training achieved by tilting the troughing idlers toward the head using flat steel washers under the tail side of each idler. The hold down bolts held them in place. Conveying rate improved dramatically, contractual obligations were met. Several years ago a laborer leaning on his shovel alongside an overland belt conveyor at a cement plant complained to me that he had to work too hard to clean up spillage near a particular low spot of the conveyor. I don’t think he understood my explanation about how the loss of drive force simultaneously with introduction of negative deceleration forces during shut-down led the belt to sag and spill at this particular location. But regardless, his complaint was about the difficulties of working and not about the $50,000 per year he was costing his employer to lean on that shovel. Over 30 years that’s $1,500,000. Because so much is invisible this optimization section concentrates on correcting those things related to the efficient use and cost of belt, idlers and pulleys. When complaints coming from the field are related to belt, splice, shafts, pulleys, spillage, festooning or start-up failure, answers to reducing these complaints might be found in section. In optimizing an existing conveyor there is a natural temptation to examine the parameter that seems most associated with the complaint. This ignores the realities of how variables are co-dependent . Reminds me of the little Dutch boy who attempted to stop a flood by plugging leaks in a dike with his fingers. For vendors the purpose of optimization is to get the order and maintain a happy customer. End of Subject
- 94 -
D5A
OPTIMIZATION PRIORITIES Involves: 1) “Running” a descriptive file of the belt conveyor in question. 2) Determine from the output data what the flaws are. 3) Fixing the flaws! Optimization of existing belt conveyors is limited by time, cost and the realities of the “as built” condition. Within these limitations | AUTOMATIC OPTIMIZATION | is useful for revealing underlying problems as a preliminary to examination in detail. The writer finds that execution from within a duplicate file enables production of hardcopy (at Title 22) useful for comparison purposes to the “as built” conveyor detail displayed on monitor. Following this Titles suggested at Title 1 - OPTIMIZATI0N PLAN should be reviewed for discrepancies. The user must make his or her own judgment call as to what things need to be corrected. (But please don’t throw the baby out with the wash water. - I once had a client who proposed throwing away a conveyor costing 2.5 $Million to fix what turned out to be a very simple problem.) A) ACCEL/DECEL TIME IN SECS. Acceleration and deceleration time impacts belt dynamics including peak tension, sag, spillage, idler space and idler series. Extending these times lessens the tension differential between these conditions and running tension but may have adverse effects. (Such as increasing the amount of material discharged over the head pulley at shut down.) Shortening these times to less than that recommended can induce undesirable dynamics and reduce the safety factor of some components while perhaps driving up cost.. Proper control requires a drive system or coupling that regulates acceleration and deceleration rates regardless of load. There are a number of electronic or controlled start drives available that do this. Within WINBELT constant acceleration and deceleration rate is modeled by specifying a fixed time period. Specifying motor torque (Across the line start.) seldom meets this requirement. The Program provides a recommendation based on the CEMA 6TH Manual. A starting or stopping time not less than this should be used to avoid “high dynamic tensions”, festooning from low tensions, “belt stretch potential energy” and “drive or brake slip” . A longer time period provides a more conservative result. B) RECOMMENDED TAKEUP TENSION In 1952 after fighting World War II in the Pacific and graduating from UC Berkeley I was hired on by Hopper Machine Works to help out in the engineering of grain elevators and rock plants. My bibles were the Hewitt-Robins and Dodge catalogs. A pocket slide rule was the nearest thing to a computer. Back then the best conveyor belting comprised rubberized layers of cotton duck. (Have you ever heard of 5ply – 32 oz. ?) Belt takeup tension was the least you could get away with without busting the belt. But now with synthetic fiber and steel cable distances conveyed run to miles and the economics of optimization has huge potential.
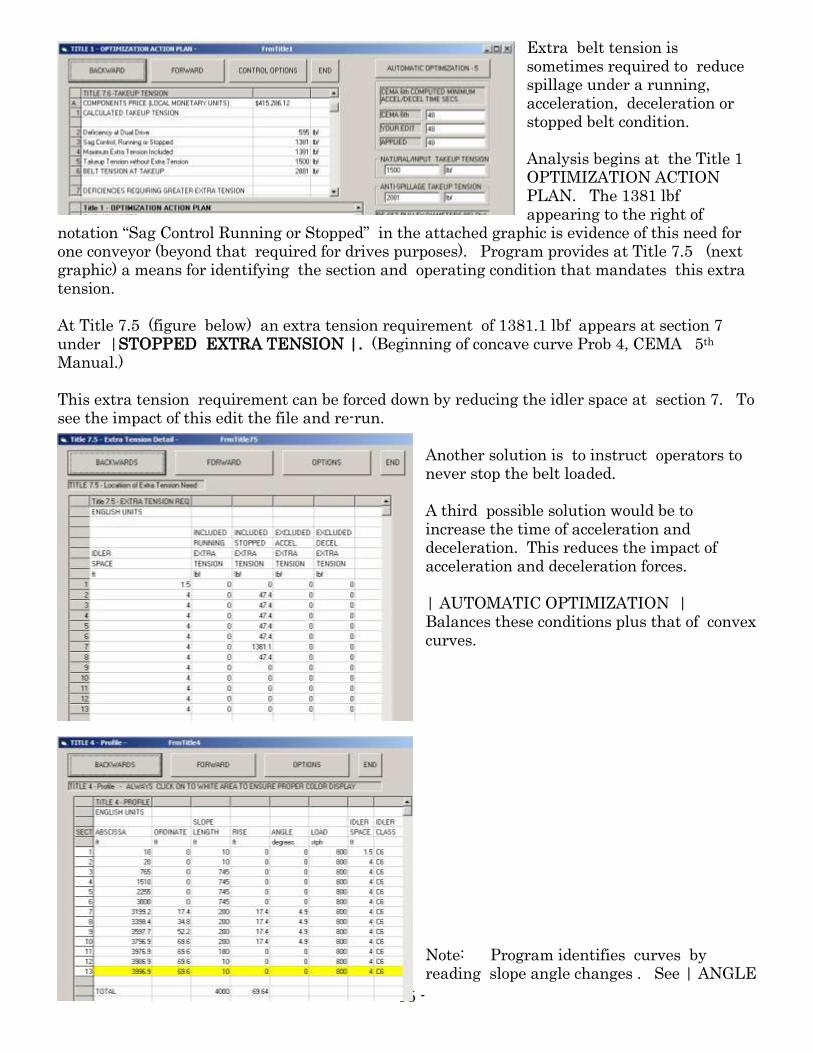
- 95 -
Extra belt tension is sometimes required to reduce spillage under a running, acceleration, deceleration or stopped belt condition. Analysis begins at the Title 1 OPTIMIZATION ACTION PLAN. The 1381 lbf appearing to the right of
notation “Sag Control Running or Stopped” in the attached graphic is evidence of this need for one conveyor (beyond that required for drives purposes). Program provides at Title 7.5 (next graphic) a means for identifying the section and operating condition that mandates this extra tension. At Title 7.5 (figure below) an extra tension requirement of 1381.1 lbf appears at section 7 under |STOPPED EXTRA TENSION |. (Beginning of concave curve Prob 4, CEMA 5th Manual.) This extra tension requirement can be forced down by reducing the idler space at section 7. To see the impact of this edit the file and re-run.
Another solution is to instruct operators to never stop the belt loaded. A third possible solution would be to increase the time of acceleration and deceleration. This reduces the impact of acceleration and deceleration forces. | AUTOMATIC OPTIMIZATION | Balances these conditions plus that of convex curves. Note: Program identifies curves by reading slope angle changes . See | ANGLE
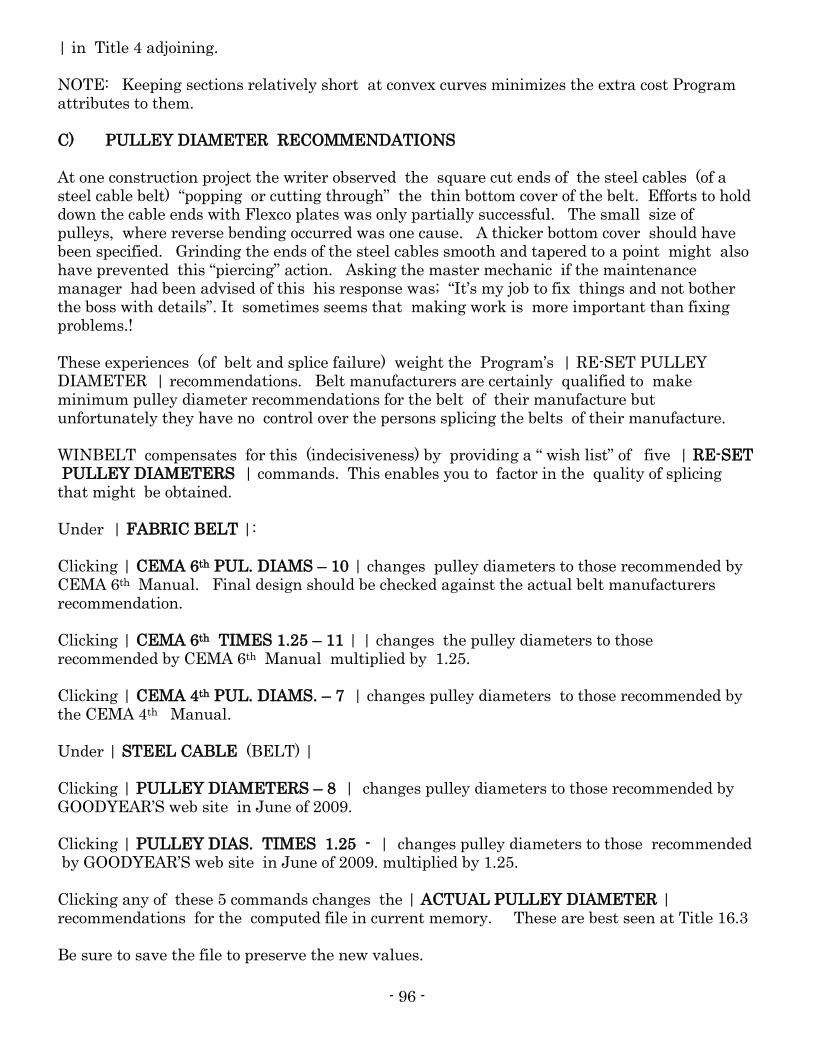
- 96 -
| in Title 4 adjoining. NOTE: Keeping sections relatively short at convex curves minimizes the extra cost Program attributes to them. C) PULLEY DIAMETER RECOMMENDATIONS At one construction project the writer observed the square cut ends of the steel cables (of a steel cable belt) “popping or cutting through” the thin bottom cover of the belt. Efforts to hold down the cable ends with Flexco plates was only partially successful. The small size of pulleys, where reverse bending occurred was one cause. A thicker bottom cover should have been specified. Grinding the ends of the steel cables smooth and tapered to a point might also have prevented this “piercing” action. Asking the master mechanic if the maintenance manager had been advised of this his response was; “It’s my job to fix things and not bother the boss with details”. It sometimes seems that making work is more important than fixing problems.! These experiences (of belt and splice failure) weight the Program’s | RE-SET PULLEY DIAMETER | recommendations. Belt manufacturers are certainly qualified to make minimum pulley diameter recommendations for the belt of their manufacture but unfortunately they have no control over the persons splicing the belts of their manufacture. WINBELT compensates for this (indecisiveness) by providing a “ wish list” of five | RE-SET PULLEY DIAMETERS | commands. This enables you to factor in the quality of splicing that might be obtained. Under | FABRIC BELT |: Clicking | CEMA 6th PUL. DIAMS – 10 | changes pulley diameters to those recommended by CEMA 6th Manual. Final design should be checked against the actual belt manufacturers recommendation. Clicking | CEMA 6th TIMES 1.25 – 11 | | changes the pulley diameters to those recommended by CEMA 6th Manual multiplied by 1.25. Clicking | CEMA 4th PUL. DIAMS. – 7 | changes pulley diameters to those recommended by the CEMA 4th Manual. Under | STEEL CABLE (BELT) | Clicking | PULLEY DIAMETERS – 8 | changes pulley diameters to those recommended by GOODYEAR’S web site in June of 2009. Clicking | PULLEY DIAS. TIMES 1.25 - | changes pulley diameters to those recommended by GOODYEAR’S web site in June of 2009. multiplied by 1.25. Clicking any of these 5 commands changes the | ACTUAL PULLEY DIAMETER | recommendations for the computed file in current memory. These are best seen at Title 16.3 Be sure to save the file to preserve the new values.
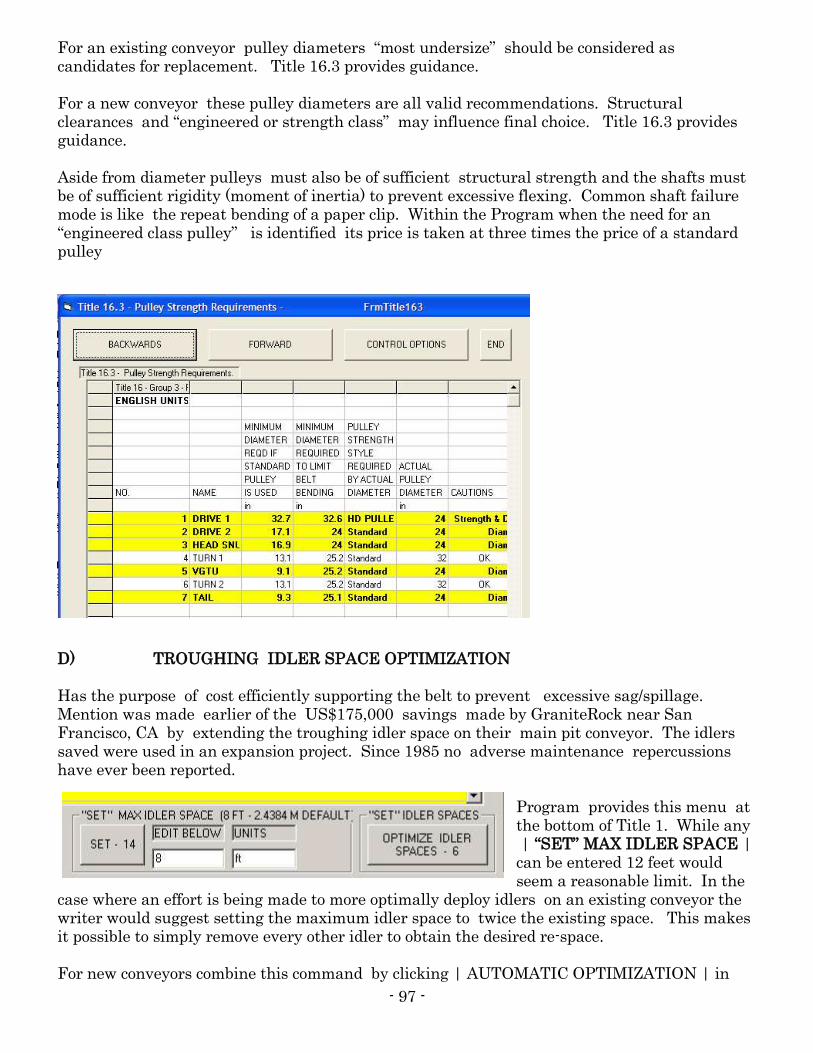
- 97 -
For an existing conveyor pulley diameters “most undersize” should be considered as candidates for replacement. Title 16.3 provides guidance. For a new conveyor these pulley diameters are all valid recommendations. Structural clearances and “engineered or strength class” may influence final choice. Title 16.3 provides guidance. Aside from diameter pulleys must also be of sufficient structural strength and the shafts must be of sufficient rigidity (moment of inertia) to prevent excessive flexing. Common shaft failure mode is like the repeat bending of a paper clip. Within the Program when the need for an “engineered class pulley” is identified its price is taken at three times the price of a standard pulley
D) TROUGHING IDLER SPACE OPTIMIZATION Has the purpose of cost efficiently supporting the belt to prevent excessive sag/spillage. Mention was made earlier of the US$175,000 savings made by GraniteRock near San Francisco, CA by extending the troughing idler space on their main pit conveyor. The idlers saved were used in an expansion project. Since 1985 no adverse maintenance repercussions have ever been reported.
Program provides this menu at the bottom of Title 1. While any | “SET” MAX IDLER SPACE | can be entered 12 feet would seem a reasonable limit. In the
case where an effort is being made to more optimally deploy idlers on an existing conveyor the writer would suggest setting the maximum idler space to twice the existing space. This makes it possible to simply remove every other idler to obtain the desired re-space. For new conveyors combine this command by clicking | AUTOMATIC OPTIMIZATION | in
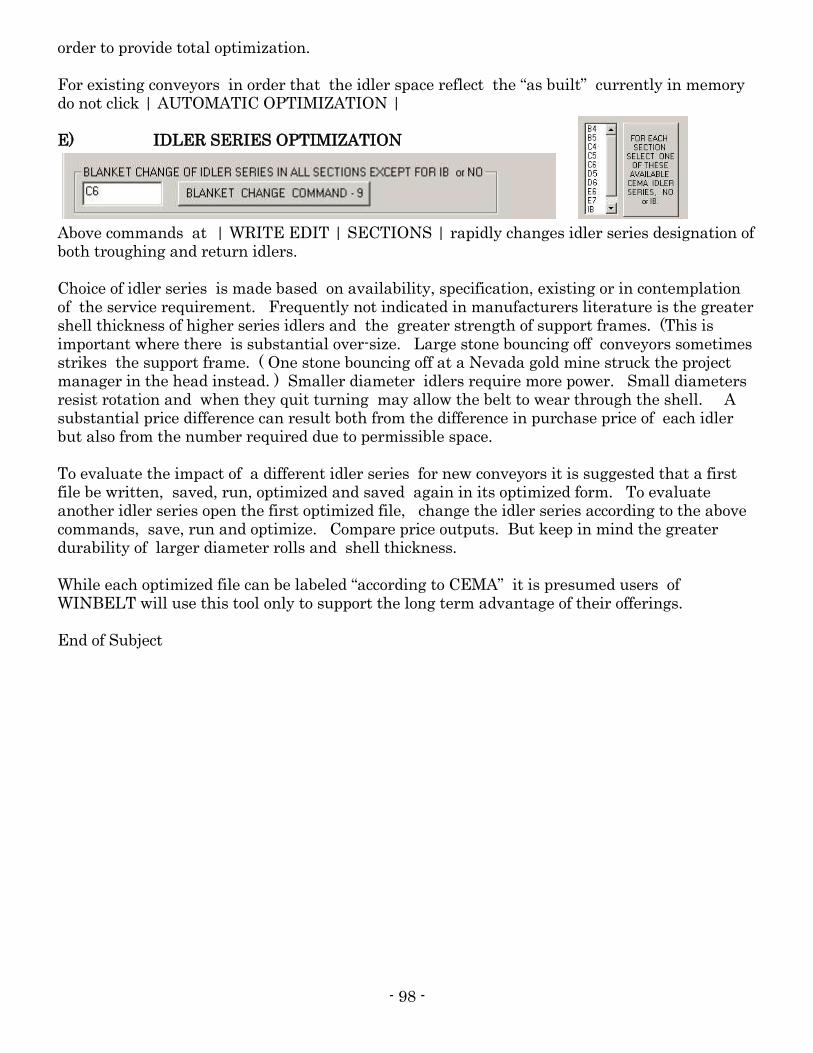
- 98 -
order to provide total optimization. For existing conveyors in order that the idler space reflect the “as built” currently in memory do not click | AUTOMATIC OPTIMIZATION | E) IDLER SERIES OPTIMIZATION
Above commands at | WRITE EDIT | SECTIONS | rapidly changes idler series designation of both troughing and return idlers. Choice of idler series is made based on availability, specification, existing or in contemplation of the service requirement. Frequently not indicated in manufacturers literature is the greater shell thickness of higher series idlers and the greater strength of support frames. (This is important where there is substantial over-size. Large stone bouncing off conveyors sometimes strikes the support frame. ( One stone bouncing off at a Nevada gold mine struck the project manager in the head instead. ) Smaller diameter idlers require more power. Small diameters resist rotation and when they quit turning may allow the belt to wear through the shell. A substantial price difference can result both from the difference in purchase price of each idler but also from the number required due to permissible space. To evaluate the impact of a different idler series for new conveyors it is suggested that a first file be written, saved, run, optimized and saved again in its optimized form. To evaluate another idler series open the first optimized file, change the idler series according to the above commands, save, run and optimize. Compare price outputs. But keep in mind the greater durability of larger diameter rolls and shell thickness. While each optimized file can be labeled “according to CEMA” it is presumed users of WINBELT will use this tool only to support the long term advantage of their offerings. End of Subject
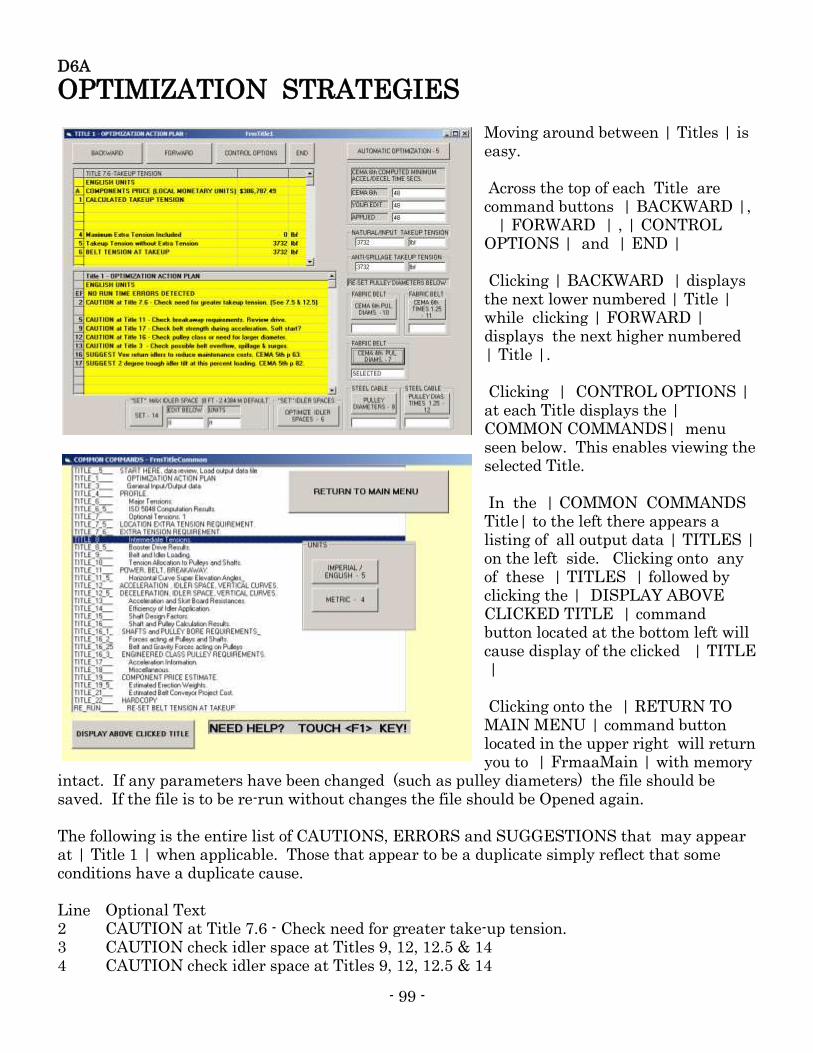
- 99 -
D6A
OPTIMIZATION STRATEGIES
Moving around between | Titles | is easy. Across the top of each Title are command buttons | BACKWARD |, | FORWARD | , | CONTROL OPTIONS | and | END | Clicking | BACKWARD | displays the next lower numbered | Title | while clicking | FORWARD | displays the next higher numbered | Title |. Clicking | CONTROL OPTIONS | at each Title displays the | COMMON COMMANDS| menu seen below. This enables viewing the selected Title. In the | COMMON COMMANDS Title| to the left there appears a listing of all output data | TITLES | on the left side. Clicking onto any of these | TITLES | followed by clicking the | DISPLAY ABOVE CLICKED TITLE | command button located at the bottom left will cause display of the clicked | TITLE | Clicking onto the | RETURN TO MAIN MENU | command button located in the upper right will return you to | FrmaaMain | with memory
intact. If any parameters have been changed (such as pulley diameters) the file should be saved. If the file is to be re-run without changes the file should be Opened again. The following is the entire list of CAUTIONS, ERRORS and SUGGESTIONS that may appear at | Title 1 | when applicable. Those that appear to be a duplicate simply reflect that some conditions have a duplicate cause. Line Optional Text 2 CAUTION at Title 7.6 - Check need for greater take-up tension. 3 CAUTION check idler space at Titles 9, 12, 12.5 & 14 4 CAUTION check idler space at Titles 9, 12, 12.5 & 14
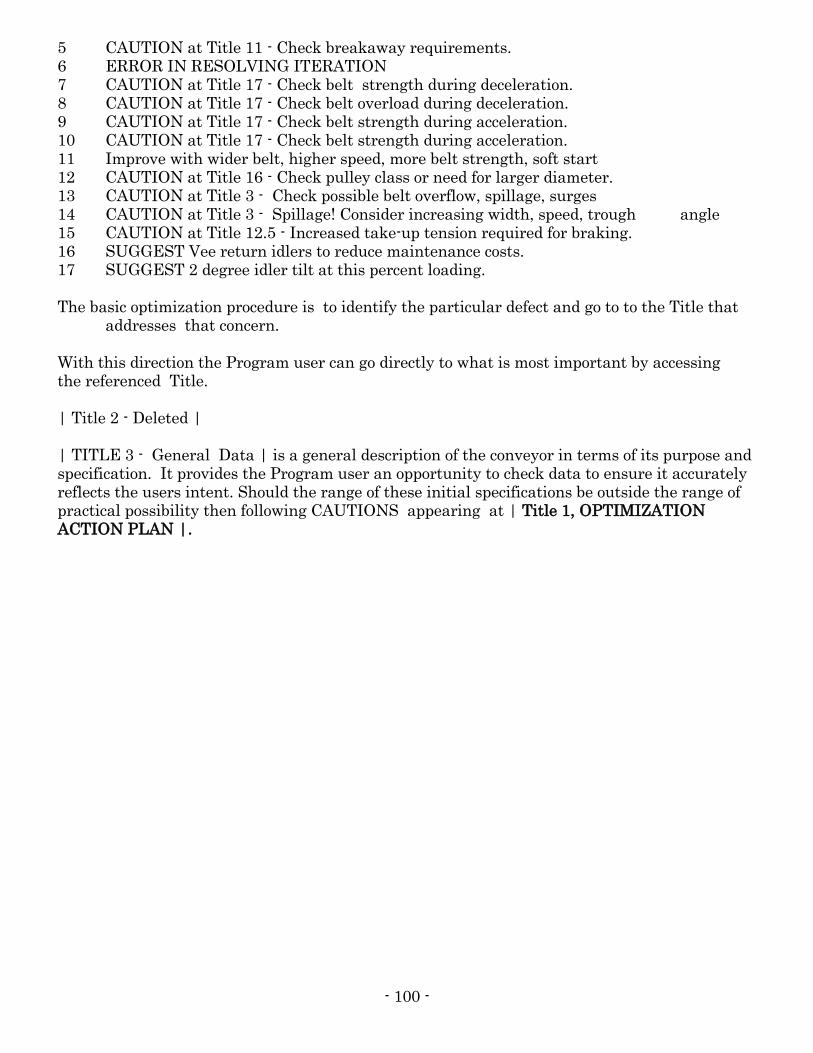
- 100 -
5 CAUTION at Title 11 - Check breakaway requirements. 6 ERROR IN RESOLVING ITERATION 7 CAUTION at Title 17 - Check belt strength during deceleration. 8 CAUTION at Title 17 - Check belt overload during deceleration. 9 CAUTION at Title 17 - Check belt strength during acceleration. 10 CAUTION at Title 17 - Check belt strength during acceleration. 11 Improve with wider belt, higher speed, more belt strength, soft start 12 CAUTION at Title 16 - Check pulley class or need for larger diameter. 13 CAUTION at Title 3 - Check possible belt overflow, spillage, surges 14 CAUTION at Title 3 - Spillage! Consider increasing width, speed, trough angle 15 CAUTION at Title 12.5 - Increased take-up tension required for braking. 16 SUGGEST Vee return idlers to reduce maintenance costs. 17 SUGGEST 2 degree idler tilt at this percent loading. The basic optimization procedure is to identify the particular defect and go to to the Title that
addresses that concern. With this direction the Program user can go directly to what is most important by accessing the referenced Title. | Title 2 - Deleted | | TITLE 3 - General Data | is a general description of the conveyor in terms of its purpose and specification. It provides the Program user an opportunity to check data to ensure it accurately reflects the users intent. Should the range of these initial specifications be outside the range of practical possibility then following CAUTIONS appearing at | Title 1, OPTIMIZATION ACTION PLAN |.
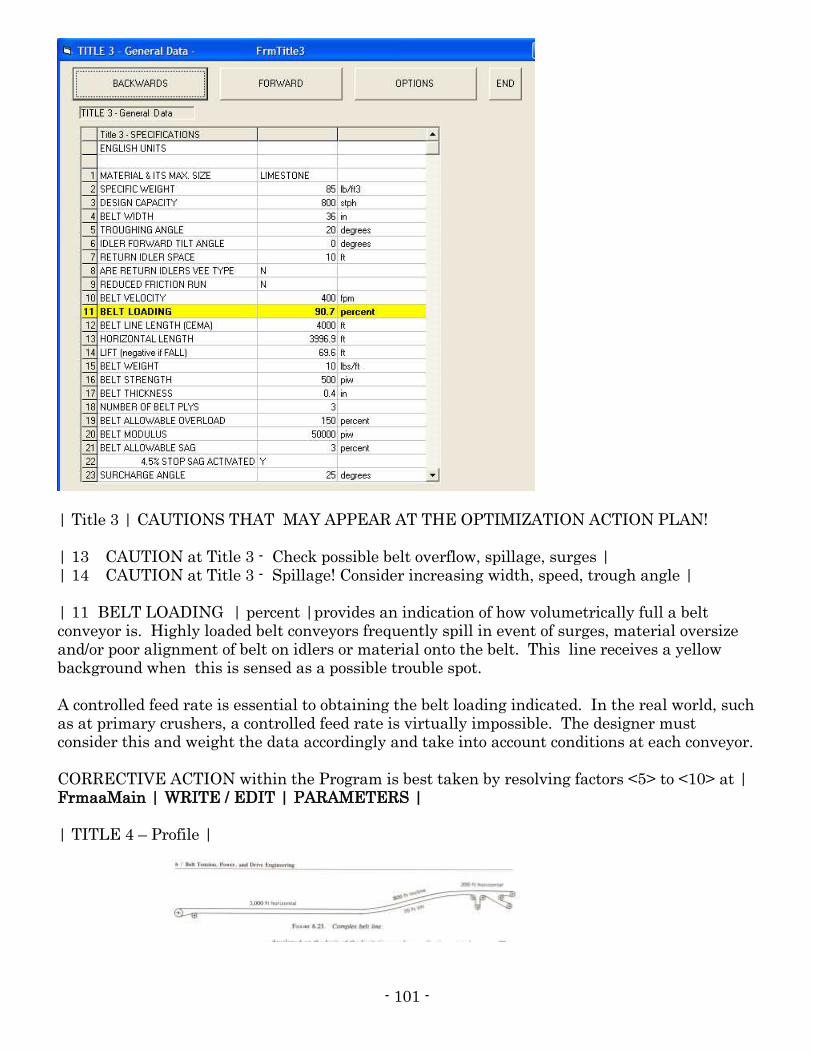
- 101 -
| Title 3 | CAUTIONS THAT MAY APPEAR AT THE OPTIMIZATION ACTION PLAN! | 13 CAUTION at Title 3 - Check possible belt overflow, spillage, surges | | 14 CAUTION at Title 3 - Spillage! Consider increasing width, speed, trough angle | | 11 BELT LOADING | percent |provides an indication of how volumetrically full a belt conveyor is. Highly loaded belt conveyors frequently spill in event of surges, material oversize and/or poor alignment of belt on idlers or material onto the belt. This line receives a yellow background when this is sensed as a possible trouble spot. A controlled feed rate is essential to obtaining the belt loading indicated. In the real world, such as at primary crushers, a controlled feed rate is virtually impossible. The designer must consider this and weight the data accordingly and take into account conditions at each conveyor. CORRECTIVE ACTION within the Program is best taken by resolving factors <5> to <10> at | FrmaaMain | WRITE / EDIT | PARAMETERS | | TITLE 4 – Profile |
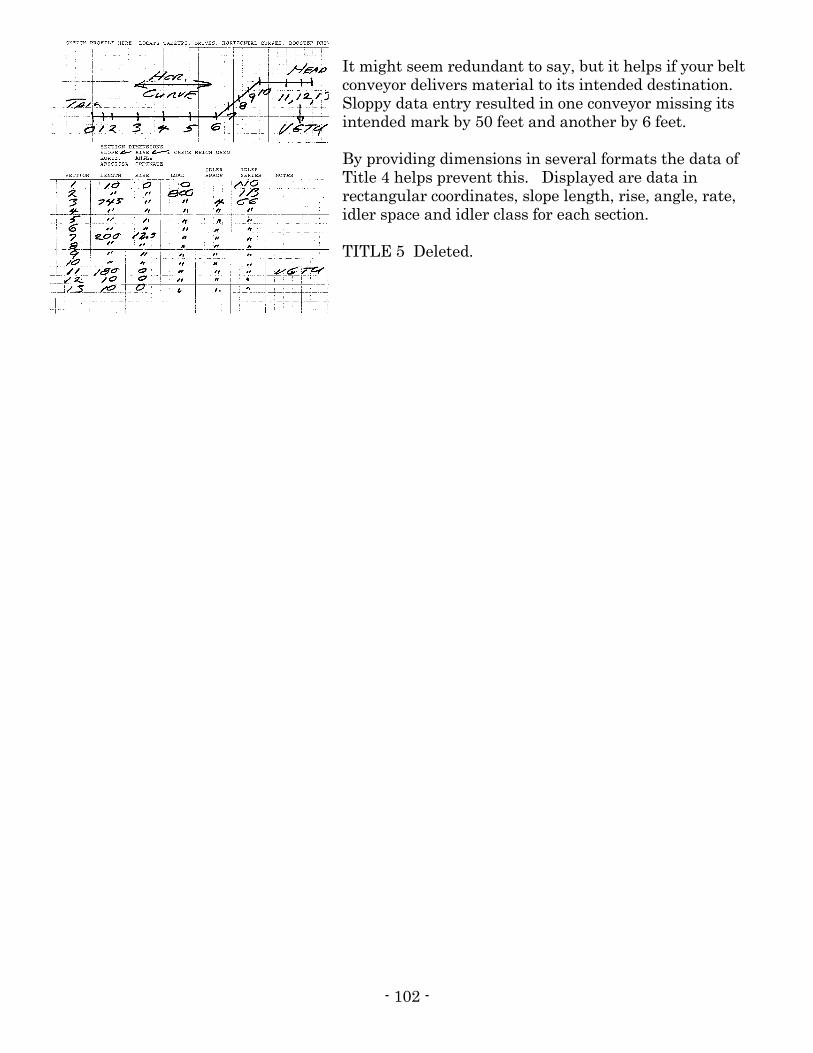
- 102 -
It might seem redundant to say, but it helps if your belt conveyor delivers material to its intended destination. Sloppy data entry resulted in one conveyor missing its intended mark by 50 feet and another by 6 feet. By providing dimensions in several formats the data of Title 4 helps prevent this. Displayed are data in rectangular coordinates, slope length, rise, angle, rate, idler space and idler class for each section. TITLE 5 Deleted.
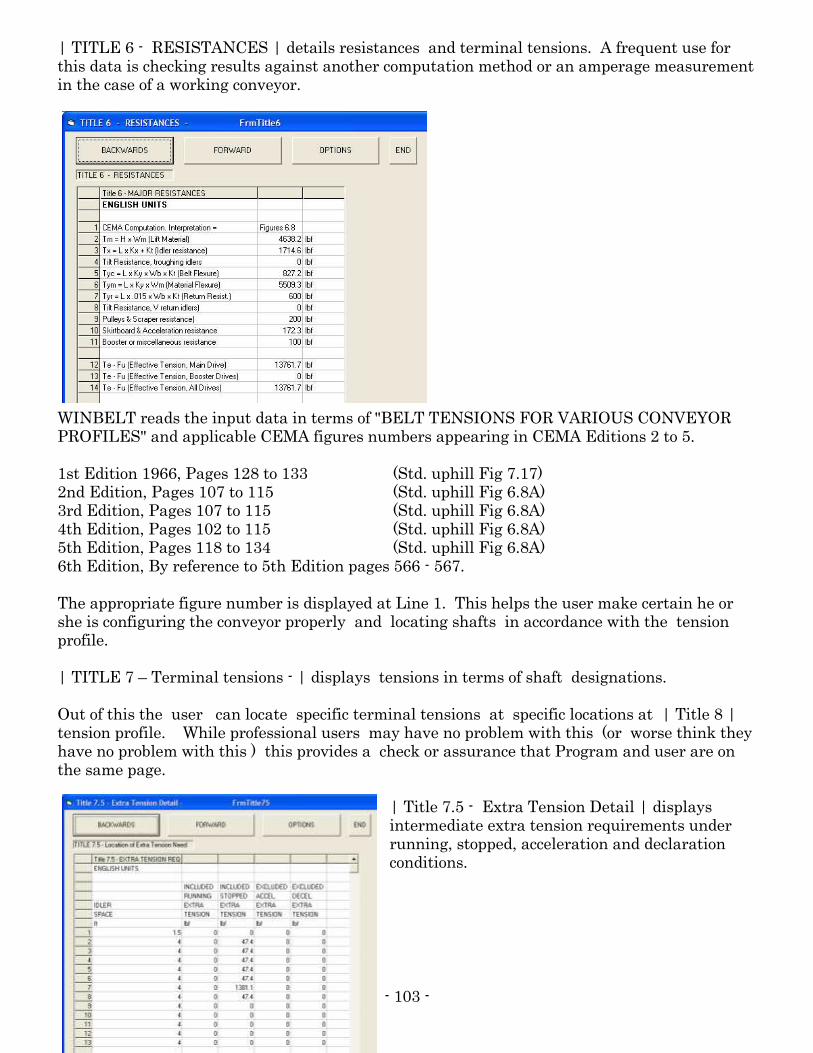
- 103 -
| TITLE 6 - RESISTANCES | details resistances and terminal tensions. A frequent use for this data is checking results against another computation method or an amperage measurement in the case of a working conveyor.
WINBELT reads the input data in terms of "BELT TENSIONS FOR VARIOUS CONVEYOR PROFILES" and applicable CEMA figures numbers appearing in CEMA Editions 2 to 5. 1st Edition 1966, Pages 128 to 133 (Std. uphill Fig 7.17) 2nd Edition, Pages 107 to 115 (Std. uphill Fig 6.8A) 3rd Edition, Pages 107 to 115 (Std. uphill Fig 6.8A) 4th Edition, Pages 102 to 115 (Std. uphill Fig 6.8A) 5th Edition, Pages 118 to 134 (Std. uphill Fig 6.8A) 6th Edition, By reference to 5th Edition pages 566 - 567. The appropriate figure number is displayed at Line 1. This helps the user make certain he or she is configuring the conveyor properly and locating shafts in accordance with the tension profile. | TITLE 7 – Terminal tensions - | displays tensions in terms of shaft designations. Out of this the user can locate specific terminal tensions at specific locations at | Title 8 | tension profile. While professional users may have no problem with this (or worse think they have no problem with this ) this provides a check or assurance that Program and user are on the same page.
| Title 7.5 - Extra Tension Detail | displays intermediate extra tension requirements under running, stopped, acceleration and declaration conditions.
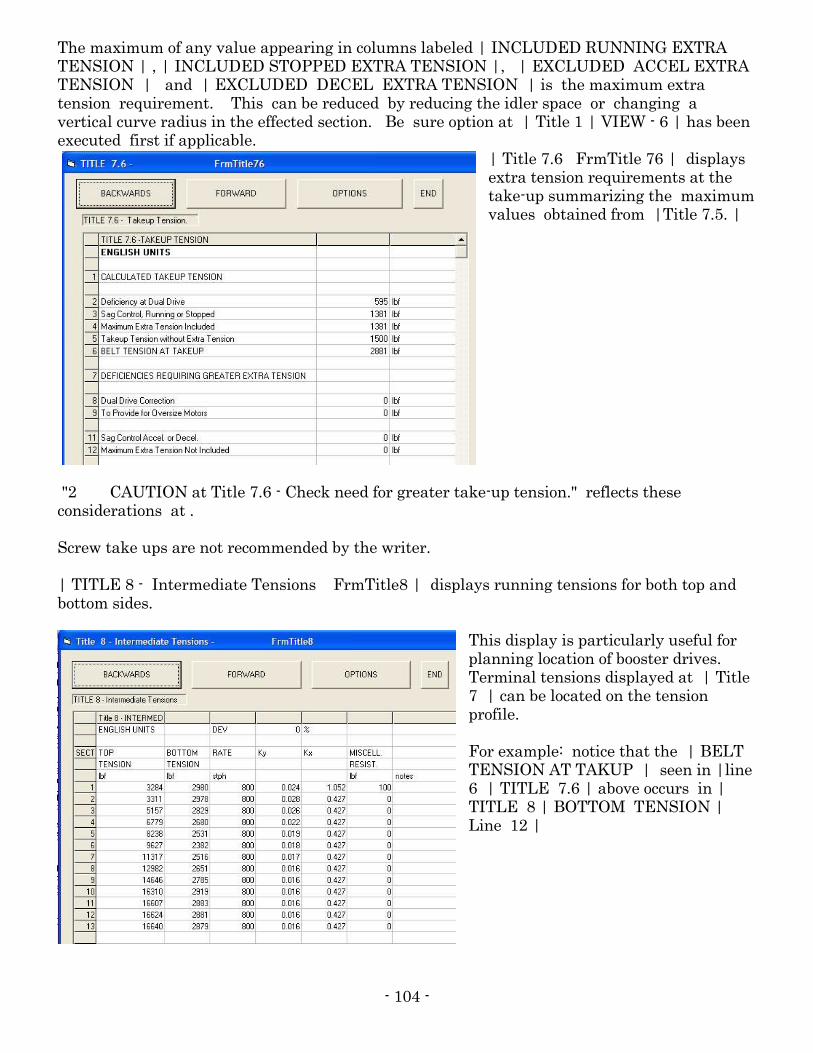
- 104 -
The maximum of any value appearing in columns labeled | INCLUDED RUNNING EXTRA TENSION | , | INCLUDED STOPPED EXTRA TENSION |, | EXCLUDED ACCEL EXTRA TENSION | and | EXCLUDED DECEL EXTRA TENSION | is the maximum extra tension requirement. This can be reduced by reducing the idler space or changing a vertical curve radius in the effected section. Be sure option at | Title 1 | VIEW - 6 | has been executed first if applicable.
| Title 7.6 FrmTitle 76 | displays extra tension requirements at the take-up summarizing the maximum values obtained from |Title 7.5. |
"2 CAUTION at Title 7.6 - Check need for greater take-up tension." reflects these considerations at . Screw take ups are not recommended by the writer. | TITLE 8 - Intermediate Tensions FrmTitle8 | displays running tensions for both top and bottom sides.
This display is particularly useful for planning location of booster drives. Terminal tensions displayed at | Title 7 | can be located on the tension profile. For example: notice that the | BELT TENSION AT TAKUP | seen in |line 6 | TITLE 7.6 | above occurs in | TITLE 8 | BOTTOM TENSION | Line 12 |
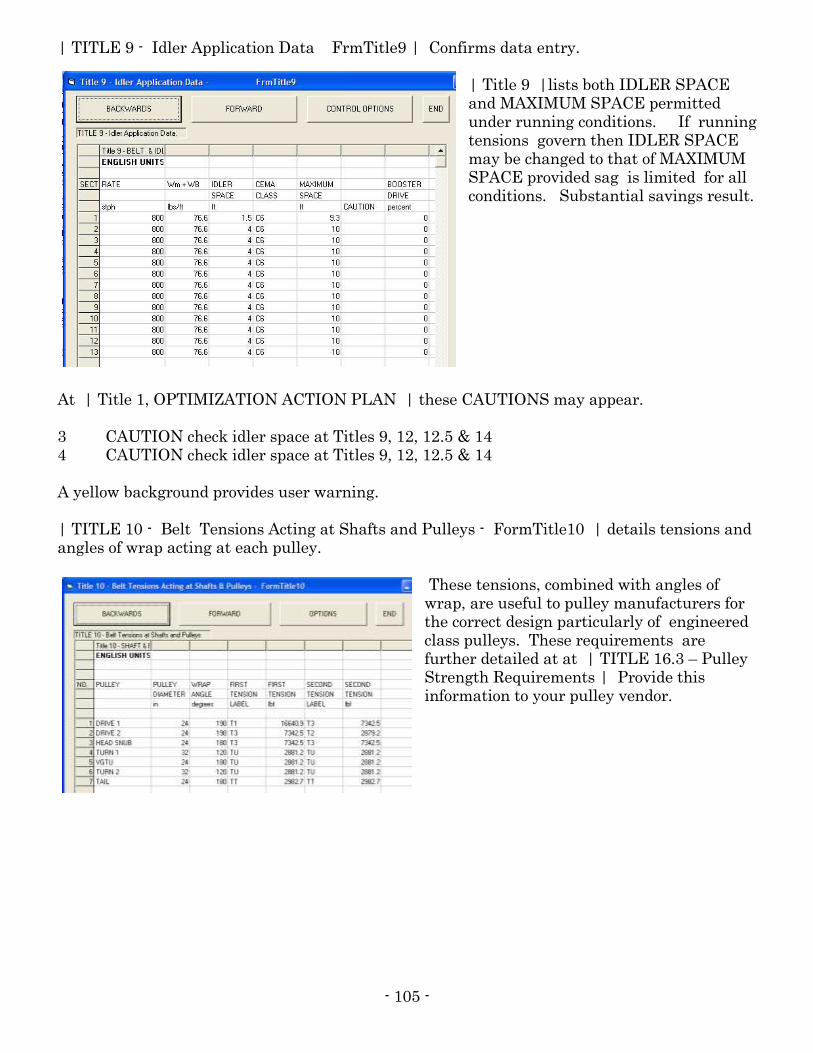
- 105 -
| TITLE 9 - Idler Application Data FrmTitle9 | Confirms data entry. | Title 9 |lists both IDLER SPACE and MAXIMUM SPACE permitted under running conditions. If running tensions govern then IDLER SPACE may be changed to that of MAXIMUM SPACE provided sag is limited for all conditions. Substantial savings result.
At | Title 1, OPTIMIZATION ACTION PLAN | these CAUTIONS may appear. 3 CAUTION check idler space at Titles 9, 12, 12.5 & 14 4 CAUTION check idler space at Titles 9, 12, 12.5 & 14 A yellow background provides user warning. | TITLE 10 - Belt Tensions Acting at Shafts and Pulleys - FormTitle10 | details tensions and angles of wrap acting at each pulley.
These tensions, combined with angles of wrap, are useful to pulley manufacturers for the correct design particularly of engineered class pulleys. These requirements are further detailed at at | TITLE 16.3 – Pulley Strength Requirements | Provide this information to your pulley vendor.
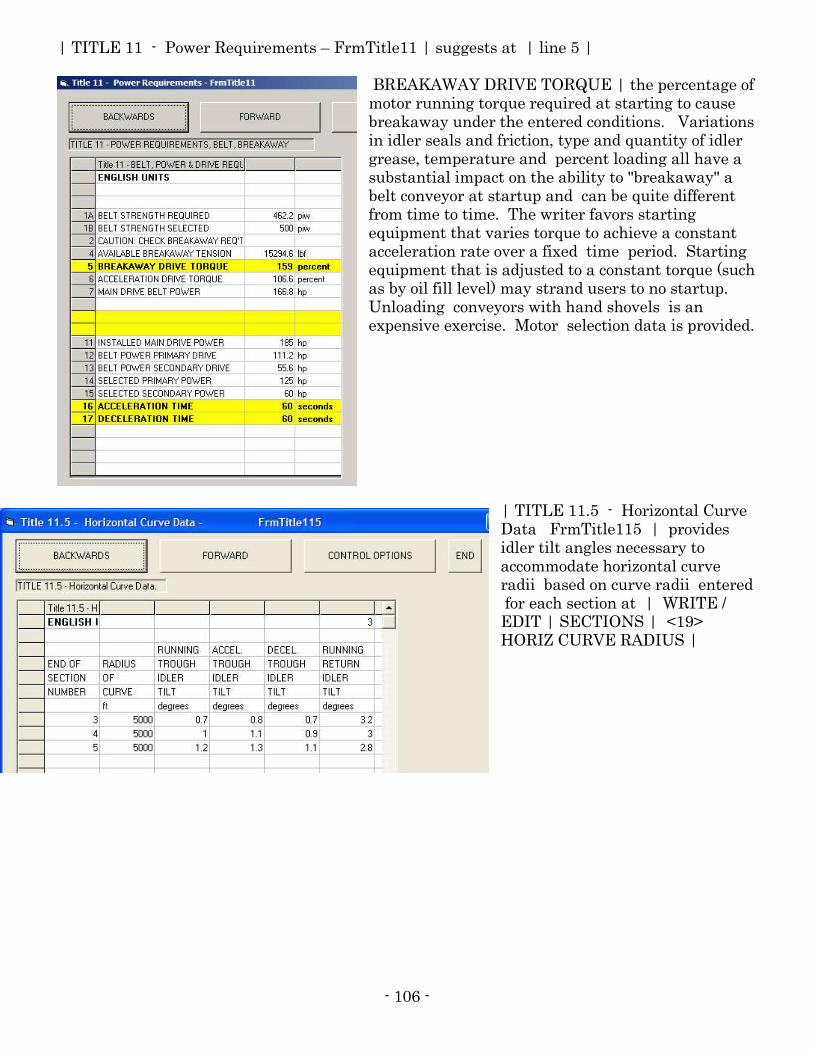
- 106 -
| TITLE 11 - Power Requirements – FrmTitle11 | suggests at | line 5 |
BREAKAWAY DRIVE TORQUE | the percentage of motor running torque required at starting to cause breakaway under the entered conditions. Variations in idler seals and friction, type and quantity of idler grease, temperature and percent loading all have a substantial impact on the ability to "breakaway" a belt conveyor at startup and can be quite different from time to time. The writer favors starting equipment that varies torque to achieve a constant acceleration rate over a fixed time period. Starting equipment that is adjusted to a constant torque (such as by oil fill level) may strand users to no startup. Unloading conveyors with hand shovels is an expensive exercise. Motor selection data is provided.
| TITLE 11.5 - Horizontal Curve Data FrmTitle115 | provides idler tilt angles necessary to accommodate horizontal curve radii based on curve radii entered for each section at | WRITE / EDIT | SECTIONS | <19> HORIZ CURVE RADIUS |
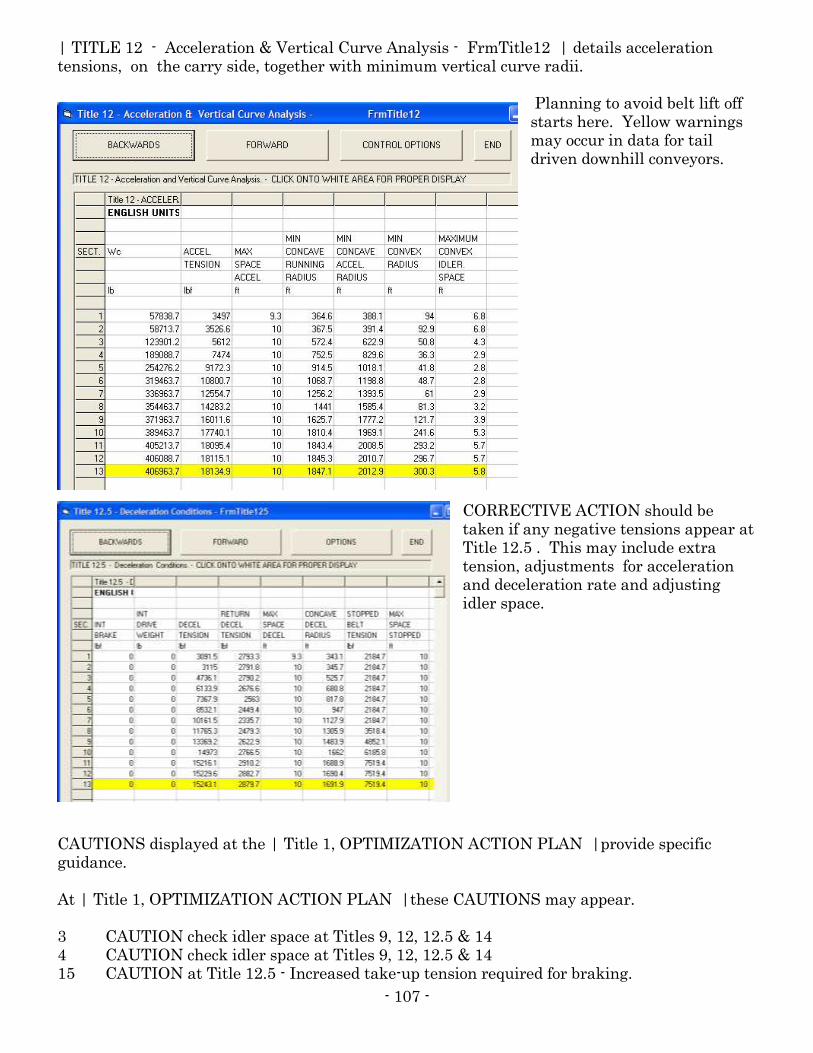
- 107 -
| TITLE 12 - Acceleration & Vertical Curve Analysis - FrmTitle12 | details acceleration tensions, on the carry side, together with minimum vertical curve radii.
Planning to avoid belt lift off starts here. Yellow warnings may occur in data for tail driven downhill conveyors.
CORRECTIVE ACTION should be taken if any negative tensions appear at Title 12.5 . This may include extra tension, adjustments for acceleration and deceleration rate and adjusting idler space.
CAUTIONS displayed at the | Title 1, OPTIMIZATION ACTION PLAN |provide specific guidance. At | Title 1, OPTIMIZATION ACTION PLAN |these CAUTIONS may appear. 3 CAUTION check idler space at Titles 9, 12, 12.5 & 14 4 CAUTION check idler space at Titles 9, 12, 12.5 & 14 15 CAUTION at Title 12.5 - Increased take-up tension required for braking.
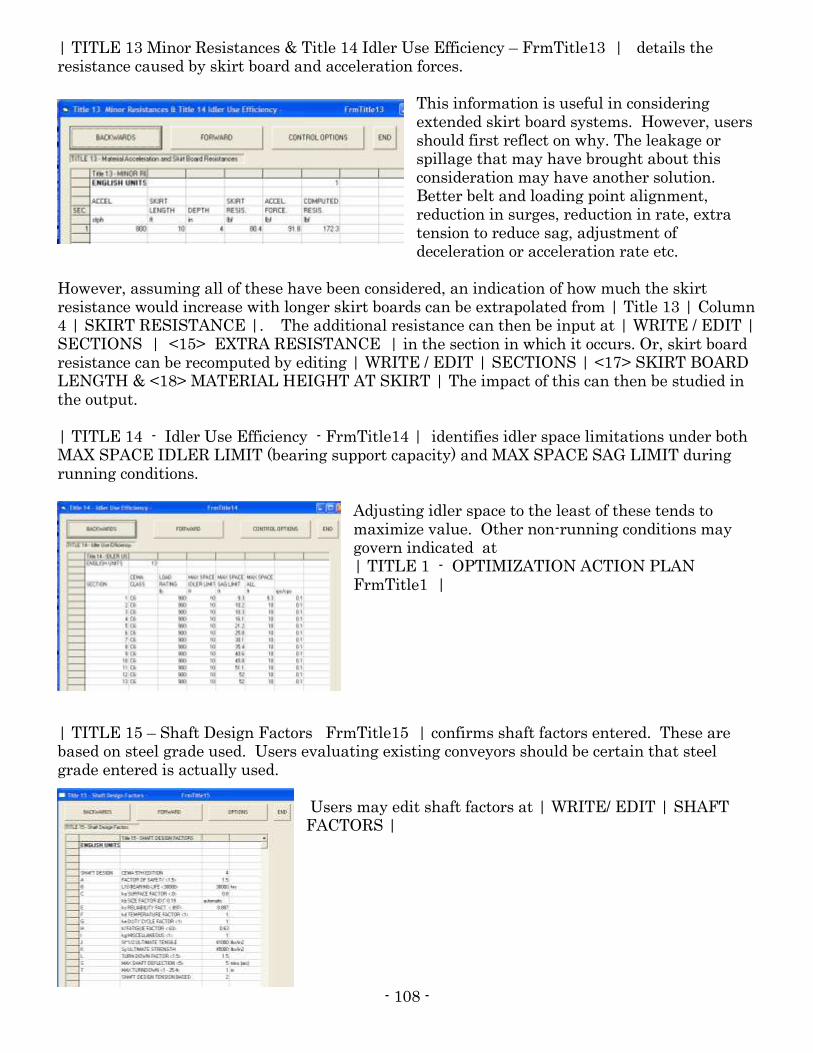
- 108 -
| TITLE 13 Minor Resistances & Title 14 Idler Use Efficiency – FrmTitle13 | details the resistance caused by skirt board and acceleration forces.
This information is useful in considering extended skirt board systems. However, users should first reflect on why. The leakage or spillage that may have brought about this consideration may have another solution. Better belt and loading point alignment, reduction in surges, reduction in rate, extra tension to reduce sag, adjustment of deceleration or acceleration rate etc.
However, assuming all of these have been considered, an indication of how much the skirt resistance would increase with longer skirt boards can be extrapolated from | Title 13 | Column 4 | SKIRT RESISTANCE |. The additional resistance can then be input at | WRITE / EDIT | SECTIONS | <15> EXTRA RESISTANCE | in the section in which it occurs. Or, skirt board resistance can be recomputed by editing | WRITE / EDIT | SECTIONS | <17> SKIRT BOARD LENGTH & <18> MATERIAL HEIGHT AT SKIRT | The impact of this can then be studied in the output. | TITLE 14 - Idler Use Efficiency - FrmTitle14 | identifies idler space limitations under both MAX SPACE IDLER LIMIT (bearing support capacity) and MAX SPACE SAG LIMIT during running conditions.
Adjusting idler space to the least of these tends to maximize value. Other non-running conditions may govern indicated at | TITLE 1 - OPTIMIZATION ACTION PLAN FrmTitle1 |
| TITLE 15 – Shaft Design Factors FrmTitle15 | confirms shaft factors entered. These are based on steel grade used. Users evaluating existing conveyors should be certain that steel grade entered is actually used.
Users may edit shaft factors at | WRITE/ EDIT | SHAFT FACTORS |
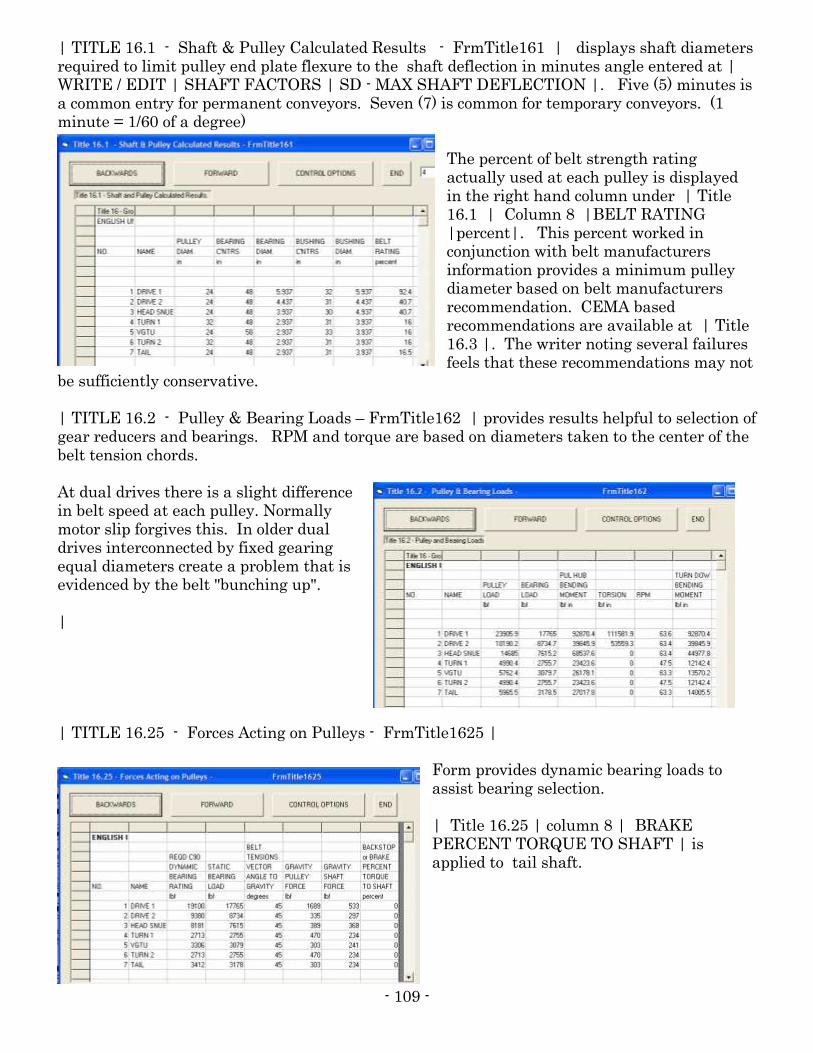
- 109 -
| TITLE 16.1 - Shaft & Pulley Calculated Results - FrmTitle161 | displays shaft diameters required to limit pulley end plate flexure to the shaft deflection in minutes angle entered at | WRITE / EDIT | SHAFT FACTORS | SD - MAX SHAFT DEFLECTION |. Five (5) minutes is a common entry for permanent conveyors. Seven (7) is common for temporary conveyors. (1 minute = 1/60 of a degree)
The percent of belt strength rating actually used at each pulley is displayed in the right hand column under | Title 16.1 | Column 8 |BELT RATING |percent|. This percent worked in conjunction with belt manufacturers information provides a minimum pulley diameter based on belt manufacturers recommendation. CEMA based recommendations are available at | Title 16.3 |. The writer noting several failures feels that these recommendations may not
be sufficiently conservative. | TITLE 16.2 - Pulley & Bearing Loads – FrmTitle162 | provides results helpful to selection of gear reducers and bearings. RPM and torque are based on diameters taken to the center of the belt tension chords. At dual drives there is a slight difference in belt speed at each pulley. Normally motor slip forgives this. In older dual drives interconnected by fixed gearing equal diameters create a problem that is evidenced by the belt "bunching up". | | TITLE 16.25 - Forces Acting on Pulleys - FrmTitle1625 |
Form provides dynamic bearing loads to assist bearing selection. | Title 16.25 | column 8 | BRAKE PERCENT TORQUE TO SHAFT | is applied to tail shaft.
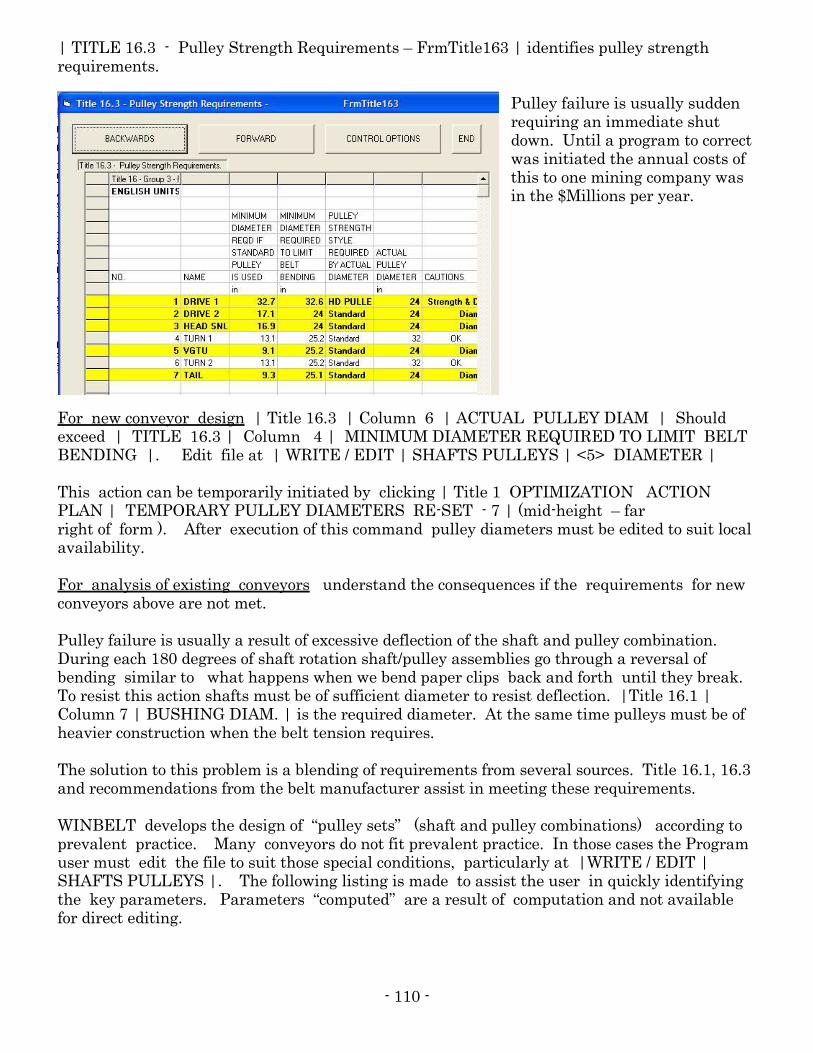
- 110 -
| TITLE 16.3 - Pulley Strength Requirements – FrmTitle163 | identifies pulley strength requirements.
Pulley failure is usually sudden requiring an immediate shut down. Until a program to correct was initiated the annual costs of this to one mining company was in the $Millions per year.
For new conveyor design | Title 16.3 | Column 6 | ACTUAL PULLEY DIAM | Should exceed | TITLE 16.3 | Column 4 | MINIMUM DIAMETER REQUIRED TO LIMIT BELT BENDING |. Edit file at | WRITE / EDIT | SHAFTS PULLEYS | <5> DIAMETER | This action can be temporarily initiated by clicking | Title 1 OPTIMIZATION ACTION PLAN | TEMPORARY PULLEY DIAMETERS RE-SET - 7 | (mid-height – far right of form ). After execution of this command pulley diameters must be edited to suit local availability. For analysis of existing conveyors understand the consequences if the requirements for new conveyors above are not met. Pulley failure is usually a result of excessive deflection of the shaft and pulley combination. During each 180 degrees of shaft rotation shaft/pulley assemblies go through a reversal of bending similar to what happens when we bend paper clips back and forth until they break. To resist this action shafts must be of sufficient diameter to resist deflection. |Title 16.1 | Column 7 | BUSHING DIAM. | is the required diameter. At the same time pulleys must be of heavier construction when the belt tension requires. The solution to this problem is a blending of requirements from several sources. Title 16.1, 16.3 and recommendations from the belt manufacturer assist in meeting these requirements. WINBELT develops the design of “pulley sets” (shaft and pulley combinations) according to prevalent practice. Many conveyors do not fit prevalent practice. In those cases the Program user must edit the file to suit those special conditions, particularly at |WRITE / EDIT | SHAFTS PULLEYS |. The following listing is made to assist the user in quickly identifying the key parameters. Parameters “computed” are a result of computation and not available for direct editing.
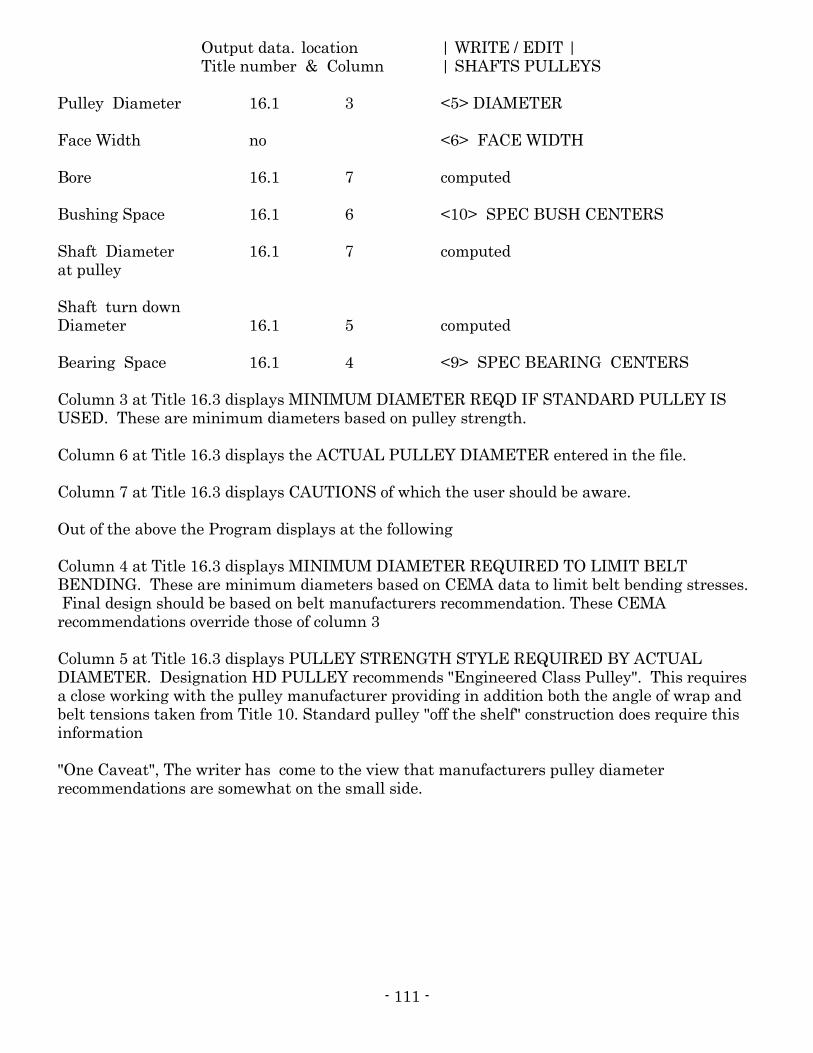
- 111 -
Output data. location | WRITE / EDIT | Title number & Column | SHAFTS PULLEYS Pulley Diameter 16.1 3 <5> DIAMETER Face Width no <6> FACE WIDTH Bore 16.1 7 computed Bushing Space 16.1 6 <10> SPEC BUSH CENTERS Shaft Diameter 16.1 7 computed at pulley Shaft turn down Diameter 16.1 5 computed Bearing Space 16.1 4 <9> SPEC BEARING CENTERS Column 3 at Title 16.3 displays MINIMUM DIAMETER REQD IF STANDARD PULLEY IS USED. These are minimum diameters based on pulley strength. Column 6 at Title 16.3 displays the ACTUAL PULLEY DIAMETER entered in the file. Column 7 at Title 16.3 displays CAUTIONS of which the user should be aware. Out of the above the Program displays at the following Column 4 at Title 16.3 displays MINIMUM DIAMETER REQUIRED TO LIMIT BELT BENDING. These are minimum diameters based on CEMA data to limit belt bending stresses. Final design should be based on belt manufacturers recommendation. These CEMA recommendations override those of column 3 Column 5 at Title 16.3 displays PULLEY STRENGTH STYLE REQUIRED BY ACTUAL DIAMETER. Designation HD PULLEY recommends "Engineered Class Pulley". This requires a close working with the pulley manufacturer providing in addition both the angle of wrap and belt tensions taken from Title 10. Standard pulley "off the shelf" construction does require this information "One Caveat", The writer has come to the view that manufacturers pulley diameter recommendations are somewhat on the small side.

- 112 -
| TITLE 17 – Acceleration Data - FrmTitle17 | provides acceleration information.
This output enables comparison of CEMA Problems published in CEMA Editions 2 to 5 to output of the same Problems computed by WINBELT. This is one check used to check Program accuracy. The equivalent weights may be adjusted at | WRITE / EDIT | PARAMETERS | <25>, <29> to <32> | Material weight discharged during deceleration | Title 17 | line 23 | is useful for design of chute work and planning of conveyors in series.
( What happens to material discharged from conveyor 1 when following conveyor 2 fails?) | TITLE 18 - Miscellaneous - FrmTitle18 |.
A theoretical value for take-up travel can be gleaned from data at | Title 18 |lines 20 – 22 |. Dividing the belt stretch difference between acceleration and deceleration conditions by two yields the theoretical travel for the take-up pulley assuming a conventional vertical gravity take-up.
End of Subject

- 113 -
D7A
COST OPTIMIZATION TITLE 19 – Component Price Estimate – FrmTitle19 | provides a breakdown of the price of components. (Be sure to move the slider bar up and down.)
This is cost estimating in real-time. That is, the prices are computed concurrently with each computation. The lower portion of |Title 19 | lists the price multipliers entered in the file. By proportionately adjusting the same multipliers at | WRITE / EDIT | PRICE MULTIPLIERS | a proportionate change in output prices at | Title 19 | is obtained. A calculator for determining price multipliers is available from the menu bar at | UTILITIES | DETERMINE PRICE MULTIPLIERS |. The actual change of price multipliers within a file must be
made at | WRITE / EDIT | PRICE MULTIPLIERS | also at the menu bar. | TITLE 19.5 - Estimated Component Weights – FrmTitle195 | provides a weight estimate of components with and without the weight of material. These numbers are useful for design of the support steel system, Programs CTRUSS, CBENT and TOWER enable a continuation of the design process.
These numbers find use in structural design, estimating of shipping, assembly and millwright costs. Some firms very successfully estimate the sale price of millwright labor based on man hours per hundred weight. |
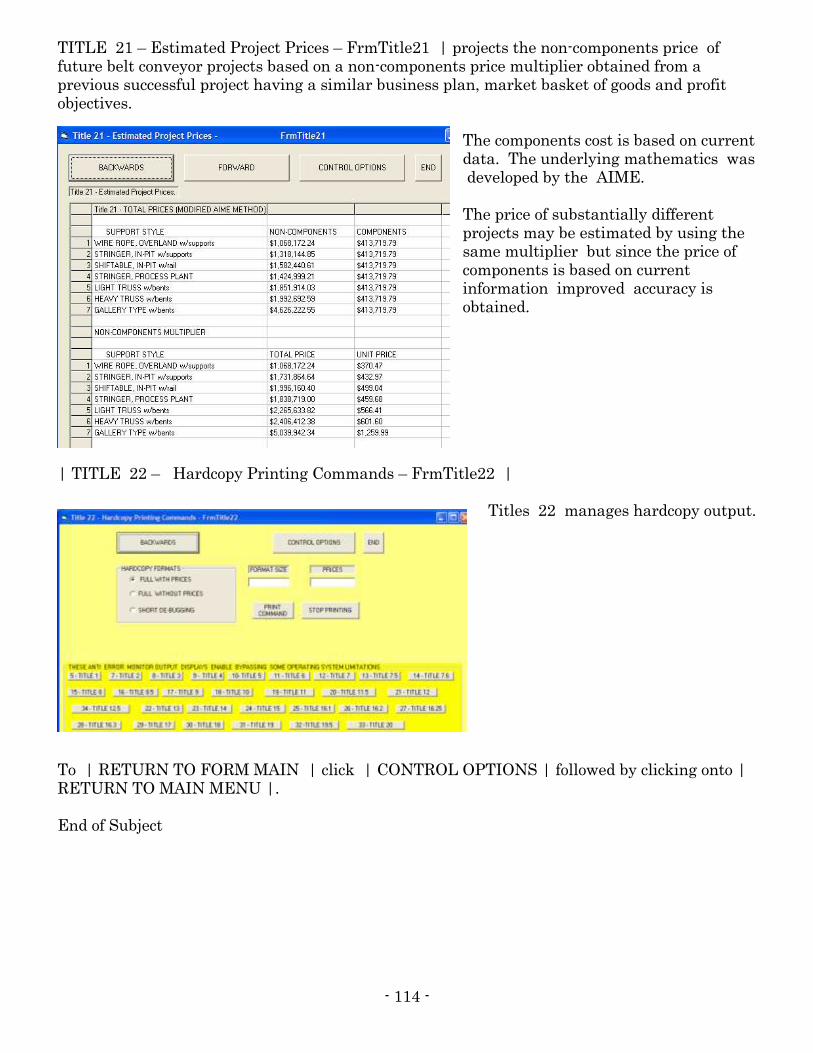
- 114 -
TITLE 21 – Estimated Project Prices – FrmTitle21 | projects the non-components price of future belt conveyor projects based on a non-components price multiplier obtained from a previous successful project having a similar business plan, market basket of goods and profit objectives.
The components cost is based on current data. The underlying mathematics was developed by the AIME. The price of substantially different projects may be estimated by using the same multiplier but since the price of components is based on current information improved accuracy is obtained.
| TITLE 22 – Hardcopy Printing Commands – FrmTitle22 |
Titles 22 manages hardcopy output.
To | RETURN TO FORM MAIN | click | CONTROL OPTIONS | followed by clicking onto | RETURN TO MAIN MENU |. End of Subject
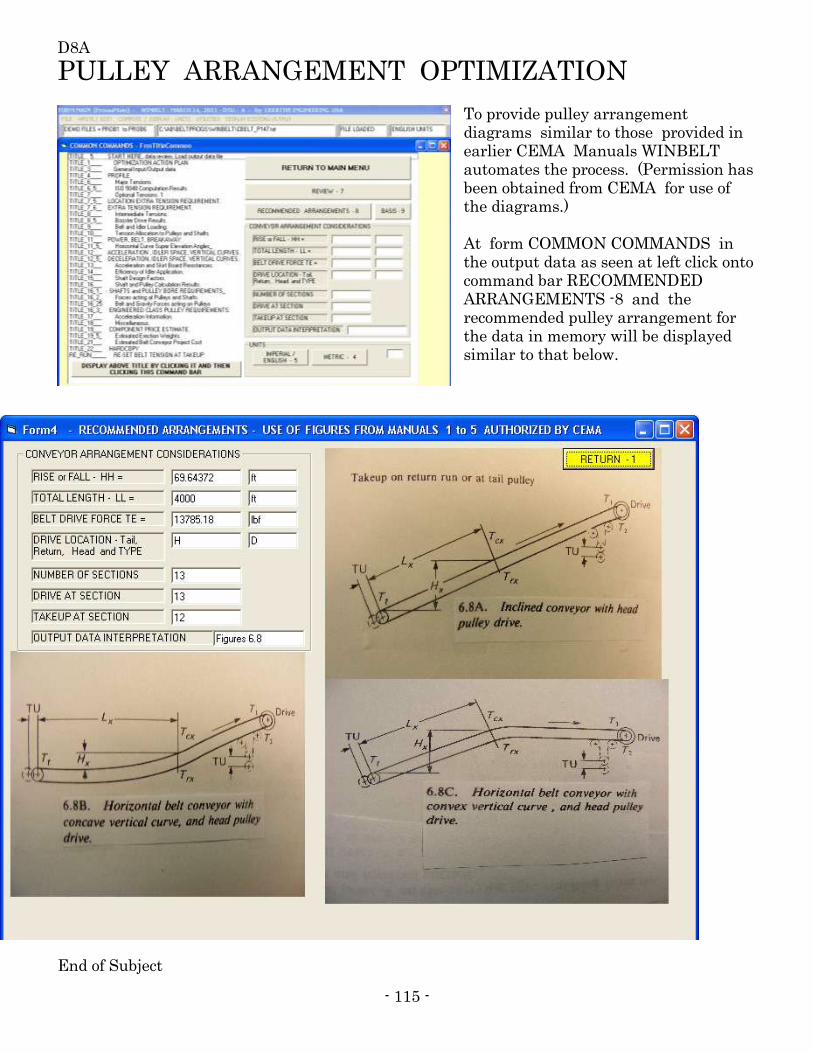
- 115 -
D8A
PULLEY ARRANGEMENT OPTIMIZATION
To provide pulley arrangement diagrams similar to those provided in earlier CEMA Manuals WINBELT automates the process. (Permission has been obtained from CEMA for use of the diagrams.) At form COMMON COMMANDS in the output data as seen at left click onto command bar RECOMMENDED ARRANGEMENTS -8 and the recommended pulley arrangement for the data in memory will be displayed similar to that below.
End of Subject
- 116 -
F5A
DETERMINING PRICE MULTIPLIERS From the menu bar | UTILITIES | DETERMINE PRICE MULTIPLIERS| accesses a convenient routine for determining price multipliers for 8 different components. Lets use idlers as an example: CLICK | UTILITIES | DETERMINE PRICE MULTIPLIERS| UNITS SELECTION | CLICK = 1 - ENGLISH | COMPONENT CATEGORY SELECTION | CLICK = 4 - IDLER PRICES | MULTIPLIER | CLICK = 1 | WIDTH OF BELT (under) | CLICK = 36 (inches) CEMA IDLER CLASS (under) | CLICK = C6 BLANK (ignore) CLICK | 2 - COMPUTE | Using a price multiplier of 1 at | WRITE / EDIT | PRICE MULTIPLIERS | NIS - TROUGHING AND RETURN IDLERS | The program would compute the price of each troughing idler at $322.00 and each return idler at $157. Using simple proportional adjustments the MULTIPLIER can be used to cause prices you want. For multipliers to actually function they must be included in the working files. For example: Using a price multiplier of .5 at | WRITE / EDIT | PRICE MULTIPLIERS | NIS - TROUGHING AND RETURN IDLERS | The program would compute the price of each troughing idler at $161.00 and each return idler at $78.50. To function within any Program file the multiplier you want must be edited into your file at | WRITE / EDIT | PRICE MULTIPLIERS | NIS - TROUGHING AND RETURN IDLERS | The procedure is similar for other component categories. Include components most associated with motors such as high speed couplings, vee belt drives and motor bases with motor prices Include components most associated with pulley speed such as low speed couplings, backstop, gear reducer support with price of gear reducer. Further detail is provided at BELTHELP accessed by keying F1. End of Subject
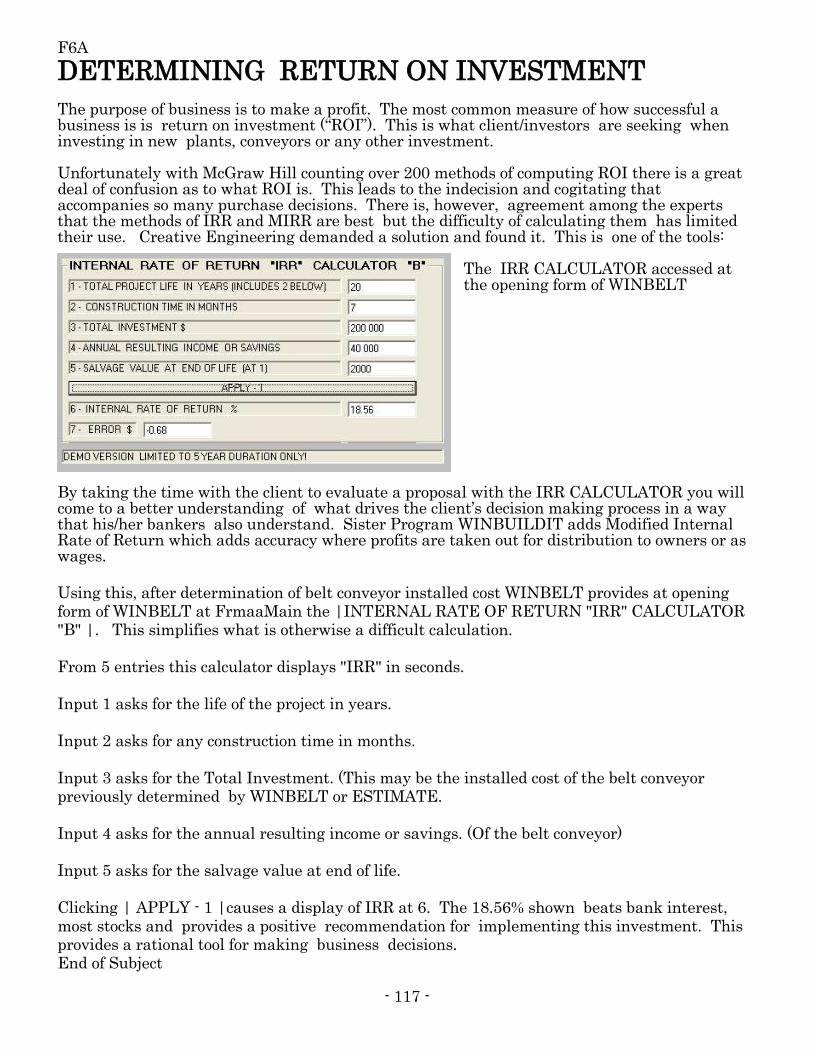
- 117 -
F6A
DETERMINING RETURN ON INVESTMENT The purpose of business is to make a profit. The most common measure of how successful a business is is return on investment (“ROI”). This is what client/investors are seeking when investing in new plants, conveyors or any other investment. Unfortunately with McGraw Hill counting over 200 methods of computing ROI there is a great deal of confusion as to what ROI is. This leads to the indecision and cogitating that accompanies so many purchase decisions. There is, however, agreement among the experts that the methods of IRR and MIRR are best but the difficulty of calculating them has limited their use. Creative Engineering demanded a solution and found it. This is one of the tools:
The IRR CALCULATOR accessed at the opening form of WINBELT
By taking the time with the client to evaluate a proposal with the IRR CALCULATOR you will come to a better understanding of what drives the client’s decision making process in a way that his/her bankers also understand. Sister Program WINBUILDIT adds Modified Internal Rate of Return which adds accuracy where profits are taken out for distribution to owners or as wages. Using this, after determination of belt conveyor installed cost WINBELT provides at opening form of WINBELT at FrmaaMain the |INTERNAL RATE OF RETURN "IRR" CALCULATOR "B" |. This simplifies what is otherwise a difficult calculation. From 5 entries this calculator displays "IRR" in seconds. Input 1 asks for the life of the project in years. Input 2 asks for any construction time in months. Input 3 asks for the Total Investment. (This may be the installed cost of the belt conveyor previously determined by WINBELT or ESTIMATE. Input 4 asks for the annual resulting income or savings. (Of the belt conveyor) Input 5 asks for the salvage value at end of life. Clicking | APPLY - 1 |causes a display of IRR at 6. The 18.56% shown beats bank interest, most stocks and provides a positive recommendation for implementing this investment. This provides a rational tool for making business decisions. End of Subject
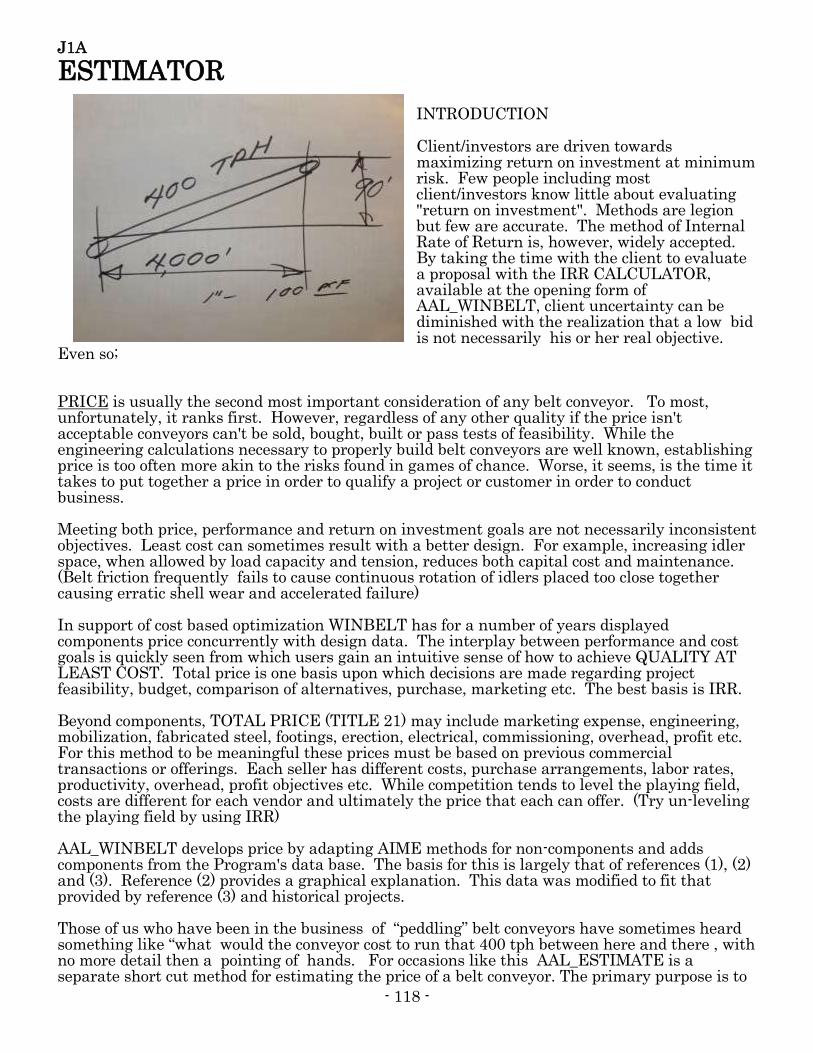
- 118 -
J1A
ESTIMATOR INTRODUCTION Client/investors are driven towards maximizing return on investment at minimum risk. Few people including most client/investors know little about evaluating "return on investment". Methods are legion but few are accurate. The method of Internal Rate of Return is, however, widely accepted. By taking the time with the client to evaluate a proposal with the IRR CALCULATOR, available at the opening form of AAL_WINBELT, client uncertainty can be diminished with the realization that a low bid is not necessarily his or her real objective.
Even so; PRICE is usually the second most important consideration of any belt conveyor. To most, unfortunately, it ranks first. However, regardless of any other quality if the price isn't acceptable conveyors can't be sold, bought, built or pass tests of feasibility. While the engineering calculations necessary to properly build belt conveyors are well known, establishing price is too often more akin to the risks found in games of chance. Worse, it seems, is the time it takes to put together a price in order to qualify a project or customer in order to conduct business. Meeting both price, performance and return on investment goals are not necessarily inconsistent objectives. Least cost can sometimes result with a better design. For example, increasing idler space, when allowed by load capacity and tension, reduces both capital cost and maintenance. (Belt friction frequently fails to cause continuous rotation of idlers placed too close together causing erratic shell wear and accelerated failure) In support of cost based optimization WINBELT has for a number of years displayed components price concurrently with design data. The interplay between performance and cost goals is quickly seen from which users gain an intuitive sense of how to achieve QUALITY AT LEAST COST. Total price is one basis upon which decisions are made regarding project feasibility, budget, comparison of alternatives, purchase, marketing etc. The best basis is IRR. Beyond components, TOTAL PRICE (TITLE 21) may include marketing expense, engineering, mobilization, fabricated steel, footings, erection, electrical, commissioning, overhead, profit etc. For this method to be meaningful these prices must be based on previous commercial transactions or offerings. Each seller has different costs, purchase arrangements, labor rates, productivity, overhead, profit objectives etc. While competition tends to level the playing field, costs are different for each vendor and ultimately the price that each can offer. (Try un-leveling the playing field by using IRR) AAL_WINBELT develops price by adapting AIME methods for non-components and adds components from the Program's data base. The basis for this is largely that of references (1), (2) and (3). Reference (2) provides a graphical explanation. This data was modified to fit that provided by reference (3) and historical projects. Those of us who have been in the business of “peddling” belt conveyors have sometimes heard something like “what would the conveyor cost to run that 400 tph between here and there , with no more detail then a pointing of hands. For occasions like this AAL_ESTIMATE is a separate short cut method for estimating the price of a belt conveyor. The primary purpose is to
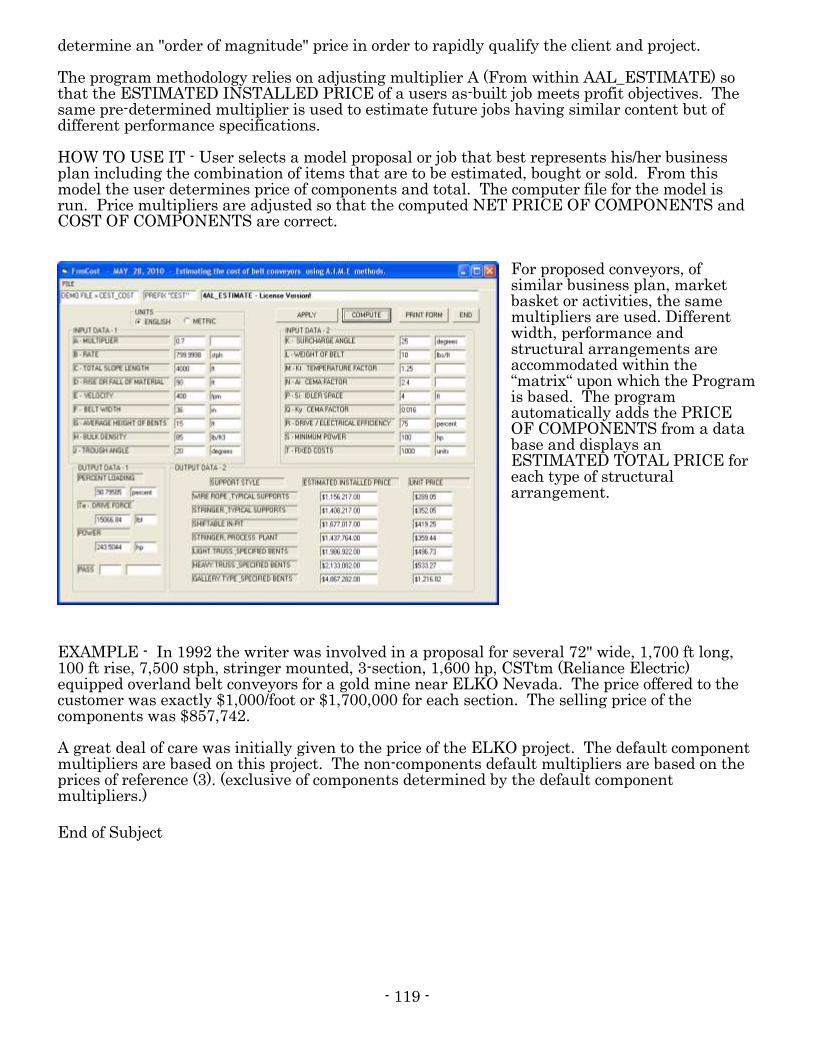
- 119 -
determine an "order of magnitude" price in order to rapidly qualify the client and project. The program methodology relies on adjusting multiplier A (From within AAL_ESTIMATE) so that the ESTIMATED INSTALLED PRICE of a users as-built job meets profit objectives. The same pre-determined multiplier is used to estimate future jobs having similar content but of different performance specifications. HOW TO USE IT - User selects a model proposal or job that best represents his/her business plan including the combination of items that are to be estimated, bought or sold. From this model the user determines price of components and total. The computer file for the model is run. Price multipliers are adjusted so that the computed NET PRICE OF COMPONENTS and COST OF COMPONENTS are correct.
For proposed conveyors, of similar business plan, market basket or activities, the same multipliers are used. Different width, performance and structural arrangements are accommodated within the “matrix“ upon which the Program is based. The program automatically adds the PRICE OF COMPONENTS from a data base and displays an ESTIMATED TOTAL PRICE for each type of structural arrangement.
EXAMPLE - In 1992 the writer was involved in a proposal for several 72" wide, 1,700 ft long, 100 ft rise, 7,500 stph, stringer mounted, 3-section, 1,600 hp, CSTtm (Reliance Electric) equipped overland belt conveyors for a gold mine near ELKO Nevada. The price offered to the customer was exactly $1,000/foot or $1,700,000 for each section. The selling price of the components was $857,742. A great deal of care was initially given to the price of the ELKO project. The default component multipliers are based on this project. The non-components default multipliers are based on the prices of reference (3). (exclusive of components determined by the default component multipliers.) End of Subject

- 120 -
K2A
HAULPLAN OPEN PIT MINING belt conveyors
compete with other material handling options. Sorting out which method is best is a time consuming and costly process both for the belt conveyor user and supporting vendors. HAULPLAN determines the most economic plan for mining a quarry by comparing the advantage of a new HAULPLAN I over an old HAULPLAN II in terms of its INTERNAL RATE OF RETURN and NPV advantage. There are few disputes over the acceptability of these metrics. To move material from quarry face to mill or waste dump, pit and quarry operators frequently use
wheel loaders, haul trucks, scrapers, dozers and excavators in some combination with belt conveyors and crushing plants. Selecting the right combination is key to obtaining maximum economic advantage. Practical considerations may limit possible machinery arrangements. Wheel loaders, dozers and scrapers can each excavate and move material while trucks and belt conveyors are limited to transport. Other machines, such as power shovels, may be used to excavate and load. The feed to belt conveyors must be even and limited in size. Aside from material properties these considerations may dictate that crushing precede a belt conveyor. With rising energy, labor and equipment costs quarry managers are increasingly looking to the advantages of in-pit crushing and belt conveying. Each quarry is different. haul length, rate and life of quarry are but a few of the parameters that vary. Time value of money can't be ignored. To be certain of direction the investment and costs of an in-pit crusher and belt conveyor system must be weighed against the investment and costs of haul vehicles, haul roads, maintenance and other charges. Changing energy costs must be weighed. The difficulty of this analysis is traditionally overwhelming. HAULPLAN is an aid to this planning and financial analysis. Costs of alternative arrangements are compared so that the user can move in an intelligent direction toward maximizing Net-Present-Value and Internal-Rate-of-Return, bench marks, the metrics preferred by financial analysts. Computation of these measures is automatic and do not require a high level of skill. Program develops costs for HAULPLAN I as a combination of haul distances LAC for haul trucks, AC for wheel loaders, and P for belt conveyors. If any of these haul distances is zero (0) then the cost of that portion of the haul is zero. For belt haul distance P program extracts belt performance data and costs from those listed under 50 - BELT CONVEYOR SYSTEM INPUT DATA. For truck haul distance AC program extracts truck data from 60 - TRUCK INPUT DATA. For wheel loader haul distance LAC performance data is extracted from 70 - WHEEL LOADER INPUT DATA. Data under 40 - COMMON INPUT DATA fixes the mining rate for all haul elements of both HAUL PLAN I and II. In similar fashion program develops costs for HAUL PLAN II. Except for haul distances program uses the same data for wheel loaders and haul trucks as HAUL PLAN I. Within the program, terms "TRUCK" and "LOADER" carry the same parameters and can be
- 121 -
used to define other haulers such as scrapers and dozers. Or, the terms can be used to define different models and size equipment of the same type for both HAUL PLAN I and II. Machines that essentially don't haul, such as crawler mounted excavators, or blasting costs can be introduced using variables EX1 and EX2. These are listed under 40 -COMMON INPUT DATA, and apply respectively to HAUL PLAN I and HAUL PLAN II. With data entered computation is complete and OUTPUT RESULTS displayed in milliseconds. Various arrangements can then be compared by editing variables. Over 72 scenarios can be examined. In the following comparisons character ">" indicates direction of flow. HAUL PLAN I - SOME POSSIBLE NEW OPEN PIT ARRANGEMENTS. 1 Excavator > truck > stationary crusher or waste dump. 2 Excavator > truck > in-pit crusher > belt conveyor > mill or waste dump. 3 Wheel loader > truck > stationary crusher or waste dump. 4 Wheel loader > truck > in-pit crusher > belt conveyor > mill or waste dump. 5 Wheel loader > stationary crusher. 6 Wheel loader > in-pit crusher > belt conveyor > mill or waste dump. 7 Scraper > hopper/feeder at mill. 8 Scraper > hopper/feeder > belt conveyor > mill. 9 Dozer > in-pit crusher > belt conveyor > mill. 10 Dozer > stationary crusher at mill. 11 An individual truck, wheel loader, dozer or scraper haul. 12 An individual belt conveyor haul. HAUL PLAN II - SOME POSSIBLE EXISTING or OLD OPEN PIT ARRANGEMENTS. 21 Excavator > truck > stationary crusher or waste dump. 22 Wheel loader > truck > stationary crusher or waste dump. 23 Wheel loader > stationary crusher. 24 Scraper > hopper/feeder > mill. 25 Dozer > hopper/feeder or stationary crusher at mill. 26 An individual truck, wheel loader, dozer or scraper haul. LOADER and TRUCK may be edited to define different sizes or manufacturers of equipment. Comparisons may be made of similar equipment for procurement or marketing purposes. EXAMPLE In example represented by file DEMO1 a cement plant is considering the installation of an 8,000 ft belt conveyor (Variable P) or using a 12,000 ft truck haul (AK). The $4,000,000 additional cost of the belt conveyor and hydraulic hoist is included in item M. Wheel loaders operate at a fixed 75 ft haul distance to either trucks or the portable hydraulic hoist combined with a mobile in-pit primary crushing plant. Favorable INTERNAL RATE OF RETURN indicates the advantage of HAUL PLAN I. Program accepts metric or imperial units. Examples available for Demo or template use are pre-written files CHAUL_DEMO1 . CHAUL should be included as a prefix to file names saved for use in HAULPLAN.
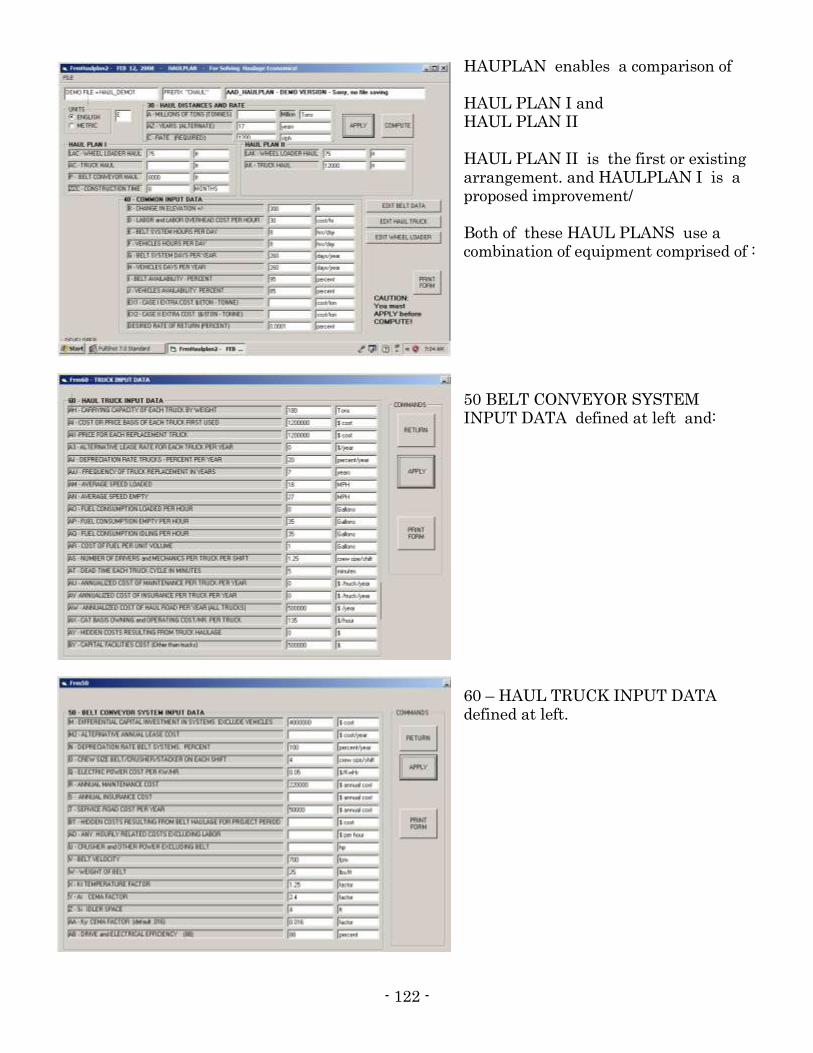
- 122 -
HAUPLAN enables a comparison of HAUL PLAN I and HAUL PLAN II HAUL PLAN II is the first or existing arrangement. and HAULPLAN I is a proposed improvement/ Both of these HAUL PLANS use a combination of equipment comprised of : 50 BELT CONVEYOR SYSTEM INPUT DATA defined at left and: 60 – HAUL TRUCK INPUT DATA defined at left.
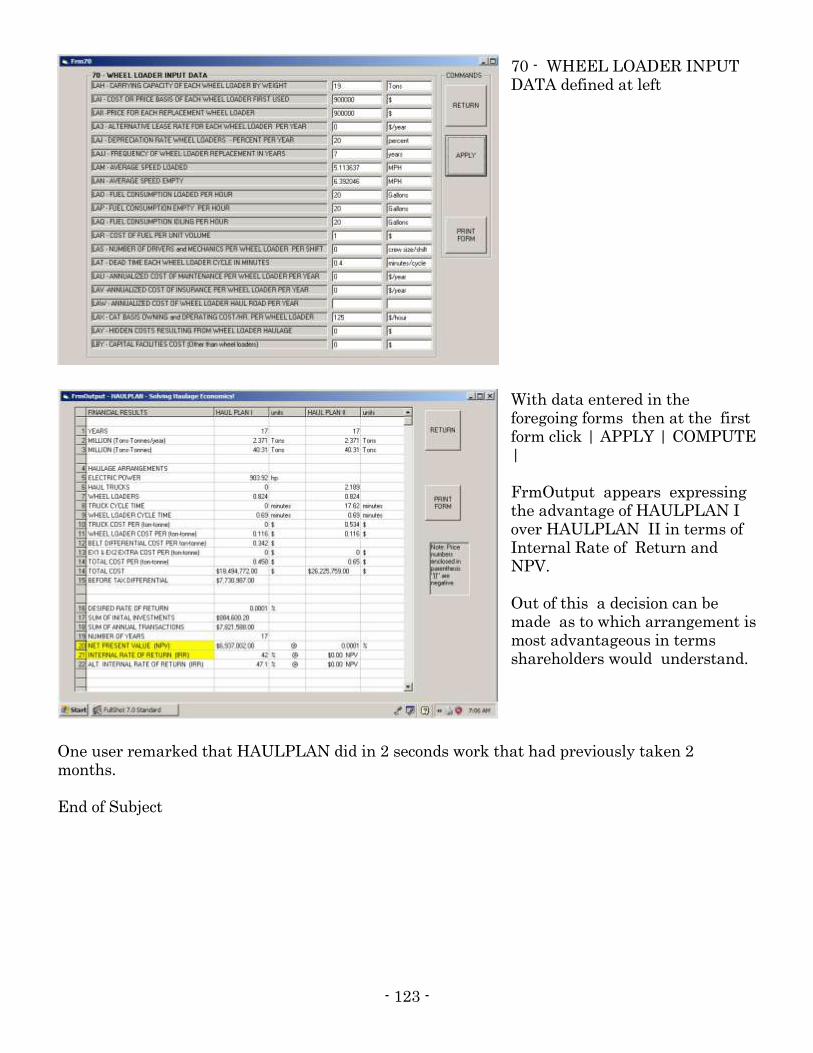
- 123 -
70 - WHEEL LOADER INPUT DATA defined at left With data entered in the foregoing forms then at the first form click | APPLY | COMPUTE | FrmOutput appears expressing the advantage of HAULPLAN I over HAULPLAN II in terms of Internal Rate of Return and NPV. Out of this a decision can be made as to which arrangement is most advantageous in terms shareholders would understand.
One user remarked that HAULPLAN did in 2 seconds work that had previously taken 2 months. End of Subject
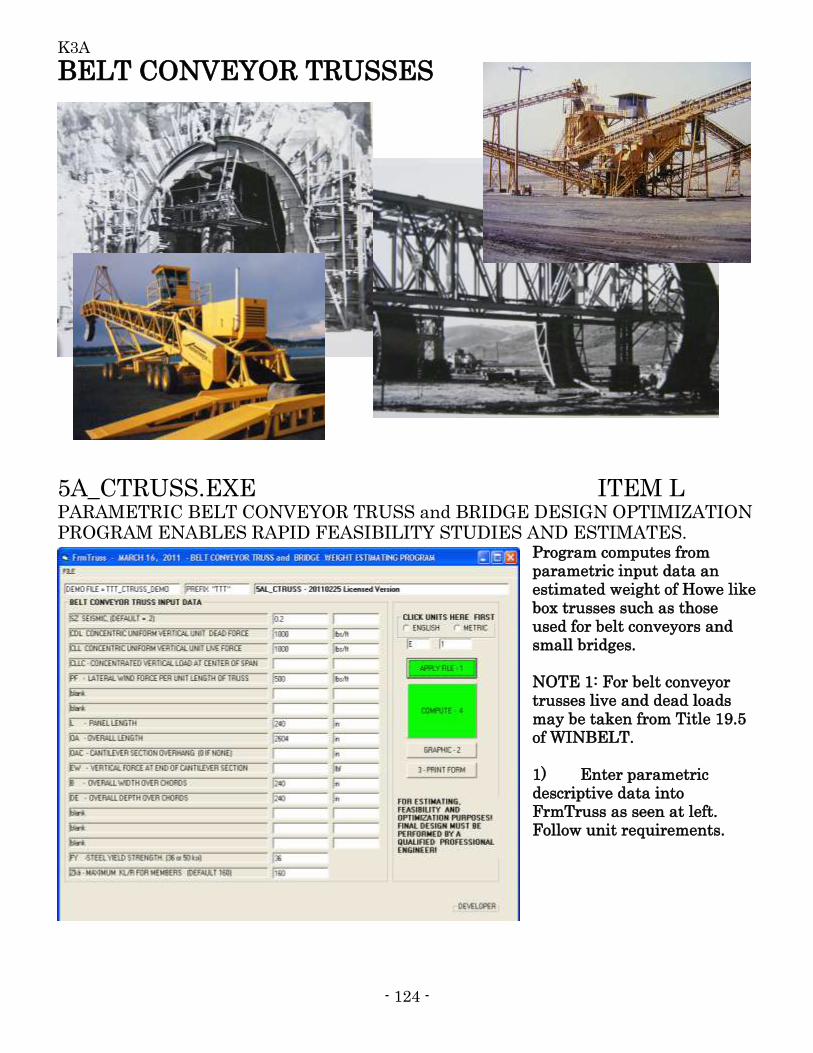
- 124 -
K3A
BELT CONVEYOR TRUSSES
5A_CTRUSS.EXE ITEM L PARAMETRIC BELT CONVEYOR TRUSS and BRIDGE DESIGN OPTIMIZATION PROGRAM ENABLES RAPID FEASIBILITY STUDIES AND ESTIMATES.
Program computes from parametric input data an estimated weight of Howe like box trusses such as those used for belt conveyors and small bridges. NOTE 1: For belt conveyor trusses live and dead loads may be taken from Title 19.5 of WINBELT. 1) Enter parametric descriptive data into FrmTruss as seen at left. Follow unit requirements.
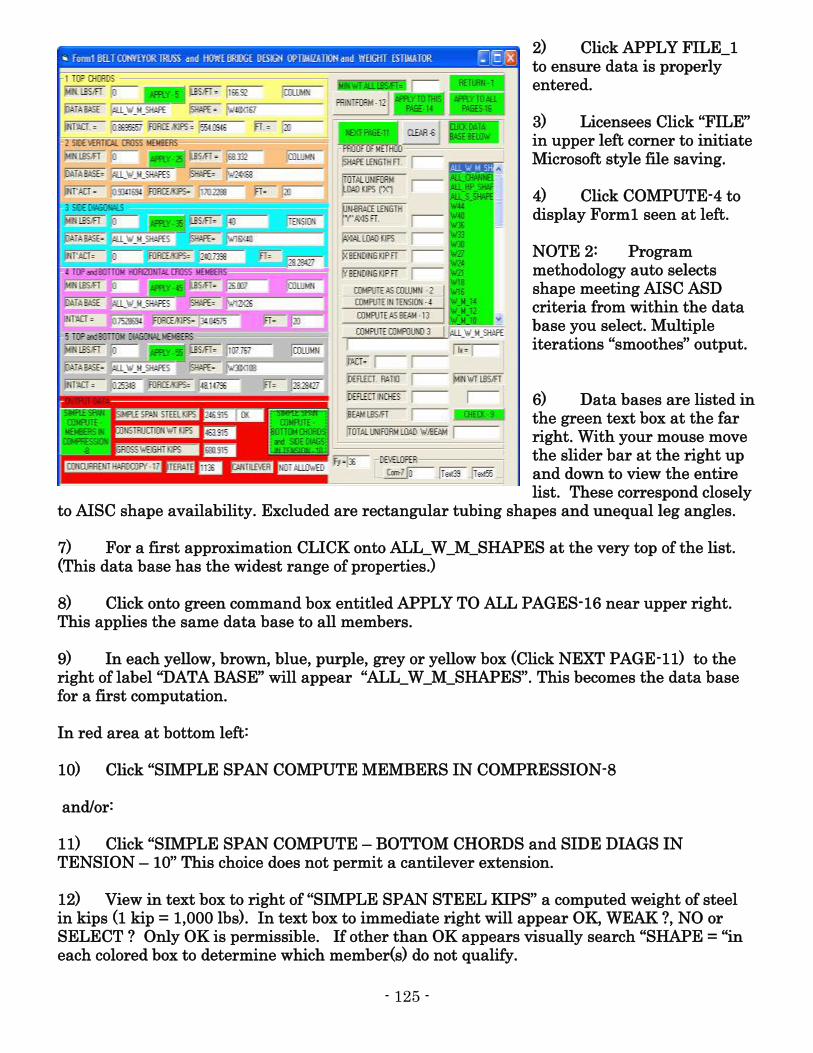
- 125 -
2) Click APPLY FILE_1 to ensure data is properly entered. 3) Licensees Click “FILE” in upper left corner to initiate Microsoft style file saving. 4) Click COMPUTE-4 to display Form1 seen at left. NOTE 2: Program methodology auto selects shape meeting AISC ASD criteria from within the data base you select. Multiple iterations “smoothes” output. 6) Data bases are listed in the green text box at the far right. With your mouse move the slider bar at the right up and down to view the entire list. These correspond closely
to AISC shape availability. Excluded are rectangular tubing shapes and unequal leg angles. 7) For a first approximation CLICK onto ALL_W_M_SHAPES at the very top of the list. (This data base has the widest range of properties.) 8) Click onto green command box entitled APPLY TO ALL PAGES-16 near upper right. This applies the same data base to all members. 9) In each yellow, brown, blue, purple, grey or yellow box (Click NEXT PAGE-11) to the right of label “DATA BASE” will appear “ALL_W_M_SHAPES”. This becomes the data base for a first computation. In red area at bottom left: 10) Click “SIMPLE SPAN COMPUTE MEMBERS IN COMPRESSION-8 and/or: 11) Click “SIMPLE SPAN COMPUTE – BOTTOM CHORDS and SIDE DIAGS IN TENSION – 10” This choice does not permit a cantilever extension. 12) View in text box to right of “SIMPLE SPAN STEEL KIPS” a computed weight of steel in kips (1 kip = 1,000 lbs). In text box to immediate right will appear OK, WEAK ?, NO or SELECT ? Only OK is permissible. If other than OK appears visually search “SHAPE = “in each colored box to determine which member(s) do not qualify.
- 126 -
If ALL_W_M_SHAPES has been selected and OK does not appear then the Program will not find a solution based in the entered INPUT parameters. Options are to adjust input data. If 10) above has been clicked and the input OAC CANTILEVER causes a bending moment requirement exceeding that available from the design of the simple span then “TOO LONG” will appear in the text box in the lower right of the red area. Cantilever spans are NOT ALLOWED for 11) above regardless. REAL TIME OPTIMIZATION Reducing weight of trusses is essential not only for cost reasons but to reduce the weight that goes into just supporting itself. 13) For each member to the right of “INT’ACT” appears a number representing the INTERACTION or COMBINED STRESS RESULT. Multiplying this by 100 and think of in terms of “efficiency of use.” 1 ( or 100% efficiency) is ideal. This will seldom appear but numbers such as .9 are quite frequent. If the number is less you have the option of trying different data bases to raise the “INT’ACT” result. In doing this use the separate “APPLY” command in each colored box for each member or the APPLY TO THIS PAGE ONLY near upper right. Member 6 appears by Clicking NEXT PAGE – 11. Data bases preceded by ALL, HSS_SQUARE (TUBING) or W14 cover a range of sizes. Using one of these first will provide guidance or first approximation to a more size specific data base. Size designated data bases (W24 etc) include all shapes of that size (depth) that are also metric. Clicking a size designated data base enables a “fine tuning” of results. Near size data bases should also be clicked. The writer finds W14 an attractive data base for heavier bridges. Concurrent use of “MIN WT” command enables specifying shapes that are actually available or preferred for purchase reasons . 14) Standardizing member sizes is customary fabrication practice. In the upper right corner of Form1 is a text box for entering MIN WT ALL LBS/FT. A minimum weight entered here and clicked at APPLY TO ALL PAGES – 16 or applied to an individual MEMBER sets a minimum weight in conjunction with the entered shape data base. For example: The writer sometimes likes to check the weight summary. I enter W16 as the data base and 99 as the minimum weight. This forces display of W16X100. 15) To see BOTTOM CHORDS click NEXT PAGE – 11 near upper right Form1 16) PRICE: Multiply SIMPLE SPAN STEEL KIPS BY your price per 1000 lbs. Program is for estimating only. Weights do not include connections: PURPOSE For both vendors and planners proposals and feasibility studies are both time consuming and costly. The time taken is the worst of these concerns because taking time prevents the real-time optimization needed to achieve the best result. POTENTIAL USERS MAY INCLUDE” Consulting Engineers, Contractors, Steel Fabricators, Mining Companies, State Highway Departments, Belt Conveyor Vendors.

- 127 -
PROOF OF METHOD – In grey area immediately to left of data base listing enter data for individual beams and columns taken from AISC Manuals and compare. End of Subject
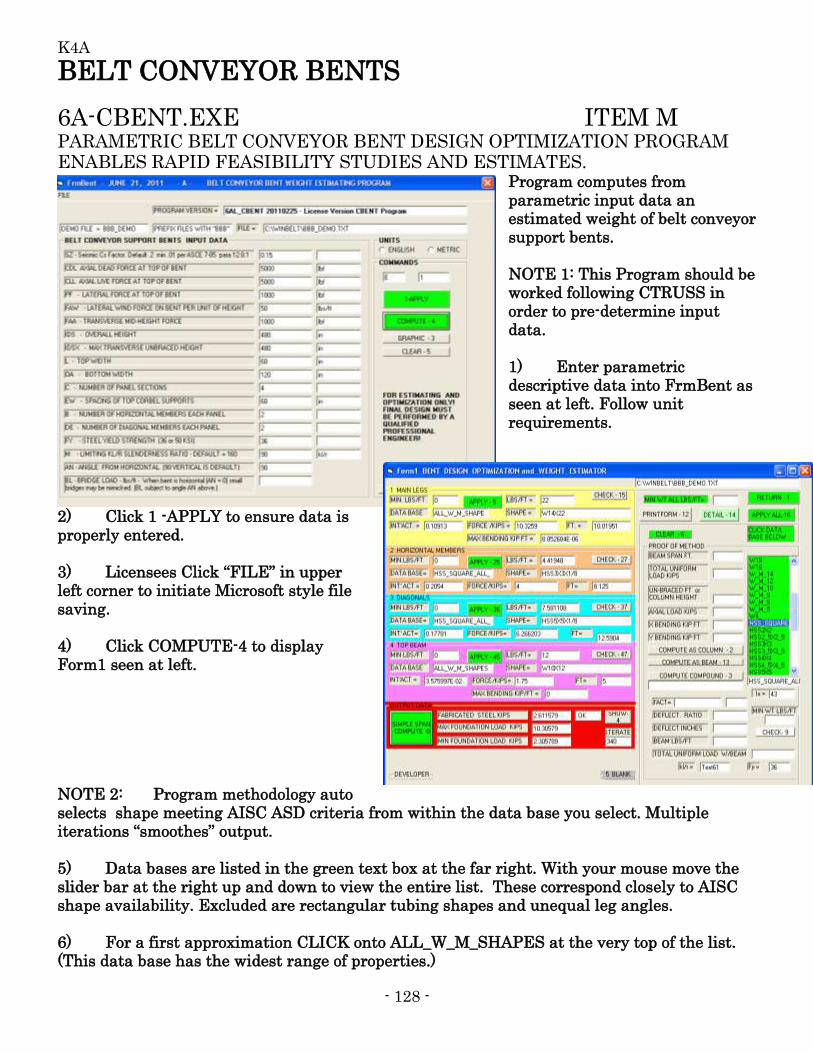
- 128 -
K4A
BELT CONVEYOR BENTS
6A-CBENT.EXE ITEM M PARAMETRIC BELT CONVEYOR BENT DESIGN OPTIMIZATION PROGRAM ENABLES RAPID FEASIBILITY STUDIES AND ESTIMATES.
Program computes from parametric input data an estimated weight of belt conveyor support bents. NOTE 1: This Program should be worked following CTRUSS in order to pre-determine input data. 1) Enter parametric descriptive data into FrmBent as seen at left. Follow unit requirements.
2) Click 1 -APPLY to ensure data is properly entered. 3) Licensees Click “FILE” in upper left corner to initiate Microsoft style file saving. 4) Click COMPUTE-4 to display Form1 seen at left. NOTE 2: Program methodology auto selects shape meeting AISC ASD criteria from within the data base you select. Multiple iterations “smoothes” output. 5) Data bases are listed in the green text box at the far right. With your mouse move the slider bar at the right up and down to view the entire list. These correspond closely to AISC shape availability. Excluded are rectangular tubing shapes and unequal leg angles. 6) For a first approximation CLICK onto ALL_W_M_SHAPES at the very top of the list. (This data base has the widest range of properties.)
- 129 -
7) Click onto green command box entitled APPLY ALL-16 near upper right. This applies the same data base to all members. 8) In each of the 4 multi-colored boxes to the right of label “DATA BASE” will appear “ALL_W_M_SHAPES”. This becomes the data base for a first computation. In red area at bottom left: 9) Click “SIMPLE SPAN COMPUTE -8” or “COMPUTE – 8” 10) View in text box to right of “FABRICATED STEEL KIPS” a computed weight of steel in kips (1 kip = 1,000 lbs). In text box to immediate right will appear OK, WEAK ?, NO or SELECT ? Only OK is permissible. If other than OK appears visually search “SHAPE = “in each colored box to determine which member(s) do not qualify. If ALL_W_M_SHAPES has been selected and OK does not appear it is unlikely a solution will be found based on the entered INPUT parameters. Option is to adjust input data. REAL TIME OPTIMIZATION Reducing weight of bents is essential for cost reasons. 11) For each member to the right of “INT’ACT” appears a number representing the INTERACTION or COMBINED STRESS RESULT. Multiplying this by 100 think of it in terms of “efficiency of use.” 1 ( or 100% efficiency) is ideal. This will seldom appear but numbers such as .9 are quite frequent. If the number is less you have the option of trying different data bases to raise the “INT’ACT” result. In doing this use the separate “APPLY” command in each colored box for each member. 12) Data bases preceded by ALL, HSS_SQUARE (TUBING) or W14 cover a range of sizes. Using one of these first will provide guidance or first approximation to a more size specific data base. Size designated data bases (W24 etc) include all shapes of that size (depth) that are also metric. Clicking a size designated data base enables a “fine tuning” of results. Near size data bases should also be clicked. Concurrent use of “MIN WT” command enables specifying shapes that are actually available or preferred for purchase reasons . 13) Standardizing member sizes is customary fabrication practice. In the upper right corner of Form1 is a text box for entering MIN WT ALL LBS/FT. A minimum weight entered here and clicked at APPLY ALL–16 or applied to an individual MEMBER sets a minimum weight in conjunction with the entered shape data base. For example: The writer sometimes likes to check the weight summary. I enter W16 as the data base and 99 as the minimum weight. This forces display of W16X100. 14) PRICE: Multiply SIMPLE SPAN STEEL KIPS BY your price per 1000 lbs. Program is for estimating only. Weights do not include connections: PURPOSE For both vendors and planners proposals and feasibility studies are both time consuming and costly. The time taken is the worst of these concerns because taking time prevents the real-

- 130 -
time optimization needed to achieve the best result. POTENTIAL USERS MAY INCLUDE” Consulting Engineers, Contractors, Steel Fabricators, Mining Companies, State Highway Departments, Belt Conveyor Vendors. PROOF OF METHOD – In grey area immediately to left of data base listing enter data for individual beams and columns taken from AISC Manuals and compare. End of Subject
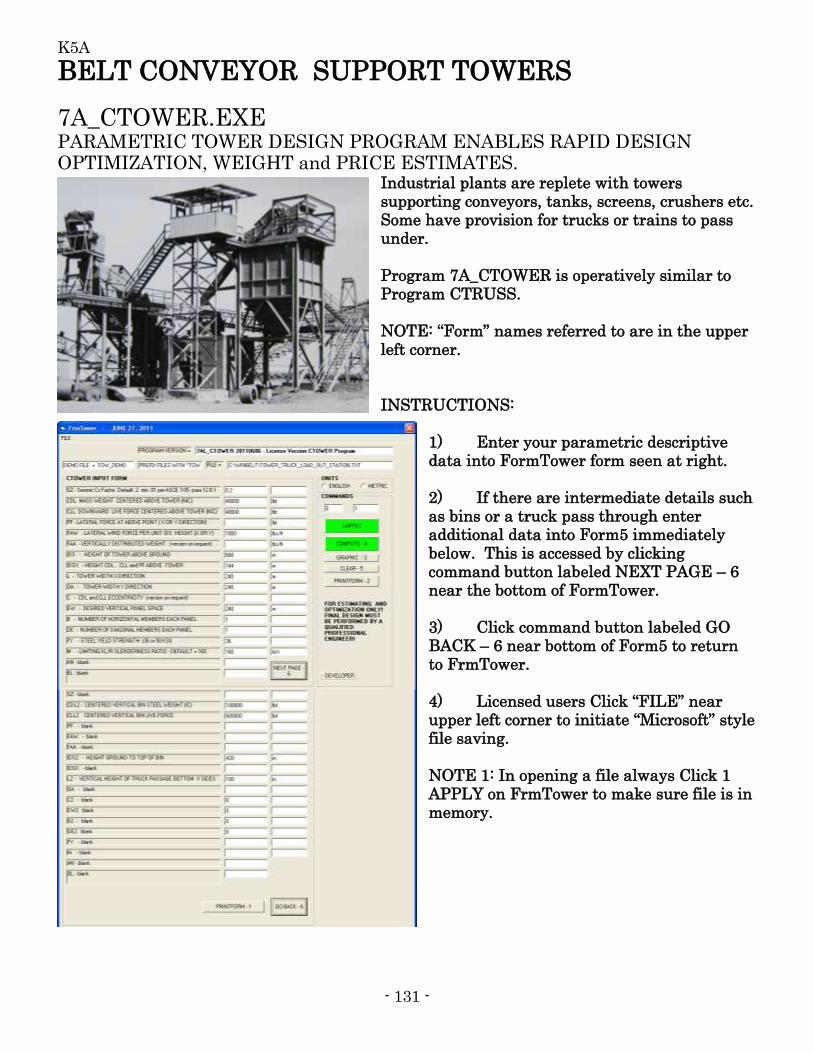
- 131 -
K5A
BELT CONVEYOR SUPPORT TOWERS
7A_CTOWER.EXE PARAMETRIC TOWER DESIGN PROGRAM ENABLES RAPID DESIGN OPTIMIZATION, WEIGHT and PRICE ESTIMATES.
Industrial plants are replete with towers supporting conveyors, tanks, screens, crushers etc. Some have provision for trucks or trains to pass under. Program 7A_CTOWER is operatively similar to Program CTRUSS. NOTE: “Form” names referred to are in the upper left corner. INSTRUCTIONS:
1) Enter your parametric descriptive data into FormTower form seen at right. 2) If there are intermediate details such as bins or a truck pass through enter additional data into Form5 immediately below. This is accessed by clicking command button labeled NEXT PAGE – 6 near the bottom of FormTower. 3) Click command button labeled GO BACK – 6 near bottom of Form5 to return to FrmTower. 4) Licensed users Click “FILE” near upper left corner to initiate “Microsoft” style file saving. NOTE 1: In opening a file always Click 1 APPLY on FrmTower to make sure file is in memory.
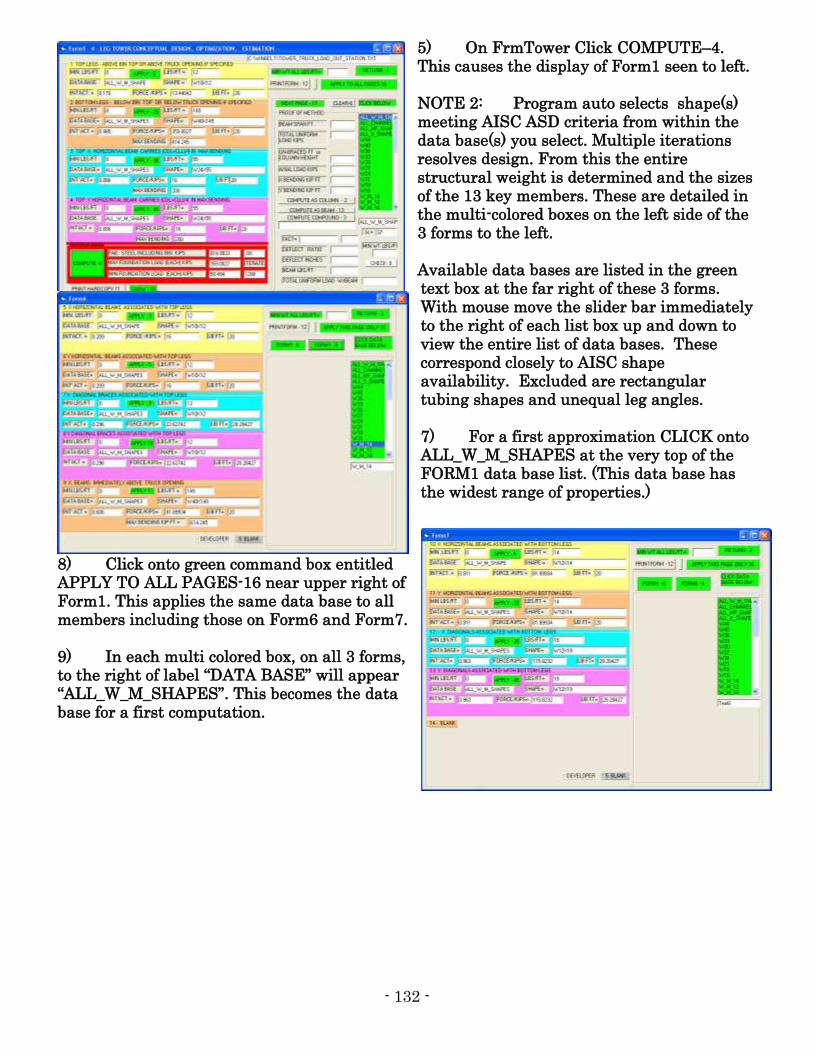
- 132 -
5) On FrmTower Click COMPUTE–4. This causes the display of Form1 seen to left. NOTE 2: Program auto selects shape(s) meeting AISC ASD criteria from within the data base(s) you select. Multiple iterations resolves design. From this the entire structural weight is determined and the sizes of the 13 key members. These are detailed in the multi-colored boxes on the left side of the 3 forms to the left. Available data bases are listed in the green text box at the far right of these 3 forms. With mouse move the slider bar immediately to the right of each list box up and down to view the entire list of data bases. These correspond closely to AISC shape availability. Excluded are rectangular tubing shapes and unequal leg angles. 7) For a first approximation CLICK onto ALL_W_M_SHAPES at the very top of the FORM1 data base list. (This data base has the widest range of properties.)
8) Click onto green command box entitled APPLY TO ALL PAGES-16 near upper right of Form1. This applies the same data base to all members including those on Form6 and Form7. 9) In each multi colored box, on all 3 forms, to the right of label “DATA BASE” will appear “ALL_W_M_SHAPES”. This becomes the data base for a first computation.
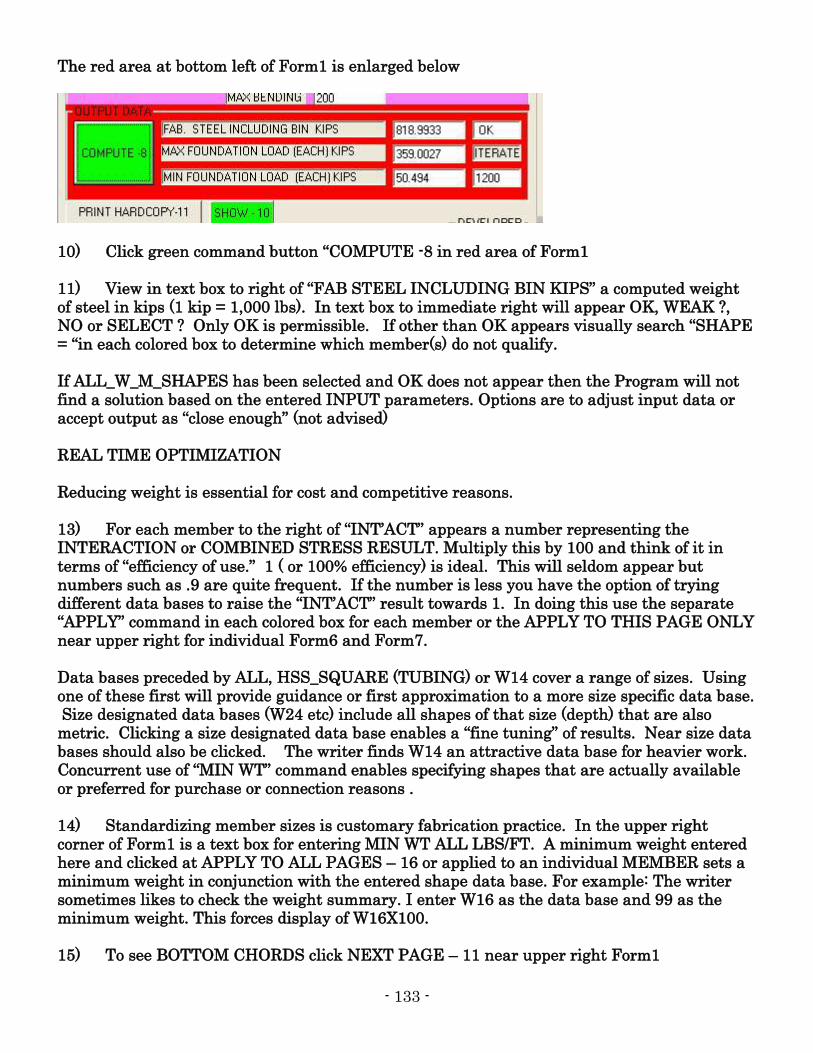
- 133 -
The red area at bottom left of Form1 is enlarged below
10) Click green command button “COMPUTE -8 in red area of Form1 11) View in text box to right of “FAB STEEL INCLUDING BIN KIPS” a computed weight of steel in kips (1 kip = 1,000 lbs). In text box to immediate right will appear OK, WEAK ?, NO or SELECT ? Only OK is permissible. If other than OK appears visually search “SHAPE = “in each colored box to determine which member(s) do not qualify. If ALL_W_M_SHAPES has been selected and OK does not appear then the Program will not find a solution based on the entered INPUT parameters. Options are to adjust input data or accept output as “close enough” (not advised) REAL TIME OPTIMIZATION Reducing weight is essential for cost and competitive reasons. 13) For each member to the right of “INT’ACT” appears a number representing the INTERACTION or COMBINED STRESS RESULT. Multiply this by 100 and think of it in terms of “efficiency of use.” 1 ( or 100% efficiency) is ideal. This will seldom appear but numbers such as .9 are quite frequent. If the number is less you have the option of trying different data bases to raise the “INT’ACT” result towards 1. In doing this use the separate “APPLY” command in each colored box for each member or the APPLY TO THIS PAGE ONLY near upper right for individual Form6 and Form7. Data bases preceded by ALL, HSS_SQUARE (TUBING) or W14 cover a range of sizes. Using one of these first will provide guidance or first approximation to a more size specific data base. Size designated data bases (W24 etc) include all shapes of that size (depth) that are also metric. Clicking a size designated data base enables a “fine tuning” of results. Near size data bases should also be clicked. The writer finds W14 an attractive data base for heavier work. Concurrent use of “MIN WT” command enables specifying shapes that are actually available or preferred for purchase or connection reasons . 14) Standardizing member sizes is customary fabrication practice. In the upper right corner of Form1 is a text box for entering MIN WT ALL LBS/FT. A minimum weight entered here and clicked at APPLY TO ALL PAGES – 16 or applied to an individual MEMBER sets a minimum weight in conjunction with the entered shape data base. For example: The writer sometimes likes to check the weight summary. I enter W16 as the data base and 99 as the minimum weight. This forces display of W16X100. 15) To see BOTTOM CHORDS click NEXT PAGE – 11 near upper right Form1

- 134 -
16) PRICE: Multiply FAB STEEL INCLUDING BIN KIPS BY your price per 1000 lbs. Program is for estimating only. Weights do not include connections: PURPOSE For both vendors and planners proposals and feasibility studies are both time consuming and costly. The time taken is the worst of these concerns because taking time prevents the real-time optimization needed to achieve the best result. POTENTIAL USERS MAY INCLUDE” Consulting Engineers, Contractors, Steel Fabricators, Mining Companies, State Highway Departments, Belt Conveyor Vendors. Process plant builders. PROOF OF METHOD – In grey area immediately to left of data base listing enter data for individual beams and columns taken from AISC Manuals and compare. Below the red box are commands PRINT HARDCOPY – 11 SHOW-10 Clicking HARDCOPY-11 before clicking COMPUTE-8 will cause Program to concurrently produce hardcopy of intermediate computational results. (If you have a printer connected) Clicking SHOW-10 after Clicking COMPUTE – 8 will enable a review of the same data on monitor. End of Subject
- 135 -
L1A APPENDIX REFERENCES: (1) BELT CONVEYORS FOR BULK MATERIALS, Conveyor Equipment Manufacturers
Association. (2) SURFACE MINING, 2nd Edition, B.A. Kennedy, Editor. Pages 704 to 705. A Publication
of AMERICAN SOCIETY FOR MINING METALLURGY & EXPLORATION, Fax 303 973 3845
(3) 1996 MINE & MILL EQUIPMENT COSTS, A publication of Western Mine Engineering. WINBELT OPTIONS FOR TRANSMITTING WINBELT OUTPUT DATA ELECTRONICALLY 1) Make Hardcopy of output data and send by fax machine. 2) Save Output data to file, requires printer driver compatibility, Send file as attachment to
e-mail.
Note: As experiment writer designated an HP ink jet printer as format and attempted printout on HP laser jet printer. Printing failed. Other combinations may function.
3) Similar to 2) above but save as file for fax transmission, send as fax to receiver according
to Microsoft instructions.
This option may prove to be most practical because it is believed to enable opening the fax attachment on monitor with the option to print out. It does not display the color coding as in 4) because it is monitor display of the hardcopy output not the original monitor display.
4) Sender save_AS OUTPUT FILE (Drop down from DISPLAY EXISTING OUTPUT) and
send the resulting .txt file to receiver. Receiver must have WINBELT (unlicensed) copy installed on computer. Receiver executes OPEN OUTPUT FILE and DISPLAY OUTPUT DATA IN MEMORY to display output data on monitor or print as HARDCOPY. Receiver can not optimize data unless he is Licensed user and has FILE | SAVE_AS file. The
advantage of this method is viewing data on monitor along with any colored warnings. C:\WINHELP\BELTHELP.DOC (DEVELOPER) C:\WINBELT\BELTHELP.PDF (USER) Tel 661 871 2168 – Fax 661 871 1798 – Cell 661 809 4764 Attn: Don Suverkrop, P.E. , S.M.E CREATIVE ENGINEERING USA 3513 Century Drive Bakersfield, CA 93306 1238 Edit date August 25, 2011
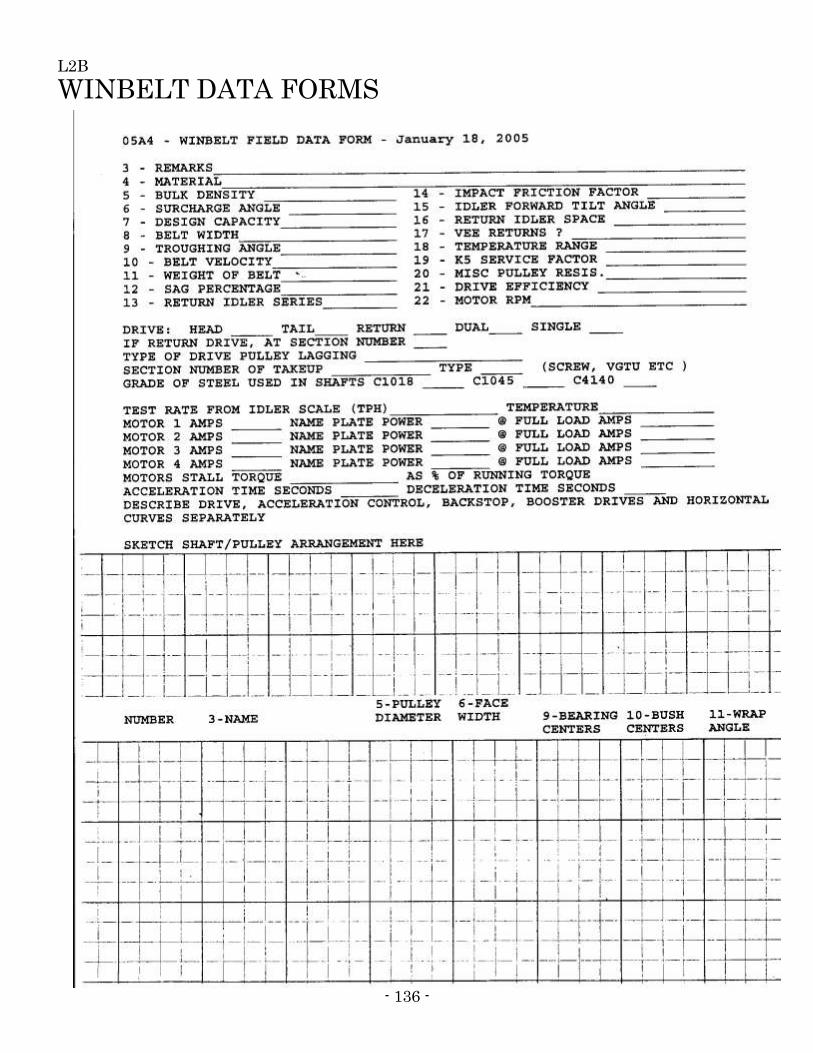
- 136 -
L2B
WINBELT DATA FORMS
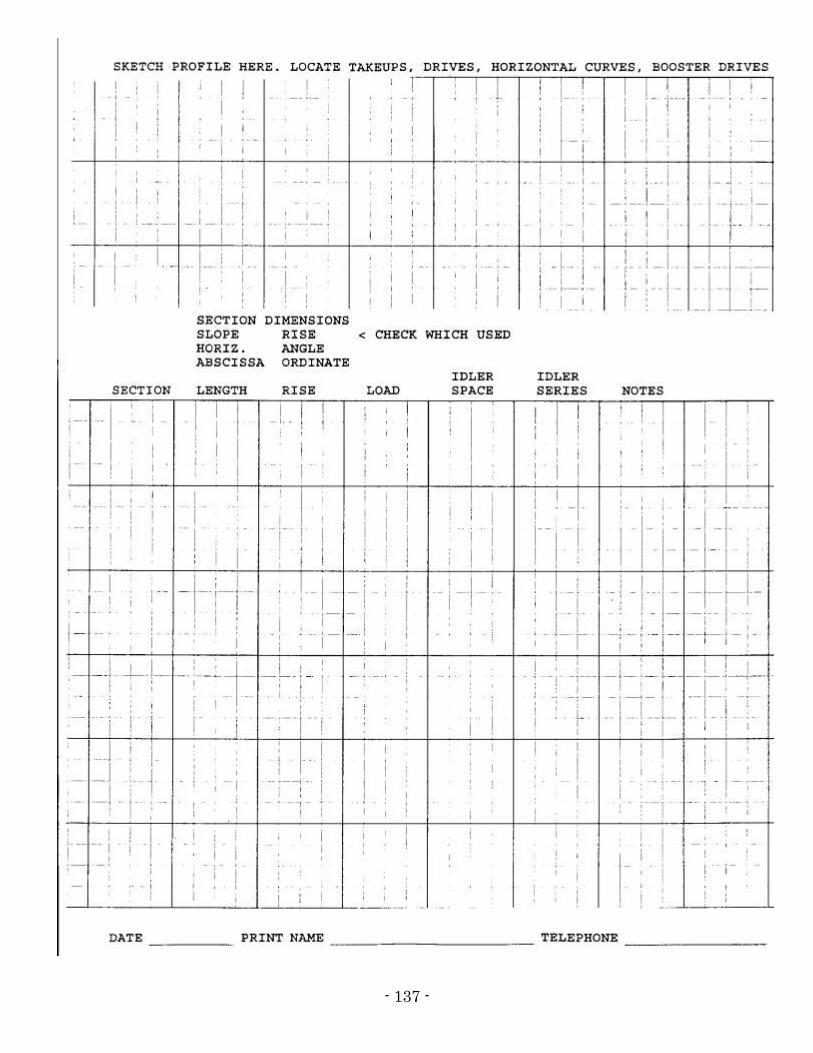
- 137 -