beijing capital land ltd. 2868.hk interim results 2016 · 9 10,260 15,276 11,201 19,441 -5,000...
TRANSCRIPT
1
Beijing Capital Land Ltd. 2868.HK
Interim Results 2016
August 2016
2
Results Highlights
1 Results Summary
2 Business Highlights
3 2H 2016 Outlook
3
Section 1
Results Summary
4
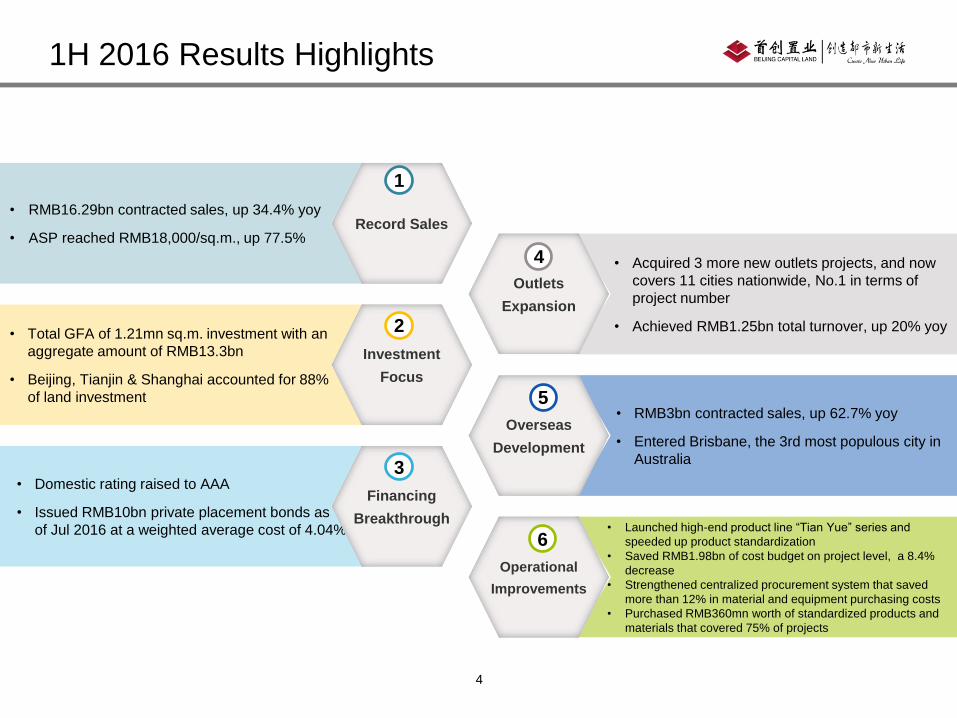
• RMB16.29bn contracted sales, up 34.4% yoy
• ASP reached RMB18,000/sq.m., up 77.5%Record Sales
• Acquired 3 more new outlets projects, and now
covers 11 cities nationwide, No.1 in terms of
project number
• Achieved RMB1.25bn total turnover, up 20% yoy
Outlets
Expansion
• Total GFA of 1.21mn sq.m. investment with an
aggregate amount of RMB13.3bn
• Beijing, Tianjin & Shanghai accounted for 88%
of land investment
Investment
Focus
• RMB3bn contracted sales, up 62.7% yoy
• Entered Brisbane, the 3rd most populous city in
Australia
Overseas
Development
• Domestic rating raised to AAA
• Issued RMB10bn private placement bonds as
of Jul 2016 at a weighted average cost of 4.04%
Financing
Breakthrough• Launched high-end product line “Tian Yue” series and
speeded up product standardization
• Saved RMB1.98bn of cost budget on project level, a 8.4%
decrease
• Strengthened centralized procurement system that saved
more than 12% in material and equipment purchasing costs
• Purchased RMB360mn worth of standardized products and
materials that covered 75% of projects
Operational
Improvements
1H 2016 Results Highlights
1
2
3
4
5
6
5
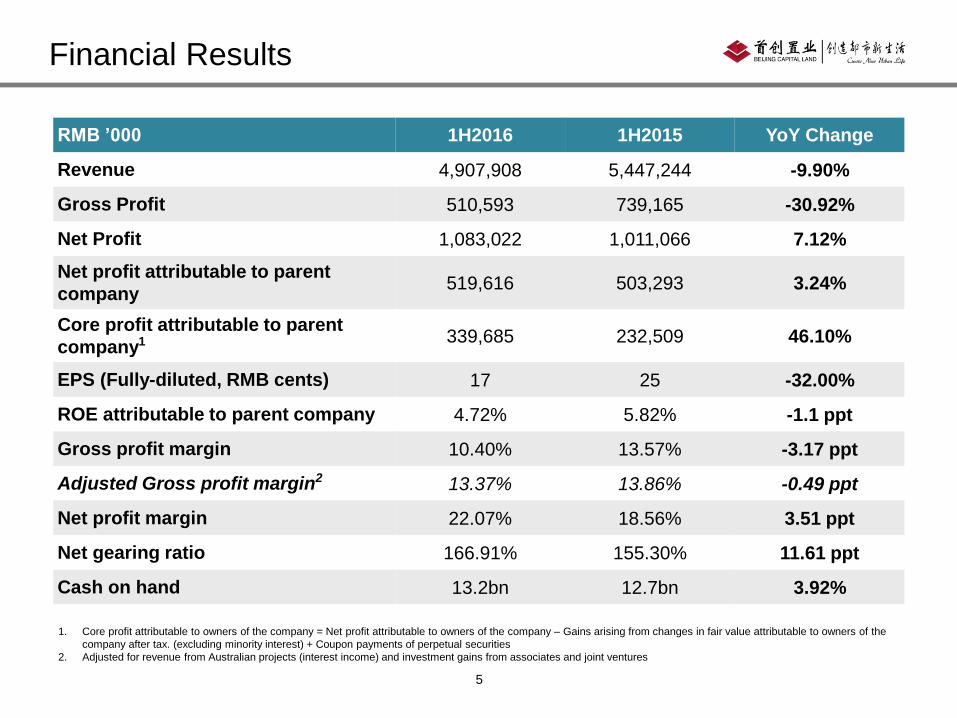
RMB ’000 1H2016 1H2015 YoY Change
Revenue 4,907,908 5,447,244 -9.90%
Gross Profit 510,593 739,165 -30.92%
Net Profit 1,083,022 1,011,066 7.12%
Net profit attributable to parent
company519,616 503,293 3.24%
Core profit attributable to parent
company1 339,685 232,509 46.10%
EPS (Fully-diluted, RMB cents) 17 25 -32.00%
ROE attributable to parent company 4.72% 5.82% -1.1 ppt
Gross profit margin 10.40% 13.57% -3.17 ppt
Adjusted Gross profit margin2 13.37% 13.86% -0.49 ppt
Net profit margin 22.07% 18.56% 3.51 ppt
Net gearing ratio 166.91% 155.30% 11.61 ppt
Cash on hand 13.2bn 12.7bn 3.92%
Financial Results
1. Core profit attributable to owners of the company = Net profit attributable to owners of the company – Gains arising from changes in fair value attributable to owners of the
company after tax. (excluding minority interest) + Coupon payments of perpetual securities
2. Adjusted for revenue from Australian projects (interest income) and investment gains from associates and joint ventures
6
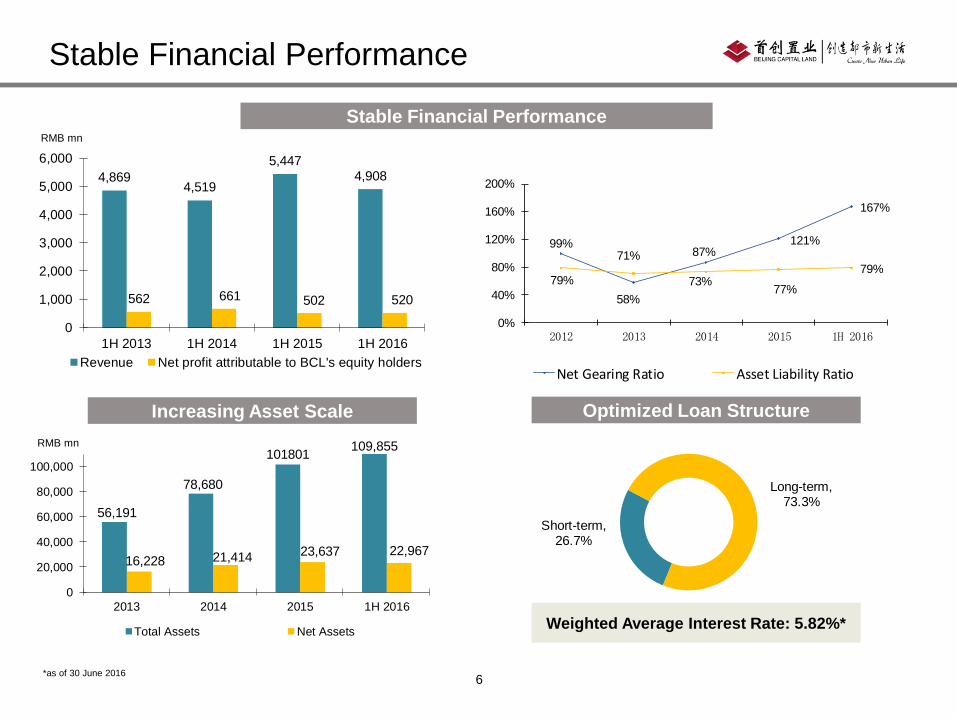
99%
58%
87%121%
167%
79%
71%
73%77%
79%
0%
40%
80%
120%
160%
200%
2012 2013 2014 2015 1H 2016
Net Gearing Ratio Asset Liability Ratio
Stable Financial Performance
Increasing Asset Scale Optimized Loan Structure
Short-term, 26.7%
Long-term, 73.3%
Weighted Average Interest Rate: 5.82%*
56,191
78,680
101801109,855
16,228 21,414 23,637 22,967
0
20,000
40,000
60,000
80,000
100,000
2013 2014 2015 1H 2016
Total Assets Net Assets
*as of 30 June 2016
RMB mn
RMB mn
Stable Financial Performance
4,869 4,519
5,447 4,908
562 661 502 520
0
1,000
2,000
3,000
4,000
5,000
6,000
1H 2013 1H 2014 1H 2015 1H 2016
Revenue Net profit attributable to BCL's equity holders
7
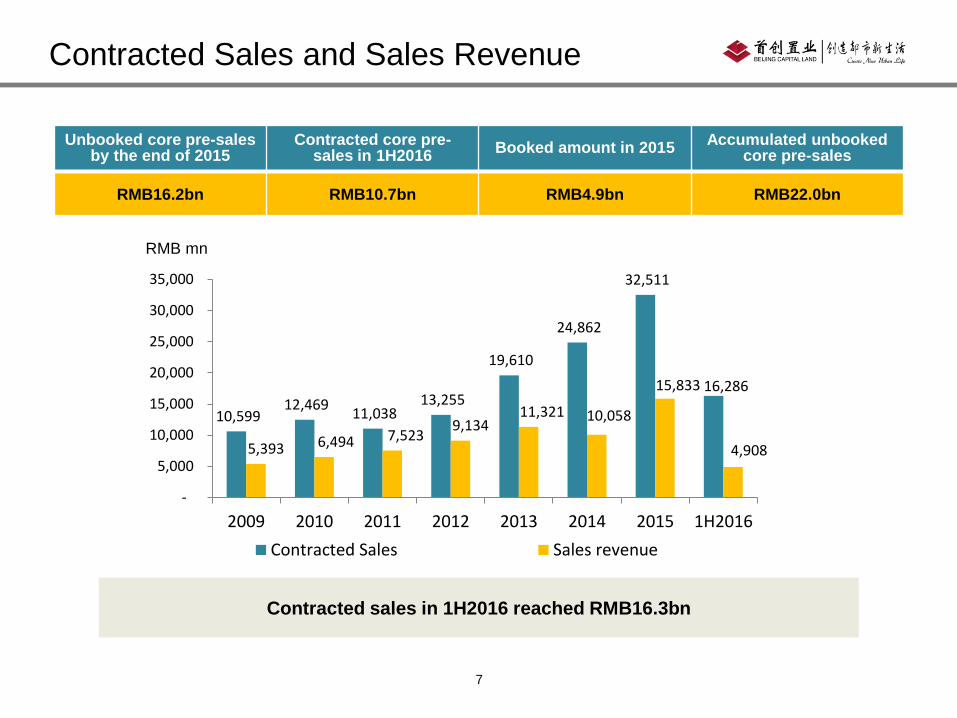
Unbooked core pre-sales by the end of 2015
Contracted core pre-sales in 1H2016
Booked amount in 2015Accumulated unbooked
core pre-sales
RMB16.2bn RMB10.7bn RMB4.9bn RMB22.0bn
10,599 12,469
11,038 13,255
19,610
24,862
32,511
16,286
5,393 6,494 7,5239,134
11,321 10,058
15,833
4,908
-
5,000
10,000
15,000
20,000
25,000
30,000
35,000
2009 2010 2011 2012 2013 2014 2015 1H2016
Contracted Sales Sales revenue
RMB mn
Contracted Sales and Sales Revenue
Contracted sales in 1H2016 reached RMB16.3bn

8
Section 2
Business Highlights
9
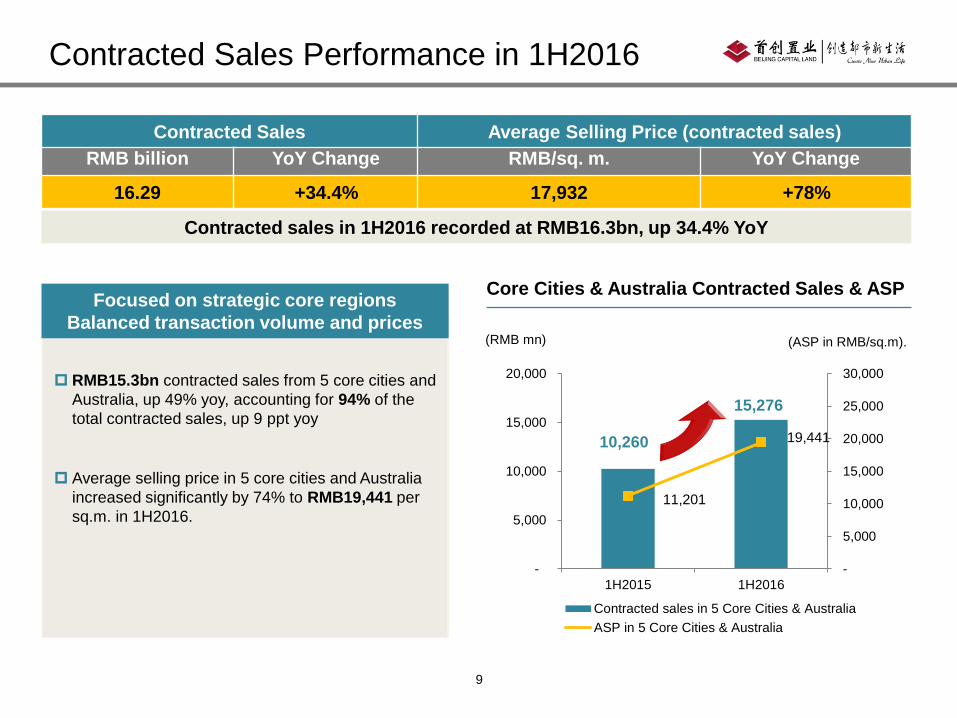
10,260
15,276
11,201
19,441
-
5,000
10,000
15,000
20,000
25,000
30,000
1H2015 1H2016
-
5,000
10,000
15,000
20,000
Contracted sales in 5 Core Cities & Australia
ASP in 5 Core Cities & Australia
Contracted Sales Average Selling Price (contracted sales)
RMB billion YoY Change RMB/sq. m. YoY Change
16.29 +34.4% 17,932 +78%
Core Cities & Australia Contracted Sales & ASP
(RMB mn)
Contracted Sales Performance in 1H2016
(ASP in RMB/sq.m).
Focused on strategic core regions
Balanced transaction volume and prices
RMB15.3bn contracted sales from 5 core cities and
Australia, up 49% yoy, accounting for 94% of the
total contracted sales, up 9 ppt yoy
Average selling price in 5 core cities and Australia
increased significantly by 74% to RMB19,441 per
sq.m. in 1H2016.
Contracted sales in 1H2016 recorded at RMB16.3bn, up 34.4% YoY
10
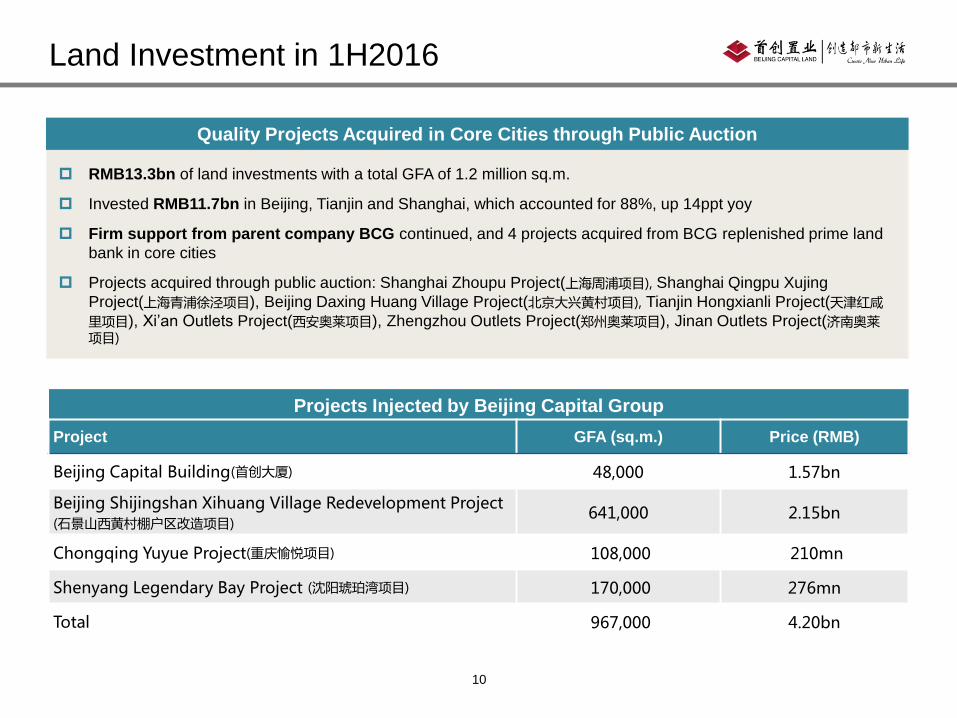
Quality Projects Acquired in Core Cities through Public Auction
Land Investment in 1H2016
RMB13.3bn of land investments with a total GFA of 1.2 million sq.m.
Invested RMB11.7bn in Beijing, Tianjin and Shanghai, which accounted for 88%, up 14ppt yoy
Firm support from parent company BCG continued, and 4 projects acquired from BCG replenished prime land
bank in core cities
Projects acquired through public auction: Shanghai Zhoupu Project(上海周浦项目), Shanghai Qingpu Xujing
Project(上海青浦徐泾项目), Beijing Daxing Huang Village Project(北京大兴黄村项目), Tianjin Hongxianli Project(天津红咸
里项目), Xi’an Outlets Project(西安奥莱项目), Zhengzhou Outlets Project(郑州奥莱项目), Jinan Outlets Project(济南奥莱项目)
Projects Injected by Beijing Capital Group
Project GFA (sq.m.) Price (RMB)
Beijing Capital Building(首创大厦) 48,000 1.57bn
Beijing Shijingshan Xihuang Village Redevelopment Project(石景山西黄村棚户区改造项目)
641,000 2.15bn
Chongqing Yuyue Project(重庆愉悦项目) 108,000 210mn
Shenyang Legendary Bay Project (沈阳琥珀湾项目) 170,000 276mn
Total 967,000 4.20bn
11
BCL Residential
Projects
Sufficient Land Bank
Capital Juda Outlets
Projects
Shanghai
HangzhouChengdu
Chongqing
Xi’an
Beijing Shenyang
Wuxi
Tianjin
Wanning
QingdaoYantai
Huzhou
Kunshan
Changsha
Nanchang
Wuhan
Zhengzhou
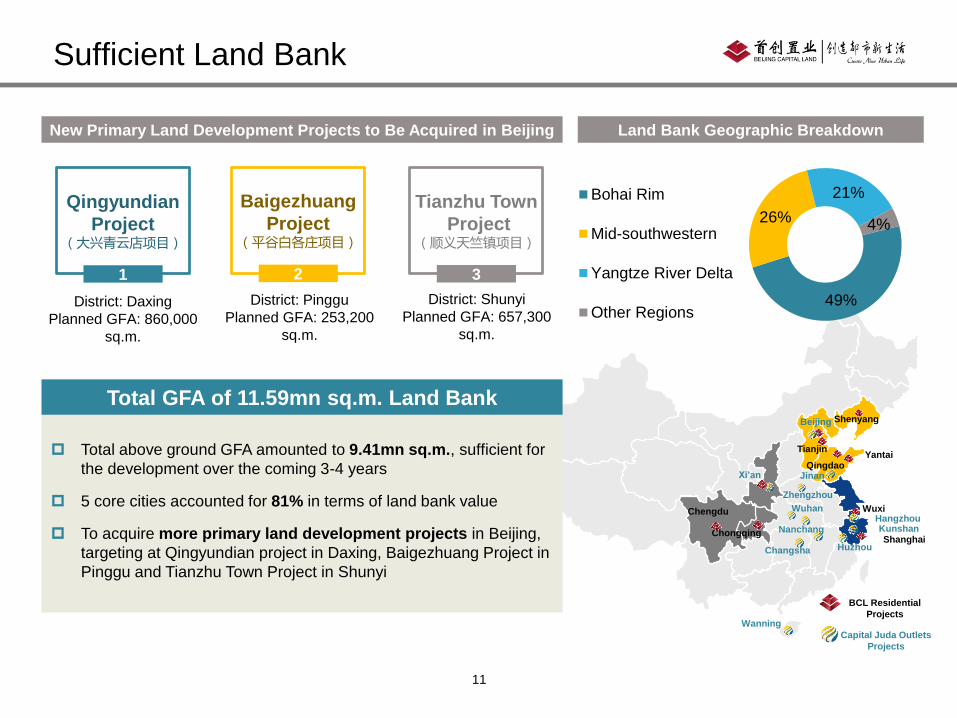
Total above ground GFA amounted to 9.41mn sq.m., sufficient for
the development over the coming 3-4 years
5 core cities accounted for 81% in terms of land bank value
To acquire more primary land development projects in Beijing,
targeting at Qingyundian project in Daxing, Baigezhuang Project in
Pinggu and Tianzhu Town Project in Shunyi
Total GFA of 11.59mn sq.m. Land Bank
Jinan
District: Daxing
Planned GFA: 860,000
sq.m.
District: Pinggu
Planned GFA: 253,200
sq.m.
District: Shunyi
Planned GFA: 657,300
sq.m.
1
Qingyundian
Project(大兴青云店项目)
2
Baigezhuang
Project(平谷白各庄项目)
3
Tianzhu Town
Project(顺义天竺镇项目)
New Primary Land Development Projects to Be Acquired in Beijing Land Bank Geographic Breakdown
49%
26%
21%
4%
Bohai Rim
Mid-southwestern
Yangtze River Delta
Other Regions
12
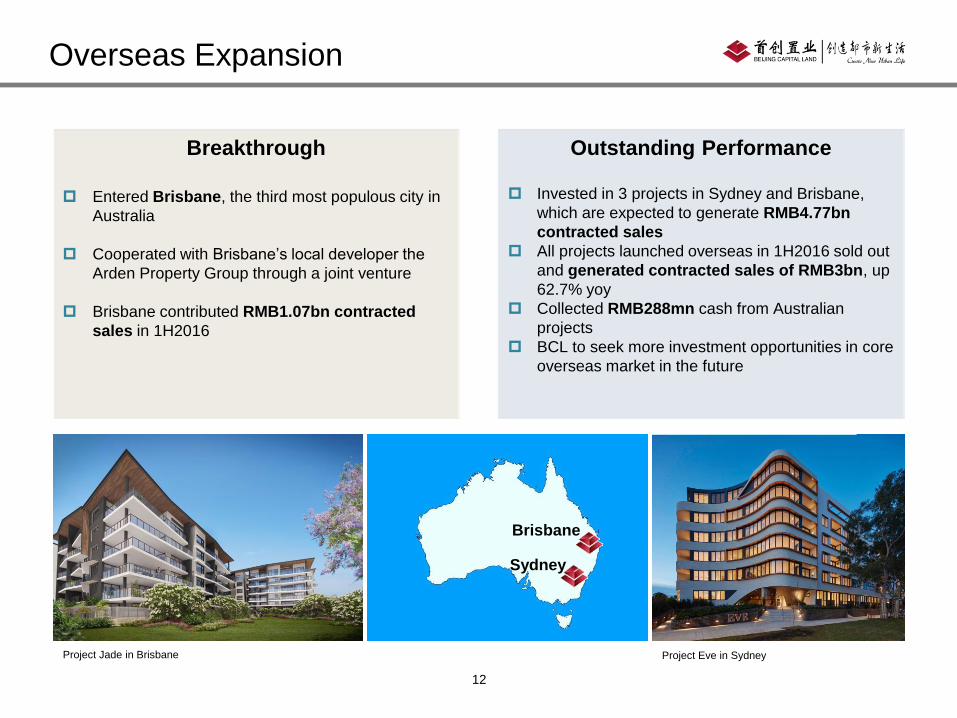
Outstanding PerformanceBreakthrough
Entered Brisbane, the third most populous city in
Australia
Cooperated with Brisbane’s local developer the
Arden Property Group through a joint venture
Brisbane contributed RMB1.07bn contracted
sales in 1H2016
Invested in 3 projects in Sydney and Brisbane,
which are expected to generate RMB4.77bn
contracted sales
All projects launched overseas in 1H2016 sold out
and generated contracted sales of RMB3bn, up
62.7% yoy
Collected RMB288mn cash from Australian
projects
BCL to seek more investment opportunities in core
overseas market in the future
Overseas Expansion
Project Eve in SydneyProject Jade in Brisbane
Brisbane
Sydney
13
Fangshan, Beijing
Kunshan
Huzhou
Nanchang
Wanning, Hainan
HangzhouWuhan
Changsha
Xi’an
Zhengzhou
Jinan
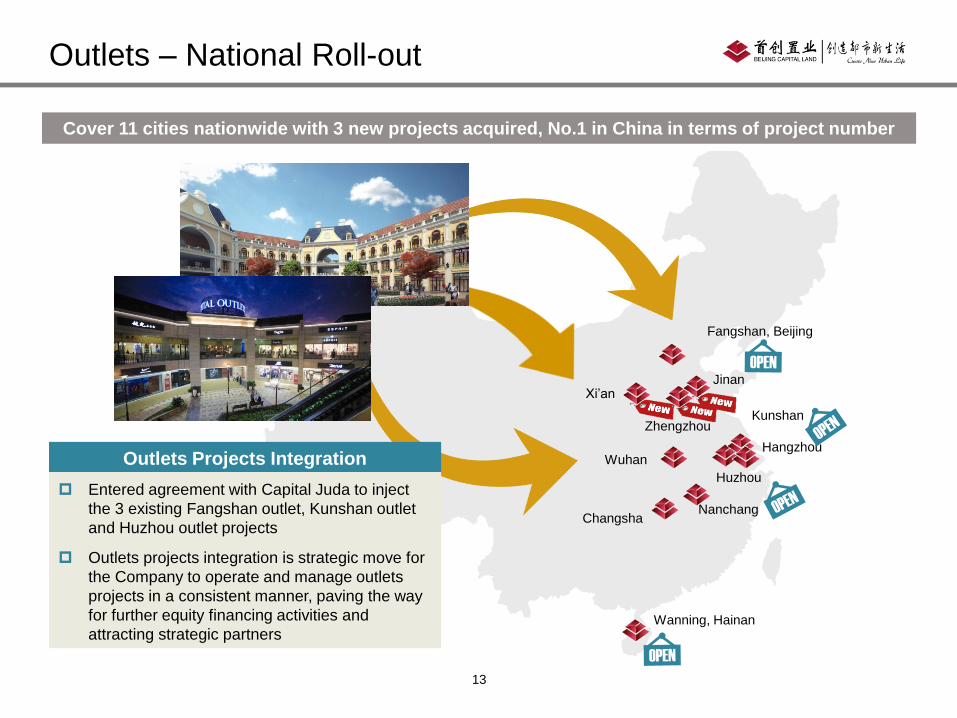
Outlets – National Roll-out
Cover 11 cities nationwide with 3 new projects acquired, No.1 in China in terms of project number
Outlets Projects Integration
Entered agreement with Capital Juda to inject
the 3 existing Fangshan outlet, Kunshan outlet
and Huzhou outlet projects
Outlets projects integration is strategic move for
the Company to operate and manage outlets
projects in a consistent manner, paving the way
for further equity financing activities and
attracting strategic partners
14
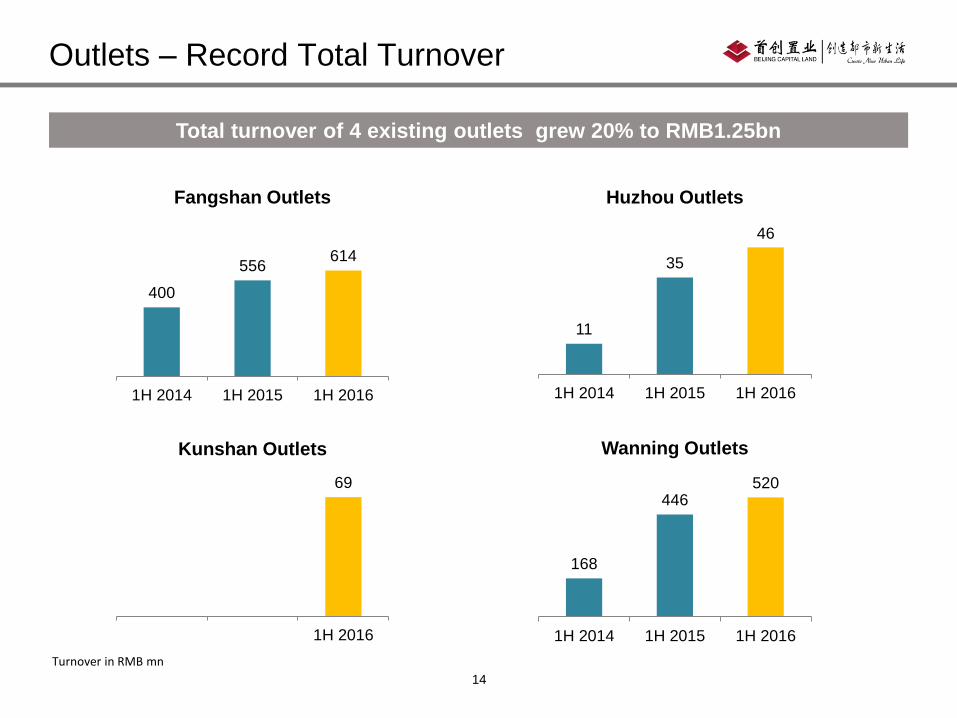
Outlets – Record Total Turnover
400
556614
1H 2014 1H 2015 1H 2016
168
446520
1H 2014 1H 2015 1H 2016
11
35
46
1H 2014 1H 2015 1H 2016
69
1H 2016
Turnover in RMB mn
Fangshan Outlets Huzhou Outlets
Kunshan Outlets Wanning Outlets
Total turnover of 4 existing outlets grew 20% to RMB1.25bn
15
Product Upgrade
Rolled out a product strategy called “Build with Heart” and placed substantial emphasis on
launching “Tian Yue” series, a high-end product line
Established a product center to speed up product standardization
Engaged in property management from early development stage so as to elevate product
quality, increase customer satisfaction and increase pricing power
Cost Control
Exercised tight cost controls, from setting cost control targets and monitoring cost control
processes to evaluating cost control results, to substantially optimize project expenses
Implemented cost control scheme called “3300”on major subsidiaries and set out cost
control guidelines
Saved RMB1.98bn of cost budget on project level (a 8.4% decrease), achieving full-year
target in cost saving in advance
Strategic Procurement
Centralized procurement system covered an aggregate area of 4.09mn sq.m., or more than
75% of the Group’s projects
Purchased RMB360mn worth of products and materials through centralized procurement
system
Operational Improvements
Improve product quality while exercising tight cost controls
16
• Received AAA credit
rating with stable outlook
from China Chengxin
• Rated BB+ by S&P,
credit profile being further
upgraded
• Created a solid foundation
for funding cost to be
continuously lowered
• Issued RMB10bn private
placement bonds in 7m2016,
at a weighted average cost
of 4.04%
• Issued bonds with a maturity
of 2+1 in July at a coupon
rate of 3.71%, the lowest
financing cost ever for BCL
and among bonds issued of
the same category in market
• Roll over loans to optimize
debt costs
• Continued to lower
financing cost incurred
through traditional funding
methods, and kept bank
borrowing costs below
benchmark interest rate
• Adhered to cost-oriented
principle, and had debt
levels under control in an
effort to optimize funding
cost
Breakthrough in Financing
Credit Rating Debt Financing Funding Cost
Accelerate A-share listing process and lower funding costs
17
Section 3
2H2016 Outlook
18
Sales Target and Measures in 2H2016
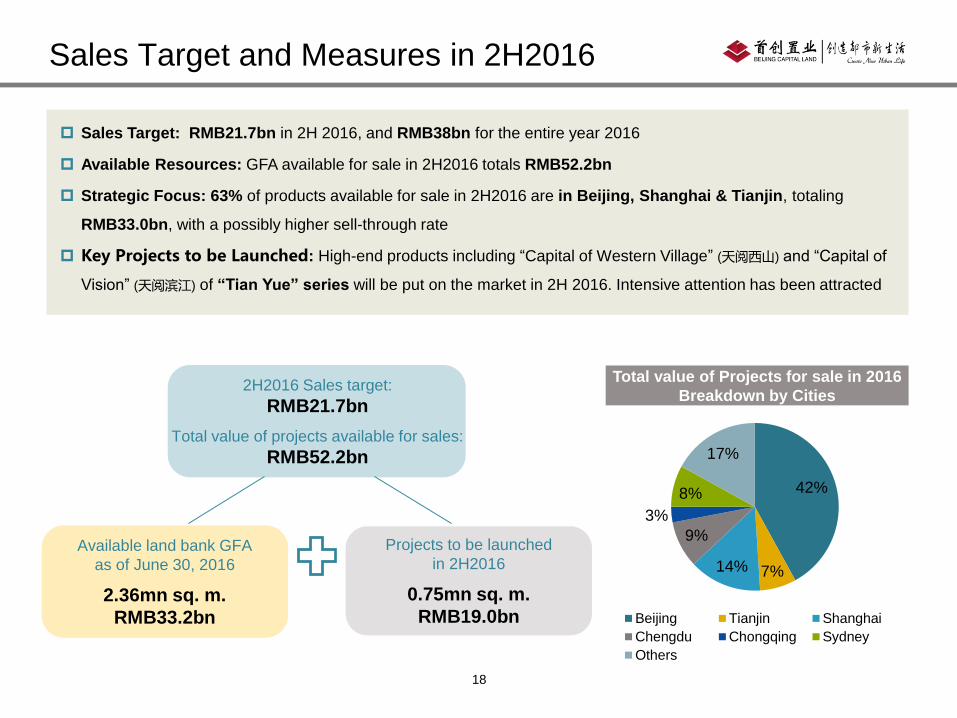
Sales Target: RMB21.7bn in 2H 2016, and RMB38bn for the entire year 2016
Available Resources: GFA available for sale in 2H2016 totals RMB52.2bn
Strategic Focus: 63% of products available for sale in 2H2016 are in Beijing, Shanghai & Tianjin, totaling
RMB33.0bn, with a possibly higher sell-through rate
Key Projects to be Launched: High-end products including “Capital of Western Village” (天阅西山) and “Capital of
Vision” (天阅滨江) of “Tian Yue” series will be put on the market in 2H 2016. Intensive attention has been attracted
42%
7%14%
9%
3%
8%
17%
Beijing Tianjin Shanghai
Chengdu Chongqing Sydney
Others
Projects to be launched
in 2H2016
0.75mn sq. m.
RMB19.0bn
Available land bank GFA
as of June 30, 2016
2.36mn sq. m.
RMB33.2bn
2H2016 Sales target:
RMB21.7bn
Total value of projects available for sales:
RMB52.2bn
Total value of Projects for sale in 2016
Breakdown by Cities
19
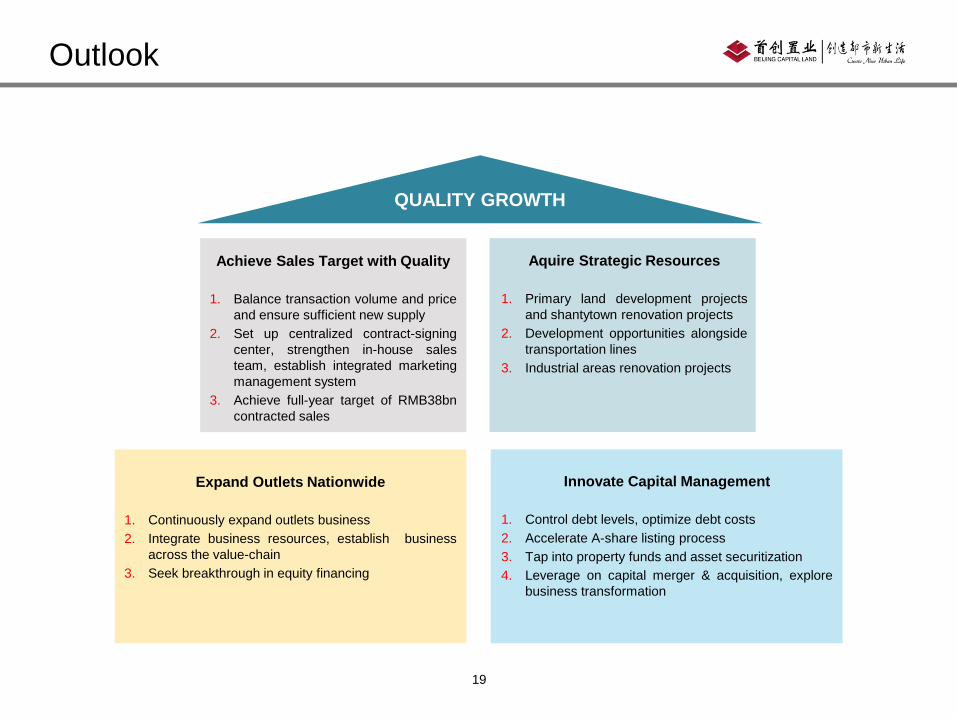
QUALITY GROWTH
Outlook
Achieve Sales Target with Quality
1. Balance transaction volume and price
and ensure sufficient new supply
2. Set up centralized contract-signing
center, strengthen in-house sales
team, establish integrated marketing
management system
3. Achieve full-year target of RMB38bn
contracted sales
Aquire Strategic Resources
1. Primary land development projects
and shantytown renovation projects
2. Development opportunities alongside
transportation lines
3. Industrial areas renovation projects
Expand Outlets Nationwide
1. Continuously expand outlets business
2. Integrate business resources, establish business
across the value-chain
3. Seek breakthrough in equity financing
Innovate Capital Management
1. Control debt levels, optimize debt costs
2. Accelerate A-share listing process
3. Tap into property funds and asset securitization
4. Leverage on capital merger & acquisition, explore
business transformation
20
Q&A
21
Thank You!