behavioral/systems/cognitive … · behavioral/systems/cognitive...
TRANSCRIPT
Behavioral/Systems/Cognitive
The Neural Coding of Stimulus Intensity: Linking thePopulation Response of Mechanoreceptive Afferents withPsychophysical Behavior
Michael A. Muniak,1 Supratim Ray,2 Steven S. Hsiao,1,3 J. Frank Dammann,3 and Sliman J. Bensmaia1,3
Departments of 1Neuroscience and 2Biomedical Engineering and 3Krieger Mind/Brain Institute, Johns Hopkins University, Baltimore, Maryland 21218
How specific aspects of a stimulus are encoded at different stages of neural processing is a critical question in sensory neuroscience. In thepresent study, we investigated the neural code underlying the perception of stimulus intensity in the somatosensory system. We firstcharacterized the responses of SA1 (slowly adapting type 1), RA (rapidly adapting), and PC (Pacinian) afferents of macaque monkeys tosinusoidal, diharmonic, and bandpass noise stimuli. We then had human subjects rate the perceived intensity of a subset of these stimuli.On the basis of these neurophysiological and psychophysical measurements, we evaluated a series of hypotheses about which aspect(s) ofthe neural activity evoked at the somatosensory periphery account for perception. We evaluated three types of neural codes. The firstconsisted of population codes based on the firing rate of neurons located directly under the probe. The second included population codesbased on the firing rate of the entire population of active neurons. The third included codes based on the number of active afferents. Wefound that the response evoked in the localized population is logarithmic with stimulus amplitude (given a constant frequency compo-sition), whereas the population response across all neurons is linear with stimulus amplitude. We conclude that stimulus intensity is bestaccounted for by the firing rate evoked in afferents located under or near the locus of stimulation, weighted by afferent type.
Key words: neural coding; neurophysiology; afferent; population coding; psychophysics; somatosensory; touch; vibration
IntroductionThe three low-threshold mechanoreceptive afferents found in theglabrous skin of macaque [slowly adapting type 1 (SA1), rapidlyadapting (RA), and Pacinian (PC)] are sensitive to different typesof stimulation (Talbot et al., 1968; Johansson and Vallbo, 1979b;Freeman and Johnson, 1982a,b). SA1 afferents are most respon-sive to statically indented stimuli or to low-frequency vibratorystimuli, whereas PC afferents are exquisitely sensitive to high-frequency vibrations (�100 Hz). RA afferents are sensitive tovibrations at intermediate frequencies. Although the three affer-ent types have been implicated in different aspects of tactile per-ception [SA1 in form and texture perception; RA in microslip,flutter and motion perception; and PC in the perception of mi-crotextures (Hollins and Bensmaia, 2007) and of textures ex-plored through a tool (Yoshioka et al., 2007) (for review, seeJohnson, 2001)], all three populations of afferents respond tomost natural stimuli, albeit to different degrees. Thus, the ner-vous system must either sift through or integrate informationconveyed through these three sensory channels to form a coher-ent percept.
In the present study, we investigated the neural mechanisms
underlying the tactile perception of stimulus intensity. The per-ceived intensity of sinusoids in the low- to intermediate-frequency range has been shown to increase linearly with stimu-lus intensity (Stevens, 1968; Franzen, 1969; Verrillo et al., 1969)whereas the firing rates evoked in individual peripheral afferentsdo not (Mountcastle et al., 1969). Johnson (1974) set out to elu-cidate the neural code of perceived intensity by reconstructingthe response evoked in a population of RA afferents by 40 Hzvibrations at various intensities (also see Cohen and Vierck,1993b). He tested several putative codes, including (but not lim-ited to) the mean population firing rate and the total number ofactive fibers, and concluded that any aspect of the neural dis-charge that increased linearly with intensity could account for thepsychophysical behavior. Several codes could not be rejectedbased on his psychophysical and neurophysiological data.
Here, we sought to elaborate on Johnson’s study in two ways.First, we presented a variety of stimuli (sinusoidal, diharmonic,and noise stimuli) that vary not only in their intensity but also intheir frequency composition. Such an assortment of stimuli islikely to constrain theories of the underlying neural code to agreater extent than would a more limited stimulus set. Second, wecharacterized the activity evoked in the three populations ofmechanoreceptive afferents to assess the extent to which eachafferent type contributes to perceived intensity. Following John-son’s approach, we then evaluated the extent to which predic-tions derived from each of a set of putative neural codes accountsfor subjective estimates of perceived intensity. An important as-sumption underlying this approach is that a linear relationship
Received April 2, 2007; revised Aug. 2, 2007; accepted Sept. 9, 2007.This work was supported by National Institutes of Health Grants NS-18787, NS-38034, DC-00095, and DC-00023.
We thank Ashley Watson for assistance with data collection and James Craig for careful reading of this manuscript.Correspondence should be addressed to Sliman J. Bensmaia, Krieger MindBrain Institute, Johns Hopkins Univer-
sity, Baltimore, MD 21218. E-mail: [email protected]:10.1523/JNEUROSCI.1486-07.2007
Copyright © 2007 Society for Neuroscience 0270-6474/07/2711687-13$15.00/0
The Journal of Neuroscience, October 24, 2007 • 27(43):11687–11699 • 11687
exists between the aspect of the neural ac-tivity that is relevant to the subjective ex-perience (in this case, perceived intensity)and the subjective experience itself (John-son et al., 2002). Finally, we discuss the im-plications of the present neurophysiologi-cal findings to the central mechanisms ofintensity coding.
Materials and MethodsApparatusTwo different simulators were used to deliverwell controlled vibratory stimuli. High-frequency stimuli were delivered with a Mini-Shaker (Type 4810; Bruel and Kjaer, Nærum,Denmark) driven by a power amplifier (Type2706; Bruel and Kjaer). Low-frequency vibra-tions were delivered using a custom-madeChubbuck motor (Chubbuck, 1966), driven bya servo-controlled amplifier and equipped witha high-precision linear variable displacementtransducer (LVDT) with micrometer-resolution. The input voltage to both amplifiers,under computer control, was generated using adigital-to-analog card (PCI-6229; output rate �20 kHz; National Instruments, Austin, TX).
Mini-Shaker movements were monitored us-ing an accelerometer (Type 8702B50M1; KistlerInstrument Corporation, Amherst, NY) with adynamic range of �50 � g. The threaded studon the top of the accelerometer was mounteddirectly to the Mini-Shaker motor, and the studof the stylus was attached to the bottom of theaccelerometer. The output of the accelerometerwas amplified and conditioned using a pi-ezotron coupler (Type 5134A; Kistler Instru-ment Corporation) and then digitized (PCI-6229; sampling rate � 20 kHz; NationalInstruments). The same analog-to-digital cardwas used to digitize the output of the LVDT.
The contactor consisted of a steel-tipped sty-lus fixed to both the table of the Chubbuck andthe threaded bottom of the accelerometer onthe Mini-Shaker. The stylus was 175 mm longwith a radius of 12.5 mm and a weight of 12.5 g. The stylus was machinedout of Carbon Afferent and Ultem (GE, Pittsfield, MA), a light-weightand rigid polyimide thermoplastic resin. The stylus was outfitted with asteel tip, embedded into the hollow shaft, and secured with a setscrew.The steel tip introduced an additional 3.2 g and 15 mm to the stylus. Thetip of the stylus was flat and had a diameter of 1 mm (cf. Freeman andJohnson, 1982b).
The effect of environmental vibrations was minimized using a floatingtable (Type MICRO-g; Technical Manufacturing Corporation, Peabody,MA), on which the entire experimental setup (including the animal) wasplaced. The motors were held securely and could be coarsely positionedusing a heavy-duty multiaxis Linhof camera positioning system (LinhofPrazisions-Systemtechnik, Munich, Germany), which was also securedto the floating table. A Newport ball bearing linear stage (UMR8.51; New-port Corporation, Irvine, CA) was bolted onto the end of the Linhof systemto finely position the motors along the z-axis (i.e., into the skin). Finally, themotors were secured onto the stage using a custom-built clamp.
The Chubbuck displacement sensor was calibrated using an Optodynelaser interferometer (LDS 1000; Optodyne, Compton, CA), capable ofmeasuring absolute displacement to submicrometer resolution. The ac-tual position, as measured by the interferometer, was regressed onto theoutput of the position sensor. The Chubbuck has a linear frequencyresponse up to �50 Hz with a slow roll-off with further increases infrequency. To compensate for the amplitude roll-off, we ran the Chub-
buck through a wide range of amplitudes at each of the frequencies usedin the experiment. From the cross-correlation between desired and ac-tual motor positions, we found the peaks of the sinusoids at each fre-quency–amplitude pair and determined the actual amplitude achieved.We then fit the measured amplitudes to the commanded amplitudes foreach frequency using second-order polynomials. We also implementedphase compensation using a lookup table at each frequency. This com-pensation was critical in generating accurate diharmonic waveforms withprespecified phase relationships.
Whenever possible, we created specific compensations for specific fre-quencies across a wide range of amplitudes (as described above), but thistechnique becomes impractical for stimuli requiring a larger set of fre-quencies, such as bandpass noise. For those stimuli, we created a fre-quency filter: We measured the Chubbuck’s frequency and phaseresponse up to 200 Hz and acquired the motor transfer function. Wethen used the inverted frequency and phase response curves, interpo-lated or decimated to match the stimulus sample size, to compensatecomplex stimuli. The frequency filter was also used to generate band-pass noise. Frequency filters produced less accurate compensationthan the frequency and phase compensation described above, but wewere still able to faithfully reproduce the desired waveforms (Figs. 1,2, bottom panels).
Analogous compensation procedures were implemented for the Mini-Shaker using the output of the accelerometer as feedback to generate thedesired acceleration signals.
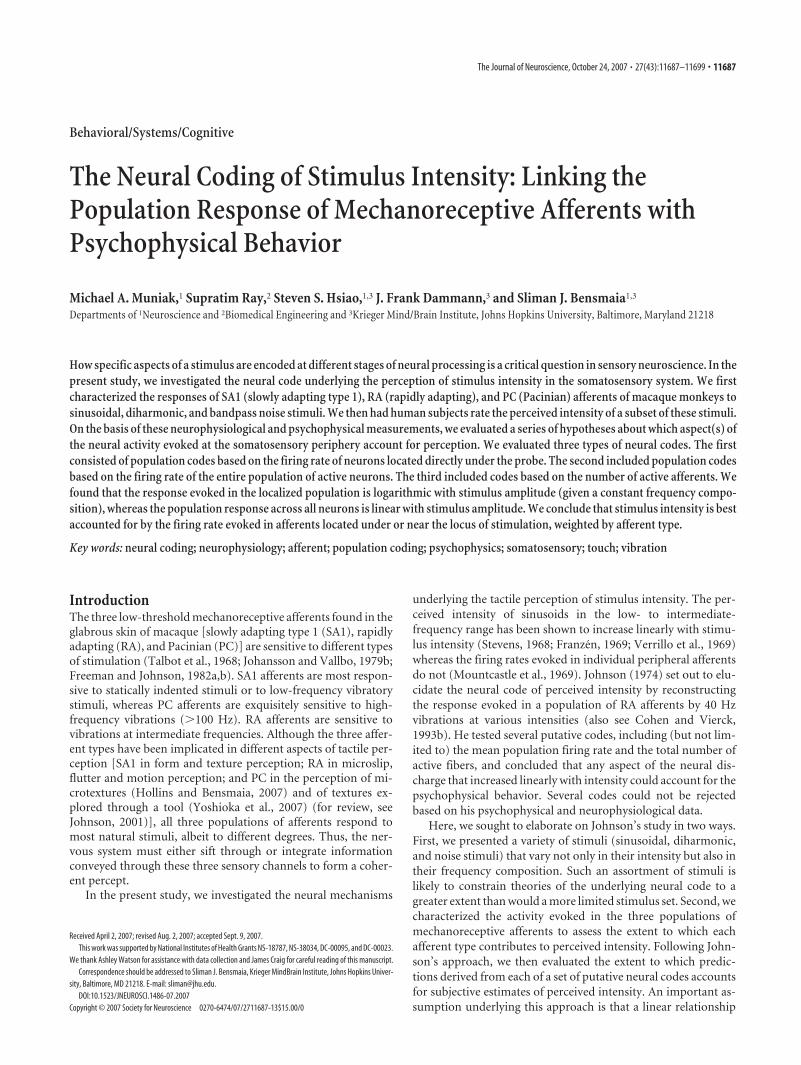
Figure 1. Spike-time rasters showing the responses of 8 SA1 (cyan), 15 RA (magenta), and 7 PC (brown) afferents to a 20 Hzsinusoid with amplitudes of 35 (left), 130 (center), and 250 �m (right). Each alternating shaded and unshaded patch correspondsto the responses of a given afferent to five presentations of the same stimulus. The bottom traces show the stimulus position as afunction of time for all of the stimulus presentations.
11688 • J. Neurosci., October 24, 2007 • 27(43):11687–11699 Muniak et al. • Neural Coding of Stimulus Intensity
Because the Chubbuck stimulator provides a force output, we alsomeasured the forces exerted on the skin during vibratory stimulation andfound that these ranged from nearly 0 to 25 � g (pressure � 0.32N/mm 2).
StimuliStimuli varied widely in their frequency content and amplitude and in-cluded simple sinusoidal, diharmonic, and noise stimuli. The Mini-Shaker was used to deliver stimuli that included frequency components�100 Hz, and the Chubbuck was used to deliver all other stimuli.
Sinusoids. Sinusoids were presented at 1, 5, 10, 25, 60, 100, 150, 200,250, 300, 400, 500, 600, 800, and 1000 Hz. At 1 Hz, amplitudes rangedfrom 5 to 360 �m, zero-to-peak; at 10 Hz, from 2.5 to 130 �m; at 100 Hz,from 0.5 to 130 �m; at 1000 Hz, from 0.17 to 8 �m. The stimulusduration was either five stimulus cycles or 0.1 s, whichever was longer. Ateach frequency, amplitudes were incremented in equal logarithmic stepsover the total range.
Diharmonic stimuli. Diharmonic stimuli were specified using the fol-lowing expression:
x�t� � A1sin��1t� � A2sin��2t � �� , (1)
where A1 and A2 are the amplitudes of the low- and high- frequencycomponents, respectively, �1 and �2 are the two frequencies (�1 � �2),
and � is the phase of the high-frequency com-ponent relative to that of the low-frequencycomponent. The (�1, �2) frequency pairs areshown in Table 1. Component amplitudesranged from 2 to 125 �m if their frequency was�100 Hz, from 2 to 100 �m at 100 and 125 Hz,and from 0.1 to 5 �m at 1000 Hz. The phase �took on one of four values: 0, �/2, �, or 3�/2.The stimulus duration was either five stimuluscycles (i.e., five cycles of the low-frequencycomponent) or 0.1 s, whichever was longer. Theamplitudes of the two frequency componentswere incremented in equal logarithmic stepsover their respective ranges.
Bandpass noise stimuli. Stimuli were gener-ated by first creating wide-band noise, thenbandpass filtering it to the specified frequencyrange. Each noise stimulus was then scaled to aset of predetermined rms amplitudes, namely 0.5,1, 5, 10, and 50 �m. The bandpass cutoff frequen-cies of the noise stimuli are shown in Table 2. Theduration of all noise stimuli was 1 s.
Each stimulus was preceded and followed bya period of no stimulation to reduce the effectsof vibratory adaptation (Bensmaia et al., 2005b;Leung et al., 2005) and to allow us to establishthe spontaneous firing rates of each afferent(which were typically near zero). The inter-stimulus interval was 100 ms for sinusoidal anddiharmonic stimuli and 1 s for noise stimuli.
SubjectsThe nine psychophysical subjects (four femalesand five males), all students or employees atJohns Hopkins University, were paid for theirparticipation. They ranged in age from 19 to 24years. Consent was obtained from each subject.The Human Subjects Institutional ReviewBoard of Johns Hopkins University approvedthe experiments.
NeurophysiologyAll experimental protocols complied with theguidelines of the Johns Hopkins University Ani-mal Care and Use Committee and the NationalInstitutes of Health Guide for the Care and Use ofLaboratory Animals. Single-unit recordings were
made from the ulnar and median nerves of two anesthetized macaque mon-keys (Macaca mulatta) using standard methods (Talbot et al., 1968). Stan-dard procedures were used to classify mechanoreceptive afferents accordingto their responses to step indentations and vibratory stimulation (Talbot etal., 1968; Freeman and Johnson, 1982b). An afferent was classified as SA1 if itproduced sustained firing in response to a step indentation. It was classifiedas RA if it had a small receptive field (RF) and responded only to the onsetand offset of an indentation. It was classified as PC if (1) it was vigorouslyactivated by air blown gently over the hand; (2) it was activated by transmit-ted vibrations produced by tapping on the hand restraint; and (3) its recep-tive field was large. The point of maximum sensitivity of the afferent (orhotspot) was located on the skin using a handheld probe and then markedwith a felt-point pen. The stimulator probe was centered on the hotspot ofthe afferent to the extent possible (PC RFs do not have clear hotspots). Thetip of the probe was fixed with cyanoacrylate glue to the skin at its restingposition, i.e., with no preindentation.
PsychophysicsThe subjects’ arm rested on a padded arm-rest, and their view of thestimulator was obstructed by a curtain. Subjects wore earphones playingpink noise to eliminate auditory cues. The stimulator assembly wasplaced on a separate platform than that on which the armrest was fixed toisolate the subject from unwanted vibrations. Before each experimental
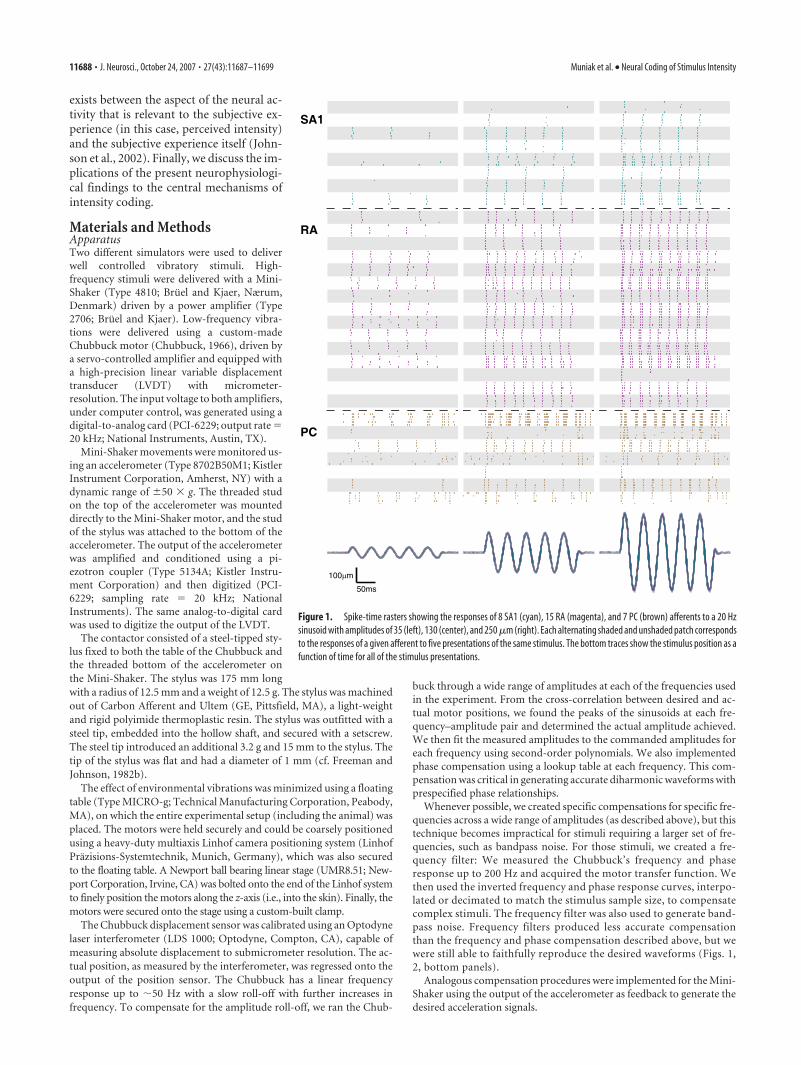
Figure 2. Spike-time rasters showing the responses of 8 SA1 (cyan), 16 RA (magenta), and 7 PC (brown) afferents to bandpassnoise (5–100 Hz) with rms amplitudes of 5 (left), 10 (center), and 50 (right) �m. Each alternating shaded and unshaded patchcorresponds to the responses of a given afferent to five presentations of the same stimulus. The bottom traces show the stimulusposition as a function of time for all of the stimulus presentations. From the almost complete overlap of the traces, it can be seenthat the stimulus was remarkably consistent across recording days.
Muniak et al. • Neural Coding of Stimulus Intensity J. Neurosci., October 24, 2007 • 27(43):11687–11699 • 11689
block, the stimulus probe was lowered until it just contacted the skin.Subjects were presented with 74 vibratory stimuli (selected as describedin Results) presented in pseudorandom order. On each trial, subjectsproduced magnitude estimates of perceived intensity on a ratio scale. Ifthe stimulus was imperceptible, they were to assign to it the number 0. Ina given experimental block, the first rating was arbitrary (unless thestimulus was not perceived). They were instructed to produce a numbertwice as large if the next stimulus felt twice as intense, or a numberone-half as large if the stimulus felt one-half as intense. They were en-couraged to use decimals or fractions if they deemed it necessary. Thestimulus duration was 1 s. In the first experimental block, subjects rateda subset of 20 stimuli for practice. The practice block was followed by fiveexperimental blocks in which archival data were collected. Psychophys-ical ratings were normalized by the mean rating obtained in each exper-imental block then averaged across blocks and subjects. In one of theexperimental blocks, the probe tip was glued to the skin to mimic thestimulus conditions used in the neurophysiological recordings. The pres-ence or absence of glue had no effect on subjects’ ratings: The correlationbetween the mean ratings obtained in the glued and unglued conditionswas 0.98; a paired t test revealed that the difference between the sets ofratings was nil (t(73) � 0, p � 1).
ResultsWe recorded neural responses from 12 SA1, 17 RA, and 8 PCafferents with RFs on the glabrous surface of the hand. Figure 1shows representative afferent responses to five presentations of a20 Hz sinusoid at different amplitudes. Individual afferents pro-duced highly consistent responses across presentations of thesame stimulus, whereas responses varied substantially across af-ferent types or even across afferents of a given type. For instance,in response to a 20 Hz sinusoid of amplitude 35 �m, four RAafferents responded robustly with one impulse per cycle, anotherseven fired less than once per cycle, and the remaining four failedto respond entirely. All afferents were probed at their point ofmaximum sensitivity (except for PC afferents, which lack a de-fined hotspot) so this variability in the neural response cannot beascribed to differences in the locus of stimulation relative to theafferent’s RF. Note that, as stimulus intensity increased, moreafferents were recruited, i.e., produced a response above theirspontaneous activity (which was typically nil). Furthermore,within the subpopulations of active fibers, entrainment increasedwith increased stimulus amplitude.
When presented with a (5–100 Hz) (this notation denotes thelow- and high-frequency cutoffs of a noise stimulus) bandpassnoise stimulus, mechanoreceptive afferents also responded in anintensity-dependent manner, both in terms of firing rates and
total number of active afferents (Fig. 2). This is seen most clearlyin the responses of RA afferents: Only 2 of 16 RA afferents re-sponded to noise with an rms amplitude of 5 �m, whereas 10 of16 afferents responded to the 10 �m noise with mean rates rang-ing from 2 to 17 impulses per second, and 16 of 16 afferentsresponded to the 50 �m noise with mean rates ranging from 7 to64 impulses per second. As was seen in responses to sinusoids, awide variability in sensitivity was observed across afferents of agiven type. A difference in absolute sensitivity across afferenttypes is also readily apparent: at an rms amplitude of 5 �m, thenoise stimulus readily evoked robust responses from PC afferentsyet failed to elicit more than a handful of spikes from SA1 or RAafferents; in response to the 10 �m noise, some RA afferents wereactive, but SA1 afferents were still relatively silent; all afferenttypes responded robustly to the 50 �m stimulus.
From the raster plots shown in Figures 1 and 2, it can be seenthat at least two aspects of the afferent response changed withstimulus intensity: the firing rate evoked in individual afferentsand the total number of active afferents within each population ofafferents.
Individual rate–intensity functionsTo probe the relationship between stimulus parameters and af-ferent firing rates, we first examined how the impulse rate evokedin individual afferents varied with stimulus intensity. For theharmonic stimuli (sinusoidal and diharmonic stimuli), we mea-sured the response evoked by the stimulus in its steady state.Thus, we did not count spikes evoked during cycles that occurredduring the on or off ramps (and the stimulus duration was ad-justed accordingly). For diharmonic stimuli, stimulus cycles weredetermined on the basis of the lower-frequency component con-tained in the stimulus.
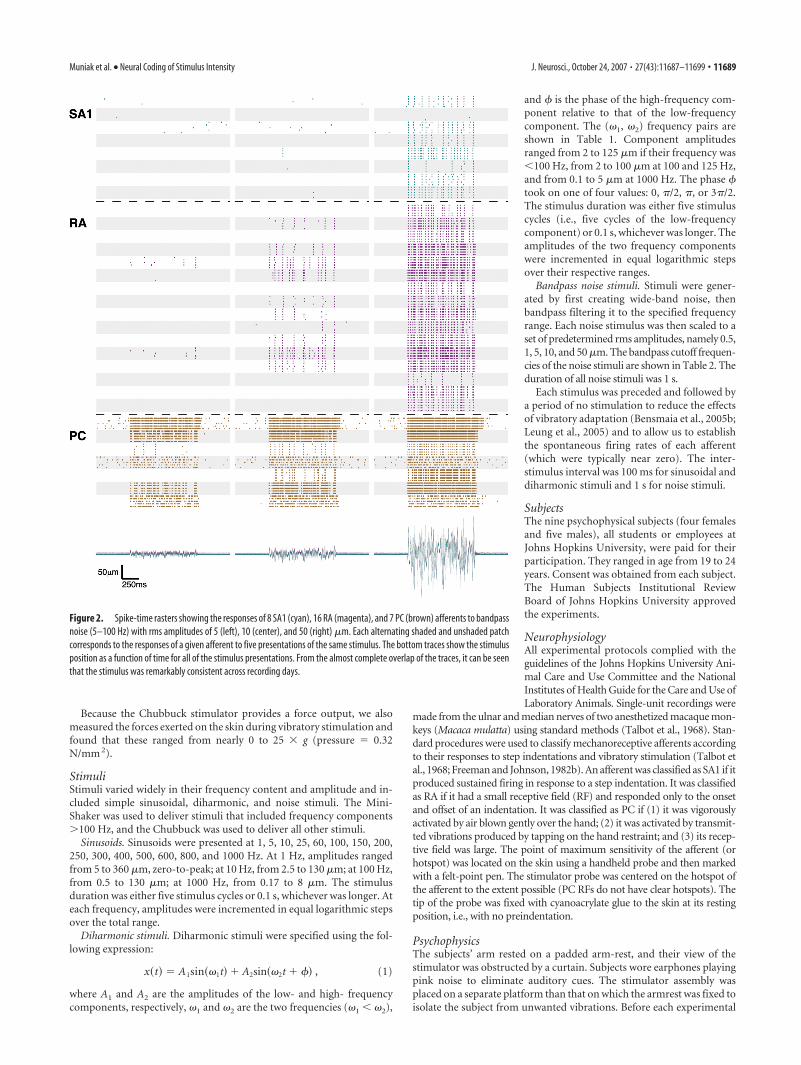
Figure 3 shows the rate–intensity functions obtained fromthree typical afferent fibers (one per afferent type) grouped ac-cording to frequency content: each trace corresponds to a partic-ular frequency (sinusoidal), pair of frequencies (diharmonic), orpair of bandpass cutoff frequencies (noise). The impulse rateevoked in each afferent type tends to increase as stimulus inten-sity increases, but the rate at which each afferent does so dependsboth on the afferent type and the frequency content of the stim-ulus. For example, the PC afferent is highly sensitive to high-frequency sinusoids (100, 300, and 600 Hz), responding even atsubmicrometer amplitudes, whereas the SA1 and RA afferents donot respond to these stimuli until amplitudes almost two ordersof magnitude higher. Conversely, PC responses to the low-frequency sinusoid (20 Hz) are weaker than their SA1 and RAcounterparts. Furthermore, absolute thresholds (the minimumamplitude to evoke a response) and the slopes of the rate–inten-sity functions are virtually independent of frequency for the SA1afferents (i.e., the traces tend to overlap), whereas these are highlyfrequency dependent for the PC fiber. RA responses exhibit in-termediate frequency dependence.
Mechanoreceptive afferents often exhibit entrained responsesto sinusoidal stimuli (i.e., an integral number of impulses percycle) over wide ranges of amplitudes (Talbot et al., 1968; John-son, 1974; Bensmaia et al., 2005b). This phenomenon is clearlyshown in the PC afferent’s response to the high-frequency sinu-soids (100, 300, and 600 Hz); for instance, at 300 Hz, the afferentresponds at 300 impulses per second (once per cycle) for stimulusamplitudes ranging from 4.2 through 85 �m. Thus, this afferent’sfiring rate provides no information about stimulus intensity overthis range of amplitudes. Indeed, this is a common problem: thePC response is entrained over the range of amplitudes tested for
Table 1. Frequency pairs in the set of diharmonic stimuli
�1 (Hz) �2 (Hz)
5 10, 15, 25, 50, 10010 20, 30, 50, 10025 50, 75, 125, 250, 500, 100050 150, 250, 500, 1000100 200, 300, 500200 400, 600, 1000400 800
Table 2. Low- (f1) and high- (f2) frequency cutoffs for the noise stimuli
f1 (Hz) f2 (Hz)
5 10, 25, 50, 10025 50, 125, 250, 50050 100, 250, 500, 1000
11690 • J. Neurosci., October 24, 2007 • 27(43):11687–11699 Muniak et al. • Neural Coding of Stimulus Intensity
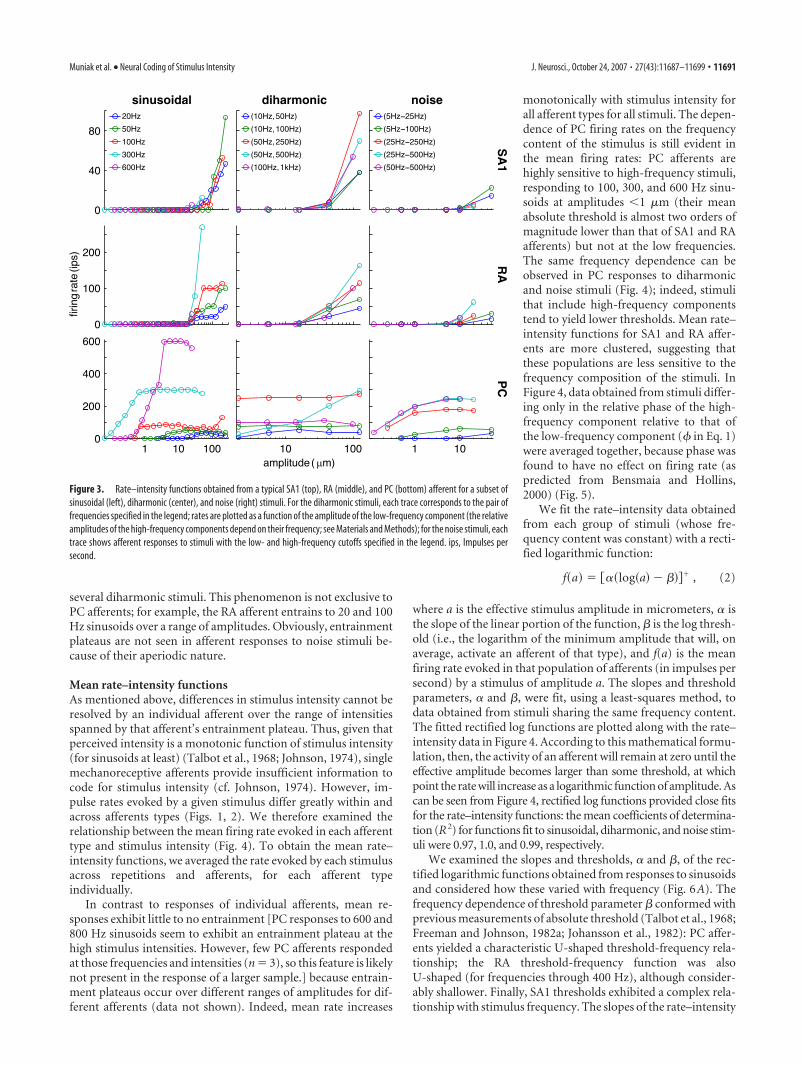
several diharmonic stimuli. This phenomenon is not exclusive toPC afferents; for example, the RA afferent entrains to 20 and 100Hz sinusoids over a range of amplitudes. Obviously, entrainmentplateaus are not seen in afferent responses to noise stimuli be-cause of their aperiodic nature.
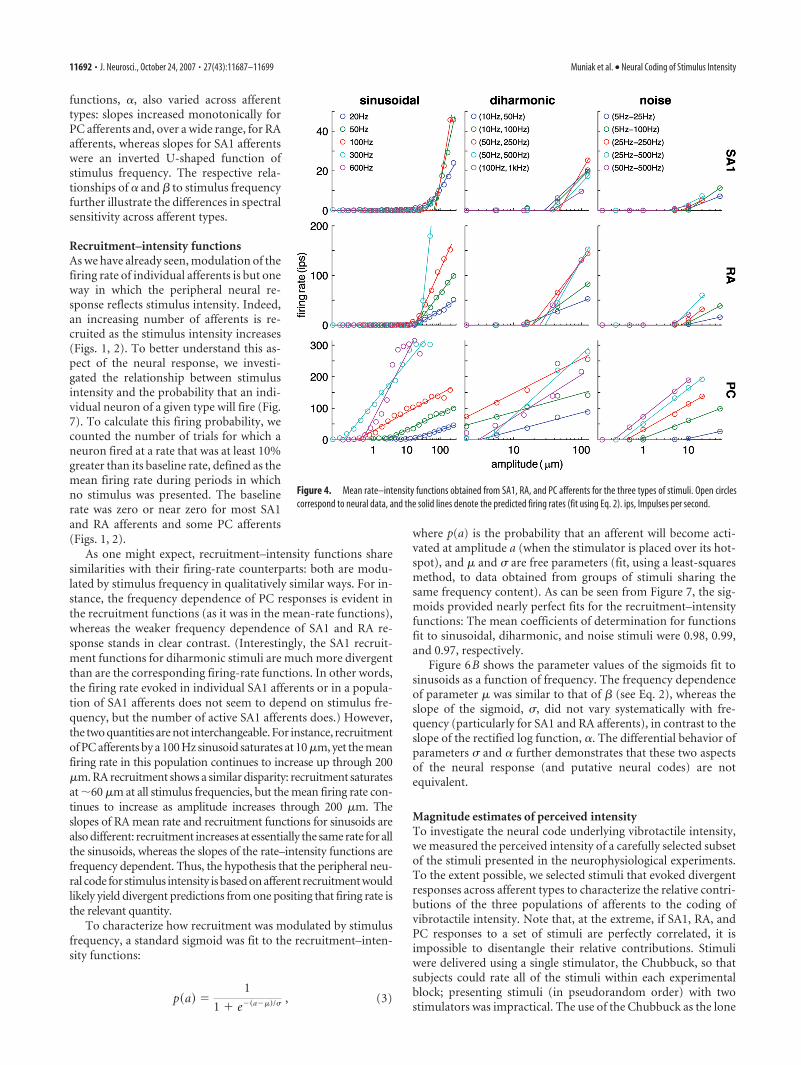
Mean rate–intensity functionsAs mentioned above, differences in stimulus intensity cannot beresolved by an individual afferent over the range of intensitiesspanned by that afferent’s entrainment plateau. Thus, given thatperceived intensity is a monotonic function of stimulus intensity(for sinusoids at least) (Talbot et al., 1968; Johnson, 1974), singlemechanoreceptive afferents provide insufficient information tocode for stimulus intensity (cf. Johnson, 1974). However, im-pulse rates evoked by a given stimulus differ greatly within andacross afferents types (Figs. 1, 2). We therefore examined therelationship between the mean firing rate evoked in each afferenttype and stimulus intensity (Fig. 4). To obtain the mean rate–intensity functions, we averaged the rate evoked by each stimulusacross repetitions and afferents, for each afferent typeindividually.
In contrast to responses of individual afferents, mean re-sponses exhibit little to no entrainment [PC responses to 600 and800 Hz sinusoids seem to exhibit an entrainment plateau at thehigh stimulus intensities. However, few PC afferents respondedat those frequencies and intensities (n � 3), so this feature is likelynot present in the response of a larger sample.] because entrain-ment plateaus occur over different ranges of amplitudes for dif-ferent afferents (data not shown). Indeed, mean rate increases
monotonically with stimulus intensity forall afferent types for all stimuli. The depen-dence of PC firing rates on the frequencycontent of the stimulus is still evident inthe mean firing rates: PC afferents arehighly sensitive to high-frequency stimuli,responding to 100, 300, and 600 Hz sinu-soids at amplitudes �1 �m (their meanabsolute threshold is almost two orders ofmagnitude lower than that of SA1 and RAafferents) but not at the low frequencies.The same frequency dependence can beobserved in PC responses to diharmonicand noise stimuli (Fig. 4); indeed, stimulithat include high-frequency componentstend to yield lower thresholds. Mean rate–intensity functions for SA1 and RA affer-ents are more clustered, suggesting thatthese populations are less sensitive to thefrequency composition of the stimuli. InFigure 4, data obtained from stimuli differ-ing only in the relative phase of the high-frequency component relative to that ofthe low-frequency component (� in Eq. 1)were averaged together, because phase wasfound to have no effect on firing rate (aspredicted from Bensmaia and Hollins,2000) (Fig. 5).
We fit the rate–intensity data obtainedfrom each group of stimuli (whose fre-quency content was constant) with a recti-fied logarithmic function:
f�a� � ��log�a� � �� , (2)
where a is the effective stimulus amplitude in micrometers, � isthe slope of the linear portion of the function, is the log thresh-old (i.e., the logarithm of the minimum amplitude that will, onaverage, activate an afferent of that type), and f(a) is the meanfiring rate evoked in that population of afferents (in impulses persecond) by a stimulus of amplitude a. The slopes and thresholdparameters, � and , were fit, using a least-squares method, todata obtained from stimuli sharing the same frequency content.The fitted rectified log functions are plotted along with the rate–intensity data in Figure 4. According to this mathematical formu-lation, then, the activity of an afferent will remain at zero until theeffective amplitude becomes larger than some threshold, at whichpoint the rate will increase as a logarithmic function of amplitude. Ascan be seen from Figure 4, rectified log functions provided close fitsfor the rate–intensity functions: the mean coefficients of determina-tion (R2) for functions fit to sinusoidal, diharmonic, and noise stim-uli were 0.97, 1.0, and 0.99, respectively.
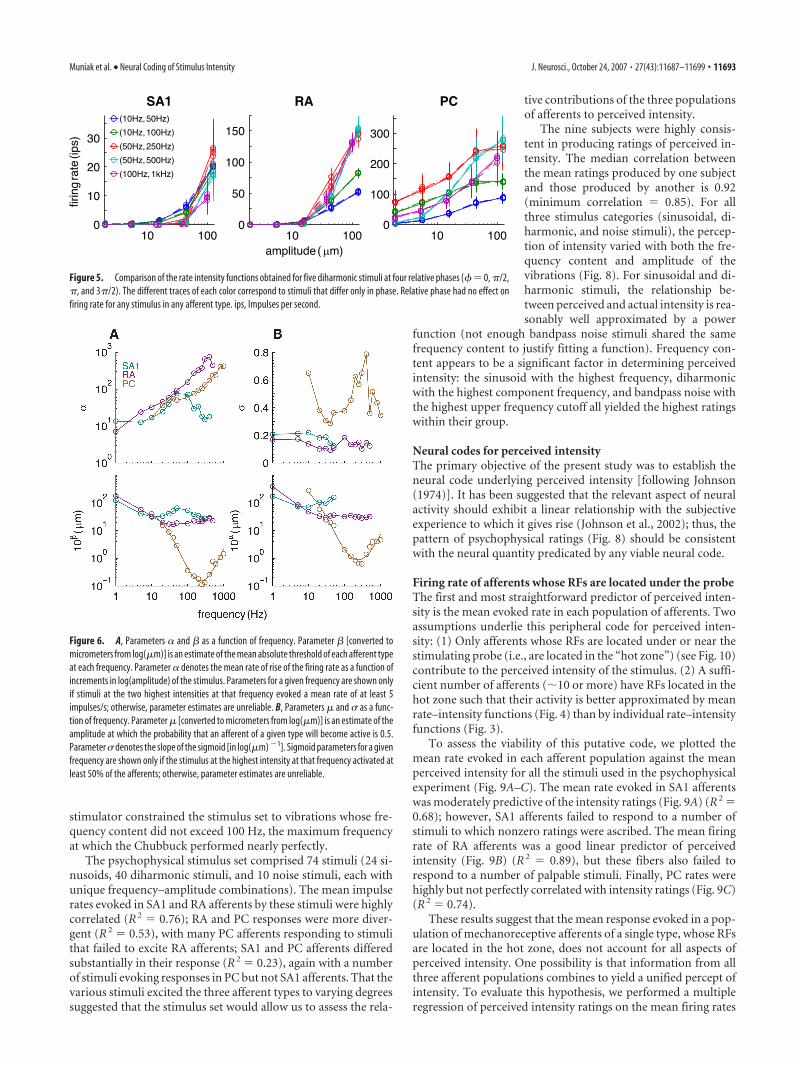
We examined the slopes and thresholds, � and , of the rec-tified logarithmic functions obtained from responses to sinusoidsand considered how these varied with frequency (Fig. 6A). Thefrequency dependence of threshold parameter conformed withprevious measurements of absolute threshold (Talbot et al., 1968;Freeman and Johnson, 1982a; Johansson et al., 1982): PC affer-ents yielded a characteristic U-shaped threshold-frequency rela-tionship; the RA threshold-frequency function was alsoU-shaped (for frequencies through 400 Hz), although consider-ably shallower. Finally, SA1 thresholds exhibited a complex rela-tionship with stimulus frequency. The slopes of the rate–intensity
Figure 3. Rate–intensity functions obtained from a typical SA1 (top), RA (middle), and PC (bottom) afferent for a subset ofsinusoidal (left), diharmonic (center), and noise (right) stimuli. For the diharmonic stimuli, each trace corresponds to the pair offrequencies specified in the legend; rates are plotted as a function of the amplitude of the low-frequency component (the relativeamplitudes of the high-frequency components depend on their frequency; see Materials and Methods); for the noise stimuli, eachtrace shows afferent responses to stimuli with the low- and high-frequency cutoffs specified in the legend. ips, Impulses persecond.
Muniak et al. • Neural Coding of Stimulus Intensity J. Neurosci., October 24, 2007 • 27(43):11687–11699 • 11691
functions, �, also varied across afferenttypes: slopes increased monotonically forPC afferents and, over a wide range, for RAafferents, whereas slopes for SA1 afferentswere an inverted U-shaped function ofstimulus frequency. The respective rela-tionships of � and to stimulus frequencyfurther illustrate the differences in spectralsensitivity across afferent types.
Recruitment–intensity functionsAs we have already seen, modulation of thefiring rate of individual afferents is but oneway in which the peripheral neural re-sponse reflects stimulus intensity. Indeed,an increasing number of afferents is re-cruited as the stimulus intensity increases(Figs. 1, 2). To better understand this as-pect of the neural response, we investi-gated the relationship between stimulusintensity and the probability that an indi-vidual neuron of a given type will fire (Fig.7). To calculate this firing probability, wecounted the number of trials for which aneuron fired at a rate that was at least 10%greater than its baseline rate, defined as themean firing rate during periods in whichno stimulus was presented. The baselinerate was zero or near zero for most SA1and RA afferents and some PC afferents(Figs. 1, 2).
As one might expect, recruitment–intensity functions sharesimilarities with their firing-rate counterparts: both are modu-lated by stimulus frequency in qualitatively similar ways. For in-stance, the frequency dependence of PC responses is evident inthe recruitment functions (as it was in the mean-rate functions),whereas the weaker frequency dependence of SA1 and RA re-sponse stands in clear contrast. (Interestingly, the SA1 recruit-ment functions for diharmonic stimuli are much more divergentthan are the corresponding firing-rate functions. In other words,the firing rate evoked in individual SA1 afferents or in a popula-tion of SA1 afferents does not seem to depend on stimulus fre-quency, but the number of active SA1 afferents does.) However,the two quantities are not interchangeable. For instance, recruitmentof PC afferents by a 100 Hz sinusoid saturates at 10 �m, yet the meanfiring rate in this population continues to increase up through 200�m. RA recruitment shows a similar disparity: recruitment saturatesat �60 �m at all stimulus frequencies, but the mean firing rate con-tinues to increase as amplitude increases through 200 �m. Theslopes of RA mean rate and recruitment functions for sinusoids arealso different: recruitment increases at essentially the same rate for allthe sinusoids, whereas the slopes of the rate–intensity functions arefrequency dependent. Thus, the hypothesis that the peripheral neu-ral code for stimulus intensity is based on afferent recruitment wouldlikely yield divergent predictions from one positing that firing rate isthe relevant quantity.
To characterize how recruitment was modulated by stimulusfrequency, a standard sigmoid was fit to the recruitment–inten-sity functions:
p�a� �1
1 � e��a���/ , (3)
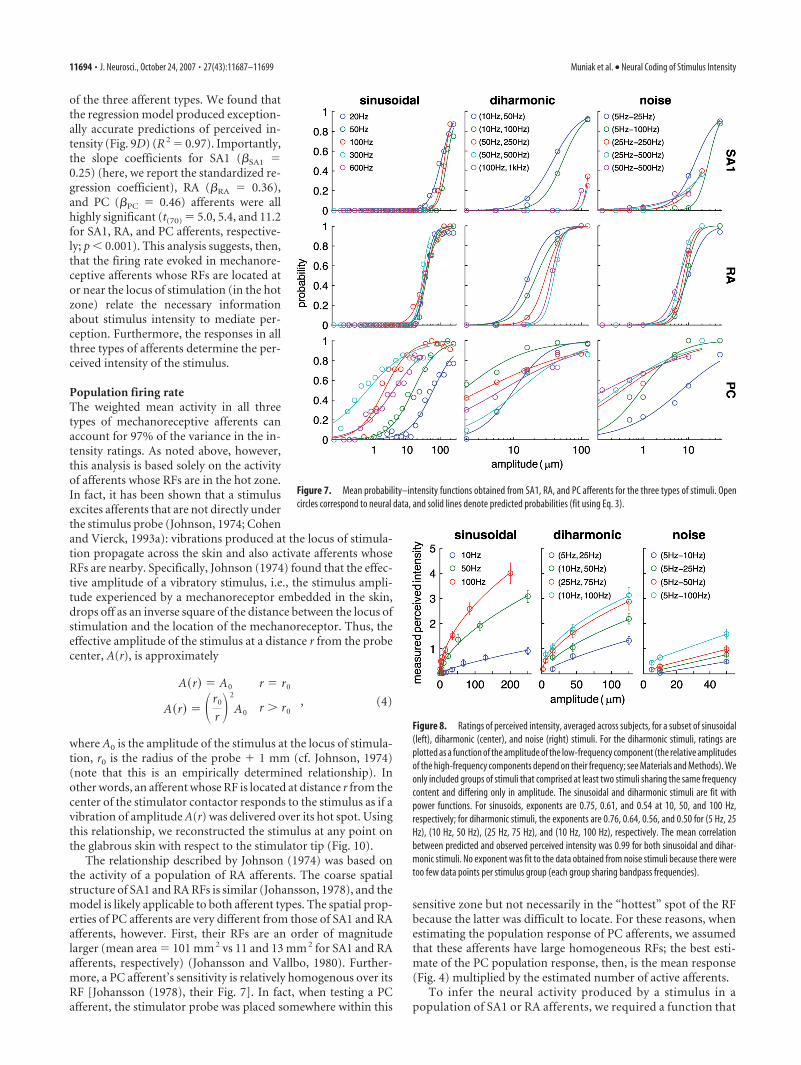
where p(a) is the probability that an afferent will become acti-vated at amplitude a (when the stimulator is placed over its hot-spot), and � and are free parameters (fit, using a least-squaresmethod, to data obtained from groups of stimuli sharing thesame frequency content). As can be seen from Figure 7, the sig-moids provided nearly perfect fits for the recruitment–intensityfunctions: The mean coefficients of determination for functionsfit to sinusoidal, diharmonic, and noise stimuli were 0.98, 0.99,and 0.97, respectively.
Figure 6B shows the parameter values of the sigmoids fit tosinusoids as a function of frequency. The frequency dependenceof parameter � was similar to that of (see Eq. 2), whereas theslope of the sigmoid, , did not vary systematically with fre-quency (particularly for SA1 and RA afferents), in contrast to theslope of the rectified log function, �. The differential behavior ofparameters and � further demonstrates that these two aspectsof the neural response (and putative neural codes) are notequivalent.
Magnitude estimates of perceived intensityTo investigate the neural code underlying vibrotactile intensity,we measured the perceived intensity of a carefully selected subsetof the stimuli presented in the neurophysiological experiments.To the extent possible, we selected stimuli that evoked divergentresponses across afferent types to characterize the relative contri-butions of the three populations of afferents to the coding ofvibrotactile intensity. Note that, at the extreme, if SA1, RA, andPC responses to a set of stimuli are perfectly correlated, it isimpossible to disentangle their relative contributions. Stimuliwere delivered using a single stimulator, the Chubbuck, so thatsubjects could rate all of the stimuli within each experimentalblock; presenting stimuli (in pseudorandom order) with twostimulators was impractical. The use of the Chubbuck as the lone
Figure 4. Mean rate–intensity functions obtained from SA1, RA, and PC afferents for the three types of stimuli. Open circlescorrespond to neural data, and the solid lines denote the predicted firing rates (fit using Eq. 2). ips, Impulses per second.
11692 • J. Neurosci., October 24, 2007 • 27(43):11687–11699 Muniak et al. • Neural Coding of Stimulus Intensity
stimulator constrained the stimulus set to vibrations whose fre-quency content did not exceed 100 Hz, the maximum frequencyat which the Chubbuck performed nearly perfectly.
The psychophysical stimulus set comprised 74 stimuli (24 si-nusoids, 40 diharmonic stimuli, and 10 noise stimuli, each withunique frequency–amplitude combinations). The mean impulserates evoked in SA1 and RA afferents by these stimuli were highlycorrelated (R 2 � 0.76); RA and PC responses were more diver-gent (R 2 � 0.53), with many PC afferents responding to stimulithat failed to excite RA afferents; SA1 and PC afferents differedsubstantially in their response (R 2 � 0.23), again with a numberof stimuli evoking responses in PC but not SA1 afferents. That thevarious stimuli excited the three afferent types to varying degreessuggested that the stimulus set would allow us to assess the rela-
tive contributions of the three populationsof afferents to perceived intensity.
The nine subjects were highly consis-tent in producing ratings of perceived in-tensity. The median correlation betweenthe mean ratings produced by one subjectand those produced by another is 0.92(minimum correlation � 0.85). For allthree stimulus categories (sinusoidal, di-harmonic, and noise stimuli), the percep-tion of intensity varied with both the fre-quency content and amplitude of thevibrations (Fig. 8). For sinusoidal and di-harmonic stimuli, the relationship be-tween perceived and actual intensity is rea-sonably well approximated by a power
function (not enough bandpass noise stimuli shared the samefrequency content to justify fitting a function). Frequency con-tent appears to be a significant factor in determining perceivedintensity: the sinusoid with the highest frequency, diharmonicwith the highest component frequency, and bandpass noise withthe highest upper frequency cutoff all yielded the highest ratingswithin their group.
Neural codes for perceived intensityThe primary objective of the present study was to establish theneural code underlying perceived intensity [following Johnson(1974)]. It has been suggested that the relevant aspect of neuralactivity should exhibit a linear relationship with the subjectiveexperience to which it gives rise (Johnson et al., 2002); thus, thepattern of psychophysical ratings (Fig. 8) should be consistentwith the neural quantity predicated by any viable neural code.
Firing rate of afferents whose RFs are located under the probeThe first and most straightforward predictor of perceived inten-sity is the mean evoked rate in each population of afferents. Twoassumptions underlie this peripheral code for perceived inten-sity: (1) Only afferents whose RFs are located under or near thestimulating probe (i.e., are located in the “hot zone”) (see Fig. 10)contribute to the perceived intensity of the stimulus. (2) A suffi-cient number of afferents (�10 or more) have RFs located in thehot zone such that their activity is better approximated by meanrate–intensity functions (Fig. 4) than by individual rate–intensityfunctions (Fig. 3).
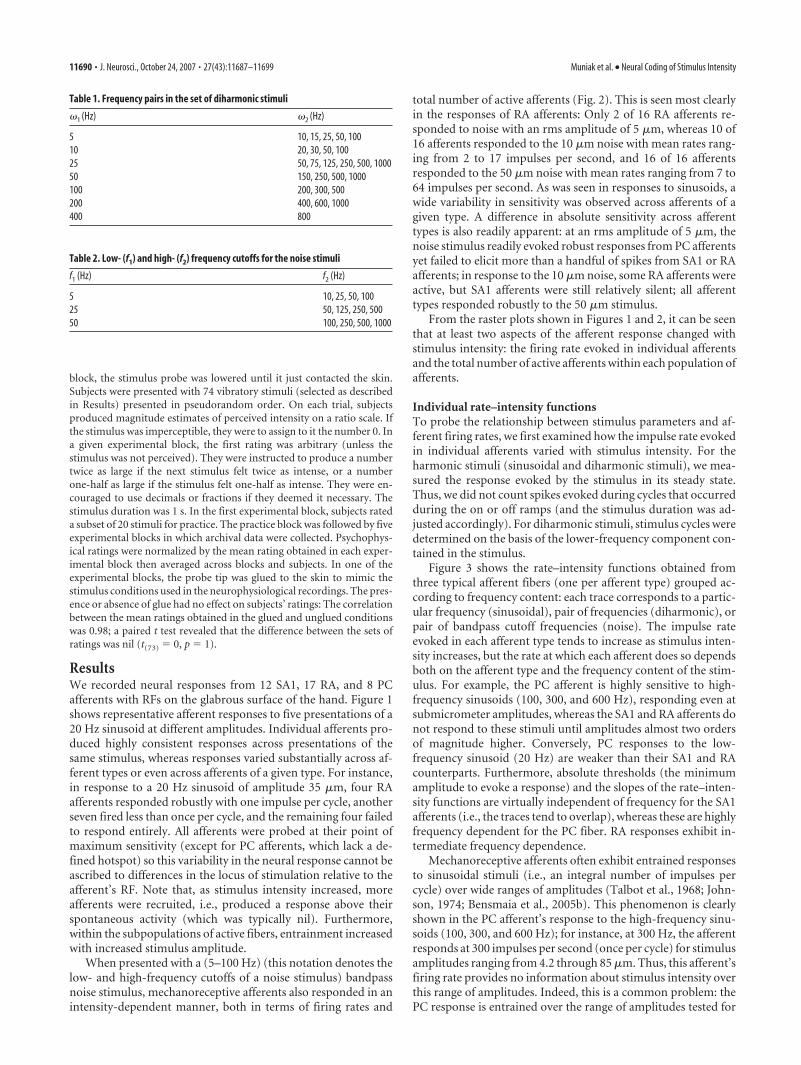
To assess the viability of this putative code, we plotted themean rate evoked in each afferent population against the meanperceived intensity for all the stimuli used in the psychophysicalexperiment (Fig. 9A–C). The mean rate evoked in SA1 afferentswas moderately predictive of the intensity ratings (Fig. 9A) (R 2 �0.68); however, SA1 afferents failed to respond to a number ofstimuli to which nonzero ratings were ascribed. The mean firingrate of RA afferents was a good linear predictor of perceivedintensity (Fig. 9B) (R 2 � 0.89), but these fibers also failed torespond to a number of palpable stimuli. Finally, PC rates werehighly but not perfectly correlated with intensity ratings (Fig. 9C)(R 2 � 0.74).
These results suggest that the mean response evoked in a pop-ulation of mechanoreceptive afferents of a single type, whose RFsare located in the hot zone, does not account for all aspects ofperceived intensity. One possibility is that information from allthree afferent populations combines to yield a unified percept ofintensity. To evaluate this hypothesis, we performed a multipleregression of perceived intensity ratings on the mean firing rates
Figure 5. Comparison of the rate intensity functions obtained for five diharmonic stimuli at four relative phases (�� 0, �/2,�, and 3�/2). The different traces of each color correspond to stimuli that differ only in phase. Relative phase had no effect onfiring rate for any stimulus in any afferent type. ips, Impulses per second.
Figure 6. A, Parameters � and as a function of frequency. Parameter [converted tomicrometers from log(�m)] is an estimate of the mean absolute threshold of each afferent typeat each frequency. Parameter � denotes the mean rate of rise of the firing rate as a function ofincrements in log(amplitude) of the stimulus. Parameters for a given frequency are shown onlyif stimuli at the two highest intensities at that frequency evoked a mean rate of at least 5impulses/s; otherwise, parameter estimates are unreliable. B, Parameters � and as a func-tion of frequency. Parameter � [converted to micrometers from log(�m)] is an estimate of theamplitude at which the probability that an afferent of a given type will become active is 0.5.Parameter denotes the slope of the sigmoid [in log(�m) �1]. Sigmoid parameters for a givenfrequency are shown only if the stimulus at the highest intensity at that frequency activated atleast 50% of the afferents; otherwise, parameter estimates are unreliable.
Muniak et al. • Neural Coding of Stimulus Intensity J. Neurosci., October 24, 2007 • 27(43):11687–11699 • 11693
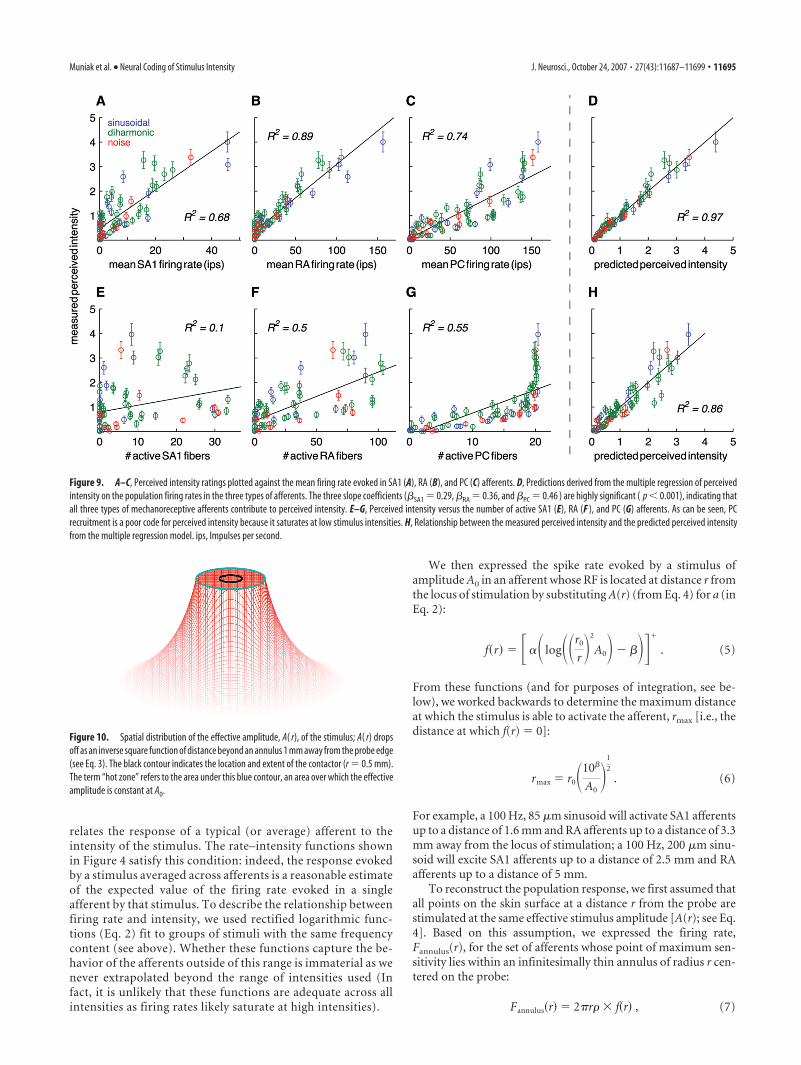
of the three afferent types. We found thatthe regression model produced exception-ally accurate predictions of perceived in-tensity (Fig. 9D) (R 2 � 0.97). Importantly,the slope coefficients for SA1 (SA1 �0.25) (here, we report the standardized re-gression coefficient), RA (RA � 0.36),and PC (PC � 0.46) afferents were allhighly significant (t(70) � 5.0, 5.4, and 11.2for SA1, RA, and PC afferents, respective-ly; p � 0.001). This analysis suggests, then,that the firing rate evoked in mechanore-ceptive afferents whose RFs are located ator near the locus of stimulation (in the hotzone) relate the necessary informationabout stimulus intensity to mediate per-ception. Furthermore, the responses in allthree types of afferents determine the per-ceived intensity of the stimulus.
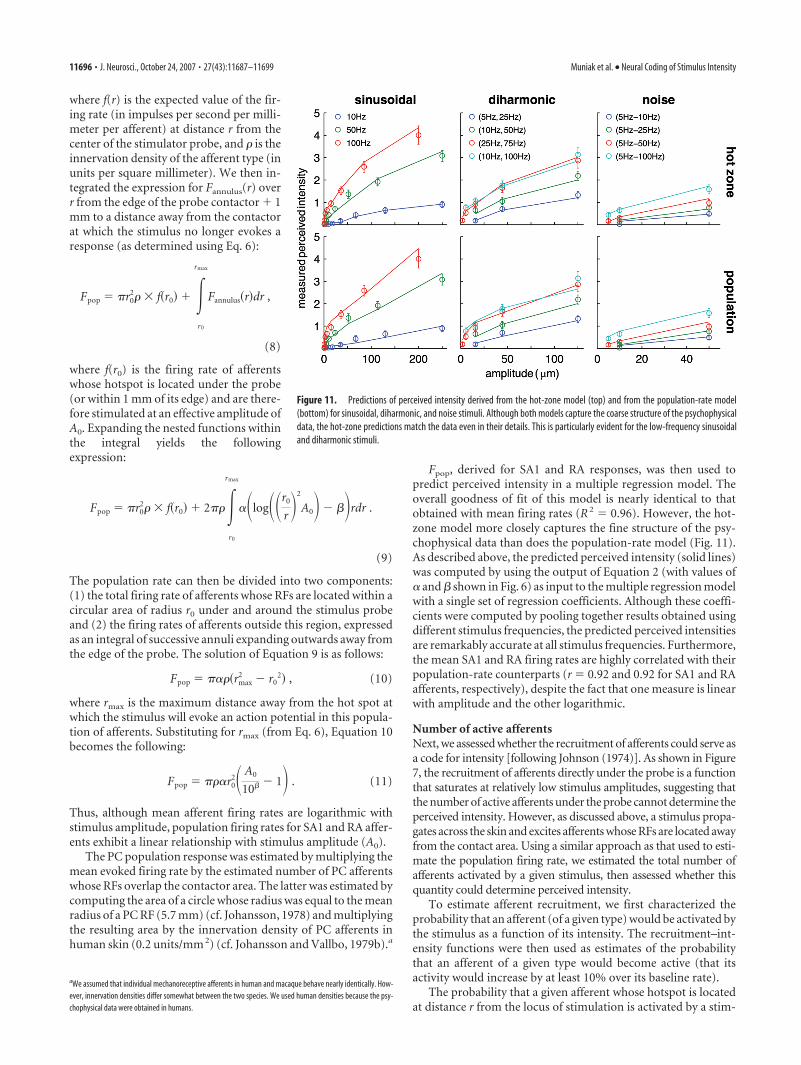
Population firing rateThe weighted mean activity in all threetypes of mechanoreceptive afferents canaccount for 97% of the variance in the in-tensity ratings. As noted above, however,this analysis is based solely on the activityof afferents whose RFs are in the hot zone.In fact, it has been shown that a stimulusexcites afferents that are not directly underthe stimulus probe (Johnson, 1974; Cohenand Vierck, 1993a): vibrations produced at the locus of stimula-tion propagate across the skin and also activate afferents whoseRFs are nearby. Specifically, Johnson (1974) found that the effec-tive amplitude of a vibratory stimulus, i.e., the stimulus ampli-tude experienced by a mechanoreceptor embedded in the skin,drops off as an inverse square of the distance between the locus ofstimulation and the location of the mechanoreceptor. Thus, theeffective amplitude of the stimulus at a distance r from the probecenter, A(r), is approximately
A�r� � A0 r � r0
A�r� � � r0
r �2
A0 r � r0, (4)
where A0 is the amplitude of the stimulus at the locus of stimula-tion, r0 is the radius of the probe � 1 mm (cf. Johnson, 1974)(note that this is an empirically determined relationship). Inother words, an afferent whose RF is located at distance r from thecenter of the stimulator contactor responds to the stimulus as if avibration of amplitude A(r) was delivered over its hot spot. Usingthis relationship, we reconstructed the stimulus at any point onthe glabrous skin with respect to the stimulator tip (Fig. 10).
The relationship described by Johnson (1974) was based onthe activity of a population of RA afferents. The coarse spatialstructure of SA1 and RA RFs is similar (Johansson, 1978), and themodel is likely applicable to both afferent types. The spatial prop-erties of PC afferents are very different from those of SA1 and RAafferents, however. First, their RFs are an order of magnitudelarger (mean area � 101 mm 2 vs 11 and 13 mm 2 for SA1 and RAafferents, respectively) (Johansson and Vallbo, 1980). Further-more, a PC afferent’s sensitivity is relatively homogenous over itsRF [Johansson (1978), their Fig. 7]. In fact, when testing a PCafferent, the stimulator probe was placed somewhere within this
sensitive zone but not necessarily in the “hottest” spot of the RFbecause the latter was difficult to locate. For these reasons, whenestimating the population response of PC afferents, we assumedthat these afferents have large homogeneous RFs; the best esti-mate of the PC population response, then, is the mean response(Fig. 4) multiplied by the estimated number of active afferents.
To infer the neural activity produced by a stimulus in apopulation of SA1 or RA afferents, we required a function that
Figure 7. Mean probability–intensity functions obtained from SA1, RA, and PC afferents for the three types of stimuli. Opencircles correspond to neural data, and solid lines denote predicted probabilities (fit using Eq. 3).
Figure 8. Ratings of perceived intensity, averaged across subjects, for a subset of sinusoidal(left), diharmonic (center), and noise (right) stimuli. For the diharmonic stimuli, ratings areplotted as a function of the amplitude of the low-frequency component (the relative amplitudesof the high-frequency components depend on their frequency; see Materials and Methods). Weonly included groups of stimuli that comprised at least two stimuli sharing the same frequencycontent and differing only in amplitude. The sinusoidal and diharmonic stimuli are fit withpower functions. For sinusoids, exponents are 0.75, 0.61, and 0.54 at 10, 50, and 100 Hz,respectively; for diharmonic stimuli, the exponents are 0.76, 0.64, 0.56, and 0.50 for (5 Hz, 25Hz), (10 Hz, 50 Hz), (25 Hz, 75 Hz), and (10 Hz, 100 Hz), respectively. The mean correlationbetween predicted and observed perceived intensity was 0.99 for both sinusoidal and dihar-monic stimuli. No exponent was fit to the data obtained from noise stimuli because there weretoo few data points per stimulus group (each group sharing bandpass frequencies).
11694 • J. Neurosci., October 24, 2007 • 27(43):11687–11699 Muniak et al. • Neural Coding of Stimulus Intensity
relates the response of a typical (or average) afferent to theintensity of the stimulus. The rate–intensity functions shownin Figure 4 satisfy this condition: indeed, the response evokedby a stimulus averaged across afferents is a reasonable estimateof the expected value of the firing rate evoked in a singleafferent by that stimulus. To describe the relationship betweenfiring rate and intensity, we used rectified logarithmic func-tions (Eq. 2) fit to groups of stimuli with the same frequencycontent (see above). Whether these functions capture the be-havior of the afferents outside of this range is immaterial as wenever extrapolated beyond the range of intensities used (Infact, it is unlikely that these functions are adequate across allintensities as firing rates likely saturate at high intensities).
We then expressed the spike rate evoked by a stimulus ofamplitude A0 in an afferent whose RF is located at distance r fromthe locus of stimulation by substituting A(r) (from Eq. 4) for a (inEq. 2):
f�r� � ��� log��r0
r �2
A0� � ���
. (5)
From these functions (and for purposes of integration, see be-low), we worked backwards to determine the maximum distanceat which the stimulus is able to activate the afferent, rmax [i.e., thedistance at which f(r) � 0]:
rmax � r0�10
A0�
1
2
. (6)
For example, a 100 Hz, 85 �m sinusoid will activate SA1 afferentsup to a distance of 1.6 mm and RA afferents up to a distance of 3.3mm away from the locus of stimulation; a 100 Hz, 200 �m sinu-soid will excite SA1 afferents up to a distance of 2.5 mm and RAafferents up to a distance of 5 mm.
To reconstruct the population response, we first assumed thatall points on the skin surface at a distance r from the probe arestimulated at the same effective stimulus amplitude [A(r); see Eq.4]. Based on this assumption, we expressed the firing rate,Fannulus(r), for the set of afferents whose point of maximum sen-sitivity lies within an infinitesimally thin annulus of radius r cen-tered on the probe:
Fannulus�r� � 2�r� f�r� , (7)
Figure 10. Spatial distribution of the effective amplitude, A( r), of the stimulus; A( r) dropsoff as an inverse square function of distance beyond an annulus 1 mm away from the probe edge(see Eq. 3). The black contour indicates the location and extent of the contactor (r � 0.5 mm).The term “hot zone” refers to the area under this blue contour, an area over which the effectiveamplitude is constant at A0.
Figure 9. A–C, Perceived intensity ratings plotted against the mean firing rate evoked in SA1 (A), RA (B), and PC (C) afferents. D, Predictions derived from the multiple regression of perceivedintensity on the population firing rates in the three types of afferents. The three slope coefficients (SA1 � 0.29, RA � 0.36, and PC � 0.46 ) are highly significant ( p � 0.001), indicating thatall three types of mechanoreceptive afferents contribute to perceived intensity. E–G, Perceived intensity versus the number of active SA1 (E), RA (F ), and PC (G) afferents. As can be seen, PCrecruitment is a poor code for perceived intensity because it saturates at low stimulus intensities. H, Relationship between the measured perceived intensity and the predicted perceived intensityfrom the multiple regression model. ips, Impulses per second.
Muniak et al. • Neural Coding of Stimulus Intensity J. Neurosci., October 24, 2007 • 27(43):11687–11699 • 11695
where f(r) is the expected value of the fir-ing rate (in impulses per second per milli-meter per afferent) at distance r from thecenter of the stimulator probe, and � is theinnervation density of the afferent type (inunits per square millimeter). We then in-tegrated the expression for Fannulus(r) overr from the edge of the probe contactor � 1mm to a distance away from the contactorat which the stimulus no longer evokes aresponse (as determined using Eq. 6):
Fpop � �r02� f�r0� � �
r0
rmax
Fannulus�r�dr ,
(8)
where f(r0) is the firing rate of afferentswhose hotspot is located under the probe(or within 1 mm of its edge) and are there-fore stimulated at an effective amplitude ofA0. Expanding the nested functions withinthe integral yields the followingexpression:
Fpop � �r02� f�r0� � 2���
r0
rmax
��log��r0
r �2
A0� � �rdr .
(9)
The population rate can then be divided into two components:(1) the total firing rate of afferents whose RFs are located within acircular area of radius r0 under and around the stimulus probeand (2) the firing rates of afferents outside this region, expressedas an integral of successive annuli expanding outwards away fromthe edge of the probe. The solution of Equation 9 is as follows:
Fpop � ����rmax2 � r0
2� , (10)
where rmax is the maximum distance away from the hot spot atwhich the stimulus will evoke an action potential in this popula-tion of afferents. Substituting for rmax (from Eq. 6), Equation 10becomes the following:
Fpop � ���r02� A0
10 � 1� . (11)
Thus, although mean afferent firing rates are logarithmic withstimulus amplitude, population firing rates for SA1 and RA affer-ents exhibit a linear relationship with stimulus amplitude (A0).
The PC population response was estimated by multiplying themean evoked firing rate by the estimated number of PC afferentswhose RFs overlap the contactor area. The latter was estimated bycomputing the area of a circle whose radius was equal to the meanradius of a PC RF (5.7 mm) (cf. Johansson, 1978) and multiplyingthe resulting area by the innervation density of PC afferents inhuman skin (0.2 units/mm 2) (cf. Johansson and Vallbo, 1979b).a
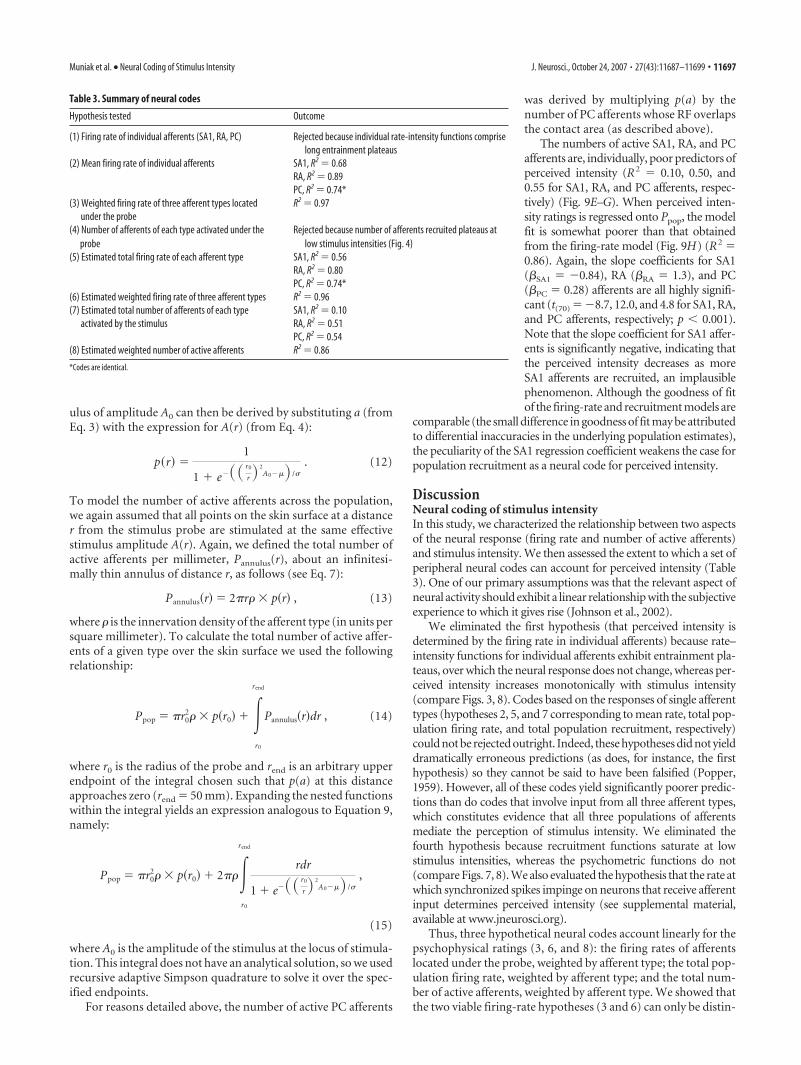
Fpop, derived for SA1 and RA responses, was then used topredict perceived intensity in a multiple regression model. Theoverall goodness of fit of this model is nearly identical to thatobtained with mean firing rates (R 2 � 0.96). However, the hot-zone model more closely captures the fine structure of the psy-chophysical data than does the population-rate model (Fig. 11).As described above, the predicted perceived intensity (solid lines)was computed by using the output of Equation 2 (with values of� and shown in Fig. 6) as input to the multiple regression modelwith a single set of regression coefficients. Although these coeffi-cients were computed by pooling together results obtained usingdifferent stimulus frequencies, the predicted perceived intensitiesare remarkably accurate at all stimulus frequencies. Furthermore,the mean SA1 and RA firing rates are highly correlated with theirpopulation-rate counterparts (r � 0.92 and 0.92 for SA1 and RAafferents, respectively), despite the fact that one measure is linearwith amplitude and the other logarithmic.
Number of active afferentsNext, we assessed whether the recruitment of afferents could serve asa code for intensity [following Johnson (1974)]. As shown in Figure7, the recruitment of afferents directly under the probe is a functionthat saturates at relatively low stimulus amplitudes, suggesting thatthe number of active afferents under the probe cannot determine theperceived intensity. However, as discussed above, a stimulus propa-gates across the skin and excites afferents whose RFs are located awayfrom the contact area. Using a similar approach as that used to esti-mate the population firing rate, we estimated the total number ofafferents activated by a given stimulus, then assessed whether thisquantity could determine perceived intensity.
To estimate afferent recruitment, we first characterized theprobability that an afferent (of a given type) would be activated bythe stimulus as a function of its intensity. The recruitment–int-ensity functions were then used as estimates of the probabilitythat an afferent of a given type would become active (that itsactivity would increase by at least 10% over its baseline rate).
The probability that a given afferent whose hotspot is locatedat distance r from the locus of stimulation is activated by a stim-
aWe assumed that individual mechanoreceptive afferents in human and macaque behave nearly identically. How-ever, innervation densities differ somewhat between the two species. We used human densities because the psy-chophysical data were obtained in humans.
Figure 11. Predictions of perceived intensity derived from the hot-zone model (top) and from the population-rate model(bottom) for sinusoidal, diharmonic, and noise stimuli. Although both models capture the coarse structure of the psychophysicaldata, the hot-zone predictions match the data even in their details. This is particularly evident for the low-frequency sinusoidaland diharmonic stimuli.
11696 • J. Neurosci., October 24, 2007 • 27(43):11687–11699 Muniak et al. • Neural Coding of Stimulus Intensity
ulus of amplitude A0 can then be derived by substituting a (fromEq. 3) with the expression for A(r) (from Eq. 4):
p�r� �1
1 � e��� r0
r � 2A0��� /
. (12)
To model the number of active afferents across the population,we again assumed that all points on the skin surface at a distancer from the stimulus probe are stimulated at the same effectivestimulus amplitude A(r). Again, we defined the total number ofactive afferents per millimeter, Pannulus(r), about an infinitesi-mally thin annulus of distance r, as follows (see Eq. 7):
Pannulus�r� � 2�r� p�r� , (13)
where � is the innervation density of the afferent type (in units persquare millimeter). To calculate the total number of active affer-ents of a given type over the skin surface we used the followingrelationship:
Ppop � �r02� p�r0� � �
r0
rend
Pannulus�r�dr , (14)
where r0 is the radius of the probe and rend is an arbitrary upperendpoint of the integral chosen such that p(a) at this distanceapproaches zero (rend � 50 mm). Expanding the nested functionswithin the integral yields an expression analogous to Equation 9,namely:
Ppop � �r02� p�r0� � 2���
r0
rend
rdr
1 � e��� r0
r � 2A0��� /
,
(15)
where A0 is the amplitude of the stimulus at the locus of stimula-tion. This integral does not have an analytical solution, so we usedrecursive adaptive Simpson quadrature to solve it over the spec-ified endpoints.
For reasons detailed above, the number of active PC afferents
was derived by multiplying p(a) by thenumber of PC afferents whose RF overlapsthe contact area (as described above).
The numbers of active SA1, RA, and PCafferents are, individually, poor predictors ofperceived intensity (R2 � 0.10, 0.50, and0.55 for SA1, RA, and PC afferents, respec-tively) (Fig. 9E–G). When perceived inten-sity ratings is regressed onto Ppop, the modelfit is somewhat poorer than that obtainedfrom the firing-rate model (Fig. 9H) (R2 �0.86). Again, the slope coefficients for SA1(SA1 � �0.84), RA (RA � 1.3), and PC(PC � 0.28) afferents are all highly signifi-cant (t(70) � �8.7, 12.0, and 4.8 for SA1, RA,and PC afferents, respectively; p � 0.001).Note that the slope coefficient for SA1 affer-ents is significantly negative, indicating thatthe perceived intensity decreases as moreSA1 afferents are recruited, an implausiblephenomenon. Although the goodness of fitof the firing-rate and recruitment models are
comparable (the small difference in goodness of fit may be attributedto differential inaccuracies in the underlying population estimates),the peculiarity of the SA1 regression coefficient weakens the case forpopulation recruitment as a neural code for perceived intensity.
DiscussionNeural coding of stimulus intensityIn this study, we characterized the relationship between two aspectsof the neural response (firing rate and number of active afferents)and stimulus intensity. We then assessed the extent to which a set ofperipheral neural codes can account for perceived intensity (Table3). One of our primary assumptions was that the relevant aspect ofneural activity should exhibit a linear relationship with the subjectiveexperience to which it gives rise (Johnson et al., 2002).
We eliminated the first hypothesis (that perceived intensity isdetermined by the firing rate in individual afferents) because rate–intensity functions for individual afferents exhibit entrainment pla-teaus, over which the neural response does not change, whereas per-ceived intensity increases monotonically with stimulus intensity(compare Figs. 3, 8). Codes based on the responses of single afferenttypes (hypotheses 2, 5, and 7 corresponding to mean rate, total pop-ulation firing rate, and total population recruitment, respectively)could not be rejected outright. Indeed, these hypotheses did not yielddramatically erroneous predictions (as does, for instance, the firsthypothesis) so they cannot be said to have been falsified (Popper,1959). However, all of these codes yield significantly poorer predic-tions than do codes that involve input from all three afferent types,which constitutes evidence that all three populations of afferentsmediate the perception of stimulus intensity. We eliminated thefourth hypothesis because recruitment functions saturate at lowstimulus intensities, whereas the psychometric functions do not(compare Figs. 7, 8). We also evaluated the hypothesis that the rate atwhich synchronized spikes impinge on neurons that receive afferentinput determines perceived intensity (see supplemental material,available at www.jneurosci.org).
Thus, three hypothetical neural codes account linearly for thepsychophysical ratings (3, 6, and 8): the firing rates of afferentslocated under the probe, weighted by afferent type; the total pop-ulation firing rate, weighted by afferent type; and the total num-ber of active afferents, weighted by afferent type. We showed thatthe two viable firing-rate hypotheses (3 and 6) can only be distin-
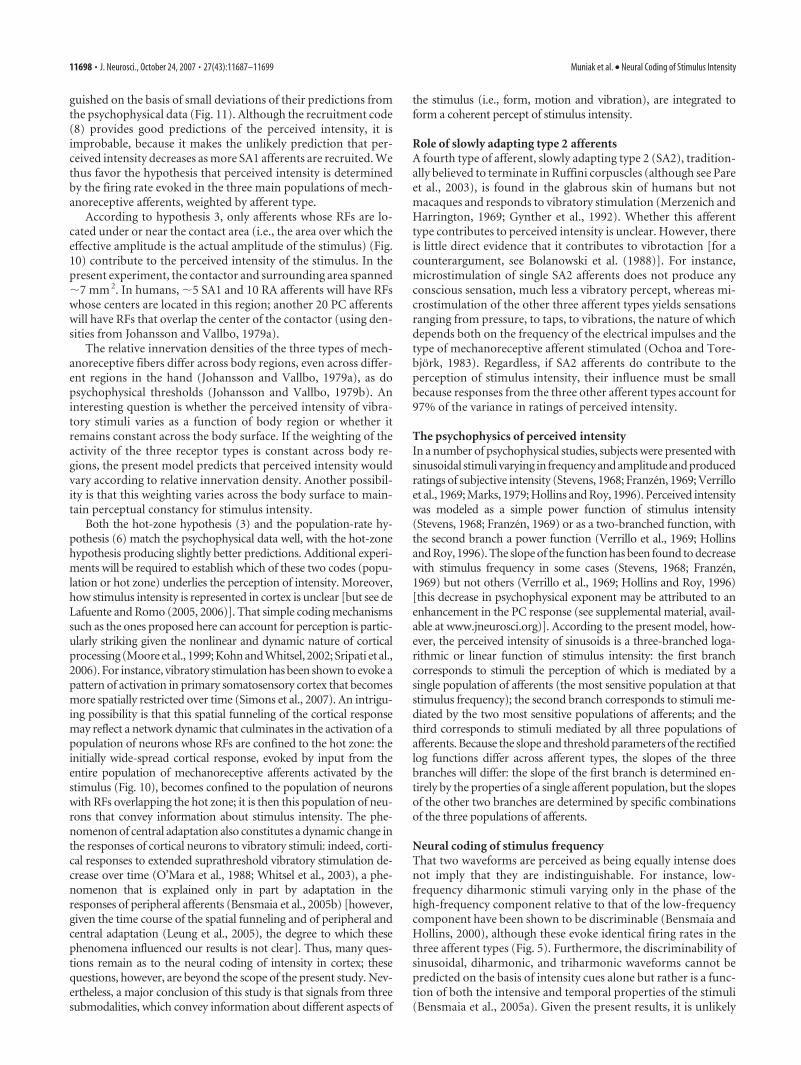
Table 3. Summary of neural codes
Hypothesis tested Outcome
(1) Firing rate of individual afferents (SA1, RA, PC) Rejected because individual rate-intensity functions compriselong entrainment plateaus
(2) Mean firing rate of individual afferents SA1, R2 � 0.68RA, R2 � 0.89PC, R2 � 0.74*
(3) Weighted firing rate of three afferent types located R2 � 0.97under the probe
(4) Number of afferents of each type activated under theprobe
Rejected because number of afferents recruited plateaus atlow stimulus intensities (Fig. 4)
(5) Estimated total firing rate of each afferent type SA1, R2 � 0.56RA, R2 � 0.80PC, R2 � 0.74*
(6) Estimated weighted firing rate of three afferent types R2 � 0.96(7) Estimated total number of afferents of each type SA1, R2 � 0.10
activated by the stimulus RA, R2 � 0.51PC, R2 � 0.54
(8) Estimated weighted number of active afferents R2 � 0.86
*Codes are identical.
Muniak et al. • Neural Coding of Stimulus Intensity J. Neurosci., October 24, 2007 • 27(43):11687–11699 • 11697
guished on the basis of small deviations of their predictions fromthe psychophysical data (Fig. 11). Although the recruitment code(8) provides good predictions of the perceived intensity, it isimprobable, because it makes the unlikely prediction that per-ceived intensity decreases as more SA1 afferents are recruited. Wethus favor the hypothesis that perceived intensity is determinedby the firing rate evoked in the three main populations of mech-anoreceptive afferents, weighted by afferent type.
According to hypothesis 3, only afferents whose RFs are lo-cated under or near the contact area (i.e., the area over which theeffective amplitude is the actual amplitude of the stimulus) (Fig.10) contribute to the perceived intensity of the stimulus. In thepresent experiment, the contactor and surrounding area spanned�7 mm 2. In humans, �5 SA1 and 10 RA afferents will have RFswhose centers are located in this region; another 20 PC afferentswill have RFs that overlap the center of the contactor (using den-sities from Johansson and Vallbo, 1979a).
The relative innervation densities of the three types of mech-anoreceptive fibers differ across body regions, even across differ-ent regions in the hand (Johansson and Vallbo, 1979a), as dopsychophysical thresholds (Johansson and Vallbo, 1979b). Aninteresting question is whether the perceived intensity of vibra-tory stimuli varies as a function of body region or whether itremains constant across the body surface. If the weighting of theactivity of the three receptor types is constant across body re-gions, the present model predicts that perceived intensity wouldvary according to relative innervation density. Another possibil-ity is that this weighting varies across the body surface to main-tain perceptual constancy for stimulus intensity.
Both the hot-zone hypothesis (3) and the population-rate hy-pothesis (6) match the psychophysical data well, with the hot-zonehypothesis producing slightly better predictions. Additional experi-ments will be required to establish which of these two codes (popu-lation or hot zone) underlies the perception of intensity. Moreover,how stimulus intensity is represented in cortex is unclear [but see deLafuente and Romo (2005, 2006)]. That simple coding mechanismssuch as the ones proposed here can account for perception is partic-ularly striking given the nonlinear and dynamic nature of corticalprocessing (Moore et al., 1999; Kohn and Whitsel, 2002; Sripati et al.,2006). For instance, vibratory stimulation has been shown to evoke apattern of activation in primary somatosensory cortex that becomesmore spatially restricted over time (Simons et al., 2007). An intrigu-ing possibility is that this spatial funneling of the cortical responsemay reflect a network dynamic that culminates in the activation of apopulation of neurons whose RFs are confined to the hot zone: theinitially wide-spread cortical response, evoked by input from theentire population of mechanoreceptive afferents activated by thestimulus (Fig. 10), becomes confined to the population of neuronswith RFs overlapping the hot zone; it is then this population of neu-rons that convey information about stimulus intensity. The phe-nomenon of central adaptation also constitutes a dynamic change inthe responses of cortical neurons to vibratory stimuli: indeed, corti-cal responses to extended suprathreshold vibratory stimulation de-crease over time (O’Mara et al., 1988; Whitsel et al., 2003), a phe-nomenon that is explained only in part by adaptation in theresponses of peripheral afferents (Bensmaia et al., 2005b) [however,given the time course of the spatial funneling and of peripheral andcentral adaptation (Leung et al., 2005), the degree to which thesephenomena influenced our results is not clear]. Thus, many ques-tions remain as to the neural coding of intensity in cortex; thesequestions, however, are beyond the scope of the present study. Nev-ertheless, a major conclusion of this study is that signals from threesubmodalities, which convey information about different aspects of
the stimulus (i.e., form, motion and vibration), are integrated toform a coherent percept of stimulus intensity.
Role of slowly adapting type 2 afferentsA fourth type of afferent, slowly adapting type 2 (SA2), tradition-ally believed to terminate in Ruffini corpuscles (although see Pareet al., 2003), is found in the glabrous skin of humans but notmacaques and responds to vibratory stimulation (Merzenich andHarrington, 1969; Gynther et al., 1992). Whether this afferenttype contributes to perceived intensity is unclear. However, thereis little direct evidence that it contributes to vibrotaction [for acounterargument, see Bolanowski et al. (1988)]. For instance,microstimulation of single SA2 afferents does not produce anyconscious sensation, much less a vibratory percept, whereas mi-crostimulation of the other three afferent types yields sensationsranging from pressure, to taps, to vibrations, the nature of whichdepends both on the frequency of the electrical impulses and thetype of mechanoreceptive afferent stimulated (Ochoa and Tore-bjork, 1983). Regardless, if SA2 afferents do contribute to theperception of stimulus intensity, their influence must be smallbecause responses from the three other afferent types account for97% of the variance in ratings of perceived intensity.
The psychophysics of perceived intensityIn a number of psychophysical studies, subjects were presented withsinusoidal stimuli varying in frequency and amplitude and producedratings of subjective intensity (Stevens, 1968; Franzen, 1969; Verrilloet al., 1969; Marks, 1979; Hollins and Roy, 1996). Perceived intensitywas modeled as a simple power function of stimulus intensity(Stevens, 1968; Franzen, 1969) or as a two-branched function, withthe second branch a power function (Verrillo et al., 1969; Hollinsand Roy, 1996). The slope of the function has been found to decreasewith stimulus frequency in some cases (Stevens, 1968; Franzen,1969) but not others (Verrillo et al., 1969; Hollins and Roy, 1996)[this decrease in psychophysical exponent may be attributed to anenhancement in the PC response (see supplemental material, avail-able at www.jneurosci.org)]. According to the present model, how-ever, the perceived intensity of sinusoids is a three-branched loga-rithmic or linear function of stimulus intensity: the first branchcorresponds to stimuli the perception of which is mediated by asingle population of afferents (the most sensitive population at thatstimulus frequency); the second branch corresponds to stimuli me-diated by the two most sensitive populations of afferents; and thethird corresponds to stimuli mediated by all three populations ofafferents. Because the slope and threshold parameters of the rectifiedlog functions differ across afferent types, the slopes of the threebranches will differ: the slope of the first branch is determined en-tirely by the properties of a single afferent population, but the slopesof the other two branches are determined by specific combinationsof the three populations of afferents.
Neural coding of stimulus frequencyThat two waveforms are perceived as being equally intense doesnot imply that they are indistinguishable. For instance, low-frequency diharmonic stimuli varying only in the phase of thehigh-frequency component relative to that of the low-frequencycomponent have been shown to be discriminable (Bensmaia andHollins, 2000), although these evoke identical firing rates in thethree afferent types (Fig. 5). Furthermore, the discriminability ofsinusoidal, diharmonic, and triharmonic waveforms cannot bepredicted on the basis of intensity cues alone but rather is a func-tion of both the intensive and temporal properties of the stimuli(Bensmaia et al., 2005a). Given the present results, it is unlikely
11698 • J. Neurosci., October 24, 2007 • 27(43):11687–11699 Muniak et al. • Neural Coding of Stimulus Intensity
that the perception of frequency is simply based on the meanfiring rates of mechanoreceptive afferents, although frequencymay be coded with a mean rate code in primary somatosensorycortex (Salinas et al., 2000). There are two other coding hypoth-eses that must be considered if frequency is not coded by rate atthe periphery. First, the temporal profile of the afferent responsehas been shown to be shaped to a large degree by the temporal prop-erties of the stimulus. For instance, sinusoids evoke periodic re-sponses, whereas noise stimuli do not (compare Figs. 1, 2). Second,because the three populations of mechanoreceptive afferents havedifferent frequency sensitivity profiles, the relative activation of eachpopulation of afferents could carry information about the frequencycontent of the stimulus (Roy and Hollins, 1998).
ConclusionThe study by Johnson (1974) was one of the first to investigate therole of population coding in sensory perception. One of his majorconclusions was that perception is based on the activity of popu-lations of neurons rather than on that of single neurons. Here weextend his findings and conclude that perception of a simplequantity such as intensity is based not only on the activity of asingle population of afferents, but on the activity of all mechano-receptive afferents. Furthermore, the present study provides amathematical framework to evaluate hypotheses about the neuralcoding of stimulus intensity, which may lead to a deeper under-standing of submodality convergence and the integration of stim-ulus information over the skin surface.
ReferencesBensmaia SJ, Hollins M (2000) Complex tactile waveform discrimination. J
Acoust Soc Am 108:1236 –1245.Bensmaia S, Hollins M, Yau J (2005a) Vibrotactile intensity and frequency
information in the pacinian system: a psychophysical model. Percept Psy-chophys 67:828 – 841.
Bensmaia SJ, Leung YY, Hsiao SS, Johnson KO (2005b) Vibratory adaptation ofcutaneous mechanoreceptive afferents. J Neurophysiol 94:3023–3036.
Bolanowski SJ, Gescheider GA, Verrillo RT, Checkosky CM (1988) Fourchannels mediate the mechanical aspects of touch. J Acoust Soc Am84:1680 –1694.
Chubbuck JG (1966) Small motion biological stimulator. Johns HopkinsAPL Tech Digest May–June: 18 –23.
Cohen RH, Vierck CJ (1993a) Population estimates for responses of cuta-neous mechanoreceptors to a vertically indenting probe on the glabrousskin of monkeys. Exp Brain Res 94:105–119.
Cohen RH, Vierck CJ (1993b) Relationships between touch sensations andpopulation responses of peripheral afferent mechanoreceptors. Exp BrainRes 94:120 –130.
de Lafuente V, Romo R (2005) Neuronal correlates of subjective sensoryexperience. Nat Neurosci 8:1698 –1703.
de Lafuente V, Romo R (2006) Neural correlate of subjective sensory expe-rience gradually builds up across cortical areas. Proc Natl Acad Sci USA103:14266 –14271.
Franzen O (1969) The dependence of vibrotactile threshold and magnitudefunctions on stimulation frequency and signal level. A perceptual andneural comparison. Scand J Psychol 10:289 –298.
Freeman AW, Johnson KO (1982a) A model accounting for effects of vibra-tory amplitude on responses of cutaneous mechanoreceptors in macaquemonkey. J Physiol (Lond) 323:43– 64.
Freeman AW, Johnson KO (1982b) Cutaneous mechanoreceptors in ma-caque monkey: temporal discharge patterns evoked by vibration, and areceptor model. J Physiol (Lond) 323:21– 41.
Gynther BD, Vickery RM, Rowe MJ (1992) Responses of slowly adaptingtype II (SAII) afferent fibers in cat hairy skin to vibrotactile stimuli.J Physiol (Lond) 458:151–169.
Hollins M, Bensmaia SJ (2007) The coding of roughness. Can J Exp Psychol,in press.
Hollins M, Roy EA (1996) Perceived intensity of vibrotactile stimuli: therole of mechanoreceptive channels. Somatosens Mot Res 13:273–286.
Johansson RS (1978) Tactile sensibility in the human hand: receptive fieldcharacteristics of mechanoreceptive units in the glabrous skin area.J Physiol (Lond) 281:101–123.
Johansson RS, Landstrom U, Lundstrom R (1982) Responses of mechano-receptive afferent units in the glabrous skin of the human hand to sinu-soidal skin displacements. Brain Res 244:17–25.
Johansson RS, Vallbo ÅB (1979a) Tactile sensibility in the human hand:relative and absolute densities of four types of mechanoreceptive units inglabrous skin. J Physiol (Lond) 286:283–300.
Johansson RS, Vallbo ÅB (1979b) Detection of tactile stimuli. Thresholds ofafferent units related to psychophysical thresholds in the human hand.J Physiol (Lond) 297:405– 422.
Johansson RS, Vallbo ÅB (1980) Spatial properties of the population ofmechanoreceptive units in the glabrous skin of the human hand. BrainRes 184:353–366.
Johnson KO (1974) Reconstruction of population response to a vibratorystimulus in quickly adapting mechanoreceptive afferent fiber populationinnervating glabrous skin of the monkey. J Neurophysiol 37:48 –72.
Johnson KO (2001) The roles and functions of cutaneous mechanorecep-tors. Curr Opin Neurobiol 11:455– 461.
Johnson KO, Hsiao SS, Yoshioka T (2002) Neural coding and the basic lawof psychophysics. Neuroscientist 8:111–121.
Kohn A, Whitsel BL (2002) Sensory cortical dynamics. Behav Brain Res135:119 –126.
Leung YY, Bensmaia SJ, Hsiao SS, Johnson KO (2005) Time-course of vi-bratory adaptation and recovery in cutaneous mechanoreceptive affer-ents. J Neurophysiol 94:3037–3045.
Marks LE (1979) Summation of vibrotactile intensity: an analog to auditorycritical bands? Sens Processes 3:188 –203.
Merzenich MM, Harrington TL (1969) The sense of flutter-vibrationevoked by stimulation of the hairy skin of primates: comparisons of hu-man sensory capacity with the responses of mechanoreceptive afferentsinnervating the hairy skin of monkeys. Exp Brain Res 9:236 –260.
Moore CI, Nelson SB, Sur M (1999) Dynamics of neuronal processing in ratsomatosensory cortex. Trends Neurosci 22:513–520.
Mountcastle VB, Talbot WH, Sakata H, Hyvarinen J (1969) Cortical neuronalmechanisms in flutter-vibration studied in unanesthetized monkeys. Neuro-nal periodicity and frequency discrimination. J Neurophysiol 32:452–484.
O’Mara S, Rowe MJ, Tarvin RP (1988) Neural mechanisms in vibrotactileadaptation. J Neurophysiol 59:607– 622.
Ochoa JL, Torebjork HE (1983) Sensations evoked by intraneural micro-stimulation of single mechanoreceptor units innervating the humanhand. J Physiol (Lond) 342:633– 654.
Pare M, Behets C, Cornu O (2003) Paucity of presumptive ruffini corpusclesin the index finger pad of humans. J Comp Neurol 456:260 –266.
Popper K (1959) The logic of scientific discovery. New York: Basic Books.Roy EA, Hollins M (1998) A ratio code for vibrotactile pitch. Somatosens
Mot Res 15:134 –145.Salinas E, Hernandez A, Zainos A, Romo R (2000) Periodicity and firing rate
as candidate neural codes for the frequency of vibrotactile stimuli. J Neu-rosci 20:5503–5515.
Simons SB, Chiu J, Favorov OV, Whitsel BL, Tommerdahl M (2007)Duration-dependent response of SI to vibrotactile stimulation in squirrelmonkey. J Neurophysiol 97:2121–2129.
Sripati AP, Yoshioka T, Denchev P, Hsiao SS, Johnson KO (2006) Spatio-temporal receptive fields of peripheral afferents and cortical area 3b and 1neurons in the primate somatosensory system. J Neurosci 26:2101–2114.
Stevens SS (1968) Tactile vibration: change of exponent with frequency.Percept Psychophys 3:223–228.
Talbot WH, Darian-Smith I, Kornhuber HH, Mountcastle VB (1968) Thesense of flutter-vibration: comparison of the human capacity with re-sponse patterns of mechanoreceptive afferents from the monkey hand.J Neurophysiol 31:301–334.
Verrillo RT, Fraioli AJ, Smith RL (1969) Sensation magnitude of vibrotactilestimuli. Percept Psychophys 6:366 –372.
Whitsel BL, Kelly EF, Quibrera M, Tommerdahl M, Li Y, Favorov OV, Xu M,Metz CB (2003) Time-dependence of SI RA neuron response to cutane-ous flutter stimulation. Somatosens Mot Res 20:45– 69.
Yoshioka T, Bensmaia SJ, Craig JC, Hsiao SS (2007) Texture perceptionthrough direct and indirect touch: an analysis of perceptual space for tactiletextures in two modes of exploration. Somatosens Mot Res 24:53–70.
Muniak et al. • Neural Coding of Stimulus Intensity J. Neurosci., October 24, 2007 • 27(43):11687–11699 • 11699