beef and sheep brp manual 8 planning grazing … · planning grazing strategies for better returns....
TRANSCRIPT
BEEF AND SHEEP BRP MANUAL 8
Planning grazing strategies for Better Returns
The information in this booklet was compiled by Dr Liz Genever (AHDB Beef & Lamb) and Sue Buckingham (Forward Thinking Farming).
The Better Returns Programme is grateful to all those who have commented and contributed to this publication.
Photography: Charlie Morgan (GrassMaster) and Germinal
While the Agriculture and Horticulture Development Board seeks to ensure that the information contained within this document is accurate at the time of printing, no warranty is given in respect thereof and, to the maximum extent permitted by law, the Agriculture and Horticulture Development Board accepts no liability for loss, damage or injury howsoever caused (including that caused by negligence) or suffered directly or indirectly in relation to information and opinions contained in or omitted from this document.
The text of this document (this excludes, where present, any logos) may be reproduced free of charge in any format or medium providing that it is reproduced accurately and not in a misleading context.
The material must be acknowledged as Agriculture and Horticulture Development Board copyright and the document title specified. Where third party material has been identified, permission from the respective copyright holder must be sought.
This publication is available from our website at beefandlamb.ahdb.org.uk.
Any enquiries related to this publication should be sent to us at AHDB Beef & Lamb, Stoneleigh Park, Kenilworth, Warwickshire, CV8 2TL.
For more information contact:
Better Returns ProgrammeAHDB Beef & LambStoneleigh ParkKenilworthWarwickshireCV8 2TL
Tel: 024 7647 8834Email: [email protected]
AHDB Beef & Lamb is a division of the Agriculture and Horticulture Development Board (AHDB).
©Agriculture and Horticulture Development Board 2016.
1
Grass is an important crop and can provide 85% and 95% of the energy requirements of English beef and sheep systems respectively. Yet it rarely earns the respect it deserves as a potentially high-quality, natural ruminant feed. Half of what is grown is commonly wasted.
Grazed grass is the cheapest feed on the farm. When well-managed it has the potential to reduce input costs significantly, in particular bought-in feed. Some producers manage to finish lambs and cattle purely off pasture and conserved forages – which saves money and in some cases earns a premium.
Whether the system is high-input or based around environmental grazing, the message is the same – understand supply and demand.
The first step to greater utilisation is to understand how grass grows and to start measuring how much is available in the fields and how fast it is growing.
It is then possible to balance feed supply with demand and make informed decisions on stocking levels and future management.
There is no doubt that optimising production from grazed grass requires focus and commitment – but the returns, both in production and profit, will more than justify the effort.
This manual will help producers develop new, more efficient grazing strategies which will earn better returns for their business.
Dr Liz GeneverSenior Livestock Scientist AHDB Beef & Lamb
Contents2 How does grass grow?
3 Factors affecting grass growth
4 Grass growth and death
5 Measuring swards
8 Common grazing strategies
10 Other management options
11 Stocking rates
12 Understanding dry matter
13 Feed planning
14 Livestock feed allocation
15 Matching short term grass supply to livestock daily requirements
16 Calculating grazing rotation length
17 Plotting pasture covers
18 How to develop a grazing plan
20 Partial feed budget
22 Full feed budget
24 Troubleshooting
2
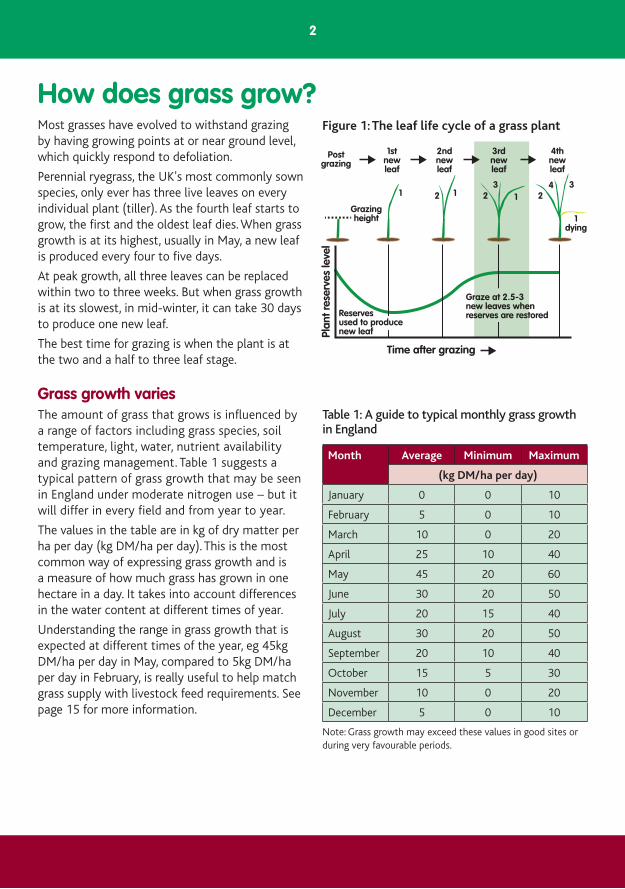
How does grass grow?Most grasses have evolved to withstand grazing by having growing points at or near ground level, which quickly respond to defoliation.
Perennial ryegrass, the UK's most commonly sown species, only ever has three live leaves on every individual plant (tiller). As the fourth leaf starts to grow, the first and the oldest leaf dies. When grass growth is at its highest, usually in May, a new leaf is produced every four to five days.
At peak growth, all three leaves can be replaced within two to three weeks. But when grass growth is at its slowest, in mid-winter, it can take 30 days to produce one new leaf.
The best time for grazing is when the plant is at the two and a half to three leaf stage.
Grass growth varies The amount of grass that grows is influenced by a range of factors including grass species, soil temperature, light, water, nutrient availability and grazing management. Table 1 suggests a typical pattern of grass growth that may be seen in England under moderate nitrogen use – but it will differ in every field and from year to year.
The values in the table are in kg of dry matter per ha per day (kg DM/ha per day). This is the most common way of expressing grass growth and is a measure of how much grass has grown in one hectare in a day. It takes into account differences in the water content at different times of year.
Understanding the range in grass growth that is expected at different times of the year, eg 45kg DM/ha per day in May, compared to 5kg DM/ha per day in February, is really useful to help match grass supply with livestock feed requirements. See page 15 for more information.
Postgrazing
Grazingheight
1 2 2 23 34
1 1
1dying
Plan
t res
erve
s le
vel
1stnewleaf
2ndnewleaf
3rdnewleaf
4thnewleaf
Reservesused to producenew leaf
Graze at 2.5-3new leaves whenreserves are restored
Time after grazing
Figure 1: The leaf life cycle of a grass plant
Month Average Minimum Maximum
(kg DM/ha per day)
January 0 0 10
February 5 0 10
March 10 0 20
April 25 10 40
May 45 20 60
June 30 20 50
July 20 15 40
August 30 20 50
September 20 10 40
October 15 5 30
November 10 0 20
December 5 0 10
Table 1: A guide to typical monthly grass growth in England
Note: Grass growth may exceed these values in good sites or during very favourable periods.
3
Factors affecting grass growth Soil temperatureGrass growth starts when soil temperature at 10cm depth reaches 5°C for five consecutive days. There is variation between grasses, eg timothy may start growing at lower temperatures. White clover and other legumes begin at around 8°C.
At these temperatures the plant becomes active and absorbs more soil moisure, which increases the uptake of nutrients and rate of growth.
Compacted soils have greater moisture content than well-structured soils, making them colder in spring. This means grass starts growing later on damaged or compacted soils.
Measuring soil temperature using a soil thermometer is a quick, easy and cheap method of identifying when the plant is growing, so that nitrogen (N) fertiliser can be applied to promote growth.
Altitude and aspectAir temperature drops 1°C in every 100m rise above sea level, which impacts directly on grass growth, particularly the length of the growing season. North-facing pastures take longer to warm up in spring than south-facing ones.
LightLight is needed by all plants to drive the reactions of photosynthesis, which provides the energy for growth. The more light a plant receives, the more it is able to grow unless moisture and nutrients are limiting.
Day lengthIncreasing day length stimulates the flowering process and seed head production which limits leaf growth. The aim of good grazing is to prevent seed head production, keeping the grass plants young and leafy.
WaterWith too little water, grass leaves wilt which means they cannot maintain optimum position for light capture. Also, nutrients cannot be transported inside the plant.
With too much water, a plant will slow or even shut down root activity, which has similar effects to drought. Leaves wilt and growth declines due to lack of water and nutrient uptake. Root rot can occur.
Nitrogen (from clover, fertiliser or manures)The faster the leaves grow the more light they intercept. In young leafy swards, N can increase sward yield and density, building tiller numbers and enhancing the ability of the plant to use other nutrients. In grazing systems N is the most effective at sward heights of between 4-8cm (1,500-2,000kg DM/ha). If it is applied to mature grass it can reduce tiller density and nutrient use efficiency (NUE).
Phosphate and potash indexPhosphate (P) and potash (K) are essential for grass and clover growth. Phosphate is important for root development and energy transfer within plants, while potash has a key role in water regulation and nitrogen efficiency. Target indices for optimum growth are 2 for phosphate and 2- for potash. If the indices are allowed to fall below target levels, grass yields will decline even if other nutrients being supplied remain the same.
Grass typeDifferent grass species and varieties have different characteristics, both in terms of total yield and timing of growth. These differences can be exploited to suit a grazing system. Information on yield, feed quality, disease, seasonal growth patterns and persistence can be found in the Recommended Grass and Clover Lists at beefandlamb.ahdb.org.uk
Grazing managementGrazing grass at the ideal two and a half to three leaf stage increases grass growth and sward yield by maintaining the optimum leaf area to capture sunlight, which provides the energy for growth. Grazing too low – below two leaves per plant, can reduce grass growth by up to 85%.

4 5
Grass growth and deathIn a grass sward, there is always a balance between grass growth and death.
In Figure 2 the optimum daily grass growth is reached when the total growth is between 2,000-2,500kg DM/ha, which equates to a height of around 8-12cm.
Beyond this, the dying leaves deprive the new leaves of sunlight, leading to more leaf death and a decline in overall production.
Grazing at the ideal point and resting swards when total grass falls below 1,250-1,500kg DM/ha (3-4cm) can improve grass utilisation, sustain sward quality and optimise performance.
UtilisationIt is no good growing as much grass as possible unless it is eaten by animals that can turn it into milk and meat. Utilisation is key to successful grassland farming.
Which is the best managed pasture?Good grazing management aims to make the most of the grass that grows. Preventing plants getting to the fourth leaf stage and dying, reduces wastage and the build up of unproductive dead leaves at the base of the sward. Dead material uses N to rot down, plays host to pests and diseases, and can limit grass and clover growth by shading out the growing points. Grass harrows can be used to drag some of this thatch out, but this takes diesel and time.
Reasons for poor useUtilisation of grazed grass is often below 50%, but can be as high as 80% with good management. Good utilisation happens when fields are grazed at the right time to the right height with the right amount of stock.
However, this is not always easy and can be affected by:
• Previous grazing – under-grazing may have allowed grass to become mature and unattractive to stock, while over-grazing reduces grass growth
• Sward composition – animals may avoid grazing weeds
• Dung and urine areas – are often avoided by grazing livestock
• Grazing system (see Table 2)
1,000 2,000Pasture cover (kg DM/ha)
Gro
wth
(kg
DM
/ha
per
day)
3,000 4,000
120
80
40
Very short swardsNet production is low due to reduced leaf growth, as available leaf for photosynthesis is low
leaf production
leaf death
net production= leaf growth - leaf death
Optimum swardsNet production is near maximum as there is leaf area to capture sunlight and leaf death is under control
Long swardsNet production is at a low level due to high leaf death and no increase in leaf growth
Figure 2: Grass production at different growth rates
Situation Expected utilisation (%)
Set stocking, limited control over sward heights, grazing large areas for long periods, wet conditions
50
Continuous grazing or relaxed rotational grazing, limited control over sward heights, grazing picky stock, eg finishing lambs or stock that should not have limited intake
60
Rotational grazing, reasonable grazing pressure, good control over sward height 65
Paddock grazing, frequent moves, good control over sward height 80
Table 2: A guide to expected utilisation according to different situations
5
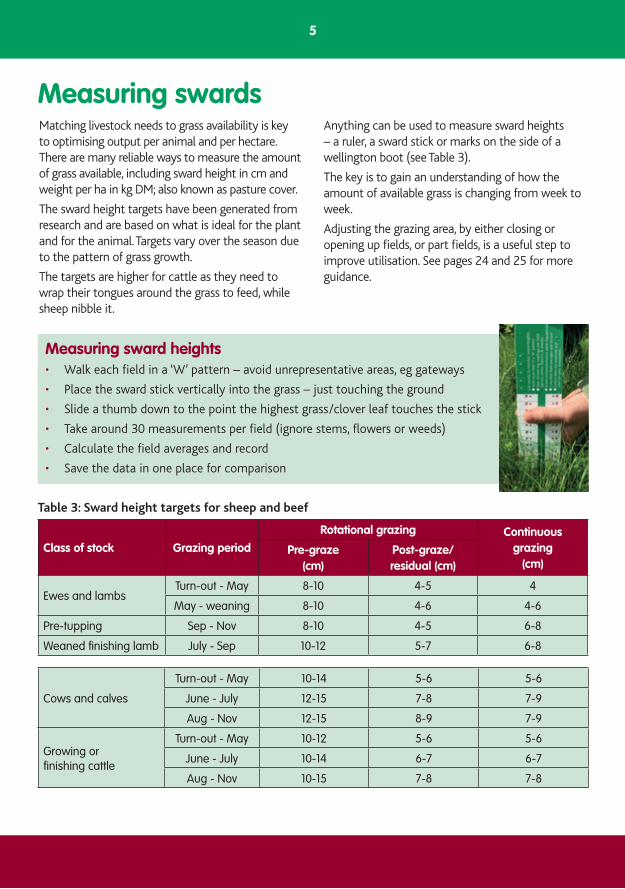
Measuring swardsMatching livestock needs to grass availability is key to optimising output per animal and per hectare. There are many reliable ways to measure the amount of grass available, including sward height in cm and weight per ha in kg DM; also known as pasture cover.
The sward height targets have been generated from research and are based on what is ideal for the plant and for the animal. Targets vary over the season due to the pattern of grass growth.
The targets are higher for cattle as they need to wrap their tongues around the grass to feed, while sheep nibble it.
Anything can be used to measure sward heights – a ruler, a sward stick or marks on the side of a wellington boot (see Table 3).
The key is to gain an understanding of how the amount of available grass is changing from week to week.
Adjusting the grazing area, by either closing or opening up fields, or part fields, is a useful step to improve utilisation. See pages 24 and 25 for more guidance.
Measuring sward heights• Walk each field in a ‘W’ pattern – avoid unrepresentative areas, eg gateways
• Place the sward stick vertically into the grass – just touching the ground
• Slide a thumb down to the point the highest grass/clover leaf touches the stick
• Take around 30 measurements per field (ignore stems, flowers or weeds)
• Calculate the field averages and record
• Save the data in one place for comparison
Table 3: Sward height targets for sheep and beef
Class of stock Grazing period
Rotational grazing Continuous grazing
(cm)Pre-graze
(cm)Post-graze/residual (cm)
Ewes and lambsTurn-out - May 8-10 4-5 4
May - weaning 8-10 4-6 4-6
Pre-tupping Sep - Nov 8-10 4-5 6-8
Weaned finishing lamb July - Sep 10-12 5-7 6-8
Cows and calves
Turn-out - May 10-14 5-6 5-6
June - July 12-15 7-8 7-9
Aug - Nov 12-15 8-9 7-9
Growing or finishing cattle
Turn-out - May 10-12 5-6 5-6
June - July 10-14 6-7 6-7
Aug - Nov 10-15 7-8 7-8
6
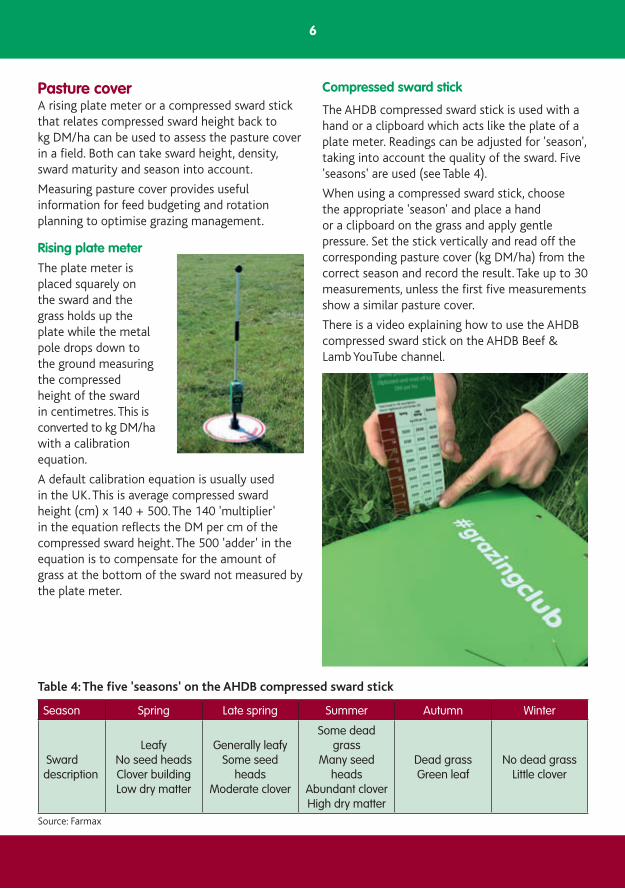
Compressed sward stick
The AHDB compressed sward stick is used with a hand or a clipboard which acts like the plate of a plate meter. Readings can be adjusted for 'season', taking into account the quality of the sward. Five 'seasons' are used (see Table 4).
When using a compressed sward stick, choose the appropriate 'season' and place a hand or a clipboard on the grass and apply gentle pressure. Set the stick vertically and read off the corresponding pasture cover (kg DM/ha) from the correct season and record the result. Take up to 30 measurements, unless the first five measurements show a similar pasture cover.
There is a video explaining how to use the AHDB compressed sward stick on the AHDB Beef & Lamb YouTube channel.
Pasture coverA rising plate meter or a compressed sward stick that relates compressed sward height back to kg DM/ha can be used to assess the pasture cover in a field. Both can take sward height, density, sward maturity and season into account.
Measuring pasture cover provides useful information for feed budgeting and rotation planning to optimise grazing management.
Rising plate meter
The plate meter is placed squarely on the sward and the grass holds up the plate while the metal pole drops down to the ground measuring the compressed height of the sward in centimetres. This is converted to kg DM/ha with a calibration equation.
A default calibration equation is usually used in the UK. This is average compressed sward height (cm) x 140 + 500. The 140 'multiplier' in the equation reflects the DM per cm of the compressed sward height. The 500 'adder' in the equation is to compensate for the amount of grass at the bottom of the sward not measured by the plate meter.
Season Spring Late spring Summer Autumn Winter
Sward description
LeafyNo seed headsClover buildingLow dry matter
Generally leafySome seed
headsModerate clover
Some dead grass
Many seed heads
Abundant cloverHigh dry matter
Dead grassGreen leaf
No dead grassLittle clover
Table 4: The five 'seasons' on the AHDB compressed sward stick
Source: Farmax
6 7
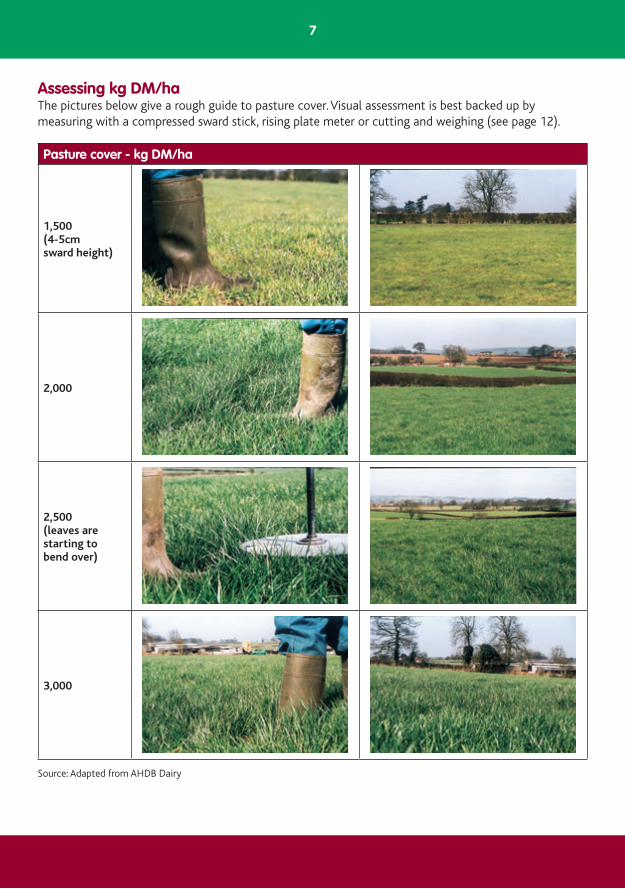
Assessing kg DM/haThe pictures below give a rough guide to pasture cover. Visual assessment is best backed up by measuring with a compressed sward stick, rising plate meter or cutting and weighing (see page 12).
Pasture cover - kg DM/ha
1,500(4-5cm sward height)
2,000
2,500 (leaves are starting to bend over)
3,000
Source: Adapted from AHDB Dairy
8
Common grazing strategiesThere are many ways to achieve sward height or pasture cover targets. One strategy does not fit every farm and there is always a need for flexibility depending on the year. It may be that continuous grazing is practised early in the year with cows and calves, then growing cattle are grazed using a paddock system.
Optimising production from grassland is a balance between utilisation, yield and management input.
Is the hassle of moving fences and updating infrastructure worth it?
Generally with a strategy that gives the grass a rest, eg by moving stock to another field, the yield will go up by around 20%. If the grazing pressure is then tightened by putting in temporary fences, utilisation will be increased.
More information on fencing options can be found online in BRP+ Electric Fencing for Livestock.
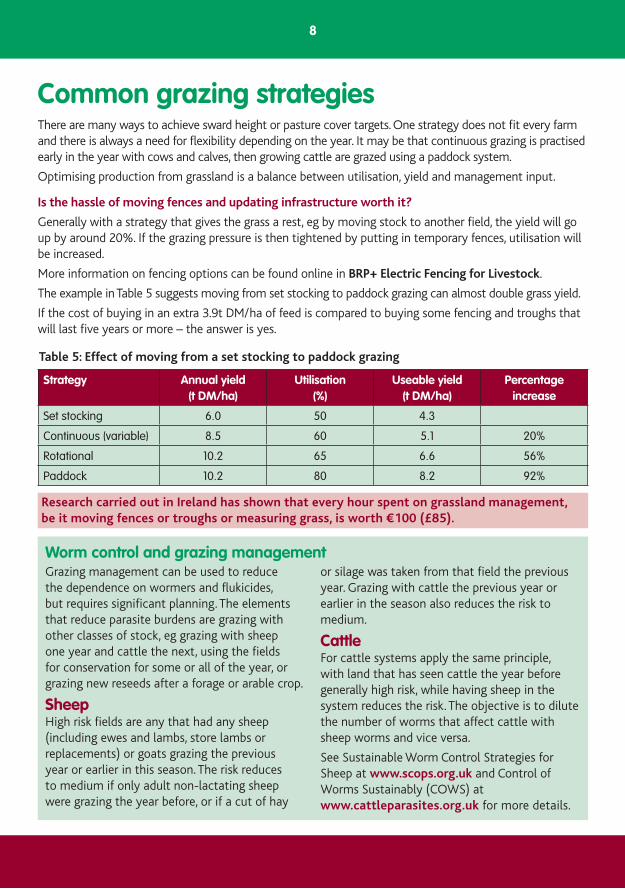
The example in Table 5 suggests moving from set stocking to paddock grazing can almost double grass yield.
If the cost of buying in an extra 3.9t DM/ha of feed is compared to buying some fencing and troughs that will last five years or more – the answer is yes.
Research carried out in Ireland has shown that every hour spent on grassland management, be it moving fences or troughs or measuring grass, is worth €100 (£85).
Strategy Annual yield (t DM/ha)
Utilisation (%)
Useable yield(t DM/ha)
Percentageincrease
Set stocking 6.0 50 4.3
Continuous (variable) 8.5 60 5.1 20%
Rotational 10.2 65 6.6 56%
Paddock 10.2 80 8.2 92%
Grazing management can be used to reduce the dependence on wormers and flukicides, but requires significant planning. The elements that reduce parasite burdens are grazing with other classes of stock, eg grazing with sheep one year and cattle the next, using the fields for conservation for some or all of the year, or grazing new reseeds after a forage or arable crop.
SheepHigh risk fields are any that had any sheep (including ewes and lambs, store lambs or replacements) or goats grazing the previous year or earlier in this season. The risk reduces to medium if only adult non-lactating sheep were grazing the year before, or if a cut of hay
or silage was taken from that field the previous year. Grazing with cattle the previous year or earlier in the season also reduces the risk to medium.
CattleFor cattle systems apply the same principle, with land that has seen cattle the year before generally high risk, while having sheep in the system reduces the risk. The objective is to dilute the number of worms that affect cattle with sheep worms and vice versa.
See Sustainable Worm Control Strategies for Sheep at www.scops.org.uk and Control of Worms Sustainably (COWS) at www.cattleparasites.org.uk for more details.
Table 5: Effect of moving from a set stocking to paddock grazing
Worm control and grazing management
9
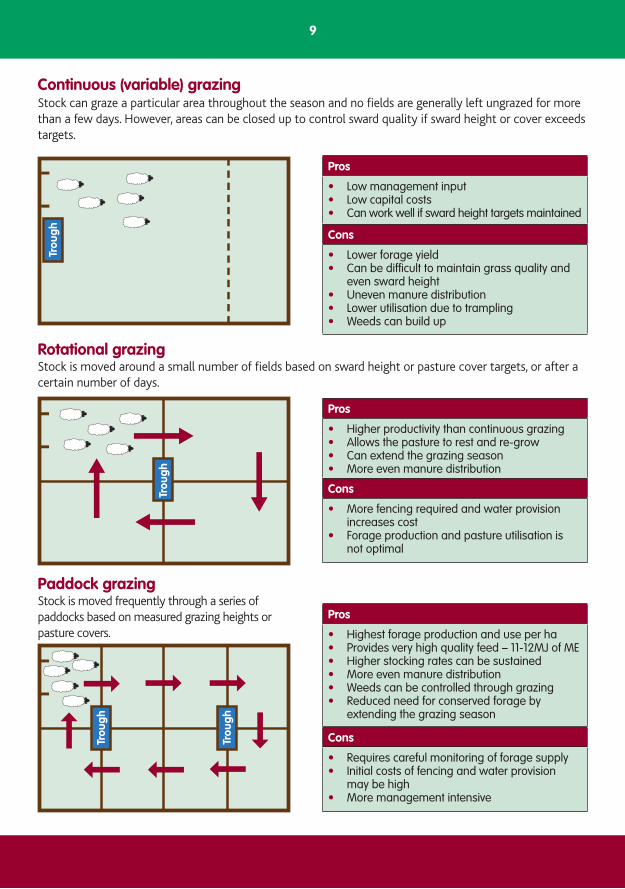
Continuous (variable) grazing
Rotational grazingStock is moved around a small number of fields based on sward height or pasture cover targets, or after a certain number of days.
Stock can graze a particular area throughout the season and no fields are generally left ungrazed for more than a few days. However, areas can be closed up to control sward quality if sward height or cover exceeds targets.
Paddock grazing Stock is moved frequently through a series of paddocks based on measured grazing heights or pasture covers.
Pros
• Low management input• Low capital costs• Can work well if sward height targets maintained
Cons
• Lower forage yield• Can be difficult to maintain grass quality and
even sward height• Uneven manure distribution• Lower utilisation due to trampling• Weeds can build up
Pros
• Higher productivity than continuous grazing• Allows the pasture to rest and re-grow• Can extend the grazing season• More even manure distribution
Cons
• More fencing required and water provision increases cost
• Forage production and pasture utilisation is not optimal
Pros
• Highest forage production and use per ha• Provides very high quality feed – 11-12MJ of ME• Higher stocking rates can be sustained• More even manure distribution • Weeds can be controlled through grazing• Reduced need for conserved forage by
extending the grazing season
Cons
• Requires careful monitoring of forage supply• Initial costs of fencing and water provision
may be high• More management intensive
10
Other management optionsDeferred grazing Deferred grazing is where stock is removed from a field so a supply of grass is built up, which can then be fed later in the year by strip or block grazing to ensure good utilisation. A back fence is used to keep the stock off the previously grazed areas to allow recovery.
This system avoids the cost of having to make that area of grass into silage or hay and the associated cost of feeding it. It is best suited to free draining fields well away from the water courses.
If the grass is being grazed in the spring, the earlier the closing date in autumn and the higher the yield of grass will be.
In trials, there was a 40% reduction in DM yield per ha when stock was excluded on the 20th September, compared with shutting up on the 30th August. This was due to falling day length and lower temperatures limiting growth after mid-September. However, the quality of the grazing in the field shut up in August was poorer, with 25% more dead material in the sward at the beginning of March, than in the field closed in September.
All grass wintering All grass wintering (AGW) is a form of paddock grazing that meets the nutritional requirements of pregnant ewes during winter mainly from grass.
The grazing rotation starts approximately three weeks after tupping until three weeks before lambing. Pastures to be grazed immediately after lambing are grazed first, giving them sufficient time to recover before spring.
In good grass growing areas, where ewes can be sustained on grass only, it has been shown to offer potential savings of £15 per ewe per winter.
Key requirements:
• Suitable breeds of sheep
• Well-drained soils
• Sufficient winter grass growth
• Feed budgeting to check there is enough grass
• Close monitoring of ewe health and field conditions. Flexibility to adapt to changing conditions
• Emergency forage reserves to cope with any adverse weather
Investment in infrastructure may be needed, eg electric fencing, additional water troughs and field access.
For further information on AGW see BRP+ All Grass Wintering of Sheep at beefandlamb.ahdb.org.uk
11
Stocking ratesStocking rates are the traditional way of calculating the appropriate number of animals needed to graze on a farm.
Stocking decisions are usually based on management priorities and land use restrictions. Rates should be adjusted according to land grade, nutrient use, any environmental stewardship schemes entered into and grazing quality.
It is actually easier to plan grazing strategies using measured grass supply and demand, but stocking rate can be useful at a farm level, or to compare different pieces of land.
High stocking rates can achieve higher utilisation and make it easier to maintain pasture quality. With low stocking rates it is easier to achieve higher gain per head providing pasture quality is good.
Calculating livestock units/ha
A livestock unit (LU) is usually defined in terms of metabolisable energy (ME) requirements. One LU is considered as the amount of feed energy needed for the maintenance of a mature black and white dairy cow.
Liveweight per ha
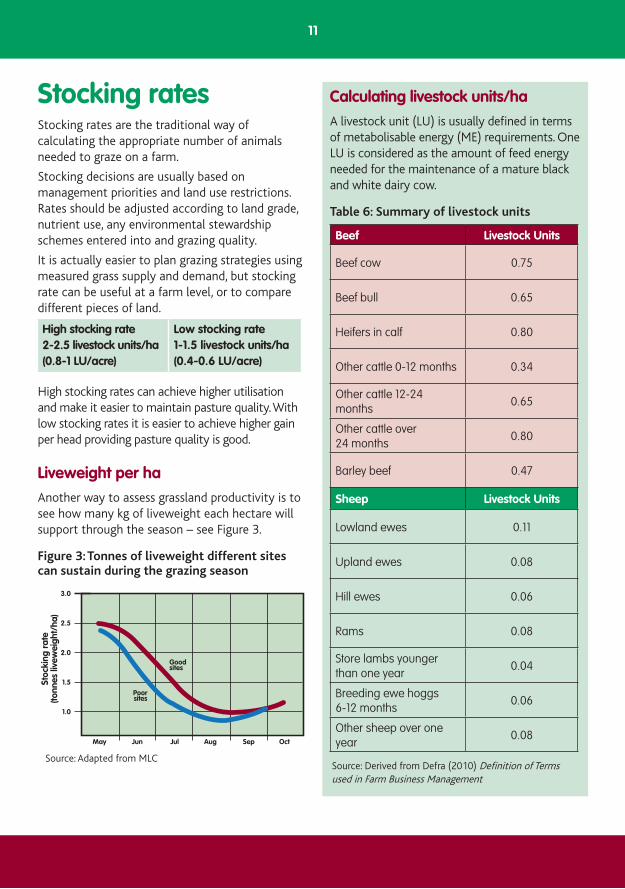
Another way to assess grassland productivity is to see how many kg of liveweight each hectare will support through the season – see Figure 3.
High stocking rate 2-2.5 livestock units/ha (0.8-1 LU/acre)
Low stocking rate1-1.5 livestock units/ha (0.4-0.6 LU/acre)
Beef Livestock Units
Beef cow 0.75
Beef bull 0.65
Heifers in calf 0.80
Other cattle 0-12 months 0.34
Other cattle 12-24 months
0.65
Other cattle over 24 months
0.80
Barley beef 0.47
Sheep Livestock Units
Lowland ewes 0.11
Upland ewes 0.08
Hill ewes 0.06
Rams 0.08
Store lambs younger than one year
0.04
Breeding ewe hoggs 6-12 months
0.06
Other sheep over one year
0.08
Source: Derived from Defra (2010) Definition of Terms used in Farm Business Management
Source: Adapted from MLC
May Jun Jul Aug
Goodsites
Poorsites
Sep Oct
3.0
2.5
2.0
1.5
1.0
Stoc
king
rat
e(to
nnes
live
wei
ght/
ha)
Figure 3: Tonnes of liveweight different sites can sustain during the grazing season
Table 6: Summary of livestock units
12
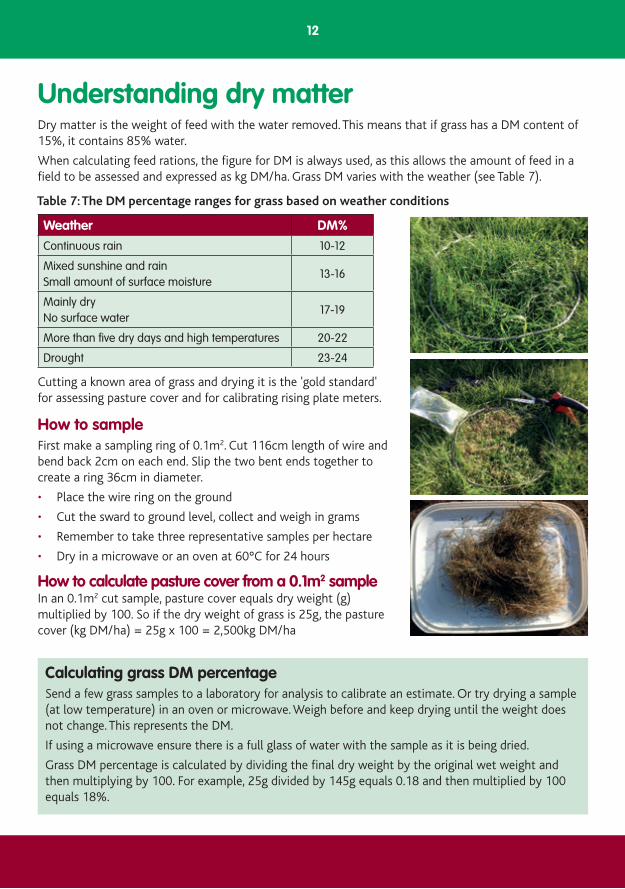
Understanding dry matterDry matter is the weight of feed with the water removed. This means that if grass has a DM content of 15%, it contains 85% water.
When calculating feed rations, the figure for DM is always used, as this allows the amount of feed in a field to be assessed and expressed as kg DM/ha. Grass DM varies with the weather (see Table 7).
How to sampleFirst make a sampling ring of 0.1m2. Cut 116cm length of wire and bend back 2cm on each end. Slip the two bent ends together to create a ring 36cm in diameter.
• Place the wire ring on the ground
• Cut the sward to ground level, collect and weigh in grams
• Remember to take three representative samples per hectare
• Dry in a microwave or an oven at 60°C for 24 hours
How to calculate pasture cover from a 0.1m2 sampleIn an 0.1m2 cut sample, pasture cover equals dry weight (g) multiplied by 100. So if the dry weight of grass is 25g, the pasture cover (kg DM/ha) = 25g x 100 = 2,500kg DM/ha
Weather DM%
Continuous rain 10-12
Mixed sunshine and rain Small amount of surface moisture
13-16
Mainly dryNo surface water
17-19
More than five dry days and high temperatures 20-22
Drought 23-24
Calculating grass DM percentageSend a few grass samples to a laboratory for analysis to calibrate an estimate. Or try drying a sample (at low temperature) in an oven or microwave. Weigh before and keep drying until the weight does not change. This represents the DM.
If using a microwave ensure there is a full glass of water with the sample as it is being dried.
Grass DM percentage is calculated by dividing the final dry weight by the original wet weight and then multiplying by 100. For example, 25g divided by 145g equals 0.18 and then multiplied by 100 equals 18%.
Table 7: The DM percentage ranges for grass based on weather conditions
Cutting a known area of grass and drying it is the 'gold standard' for assessing pasture cover and for calibrating rising plate meters.
13
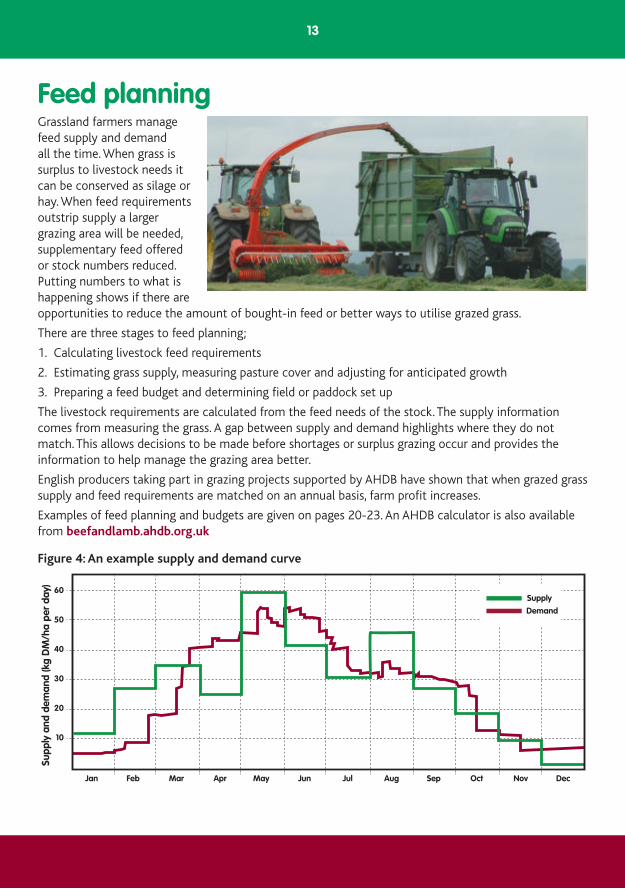
Feed planningGrassland farmers manage feed supply and demand all the time. When grass is surplus to livestock needs it can be conserved as silage or hay. When feed requirements outstrip supply a larger grazing area will be needed, supplementary feed offered or stock numbers reduced. Putting numbers to what is happening shows if there are opportunities to reduce the amount of bought-in feed or better ways to utilise grazed grass.
There are three stages to feed planning;
1. Calculating livestock feed requirements
2. Estimating grass supply, measuring pasture cover and adjusting for anticipated growth
3. Preparing a feed budget and determining field or paddock set up
The livestock requirements are calculated from the feed needs of the stock. The supply information comes from measuring the grass. A gap between supply and demand highlights where they do not match. This allows decisions to be made before shortages or surplus grazing occur and provides the information to help manage the grazing area better.
English producers taking part in grazing projects supported by AHDB have shown that when grazed grass supply and feed requirements are matched on an annual basis, farm profit increases.
Examples of feed planning and budgets are given on pages 20-23. An AHDB calculator is also available from beefandlamb.ahdb.org.uk
Jan
Supp
ly a
nd d
eman
d (k
g D
M/h
a pe
r da
y)
Feb Mar Apr May Jun Jul Aug Sep Oct Nov Dec
60
50
40
30
20
10
Supply
Demand
Figure 4: An example supply and demand curve
14
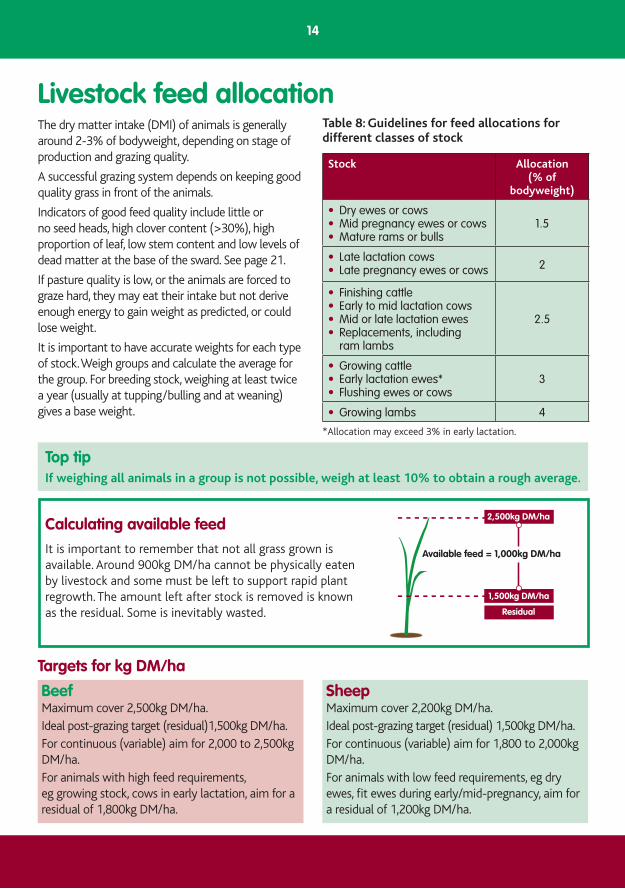
Calculating available feed
It is important to remember that not all grass grown is available. Around 900kg DM/ha cannot be physically eaten by livestock and some must be left to support rapid plant regrowth. The amount left after stock is removed is known as the residual. Some is inevitably wasted.
1,500kg DM/ha
2,500kg DM/ha
Available feed = 1,000kg DM/ha
Residual
Livestock feed allocationThe dry matter intake (DMI) of animals is generally around 2-3% of bodyweight, depending on stage of production and grazing quality.
A successful grazing system depends on keeping good quality grass in front of the animals.
Indicators of good feed quality include little or no seed heads, high clover content (>30%), high proportion of leaf, low stem content and low levels of dead matter at the base of the sward. See page 21.
If pasture quality is low, or the animals are forced to graze hard, they may eat their intake but not derive enough energy to gain weight as predicted, or could lose weight.
It is important to have accurate weights for each type of stock. Weigh groups and calculate the average for the group. For breeding stock, weighing at least twice a year (usually at tupping/bulling and at weaning) gives a base weight.
Stock Allocation (% of
bodyweight)
• Dry ewes or cows• Mid pregnancy ewes or cows• Mature rams or bulls
1.5
• Late lactation cows• Late pregnancy ewes or cows 2
• Finishing cattle• Early to mid lactation cows• Mid or late lactation ewes• Replacements, including
ram lambs
2.5
• Growing cattle• Early lactation ewes*• Flushing ewes or cows
3
• Growing lambs 4
*Allocation may exceed 3% in early lactation.
Top tipIf weighing all animals in a group is not possible, weigh at least 10% to obtain a rough average.
Table 8: Guidelines for feed allocations for different classes of stock
Targets for kg DM/ha
SheepMaximum cover 2,200kg DM/ha.Ideal post-grazing target (residual) 1,500kg DM/ha.For continuous (variable) aim for 1,800 to 2,000kg DM/ha.For animals with low feed requirements, eg dry ewes, fit ewes during early/mid-pregnancy, aim for a residual of 1,200kg DM/ha.
BeefMaximum cover 2,500kg DM/ha.Ideal post-grazing target (residual)1,500kg DM/ha.For continuous (variable) aim for 2,000 to 2,500kg DM/ha.For animals with high feed requirements, eg growing stock, cows in early lactation, aim for a residual of 1,800kg DM/ha.
15
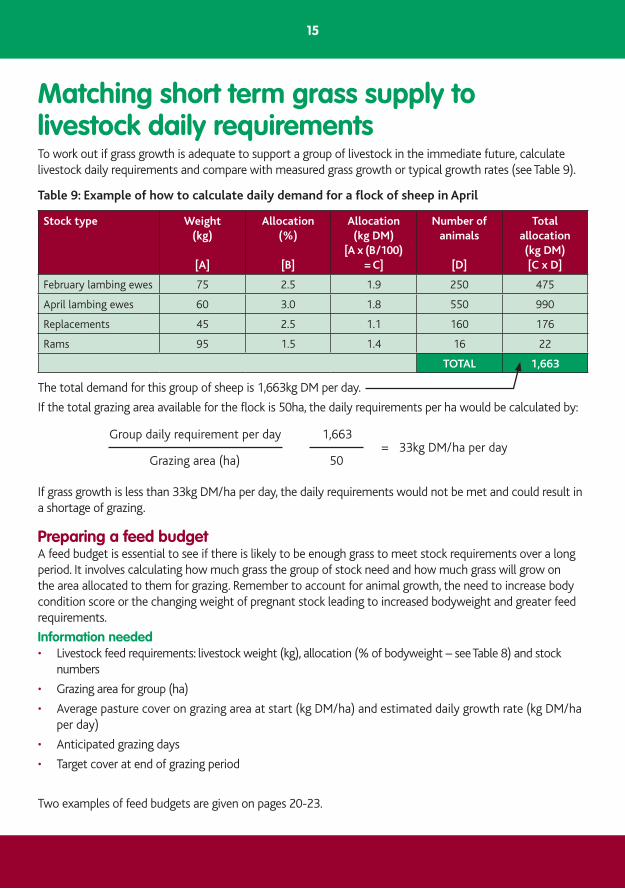
To work out if grass growth is adequate to support a group of livestock in the immediate future, calculate livestock daily requirements and compare with measured grass growth or typical growth rates (see Table 9).
The total demand for this group of sheep is 1,663kg DM per day.
If the total grazing area available for the flock is 50ha, the daily requirements per ha would be calculated by:
If grass growth is less than 33kg DM/ha per day, the daily requirements would not be met and could result in a shortage of grazing.
Preparing a feed budget A feed budget is essential to see if there is likely to be enough grass to meet stock requirements over a long period. It involves calculating how much grass the group of stock need and how much grass will grow on the area allocated to them for grazing. Remember to account for animal growth, the need to increase body condition score or the changing weight of pregnant stock leading to increased bodyweight and greater feed requirements.
Information needed• Livestock feed requirements: livestock weight (kg), allocation (% of bodyweight – see Table 8) and stock
numbers
• Grazing area for group (ha)
• Average pasture cover on grazing area at start (kg DM/ha) and estimated daily growth rate (kg DM/ha per day)
• Anticipated grazing days
• Target cover at end of grazing period
Two examples of feed budgets are given on pages 20-23.
Stock type Weight(kg)
[A]
Allocation (%)
[B]
Allocation(kg DM)
[A x (B/100) = C]
Number of animals
[D]
Total allocation (kg DM) [C x D]
February lambing ewes 75 2.5 1.9 250 475
April lambing ewes 60 3.0 1.8 550 990
Replacements 45 2.5 1.1 160 176
Rams 95 1.5 1.4 16 22
TOTAL 1,663
Table 9: Example of how to calculate daily demand for a flock of sheep in April
Matching short term grass supply to livestock daily requirements
Group daily requirement per day 1,663
Grazing area (ha) 50= 33kg DM/ha per day

16
Calculating grazing rotation length Grazing efficiently involves providing enough grass to meet the livestock feed requirements without grazing below the post-graze target or offering too much, which will lead to reduced grass quality and utilisation.
The key is to plan ahead and estimate how long the stock will need to be in each field before they are moved to the next, taking into account grass growth rates. An example for growing cattle is shown in Tables 10 and 11.
Example grazing rotation plan for growing cattle
Livestock feed requirements
Livestock weight (kg) = 250kg
Allocation (% of bodyweight) from Table 8 = 3%
Stock numbers = 60
Grass availability
Grazing area for group (ha) = 7ha (1ha paddocks)
Average cover on grazing area at start (kg DM/ha) = 2,800kg DM/ha
Estimated daily growth rate (kg DM/ha per day) = 30kg DM/ha per day
Target post-graze cover (kg DM/ha) = 1,500kg DM/ha
The area of 7ha will be grazed with 60 growing cattle weighing an average of 250kg. The grazing area is split into 1ha paddocks. Pre-grazing grass cover is 2,800kg DM/ha and estimated grass growth is 30kg DM/ha per day. The target post-graze cover is 1,500kg DM /ha.
The first step is to calculate the total daily DM requirement of the group then subtract daily grass growth (see Table 10).
Table 10: Calculating group requirements
Table 11: Calculating rotation length
Stock Weight(kg)
[A]
Allocation(%)
[B]
Allocation(kg DM per head)
[A x (B÷100) = C]
Numberof stock
[D]
Grouprequirement(kg DM per
day)[C x D = E]
Group requirement less growth
(kg DM per day)
[E - daily growth = F]
Growing cattle
250 3 7.5 60 450 420
Available grazing(kg DM/ha)
[Average pre-graze cover – post-graze target = G]
Available grazing per paddock
(kg DM)[G x paddock size]
Time in each paddock(days)
[G ÷ F = J]
Rotation length(days)
[Total grazing area x J]
1,300 1,300 3 21
From this the rotation length can be calculated (see Table 11).
This approach can be adapted to plan grazing rotations for all classes of livestock.
16 17
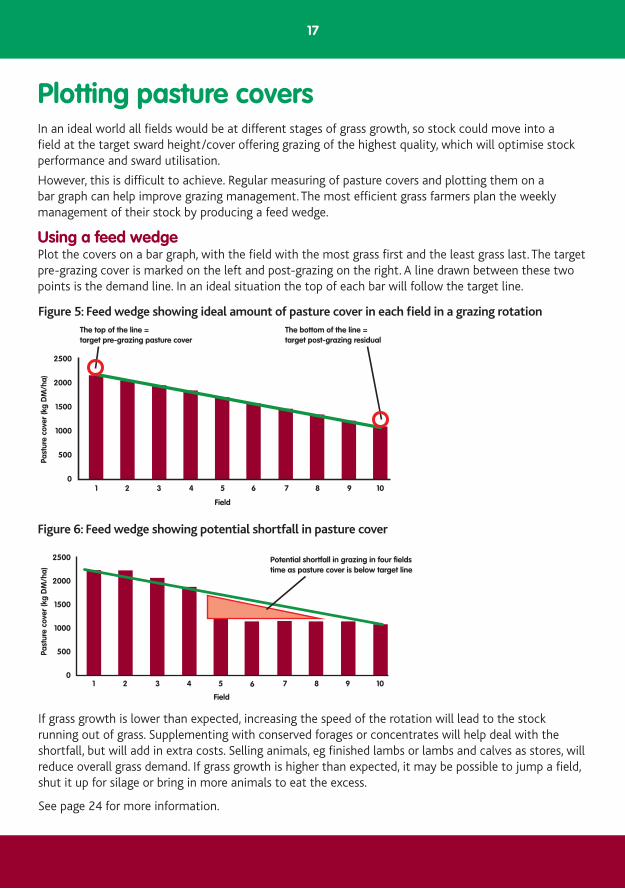
Plotting pasture covers
Figure 5: Feed wedge showing ideal amount of pasture cover in each field in a grazing rotation
Figure 6: Feed wedge showing potential shortfall in pasture cover
If grass growth is lower than expected, increasing the speed of the rotation will lead to the stock running out of grass. Supplementing with conserved forages or concentrates will help deal with the shortfall, but will add in extra costs. Selling animals, eg finished lambs or lambs and calves as stores, will reduce overall grass demand. If grass growth is higher than expected, it may be possible to jump a field, shut it up for silage or bring in more animals to eat the excess.
See page 24 for more information.
In an ideal world all fields would be at different stages of grass growth, so stock could move into a field at the target sward height/cover offering grazing of the highest quality, which will optimise stock performance and sward utilisation.
However, this is difficult to achieve. Regular measuring of pasture covers and plotting them on a bar graph can help improve grazing management. The most efficient grass farmers plan the weekly management of their stock by producing a feed wedge.
Using a feed wedge Plot the covers on a bar graph, with the field with the most grass first and the least grass last. The target pre-grazing cover is marked on the left and post-grazing on the right. A line drawn between these two points is the demand line. In an ideal situation the top of each bar will follow the target line.
The bottom of the line =target post-grazing residual
Field
The top of the line =target pre-grazing pasture cover
2500
2000
1500
1000
500
01 2 3 4 5 6 7 8 9 10
Past
ure
cove
r (k
g D
M/h
a)
Potential shortfall in grazing in four fields time as pasture cover is below target line
2500
2000
1500
1000
500
01 2 3 4 5
Field
Past
ure
cove
r (k
g D
M/h
a)
6 7 8 9 10
18
How to develop a grazing planThe challenge with a grazing plan is that it will change, as grass growth may not do what is predicted or the weather becomes a factor. The key is flexibility and reacting to the circumstances, with the overall aims of improving utilisation and performance off grass.
The best place to start is to break the farm down into separate rotations, which are more manageable and different approaches can be used on different ones. A rotation planner can be used to understand the impact of the animal group size and area. It can be used to adjust rotations as the season progresses.
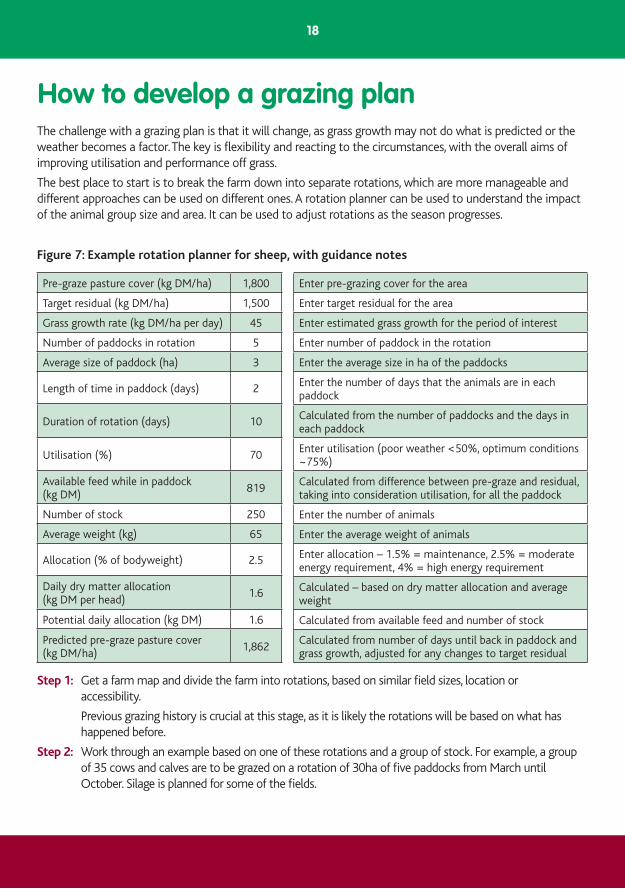
Step 1: Get a farm map and divide the farm into rotations, based on similar field sizes, location or accessibility.
Previous grazing history is crucial at this stage, as it is likely the rotations will be based on what has happened before.
Step 2: Work through an example based on one of these rotations and a group of stock. For example, a group of 35 cows and calves are to be grazed on a rotation of 30ha of five paddocks from March until October. Silage is planned for some of the fields.
Figure 7: Example rotation planner for sheep, with guidance notes
Pre-graze pasture cover (kg DM/ha) 1,800
Target residual (kg DM/ha) 1,500
Grass growth rate (kg DM/ha per day) 45
Number of paddocks in rotation 5
Average size of paddock (ha) 3
Length of time in paddock (days) 2
Duration of rotation (days) 10
Utilisation (%) 70
Available feed while in paddock (kg DM)
819
Number of stock 250
Average weight (kg) 65
Allocation (% of bodyweight) 2.5
Daily dry matter allocation (kg DM per head)
1.6
Potential daily allocation (kg DM) 1.6
Predicted pre-graze pasture cover (kg DM/ha)
1,862
Enter pre-grazing cover for the area
Enter target residual for the area
Enter estimated grass growth for the period of interest
Enter number of paddock in the rotation
Enter the average size in ha of the paddocks
Enter the number of days that the animals are in each paddock
Calculated from the number of paddocks and the days in each paddock
Enter utilisation (poor weather <50%, optimum conditions ~75%)
Calculated from difference between pre-graze and residual, taking into consideration utilisation, for all the paddock
Enter the number of animals
Enter the average weight of animals
Enter allocation – 1.5% = maintenance, 2.5% = moderate energy requirement, 4% = high energy requirement
Calculated – based on dry matter allocation and average weight
Calculated from available feed and number of stock
Calculated from number of days until back in paddock and grass growth, adjusted for any changes to target residual
18 19
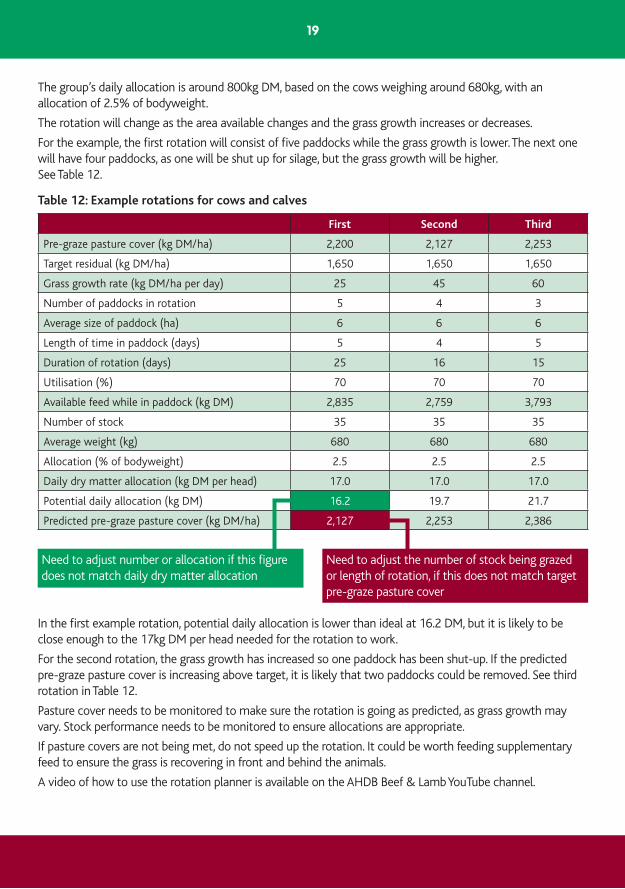
The group’s daily allocation is around 800kg DM, based on the cows weighing around 680kg, with an allocation of 2.5% of bodyweight.
The rotation will change as the area available changes and the grass growth increases or decreases.
For the example, the first rotation will consist of five paddocks while the grass growth is lower. The next one will have four paddocks, as one will be shut up for silage, but the grass growth will be higher. See Table 12.
In the first example rotation, potential daily allocation is lower than ideal at 16.2 DM, but it is likely to be close enough to the 17kg DM per head needed for the rotation to work.
For the second rotation, the grass growth has increased so one paddock has been shut-up. If the predicted pre-graze pasture cover is increasing above target, it is likely that two paddocks could be removed. See third rotation in Table 12.
Pasture cover needs to be monitored to make sure the rotation is going as predicted, as grass growth may vary. Stock performance needs to be monitored to ensure allocations are appropriate.
If pasture covers are not being met, do not speed up the rotation. It could be worth feeding supplementary feed to ensure the grass is recovering in front and behind the animals.
A video of how to use the rotation planner is available on the AHDB Beef & Lamb YouTube channel.
Table 12: Example rotations for cows and calves
First Second Third
Pre-graze pasture cover (kg DM/ha) 2,200 2,127 2,253
Target residual (kg DM/ha) 1,650 1,650 1,650
Grass growth rate (kg DM/ha per day) 25 45 60
Number of paddocks in rotation 5 4 3
Average size of paddock (ha) 6 6 6
Length of time in paddock (days) 5 4 5
Duration of rotation (days) 25 16 15
Utilisation (%) 70 70 70
Available feed while in paddock (kg DM) 2,835 2,759 3,793
Number of stock 35 35 35
Average weight (kg) 680 680 680
Allocation (% of bodyweight) 2.5 2.5 2.5
Daily dry matter allocation (kg DM per head) 17.0 17.0 17.0
Potential daily allocation (kg DM) 16.2 19.7 21.7
Predicted pre-graze pasture cover (kg DM/ha) 2,127 2,253 2,386
Need to adjust number or allocation if this figure does not match daily dry matter allocation
Need to adjust the number of stock being grazed or length of rotation, if this does not match target pre-graze pasture cover
20
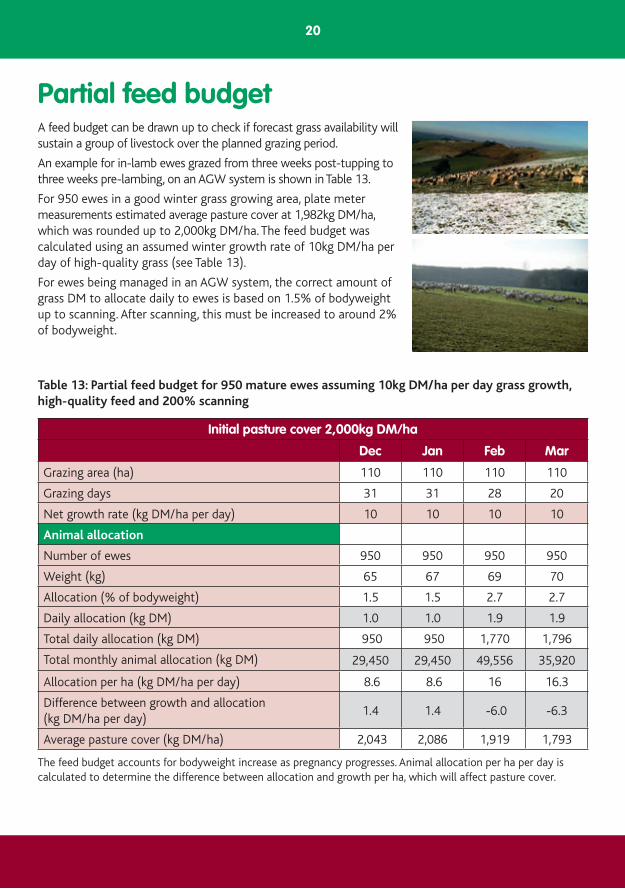
Partial feed budgetA feed budget can be drawn up to check if forecast grass availability will sustain a group of livestock over the planned grazing period.
An example for in-lamb ewes grazed from three weeks post-tupping to three weeks pre-lambing, on an AGW system is shown in Table 13.
For 950 ewes in a good winter grass growing area, plate meter measurements estimated average pasture cover at 1,982kg DM/ha, which was rounded up to 2,000kg DM/ha. The feed budget was calculated using an assumed winter growth rate of 10kg DM/ha per day of high-quality grass (see Table 13).
For ewes being managed in an AGW system, the correct amount of grass DM to allocate daily to ewes is based on 1.5% of bodyweight up to scanning. After scanning, this must be increased to around 2% of bodyweight.
Initial pasture cover 2,000kg DM/ha
Dec Jan Feb Mar
Grazing area (ha) 110 110 110 110
Grazing days 31 31 28 20
Net growth rate (kg DM/ha per day) 10 10 10 10
Animal allocation
Number of ewes 950 950 950 950
Weight (kg) 65 67 69 70
Allocation (% of bodyweight) 1.5 1.5 2.7 2.7
Daily allocation (kg DM) 1.0 1.0 1.9 1.9
Total daily allocation (kg DM) 950 950 1,770 1,796
Total monthly animal allocation (kg DM) 29,450 29,450 49,556 35,920
Allocation per ha (kg DM/ha per day) 8.6 8.6 16 16.3
Difference between growth and allocation (kg DM/ha per day)
1.4 1.4 -6.0 -6.3
Average pasture cover (kg DM/ha) 2,043 2,086 1,919 1,793
The feed budget accounts for bodyweight increase as pregnancy progresses. Animal allocation per ha per day is calculated to determine the difference between allocation and growth per ha, which will affect pasture cover.
Table 13: Partial feed budget for 950 mature ewes assuming 10kg DM/ha per day grass growth, high-quality feed and 200% scanning
21
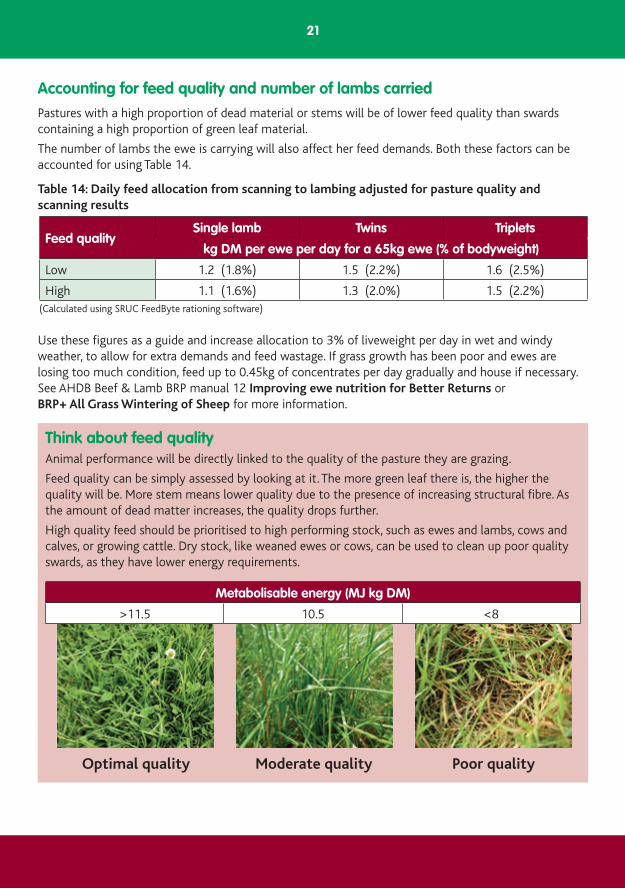
Accounting for feed quality and number of lambs carried
Pastures with a high proportion of dead material or stems will be of lower feed quality than swards containing a high proportion of green leaf material.
The number of lambs the ewe is carrying will also affect her feed demands. Both these factors can be accounted for using Table 14.
Use these figures as a guide and increase allocation to 3% of liveweight per day in wet and windy weather, to allow for extra demands and feed wastage. If grass growth has been poor and ewes are losing too much condition, feed up to 0.45kg of concentrates per day gradually and house if necessary. See AHDB Beef & Lamb BRP manual 12 Improving ewe nutrition for Better Returns or BRP+ All Grass Wintering of Sheep for more information.
Think about feed qualityAnimal performance will be directly linked to the quality of the pasture they are grazing.
Feed quality can be simply assessed by looking at it. The more green leaf there is, the higher the quality will be. More stem means lower quality due to the presence of increasing structural fibre. As the amount of dead matter increases, the quality drops further.
High quality feed should be prioritised to high performing stock, such as ewes and lambs, cows and calves, or growing cattle. Dry stock, like weaned ewes or cows, can be used to clean up poor quality swards, as they have lower energy requirements.
Table 14: Daily feed allocation from scanning to lambing adjusted for pasture quality and scanning results
Feed qualitySingle lamb Twins Triplets
kg DM per ewe per day for a 65kg ewe (% of bodyweight)
Low 1.2 (1.8%) 1.5 (2.2%) 1.6 (2.5%)
High 1.1 (1.6%) 1.3 (2.0%) 1.5 (2.2%)(Calculated using SRUC FeedByte rationing software)
Optimal quality Moderate quality Poor quality
Metabolisable energy (MJ kg DM)
>11.5 10.5 <8
22
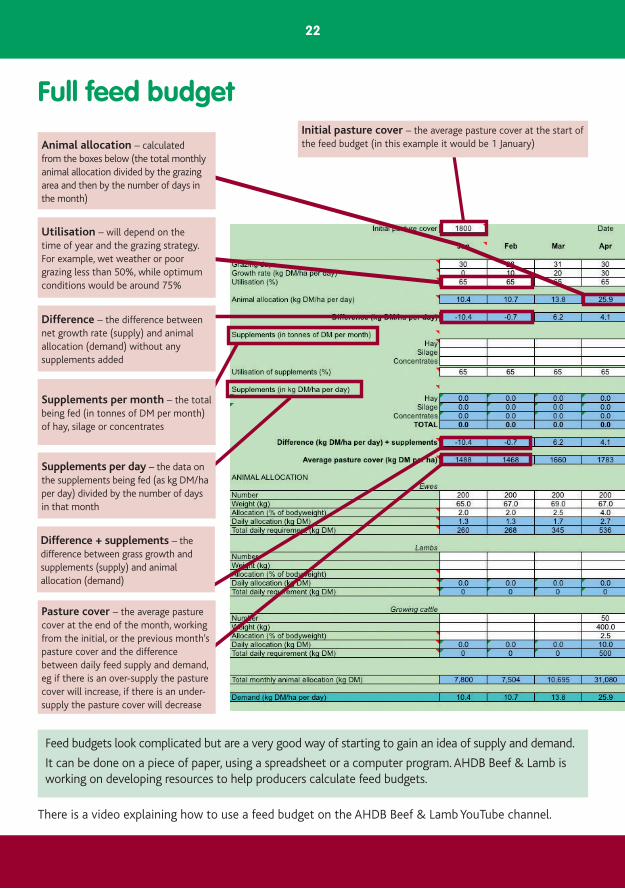
Full feed budget
Feed budgets look complicated but are a very good way of starting to gain an idea of supply and demand.
It can be done on a piece of paper, using a spreadsheet or a computer program. AHDB Beef & Lamb is working on developing resources to help producers calculate feed budgets.
Initial pasture cover – the average pasture cover at the start of the feed budget (in this example it would be 1 January)
There is a video explaining how to use a feed budget on the AHDB Beef & Lamb YouTube channel.
Animal allocation – calculated from the boxes below (the total monthly animal allocation divided by the grazing area and then by the number of days in the month)
Pasture cover – the average pasture cover at the end of the month, working from the initial, or the previous month’s pasture cover and the difference between daily feed supply and demand, eg if there is an over-supply the pasture cover will increase, if there is an under-supply the pasture cover will decrease
Utilisation – will depend on the time of year and the grazing strategy. For example, wet weather or poor grazing less than 50%, while optimum conditions would be around 75%
Supplements per month – the total being fed (in tonnes of DM per month) of hay, silage or concentrates
Supplements per day – the data on the supplements being fed (as kg DM/ha per day) divided by the number of days in that month
Difference + supplements – the difference between grass growth and supplements (supply) and animal allocation (demand)
Difference – the difference between net growth rate (supply) and animal allocation (demand) without any supplements added
23
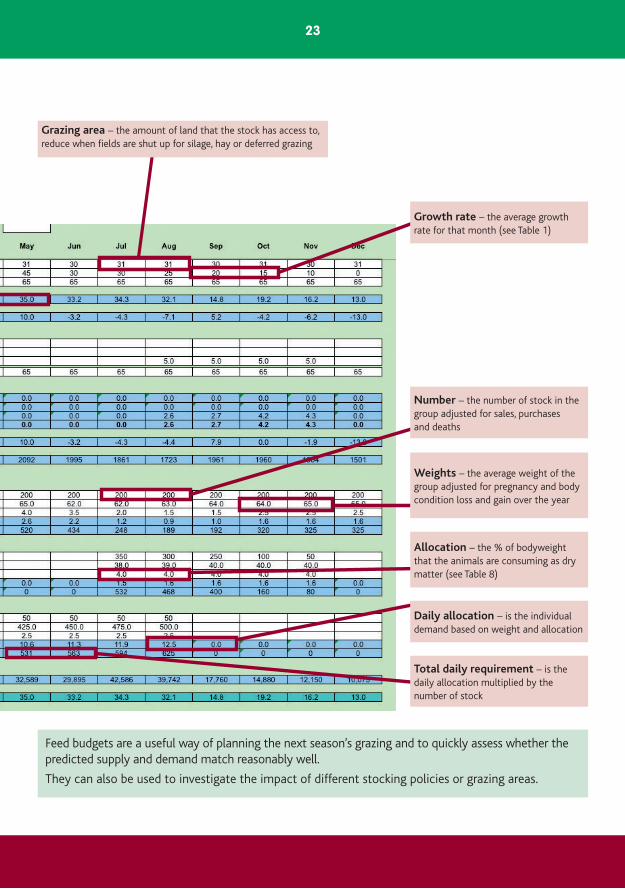
Feed budgets are a useful way of planning the next season’s grazing and to quickly assess whether the predicted supply and demand match reasonably well.
They can also be used to investigate the impact of different stocking policies or grazing areas.
Grazing area – the amount of land that the stock has access to, reduce when fields are shut up for silage, hay or deferred grazing
Growth rate – the average growth rate for that month (see Table 1)
Number – the number of stock in the group adjusted for sales, purchases and deaths
Weights – the average weight of the group adjusted for pregnancy and body condition loss and gain over the year
Allocation – the % of bodyweight that the animals are consuming as dry matter (see Table 8)
Daily allocation – is the individual demand based on weight and allocation
Total daily requirement – is the daily allocation multiplied by the number of stock
24
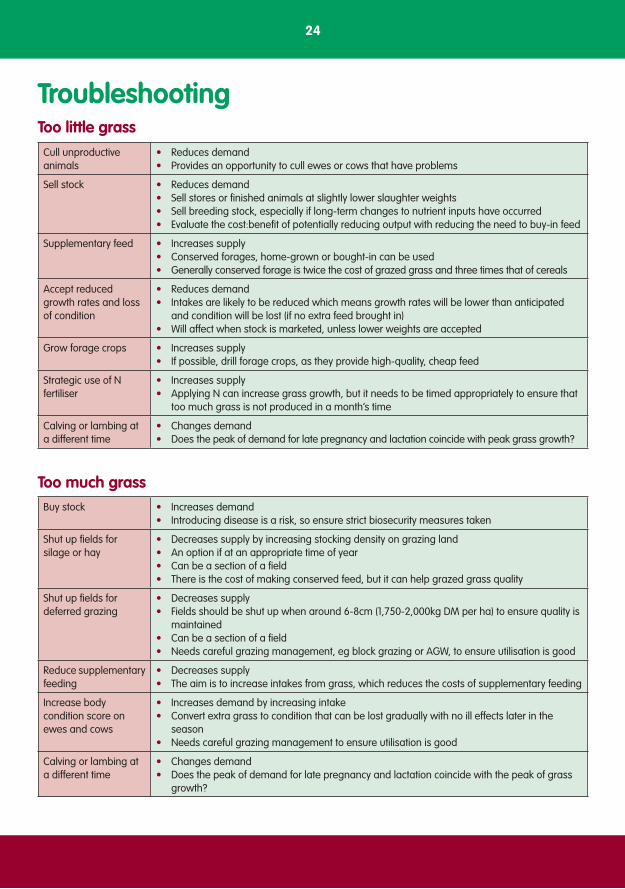
Troubleshooting
Cull unproductive animals
• Reduces demand• Provides an opportunity to cull ewes or cows that have problems
Sell stock • Reduces demand• Sell stores or finished animals at slightly lower slaughter weights• Sell breeding stock, especially if long-term changes to nutrient inputs have occurred• Evaluate the cost:benefit of potentially reducing output with reducing the need to buy-in feed
Supplementary feed • Increases supply• Conserved forages, home-grown or bought-in can be used • Generally conserved forage is twice the cost of grazed grass and three times that of cereals
Accept reduced growth rates and loss of condition
• Reduces demand• Intakes are likely to be reduced which means growth rates will be lower than anticipated
and condition will be lost (if no extra feed brought in) • Will affect when stock is marketed, unless lower weights are accepted
Grow forage crops • Increases supply• If possible, drill forage crops, as they provide high-quality, cheap feed
Strategic use of N fertiliser
• Increases supply• Applying N can increase grass growth, but it needs to be timed appropriately to ensure that
too much grass is not produced in a month’s time
Calving or lambing at a different time
• Changes demand• Does the peak of demand for late pregnancy and lactation coincide with peak grass growth?
Buy stock • Increases demand• Introducing disease is a risk, so ensure strict biosecurity measures taken
Shut up fields for silage or hay
• Decreases supply by increasing stocking density on grazing land• An option if at an appropriate time of year• Can be a section of a field• There is the cost of making conserved feed, but it can help grazed grass quality
Shut up fields for deferred grazing
• Decreases supply• Fields should be shut up when around 6-8cm (1,750-2,000kg DM per ha) to ensure quality is
maintained• Can be a section of a field• Needs careful grazing management, eg block grazing or AGW, to ensure utilisation is good
Reduce supplementary feeding
• Decreases supply• The aim is to increase intakes from grass, which reduces the costs of supplementary feeding
Increase body condition score on ewes and cows
• Increases demand by increasing intake• Convert extra grass to condition that can be lost gradually with no ill effects later in the
season• Needs careful grazing management to ensure utilisation is good
Calving or lambing at a different time
• Changes demand• Does the peak of demand for late pregnancy and lactation coincide with the peak of grass
growth?
Too little grass
Too much grass
25
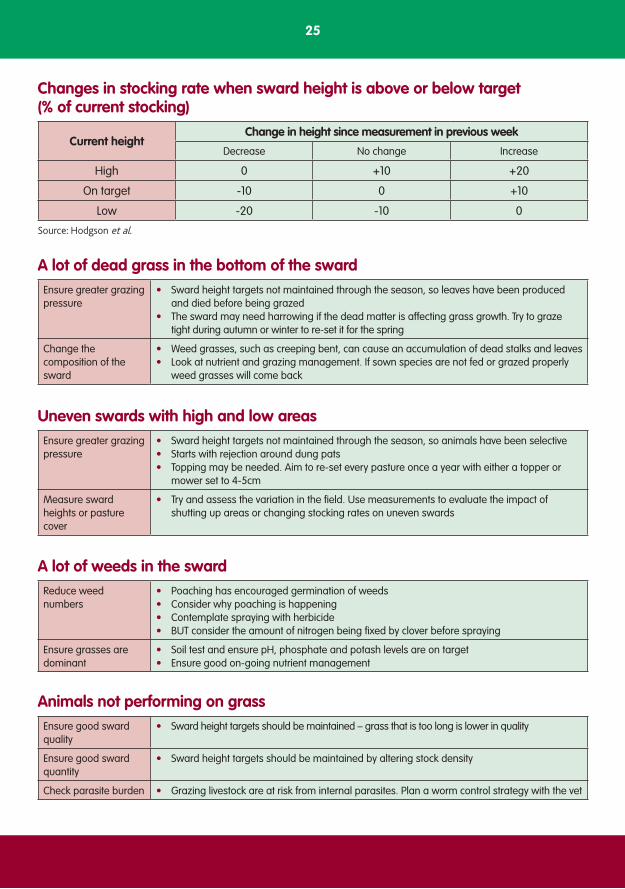
Ensure greater grazing pressure
• Sward height targets not maintained through the season, so leaves have been produced and died before being grazed
• The sward may need harrowing if the dead matter is affecting grass growth. Try to graze tight during autumn or winter to re-set it for the spring
Change the composition of the sward
• Weed grasses, such as creeping bent, can cause an accumulation of dead stalks and leaves• Look at nutrient and grazing management. If sown species are not fed or grazed properly
weed grasses will come back
Ensure greater grazing pressure
• Sward height targets not maintained through the season, so animals have been selective• Starts with rejection around dung pats• Topping may be needed. Aim to re-set every pasture once a year with either a topper or
mower set to 4-5cm
Measure sward heights or pasture cover
• Try and assess the variation in the field. Use measurements to evaluate the impact of shutting up areas or changing stocking rates on uneven swards
Reduce weed numbers
• Poaching has encouraged germination of weeds• Consider why poaching is happening• Contemplate spraying with herbicide• BUT consider the amount of nitrogen being fixed by clover before spraying
Ensure grasses are dominant
• Soil test and ensure pH, phosphate and potash levels are on target• Ensure good on-going nutrient management
Ensure good sward quality
• Sward height targets should be maintained – grass that is too long is lower in quality
Ensure good sward quantity
• Sward height targets should be maintained by altering stock density
Check parasite burden • Grazing livestock are at risk from internal parasites. Plan a worm control strategy with the vet
Current heightChange in height since measurement in previous week
Decrease No change Increase
High 0 +10 +20
On target -10 0 +10
Low -20 -10 0
A lot of dead grass in the bottom of the sward
Uneven swards with high and low areas
A lot of weeds in the sward
Animals not performing on grass
Changes in stocking rate when sward height is above or below target (% of current stocking)
Source: Hodgson et al.
Joint Beef and Sheep BRP
Manual 1 – Improving pasture for Better Returns Manual 2 – Assessing the business for Better Returns Manual 3 – Improving soils for Better Returns Manual 4 – Managing clover for Better Returns Manual 5 – Making grass silage for Better Returns Manual 6 – Using brassicas for Better ReturnsManual 7 – Managing nutrients for Better ReturnsManual 8 – Planning grazing strategies for Better ReturnsManual 9 – Minimising carcase losses for Better ReturnsManual 10 – Growing and feeding maize silage for Better Returns
See the AHDB Beef & Lamb website beefandlamb.ahdb.org.uk for the full list of Better Returns Programme publications for beef and sheep producers.
Other BRP publications available
For more information contact:Better Returns ProgrammeAHDB Beef & LambStoneleigh ParkKenilworthWarwickshireCV8 2TL
Tel: 024 7647 8834Email: [email protected]
AHDB Beef & Lamb is a division of the Agriculture and Horticulture Development Board (AHDB)
© Agriculture and Horticulture Development Board 2016