bbw2012 - ln
TRANSCRIPT
Implementation of Business Intelligence – The Experience of Lingnan University, Hong Kong
Professor William LeeAssociate Vice-President (Academic Affairs) & Registrar
Terence KwokAngela Ng
Lingnan University, Hong Kong
2
Agenda
• Who Are WE?
• Background of the BI Project
• Implementation of Business Intelligence
• Project Timeline
• Technical Issues: Implementation and Challenges
• How Data is transformed to Information? – A Live Demo on Internationalization KPI on ProClarity
• Challenges Encountered
• Conclusion & Recommendations
• Q & A Session

3
Who Are We?
• Characteristics of Lingnan University • A Publicly-funded Liberal Arts University in Hong
Kong – 2,300 students
• Small Class Teaching – class size keeps at 35-40• Multi-disciplinary Programmes to embrace liberal
arts education• High priority on Internationalization – 50%
exchange-out rate• Close to Full Residence • First in Hong Kong to establish a Living & Learning
Community • Heavy emphasis on Experiential Learning through
Service-Learning, Integrated Learning Programmes (ILP), Civic Engagement, Community Services, etc.
4
Background of the BI Project
• Report of a Quality Audit of Lingnan in July 2010 - Recommendation from Quality Assurance Council • To develop an Overarching Evaluation Framework to help
focus and define appropriate Educational Indicators & to ensure the flow of empirical information for academic & management decision-making
• Implementation of the new 4-year curriculum w.e.f. 2012-13
• A BI solution is therefore considered essential!!
5
Implementation of BI
• Step 1 – Preparation Works• September 2010 – set up Task Force on Evaluation
Framework to develop overarching evaluation framework to pull data together for panoramic view
• Five university-wide indicators of good education experiences (KPIs) were identified:
a) Internationalization;
b) Experiential Learning;
c) Small Class;
d) Inter-disciplinary Courses; and
e) Residential Experiences
6
Implementation of BI
• Step 2 - Acquisition of BI system • September 2010 – February 2011 – sourcing of a suitable BI
solution for higher education in Hong Kong
• February 2011 – Blackboard Analytics had acquired iStrategy and started aggressively promoting the product outside the U.S.
• March 2011 – benchmarking with overseas institutions on using different BI products
7
Implementation of BI
• Step 2 - Acquisition of BI system (Cont’d)• Blackboard Analytics is identified as the most suitable BI
solution for Lingnan because it is:
a) Purposely built for analyzing student data for higher education with all the basic foundations (baseline) to start with;
b) Less expensive compared with other BI products;
c) User-friendly for Faculty/administrative units to access their data directly for data analysis/modelling; and
d) Compatible with Moodle (a teaching and learning system)
• June 2011 – Contract Agreement Sign-off
8
Implementation of BI
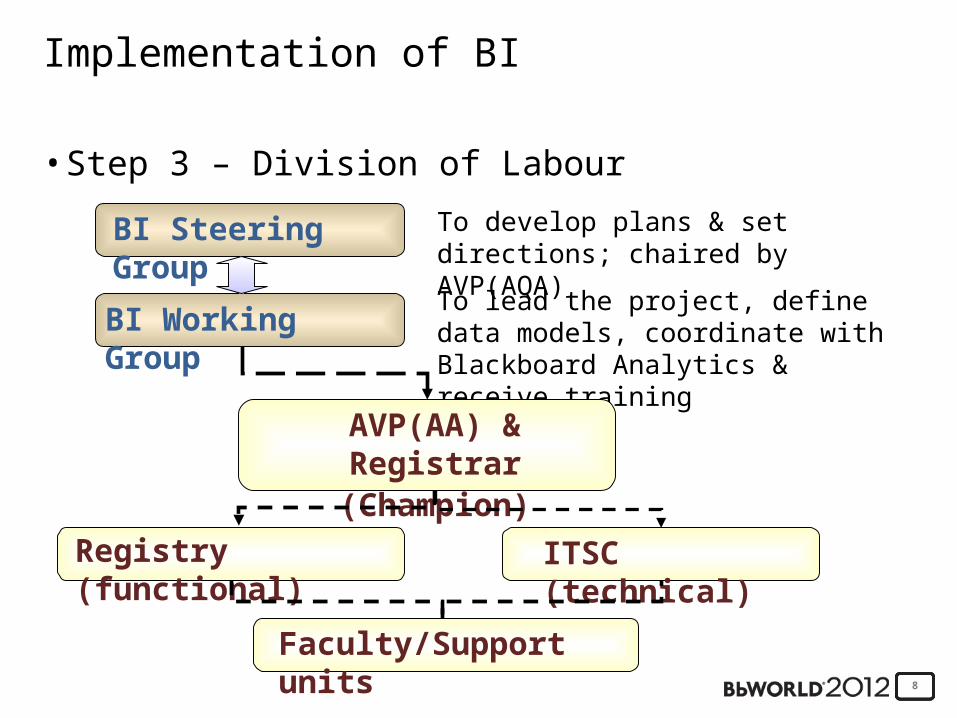
• Step 3 – Division of Labour
BI Steering Group To develop plans & set directions; chaired by AVP(AQA)
To lead the project, define data models, coordinate with Blackboard Analytics & receive training
AVP(AA) & Registrar(Champion)
Registry (functional) ITSC (technical)
BI Working Group
Faculty/Support units
9
Implementation of BI
• Step 3 – Division of Labour (Cont’d)• Relationship with Blackboard Analytics
a) Advise on Infrastructure Requirements;
b) Knowledge Transfer;
c) Advise on Business Rules Validation & GAP Analysis;
d) Conduct Technical Training on System Application;
e) Support on Design & Development of Customized Data Models; and
f) Assist in System Deployment and developing Reports.
10
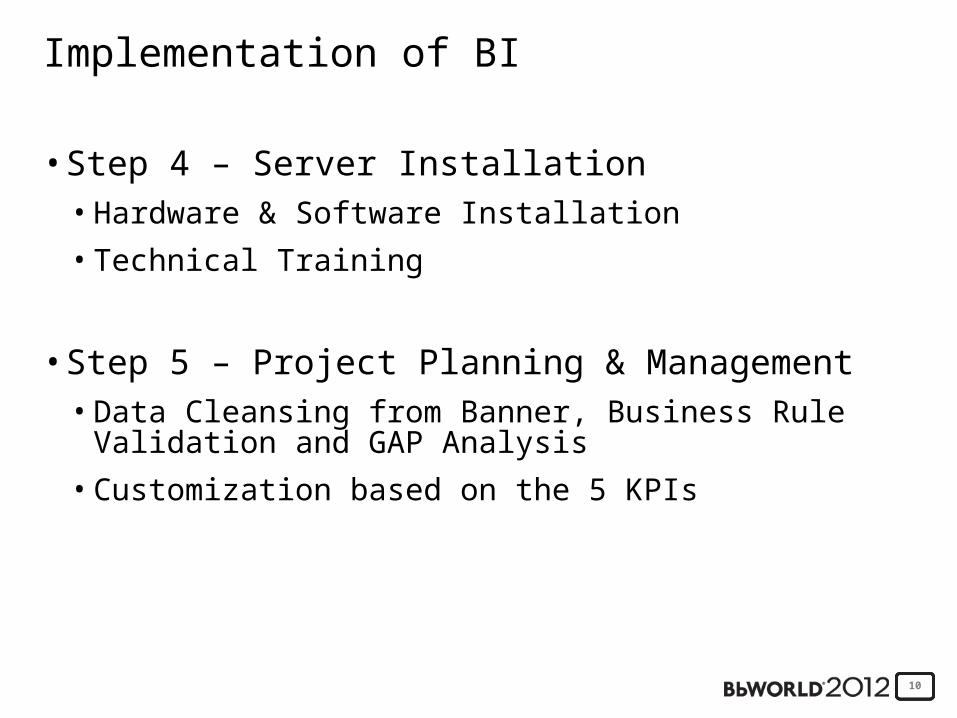
Implementation of BI
• Step 4 – Server Installation • Hardware & Software Installation
• Technical Training
• Step 5 – Project Planning & Management• Data Cleansing from Banner, Business Rule Validation and
GAP Analysis
• Customization based on the 5 KPIs
11
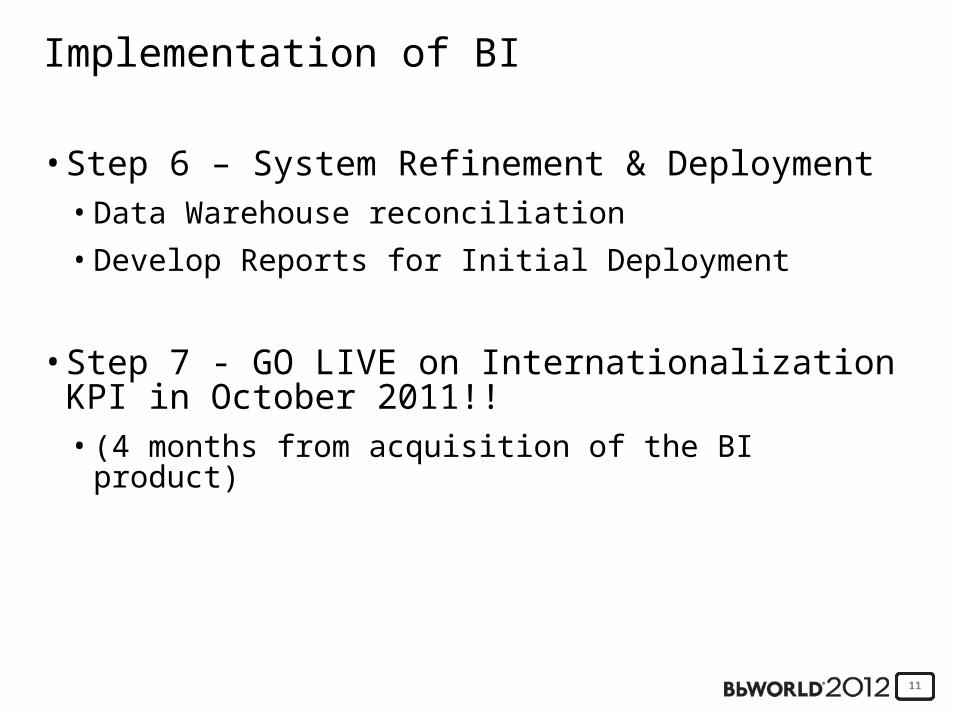
Implementation of BI
• Step 6 – System Refinement & Deployment• Data Warehouse reconciliation
• Develop Reports for Initial Deployment
• Step 7 - GO LIVE on Internationalization KPI in October 2011!! • (4 months from acquisition of the BI product)
12
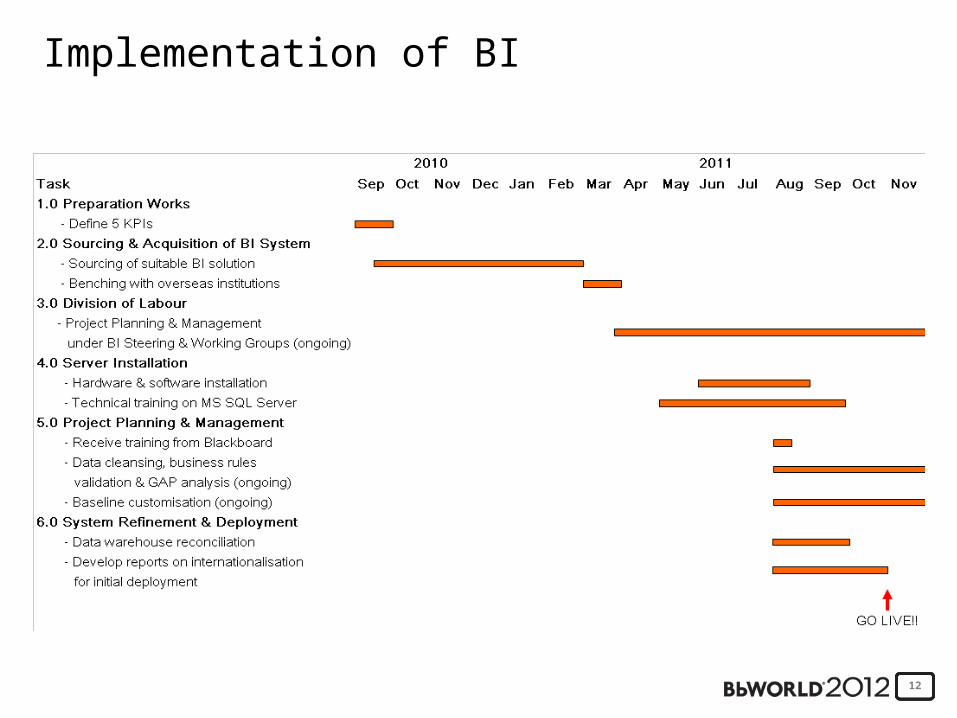
Implementation of BI
13
Technical Issues: Implementation and Challenges
14
Background
• Implemented Banner System in 2002• Student Module
• Finance Module
• Human Resources / Payroll Modules
• Advancement Module
• Implemented DegreeWorks (an academic advising & degree auditing tool) in April 2010
• Implemented BI System offered by Blackboard Analytics in October 2011
15
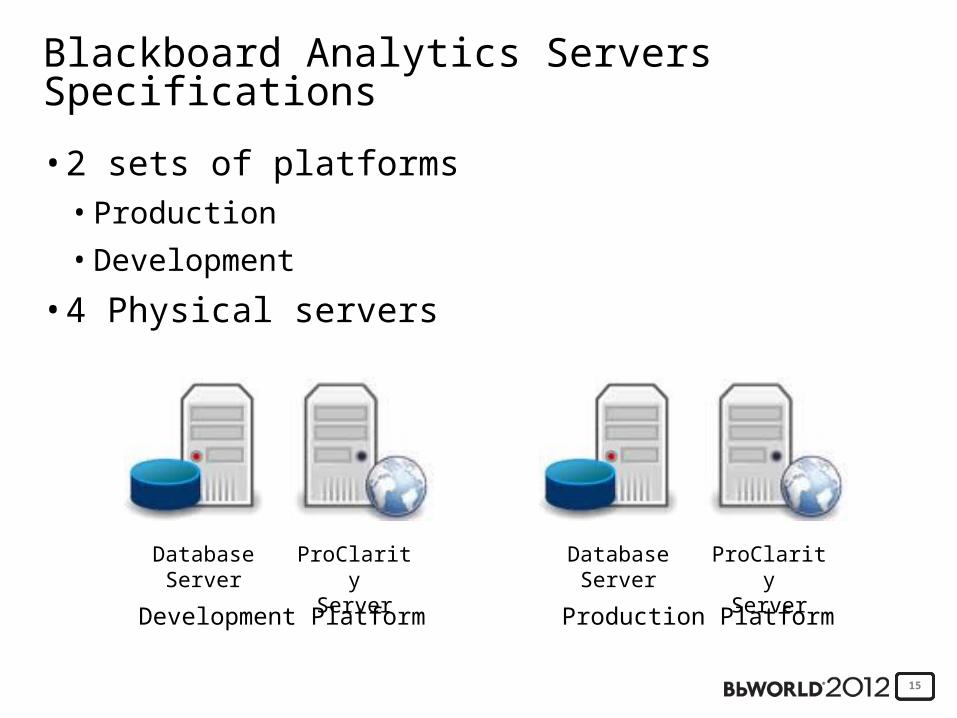
Blackboard Analytics Servers Specifications
• 2 sets of platforms• Production
• Development
• 4 Physical servers
DatabaseServer
ProClarityServer
Development Platform
DatabaseServer
ProClarityServer
Production Platform
16
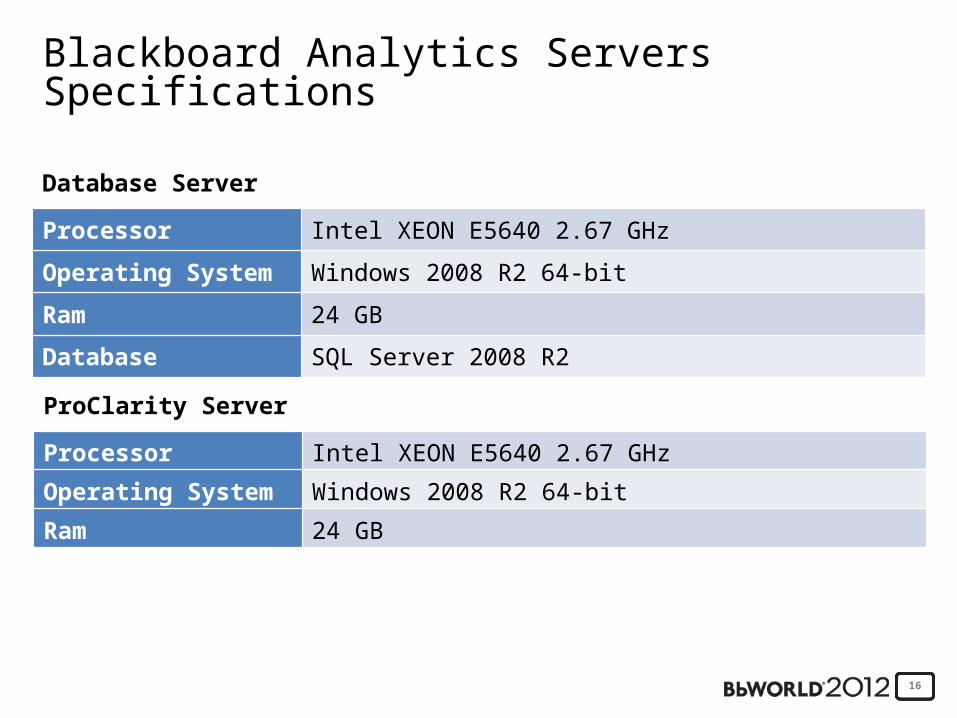
Blackboard Analytics Servers Specifications
Processor Intel XEON E5640 2.67 GHz
Operating System Windows 2008 R2 64-bit
Ram 24 GB
Database SQL Server 2008 R2
Database Server
ProClarity Server
Processor Intel XEON E5640 2.67 GHz
Operating System Windows 2008 R2 64-bit
Ram 24 GB
17
Technical Challenges
18
Data Warehouse Concept
• Operational Database vs Data Warehouse• Details Report vs Summary Report
• Functional users should expect the report is more strategic in nature, looking at summarized data
• Different system design
• Technical people should adopt the data warehouse methodology in designing the tables
19
Data Warehouse Concept
• Oracle vs SQL Server• DBA and Application Developers have built up a knowledge
base in Oracle through development in the Banner System and DegreeWorks System
• Requires to pick up SQL Server and Analysis Service knowledge in a short period of time
20
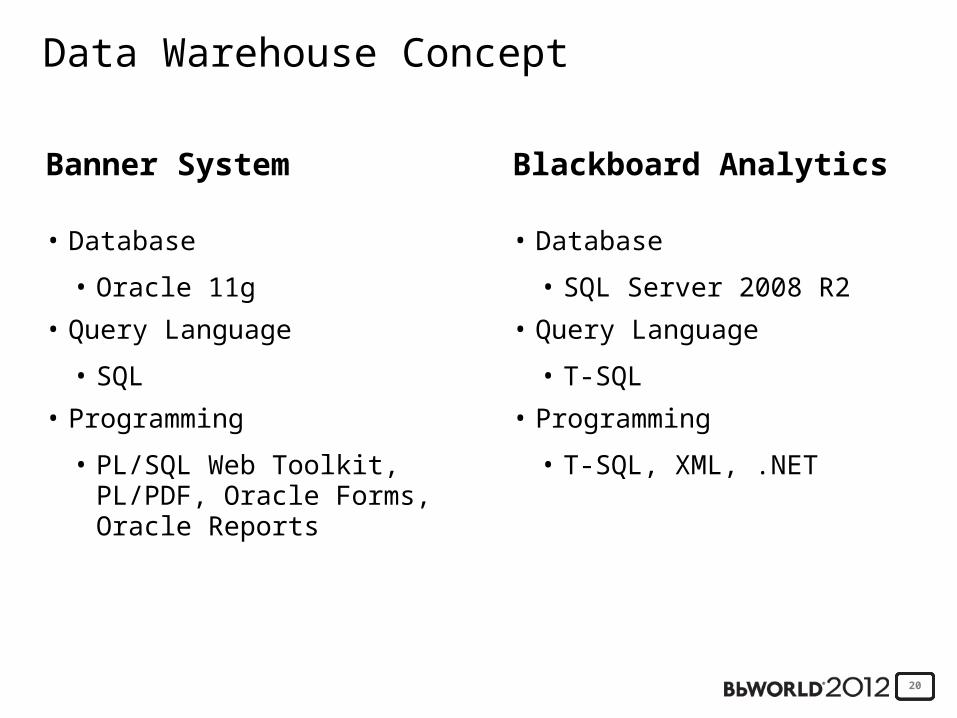
Data Warehouse Concept
Banner System
• Database
• Oracle 11g
• Query Language
• SQL
• Programming
• PL/SQL Web Toolkit, PL/PDF, Oracle Forms, Oracle Reports
Blackboard Analytics
• Database
• SQL Server 2008 R2
• Query Language
• T-SQL
• Programming
• T-SQL, XML, .NET
21
Implementation starts from building localized KPIs
• Presume the BbA baseline model is valid as Lingnan has followed very closely to the Banner baseline in inputting student data
• Some essential reports are not covered in the baseline model
• Focus on customization instead of learning the baseline model
22
Implementation starts from building localized KPIs
• Consequences• Functional users has less time in learning and validating the
baseline model
• Urgency to set up a development platform DBA encountered difficulties in setting up a development server
(the production server is set up by the Blackboard Installation Team)
Challenge to Blackboard as not much experience in setting up another set of server for the same school
23
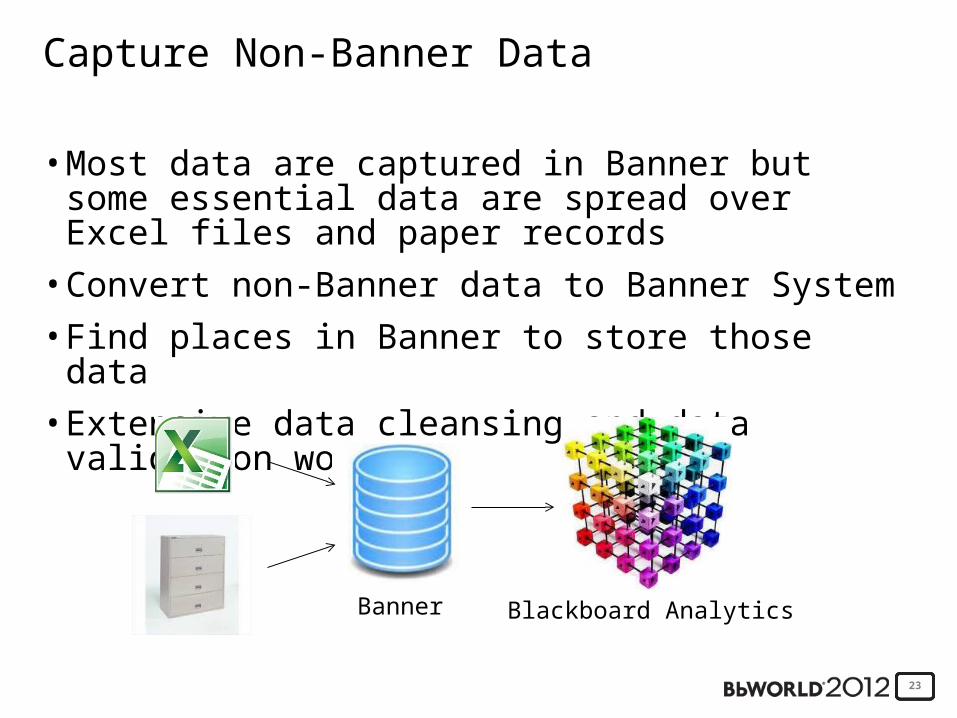
Capture Non-Banner Data
• Most data are captured in Banner but some essential data are spread over Excel files and paper records
• Convert non-Banner data to Banner System
• Find places in Banner to store those data
• Extensive data cleansing and data validation works
Banner Blackboard Analytics
24
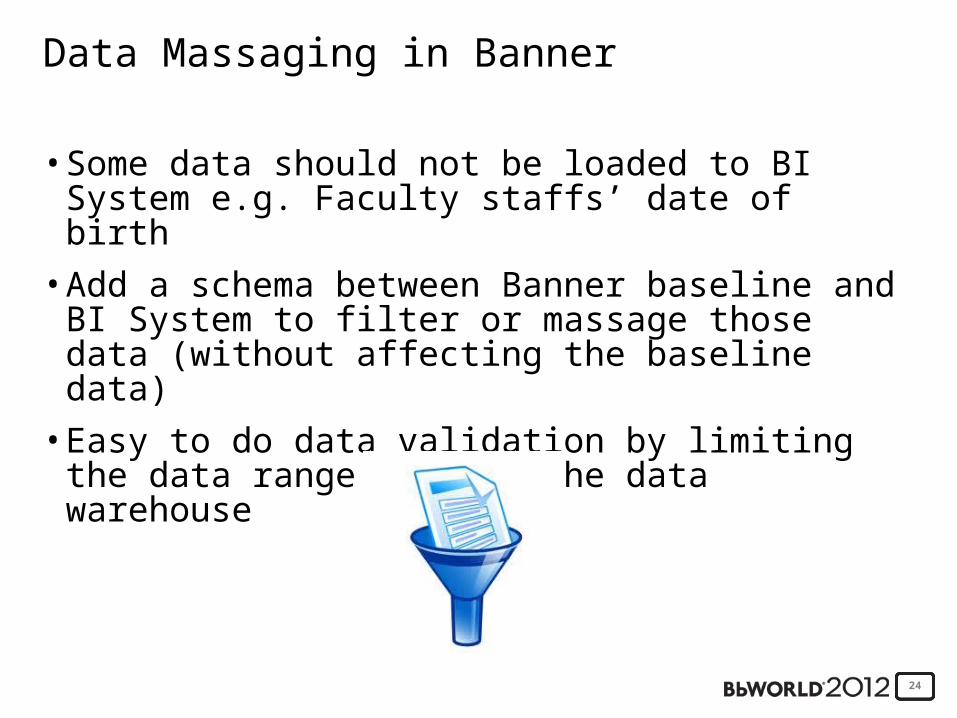
Data Massaging in Banner
• Some data should not be loaded to BI System e.g. Faculty staffs’ date of birth
• Add a schema between Banner baseline and BI System to filter or massage those data (without affecting the baseline data)
• Easy to do data validation by limiting the data range load to the data warehouse
25
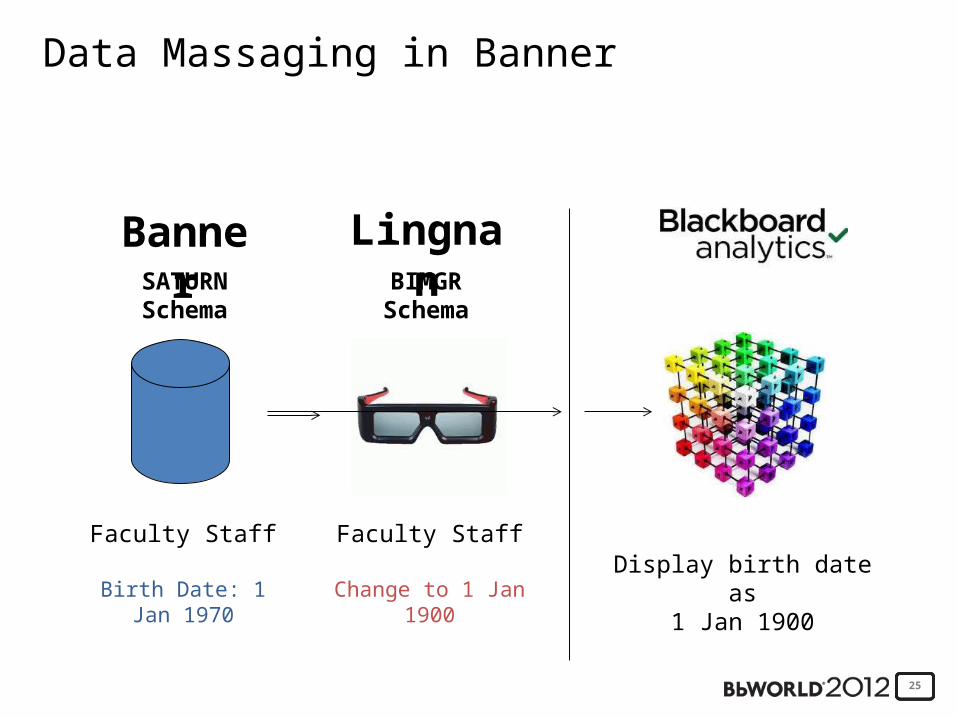
Data Massaging in Banner
Faculty Staff
Birth Date: 1 Jan 1970
Faculty Staff
Change to 1 Jan 1900
SATURN Schema
BIMGR Schema
Display birth date as1 Jan 1900
Banner Lingnan
26
Experience Sharing
• Self-Learnt before consultant’s visit• Data Warehouse concept – both functional users and
developers
• SQL Server
• SQL Server Analysis Service
• Done data filtering on Oracle’s new schema is a good idea to control the data to be loaded to the data warehouse
27
How Data is Transformed to Information?A Live Demo on Internationalization KPI on
ProClarity
28
Impact on the Institution
• Change on workflow – more efficient
• Use evidence to make decision – more effective
• More proactive bringing policy to deal with change
• Streamlining the collection of important information
29
Challenges Encountered
• Cultural Differences – U.S. vs Hong Kong• How to make use of a standard US-based application tools
for an international university in Hong Kong?
• Not all baseline models can be used (e.g. student attrition & retention rates)
• Extensive customization works
• Extensive time to go through Business Rule Validation
• Implementation starts from KPI but not Baseline• Extensive customization works
30
Challenges Encountered
• Data spread through everywhere• No single warehouse; data have to be collected &
consolidated together
• Extensive data cleansing works
• Change of mindset • How to motivate staff members from different units to
contribute to the success of the BI implementation?
• High-level steering & working groups chaired by two AVPs; hands-on supervision by the Champion; 360 degrees report-back mechanism
31
Conclusion & Recommendations
• Factors leading to the Success• Get everybody involved – from AVPs to Clerical Staff
• Everyone goes for one goal – Phase I implementation goes live by October 2011
• Have the right champion & working partners leading and working for the BI project

32
Thank YouQ & A Session
33
We value your feedback!Please fill out a session evaluation.