baye chap011
TRANSCRIPT

Copyright © 2010 by the McGraw-Hill Companies, Inc. All rights reserved. McGraw-Hill/Irwin
Managerial Economics & Business Strategy
Chapter 11 Pricing Strategies
for Firms with Market Power

11-2
Overview I. Basic Pricing Strategies
– Monopoly & Monopolistic Competition – Cournot Oligopoly
II. Extracting Consumer Surplus – Price Discrimination ■ Two-Part Pricing – Block Pricing ■ Commodity Bundling
III. Pricing for Special Cost and Demand Structures – Peak-Load Pricing ■ Transfer Pricing – Cross Subsidies
IV. Pricing in Markets with Intense Price Competition – Price Matching ■ Randomized Pricing – Brand Loyalty

11-3
Standard Pricing and Profits for Firms with Market Power Price
Quantity
P = 10 - 2Q
10
8
6
4
2
1 2 3 4 5
MC
MR = 10 - 4Q
Profits from standard pricing = $8

11-4
An Algebraic Example
§ P = 10 - 2Q § C(Q) = 2Q § If the firm must charge a single price to all
consumers, the profit-maximizing price is obtained by setting MR = MC.
§ 10 - 4Q = 2, so Q* = 2. § P* = 10 - 2(2) = 6. § Profits = (6)(2) - 2(2) = $8.
11-5
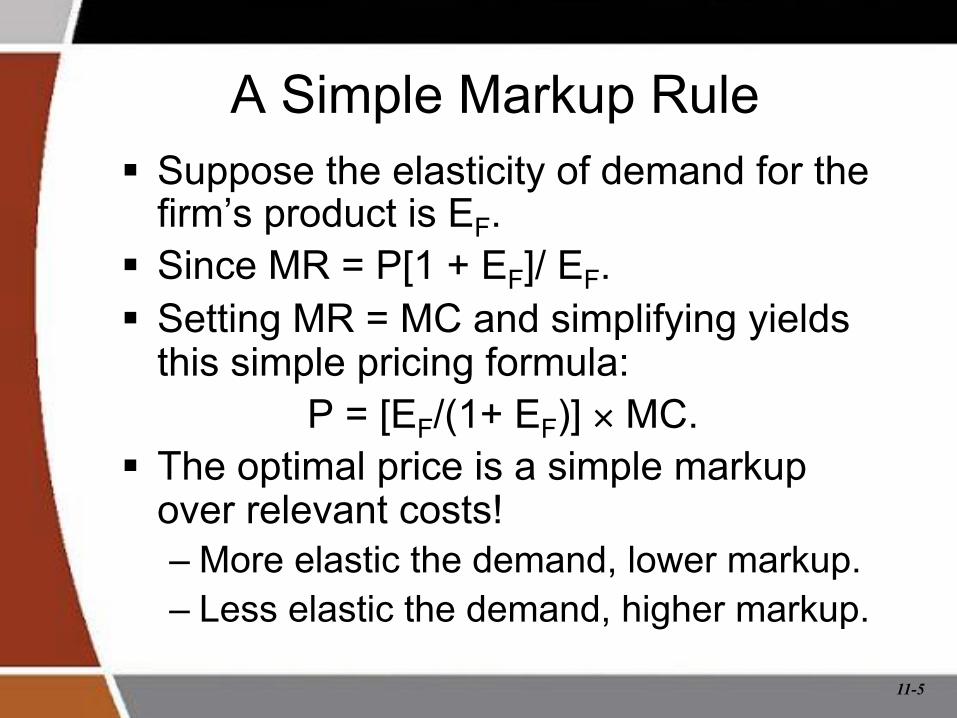
A Simple Markup Rule § Suppose the elasticity of demand for the
firm’s product is EF. § Since MR = P[1 + EF]/ EF. § Setting MR = MC and simplifying yields
this simple pricing formula: P = [EF/(1+ EF)] × MC.
§ The optimal price is a simple markup over relevant costs! – More elastic the demand, lower markup. – Less elastic the demand, higher markup.

11-6
An Example
§ Elasticity of demand for Kodak film is -2. § P = [EF/(1+ EF)] × MC § P = [-2/(1 - 2)] × MC § P = 2 × MC § Price is twice marginal cost. § Fifty percent of Kodak’s price is margin
above manufacturing costs.

11-7
Markup Rule for Cournot Oligopoly
§ Homogeneous product Cournot oligopoly. § N = total number of firms in the industry. § Market elasticity of demand EM . § Elasticity of individual firm’s demand is given
by EF = N x EM. § Since P = [EF/(1+ EF)] × MC, § Then, P = [NEM/(1+ NEM)] × MC. § The greater the number of firms, the lower
the profit-maximizing markup factor.
11-8
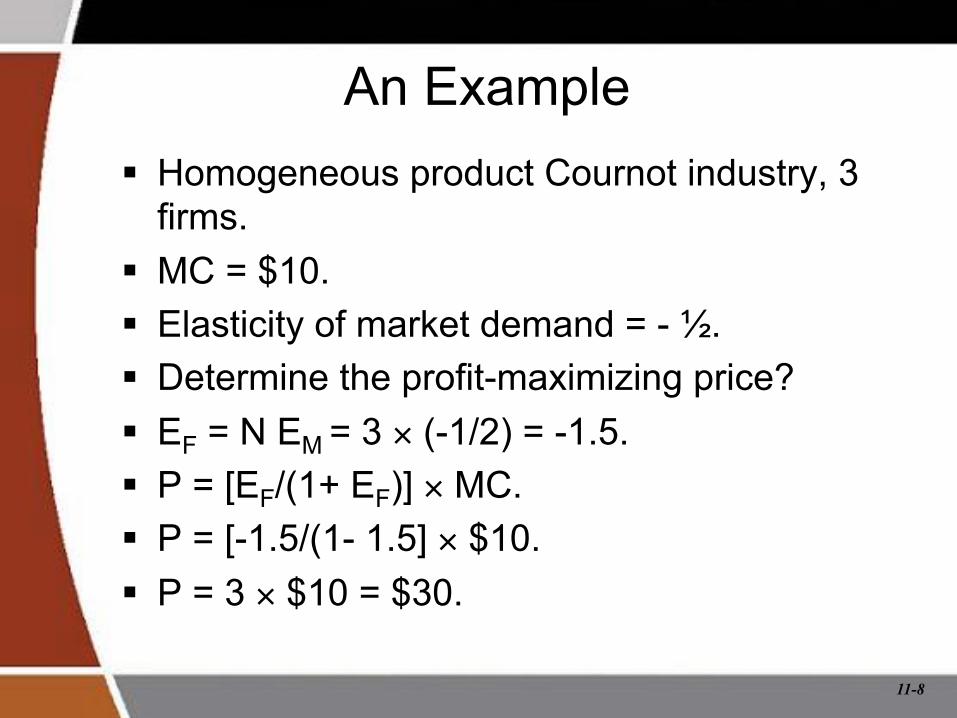
An Example § Homogeneous product Cournot industry, 3
firms. § MC = $10. § Elasticity of market demand = - ½. § Determine the profit-maximizing price? § EF = N EM = 3 × (-1/2) = -1.5. § P = [EF/(1+ EF)] × MC. § P = [-1.5/(1- 1.5] × $10. § P = 3 × $10 = $30.

11-9
Extracting Consumer Surplus: Moving From Single Price Markets
§ Most models examined to this point involve a “single” equilibrium price.
§ In reality, there are many different prices being charged in the market.
§ Price discrimination is the practice of charging different prices to consumer for the same good to achieve higher prices.
§ The three basic forms of price discrimination are: – First-degree (or perfect) price discrimination. – Second-degree price discrimination. – Third-degree price discrimiation.
11-10
First-Degree or Perfect Price Discrimination
§ Practice of charging each consumer the maximum amount he or she will pay for each incremental unit.
§ Permits a firm to extract all surplus from consumers.

11-11
Perfect Price Discrimination
Price
Quantity
D
10
8
6
4
2
1 2 3 4 5
Profits*: .5(4-0)(10 - 2)
= $16
Total Cost* = $8
MC
* Assuming no fixed costs
11-12
Caveats:
§ In practice, transactions costs and information constraints make this difficult to implement perfectly (but car dealers and some professionals come close).
§ Price discrimination won’t work if consumers can resell the good.

11-13
Second-Degree Price Discrimination
§ The practice of posting a discrete schedule of declining prices for different quantities.
§ Eliminates the information constraint present in first-degree price discrimination.
§ Example: Electric utilities
Price
MC
D
$5
$10
4 Quantity
$8
2

11-14
Third-Degree Price Discrimination
§ The practice of charging different groups of consumers different prices for the same product.
§ Group must have observable characteristics for third-degree price discrimination to work.
§ Examples include student discounts, senior citizen’s discounts, regional & international pricing.
11-15
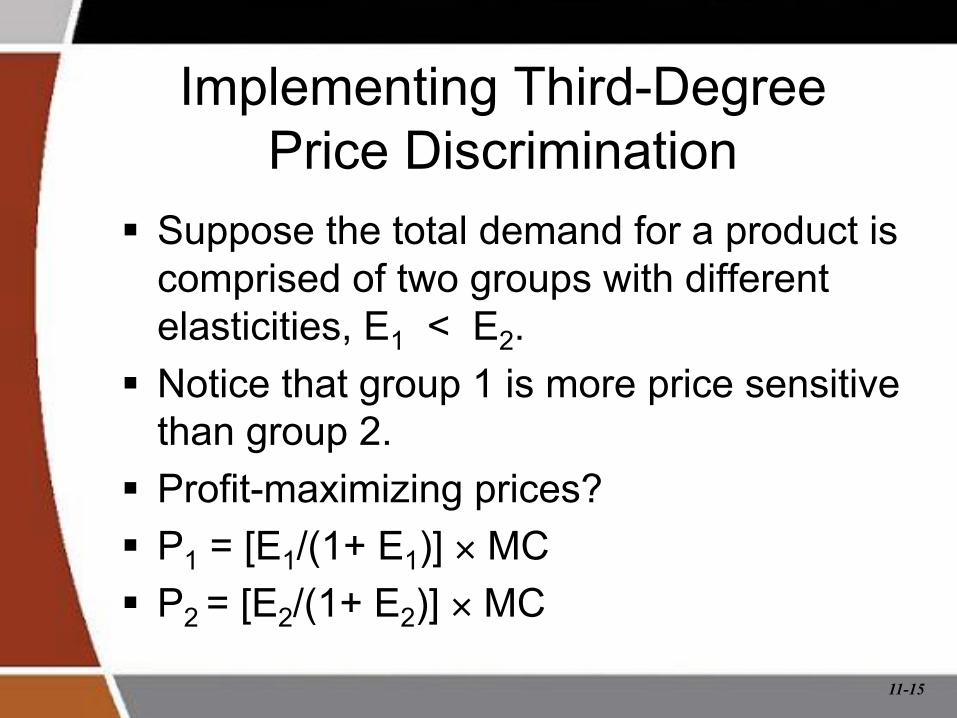
Implementing Third-Degree Price Discrimination
§ Suppose the total demand for a product is comprised of two groups with different elasticities, E1 < E2.
§ Notice that group 1 is more price sensitive than group 2.
§ Profit-maximizing prices? § P1 = [E1/(1+ E1)] × MC § P2 = [E2/(1+ E2)] × MC

11-16
An Example § Suppose the elasticity of demand for Kodak film
in the US is EU = -1.5, and the elasticity of demand in Japan is EJ = -2.5.
§ Marginal cost of manufacturing film is $3. § PU = [EU/(1+ EU)] × MC = [-1.5/(1 - 1.5)] × $3 =
$9 § PJ = [EJ/(1+ EJ)] × MC = [-2.5/(1 - 2.5)] × $3 =
$5 § Kodak’s optimal third-degree pricing strategy is
to charge a higher price in the US, where demand is less elastic.

11-17
Two-Part Pricing § When it isn’t feasible to charge different
prices for different units sold, but demand information is known, two-part pricing may permit you to extract all surplus from consumers.
§ Two-part pricing consists of a fixed fee and a per unit charge. – Example: Athletic club memberships.

11-18
How Two-Part Pricing Works 1. Set price at marginal cost. 2. Compute consumer
surplus. 3. Charge a fixed-fee equal to
consumer surplus.
Quantity
D
10
8
6
4
2
1 2 3 4 5
MC
Fixed Fee = Profits* = $16
Price
Per Unit Charge
* Assuming no fixed costs
11-19
Block Pricing
§ The practice of packaging multiple units of an identical product together and selling them as one package.
§ Examples – Paper. – Six-packs of soda. – Different sized of cans of green beans.
11-20
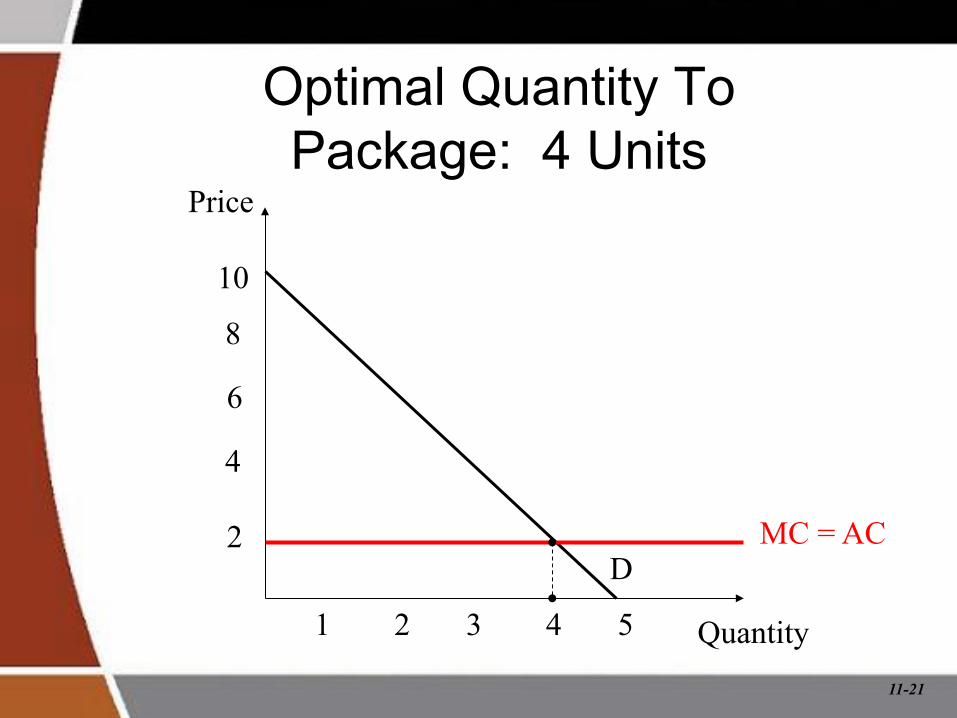
An Algebraic Example
§ Typical consumer’s demand is P = 10 - 2Q § C(Q) = 2Q § Optimal number of units in a package? § Optimal package price?
11-21
Optimal Quantity To Package: 4 Units
Price
Quantity
D
10
8
6
4
2
1 2 3 4 5
MC = AC
11-22
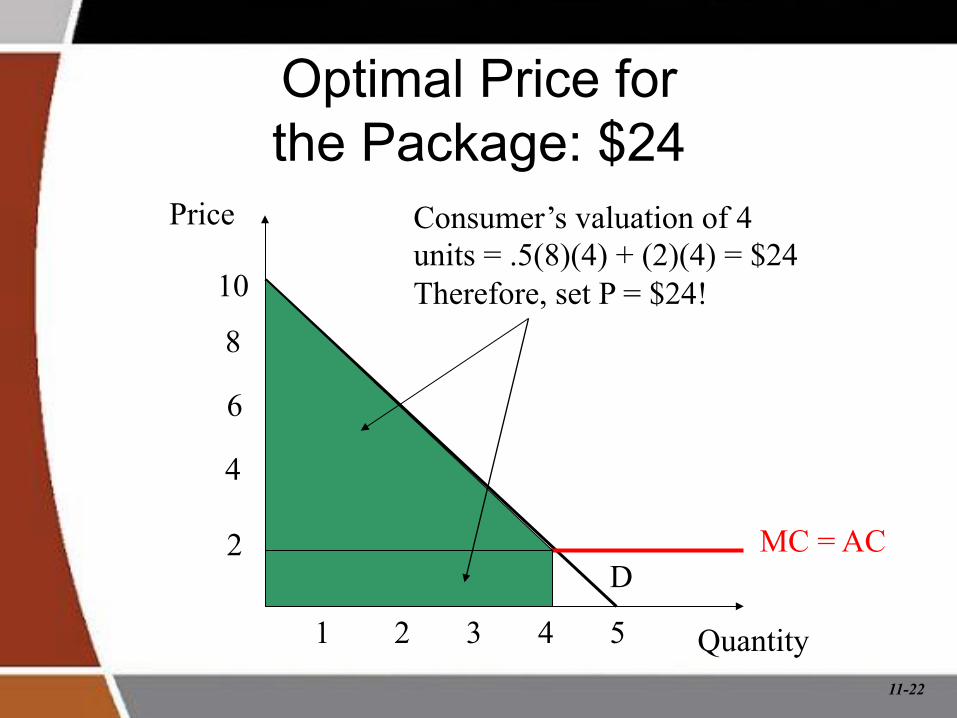
Optimal Price for the Package: $24
Price
Quantity
D
10
8
6
4
2
1 2 3 4 5
MC = AC
Consumer’s valuation of 4 units = .5(8)(4) + (2)(4) = $24 Therefore, set P = $24!

11-23
Costs and Profits with Block Pricing
Price
Quantity
D
10
8
6
4
2
1 2 3 4 5
MC = AC
Profits* = [.5(8)(4) + (2)(4)] – (2)(4) = $16
Costs = (2)(4) = $8
* Assuming no fixed costs

11-24
Commodity Bundling
§ The practice of bundling two or more products together and charging one price for the bundle.
§ Examples – Vacation packages. – Computers and software. – Film and developing.

11-25
An Example that Illustrates Kodak’s Moment
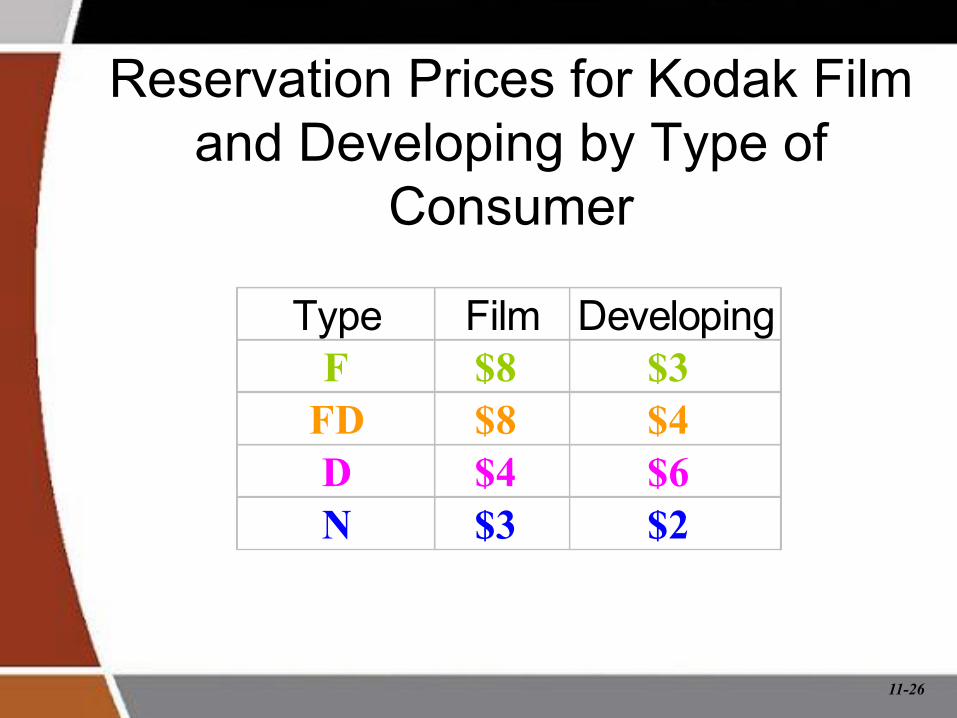
§ Total market size for film and developing is 4 million consumers.
§ Four types of consumers – 25% will use only Kodak film (F). – 25% will use only Kodak developing (D). – 25% will use only Kodak film and use only Kodak
developing (FD). – 25% have no preference (N).
§ Zero costs (for simplicity). § Maximum price each type of consumer will pay is
as follows:
11-26
Reservation Prices for Kodak Film and Developing by Type of
Consumer
Type Film DevelopingF $8 $3FD $8 $4D $4 $6N $3 $2
11-27
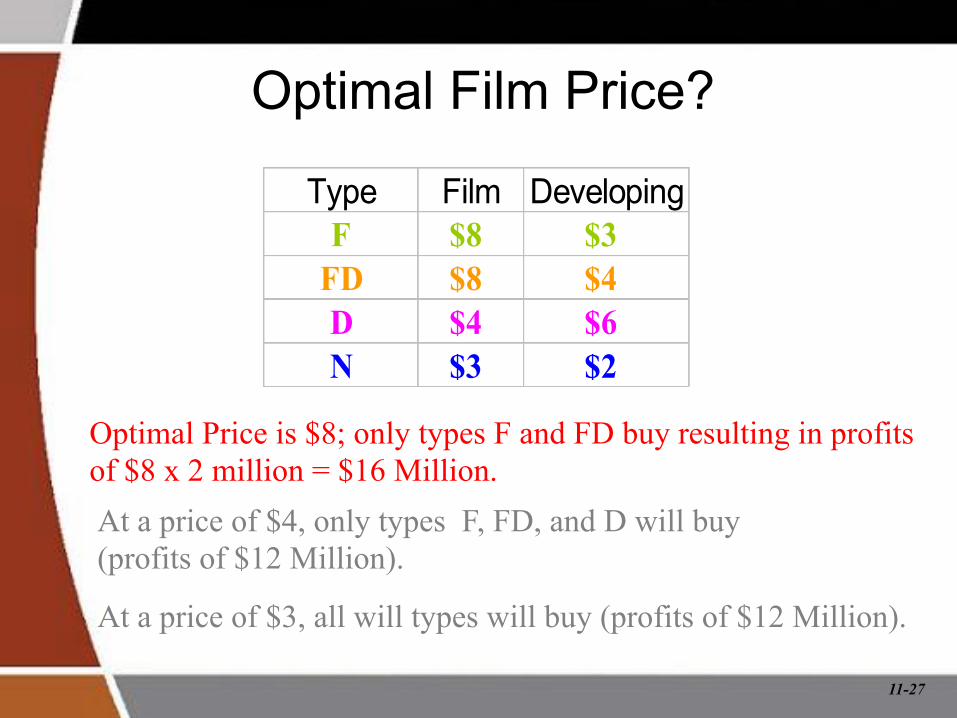
Optimal Film Price?
Type Film DevelopingF $8 $3FD $8 $4D $4 $6N $3 $2
Optimal Price is $8; only types F and FD buy resulting in profits of $8 x 2 million = $16 Million. At a price of $4, only types F, FD, and D will buy (profits of $12 Million).
At a price of $3, all will types will buy (profits of $12 Million).

11-28
Optimal Price for Developing?
Type Film DevelopingF $8 $3FD $8 $4D $4 $6N $3 $2
Optimal Price is $3, to earn profits of $3 x 3 million = $9 Million.
At a price of $6, only “D” type buys (profits of $6 Million). At a price of $4, only “D” and “FD” types buy (profits of $8 Million). At a price of $2, all types buy (profits of $8 Million).
11-29
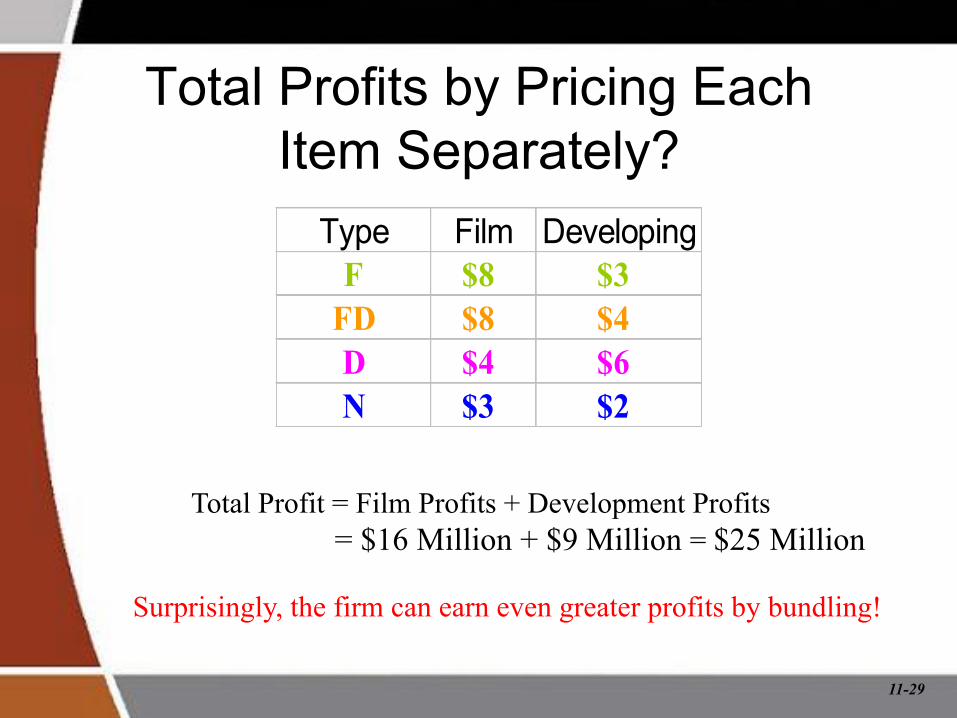
Total Profits by Pricing Each Item Separately? Type Film DevelopingF $8 $3FD $8 $4D $4 $6N $3 $2
Total Profit = Film Profits + Development Profits = $16 Million + $9 Million = $25 Million
Surprisingly, the firm can earn even greater profits by bundling!

11-30
Pricing a “Bundle” of Film and Developing

11-31
Consumer Valuations of a Bundle
Type Film Developing Value of BundleF $8 $3 $11
FD $8 $4 $12D $4 $6 $10N $3 $2 $5

11-32
What’s the Optimal Price for a Bundle?
Type Film Developing Value of BundleF $8 $3 $11
FD $8 $4 $12D $4 $6 $10N $3 $2 $5
Optimal Bundle Price = $10 (for profits of $30 million)
11-33
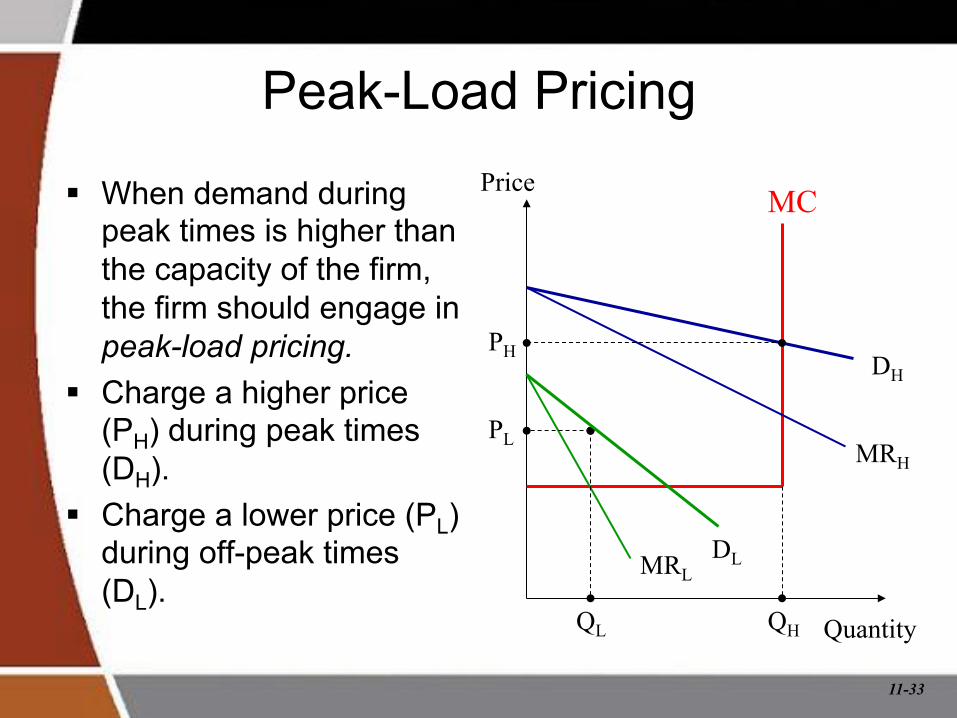
Peak-Load Pricing
§ When demand during peak times is higher than the capacity of the firm, the firm should engage in peak-load pricing.
§ Charge a higher price (PH) during peak times (DH).
§ Charge a lower price (PL) during off-peak times (DL).
Quantity
Price MC
MRL
PL
QL QH
DH
MRH
DL
PH
11-34
Cross-Subsidies § Prices charged for one product are
subsidized by the sale of another product. § May be profitable when there are significant
demand complementarities effects. § Examples
– Browser and server software. – Drinks and meals at restaurants.

11-35
Double Marginalization § Consider a large firm with two divisions:
– the upstream division is the sole provider of a key input. – the downstream division uses the input produced by the upstream
division to produce the final output. § Incentives to maximize divisional profits leads the
upstream manager to produce where MRU = MCU. – Implication: PU > MCU.
§ Similarly, when the downstream division has market power and has an incentive to maximize divisional profits, the manager will produce where MRD = MCD. – Implication: PD > MCD.
§ Thus, both divisions mark price up over marginal cost resulting in in a phenomenon called double marginalization. – Result: less than optimal overall profits for the firm.
11-36
Transfer Pricing
§ To overcome double marginalization, the internal price at which an upstream division sells inputs to a downstream division should be set in order to maximize the overall firm profits.
§ To achieve this goal, the upstream division produces such that its marginal cost, MCu, equals the net marginal revenue to the downstream division (NMRd):
NMRd = MRd - MCd = MCu

11-37
Upstream Division’s Problem
§ Demand for the final product P = 10 - 2Q. § C(Q) = 2Q. § Suppose the upstream manager sets MR
= MC to maximize profits. § 10 - 4Q = 2, so Q* = 2. § P* = 10 - 2(2) = $6, so upstream manager
charges the downstream division $6 per unit.

11-38
Downstream Division’s Problem
§ Demand for the final product P = 10 - 2Q. § Downstream division’s marginal cost is the $6
charged by the upstream division. § Downstream division sets MR = MC to
maximize profits. § 10 - 4Q = 6, so Q* = 1. § P* = 10 - 2(1) = $8, so downstream division
charges $8 per unit.
11-39
Analysis § This pricing strategy by the upstream division
results in less than optimal profits! § The upstream division needs the price to be $6 and
the quantity sold to be 2 units in order to maximize profits. Unfortunately,
§ The downstream division sets price at $8, which is too high; only 1 unit is sold at that price. – Downstream division profits are $8 × 1 – 6(1) = $2.
§ The upstream division’s profits are $6 × 1 - 2(1) = $4 instead of the monopoly profits of $6 × 2 - 2(2) = $8.
§ Overall firm profit is $4 + $2 = $6.
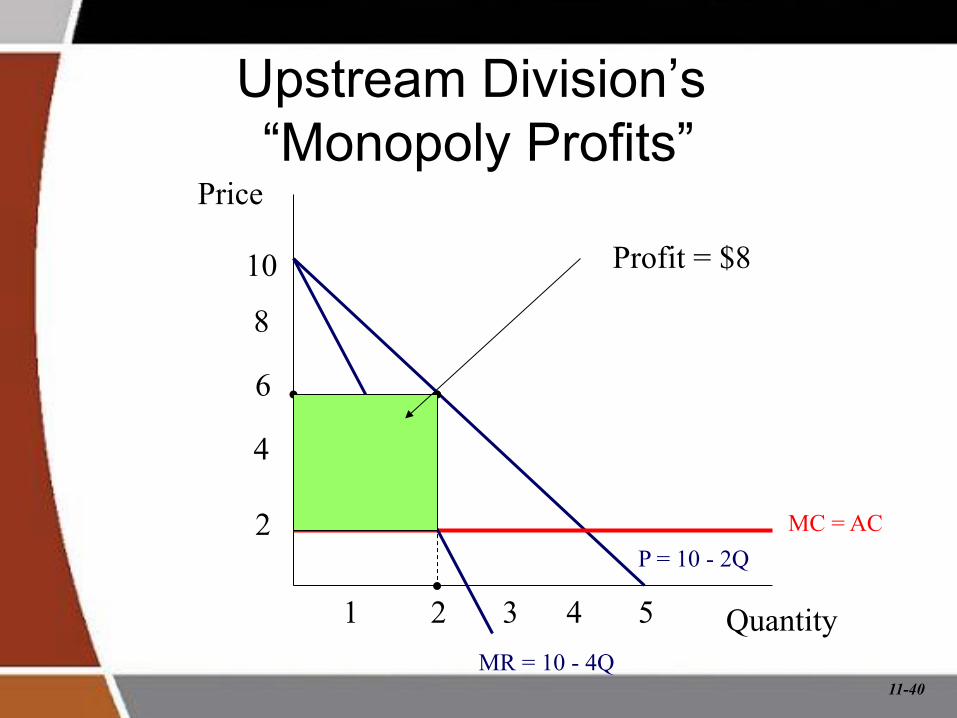
11-40
Upstream Division’s “Monopoly Profits”
Price
Quantity
P = 10 - 2Q
10
8
6
4
2
1 2 3 4 5
MC = AC
MR = 10 - 4Q
Profit = $8

11-41
Upstream Firm’s Profits when Downstream Marks Price Up to $8
Price
Quantity
P = 10 - 2Q
10
8
6
4
2
1 2 3 4 5
MC = AC
MR = 10 - 4Q
Profit = $4 Downstream Price
11-42
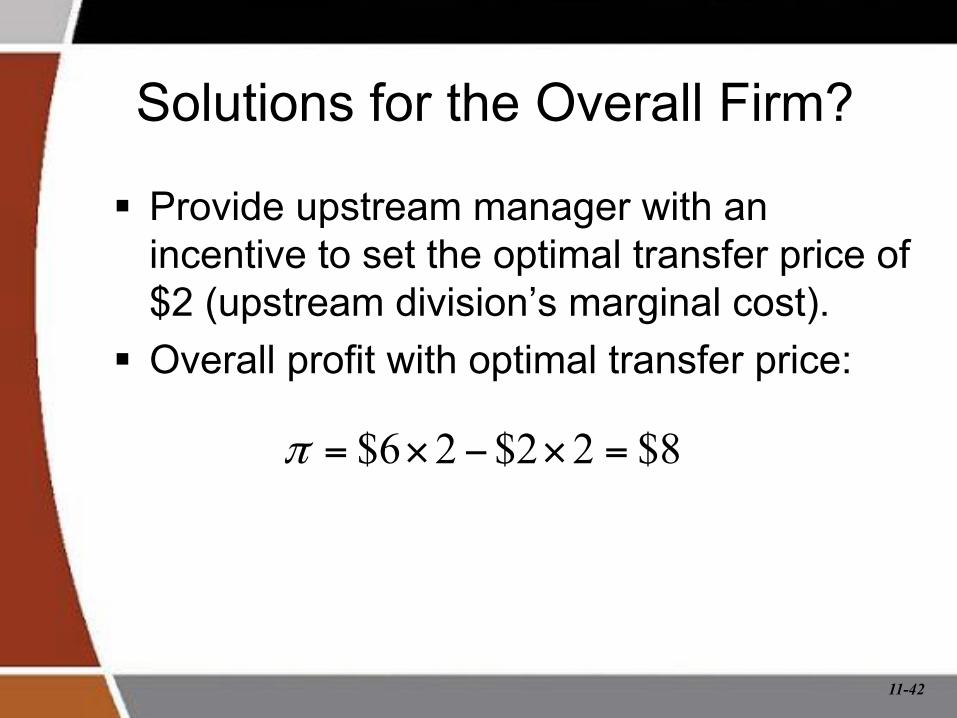
Solutions for the Overall Firm?
§ Provide upstream manager with an incentive to set the optimal transfer price of $2 (upstream division’s marginal cost).
§ Overall profit with optimal transfer price:
8$22$26$ =×−×=π

11-43
Pricing in Markets with Intense Price Competition
§ Price Matching – Advertising a price and a promise to match any lower price
offered by a competitor. – No firm has an incentive to lower their prices. – Each firm charges the monopoly price and shares the market.
§ Induce brand loyalty – Some consumers will remain “loyal” to a firm; even in the face of
price cuts. – Advertising campaigns and “frequent-user” style programs can
help firms induce loyal among consumers. § Randomized Pricing
– A strategy of constantly changing prices. – Decreases consumers’ incentive to shop around as they cannot
learn from experience which firm charges the lowest price. – Reduces the ability of rival firms to undercut a firm’s prices.

11-44
Conclusion § First degree price discrimination, block pricing, and
two part pricing permit a firm to extract all consumer surplus.
§ Commodity bundling, second-degree and third degree price discrimination permit a firm to extract some (but not all) consumer surplus.
§ Simple markup rules are the easiest to implement, but leave consumers with the most surplus and may result in double-marginalization.
§ Different strategies require different information.