basildon and thurrock nhs foundation trust data …...basildon and thurrock nhs foundation trust...
TRANSCRIPT
Basildon and Thurrock NHS Foundation Trust Data Pack 9th July, 2013
Overview
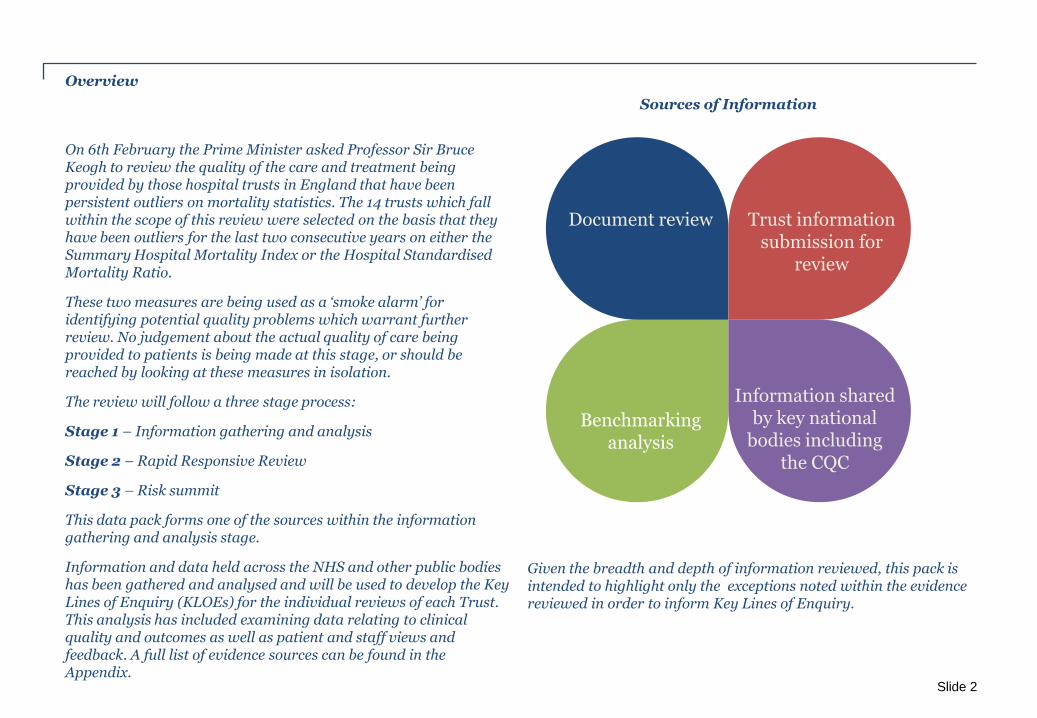
On 6th February the Prime Minister asked Professor Sir Bruce Keogh to review the quality of the care and treatment being provided by those hospital trusts in England that have been persistent outliers on mortality statistics. The 14 trusts which fall within the scope of this review were selected on the basis that they have been outliers for the last two consecutive years on either the Summary Hospital Mortality Index or the Hospital Standardised Mortality Ratio.
These two measures are being used as a ‘smoke alarm’ for identifying potential quality problems which warrant further review. No judgement about the actual quality of care being provided to patients is being made at this stage, or should be reached by looking at these measures in isolation.
The review will follow a three stage process:
Stage 1 – Information gathering and analysis
Stage 2 – Rapid Responsive Review
Stage 3 – Risk summit
This data pack forms one of the sources within the information gathering and analysis stage.
Information and data held across the NHS and other public bodies has been gathered and analysed and will be used to develop the Key Lines of Enquiry (KLOEs) for the individual reviews of each Trust. This analysis has included examining data relating to clinical quality and outcomes as well as patient and staff views and feedback. A full list of evidence sources can be found in the Appendix.
Given the breadth and depth of information reviewed, this pack is intended to highlight only the exceptions noted within the evidence reviewed in order to inform Key Lines of Enquiry.
Slide 2
Document review Trust information submission for
review
Benchmarking analysis
Information shared by key national
bodies including the CQC
Sources of Information
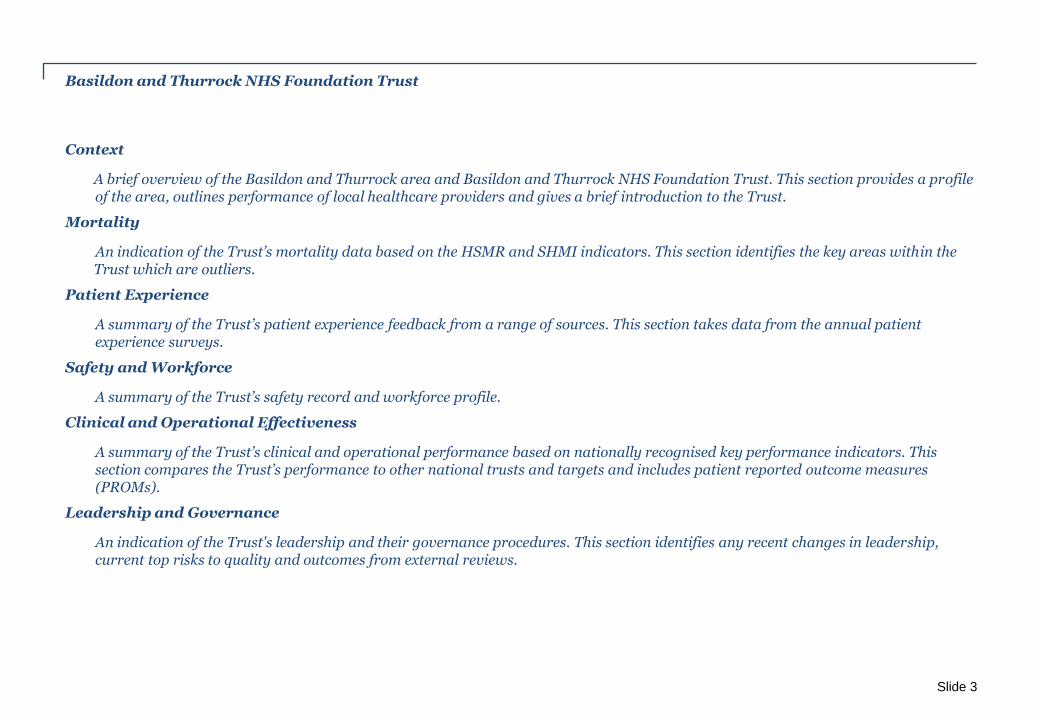
Basildon and Thurrock NHS Foundation Trust
Context
A brief overview of the Basildon and Thurrock area and Basildon and Thurrock NHS Foundation Trust. This section provides a profile of the area, outlines performance of local healthcare providers and gives a brief introduction to the Trust.
Mortality
An indication of the Trust’s mortality data based on the HSMR and SHMI indicators. This section identifies the key areas within the Trust which are outliers.
Patient Experience
A summary of the Trust’s patient experience feedback from a range of sources. This section takes data from the annual patient experience surveys.
Safety and Workforce
A summary of the Trust’s safety record and workforce profile.
Clinical and Operational Effectiveness
A summary of the Trust’s clinical and operational performance based on nationally recognised key performance indicators. This section compares the Trust’s performance to other national trusts and targets and includes patient reported outcome measures (PROMs).
Leadership and Governance
An indication of the Trust's leadership and their governance procedures. This section identifies any recent changes in leadership, current top risks to quality and outcomes from external reviews.
Slide 3

Context
Slide 4
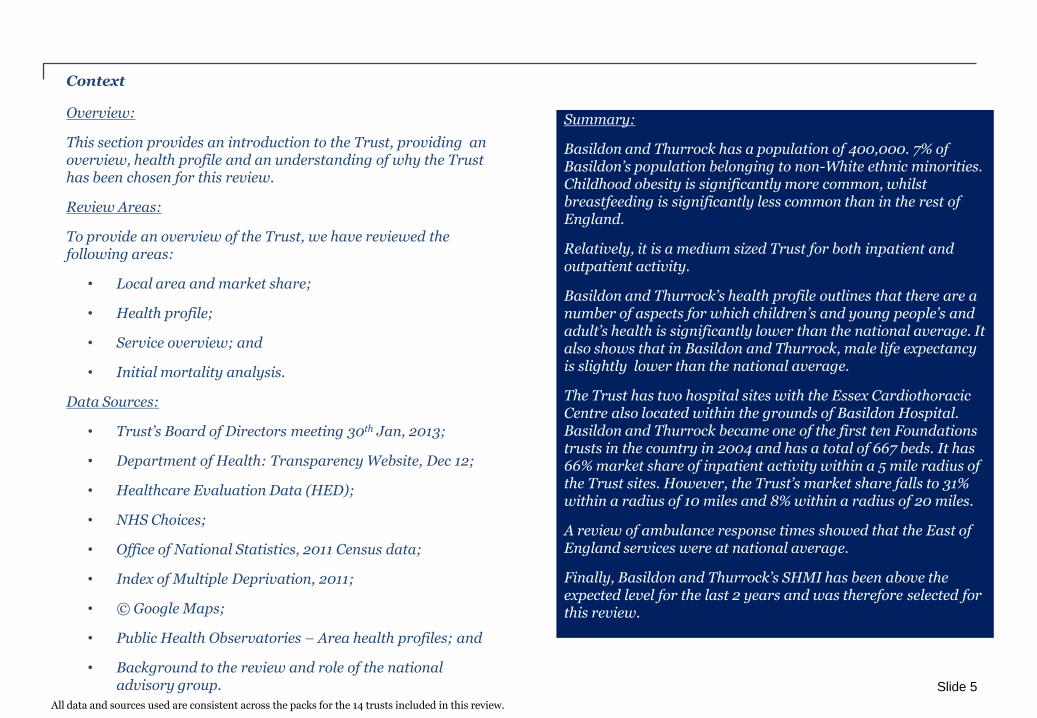
Context
Overview:
This section provides an introduction to the Trust, providing an overview, health profile and an understanding of why the Trust has been chosen for this review.
Review Areas:
To provide an overview of the Trust, we have reviewed the following areas:
• Local area and market share;
• Health profile;
• Service overview; and
• Initial mortality analysis.
Data Sources:
• Trust’s Board of Directors meeting 30th Jan, 2013;
• Department of Health: Transparency Website, Dec 12;
• Healthcare Evaluation Data (HED);
• NHS Choices;
• Office of National Statistics, 2011 Census data;
• Index of Multiple Deprivation, 2011;
• © Google Maps;
• Public Health Observatories – Area health profiles; and
• Background to the review and role of the national advisory group.
Summary:
Basildon and Thurrock has a population of 400,000. 7% of Basildon’s population belonging to non-White ethnic minorities. Childhood obesity is significantly more common, whilst breastfeeding is significantly less common than in the rest of England.
Relatively, it is a medium sized Trust for both inpatient and outpatient activity.
Basildon and Thurrock’s health profile outlines that there are a number of aspects for which children’s and young people’s and adult’s health is significantly lower than the national average. It also shows that in Basildon and Thurrock, male life expectancy is slightly lower than the national average.
The Trust has two hospital sites with the Essex Cardiothoracic Centre also located within the grounds of Basildon Hospital. Basildon and Thurrock became one of the first ten Foundations trusts in the country in 2004 and has a total of 667 beds. It has 66% market share of inpatient activity within a 5 mile radius of the Trust sites. However, the Trust’s market share falls to 31% within a radius of 10 miles and 8% within a radius of 20 miles.
A review of ambulance response times showed that the East of England services were at national average.
Finally, Basildon and Thurrock’s SHMI has been above the expected level for the last 2 years and was therefore selected for this review.
Slide 5
All data and sources used are consistent across the packs for the 14 trusts included in this review.

Number of Beds and Bed Occupancy (Oct12-Dec12)
Beds
Available
Percentage
Occupied
National
Average
Total 667 90% 86%
General and
Acute
614 93.3% 88%
Maternity 53 51.3% 59%
Trust Status Foundation Trust (2004)
Inpatient/Outpatient Activity (Jan12-Dec12)
Inpatient Activity Elective 57,595 (57%)
Day Case Rate:
87%
Non Elective 44,124 (43%)
Total 101,719
Outpatient Activity Total 331,709
Basildon and Thurrock became one of the first ten Foundations trusts in the country in 2004. Prior to this, in 2002, the Trust had gained University Hospital status. The Trust services a population of approximately 400,000 and has more than 10,000 public members as well as 3,700 staff. The Trust includes the Essex Cardiothoracic Centre, opened in 2007 and one of the most modern centres of its kind in the country. Heart attack victims from across the county are brought directly to the Essex Cardiothoracic Centre to have stents fitted to repair constricted coronary arteries, within just over two hours of the ambulance arriving at the scene. It also has 24 haemodialysis stations; this is the largest renal unit in Essex. The unit currently has over 150 patients receiving haemodialysis daily, six days a week.
Trust Overview
Departments and Services
Accident & Emergency, Breast Surgery, Cardiology, Children’s and
Adolescent Services, Dermatology, Diabetic Medicine, Diagnostic
Imaging, Diagnostic Physiological Measurement, ENT, Endocrinology
and Metabolic Medicine, Gastro Intestinal and Liver Services,
General Medicine, General Surgery, Geriatric Medicine, Gynaecology
, Haematology, Maternity Service, Minor Injuries Unit, Nephrology,
Neurology, Oral and Maxillofacial Surgery, Orthopaedics, Pain
Management, Respiratory Medicine, Rheumatology, Sleep Medicine,
Urology, Vascular Surgery.
Basildon and Thurrock University Hospitals NHS Foundation Trust
Acute Hospital Basildon University Hospital
Outpatient Hospitals Orsett Hospital
Diagnostic Services Unit St. Andrew’s Centre
Other Specialist Units Essex Cardiothoracic Centre
Slide 6
Source: Department of Health: Transparency Website
Source: Healthcare Evaluation Data (HED)
Source: NHS Choices
Finance Information
2012-13 Income £254m
2012-13 Expenditure £237m
2012-13 EBITDA £17m
2012-13 Net surplus (deficit) £124k
2013-14 Budgeted Income £278m
2013-14 Budgeted Expenditure £262m
2013-14 Budgeted EBITDA £16m
2013-14 Budgeted Net surplus (deficit) £100k
Source: NHS Choices
Source: Basildon and Thurrock University Hospitals NHS Foundation Trust, Board of Directors’ Meeting, 27 March 2013, ‘Proposed Budget and Financial Plan 2013/14 - Report of the Acting Director of Finance’ Maps of Basildon and Thurrock University Hospitals are included in the Appendix.

0
200
400
600
800
1000
1200
Num
ber
of
Outp
atient
Spells
(T
housands)
Trusts
Outpatient Activity by Trust
Trusts Covered by Review National Outpatient Activity Curve
Trust Overview continued...
0
50
100
150
200
250
300
Num
ber
of
Inpatient
Spells
(T
housands)
Trusts
Inpatient Activity by Trust
Trusts Covered by Review National Inpatient Activity Curve
Basildon and Thurrock 101,474 Basildon and Thurrock
331,709
Top 10 Inpatient Main Specialties as a
% of Total Inpatient Activity
Nephrology 24%
Gynaecology 13%
General Surgery 9%
General Medicine 8%
Paediatrics 7%
Cardiology 6%
Gastroenterology 5%
Trauma & Orthopaedics 5%
Urology 4%
Geriatric Medicine 4%
Bottom 10 Inpatient Main Specialties
and Spells
Accident & Emergency 6
Palliative Medicine 7
Radiology 233
Nursing episode 515
Oral Surgery 798
Respiratory Medicine 1024
Clinical Haematology 1293
Anaesthetics 1441
Ear, Nose and Throat 1495
Cardiothoracic Surgery 1629
Top 10 Outpatient Main Specialties as
a % of Total Outpatient Activity
Trauma & Orthopaedics 14%
Dermatology 13%
Gynaecology 9%
Haematology 7%
General Surgery 6%
General Medicine 6%
Cardiology 5%
Paediatrics 5%
Ear, Nose and Throat 4%
Midwifery 4%
The graphs show the relative size of Basildon and Thurrock against national trusts in terms of inpatient and outpatient activity.
Basildon and Thurrock is a medium sized trust for inpatient activity, relative to both the 14 trusts selected for this review and the rest of England. However, the Trust is in the lower half of all those nationally for outpatient activity.
Nephrology and Gynaecology are the largest inpatient specialties while Trauma & Orthopaedics and Dermatology are the largest for outpatients.
Slide 7 Source: Healthcare Evaluation Data (HED); Jan 12-Dec 12
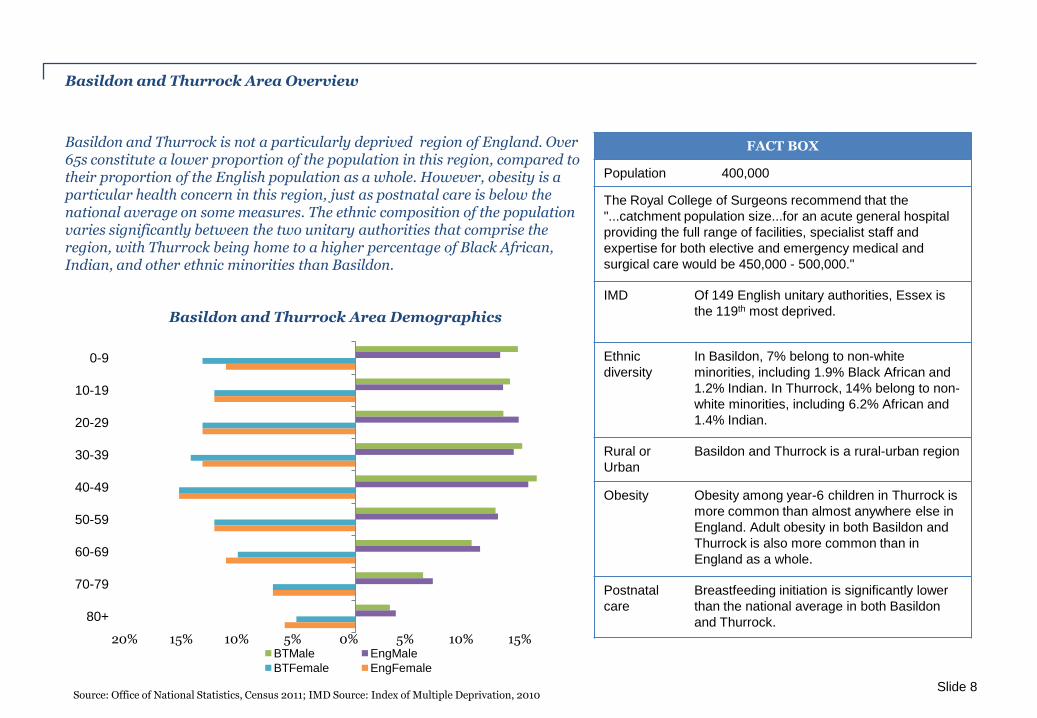
Basildon and Thurrock is not a particularly deprived region of England. Over 65s constitute a lower proportion of the population in this region, compared to their proportion of the English population as a whole. However, obesity is a particular health concern in this region, just as postnatal care is below the national average on some measures. The ethnic composition of the population varies significantly between the two unitary authorities that comprise the region, with Thurrock being home to a higher percentage of Black African, Indian, and other ethnic minorities than Basildon.
Basildon and Thurrock Area Overview
0-9
10-19
20-29
30-39
40-49
50-59
60-69
70-79
80+
Basildon and Thurrock Area Demographics
BTMale EngMale
BTFemale EngFemale
20% 15% 10% 5% 0% 5% 10% 15% 20%
FACT BOX
Population 400,000
The Royal College of Surgeons recommend that the
"...catchment population size...for an acute general hospital
providing the full range of facilities, specialist staff and
expertise for both elective and emergency medical and
surgical care would be 450,000 - 500,000."
IMD Of 149 English unitary authorities, Essex is
the 119th most deprived.
Ethnic
diversity
In Basildon, 7% belong to non-white
minorities, including 1.9% Black African and
1.2% Indian. In Thurrock, 14% belong to non-
white minorities, including 6.2% African and
1.4% Indian.
Rural or
Urban
Basildon and Thurrock is a rural-urban region
Obesity Obesity among year-6 children in Thurrock is
more common than almost anywhere else in
England. Adult obesity in both Basildon and
Thurrock is also more common than in
England as a whole.
Postnatal
care
Breastfeeding initiation is significantly lower
than the national average in both Basildon
and Thurrock.
Slide 8 Source: Office of National Statistics, Census 2011; IMD Source: Index of Multiple Deprivation, 2010
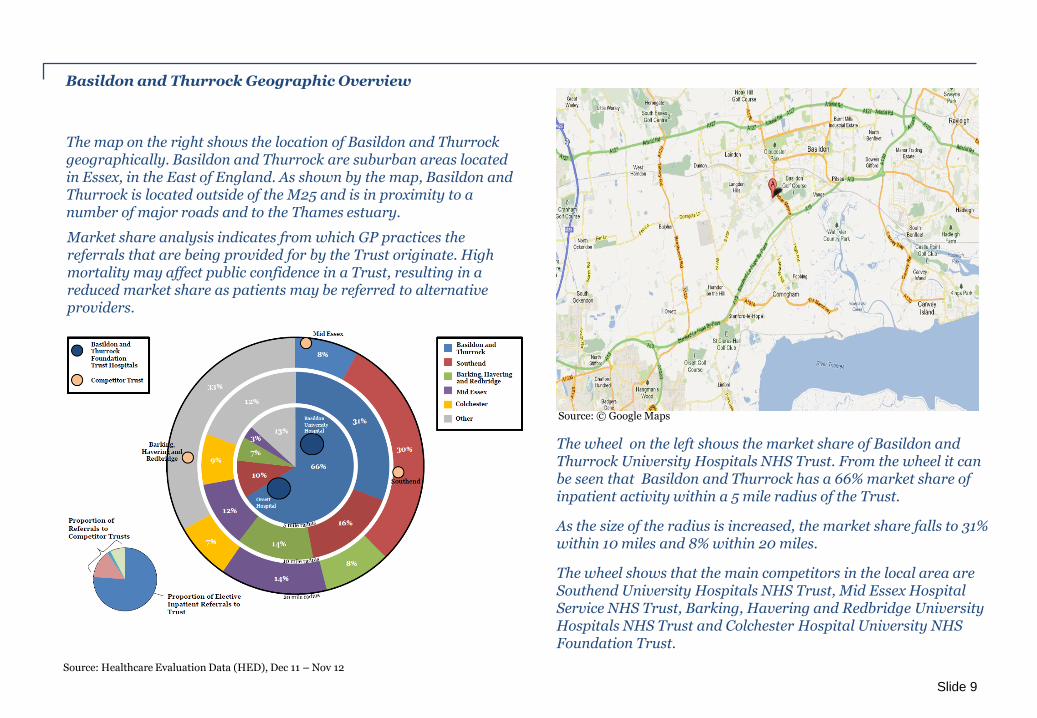
Basildon and Thurrock Geographic Overview
The wheel on the left shows the market share of Basildon and Thurrock University Hospitals NHS Trust. From the wheel it can be seen that Basildon and Thurrock has a 66% market share of inpatient activity within a 5 mile radius of the Trust.
As the size of the radius is increased, the market share falls to 31% within 10 miles and 8% within 20 miles.
The wheel shows that the main competitors in the local area are Southend University Hospitals NHS Trust, Mid Essex Hospital Service NHS Trust, Barking, Havering and Redbridge University Hospitals NHS Trust and Colchester Hospital University NHS Foundation Trust.
The map on the right shows the location of Basildon and Thurrock geographically. Basildon and Thurrock are suburban areas located in Essex, in the East of England. As shown by the map, Basildon and Thurrock is located outside of the M25 and is in proximity to a number of major roads and to the Thames estuary.
Slide 9
Source: Healthcare Evaluation Data (HED), Dec 11 – Nov 12
Source: © Google Maps
Market share analysis indicates from which GP practices the referrals that are being provided for by the Trust originate. High mortality may affect public confidence in a Trust, resulting in a reduced market share as patients may be referred to alternative providers.
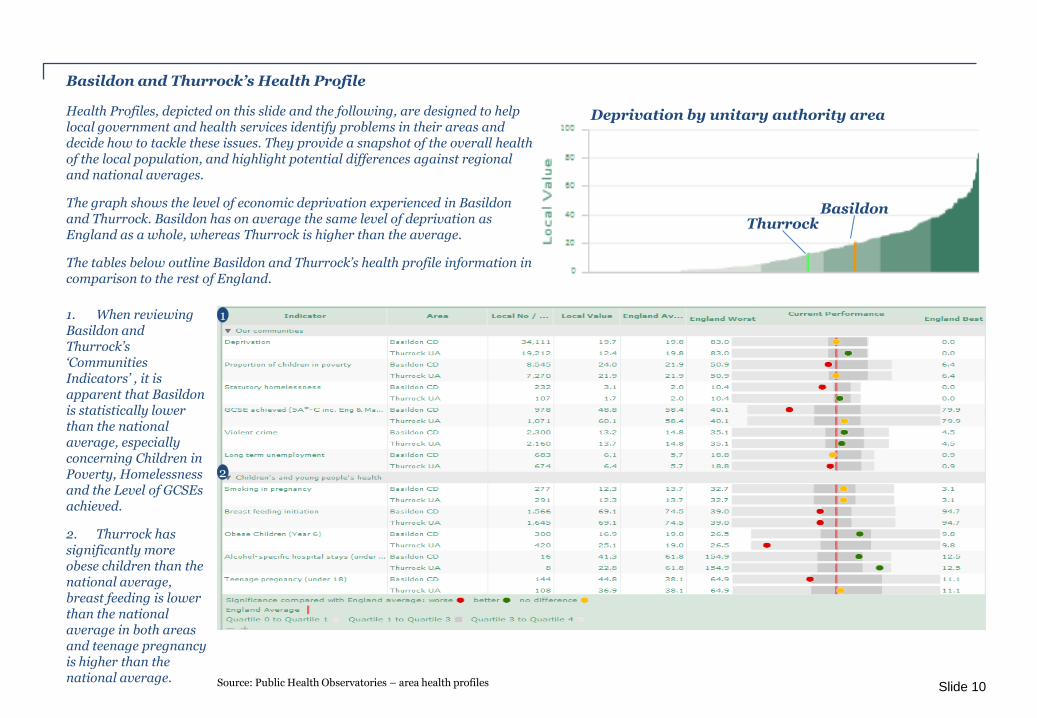
Basildon and Thurrock’s Health Profile
Health Profiles, depicted on this slide and the following, are designed to help local government and health services identify problems in their areas and decide how to tackle these issues. They provide a snapshot of the overall health of the local population, and highlight potential differences against regional and national averages.
The graph shows the level of economic deprivation experienced in Basildon and Thurrock. Basildon has on average the same level of deprivation as England as a whole, whereas Thurrock is higher than the average.
The tables below outline Basildon and Thurrock’s health profile information in comparison to the rest of England.
1. When reviewing Basildon and Thurrock’s ‘Communities Indicators’ , it is apparent that Basildon is statistically lower than the national average, especially concerning Children in Poverty, Homelessness and the Level of GCSEs achieved.
2. Thurrock has significantly more obese children than the national average, breast feeding is lower than the national average in both areas and teenage pregnancy is higher than the national average.
1
2
Basildon Thurrock
Slide 10 Source: Public Health Observatories – area health profiles
Deprivation by unitary authority area
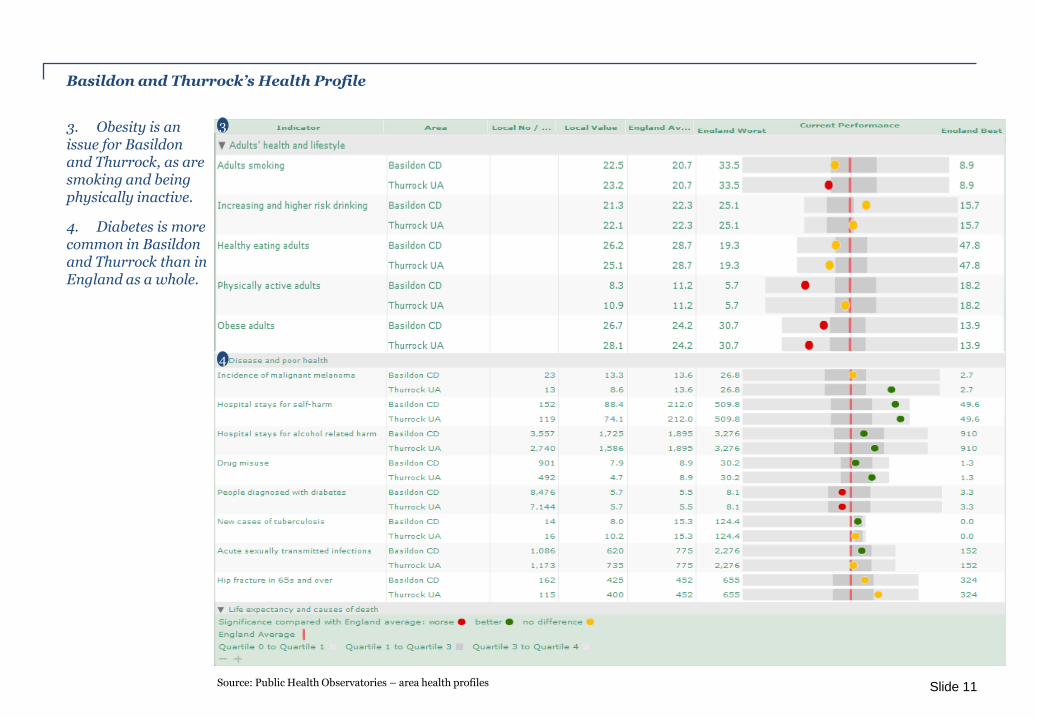
Basildon and Thurrock’s Health Profile
3. Obesity is an issue for Basildon and Thurrock, as are smoking and being physically inactive.
4. Diabetes is more common in Basildon and Thurrock than in England as a whole.
4
3
Slide 11 Source: Public Health Observatories – area health profiles
Basildon and Thurrock’s Health Profile
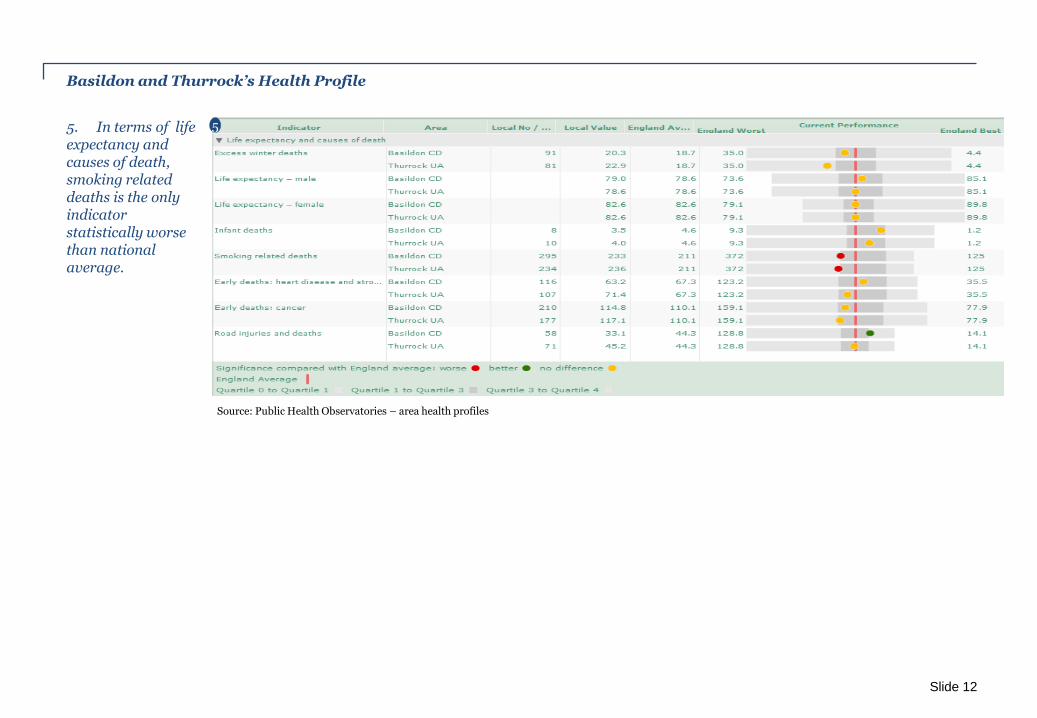
5. In terms of life expectancy and causes of death, smoking related deaths is the only indicator statistically worse than national average.
5
Slide 12
Source: Public Health Observatories – area health profiles
Performance of Local Healthcare Providers
0% 10% 20% 30% 40% 50% 60% 70% 80% 90%
100%
Isle of Wight NHS Trust
South Western
Ambulance Service NHS Foundation
Trust
West Midlands
Ambulance Service NHS
Trust
South Central Ambulance Service NHS Foundation
Trust
South East Coast
Ambulance Service NHS Foundation
Trust
East of England
Ambulance Service NHS
Trust
London Ambulance Service NHS
Trust
North West Ambulance Service NHS
Trust
Great Western
Ambulance Service NHS
Trust
North East Ambulance Service NHS
Trust
Yorkshire Ambulance Service NHS
Trust
East Midlands Ambulance Service NHS
Trust
Proportion of calls responded to within 8 minutes
Ambulance Trust England
84%
86%
88%
90%
92%
94%
96%
98%
100%
Isle of Wight NHS Trust
West Midlands
Ambulance Service NHS
Trust
London Ambulance Service NHS
Trust
South East Coast
Ambulance Service NHS Foundation
Trust
Yorkshire Ambulance Service NHS
Trust
South Western
Ambulance Service NHS Foundation
Trust
Great Western
Ambulance Service NHS
Trust
North East Ambulance Service NHS
Trust
North West Ambulance Service NHS
Trust
South Central Ambulance Service NHS Foundation
Trust
East of England
Ambulance Service NHS
Trust
East Midlands Ambulance Service NHS
Trust
Proportion of calls responded to within 19 minutes
Ambulance Trusts England Slide 13
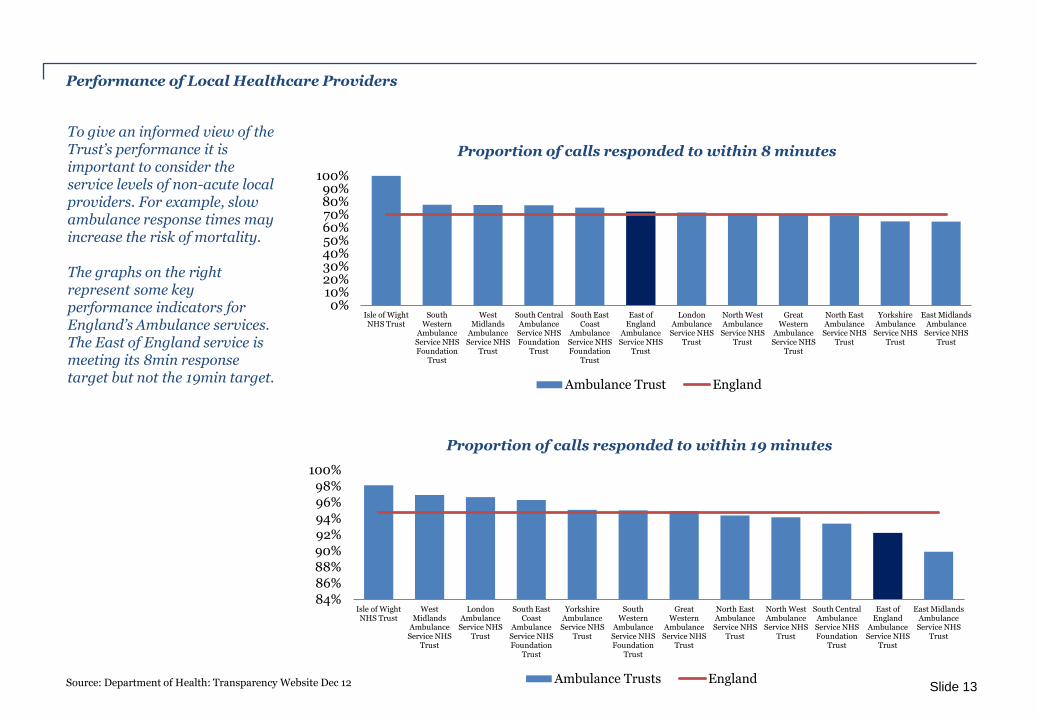
To give an informed view of the Trust’s performance it is important to consider the service levels of non-acute local providers. For example, slow ambulance response times may increase the risk of mortality. The graphs on the right represent some key performance indicators for England’s Ambulance services. The East of England service is meeting its 8min response target but not the 19min target.
Source: Department of Health: Transparency Website Dec 12

Why was Basildon and Thurrock chosen for this review?
Banding 1 – ‘higher than expected’
Trust SHMI 2011 SHMI 2012 HSMR
FY 11
HSMR
FY 12
Within
Expected?
Basildon and Thurrock University Hospitals NHS
Foundation Trust 1 1 98 102 Within expected
Blackpool Teaching Hospitals NHS Foundation Trust 1 1 112 114 Above expected
Buckinghamshire Healthcare NHS Trust 112 110 Above expected
Burton Hospitals NHS Foundation Trust 112 112 Above expected
Colchester Hospital University NHS Foundation Trust 1 1 107 102 Within expected
East Lancashire Hospitals NHS Trust 1 1 108 103 Within expected
George Eliot Hospital NHS Trust 117 120 Above expected
Medway NHS Foundation Trust 115 112 Above expected
North Cumbria University Hospitals NHS Trust 118 118 Above expected
Northern Lincolnshire And Goole Hospitals NHS
Foundation Trust 116 118 Above expected
Sherwood Forest Hospitals NHS Foundation Trust 114 113 Above expected
Tameside Hospital NHS Foundation Trust 1 1 101 102 Within expected
The Dudley Group Of Hospitals NHS Foundation Trust 116 111 Above expected
United Lincolnshire Hospitals NHS Trust 113 111 Above expected
Based on the Summary Hospital level Mortality Indicator (SHMI) and Hospital Standardised Mortality Ratio (HSMR), 14 trusts were selected for this review. The table includes information on which trusts were selected. An explanation of each of these indicators is provided in the Mortality section. Where it does not include the SHMI for a trust, it is because the trust was selected due to a high HSMR as opposed to its SHMI. The SHMI for all 14 trusts can be found in the following pages. Initially, five hospital trusts were announced as falling within the scope of this investigation based on the fact that they had been outliers on SHMI for the last two years (SHMI data has only been published for the last two years). Subsequent to these five hospital trusts being announced, Professor Sir Bruce Keogh took the decision that those hospital trusts that had also been outliers for the last two consecutive years on HSMR should also fall within the scope of his review. The rationale for this was that it had been HSMR that had provided the trigger for the Healthcare Commission’s initial investigation into the quality of care provided at Mid Staffordshire Hospitals NHS Foundation Trust. Basildon and Thurrock has been above the expected level for both SHMI and HSMR over the last 2 years and was therefore selected for this review.
Source: Background to the review and role of the national advisory group Financial years 2010-11, 2011-12
Slide 14
Why was Basildon and Thurrock chosen for this review?
HSMR Time Series HSMR Funnel Chart
SHMI Funnel Chart SHMI Time Series
Basildon and Thurrock
Selected trusts Outside Range Selected trusts w/in Range
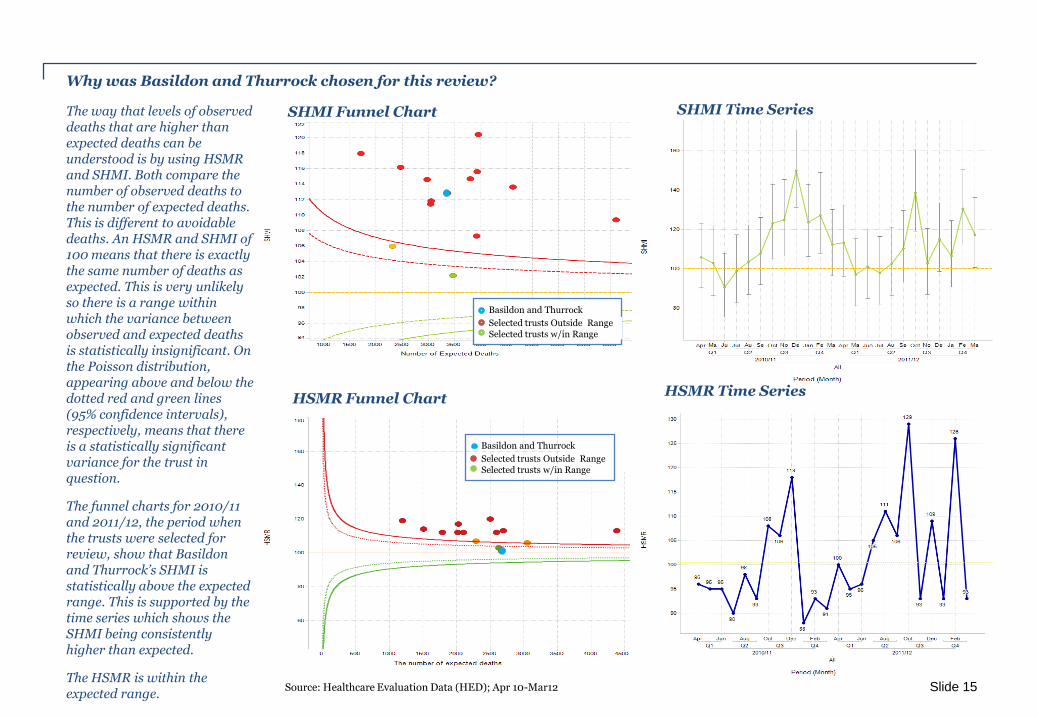
The way that levels of observed deaths that are higher than expected deaths can be understood is by using HSMR and SHMI. Both compare the number of observed deaths to the number of expected deaths. This is different to avoidable deaths. An HSMR and SHMI of 100 means that there is exactly the same number of deaths as expected. This is very unlikely so there is a range within which the variance between observed and expected deaths is statistically insignificant. On the Poisson distribution, appearing above and below the dotted red and green lines (95% confidence intervals), respectively, means that there is a statistically significant variance for the trust in question.
The funnel charts for 2010/11 and 2011/12, the period when the trusts were selected for review, show that Basildon and Thurrock’s SHMI is statistically above the expected range. This is supported by the time series which shows the SHMI being consistently higher than expected.
The HSMR is within the expected range.
Basildon and Thurrock
Selected trusts Outside Range Selected trusts w/in Range
Slide 15 Source: Healthcare Evaluation Data (HED); Apr 10-Mar12
Mortality
Slide 16
Mortality
Overview:
This section focuses upon recent mortality data to provide an indication of the current position. All 14 trusts in the review have been analysed using consistent methodology.
The measures identified are being used as a ‘smoke alarm’ for highlighting potential quality issues. No judgement about the actual quality of care being provided to patients is being made at this stage, nor should it be reached by looking at these measures in isolation.
Review areas
To undertake a detailed analysis of the trust’s mortality, it is necessary to look at the following areas:
• Differences between the HSMR and SHMI;
• Elective and non-elective mortality;
• Specialty and Diagnostic groups; and
• Alerts and investigations.
Data sources
• Healthcare Evaluation Data (HED);
• Health & Social Care Information Centre – SHMI and contextual indicators;
• Dr Foster – HSMR; and
• Care Quality Commission – alerts, correspondence and findings.
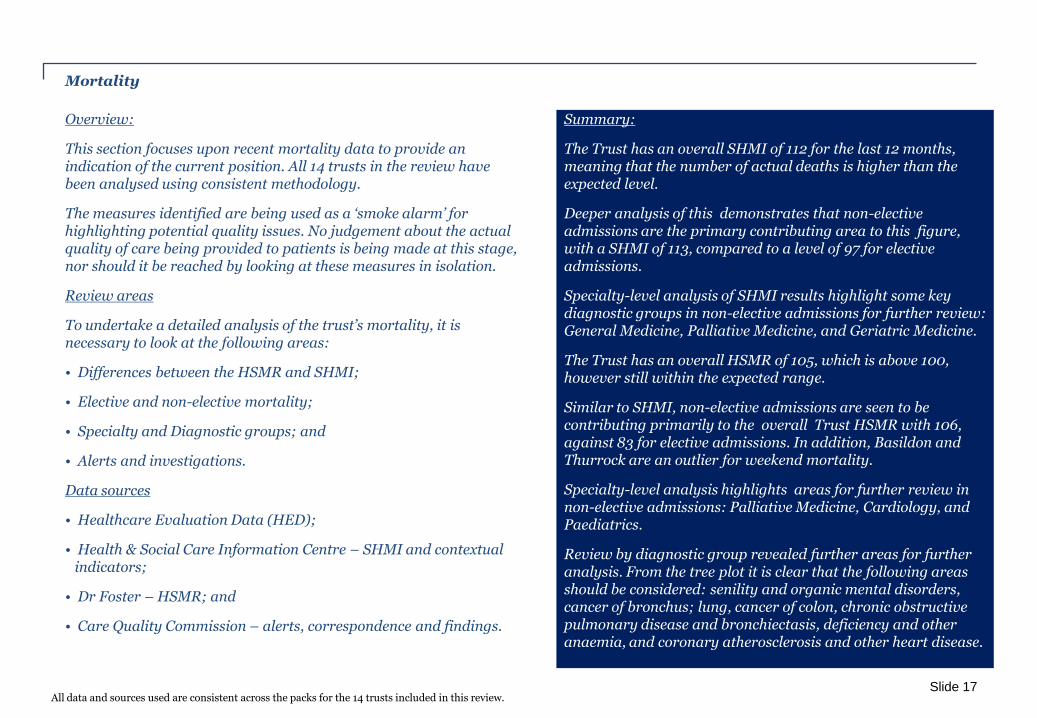
Summary:
The Trust has an overall SHMI of 112 for the last 12 months, meaning that the number of actual deaths is higher than the expected level.
Deeper analysis of this demonstrates that non-elective admissions are the primary contributing area to this figure, with a SHMI of 113, compared to a level of 97 for elective admissions.
Specialty-level analysis of SHMI results highlight some key diagnostic groups in non-elective admissions for further review: General Medicine, Palliative Medicine, and Geriatric Medicine.
The Trust has an overall HSMR of 105, which is above 100, however still within the expected range.
Similar to SHMI, non-elective admissions are seen to be contributing primarily to the overall Trust HSMR with 106, against 83 for elective admissions. In addition, Basildon and Thurrock are an outlier for weekend mortality.
Specialty-level analysis highlights areas for further review in non-elective admissions: Palliative Medicine, Cardiology, and Paediatrics.
Review by diagnostic group revealed further areas for further analysis. From the tree plot it is clear that the following areas should be considered: senility and organic mental disorders, cancer of bronchus; lung, cancer of colon, chronic obstructive pulmonary disease and bronchiectasis, deficiency and other anaemia, and coronary atherosclerosis and other heart disease.
Slide 17 All data and sources used are consistent across the packs for the 14 trusts included in this review.

Mortality Overview
Slide 18
Mo
rta
lity
Outcome 1 (R17) Respecting and involving e who use services
Overall HSMR
Overall SHMI*
Weekend or weekday mortality outliers
Elective mortality (SHMI and HSMR)
Non-elective mortality (SHMI and HSMR)
Palliative care coding issues
Emergency specialty groups much worse than expected 30-day mortality following specific surgery / admissions
Emergency specialty groups worse than expected Mortality among patients with diabetes
Diagnosis group alerts to CQC
Diagnosis group alerts followed up by CQC
The following overview provides a summary of the Trust’s key mortality areas:
Source: Healthcare Evaluation Data (HED). Dec 11 – Nov 12 Health & Social Care Information Centre – SHMI and contextual indicators, Dr Foster – HSMR, Care Quality Commission – alerts, correspondence and findings
Outside expected range
Within expected range
*The detailed following analysis on SHMI is based upon a narrower set of confidence intervals compared to the Random effects model, which the HSCIC use to report whether the SHMI is within, below or above the expected range and was the range used to select the 14 trusts for this review. The narrower range is used here to increase the sensitivity to the data and serves to give an earlier warning for the purposes of this review.
Outside expected range of the HSCIC for Mar 11 – Sep 12
Within expected range
Outside expected range based on Poisson distribution for Dec 11 – Nov 12
SHMI*
HSMR Definition
What is the Hospital Standardised Mortality Ratio? The Hospital Standardised Mortality Ratio (HSMR) is an indicator of healthcare quality that measures whether the mortality rate at a hospital is higher or lower than you would expect. Like all statistical indicators, HSMR is not perfect. If a hospital has a high HSMR, it cannot be said for certain that this reflects failings in the care provided by the hospital. However, it can be a warning sign that things are going wrong. How does HSMR work? The HSMR is a ratio of the observed number of in-hospital deaths at the end of a continuous inpatient spell to the expected number of in-hospital deaths (multiplied by 100) for 56 specific CCS groups; in a specified patient group. The expected deaths are calculated from logistical regression models taking into account and adjusting for a case-mix of: age band, sex, deprivation, interaction between age band and co-morbidities, month of admission, admission method, source of admission, the presence of palliative care, number of previous emergency admissions and financial year of discharge. How should HSMR be interpreted? Care is needed in interpreting these results. Although a score of 100 indicates that the observed number of deaths matched the expected number in order to identify if variation from this is significant confidence intervals are calculated. A Poisson distribution model is used to calculate 95% and 99.9% confidence intervals and only when these have been crossed is performance classed as higher or lower than expected.
Slide 19
SHMI Definition
What is the Summary Hospital-level Mortality Indicator? The Summary Hospital-level Mortality Indicator (SHMI) is a high level hospital mortality indicator that is published by the Department of Health on a quarterly basis. The SHMI follows a similar principle to the general standardised mortality ratio; a measure based upon a nationally expected value. SHMI can be used as a potential smoke alarm for potential deviations away from regular practice. How does SHMI work? 1. Deaths up to 30 days post acute trust discharge are considered in the mortality indicator, utilising ONS data 2. The SHMI is the ratio of the Observed number of deaths in a Trust vs. Expected number of deaths over a period of time 3. The Indicator will utilise 5 factors to adjust mortality rates by
a. The primary admitting diagnosis; b. The type of admission; c. A calculation of co-morbid complexity (Charlson Index of co-morbidities); d. Age; and e. Sex.
4. All inpatient mortalities that occur within a Hospital are considered in the indicator How should SHMI be interpreted? Due to the complexities of hospital care and the high variation in the statistical models used all deviations from the expected range are highlighted using a Random Effects funnel plot.
Slide 20

Some key differences between SHMI and HSMR
Slide 21
Indicator HSMR SHMI
Are all hospital deaths included? No, around 80% of in hospital deaths are
included, which varies significantly
dependent upon the services provided by
each hospital
Yes all deaths are included
When a patient dies how many times is this
counted?
If a patient is transferred between hospitals
within 2 days the death is counted multiple
times
1 death is counted once, and if the patient is
transferred the death is attached to the last
acute/secondary care provider
Does the use of the palliative care code
reduce the relative impact of a death on the
indicator?
Yes No
Does the indicator consider where deaths
occur?
Only considers in-hospital deaths Considers in-hospital deaths but also those
up to 30 days post discharge anywhere too.
Is this applied to all health care providers? Yes No, does not apply to specialist hospitals
SHMI overview
Slide 22
Month-on-month time series
Year-on-year time series
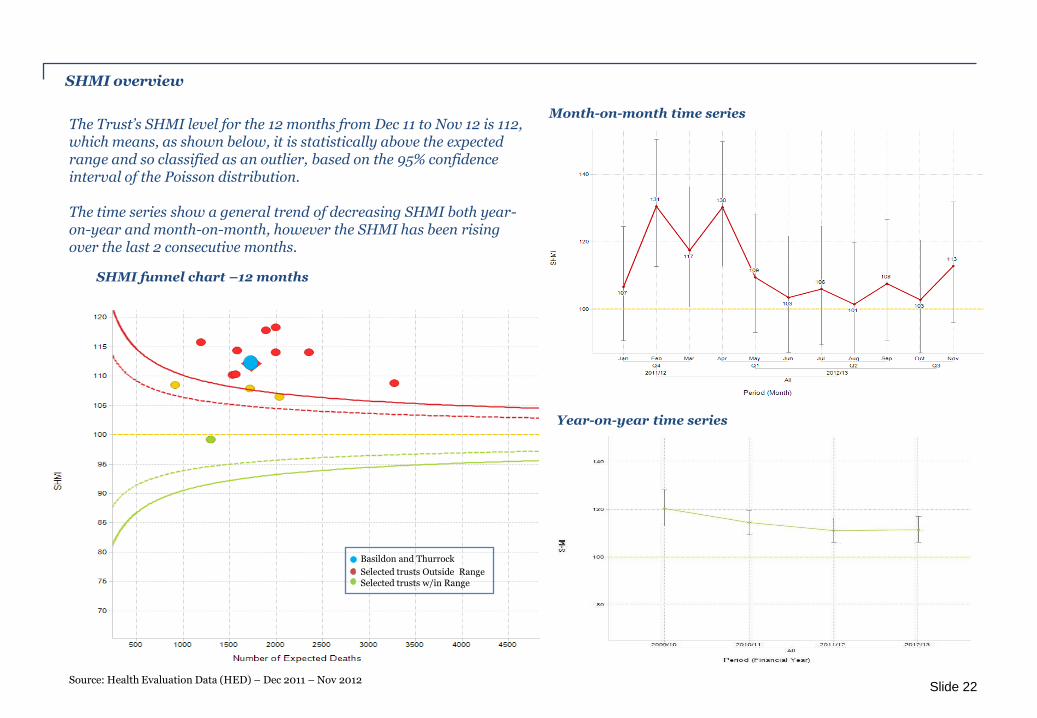
The Trust’s SHMI level for the 12 months from Dec 11 to Nov 12 is 112, which means, as shown below, it is statistically above the expected range and so classified as an outlier, based on the 95% confidence interval of the Poisson distribution. The time series show a general trend of decreasing SHMI both year-on-year and month-on-month, however the SHMI has been rising over the last 2 consecutive months.
SHMI funnel chart –12 months
Source: Health Evaluation Data (HED) – Dec 2011 – Nov 2012
Basildon and Thurrock
Selected trusts Outside Range Selected trusts w/in Range
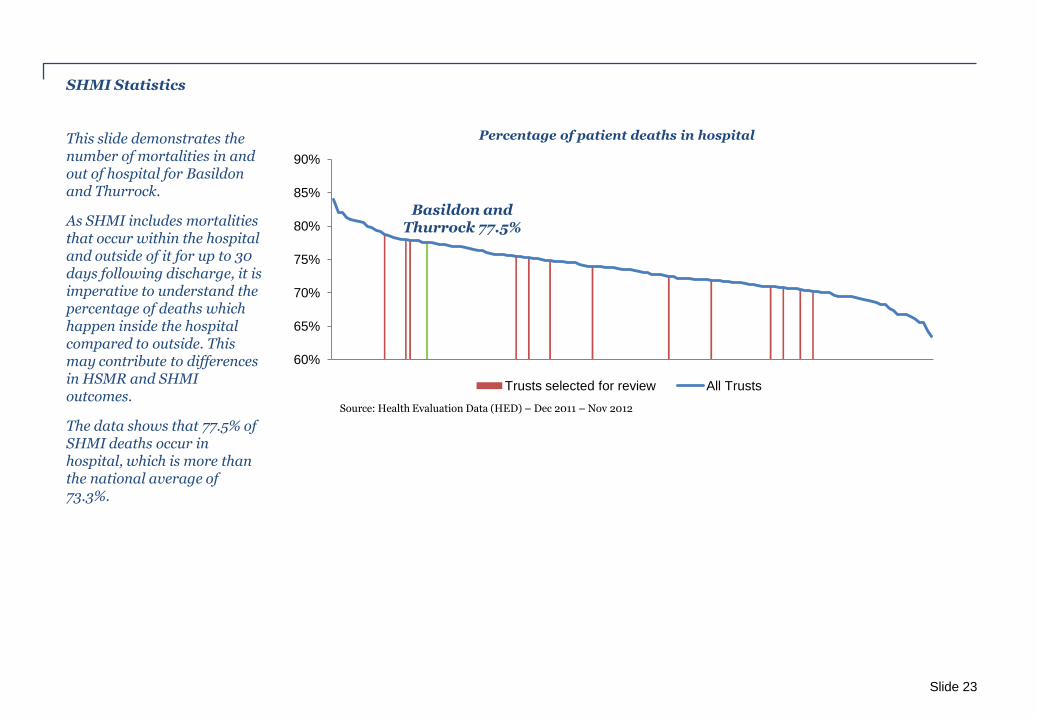
SHMI Statistics This slide demonstrates the
number of mortalities in and out of hospital for Basildon and Thurrock.
As SHMI includes mortalities that occur within the hospital and outside of it for up to 30 days following discharge, it is imperative to understand the percentage of deaths which happen inside the hospital compared to outside. This may contribute to differences in HSMR and SHMI outcomes.
The data shows that 77.5% of SHMI deaths occur in hospital, which is more than the national average of 73.3%.
60%
65%
70%
75%
80%
85%
90%
Percentage of patient deaths in hospital
Trusts selected for review All Trusts
Basildon and Thurrock 77.5%
Slide 23
Source: Health Evaluation Data (HED) – Dec 2011 – Nov 2012
Mortality - SHMI Tree
( )
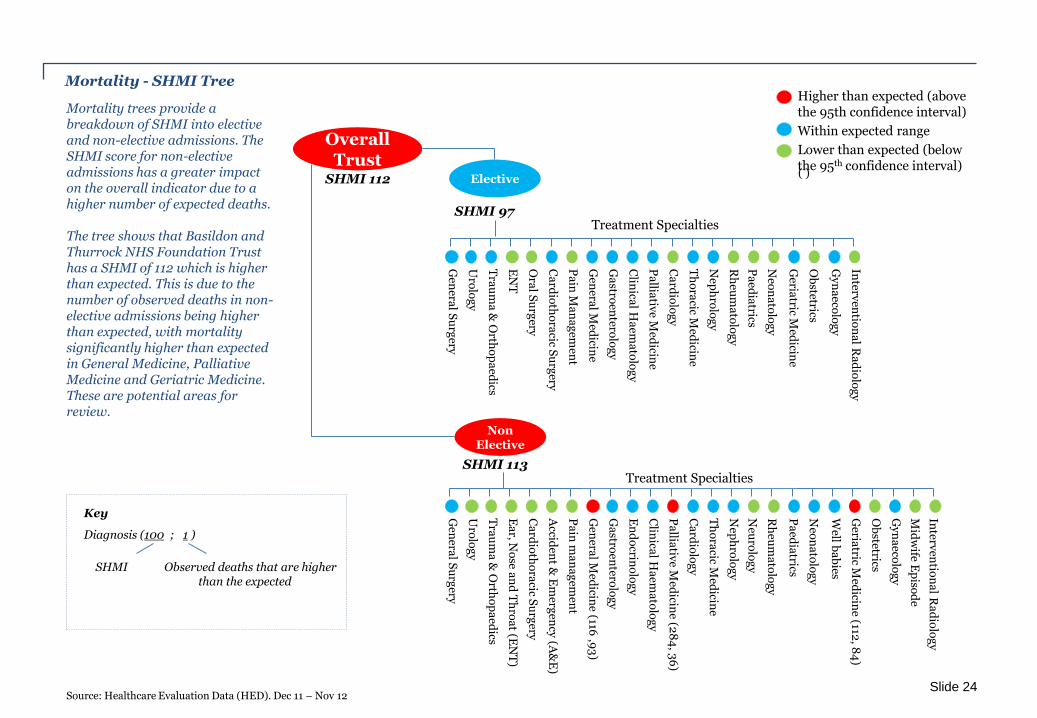
Mortality trees provide a breakdown of SHMI into elective and non-elective admissions. The SHMI score for non-elective admissions has a greater impact on the overall indicator due to a higher number of expected deaths. The tree shows that Basildon and Thurrock NHS Foundation Trust has a SHMI of 112 which is higher than expected. This is due to the number of observed deaths in non-elective admissions being higher than expected, with mortality significantly higher than expected in General Medicine, Palliative Medicine and Geriatric Medicine. These are potential areas for review.
Slide 24
Higher than expected (above the 95th confidence interval)
Within expected range
Lower than expected (below the 95th confidence interval)
Source: Healthcare Evaluation Data (HED). Dec 11 – Nov 12
Diagnosis (100 ; 1 )
SHMI Observed deaths that are higher than the expected
Key
Overall Trust
Elective SHMI 112
Non Elective
Neu
rolo
gy
Gen
eral S
urg
ery
Uro
log
y
Tra
um
a &
Orth
op
aed
ics
Ea
r, No
se an
d T
hro
at (E
NT
)
Ca
rdio
tho
racic S
urg
ery
Accid
ent &
Em
ergen
cy (A
&E
)
Pa
in m
an
ag
emen
t
Gen
eral M
edicin
e (116 ,9
3)
Ga
stroen
terolo
gy
En
do
crino
log
y
Clin
ical H
aem
ato
log
y
Pa
lliativ
e Med
icine (2
84
, 36
)
Ca
rdio
log
y
Th
ora
cic Med
icine
Pa
edia
trics
Rh
eum
ato
log
y
Neo
na
tolo
gy
Geria
tric Med
icine (112
, 84
)
Gy
na
ecolo
gy
Well b
ab
ies
Ob
stetrics
Mid
wife E
piso
de
Interv
entio
na
l Ra
dio
log
y
Nep
hro
log
y
SHMI 113
SHMI 97 Treatment Specialties
Treatment Specialties
Pa
edia
trics
Gen
eral S
urg
ery
Uro
log
y
Tra
um
a &
Orth
op
aed
ics
EN
T
Ora
l Su
rgery
Ca
rdio
tho
racic S
urg
ery
Pa
in M
an
ag
emen
t
Gen
eral M
edicin
e
Ga
stroen
terolo
gy
Clin
ical H
aem
ato
log
y
Pa
lliativ
e Med
icine
Ca
rdio
log
y
Th
ora
cic Med
icine
Nep
hro
log
y
Geria
tric Med
icine
Neo
na
tolo
gy
Ob
stetrics
Interv
entio
na
l Ra
dio
log
y
Gy
na
ecolo
gy
Rh
eum
ato
log
y

SHMI sub-tree of specialties
The SHMI sub-tree highlights the specialties for elective and non-elective admissions with a statistically higher SHMI than expected and highlights the diagnostic groups with at least 4 more observed deaths than expected. When identifying areas to review, it is important to consider the number of deaths as well as the SHMI. Geriatric Medicine has the highest number of greater than expected deaths with senility and organic mental disorders, urinary tract infections, and chronic obstructive pulmonary disease and bronchiectasis seen as the main diagnostic groups contributing to this.
Slide 25
Diagnostic Groups
Source: Health Evaluation Data (HED) – Dec 2011 – Nov 2012
Higher than expected (above the 95th confidence interval)
Within expected range
Lower than expected (below the 95th confidence interval)
Treatment Specialties
118.2 Non-elective (113; 212) Overall (112; 217)
Diagnosis (100 ; 1 )
SHMI Observed deaths that are higher than the expected
Key
General Medicine (116; 68) Palliative Medicine (284; 36) Geriatric Medicine (112; 84)
Pneumonia (except that caused by tuberculosis or sexually transmitted disease) (275; 4)
Aspiration pneumonitis; food/vomitus (158; 6)
Chronic obstructive pulmonary disease and bronchiectasis (127; 7)
Deficiency and other anemia (177; 5)
Fluid and electrolyte disorders (135; 5)
Gastrointestinal hemorrhage (158; 6)
Intestinal infection (167; 5)
Nausea and vomiting (364; 4)
Open wounds of head; neck; and trunk (376; 4)
Senility and organic mental disorders (227; 15)
Skin and subcutaneous tissue infections (206; 6)
Urinary tract infections (128; 8)
Acute and unspecified renal failure (113; 4)
Acute cerebrovascular disease (156; 9)
Cancer of stomach (347; 4)
Cardiac arrest and ventricular fibrillation (143; 4)
Deficiency and other anemia (196; 5)
Gastrointestinal hemorrhage (158; 5)
Other gastrointestinal disorders (310; 7)
Pleurisy; pneumothorax; pulmonary collapse (137; 4)
Residual codes; unclassified (387; 6)
Skin and subcutaneous tissue infections (294; 6)
HSCIC SHMI overview
Slide 26
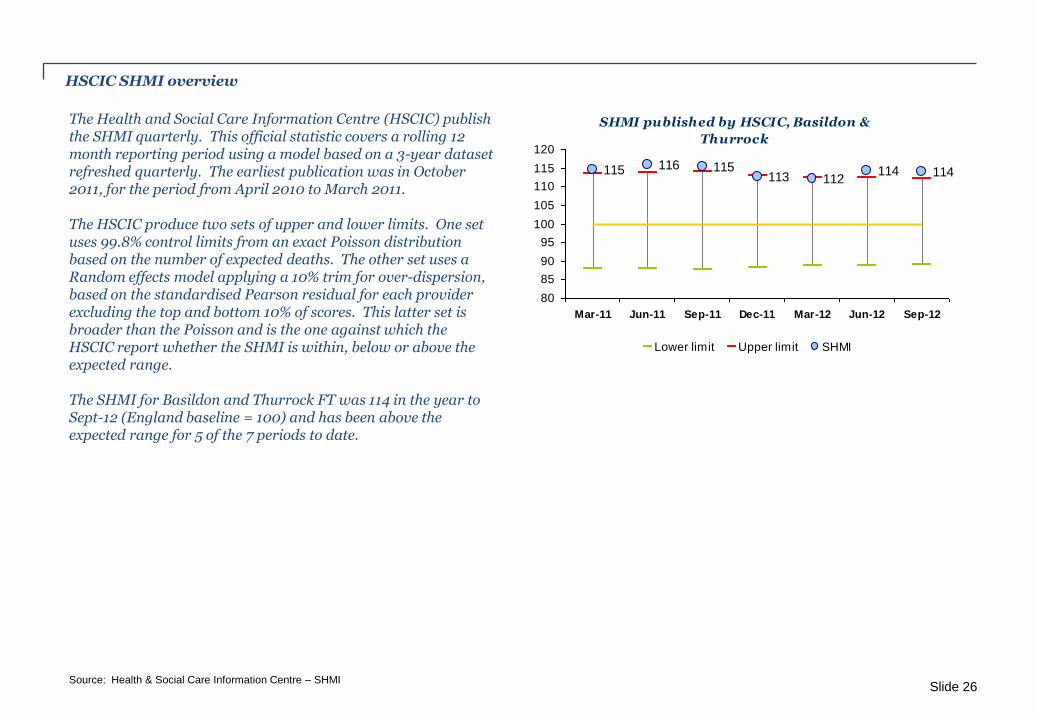
The Health and Social Care Information Centre (HSCIC) publish the SHMI quarterly. This official statistic covers a rolling 12 month reporting period using a model based on a 3-year dataset refreshed quarterly. The earliest publication was in October 2011, for the period from April 2010 to March 2011. The HSCIC produce two sets of upper and lower limits. One set uses 99.8% control limits from an exact Poisson distribution based on the number of expected deaths. The other set uses a Random effects model applying a 10% trim for over-dispersion, based on the standardised Pearson residual for each provider excluding the top and bottom 10% of scores. This latter set is broader than the Poisson and is the one against which the HSCIC report whether the SHMI is within, below or above the expected range. The SHMI for Basildon and Thurrock FT was 114 in the year to Sept-12 (England baseline = 100) and has been above the expected range for 5 of the 7 periods to date.
Source: Health & Social Care Information Centre – SHMI
SHMI published by HSCIC, Basildon &
Thurrock
115 116 115113 112
114 114
80
85
90
95
100
105
110
115
120
Mar-11 Jun-11 Sep-11 Dec-11 Mar-12 Jun-12 Sep-12
Rolling 12 months ending
Lower limit Upper limit SHMI
HSMR overview
Slide 27
Month-on-month time series
Year-on-year time series
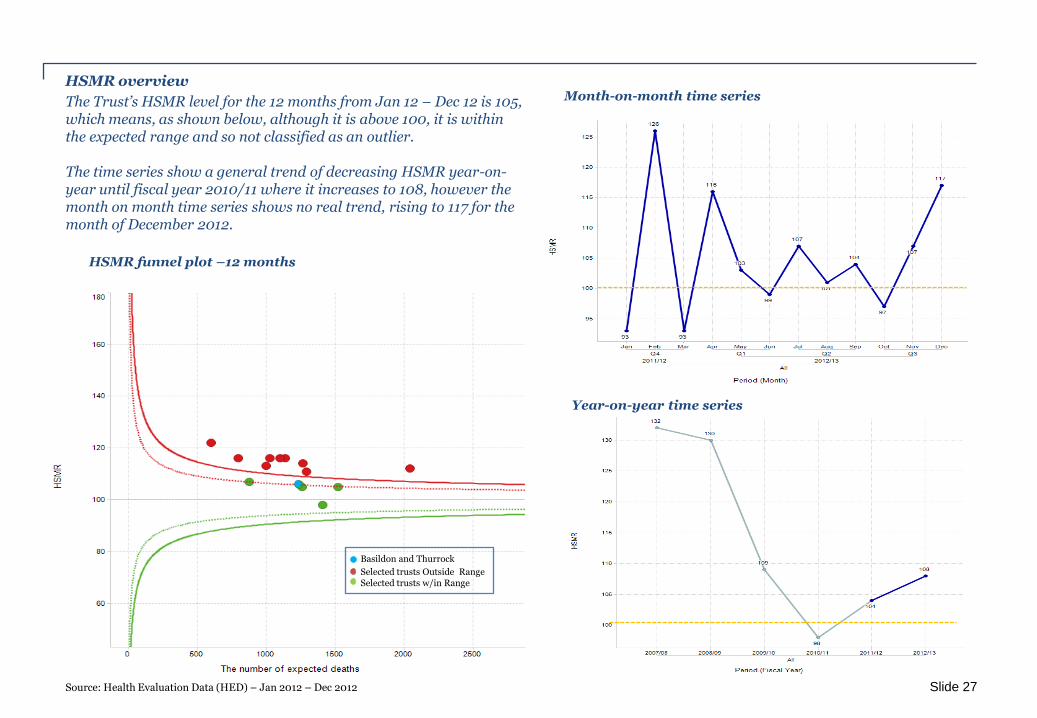
The Trust’s HSMR level for the 12 months from Jan 12 – Dec 12 is 105, which means, as shown below, although it is above 100, it is within the expected range and so not classified as an outlier. The time series show a general trend of decreasing HSMR year-on-year until fiscal year 2010/11 where it increases to 108, however the month on month time series shows no real trend, rising to 117 for the month of December 2012.
HSMR funnel plot –12 months
Source: Health Evaluation Data (HED) – Jan 2012 – Dec 2012
Basildon and Thurrock
Selected trusts Outside Range Selected trusts w/in Range
HSMR Statistics
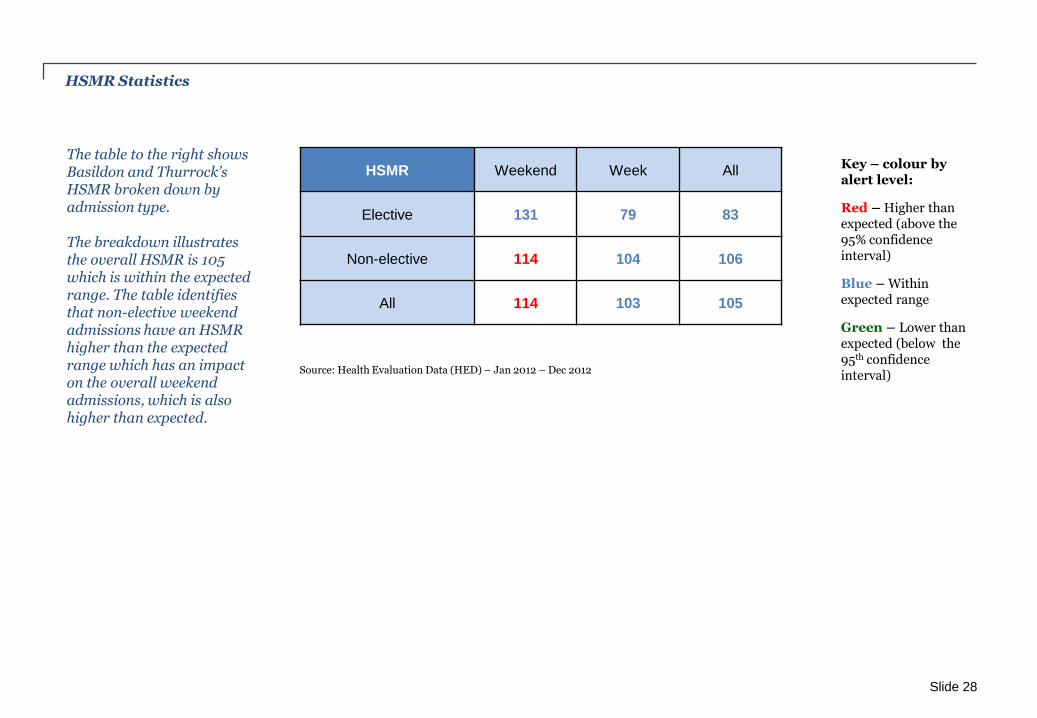
The table to the right shows Basildon and Thurrock’s HSMR broken down by admission type. The breakdown illustrates the overall HSMR is 105 which is within the expected range. The table identifies that non-elective weekend admissions have an HSMR higher than the expected range which has an impact on the overall weekend admissions, which is also higher than expected.
Slide 28
HSMR Weekend Week All
Elective 131 79 83
Non-elective 114 104 106
All 114 103 105
Key – colour by alert level:
Red – Higher than expected (above the 95% confidence interval)
Blue – Within expected range
Green – Lower than expected (below the 95th confidence interval)
Source: Health Evaluation Data (HED) – Jan 2012 – Dec 2012
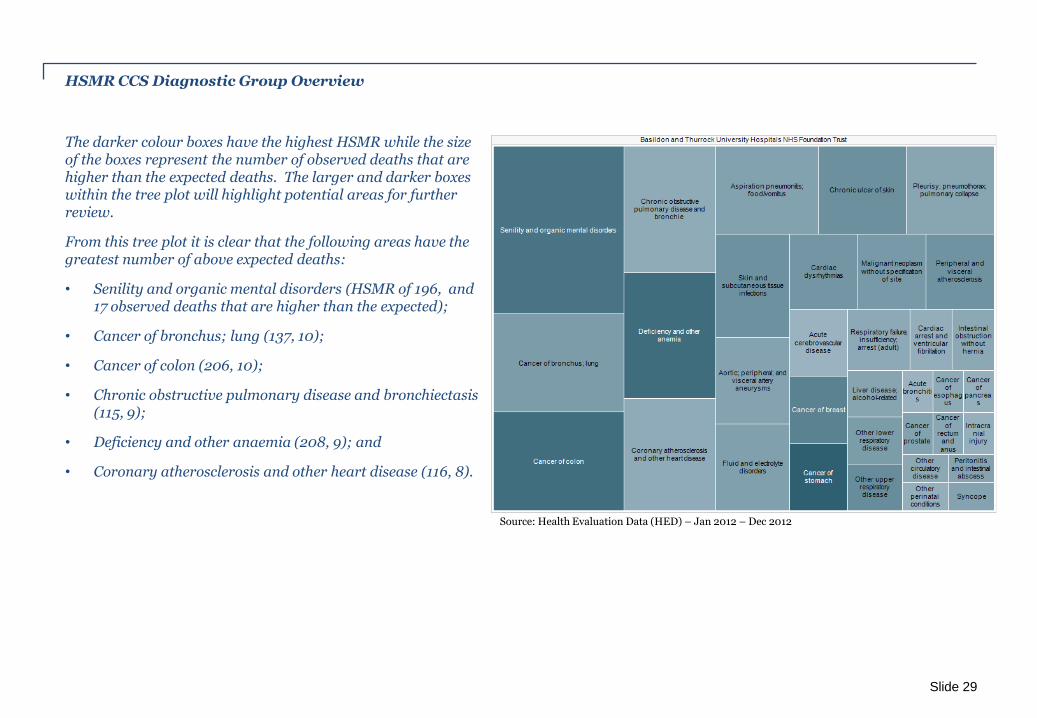
HSMR CCS Diagnostic Group Overview
The darker colour boxes have the highest HSMR while the size of the boxes represent the number of observed deaths that are higher than the expected deaths. The larger and darker boxes within the tree plot will highlight potential areas for further review.
From this tree plot it is clear that the following areas have the greatest number of above expected deaths:
• Senility and organic mental disorders (HSMR of 196, and 17 observed deaths that are higher than the expected);
• Cancer of bronchus; lung (137, 10);
• Cancer of colon (206, 10);
• Chronic obstructive pulmonary disease and bronchiectasis (115, 9);
• Deficiency and other anaemia (208, 9); and
• Coronary atherosclerosis and other heart disease (116, 8).
Slide 29
Source: Health Evaluation Data (HED) – Jan 2012 – Dec 2012
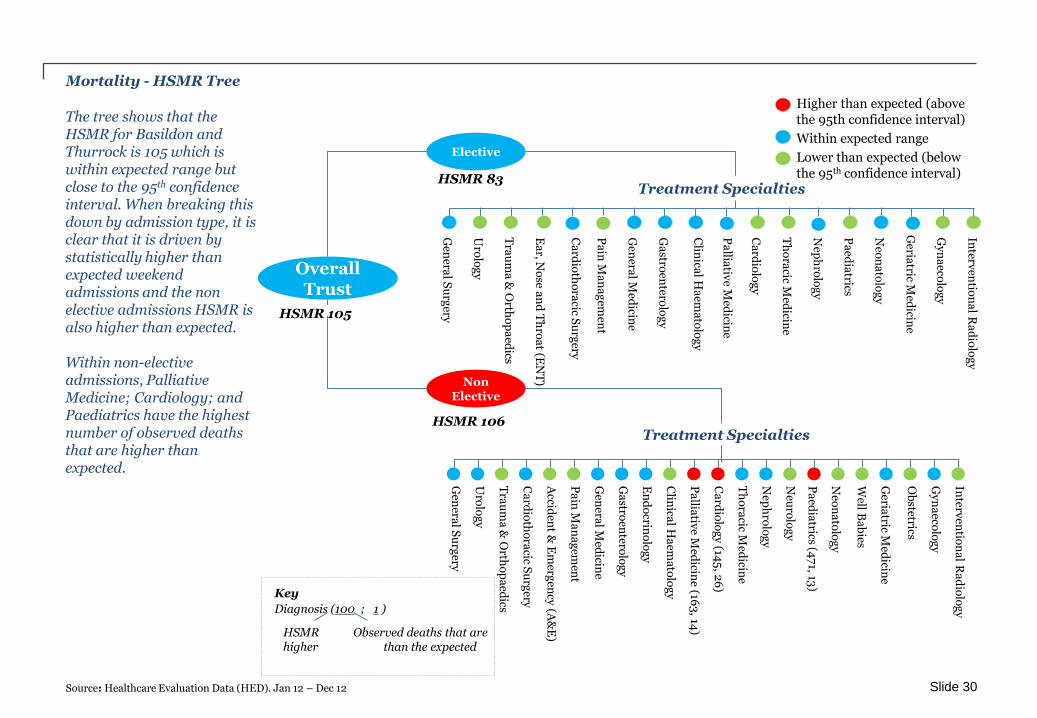
Mortality - HSMR Tree
The tree shows that the HSMR for Basildon and Thurrock is 105 which is within expected range but close to the 95th confidence interval. When breaking this down by admission type, it is clear that it is driven by statistically higher than expected weekend admissions and the non elective admissions HSMR is also higher than expected. Within non-elective admissions, Palliative Medicine; Cardiology; and Paediatrics have the highest number of observed deaths that are higher than expected.
Slide 30
Overall Trust
Elective
Non Elective
Gen
eral S
urg
ery
Uro
log
y
Tra
um
a &
Orth
op
aed
ics
Ea
r, No
se an
d T
hro
at (E
NT
)
Ca
rdio
tho
racic S
urg
ery
Pa
in M
an
ag
emen
t
Gen
eral M
edicin
e
Ga
stroen
terolo
gy
Clin
ical H
aem
ato
log
y
Pa
lliativ
e Med
icine
Ca
rdio
log
y
Th
ora
cic Med
icine
Nep
hro
log
y
Pa
edia
trics
Geria
tric Med
icine
Interv
entio
na
l Ra
dio
log
y
Gy
na
ecolo
gy
Neo
na
tolo
gy
Pa
edia
trics (47
1, 13)
Gen
eral S
urg
ery
Uro
log
y
Tra
um
a &
Orth
op
aed
ics
Ca
rdio
tho
racic S
urg
ery
Accid
ent &
Em
ergen
cy (A
&E
)
Pa
in M
an
ag
emen
t
Gen
eral M
edicin
e
Ga
stroen
terolo
gy
En
do
crino
log
y
Clin
ical H
aem
ato
log
y
Pa
lliativ
e Med
icine (16
3, 14
)
Ca
rdio
log
y (14
5, 2
6)
Th
ora
cic Med
icine
Nep
hro
log
y
Well B
ab
ies
Neo
na
tolo
gy
Geria
tric Med
icine
Gy
na
ecolo
gy
Ob
stetrics
Interv
entio
na
l Ra
dio
log
y
Neu
rolo
gy
HSMR 106
HSMR 83 Treatment Specialties
Treatment Specialties
Source: Healthcare Evaluation Data (HED). Jan 12 – Dec 12
Higher than expected (above the 95th confidence interval)
Within expected range
Lower than expected (below the 95th confidence interval)
HSMR 105
Diagnosis (100 ; 1 )
HSMR Observed deaths that are higher than the expected
Key
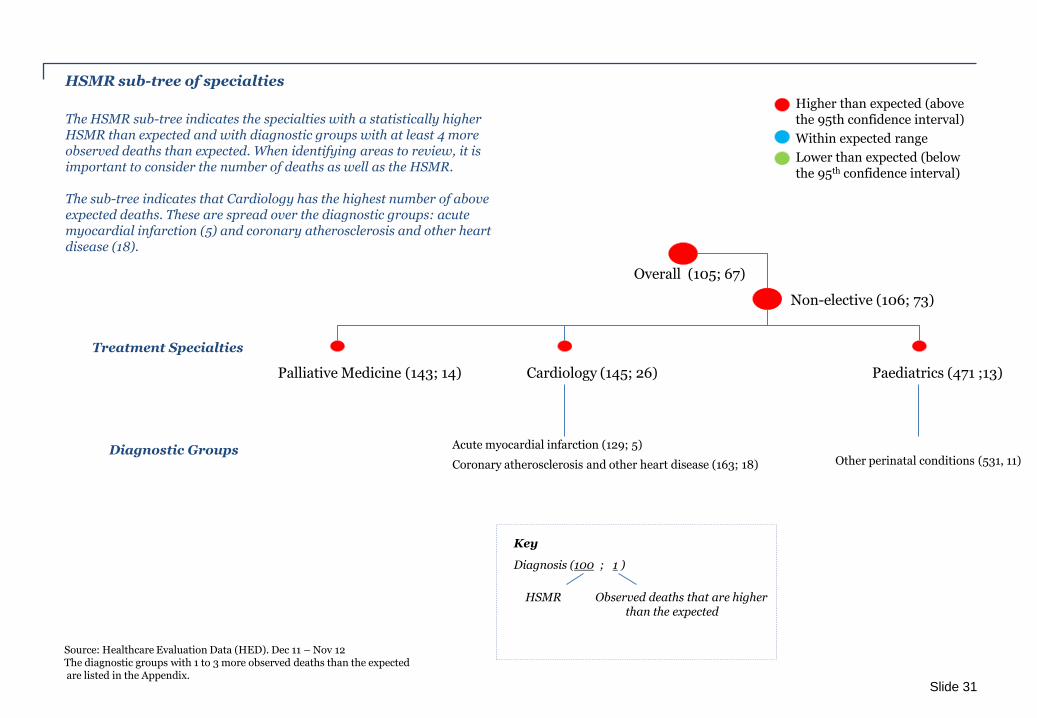
HSMR sub-tree of specialties
The HSMR sub-tree indicates the specialties with a statistically higher HSMR than expected and with diagnostic groups with at least 4 more observed deaths than expected. When identifying areas to review, it is important to consider the number of deaths as well as the HSMR. The sub-tree indicates that Cardiology has the highest number of above expected deaths. These are spread over the diagnostic groups: acute myocardial infarction (5) and coronary atherosclerosis and other heart disease (18).
Slide 31
Diagnosis (100 ; 1 )
HSMR Observed deaths that are higher than the expected
Key
Treatment Specialties
Diagnostic Groups
Source: Healthcare Evaluation Data (HED). Dec 11 – Nov 12 The diagnostic groups with 1 to 3 more observed deaths than the expected are listed in the Appendix.
Higher than expected (above the 95th confidence interval)
Within expected range
Lower than expected (below the 95th confidence interval)
118.2
Cardiology (145; 26)
Non-elective (106; 73)
Overall (105; 67)
Palliative Medicine (143; 14)
Acute myocardial infarction (129; 5)
Coronary atherosclerosis and other heart disease (163; 18) Other perinatal conditions (531, 11)
Paediatrics (471 ;13)

HSMR – Dr Foster
The HSMR time series for Basildon & Thurrock FT from Dr Foster shows a fall in the HSMR since 2008/09. This measures the observed in-hospital death rate against an expected value based on all the data for that year. An HSMR (or SHMI) of 100 means that there is exactly the same number of deaths as expected. The HSMR is classified as above expected if the lower 95% confidence limit exceeds 100, which was the case in financial years 2008/09 and 2009/10, but not the more recent years. Basildon & Thurrock FT’s latest SHMI published by the HSCIC, for Oct 11 to Sept 12, is higher than the Dr Foster HSMR for the same period, which may be due to a number of factors. Dr Foster have made the following adjustments to show differences explained by these factors: • Adjustment for palliative care: used the SHMI observed deaths
but changed expected deaths to take account of palliative care. Unlike the HSCIC analysis for the April 2012 SHMI (based on the palliative care treatment specialty), this did not reduce the SHMI.
• Adjustment for in-hospital deaths: • Removed out-of-hospital deaths from the observed
figure, and • Reduced expected deaths to only those in-hospital.
The remaining variances are largely due to: • The scope of deaths included (SHMI covers all deaths whereas
HSMR covers clinical areas accounting for an average of around 80% of deaths), and
• The definition of spells, which includes those provider(s) the death attributes to.
Source: Dr Foster HSMRs, HSCIC SHMI
Slide 32
132
108
98 102
90
100
110
120
130
140
150
2008/09 2009/10 2010/11 2011/12
Time series of HSMR, Basildon & Thurrock
HSMR 95% Confidence intervalI
Com parison of m ortality m easures,
Basildon & Thurrock
114117
120
102
80
90
100
110
120
130
SHMI SHMI
adjusted for
palliative care
SHMI in
hospital
deaths only
HSMR

Coding
Average Diagnosis Coding Depth
0
1
2
3
4
5
6
7
Q1 Q2 Q3 Q4 Q1 Q2 Q3 Q4 Q1 Q2 Q3 Q4 Q1 Q2 Q3 Q4 Q1 Q2 Q3
2008/09 2009/10 2010/11 2011/12 2012/13
Elective
National Average Diagnosis Coding Depth
14 Trusts' Average Diagnosis Coding Depth
Basildon
0
1
2
3
4
5
6
7
Q1 Q2 Q3 Q4 Q1 Q2 Q3 Q4 Q1 Q2 Q3 Q4 Q1 Q2 Q3 Q4 Q1 Q2 Q3
2008/09 2009/10 2010/11 2011/12 2012/13
Non-Elective
National Average Diagnosis Coding Depth
14 Trusts' Average Diagnosis Coding Depth
Basildon Basildon and Thurrock Basildon and Thurrock
Slide 33
Diagnosis coding depth has an impact on the expected number of deaths. A higher than average diagnosis coding depth is more likely to collect co-morbidity which will influence the expected mortality calculation. When looking at the depth of coding for Basildon and Thurrock, it is clear that the Trust’s average diagnosis coding depth is greater than the national average and greater than the average of the 13 other trusts covered by this review. The elective and non elective graphs both show that Basildon and Thurrock was below the national average but since Q4 2009/10, the diagnosis coding depth has improved.
Source: Health Evaluation Data (HED) – Jan 2012 – Dec 2012

Palliative care
Accurate coding of palliative care is important for contextualising SHMI and HSMR. HSMR takes into account that a patient is receiving palliative care, but SHMI does not. Basildon’s SHMI would reduce to ‘As expected’ if the SHMI model accounted for treatment specialty use (Apr- 12). However, the inconsistent use of these codes between providers led to the conclusion that the SHMI model is not improved by their inclusion. Until recently, Basildon had the highest percentage use of the palliative care treatment specialty nationally, plus high use of palliative care diagnosis coding (Z51.5). Basildon & Thurrock has a ward-based palliative care team and provides specialist inpatient palliative care at two charity-funded hospices (St Luke’s and Fairhaven).
Source: Health & Social Care Information Centre – SHMI contextual indicators
Slide 34
Percentage of admissions with palliative
care coding
-
0.5
1.0
1.5
2.0
2.5
Oct-11 Jan-12 Apr-12 Jul-12 Oct-12 Jan-13 Apr-13
SHMI publicationBasildon & Thurrock National
Percentage of deaths with palliative care
coding
-
5
10
15
20
25
30
35
40
Oct-11 Jan-12 Apr-12 Jul-12 Oct-12 Jan-13 Apr-13
SHMI publicationBasildon & Thurrock National

Care Quality Commission findings
Emergency specialty groups much worse than expected
Sep 11 to Aug 12 2
Endocrinology
Dermatology
Emergency specialty groups worse than expected
Sep 11 to Aug 12 4
Other injuries due to external causes
Musculoskeletal
Cardiology
Respiratory medicine
Diagnosis group alerts (2007 to date)
Alerts to CQC 17
Alerts followed up by CQC 15
Recent diagnosis group alerts pursued by CQC
Acute myocardial infarction (Jun-11)
Pneumonia (Feb-12)
Any related patient groups alerting more than once since 2007
Acute myocardial infarction
Chronic ulcer of skin
Intestinal obstruction without hernia
Urinary tract infections
Care Quality Commission (CQC) review mortality alerts for each Trust on an ongoing basis. These alerts, which indicate observed deaths significantly above expected for specialties or diagnoses, come from different sources based on either HSMR or SHMI. Where these appear unexplained, CQC correspond with the Trust to agree any appropriate action. For Basildon and Thurrock, the common themes that have arisen across the patient groups alerting since 2007 are Elderly Care and the Emergency care pathway. The themes common to responses to the CQC are • Accuracy of primary diagnosis; • Coding; • Lack of comprehensive medical assessment on
admission; • Failure to recognise a deteriorating patient; and • Lack of sustainability of improvements implemented
following an alert. The trust formed an action plan to implement recommendations following a review of mortality at the trust by West Midlands SHA. It has also been looking further at its clinical pathway for pneumonia patients.
Source: Care Quality Commission – alerts, correspondence and findings
Source: Care Quality Commission – alerts, correspondence and findings
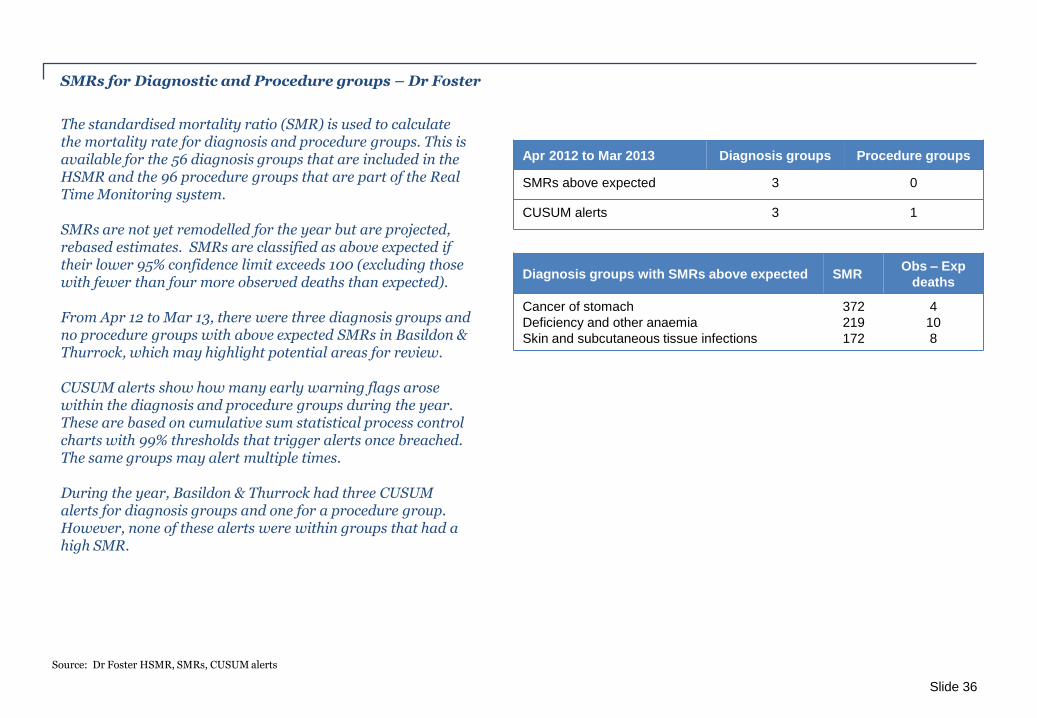
SMRs for Diagnostic and Procedure groups – Dr Foster
The standardised mortality ratio (SMR) is used to calculate the mortality rate for diagnosis and procedure groups. This is available for the 56 diagnosis groups that are included in the HSMR and the 96 procedure groups that are part of the Real Time Monitoring system. SMRs are not yet remodelled for the year but are projected, rebased estimates. SMRs are classified as above expected if their lower 95% confidence limit exceeds 100 (excluding those with fewer than four more observed deaths than expected). From Apr 12 to Mar 13, there were three diagnosis groups and no procedure groups with above expected SMRs in Basildon & Thurrock, which may highlight potential areas for review. CUSUM alerts show how many early warning flags arose within the diagnosis and procedure groups during the year. These are based on cumulative sum statistical process control charts with 99% thresholds that trigger alerts once breached. The same groups may alert multiple times. During the year, Basildon & Thurrock had three CUSUM alerts for diagnosis groups and one for a procedure group. However, none of these alerts were within groups that had a high SMR.
Source: Dr Foster HSMR, SMRs, CUSUM alerts
Slide 36
Apr 2012 to Mar 2013 Diagnosis groups Procedure groups
SMRs above expected 3 0
CUSUM alerts 3 1
Diagnosis groups with SMRs above expected SMR Obs – Exp
deaths
Cancer of stomach
Deficiency and other anaemia
Skin and subcutaneous tissue infections
372
219
172
4
10
8
Mortality – other alerts
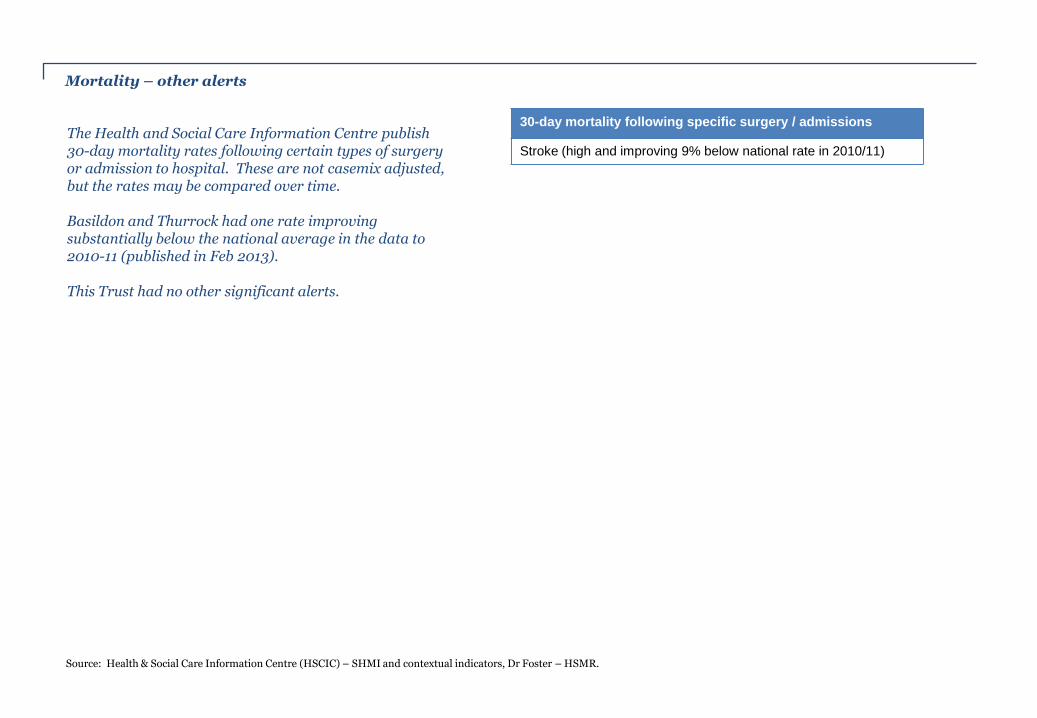
30-day mortality following specific surgery / admissions
Stroke (high and improving 9% below national rate in 2010/11)
The Health and Social Care Information Centre publish 30-day mortality rates following certain types of surgery or admission to hospital. These are not casemix adjusted, but the rates may be compared over time. Basildon and Thurrock had one rate improving substantially below the national average in the data to 2010-11 (published in Feb 2013). This Trust had no other significant alerts.
Source: Health & Social Care Information Centre (HSCIC) – SHMI and contextual indicators, Dr Foster – HSMR.
Patient Experience Slide 38
Patient Experience
Overview:
The following section provides an insight into the Trust’s patient experience.
Review Areas:
To undertake a detailed analysis of the Trust’s Patient Experience it is necessary to review the following areas:
• Patient Experience, and
• Complaints.
Data Sources:
• Patient Experience Survey;
• Cancer Patient Experience Survey;
• Peoples’ Voice Summary; and
• Complaints data.
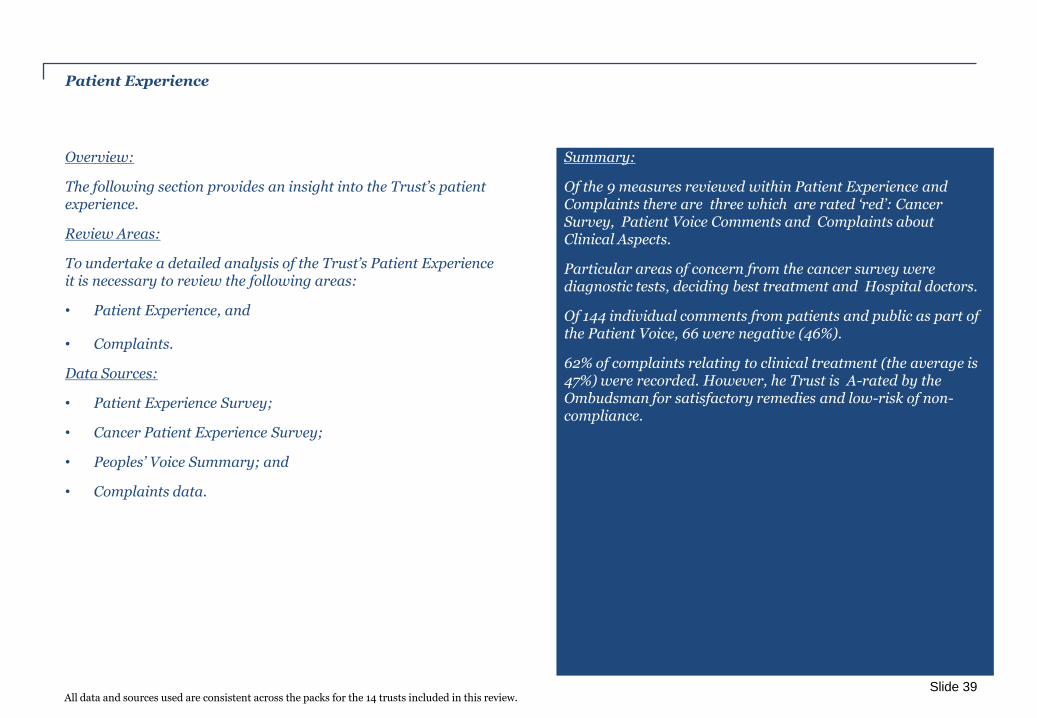
Summary:
Of the 9 measures reviewed within Patient Experience and Complaints there are three which are rated ‘red’: Cancer Survey, Patient Voice Comments and Complaints about Clinical Aspects.
Particular areas of concern from the cancer survey were diagnostic tests, deciding best treatment and Hospital doctors.
Of 144 individual comments from patients and public as part of the Patient Voice, 66 were negative (46%).
62% of complaints relating to clinical treatment (the average is 47%) were recorded. However, he Trust is A-rated by the Ombudsman for satisfactory remedies and low-risk of non-compliance.
Slide 39
All data and sources used are consistent across the packs for the 14 trusts included in this review.

Patient Experience
Inpatient PEAT : environment
Cancer survey PEAT : food
PEAT : privacy and dignity Friends and family test
Patient voice comments
Complaints about clinical aspects
Ombudsman’s rating
Pa
tie
nt
Ex
pe
rie
nc
e
This page shows the patient experience measures which are considered to be the most pertinent for this review. Further analysis, where relevant, is detailed in the following pages.
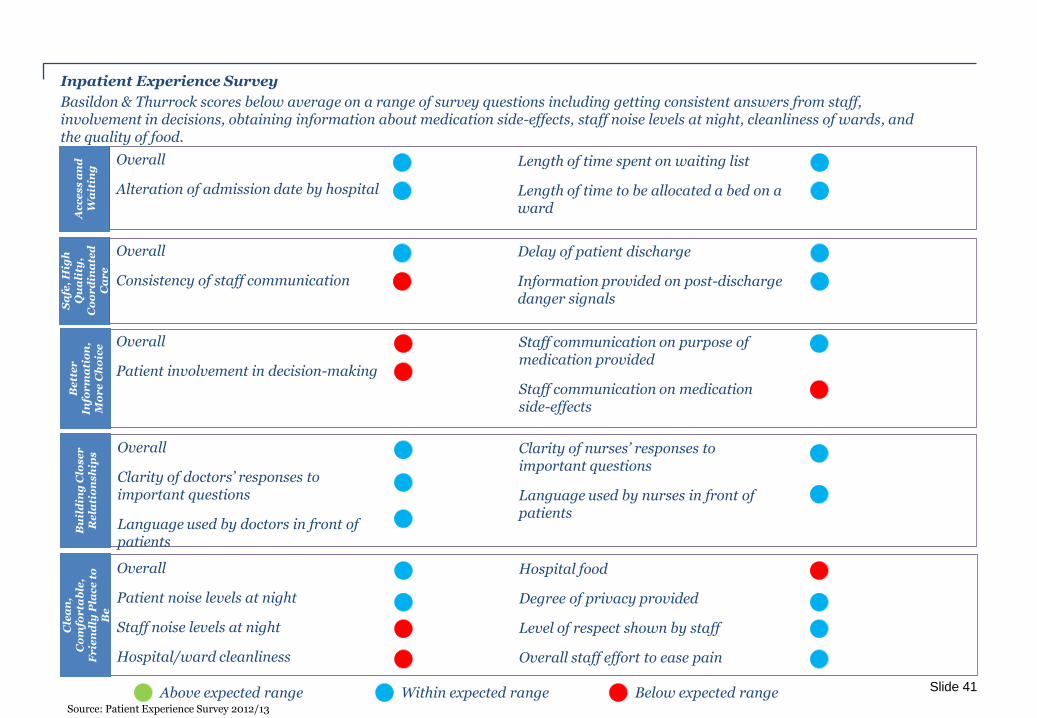
Slide 40
Outside expected range
Within expected range
Ac
ce
ss
an
d
Wa
itin
g Overall
Alteration of admission date by hospital
Length of time spent on waiting list
Length of time to be allocated a bed on a ward
Sa
fe,
Hig
h
Qu
ali
ty,
Co
or
din
ate
d
Ca
re
Overall
Consistency of staff communication
Delay of patient discharge
Information provided on post-discharge danger signals
Overall
Patient involvement in decision-making
Overall
Patient noise levels at night
Staff noise levels at night
Hospital/ward cleanliness
Inpatient Experience Survey
Slide 41
Be
tte
r
Info
rm
ati
on
, M
or
e C
ho
ice
Staff communication on purpose of medication provided
Staff communication on medication side-effects
Hospital food
Degree of privacy provided
Level of respect shown by staff
Overall staff effort to ease pain
Below expected range Within expected range Above expected range
Cle
an
, C
om
for
tab
le,
Fr
ien
dly
Pla
ce
to
B
e
Basildon & Thurrock scores below average on a range of survey questions including getting consistent answers from staff, involvement in decisions, obtaining information about medication side-effects, staff noise levels at night, cleanliness of wards, and the quality of food.
Overall
Clarity of doctors’ responses to important questions
Language used by doctors in front of patients
Clarity of nurses’ responses to important questions
Language used by nurses in front of patients
Bu
ild
ing
Clo
se
r
Re
lati
on
sh
ips
Source: Patient Experience Survey 2012/13
Patient experience and patient voice
Inpatient Survey
The national inpatient survey 2012 measures a wide range of aspects of patient experience. A composite ‘overall measure’ is calculated for use in the Outcomes Framework. This measure uses a pre-defined selection of 20 survey questions to rate the Trust on aspects including access to services, co-ordination of care, information & choice, relationship with staff and the quality of the clinical environment .
• England Average: 76.5
• Basildon and Thurrock: 74.6 (within range)
Cancer Survey
• Of 58 questions, 37 were in the ‘bottom 20%’.
• Particular areas of concern:
1. Diagnostic tests;
2. Deciding best treatment’ and
3. ‘Hospital doctors’.
Patient Voice
• The quality risk profiles compiled by the Care Quality Commission collate comments from individuals and various sources. In the two years to 31st January 2013, there were 144 comments on Basildon and Thurrock of which 66 were negative (46%). Key themes included lack of, or patronising nature of, communication, some comments about neglect (soiled sheets for example), lack of privacy and dignity.
Slide 42
50
55
60
65
70
75
80
85
90
95
Basildon and Thurrock
Source :Patient Experience Survey, Cancer patient experience survey
Overall patient experience score: Inpatients 2012
Trusts in
this review
National
results curve
England
average
Complaints Handling
• Data returns to the Health and Social Care Information Centre showed 489 written complaints in 2011-12. the number of complaints is not always a good indicator, because stronger Trusts encourage comments from patients. However, central returns are categorised by subject matter against a list of 25 headings. For this Trust, 62% of complaints related to clinical treatment (compared to the national average of 47%).
• A separate report by the Ombudsman rates the Trust as A-rated for satisfactory remedies and low-risk of non-compliance.
Safety and workforce Slide 43

Safety and Workforce
Overview:
The following section will provide an insight into the Trust’s workforce profile and safety record. This section outlines whether the Trust is adequately staffed and is safely operated.
Review Areas:
To undertake a detailed analysis of the Trust’s Safety and Workforce it is necessary to review the following areas:
• General Safety;
• Staffing;
• Staff Survey;
• Litigation and Coroner; and
• Analysis of patient safety incident reporting.
Data Sources:
• Acute Trust Quality Dashboard, Oct 2011 – Mar 2012;
• Safety Thermometer, Apr 12 – Mar 13;
• Litigation Authority Reports;
• GMC Evidence to Review 2013;
• National Staff Survey 2011, 2012;
• 2011/12 Organisational Readiness Self-Assessment (ORSA);
• National Training Survey, 2012; and
• NHS Hospital & Community Health Service (HCHS), monthly workforce statistics.
Summary:
Basildon and Thurrock is ‘red rated’ in four of the safety indicators: reporting of patient safety incidents, pressure ulcers, “harm” for all four safety thermometer indicators, and clinical negligence scheme payments.
The Trust recognises and reports patient safety incidents less fully and completely than similar trusts. It recorded 563 incidents reported as either moderate, severe or death between April 2011 and March 2012. Since 2009, seven ‘never events’ have occurred at Basildon and Thurrock, classified as that because they are incidents that are so serious they should never happen. On the other hand, Basildon and Thurrock has a rate of medication errors of 1.97, that is lower than the mean rate of 7.17 for all acute trusts.
Throughout the last 12 months, Basildon and Thurrock has been consistently below the national rate for new pressure ulcers, though it has breached this figure on three occasions. The prevalence rate of total pressure ulcers for Basildon and Thurrock has been above the national average for 10 of the last 12 months and is therefore an area for review.
The Trust’s Clinical Negligence payments have exceeded contributions to the ‘risk sharing scheme’ over the last three years, and flagged twice in Rule 43 Coroner’s reports.
Basildon and Thurrock is ‘red rated’ in nine of the workforce indicators. It notably has both a sickness absence rate for other staff and a consultant productivity rate above the national mean rate. For training of its doctors, it has a lower score on ‘undermining’ that is lower than the national average. In addition, Basildon and Thurrock’s joining and leaving rates are above the national average.
Slide 44 All data and sources used are consistent across the packs for the 14 trusts included in this review.
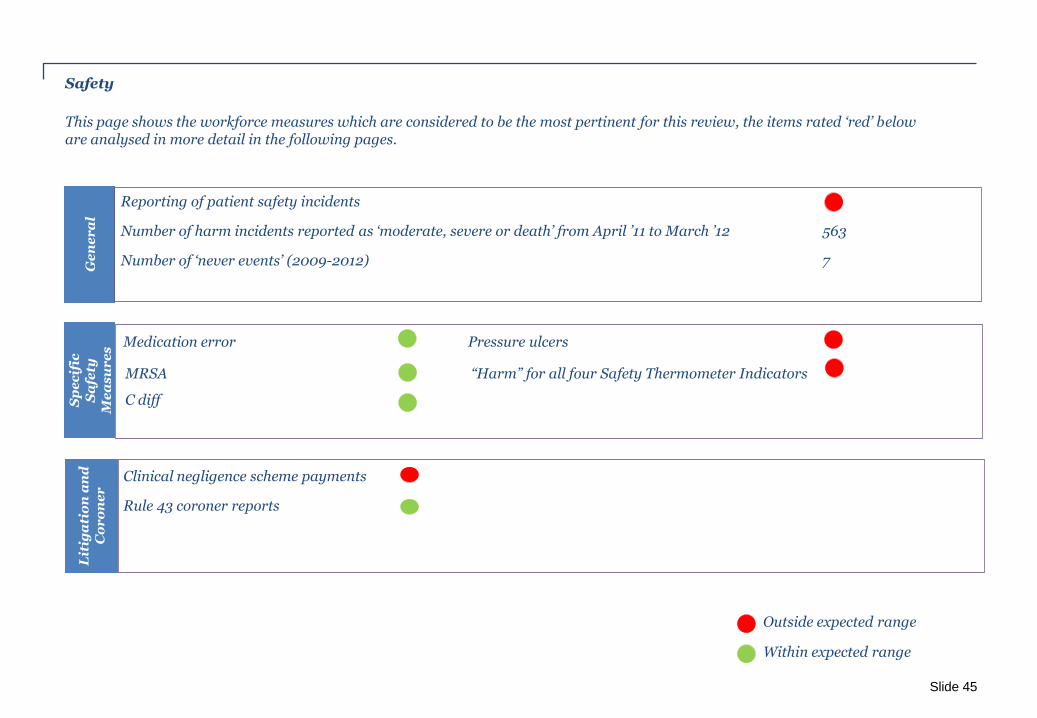
Safety G
en
er
al
Reporting of patient safety incidents
Number of harm incidents reported as ‘moderate, severe or death’ from April ’11 to March ’12 563
Number of ‘never events’ (2009-2012) 7
Outside expected range
Within expected range
Sp
ec
ific
S
afe
ty
Me
as
ur
es
MRSA “Harm” for all four Safety Thermometer Indicators
C diff
This page shows the workforce measures which are considered to be the most pertinent for this review, the items rated ‘red’ below are analysed in more detail in the following pages.
x Medication error Pressure ulcers
Slide 45
Outcome 1 (R17) Respecting and involving people who use services
Clinical negligence scheme payments
Rule 43 coroner reports
Lit
iga
tio
n a
nd
C
or
on
er
Slide 46
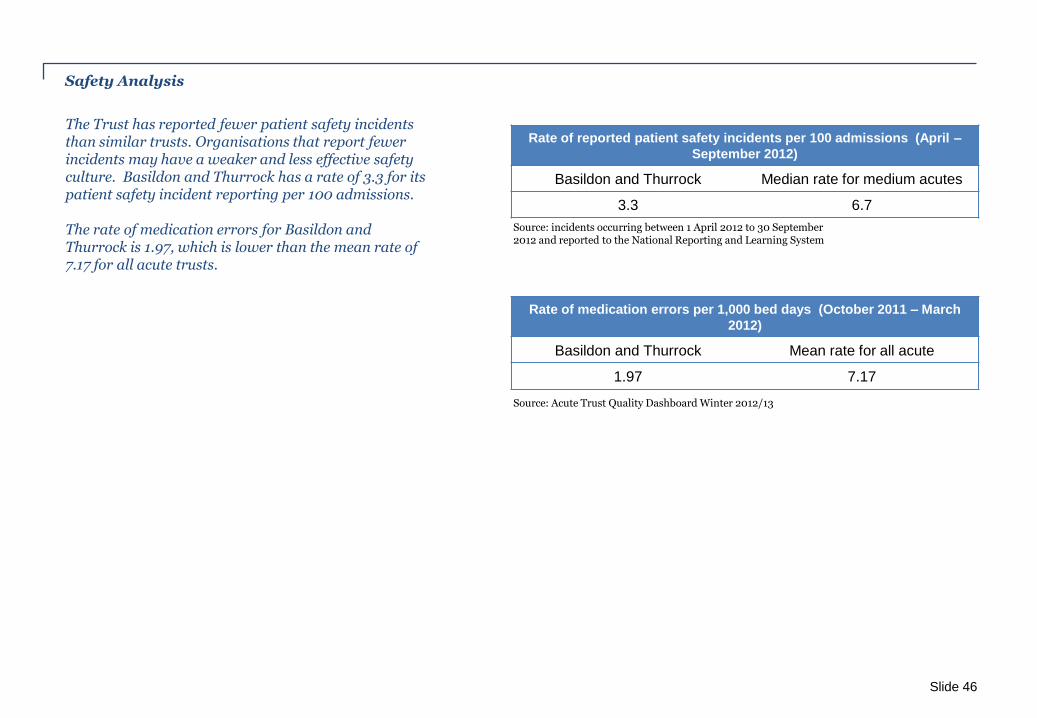
Safety Analysis
Rate of reported patient safety incidents per 100 admissions (April –
September 2012)
Basildon and Thurrock Median rate for medium acutes
3.3 6.7
The Trust has reported fewer patient safety incidents than similar trusts. Organisations that report fewer incidents may have a weaker and less effective safety culture. Basildon and Thurrock has a rate of 3.3 for its patient safety incident reporting per 100 admissions. The rate of medication errors for Basildon and Thurrock is 1.97, which is lower than the mean rate of 7.17 for all acute trusts.
Source: incidents occurring between 1 April 2012 to 30 September 2012 and reported to the National Reporting and Learning System
Rate of medication errors per 1,000 bed days (October 2011 – March
2012)
Basildon and Thurrock Mean rate for all acute
1.97 7.17
Source: Acute Trust Quality Dashboard Winter 2012/13

Slide 47
Safety Incident Breakdown
Since 2009, seven ‘never events’ have occurred at Basildon and Thurrock, classified as that because they are incidents that are so serious they should never happen. The patient safety incidents reported are broken down into five levels of harm below, ranging from ‘no harm’ to ‘death’. 28% of incidents which have been reported at Basildon and Thurrock have been classed as ‘no harm’, with 55% ‘low’, 15% ‘moderate’, 2% ‘severe’ and 10 occurrences classified as ‘death’. When broken down by category, the most regular occurrences of patient incident at Basildon and Thurrock are in ‘patient accident’ and ‘’implementation of care and ongoing monitoring / review’.
Source: Freedom of information request, BBC - http://www.bbc.co.uk/news/health-22466496
Never Events Breakdown (2009-2012)
Misplaced naso-or oro-gastric tubes 3
Maladministration of potassium containing
solutions 1
Wrong site surgery 2
Retained foreign object post-operation 1
Total 7
Source: National Patient Safety Agency (NPSA) Apr 11 – Mar 12 A definition of serious harm is given in the Appendix.
Source: National Patient Safety Agency (NPSA) . Apr 11 – Mar 12
Breakdown of patient incidents by degree of harm
Breakdown of patient incidents by incident type
913
1773
500
53 10 0
200
400
600
800
1000
1200
1400
1600
1800
2000
No Harm Low Moderate Severe Death
1440
636
438
192
185
132
108
61
21
20
16
0 500 1000 1500 2000
Patient accident
Implementation of care and …
Treatment, procedure
All others categories
Access, admission, transfer, …
Clinical assessment
Medication
Consent, communication, …
Documentation
Medical device / equipment
Infrastructure
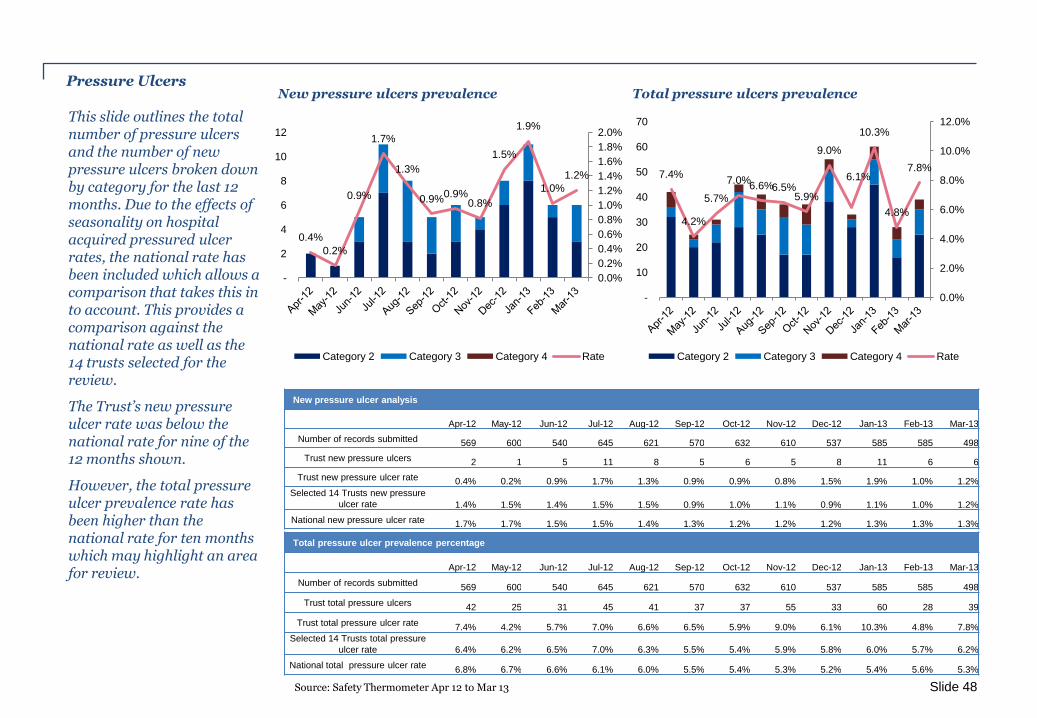
Pressure Ulcers
This slide outlines the total number of pressure ulcers and the number of new pressure ulcers broken down by category for the last 12 months. Due to the effects of seasonality on hospital acquired pressured ulcer rates, the national rate has been included which allows a comparison that takes this in to account. This provides a comparison against the national rate as well as the 14 trusts selected for the review.
The Trust’s new pressure ulcer rate was below the national rate for nine of the 12 months shown.
However, the total pressure ulcer prevalence rate has been higher than the national rate for ten months which may highlight an area for review.
Slide 48
New pressure ulcer analysis
Apr-12 May-12 Jun-12 Jul-12 Aug-12 Sep-12 Oct-12 Nov-12 Dec-12 Jan-13 Feb-13 Mar-13
Number of records submitted 569 600 540 645 621 570 632 610 537 585 585 498
Trust new pressure ulcers 2 1 5 11 8 5 6 5 8 11 6 6
Trust new pressure ulcer rate 0.4% 0.2% 0.9% 1.7% 1.3% 0.9% 0.9% 0.8% 1.5% 1.9% 1.0% 1.2%
Selected 14 Trusts new pressure
ulcer rate 1.4% 1.5% 1.4% 1.5% 1.5% 0.9% 1.0% 1.1% 0.9% 1.1% 1.0% 1.2%
National new pressure ulcer rate 1.7% 1.7% 1.5% 1.5% 1.4% 1.3% 1.2% 1.2% 1.2% 1.3% 1.3% 1.3%
Total pressure ulcer prevalence percentage
Apr-12 May-12 Jun-12 Jul-12 Aug-12 Sep-12 Oct-12 Nov-12 Dec-12 Jan-13 Feb-13 Mar-13
Number of records submitted 569 600 540 645 621 570 632 610 537 585 585 498
Trust total pressure ulcers 42 25 31 45 41 37 37 55 33 60 28 39
Trust total pressure ulcer rate 7.4% 4.2% 5.7% 7.0% 6.6% 6.5% 5.9% 9.0% 6.1% 10.3% 4.8% 7.8%
Selected 14 Trusts total pressure
ulcer rate 6.4% 6.2% 6.5% 7.0% 6.3% 5.5% 5.4% 5.9% 5.8% 6.0% 5.7% 6.2%
National total pressure ulcer rate 6.8% 6.7% 6.6% 6.1% 6.0% 5.5% 5.4% 5.3% 5.2% 5.4% 5.6% 5.3%
Source: Safety Thermometer Apr 12 to Mar 13
7.4%
4.2%
5.7%
7.0% 6.6% 6.5%
5.9%
9.0%
6.1%
10.3%
4.8%
7.8%
0.0%
2.0%
4.0%
6.0%
8.0%
10.0%
12.0%
-
10
20
30
40
50
60
70
Total pressure ulcers prevalence
Category 2 Category 3 Category 4 Rate
0.4%
0.2%
0.9%
1.7%
1.3%
0.9% 0.9%
0.8%
1.5%
1.9%
1.0%
1.2%
0.0%
0.2%
0.4%
0.6%
0.8%
1.0%
1.2%
1.4%
1.6%
1.8%
2.0%
-
2
4
6
8
10
12
New pressure ulcers prevalence
Category 2 Category 3 Category 4 Rate
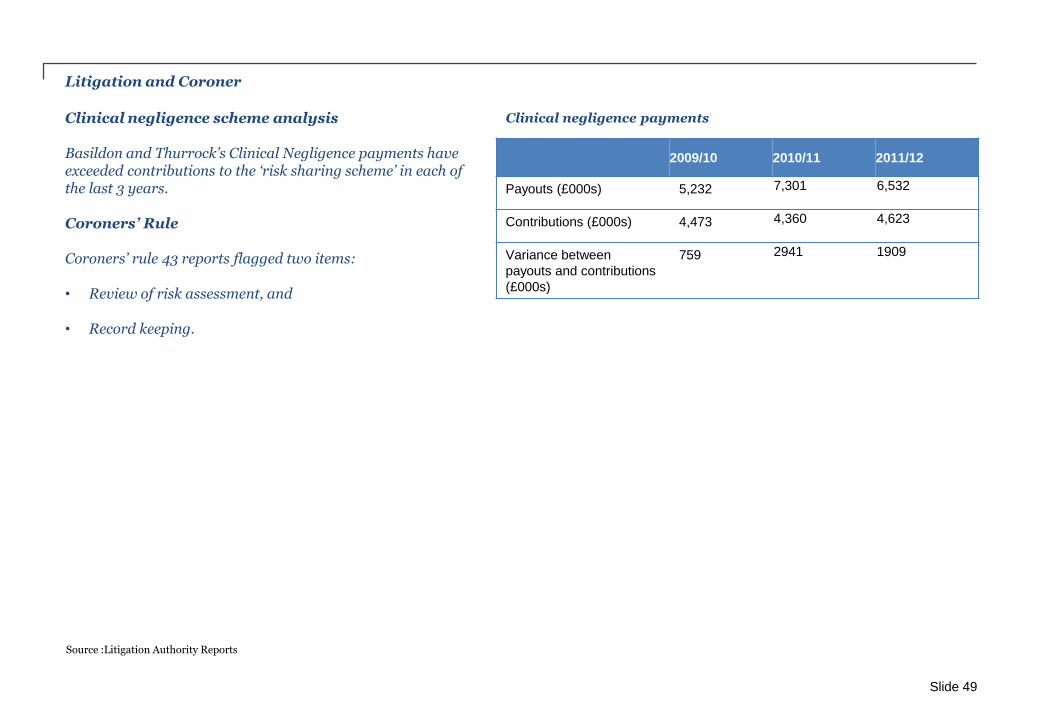
Litigation and Coroner
Clinical negligence payments Clinical negligence scheme analysis Basildon and Thurrock’s Clinical Negligence payments have exceeded contributions to the ‘risk sharing scheme’ in each of the last 3 years. Coroners’ Rule Coroners’ rule 43 reports flagged two items: • Review of risk assessment, and • Record keeping.
Slide 49
2009/10 2010/11 2011/12
Payouts (£000s) 5,232 7,301 6,532
Contributions (£000s) 4,473 4,360 4,623
Variance between
payouts and contributions
(£000s)
759 2941 1909
Source :Litigation Authority Reports
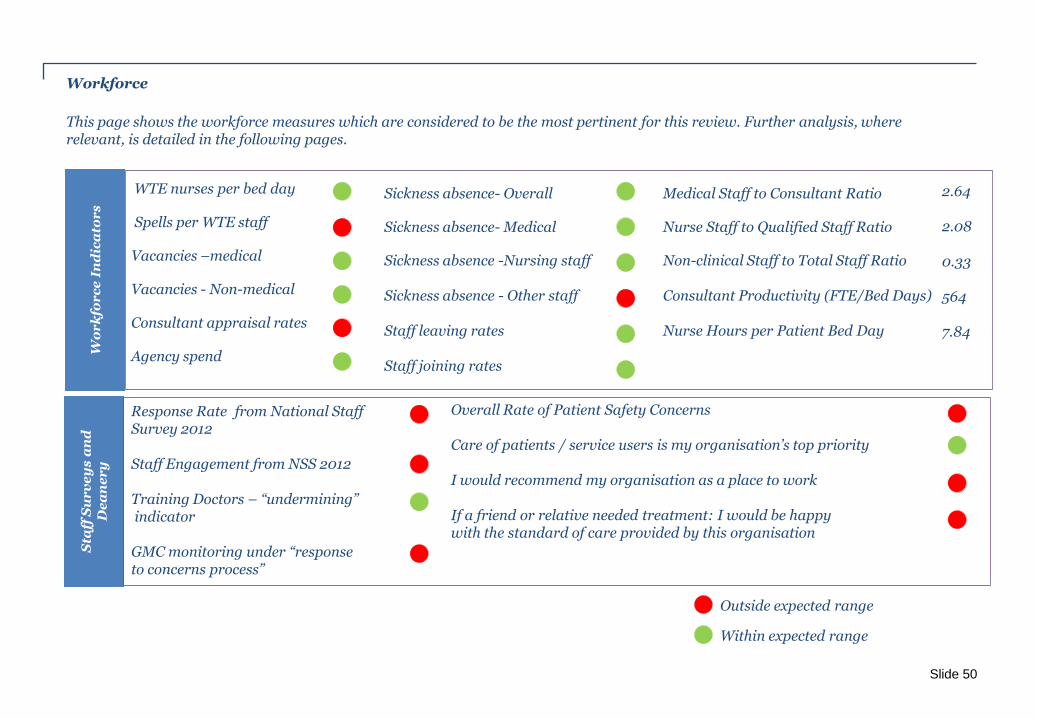
Workforce W
or
kfo
rc
e I
nd
ica
tor
s
Outcome 1 (R17) Respecting and involving e who u se services
WTE nurses per bed day
Spells per WTE staff
Vacancies –medical
Vacancies - Non-medical
Consultant appraisal rates
Agency spend
Outside expected range
Within expected range
Sta
ff S
ur
ve
ys
an
d
De
an
er
y
x
Sickness absence- Overall
Sickness absence- Medical
Sickness absence -Nursing staff Sickness absence - Other staff Staff leaving rates Staff joining rates
Response Rate from National Staff Survey 2012 Staff Engagement from NSS 2012 Training Doctors – “undermining” indicator GMC monitoring under “response to concerns process”
This page shows the workforce measures which are considered to be the most pertinent for this review. Further analysis, where relevant, is detailed in the following pages.
Slide 50
Overall Rate of Patient Safety Concerns Care of patients / service users is my organisation’s top priority I would recommend my organisation as a place to work If a friend or relative needed treatment: I would be happy with the standard of care provided by this organisation
Medical Staff to Consultant Ratio
Nurse Staff to Qualified Staff Ratio
Non-clinical Staff to Total Staff Ratio Consultant Productivity (FTE/Bed Days) Nurse Hours per Patient Bed Day
2.64 2.08 0.33 564 7.84

Ca
rd
io-t
ho
ra
cic
Su
rg
er
y
Overall satisfaction
Clinical supervision
Workload
Handover
Adequate experience
Educational supervision
Feedback
Induction
Undermining
Access to educational resource
Local teaching
Study leave
Regional teaching
General Medical Council (GMC) National Training Scheme Survey 2012
The below summarises the output from the General Medical Council National Training Scheme 2012 Survey Results Given the volume of data only specialties with red outliers are noted below (where those specialties also have green outliers, they are included).
Slide 51 Red outlier Within expected range Green outlier
Ob
ste
tric
s a
nd
Gy
ne
co
log
y
Overall satisfaction
Clinical supervision
Workload
Handover
Adequate experience
Educational supervision
Feedback
Induction
Undermining
Access to educational resource
Local teaching
Study leave
Regional teaching
Tr
au
ma
an
d O
rth
op
ae
dic
Su
rg
er
y Overall satisfaction
Clinical supervision
Workload
Handover
Adequate experience
Educational supervision
Feedback
Induction
Undermining
Access to educational resource
Local teaching
Study leave
Regional teaching
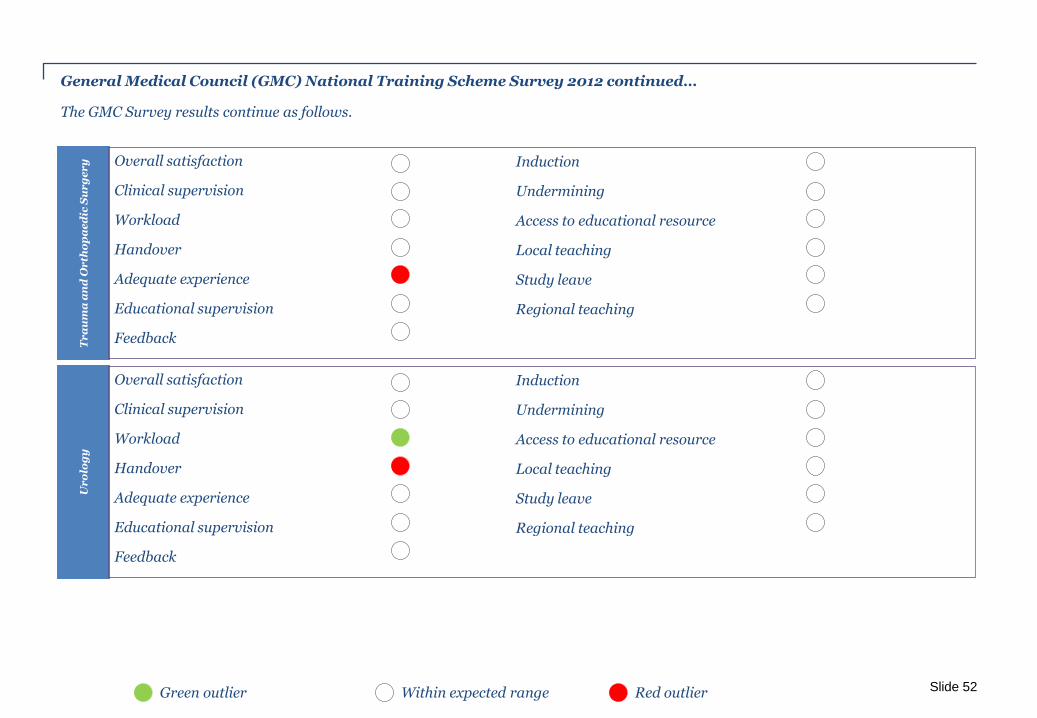
General Medical Council (GMC) National Training Scheme Survey 2012 continued…
The GMC Survey results continue as follows.
Slide 52 Red outlier Within expected range Green outlier
Ur
olo
gy
Overall satisfaction
Clinical supervision
Workload
Handover
Adequate experience
Educational supervision
Feedback
Induction
Undermining
Access to educational resource
Local teaching
Study leave
Regional teaching
Basildon and Thurrock 27
0
5
10
15
20
25
30
35
40
45
50
Spells
per
WT
E
Spells per WTE for Acute Trusts
Trusts covered by review All Trusts
Agency Staff (2011/12)
Basildon
Expenditure
Percentage of
Total Staff Costs
Median within
Region
£6.5m 3.9% 4.6%
Number of FTEs (Dec 11-Nov 12 average) 3,720
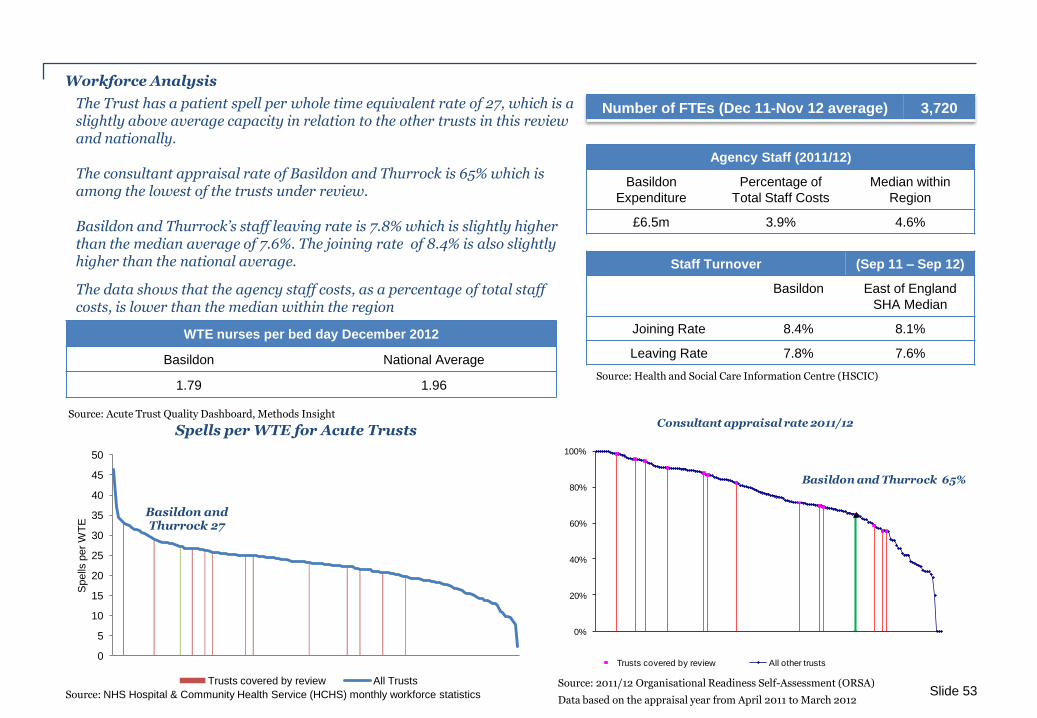
Workforce Analysis
Slide 53 Source: NHS Hospital & Community Health Service (HCHS) monthly workforce statistics
The Trust has a patient spell per whole time equivalent rate of 27, which is a slightly above average capacity in relation to the other trusts in this review and nationally. The consultant appraisal rate of Basildon and Thurrock is 65% which is among the lowest of the trusts under review. Basildon and Thurrock’s staff leaving rate is 7.8% which is slightly higher than the median average of 7.6%. The joining rate of 8.4% is also slightly higher than the national average.
The data shows that the agency staff costs, as a percentage of total staff costs, is lower than the median within the region
Staff Turnover (Sep 11 – Sep 12)
Basildon East of England
SHA Median
Joining Rate 8.4% 8.1%
Leaving Rate 7.8% 7.6%
Source: Health and Social Care Information Centre (HSCIC)
WTE nurses per bed day December 2012
Basildon National Average
1.79 1.96
Source: Acute Trust Quality Dashboard, Methods Insight
Basildon
0%
20%
40%
60%
80%
100%
Consultant appraisal rate, 2011/12
Trusts covered by review All other trusts Basildon
Consultant appraisal rate 2011/12
Basildon and Thurrock 65%
Source: 2011/12 Organisational Readiness Self-Assessment (ORSA)
Data based on the appraisal year from April 2011 to March 2012
Workforce Analysis continued…
Slide 54
Sickness Absence Rates (2011-2012)
Basildon and
Thurrock
East of England
SHA Average
National Average
All Staff 3.67% 4.03% 4.12%
Sickness Absence Rates by Staff Category (Dec 12)
Basildon and Thurrock National Average
Medical Staff 1.0% 1.3%
Nursing Staff 4.8% 4.8%
Other Staff 4.9% 4.7%
Source: Health and Social Care Information Centre (HSCIC)
Source: Acute Trust Quality Dashboard, Methods Insight
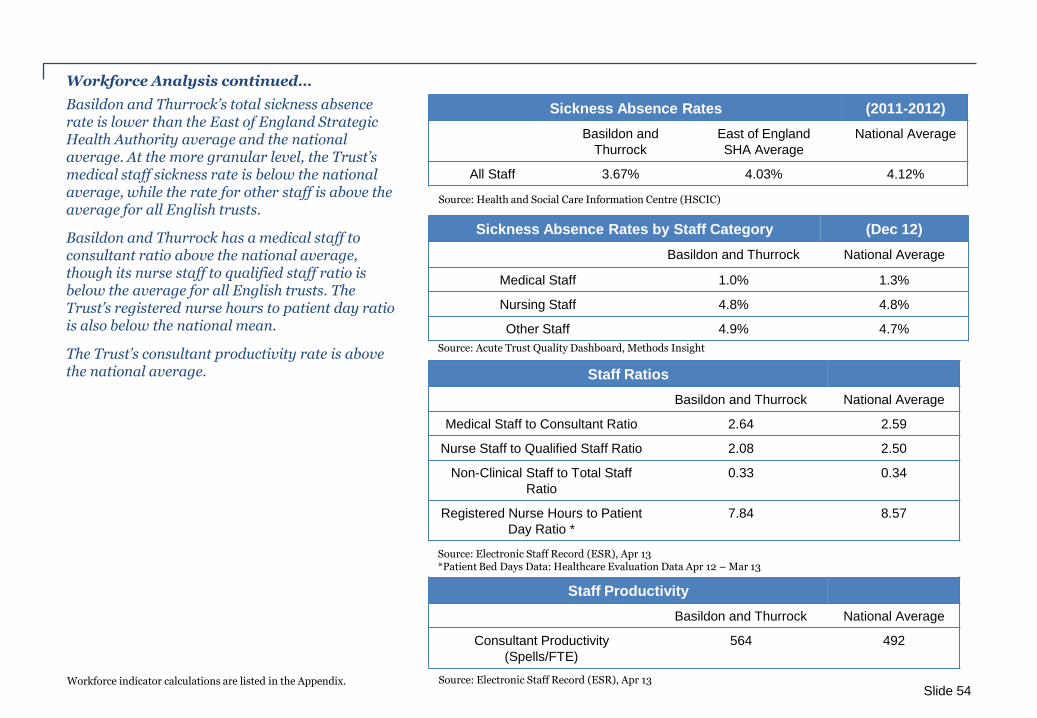
Basildon and Thurrock’s total sickness absence rate is lower than the East of England Strategic Health Authority average and the national average. At the more granular level, the Trust’s medical staff sickness rate is below the national average, while the rate for other staff is above the average for all English trusts.
Basildon and Thurrock has a medical staff to consultant ratio above the national average, though its nurse staff to qualified staff ratio is below the average for all English trusts. The Trust’s registered nurse hours to patient day ratio is also below the national mean.
The Trust’s consultant productivity rate is above the national average.
Staff Ratios
Basildon and Thurrock National Average
Medical Staff to Consultant Ratio 2.64 2.59
Nurse Staff to Qualified Staff Ratio 2.08 2.50
Non-Clinical Staff to Total Staff
Ratio
0.33 0.34
Registered Nurse Hours to Patient
Day Ratio *
7.84 8.57
Source: Electronic Staff Record (ESR), Apr 13 *Patient Bed Days Data: Healthcare Evaluation Data Apr 12 – Mar 13
Staff Productivity
Basildon and Thurrock National Average
Consultant Productivity
(Spells/FTE)
564 492
Source: Electronic Staff Record (ESR), Apr 13 Workforce indicator calculations are listed in the Appendix.
Workforce Analysis continued…
Slide 55
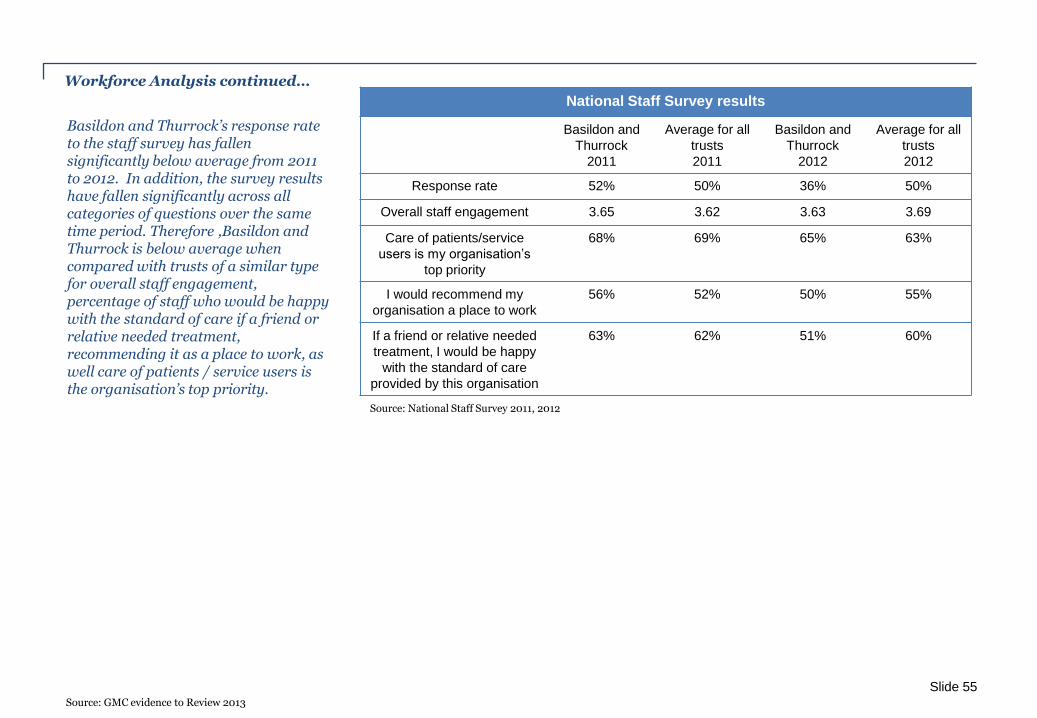
Basildon and Thurrock’s response rate to the staff survey has fallen significantly below average from 2011 to 2012. In addition, the survey results have fallen significantly across all categories of questions over the same time period. Therefore ,Basildon and Thurrock is below average when compared with trusts of a similar type for overall staff engagement, percentage of staff who would be happy with the standard of care if a friend or relative needed treatment, recommending it as a place to work, as well care of patients / service users is the organisation’s top priority.
National Staff Survey results
Basildon and
Thurrock
2011
Average for all
trusts
2011
Basildon and
Thurrock
2012
Average for all
trusts
2012
Response rate 52% 50% 36% 50%
Overall staff engagement 3.65 3.62 3.63 3.69
Care of patients/service
users is my organisation’s
top priority
68% 69% 65% 63%
I would recommend my
organisation a place to work
56% 52% 50% 55%
If a friend or relative needed
treatment, I would be happy
with the standard of care
provided by this organisation
63% 62% 51% 60%
Source: GMC evidence to Review 2013
Source: National Staff Survey 2011, 2012

Deanery
The trust has been under scrutiny from the GMC and the CQC for a number of years. Education concerns have related to training in Trauma and Orthopaedic Surgery, Anaesthetics and Obstetrics and Gynaecology, and Emergency Medicine. Significant improvement has been made in most of these areas since 2010, although the trust is still being monitored under our response to concerns process.
National Training Scheme (NTS) Outliers – Programme Groups by Trust/Board between 2010-12
Trauma and Orthopaedic Surgery and Anaesthetics were the programme groups with the most below outliers between 2010 and 2012. Paediatrics received the most above outliers during this period. Perceptions of doctors in training improved in 2012, with fewer below outliers reported compared to previous years.
NTS 2012 Patient Safety Comments
10 doctors in training commented, representing 6.13% of respondents. This was higher than the national average of 4.7%. Their concerns, which were raised in relation to specific training posts, and may apply to a single or multiple departments, related to:
• Low staffing levels, especially at night;
• Shortage of beds resulting in patients being frequently moved, with poor patient tracking systems;
• Shortage of equipment (esp. clinical escalation area);
• Locum doctors of variable ability; and
• Not enough senior support.
Deanery Reports
The Deanery returns for 2011 and 2012 identified the levels of non-Registrar middle grade support for doctors in training in the Emergency Department as being a concern. The substantial numbers of below outliers from Anaesthetic doctors in training of all grades from the NTS were also recorded as a concern.
Source: GMC evidence to Review 2013
Slide 56

Monitored under the response to concerns process?
Yes, Basildon and Thurrock University Foundation Trust has been monitored through the response to concerns process since October 2009, when the CQC highlighted serious issues at this Trust including high mortality rates and issues around governance.
Deanery Action
• The Deanery undertook a series of visits to the site to consider the general training experience at the Trust.
• Issues were identified around the management of acute patients, handover, formal teaching, and supervision of F1 Doctors.
• Action planning at the time indicated improvement.
• In February 2011, the Deanery reported that a new Clinical Tutor had been appointed, that the Head of School for O&G was addressing ‘Consultant undermining’ that arose from the survey. Undermining is behaviour that subverts, weakens or wears away confidence.
• In late 2011/2012, the Foundation School had a further positive visit, and an exceptional visit to Trauma and Orthopaedics was undertaken as a number of issues had been identified, some of which related to the interface of programmes with the London Deanery. The issue is complex as some of the foundation doctors in training come from London but the East of England Deanery manage the environment.
• The Deanery undertook a Paediatric School visit to the Trust in December 2012, which indicated that doctors in training were having a good educational experience, and no patient safety issues were identified.
• 2012 survey results indicate improvement across all areas, and the site is not considered to be an outlier within the region, other than the slightly higher number of patient safety concerns raised by doctors in training.
• The Deanery is managing issues that arose during a Foundation school visit (28 February 2013) regarding supervision in the Emergency Department.
GMC Action
• GMC have contributed to four risk summits on this Trust since September 2012, and
• GMC are monitoring annual deanery reports, Deanery visit reports, and Trust action plans.
Slide 57
Source: GMC evidence to Review 2013
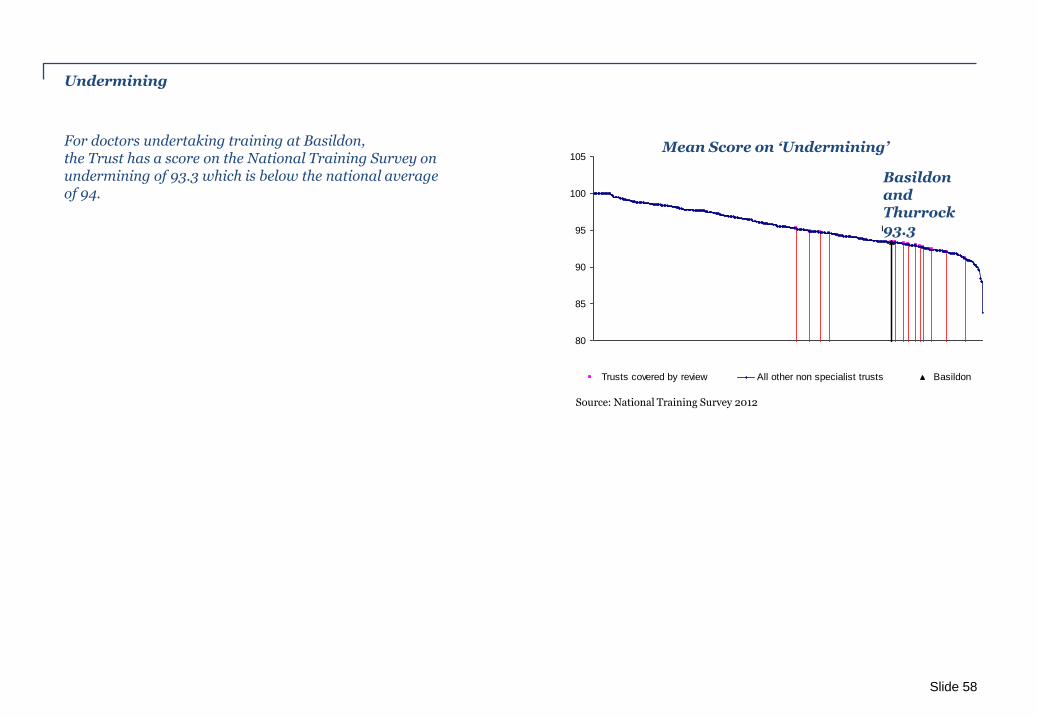
Undermining
For doctors undertaking training at Basildon, the Trust has a score on the National Training Survey on undermining of 93.3 which is below the national average of 94.
Slide 58
Mean Score on 'Undermining'
Basildon
80
85
90
95
100
105
Trusts covered by review All other non specialist trusts Basildon
Mean Score on ‘Undermining’
Basildon and Thurrock 93.3
Source: National Training Survey 2012

Clinical and operational effectiveness
Slide 59

Clinical and Operational Effectiveness
Overview:
The following section will provide an insight in to the Trust’s clinical and operational performance based on nationally recognised key performance indicators.
Review Areas:
To undertake a detailed analysis of the Trust’s clinical and operational performance it is necessary to review the following areas:
• Clinical Effectiveness;
• Operational Effectiveness; and
• Patient Reported Outcome Measures (PROMs) for the review areas.
Data Sources:
• Clinical Audit Data Trust, CQC Data Submission;
• Healthcare Evaluation Data (HED), Jan – Dec 2012;
• Department of Health;
• Cancer Waits Database, Q3, 2012-13; and
• PROMs Dashboard.
Summary:
With 92.3% of A&E patients seen within 4 hours, which is below the 95% target level, Basildon and Thurrock have one of the lowest percentages from the selected trusts in the review. In addition to this, the percentage of patients seen within 4 hours is falling. Similarly, a recent downturn means that only 89% of patients are seen within the 18 week target time (RTT) which is lower than the target level and places them as one of the lowest amongst the trusts being reviewed.
The Trust’s crude readmission rate is the lowest readmission rate of all the trusts in the review. The readmission rate of 8.9% is in the upper quartile of the trusts covered by this review. Basildon and Thurrock also have the lowest standardised readmission rate of the 14 selected trusts and are shorter than the national mean average length of stay. The PROMS dashboard shows that Basildon and Thurrock is in line with the average across procedures covered by PROMS. The average health gain from Hip Replacement declined in each of the last two years, and the Trust is now close to the lower control limit (outcomes less good than average).
Slide 60
All data and sources used are consistent across the packs for the 14 trusts included in this review.

Outcome 1 (R17) Respecting and involving people who use services
Clinical and Operational Effectiveness
Outside expected range
Within expected range
This page shows measures of clinical and operational effectiveness which are considered to be the most pertinent for this review. The items displayed below are analysed in more detail in the following pages where they are deemed to be relevant for this review.
Neonatal – women receiving steroids Coronary angioplasty Heart failure
Adult Critical care Peripheral vascular surgery Lung cancer
Diabetes safety/ effectiveness Carotid interventions Bowel cancer
PROMS safety/ effectiveness Acute MI Hip fracture - mortality
Joints – revision ratio Acute stroke Severe trauma
Elective Surgery
Cli
nic
al
eff
ec
tiv
en
es
s
O
pe
ra
tio
na
l E
ffe
cti
ve
ne
ss
x RTT Waiting Times Cancelled Operations
Emergency readmissions PbR Coding Audit
Cancer Waits
A&E Waits
PR
OM
s
Da
sh
bo
ar
d
Hip Replacement EQ-5D
Knee Replacement EQ-5D
Varicose Vein EQ-5D
Hip Replacement OHS
Knee Replacement OKS
Groin Hernia EQ-5D
Slide 61
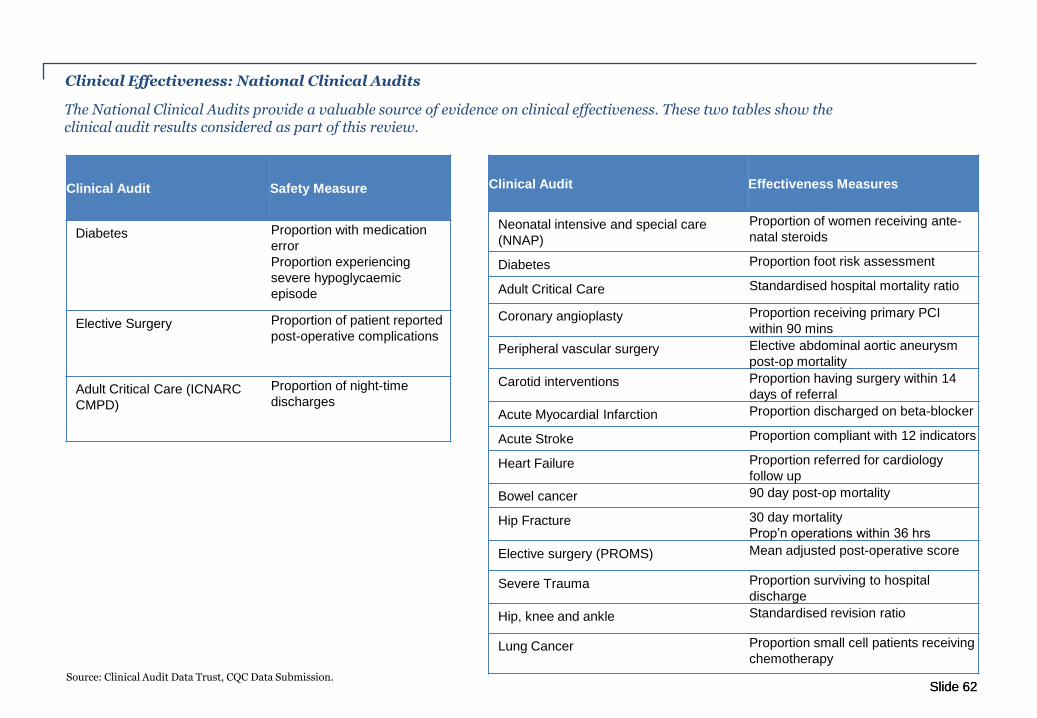
Clinical Effectiveness: National Clinical Audits
The National Clinical Audits provide a valuable source of evidence on clinical effectiveness. These two tables show the clinical audit results considered as part of this review.
Slide 62
Clinical Audit Safety Measure
Diabetes Proportion with medication
error
Proportion experiencing
severe hypoglycaemic
episode
Elective Surgery Proportion of patient reported
post-operative complications
Adult Critical Care (ICNARC
CMPD)
Proportion of night-time
discharges
Clinical Audit Effectiveness Measures
Neonatal intensive and special care
(NNAP)
Proportion of women receiving ante-
natal steroids
Diabetes Proportion foot risk assessment
Adult Critical Care Standardised hospital mortality ratio
Coronary angioplasty Proportion receiving primary PCI
within 90 mins
Peripheral vascular surgery Elective abdominal aortic aneurysm
post-op mortality
Carotid interventions Proportion having surgery within 14
days of referral
Acute Myocardial Infarction Proportion discharged on beta-blocker
Acute Stroke Proportion compliant with 12 indicators
Heart Failure Proportion referred for cardiology
follow up
Bowel cancer 90 day post-op mortality
Hip Fracture 30 day mortality
Prop’n operations within 36 hrs
Elective surgery (PROMS) Mean adjusted post-operative score
Severe Trauma Proportion surviving to hospital
discharge
Hip, knee and ankle Standardised revision ratio
Lung Cancer Proportion small cell patients receiving
chemotherapy
Slide 62 Source: Clinical Audit Data Trust, CQC Data Submission.
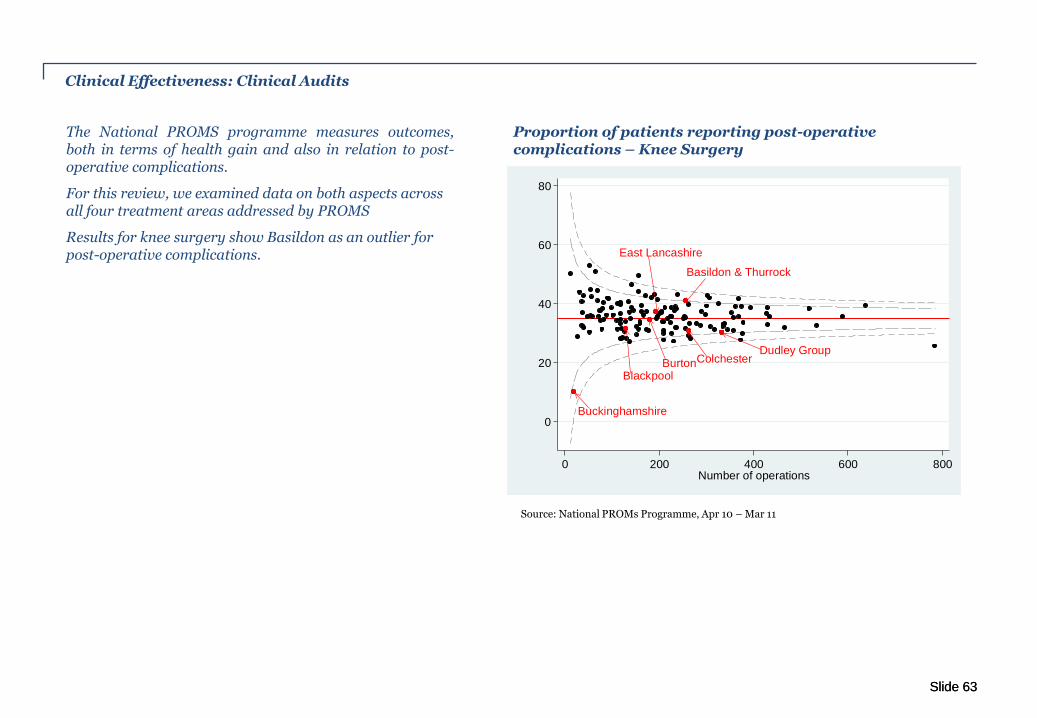
Clinical Effectiveness: Clinical Audits
The National PROMS programme measures outcomes, both in terms of health gain and also in relation to post-operative complications.
For this review, we examined data on both aspects across all four treatment areas addressed by PROMS
Results for knee surgery show Basildon as an outlier for post-operative complications.
Slide 63
Proportion of patients reporting post-operative complications – Knee Surgery
Basildon & Thurrock
Blackpool
Buckinghamshire
BurtonColchester Dudley Group
East Lancashire
0
20
40
60
80
% w
ith c
om
plic
atio
ns in
kn
ee
su
rge
ry
0 200 400 600 800Number of operations
Slide 63
Source: National PROMs Programme, Apr 10 – Mar 11
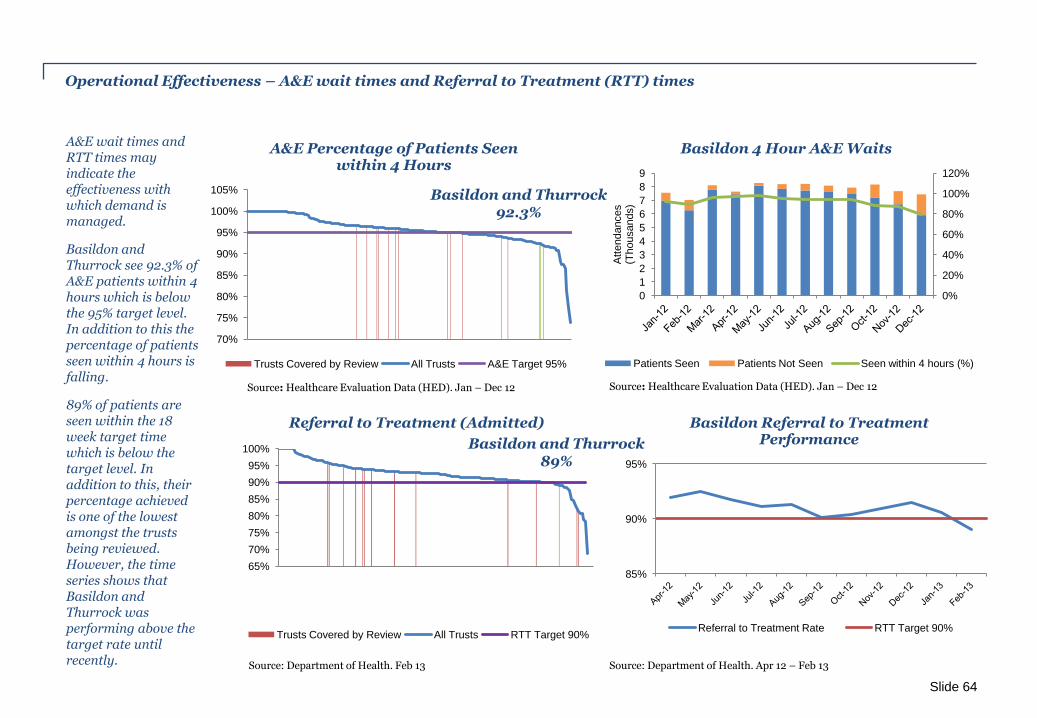
A&E wait times and RTT times may indicate the effectiveness with which demand is managed.
Basildon and Thurrock see 92.3% of A&E patients within 4 hours which is below the 95% target level. In addition to this the percentage of patients seen within 4 hours is falling.
89% of patients are seen within the 18 week target time which is below the target level. In addition to this, their percentage achieved is one of the lowest amongst the trusts being reviewed. However, the time series shows that Basildon and Thurrock was performing above the target rate until recently.
Operational Effectiveness – A&E wait times and Referral to Treatment (RTT) times
70%
75%
80%
85%
90%
95%
100%
105%
A&E Percentage of Patients Seen within 4 Hours
Trusts Covered by Review All Trusts A&E Target 95%
0%
20%
40%
60%
80%
100%
120%
0
1
2
3
4
5
6
7
8
9
Att
endances
(Th
ousands)
Basildon 4 Hour A&E Waits
Patients Seen Patients Not Seen Seen within 4 hours (%)
Basildon and Thurrock 92.3%
Source: Healthcare Evaluation Data (HED). Jan – Dec 12
Source: Department of Health. Feb 13 Source: Department of Health. Apr 12 – Feb 13
65%
70%
75%
80%
85%
90%
95%
100%
Referral to Treatment (Admitted)
Trusts Covered by Review All Trusts RTT Target 90%
85%
90%
95%
Basildon Referral to Treatment Performance
Referral to Treatment Rate RTT Target 90%
Basildon and Thurrock 89%
Slide 64
Source: Healthcare Evaluation Data (HED). Jan – Dec 12

Readmission rates may indicate the appropriateness of treatment offered, whilst average length of stay may indicate the efficiency of treatment.
Basildon and Thurrock’s crude readmission rate is the lowest readmission rate of the trusts in the review at 8.9% and is in the upper quartile of trusts nationally.
The standardised readmission rate most importantly accounts for the Trust’s case mix and shows Basildon and Thurrock are statistically lower than expected having the lowest standardised readmission rate of the 14 selected trusts.
Basildon and Thurrock’s average length of stay is 4.6 days, which is shorter than the national mean average of 5.2 days.
Operational Effectiveness – Emergency Re-admissions and Length of Stay
Basildon and
Thurrock 8.9%
0%
5%
10%
15%
20%
25%
Cru
de R
eadm
issio
n R
ate
Crude Readmission Rate by Trust
Trusts Covered by Review All Trusts
Basildon and Thurrock
4.6
0
2
4
6
8
10
Spell
Dura
tio
n (
Days)
Average Length of Stay by Trust
Trusts Covered by Review All Trusts
Basildon and Thurrock
Selected trusts Outside Selected trusts w/in Range
Standardised 30-day Readmission Rate
Slide 65 Source: Healthcare Evaluation Data (HED); Jan 12 – Dec 12
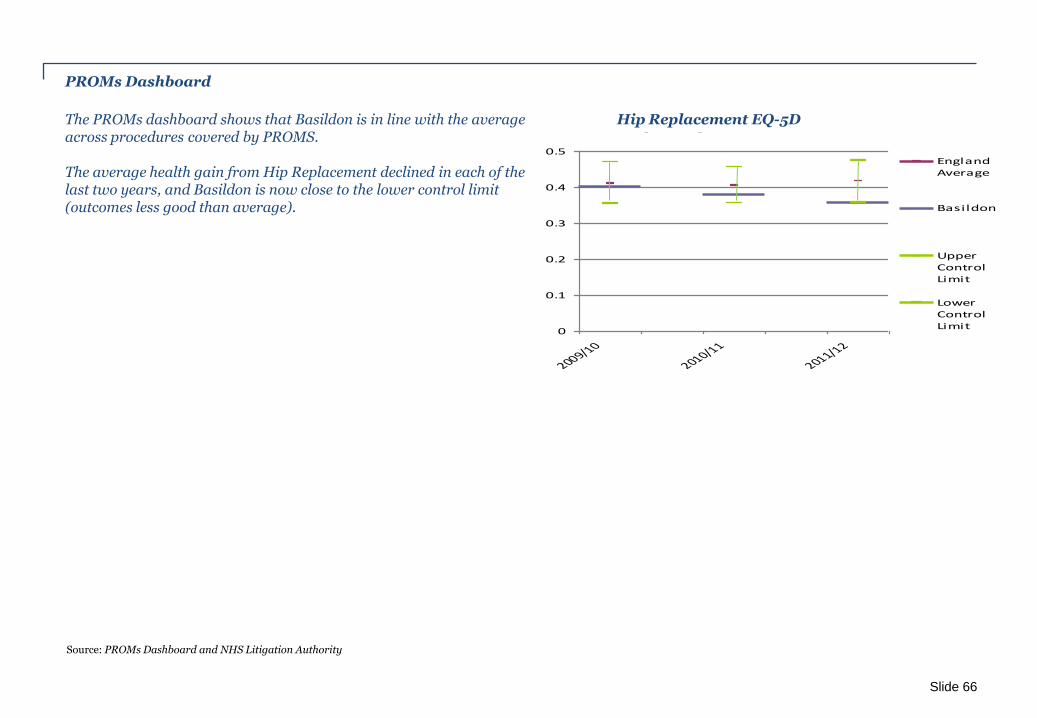
PROMs Dashboard
Hip Replacement EQ-5D
0
0.1
0.2
0.3
0.4
0.5
2009/10
2010/11
2011/12
EnglandAverage
Basildon
UpperControlLimit
LowerControlLimit
The PROMs dashboard shows that Basildon is in line with the average across procedures covered by PROMS. The average health gain from Hip Replacement declined in each of the last two years, and Basildon is now close to the lower control limit (outcomes less good than average).
Slide 66
Source: PROMs Dashboard and NHS Litigation Authority
Hip Replacement EQ-5D

Leadership and governance
Slide 67
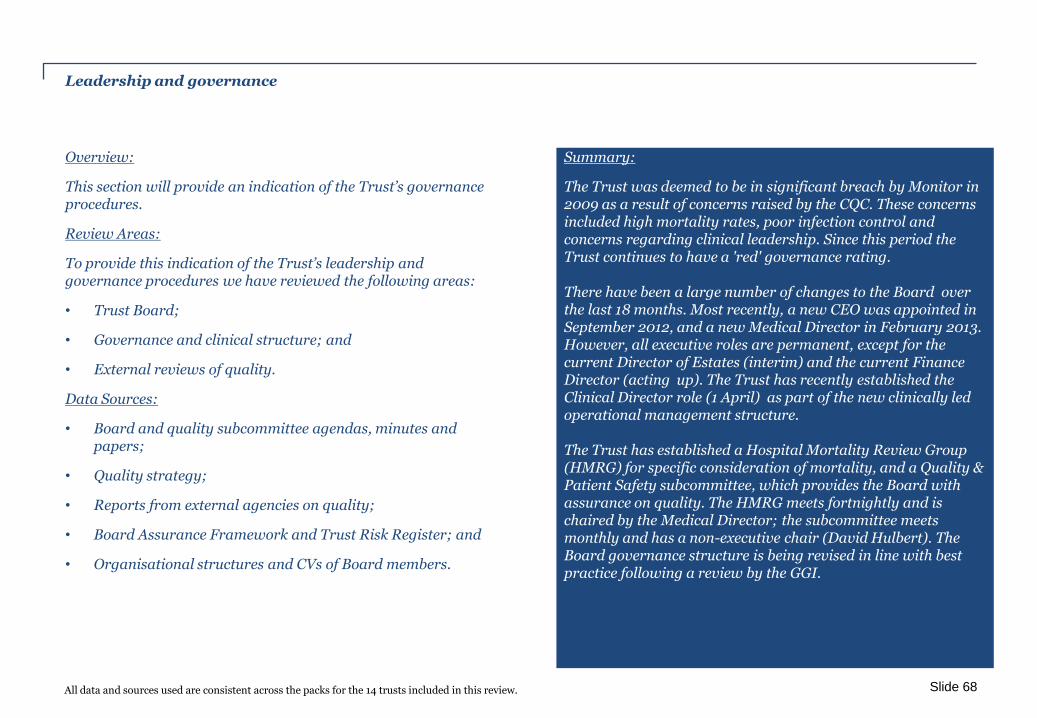
Leadership and governance
Overview:
This section will provide an indication of the Trust’s governance procedures.
Review Areas:
To provide this indication of the Trust’s leadership and governance procedures we have reviewed the following areas:
• Trust Board;
• Governance and clinical structure; and
• External reviews of quality.
Data Sources:
• Board and quality subcommittee agendas, minutes and papers;
• Quality strategy;
• Reports from external agencies on quality;
• Board Assurance Framework and Trust Risk Register; and
• Organisational structures and CVs of Board members.
Summary:
The Trust was deemed to be in significant breach by Monitor in 2009 as a result of concerns raised by the CQC. These concerns included high mortality rates, poor infection control and concerns regarding clinical leadership. Since this period the Trust continues to have a 'red' governance rating. There have been a large number of changes to the Board over the last 18 months. Most recently, a new CEO was appointed in September 2012, and a new Medical Director in February 2013. However, all executive roles are permanent, except for the current Director of Estates (interim) and the current Finance Director (acting up). The Trust has recently established the Clinical Director role (1 April) as part of the new clinically led operational management structure. The Trust has established a Hospital Mortality Review Group (HMRG) for specific consideration of mortality, and a Quality & Patient Safety subcommittee, which provides the Board with assurance on quality. The HMRG meets fortnightly and is chaired by the Medical Director; the subcommittee meets monthly and has a non-executive chair (David Hulbert). The Board governance structure is being revised in line with best practice following a review by the GGI.
Slide 68 All data and sources used are consistent across the packs for the 14 trusts included in this review.

Monitor governance risk rating CQC Outcome 16 - Moderate concern
Monitor finance rating 3 CQC Outcome 10 - Moderate concern
CQC Outcome 4 - Minor concern
CQC Outcome 8 - Minor concern
Le
ad
er
sh
ip a
nd
g
ov
er
na
nc
e
This page shows the latest rating against regulatory standards, the items rated ‘red’ or ‘amber’ below are discussed in more detail in the following pages.
Slide 69
Governance risk rating CQC Concerns Red - Likely or actual significant breach of terms of authorisation Red – Major concern Amber-red - Material concerns surrounding terms of authorisation Amber – Minor or Moderate concern Amber-green - Limited concerns surrounding terms of authorisation Green – No concerns Green - No material concerns Financial risk rating rated 1-5, where 1 represents the highest risk and 5 the lowest
Leadership and governance
Leadership and governance
Trust Board
There have been a large number of changes to the Board over the last 18 months. Most recently, a new CEO was appointed in Sep 2012, and a new Medical Director in Feb 2013. All executive roles are permanent, except the Director of Estates (interim) and Finance Director (acting up).
Governance and clinical structures
The Trust is in a period of change with their operational and governance structures. On 1 April 2013 they moved to a new clinically led operational management structure. The Trust now has five clinical divisions; Women & Children's, Surgical Services, Acute Medicine, General Medicine and CTC , led by Clinical Directors (see Appendix A).
The Trust has established a Hospital Mortality Review Group (HMRG) for specific consideration of mortality, and a Quality & Patient Safety subcommittee, which provides the Board with assurance on quality. The HMRG meets fortnightly and is chaired by the Medical Director; the subcommittee meets monthly and has a non-executive chair (David Hulbert). The Board governance structure is being revised in line with best practice following a review by the GGI (see Appendix B for current structure).
External reviews
The Trust was placed in significant breach of the terms of their authorisation by Monitor in 2009, as a result of concerns raised by the CQC, high mortality rates, poor infection control (2009) and concerns regarding clinical leadership. At the time of the RRRs the Trust remains in significant breach with Monitor and has 2 minor concerns and 2 moderate concerns resulting from a CQC inspection in January 2013.
There have been a number of external reviews since this period, conducted by teams including PwC, McKinsey and Good Governance Institute (GGI) all resulting in action plans. However, the Trust continues to have a 'red' governance rating scoring 4 in March 2013.
Slide 70 A diagram of operational and trust committee structure as well as a table of the Board of Directors can be found in the Appendix.
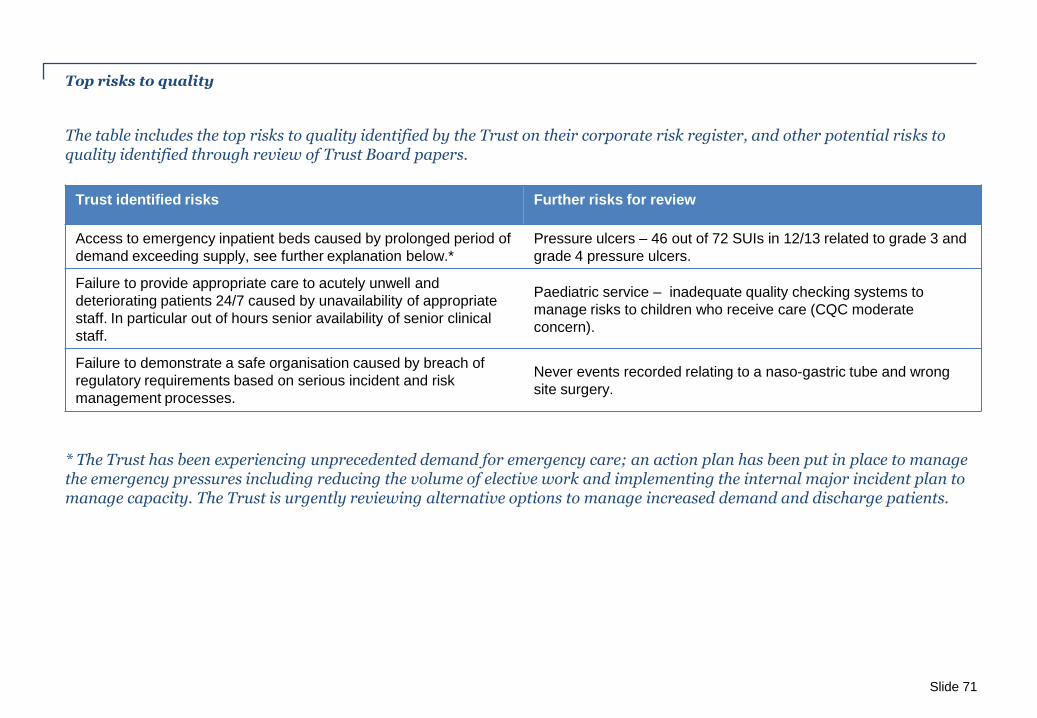
Top risks to quality
Trust identified risks Further risks for review
Access to emergency inpatient beds caused by prolonged period of
demand exceeding supply, see further explanation below.*
Pressure ulcers – 46 out of 72 SUIs in 12/13 related to grade 3 and
grade 4 pressure ulcers.
Failure to provide appropriate care to acutely unwell and
deteriorating patients 24/7 caused by unavailability of appropriate
staff. In particular out of hours senior availability of senior clinical
staff.
Paediatric service – inadequate quality checking systems to
manage risks to children who receive care (CQC moderate
concern).
Failure to demonstrate a safe organisation caused by breach of
regulatory requirements based on serious incident and risk
management processes.
Never events recorded relating to a naso-gastric tube and wrong
site surgery.
Slide 71
* The Trust has been experiencing unprecedented demand for emergency care; an action plan has been put in place to manage the emergency pressures including reducing the volume of elective work and implementing the internal major incident plan to manage capacity. The Trust is urgently reviewing alternative options to manage increased demand and discharge patients.
The table includes the top risks to quality identified by the Trust on their corporate risk register, and other potential risks to quality identified through review of Trust Board papers.

Leadership and governance – other areas for further review
External reviews
In January 2013 a CQC inspection resulted in a second warning notice being issued for Outcome 16: Assessing and monitoring the quality of service provision. The first warning notice was served by CQC on 14 November 2012 as the Trust did not have robust quality checking systems in place to manage risks to children who receive care. Although improvements have been made, there were not effective systems in place to identify, monitor and protect against identified risks at the time of the second inspection.
Following a number of serious incidents and the warning notice issued by the CQC, an external review of the operational and governance structures of paediatric services was commissioned. The review resulted in a number of immediate and medium term actions.
The two minor concerns that were raised related to Outcome 4: Care and welfare of people who use the services and Outcome 8: Cleanliness and infection control. For Outcome 4 it was identified that Children's assessment practices require development to ensure care and treatment is planned and delivered in a way that ensures their safety and welfare at all times. Following complaints from the public an inspection in relation to Outcome 8 identified that there were ineffective systems in place to reduce the risk and spread of infection.
In relation to Outcome 15, (Safety and Suitability of Premises), an inspection was undertaken to assess how the trust was managing the prevention and control of Legionella. The following was assessed:
The trust had taken acceptable actions to safely manage the prevention and control of hospital acquired Legionella; and
All relevant stakeholders in the process had concluded that the Trust is operating a water system that is under control and compliant and that the Trust has a robust system of assurance to monitor and mitigate any Legionella risk to patients, staff and visitors.
Further areas
A Quality and Safety turnaround programme is being implemented to sustainably improve the safety and quality of services provided by the Trust. Six workstreams had been set up; each clinically led, to look at the changes the Trust needs to make in high priority areas.
The Trust is in the lowest 25% of incident reporters compared to other medium acute Trusts. Actions are underway to strengthen the serious incident process in order to achieve compliance with the CQC regulatory framework, following a management review during January 2013.
Slide 72

Appendix
Slide 73
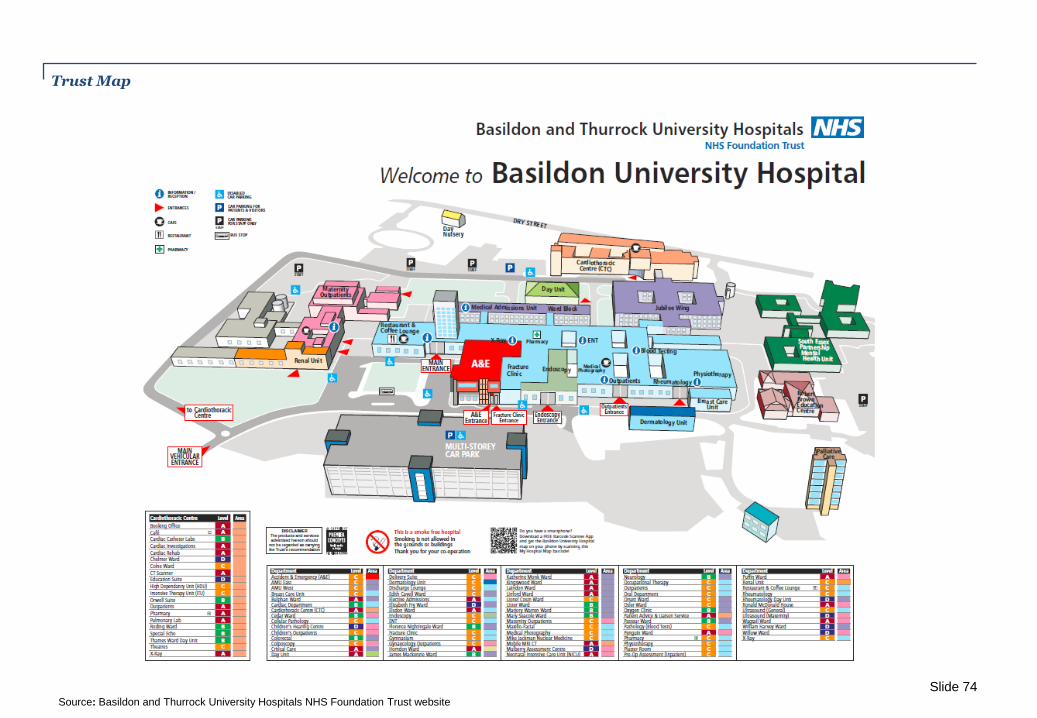
Trust Map
Slide 74 Source: Basildon and Thurrock University Hospitals NHS Foundation Trust website
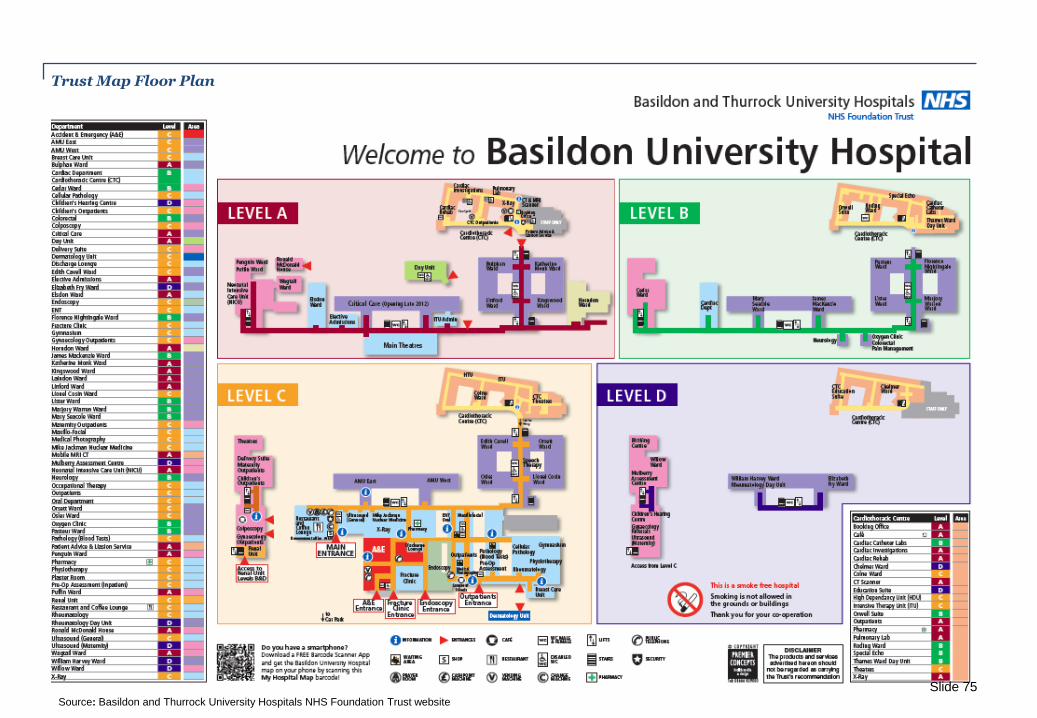
Trust Map Floor Plan
Slide 75 Source: Basildon and Thurrock University Hospitals NHS Foundation Trust website

Serious harm definition
A serious incident requiring investigation is defined as an incident that occurred in relation to NHS-funded services and care resulting in one of the following:
• Unexpected or avoidable death of one or more patients, staff, visitors or members of the public;
• Serious harm to one or more patients, staff, visitors or members of the public or where the outcome requires life-saving intervention, major surgical/medical intervention, permanent harm or will shorten life expectancy or result in prolonged pain or psychological harm (this includes incidents graded under the NPSA definition of severe harm);
• A scenario that prevents or threatens to prevent a provider organisation's ability to continue to deliver healthcare services, for example, actual or potential loss of personal/organisational information, damage to property, reputation or the environment, or IT failure;
• Allegations of abuse;
• Adverse media coverage or public concern about the organisation or the wider NHS; and
• One of the core set of "Never Events" as updated on an annual basis.
Slide 76
Source: UK National Screening Committee
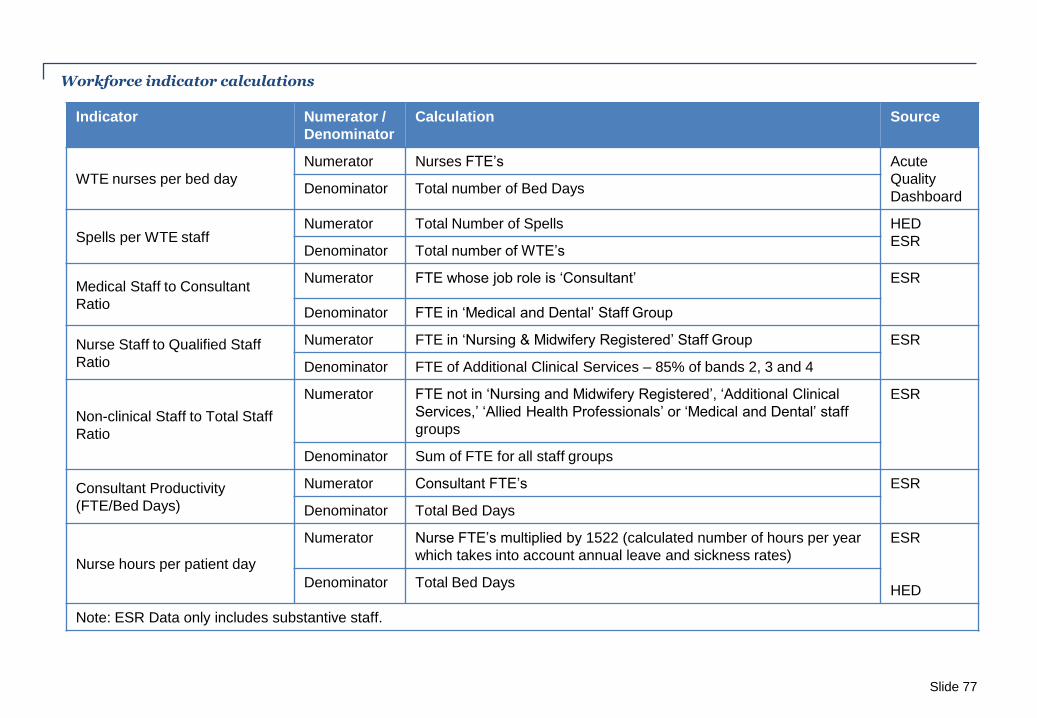
Workforce indicator calculations
Indicator Numerator /
Denominator
Calculation Source
WTE nurses per bed day
Numerator Nurses FTE’s Acute
Quality
Dashboard Denominator Total number of Bed Days
Spells per WTE staff Numerator Total Number of Spells HED
ESR Denominator Total number of WTE’s
Medical Staff to Consultant
Ratio
Numerator FTE whose job role is ‘Consultant’ ESR
Denominator FTE in ‘Medical and Dental’ Staff Group
Nurse Staff to Qualified Staff
Ratio
Numerator FTE in ‘Nursing & Midwifery Registered’ Staff Group ESR
Denominator FTE of Additional Clinical Services – 85% of bands 2, 3 and 4
Non-clinical Staff to Total Staff
Ratio
Numerator FTE not in ‘Nursing and Midwifery Registered’, ‘Additional Clinical
Services,’ ‘Allied Health Professionals’ or ‘Medical and Dental’ staff
groups
ESR
Denominator Sum of FTE for all staff groups
Consultant Productivity
(FTE/Bed Days)
Numerator Consultant FTE’s ESR
Denominator Total Bed Days
Nurse hours per patient day
Numerator Nurse FTE’s multiplied by 1522 (calculated number of hours per year
which takes into account annual leave and sickness rates)
ESR
HED Denominator Total Bed Days
Note: ESR Data only includes substantive staff.
Slide 77
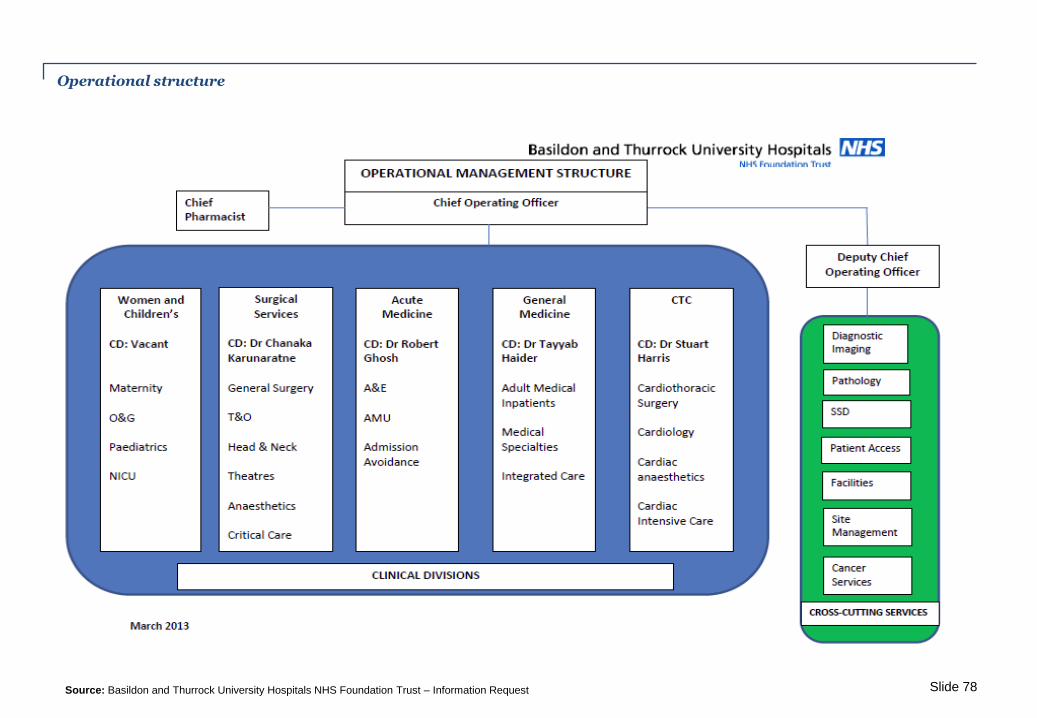
Slide 78
Operational structure
Source: Basildon and Thurrock University Hospitals NHS Foundation Trust – Information Request

Trust committee structure
Slide 79
Board of Directors
Charitable Funds
Committee
Investment Committee
Quality & Patient Safety
Committee
Finance Committee
Health & Safety
Committee
Council of Governors Nominations
Committee Remuneration
Committee
Clinical Quality Board. Right Place Right Time
Programme Board. Workforce Governance
Group. Equality and Diversity Management Group.
Cancer Board. Emergency Planning
Group. Business continuity
Group. H&S Management
Group.
Audit & risk
Committee
Operational Management
Board
Clinical Quality Board.
Infection control committee.
Patient Safety Steering Group.
Hospital Mortality
Review Group. Risk Steering
Group.
Health and Safety
Management Group
Legionella
Management Group
Clinical Quality Board
Source: Basildon and Thurrock University Hospitals NHS Foundation Trust – Information Request
Divisional Governance Meetings.
Clinical Audit Committee.
Hospital Transfusion Group.
Infection Control Committee . Information Governance Committee.
Resuscitation Committee.
Safeguarding Committee.
Dignity and Respect Action Group.
Medication Safety Group.
NICE Implementation Group.
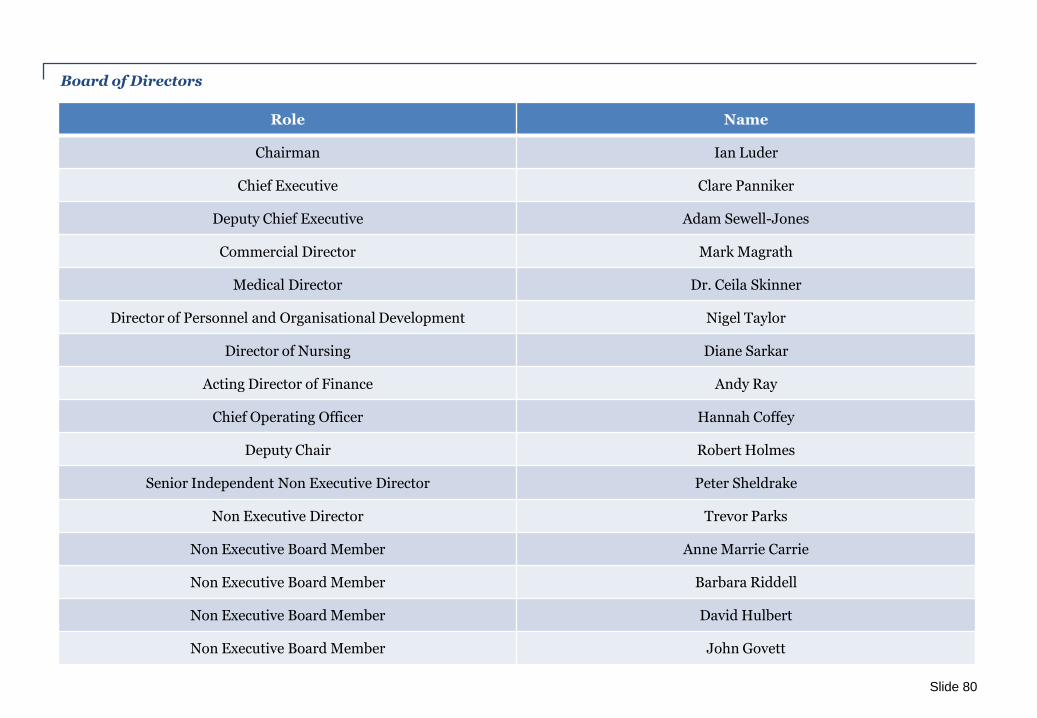
Board of Directors
Role Name
Chairman Ian Luder
Chief Executive Clare Panniker
Deputy Chief Executive Adam Sewell-Jones
Commercial Director Mark Magrath
Medical Director Dr. Ceila Skinner
Director of Personnel and Organisational Development Nigel Taylor
Director of Nursing Diane Sarkar
Acting Director of Finance Andy Ray
Chief Operating Officer Hannah Coffey
Deputy Chair Robert Holmes
Senior Independent Non Executive Director Peter Sheldrake
Non Executive Director Trevor Parks
Non Executive Board Member Anne Marrie Carrie
Non Executive Board Member Barbara Riddell
Non Executive Board Member David Hulbert
Non Executive Board Member John Govett
Slide 80

No. Data Source name Type Area
49 Outline Timetable - Mortality Outlier Review Analysis Mortality
50 CQC review of Mortality data and alerts -Blackpool NHSFT Analysis Mortality
51 Peoples Voice QRP v4.7 Analysis Patient Experience
52 Mortality outlier review -PE score Analysis Patient Experience
53 CPES Review Analysis Patient Experience
54 Pat experience quick wins from dh tool Analysis Patient Experience
55 PEAT 2008-2012 for KATE Analysis Patient Experience
56 PROMs Dashboard and Data for 14 trusts Analysis Patient Experience
57 PROMS for stage 1 review Analysis Patient Experience
58 NHS written complaints, mortality outlier review Data Patient Experience
59 Summary of Monitor SHA Evidence Analysis Patient Experience
60 Suggested KLOI CQC Analysis Patient Experience
61 Various debate and discussion thread Data Patient Experience
62 People Voice Summaries Analysis Patient Experience
63 Litigation Authority Reports Analysis Patient Experience
64 PROMs Dashboard Analysis Patient Experience
65 Rule 43 reports Analysis Patient Experience
66 Data from NHS Litigation Authority Analysis Patient Experience
67 Annual Sickness rates by org Analysis Safety and Workforce
68 Evidence from staff survey Analysis Safety and Workforce
69 Monthly HCSC Workforce Oct 2012 Quarterly tables turnover Data Safety and Workforce
70 Monthly HCSC Workforce Oct 2012 Annual time series turnover Analysis Safety and Workforce
71 Mortality outlier review -education and training KLOI Analysis Safety and Workforce
72 Staff in post Analysis Safety and Workforce
73 Staff survey score in Org Analysis Safety and Workforce
74 Agency and turnover Analysis Safety and Workforce
75 GMC ANNEX -GMC summary of education Data Safety and Workforce
76 Analysis of most recent Pat safety incident data for 14 Analysis Safety and Workforce
77 Safety Thermometer for non spec Data Safety and Workforce
78 Acute Trust Quality Dashboard v1.1 Data Safety and Workforce
79 Initial Findings on NHS written complaints 2011_12 Data Safety and Workforce
80 Quality accounts First Cut Summary Data Safety and Workforce
81 Monitor SHA evidence Analysis Safety and Workforce
82 Care and compassion - analysis and evidence Analysis Safety and Workforce
83 United Linc never events Analysis Safety and Workforce
84 QRP Materials Analysis Safety and Workforce
85 QRP Guidance Data Safety and Workforce
86 QRP User Feedback Analysis Safety and Workforce
87 QRP List of 16 Outcome areas Analysis Safety and Workforce
88 Monitor Briefing on FTs Analysis Safety and Workforce
89 Acute Trust Quality Dashboard v1.1 Analysis Safety and Workforce
90 Safety Thermometer Analysis Safety and Workforce
91 Agency and Turnover - output Analysis Safety and Workforce
92 Quality Account 2011-12 Analysis Safety and Workforce
93 Annual Sickness Absence rates by org Analysis Safety and Workforce
94 Evidence from Staff Survey Analysis Safety and Workforce
95 Monthly HCHS Workforce October 2012 QTT Analysis Safety and Workforce
96 Monthly HCHS Workforce October 2012 ATT Analysis Safety and Workforce
97 Source: Freedom of information request, BBC -
http://www.bbc.co.uk/news/health-22466496 Data Safety and Workforce
Slide 81
No. Data Source name Type Area
1 3 years CDI extended Analysis Clinical and Operational Effectiveness
2 3 years MRSA Analysis Clinical and Operational Effectiveness
3 Acute Trust Quality Dashboard Analysis Clinical and Operational Effectiveness
4 NQD alerts for 14 Analysis Clinical and Operational Effectiveness
5 PbR review data Data Clinical and Operational Effectiveness
6 QRP time series Analysis Clinical and Operational Effectiveness
7 Healthcare Evaluation Data Analysis General
8 GMC Annex - GMC summary of Education Evidence - trusts with high mortality rates Data General
9 1 Buckinghamshire Healthcare Quality Accounts Data General
10 Burton Quality Account Data General
11 CHUFT Annual Report 2012 Data General
12 Quality Report 2011-12 Data General
13 Annual Report 2011-12_final Data General
14 NLG. Quality Account 2011-12 Data General
15 Annual Report 2012 Data General
16 Litigation covering email Data Governance and leadership
17 Litigation summary sheet Data Governance and leadership
18 Rule 43 reports by Trust Data Governance and leadership
19 Rule 43 reports MOJ Data Governance and leadership
20 Governance and Finance Data Governance and leadership
21 MOR Board reports Data Governance and leadership
22 Board papers Data Governance and leadership
23 CQC data submissions Data Governance and leadership
24 Evidence Chronology B&T Data Governance and leadership
25 Hospital Sites within Trust Data Governance and leadership
26 NHS LA Factsheet Analysis Governance and leadership
27 NHSLA comment on five Analysis Governance and leadership
28 Steering Group Agenda and Papers incl Governance Structure and Timetable Analysis Governance and leadership
29 List of products Data Governance and leadership
30 Provider Site details from QRP Analysis Governance and leadership
31 Annual Report 2011-12 Analysis Governance and leadership
32 SHMI Summary Analysis Mortality
33 Diabetes Mortality Outliers Analysis Mortality
34 Mortality among inpatient with diabetes Analysis Mortality
35 supplementary analysis of HES mortality data Analysis Mortality
36 VLAD summary Analysis Mortality
37 Mor Dr Foster HSMR Analysis Mortality
38 Outliers Elective Non elective split Analysis Mortality
39 Presentation to DH Analysts about Mid-staffs Analysis Mortality
40 CQC mortality outlier summaries Data Mortality
41 SHMI Materials Analysis Mortality
42 Dr Foster HSMR Analysis Mortality
43 AQuA material Analysis Mortality
44 Mortality Outlier Review Analysis Mortality
45 Original Analysis Identifying Mortality Outliers Analysis Mortality
46 Original Analysis of HSMR-2010-12 Analysis Mortality
47 High-level Methodology and Timetable Data Mortality
48 Analytical Distribution of Work_extended table Data Mortality
Data Sources
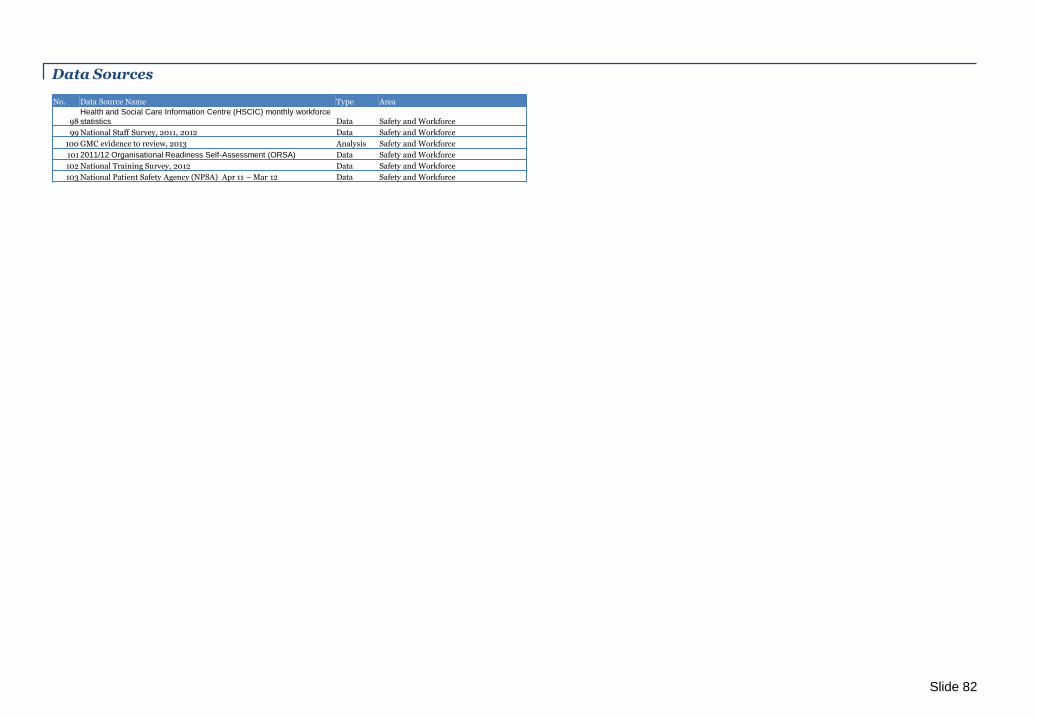
Slide 82
No. Data Source Name Type Area
98 Health and Social Care Information Centre (HSCIC) monthly workforce
statistics Data Safety and Workforce
99 National Staff Survey, 2011, 2012 Data Safety and Workforce
100 GMC evidence to review, 2013 Analysis Safety and Workforce
101 2011/12 Organisational Readiness Self-Assessment (ORSA) Data Safety and Workforce
102 National Training Survey, 2012 Data Safety and Workforce
103 National Patient Safety Agency (NPSA) Apr 11 – Mar 12 Data Safety and Workforce
Data Sources
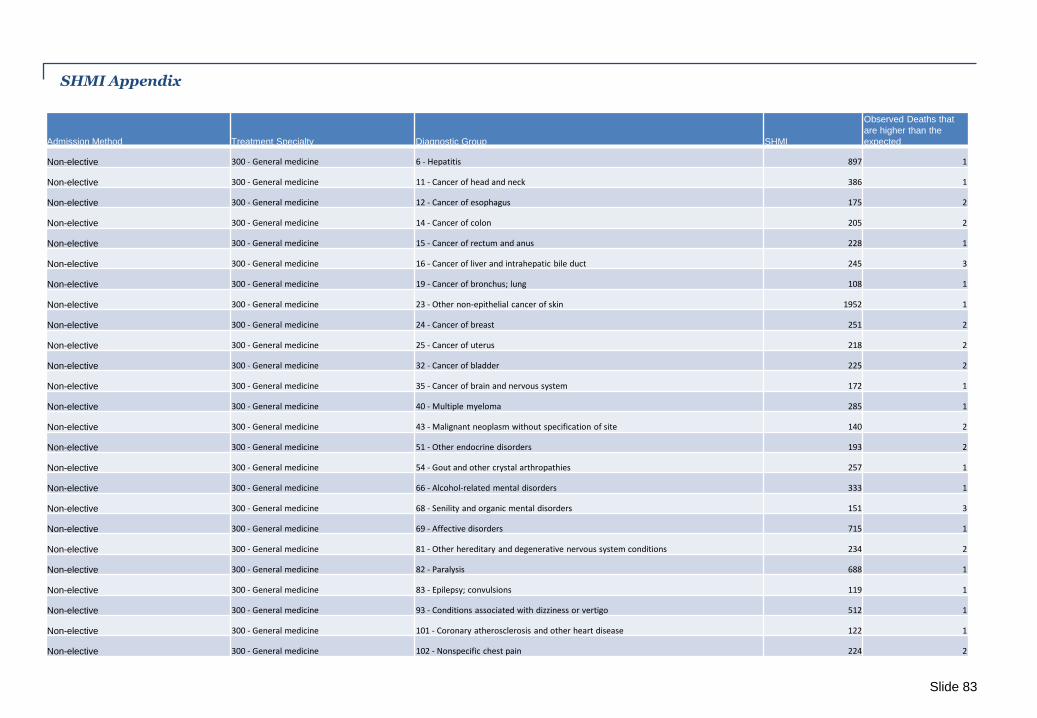
SHMI Appendix
Admission Method Treatment Specialty Diagnostic Group SHMI
Observed Deaths that
are higher than the
expected
Non-elective 300 - General medicine 6 - Hepatitis 897 1
Non-elective 300 - General medicine 11 - Cancer of head and neck 386 1
Non-elective 300 - General medicine 12 - Cancer of esophagus 175 2
Non-elective 300 - General medicine 14 - Cancer of colon 205 2
Non-elective 300 - General medicine 15 - Cancer of rectum and anus 228 1
Non-elective 300 - General medicine 16 - Cancer of liver and intrahepatic bile duct 245 3
Non-elective 300 - General medicine 19 - Cancer of bronchus; lung 108 1
Non-elective 300 - General medicine 23 - Other non-epithelial cancer of skin 1952 1
Non-elective 300 - General medicine 24 - Cancer of breast 251 2
Non-elective 300 - General medicine 25 - Cancer of uterus 218 2
Non-elective 300 - General medicine 32 - Cancer of bladder 225 2
Non-elective 300 - General medicine 35 - Cancer of brain and nervous system 172 1
Non-elective 300 - General medicine 40 - Multiple myeloma 285 1
Non-elective 300 - General medicine 43 - Malignant neoplasm without specification of site 140 2
Non-elective 300 - General medicine 51 - Other endocrine disorders 193 2
Non-elective 300 - General medicine 54 - Gout and other crystal arthropathies 257 1
Non-elective 300 - General medicine 66 - Alcohol-related mental disorders 333 1
Non-elective 300 - General medicine 68 - Senility and organic mental disorders 151 3
Non-elective 300 - General medicine 69 - Affective disorders 715 1
Non-elective 300 - General medicine 81 - Other hereditary and degenerative nervous system conditions 234 2
Non-elective 300 - General medicine 82 - Paralysis 688 1
Non-elective 300 - General medicine 83 - Epilepsy; convulsions 119 1
Non-elective 300 - General medicine 93 - Conditions associated with dizziness or vertigo 512 1
Non-elective 300 - General medicine 101 - Coronary atherosclerosis and other heart disease 122 1
Non-elective 300 - General medicine 102 - Nonspecific chest pain 224 2
Slide 83
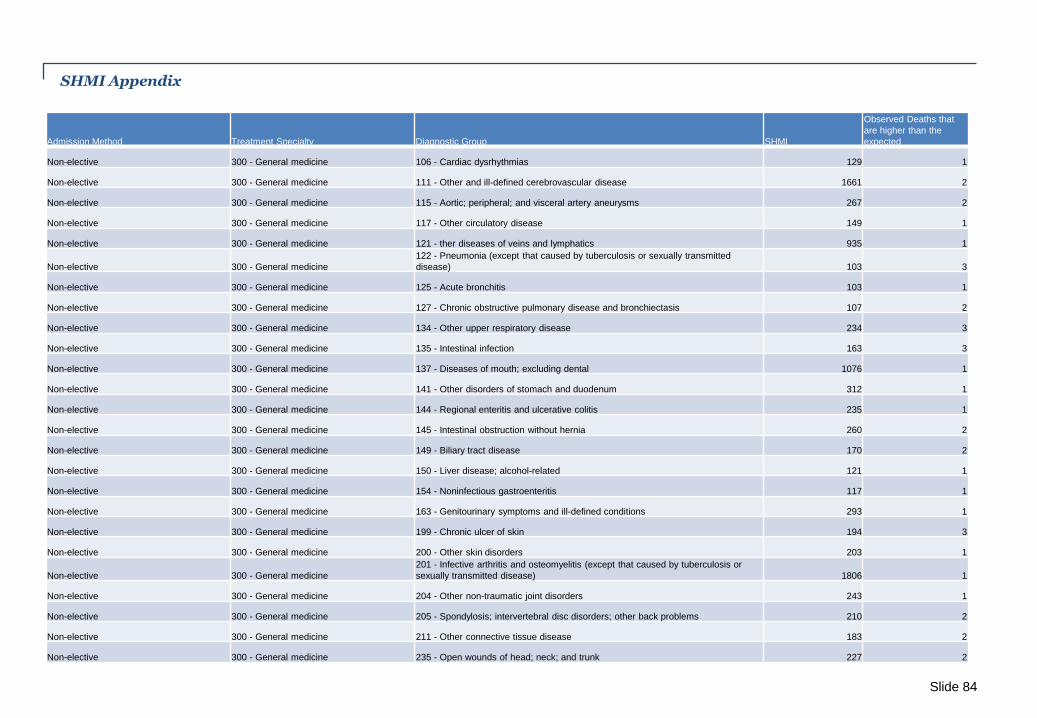
SHMI Appendix
Admission Method Treatment Specialty Diagnostic Group SHMI
Observed Deaths that
are higher than the
expected
Non-elective 300 - General medicine 106 - Cardiac dysrhythmias 129 1
Non-elective 300 - General medicine 111 - Other and ill-defined cerebrovascular disease 1661 2
Non-elective 300 - General medicine 115 - Aortic; peripheral; and visceral artery aneurysms 267 2
Non-elective 300 - General medicine 117 - Other circulatory disease 149 1
Non-elective 300 - General medicine 121 - ther diseases of veins and lymphatics 935 1
Non-elective 300 - General medicine
122 - Pneumonia (except that caused by tuberculosis or sexually transmitted
disease) 103 3
Non-elective 300 - General medicine 125 - Acute bronchitis 103 1
Non-elective 300 - General medicine 127 - Chronic obstructive pulmonary disease and bronchiectasis 107 2
Non-elective 300 - General medicine 134 - Other upper respiratory disease 234 3
Non-elective 300 - General medicine 135 - Intestinal infection 163 3
Non-elective 300 - General medicine 137 - Diseases of mouth; excluding dental 1076 1
Non-elective 300 - General medicine 141 - Other disorders of stomach and duodenum 312 1
Non-elective 300 - General medicine 144 - Regional enteritis and ulcerative colitis 235 1
Non-elective 300 - General medicine 145 - Intestinal obstruction without hernia 260 2
Non-elective 300 - General medicine 149 - Biliary tract disease 170 2
Non-elective 300 - General medicine 150 - Liver disease; alcohol-related 121 1
Non-elective 300 - General medicine 154 - Noninfectious gastroenteritis 117 1
Non-elective 300 - General medicine 163 - Genitourinary symptoms and ill-defined conditions 293 1
Non-elective 300 - General medicine 199 - Chronic ulcer of skin 194 3
Non-elective 300 - General medicine 200 - Other skin disorders 203 1
Non-elective 300 - General medicine
201 - Infective arthritis and osteomyelitis (except that caused by tuberculosis or
sexually transmitted disease) 1806 1
Non-elective 300 - General medicine 204 - Other non-traumatic joint disorders 243 1
Non-elective 300 - General medicine 205 - Spondylosis; intervertebral disc disorders; other back problems 210 2
Non-elective 300 - General medicine 211 - Other connective tissue disease 183 2
Non-elective 300 - General medicine 235 - Open wounds of head; neck; and trunk 227 2
Slide 84
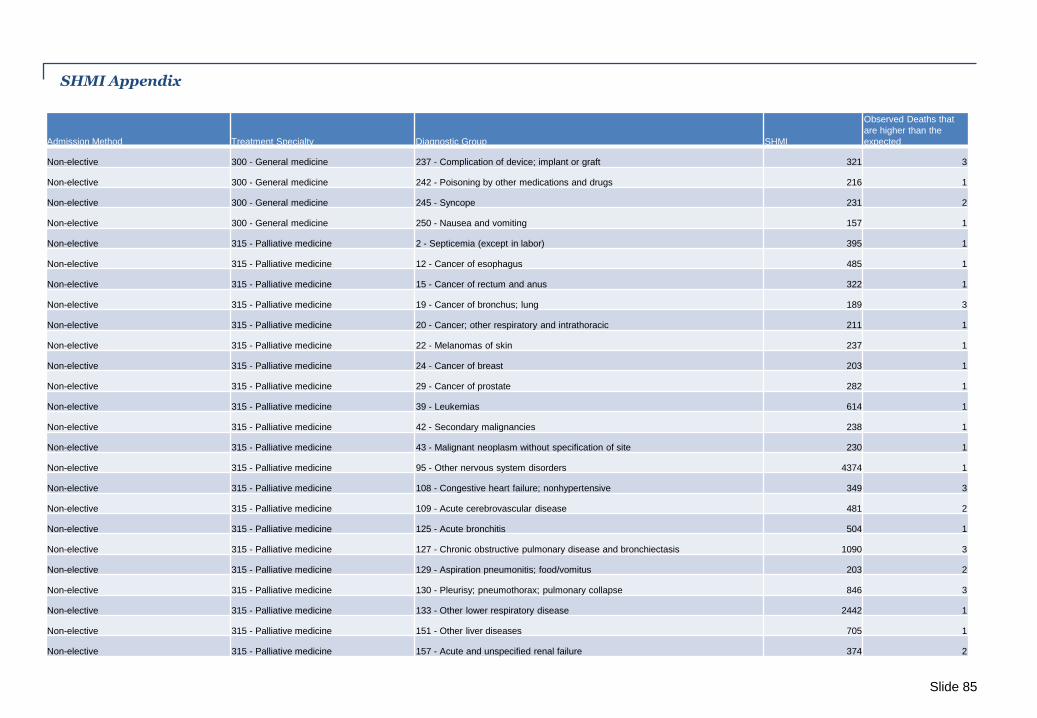
SHMI Appendix
Admission Method Treatment Specialty Diagnostic Group SHMI
Observed Deaths that
are higher than the
expected
Non-elective 300 - General medicine 237 - Complication of device; implant or graft 321 3
Non-elective 300 - General medicine 242 - Poisoning by other medications and drugs 216 1
Non-elective 300 - General medicine 245 - Syncope 231 2
Non-elective 300 - General medicine 250 - Nausea and vomiting 157 1
Non-elective 315 - Palliative medicine 2 - Septicemia (except in labor) 395 1
Non-elective 315 - Palliative medicine 12 - Cancer of esophagus 485 1
Non-elective 315 - Palliative medicine 15 - Cancer of rectum and anus 322 1
Non-elective 315 - Palliative medicine 19 - Cancer of bronchus; lung 189 3
Non-elective 315 - Palliative medicine 20 - Cancer; other respiratory and intrathoracic 211 1
Non-elective 315 - Palliative medicine 22 - Melanomas of skin 237 1
Non-elective 315 - Palliative medicine 24 - Cancer of breast 203 1
Non-elective 315 - Palliative medicine 29 - Cancer of prostate 282 1
Non-elective 315 - Palliative medicine 39 - Leukemias 614 1
Non-elective 315 - Palliative medicine 42 - Secondary malignancies 238 1
Non-elective 315 - Palliative medicine 43 - Malignant neoplasm without specification of site 230 1
Non-elective 315 - Palliative medicine 95 - Other nervous system disorders 4374 1
Non-elective 315 - Palliative medicine 108 - Congestive heart failure; nonhypertensive 349 3
Non-elective 315 - Palliative medicine 109 - Acute cerebrovascular disease 481 2
Non-elective 315 - Palliative medicine 125 - Acute bronchitis 504 1
Non-elective 315 - Palliative medicine 127 - Chronic obstructive pulmonary disease and bronchiectasis 1090 3
Non-elective 315 - Palliative medicine 129 - Aspiration pneumonitis; food/vomitus 203 2
Non-elective 315 - Palliative medicine 130 - Pleurisy; pneumothorax; pulmonary collapse 846 3
Non-elective 315 - Palliative medicine 133 - Other lower respiratory disease 2442 1
Non-elective 315 - Palliative medicine 151 - Other liver diseases 705 1
Non-elective 315 - Palliative medicine 157 - Acute and unspecified renal failure 374 2
Slide 85
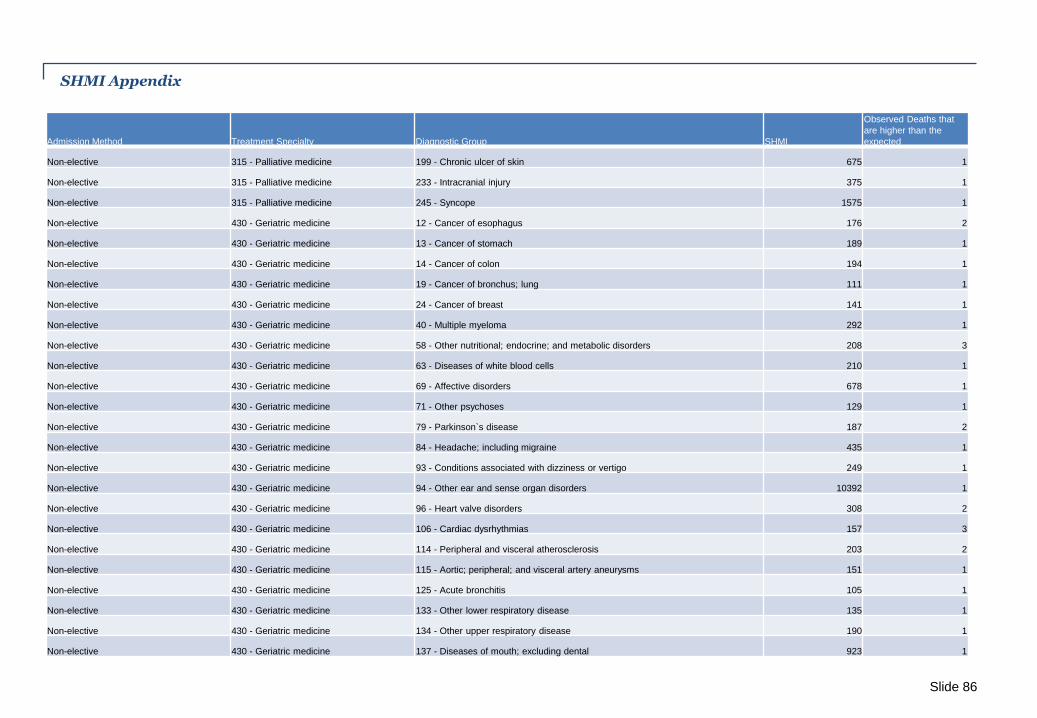
SHMI Appendix
Admission Method Treatment Specialty Diagnostic Group SHMI
Observed Deaths that
are higher than the
expected
Non-elective 315 - Palliative medicine 199 - Chronic ulcer of skin 675 1
Non-elective 315 - Palliative medicine 233 - Intracranial injury 375 1
Non-elective 315 - Palliative medicine 245 - Syncope 1575 1
Non-elective 430 - Geriatric medicine 12 - Cancer of esophagus 176 2
Non-elective 430 - Geriatric medicine 13 - Cancer of stomach 189 1
Non-elective 430 - Geriatric medicine 14 - Cancer of colon 194 1
Non-elective 430 - Geriatric medicine 19 - Cancer of bronchus; lung 111 1
Non-elective 430 - Geriatric medicine 24 - Cancer of breast 141 1
Non-elective 430 - Geriatric medicine 40 - Multiple myeloma 292 1
Non-elective 430 - Geriatric medicine 58 - Other nutritional; endocrine; and metabolic disorders 208 3
Non-elective 430 - Geriatric medicine 63 - Diseases of white blood cells 210 1
Non-elective 430 - Geriatric medicine 69 - Affective disorders 678 1
Non-elective 430 - Geriatric medicine 71 - Other psychoses 129 1
Non-elective 430 - Geriatric medicine 79 - Parkinson`s disease 187 2
Non-elective 430 - Geriatric medicine 84 - Headache; including migraine 435 1
Non-elective 430 - Geriatric medicine 93 - Conditions associated with dizziness or vertigo 249 1
Non-elective 430 - Geriatric medicine 94 - Other ear and sense organ disorders 10392 1
Non-elective 430 - Geriatric medicine 96 - Heart valve disorders 308 2
Non-elective 430 - Geriatric medicine 106 - Cardiac dysrhythmias 157 3
Non-elective 430 - Geriatric medicine 114 - Peripheral and visceral atherosclerosis 203 2
Non-elective 430 - Geriatric medicine 115 - Aortic; peripheral; and visceral artery aneurysms 151 1
Non-elective 430 - Geriatric medicine 125 - Acute bronchitis 105 1
Non-elective 430 - Geriatric medicine 133 - Other lower respiratory disease 135 1
Non-elective 430 - Geriatric medicine 134 - Other upper respiratory disease 190 1
Non-elective 430 - Geriatric medicine 137 - Diseases of mouth; excluding dental 923 1
Slide 86

SHMI Appendix
Admission Method Treatment Specialty Diagnostic Group SHMI
Observed Deaths that
are higher than the
expected
Non-elective 430 - Geriatric medicine 143 - Abdominal hernia 236 1
Non-elective 430 - Geriatric medicine 145 - Intestinal obstruction without hernia 141 1
Non-elective 430 - Geriatric medicine 146 - Diverticulosis and diverticulitis 245 1
Non-elective 430 - Geriatric medicine 155 - Other gastrointestinal disorders 121 1
Non-elective 430 - Geriatric medicine 163 - Genitourinary symptoms and ill-defined conditions 214 1
Non-elective 430 - Geriatric medicine 171 - Menstrual disorders 601 1
Non-elective 430 - Geriatric medicine 199 - Chronic ulcer of skin 162 2
Non-elective 430 - Geriatric medicine 205 - Spondylosis; intervertebral disc disorders; other back problems 183 2
Non-elective 430 - Geriatric medicine 207 - Pathological fracture 329 1
Non-elective 430 - Geriatric medicine 214 - Digestive congenital anomalies 2668 1
Non-elective 430 - Geriatric medicine 226 - Fracture of neck of femur (hip) 195 1
Non-elective 430 - Geriatric medicine 229 - Fracture of upper limb 292 3
Non-elective 430 - Geriatric medicine 230 - Fracture of lower limb 223 1
Non-elective 430 - Geriatric medicine 233 - Intracranial injury 151 2
Non-elective 430 - Geriatric medicine 234 - Crushing injury or internal injury 697 3
Non-elective 430 - Geriatric medicine 236 - Open wounds of extremities 308 3
Non-elective 430 - Geriatric medicine 238 - Complications of surgical procedures or medical care 379 1
Non-elective 430 - Geriatric medicine 239 - Superficial injury; contusion 160 2
Non-elective 430 - Geriatric medicine 240 - Burns 554 1
Non-elective 430 - Geriatric medicine 246 - Fever of unknown origin 286 1
Non-elective 430 - Geriatric medicine 251 - Abdominal pain 237 1
Non-elective 430 - Geriatric medicine 252 - Malaise and fatigue 251 2
Non-elective 430 - Geriatric medicine 259 - Residual codes; unclassified 163 2
Slide 87

HSMR Appendix
Admission Method Treatment Specialty Diagnostic Group HSMR
Observed Deaths that
are higher than the
expected
Nonelective 315 - Palliative medicine Pneumonia (except that caused by tuberculosis or s 138 2
Nonelective 315 - Palliative medicine Chronic obstructive pulmonary disease and bronchie 240 2
Nonelective 315 - Palliative medicine Pleurisy; pneumothorax; pulmonary collapse 495 2
Nonelective 315 - Palliative medicine Acute and unspecified renal failure 175 1
Nonelective 315 - Palliative medicine Septicemia (except in labor) 241 1
Nonelective 315 - Palliative medicine Cancer of bronchus; lung 128 1
Nonelective 315 - Palliative medicine Aspiration pneumonitis; food/vomitus 137 1
Nonelective 315 - Palliative medicine Other lower respiratory disease 318 1
Nonelective 315 - Palliative medicine Acute cerebrovascular disease 124 1
Nonelective 315 - Palliative medicine Cancer of rectum and anus 277 1
Nonelective 315 - Palliative medicine Malignant neoplasm without specification of site 264 1
Nonelective 315 - Palliative medicine Other liver diseases 273 1
Nonelective 315 - Palliative medicine Cancer of prostate 206 1
Nonelective 315 - Palliative medicine Congestive heart failure; nonhypertensive 115 1
Nonelective 315 - Palliative medicine Syncope 200 1
Nonelective 320 - Cardiology Cardiac dysrhythmias 162 1
Nonelective 320 - Cardiology Chronic obstructive pulmonary disease and bronchie 300 1
Nonelective 320 - Cardiology Congestive heart failure; nonhypertensive 168 2
Nonelective 320 - Cardiology Fluid and electrolyte disorders 953 1
Nonelective 320 - Cardiology Intracranial injury 1047 1
Nonelective 320 - Cardiology Peripheral and visceral atherosclerosis 449 1
Nonelective 320 - Cardiology Pulmonary heart disease 244 1
Nonelective 420 - Paediatriucs Acute bronchitis 1318 2
Nonelective 420 - Paediatriucs Pneumonia (except that caused by tuberculosis or s 589 1
Slide 88

Higher than Expected Diagnostic Groups HSMR / SHMI Summary (Non-elective)
Treatment Specialty HSMR SHMI
Palliative Medicine X X
Cardiology X
Paediatric Medicine X
General Medicine X
Geriatric Medicine X
Slide 89