basic openhole interpretation walter
TRANSCRIPT

February 2007
FTW Global Training
Basic Open Hole Interpretation
6© 2006 Weatherford. All rights reserved.© 2006 Weatherford. All rights reserved.
Why run open hole logs?
• Does the wellbore penetrate formations that produce?
• Are hydrocarbons present?
• Are there commercial quantities present?
• Will the hydrocarbons flow to the wellbore?
7© 2006 Weatherford. All rights reserved.© 2006 Weatherford. All rights reserved.
Logging objectives
• Correlation: well to well of formation tops, major lithologies, unconformities
• Identifying porous and permeable reservoir rocks
• Identifying hydrocarbon intervals
• Reservoir engineering: pay thickness, average porosity, average water saturation
• Stratigraphic and structural studies
• Well completions
• Geophysical applications
8© 2006 Weatherford. All rights reserved.© 2006 Weatherford. All rights reserved.
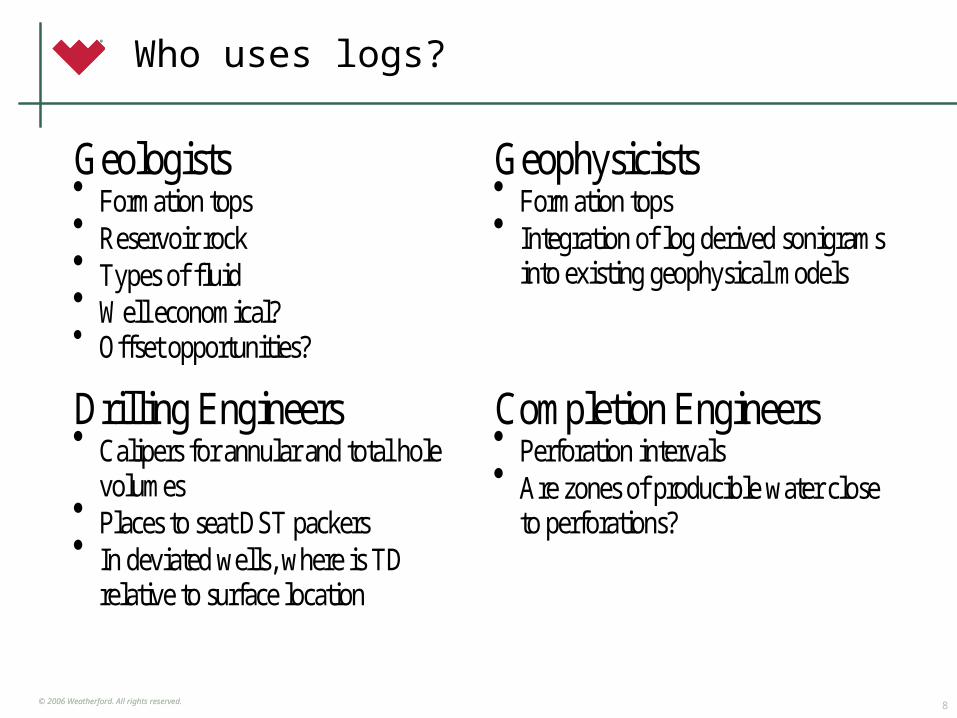
Who uses logs?
Geologists Formation tops Reservoir rock Types of fluid Well economical? Offset opportunities?
Geophysicists Formation tops Integration of log derived sonigrams
into existing geophysical models
Drilling Engineers Calipers for annular and total hole
volumes Places to seat DST packers In deviated wells, where is TD
relative to surface location
Completion Engineers Perforation intervals Are zones of producible water close
to perforations?
9© 2006 Weatherford. All rights reserved.© 2006 Weatherford. All rights reserved.
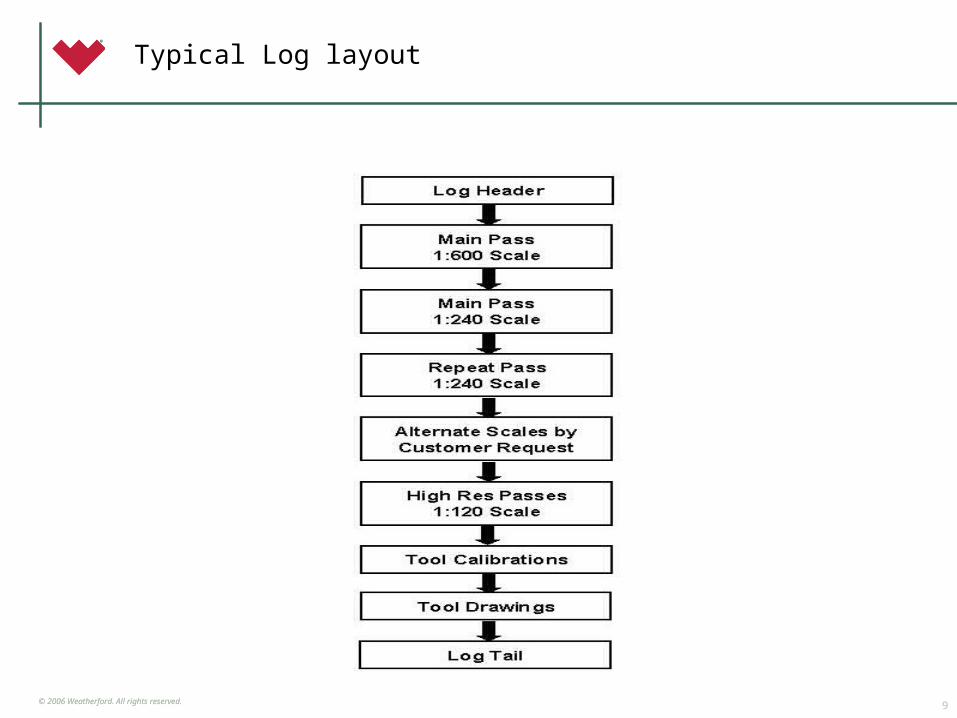
Typical Log layout
10© 2006 Weatherford. All rights reserved.© 2006 Weatherford. All rights reserved.
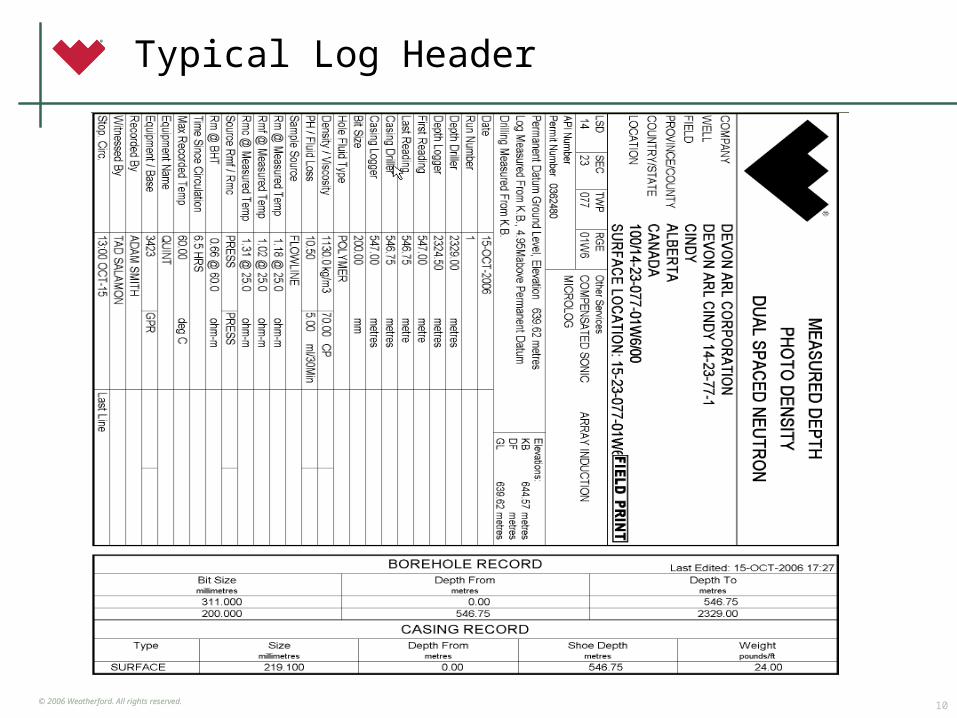
Typical Log Header
11© 2006 Weatherford. All rights reserved.© 2006 Weatherford. All rights reserved.
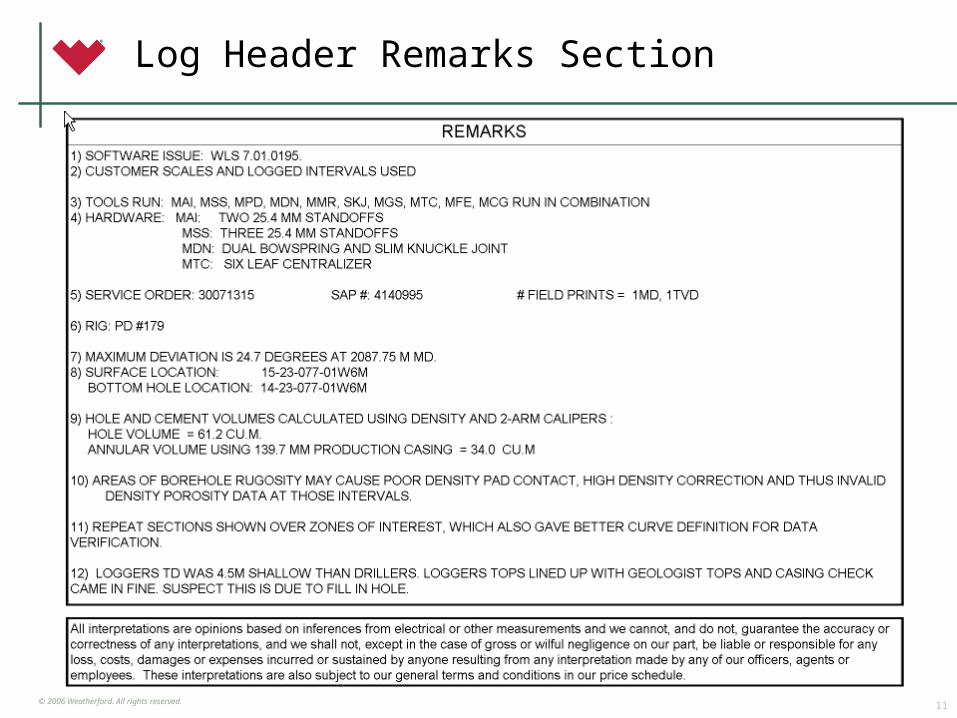
Log Header Remarks Section
12© 2006 Weatherford. All rights reserved.© 2006 Weatherford. All rights reserved.
Adjacent Bed
Adjacent BedMudcake
Mud
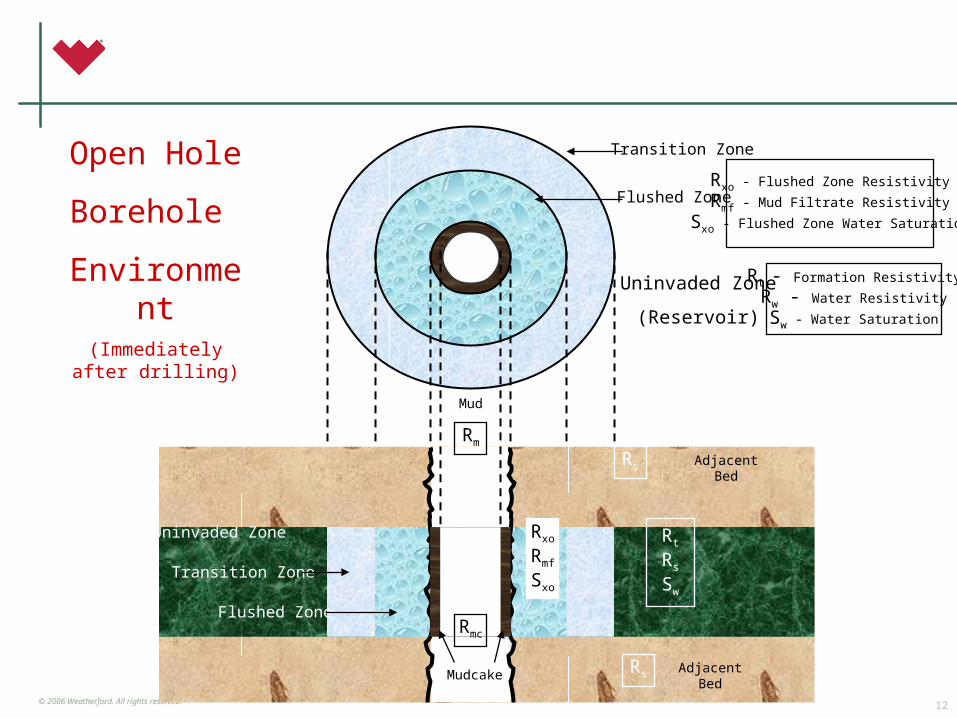
Open Hole
Borehole
Environment(Immediately after
drilling)
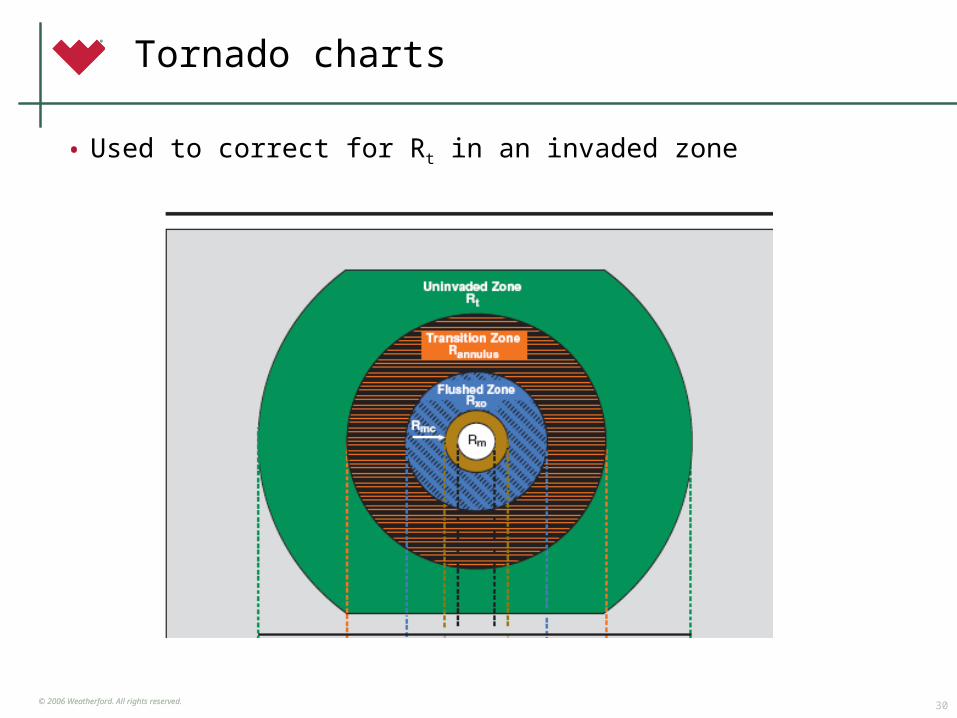
Transition Zone
Transition Zone
Rmc
Uninvaded Zone
Uninvaded Zone
(Reservoir)
Rt
Rs
Sw
Rt - Formation Resistivity
Rw - Water Resistivity
Sw - Water Saturation
Rs
Rs
Flushed Zone
Flushed ZoneRxo - Flushed Zone Resistivity
Rmf - Mud Filtrate Resistivity
Sxo - Flushed Zone Water Saturation
Rxo
Rmf
Sxo
Rm
13© 2006 Weatherford. All rights reserved.© 2006 Weatherford. All rights reserved.
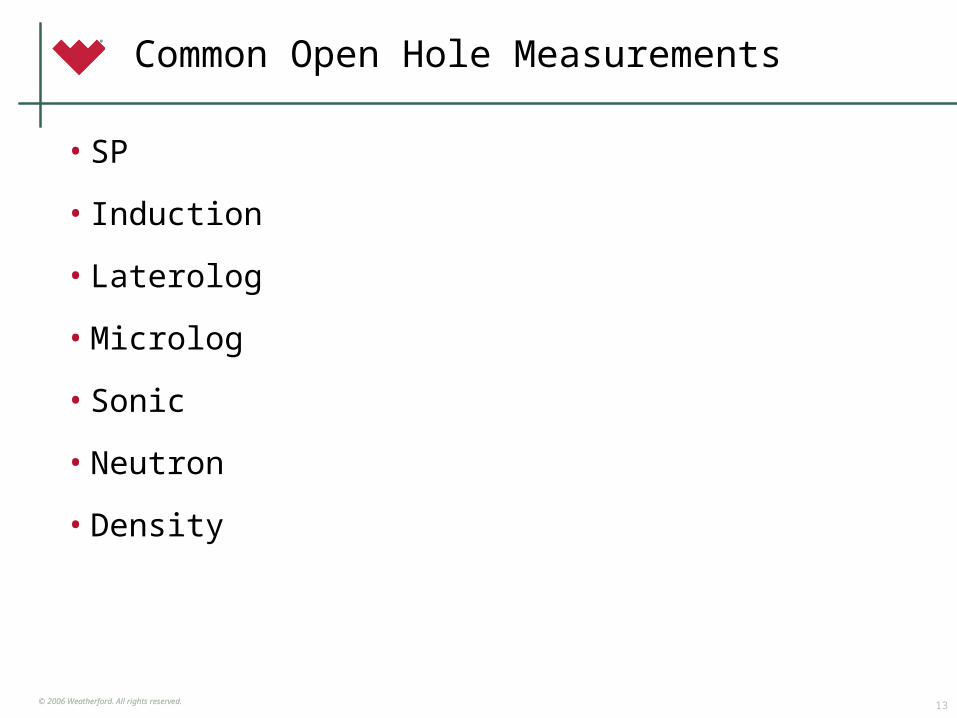
Common Open Hole Measurements
• SP
• Induction
• Laterolog
• Microlog
• Sonic
• Neutron
• Density
14© 2006 Weatherford. All rights reserved.© 2006 Weatherford. All rights reserved.
Spontaneous Potential (SP)
SP is a naturally occurring phenomena in the borehole environment.
First ever log (~1930)
15© 2006 Weatherford. All rights reserved.© 2006 Weatherford. All rights reserved.
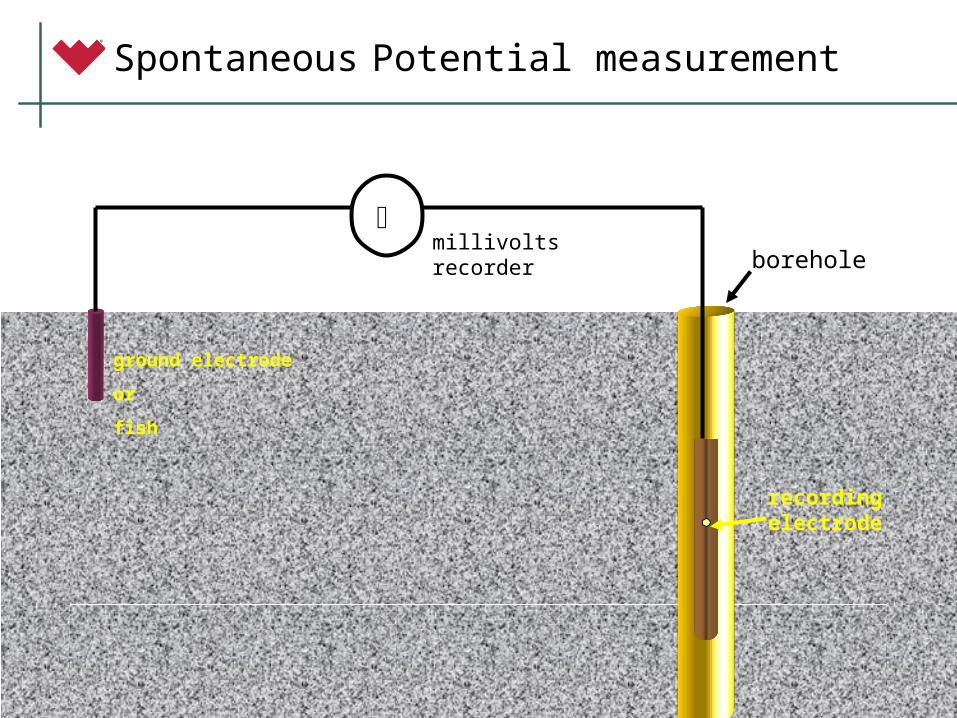
Spontaneous Potential measurement
millivolts recorder
recording electrode
borehole
ground electrode
or
fish
16© 2006 Weatherford. All rights reserved.© 2006 Weatherford. All rights reserved.
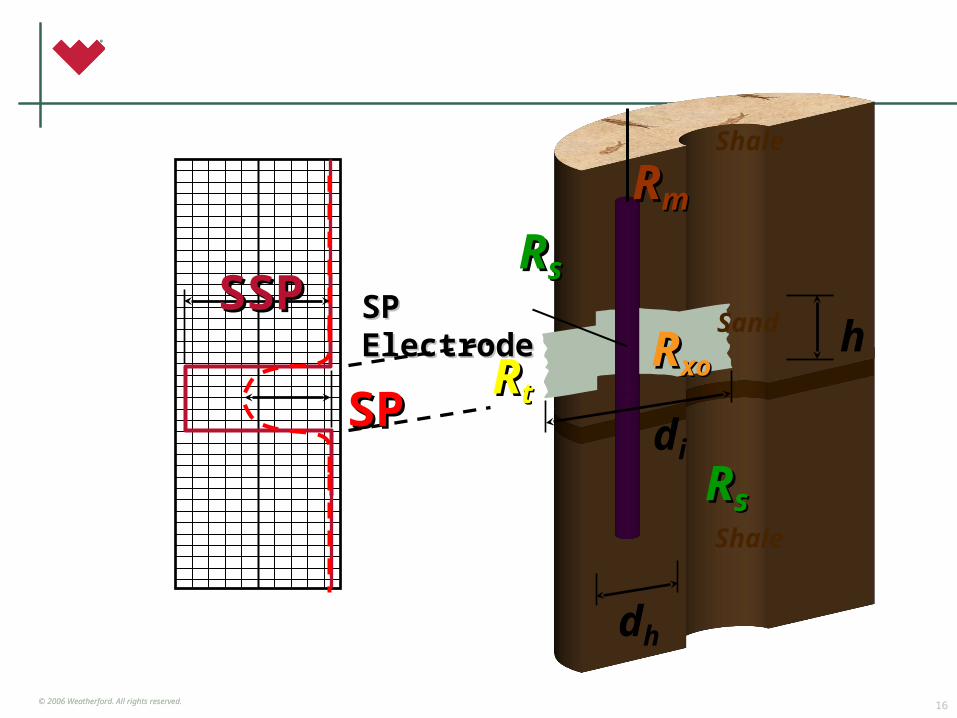
RRttRRxoxo
RRss
RRssdi
RRmm
dh
hSP ElectrodeSP Electrode
SPSP
SSPSSP
Shale
Sand
Shale
17© 2006 Weatherford. All rights reserved.© 2006 Weatherford. All rights reserved.
Uses and applications of SP
• Correlation
• Bed boundaries
• Shale indicator Vshale = 1 – PSP/SSP
• Qualitative indicator of permeability
• Source for water resistivity (Rw)
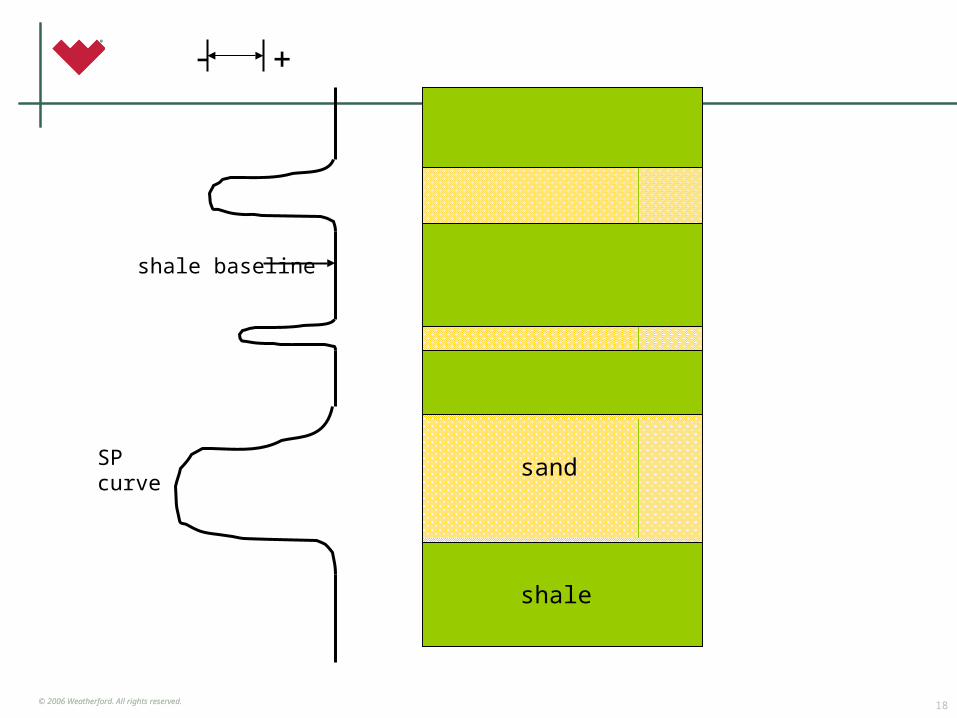
18© 2006 Weatherford. All rights reserved.© 2006 Weatherford. All rights reserved.
sand
shale
-
SP curve
shale baseline
19© 2006 Weatherford. All rights reserved.© 2006 Weatherford. All rights reserved.
Factors affecting SP response
• borehole fluid must be conductive
• salinity contrast between formation fluid (Rw) and mud filtrate (Rmf) dictates magnitude of SP response
• formation and side bed resistivities
• bed thickness
• borehole diameter
• deep invasion
20© 2006 Weatherford. All rights reserved.© 2006 Weatherford. All rights reserved.
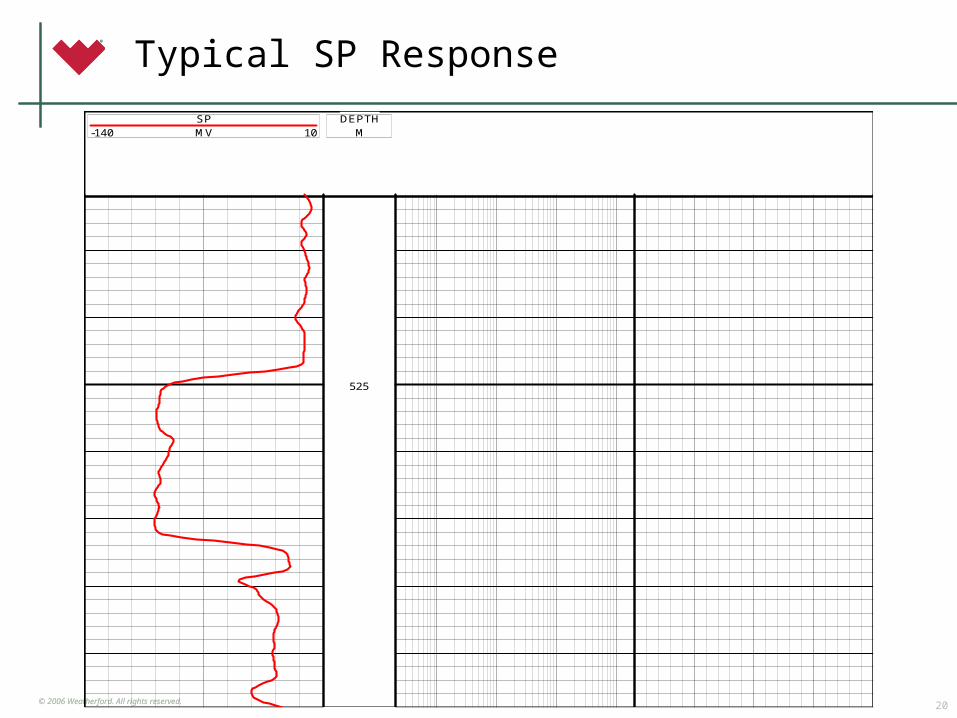
SPMV-140 10
DEPTHM
525
Typical SP Response
21© 2006 Weatherford. All rights reserved.© 2006 Weatherford. All rights reserved.
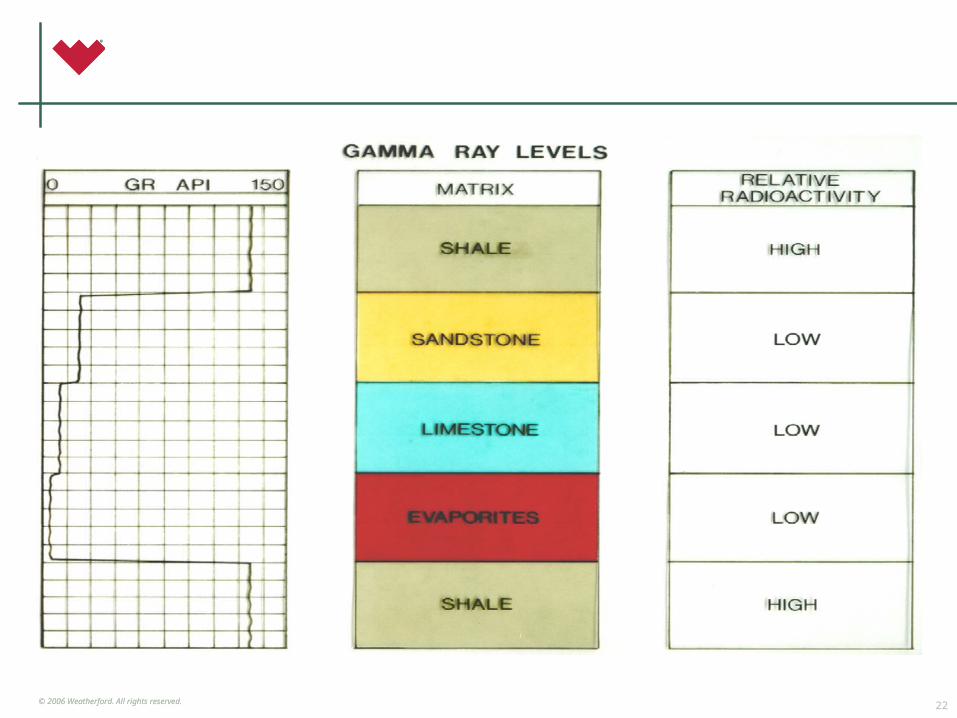
Formation Lithology Fracture Indication (Uranium Deposits) Volume Shale Indicator Effective Porosity Depth Correlation (Open hole & Cased hole)
Gamma Ray Tool Applications
22© 2006 Weatherford. All rights reserved.© 2006 Weatherford. All rights reserved.
23© 2006 Weatherford. All rights reserved.© 2006 Weatherford. All rights reserved.
Factors affecting GR response
• Any material between source and detector will reduce the GR response
• Hole size
• Formation density
• KCl mud
• GR emissions are statistical , hence curve variation and averaging of data
• GR indicative of K, related to shale content. GR response can be due to U and Th in clean zones
24© 2006 Weatherford. All rights reserved.© 2006 Weatherford. All rights reserved.
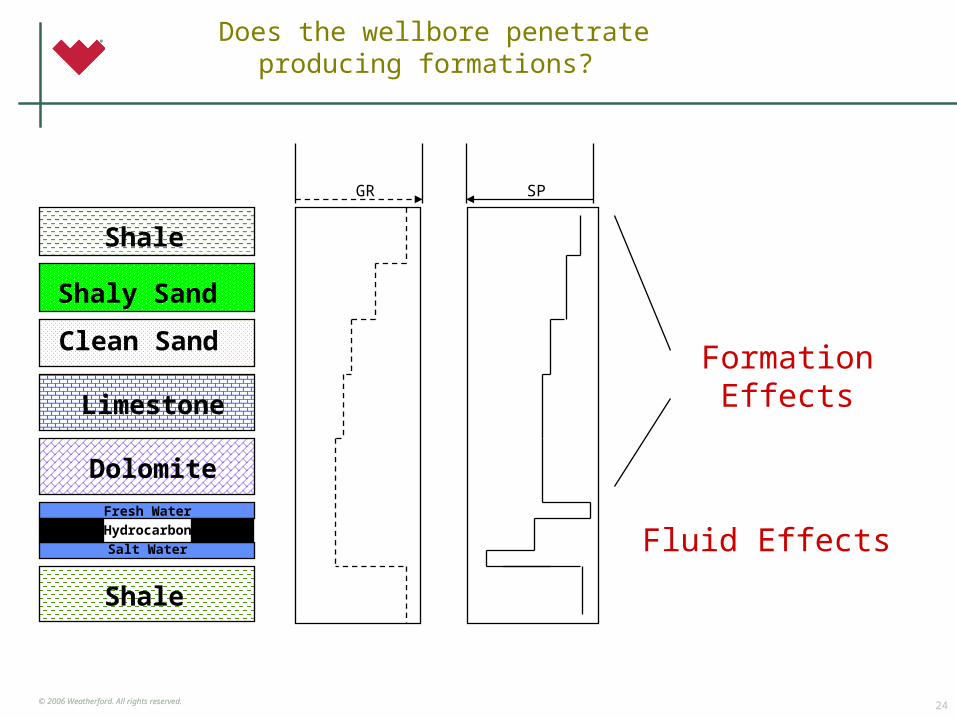
Does the wellbore penetrate producing formations?
Oil
Shale
Shale
Fresh Water
Hydrocarbon
Salt Water
Clean Sand
Dolomite
GR
Shaly Sand
Limestone
SP
Fluid Effects
Formation Effects
25© 2006 Weatherford. All rights reserved.© 2006 Weatherford. All rights reserved.
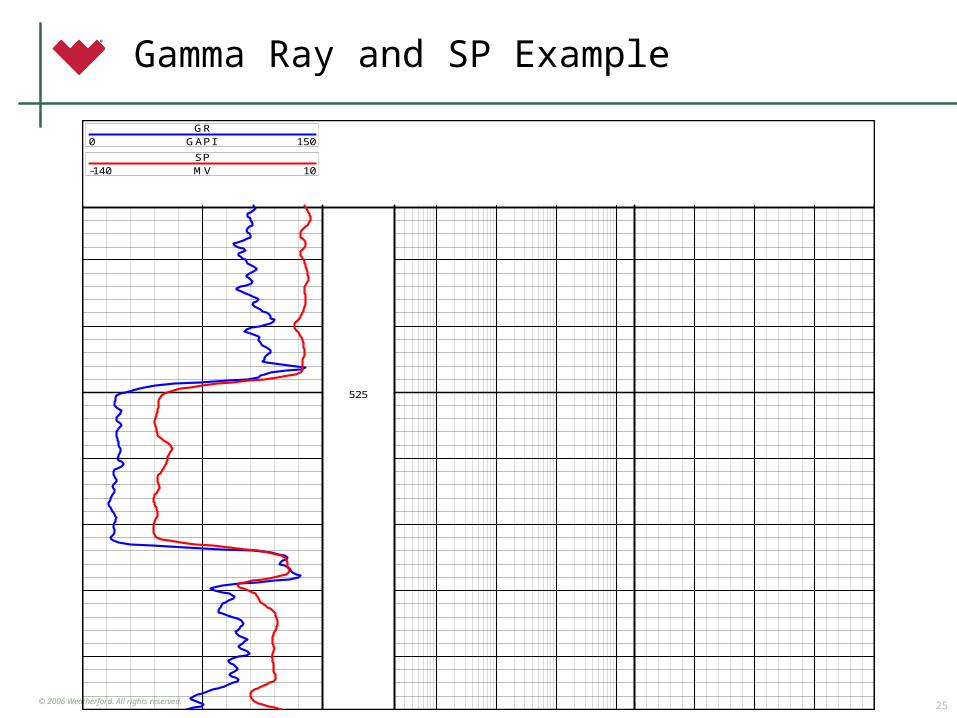
GRGAPI0 150
SPMV-140 10
525
Gamma Ray and SP Example
26© 2006 Weatherford. All rights reserved.© 2006 Weatherford. All rights reserved.
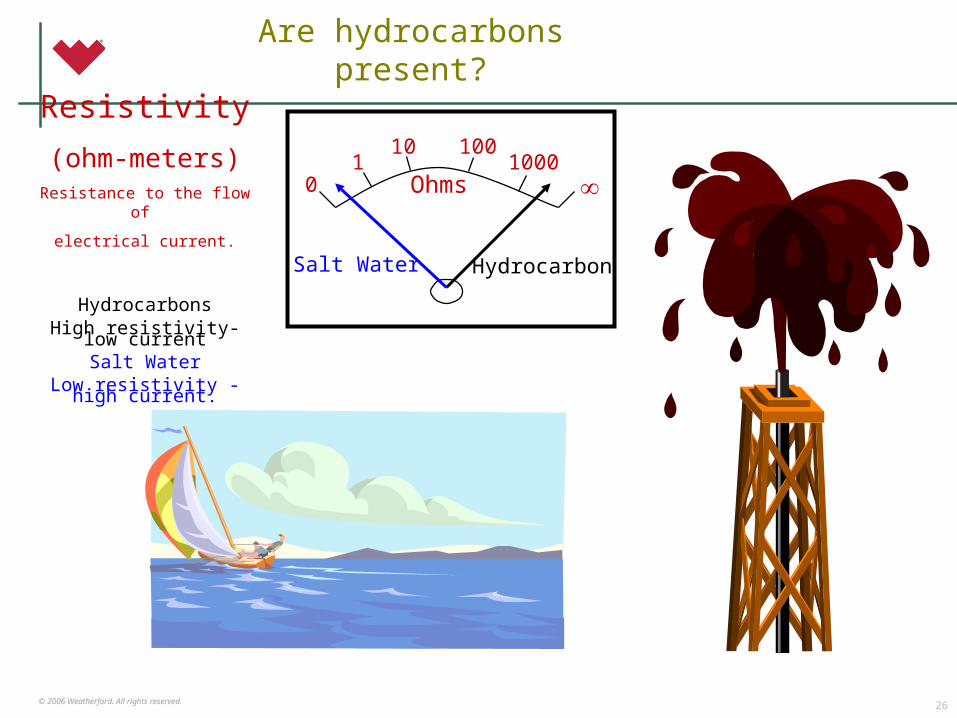
Resistivity
(ohm-meters)Resistance to the flow of
electrical current.
Hydrocarbons
High resistivity-low currentSalt Water
Low resistivity - high current.
0 1
10 1001000
Ohms
HydrocarbonSalt Water
Are hydrocarbons present?
© 2006 Weatherford. All rights reserved.© 2006 Weatherford. All rights reserved.
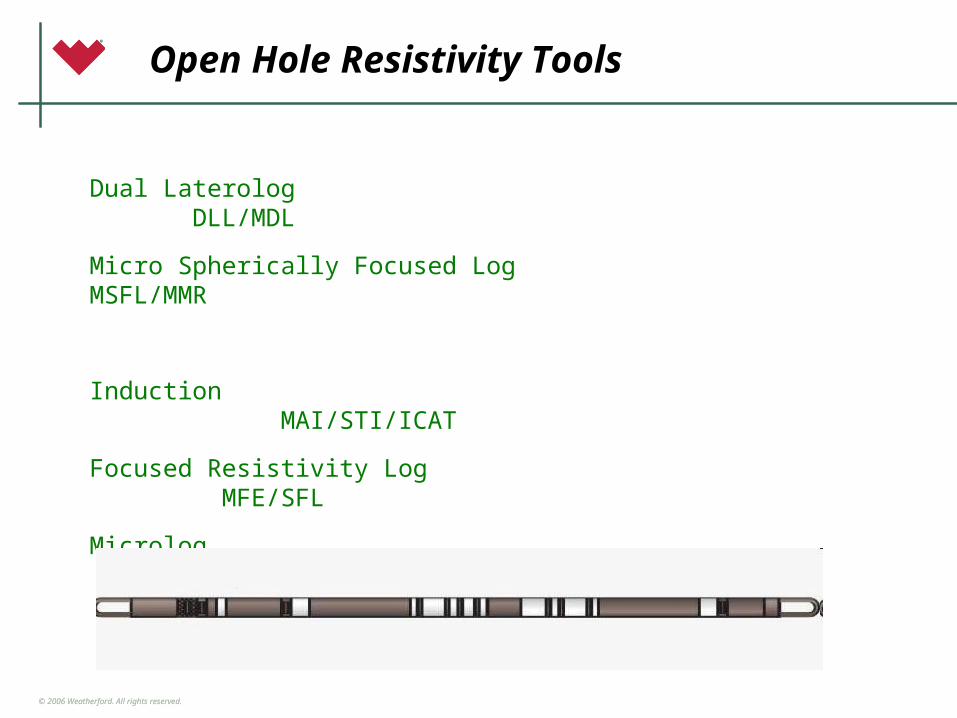
Open Hole Resistivity Tools
Dual Laterolog DLL/MDL
Micro Spherically Focused Log MSFL/MMR
Induction MAI/STI/ICAT
Focused Resistivity Log MFE/SFL
Microlog MML/MRT
28© 2006 Weatherford. All rights reserved.© 2006 Weatherford. All rights reserved.
Formation and Flushed Zone Resistivity Depth of Filtrate Invasion Estimates from tornado charts Water Saturations Fluid Contacts Permeability Indicator (SP) Hydrocarbon Indicators.
Resistivity Tool Applications
29© 2006 Weatherford. All rights reserved.© 2006 Weatherford. All rights reserved.
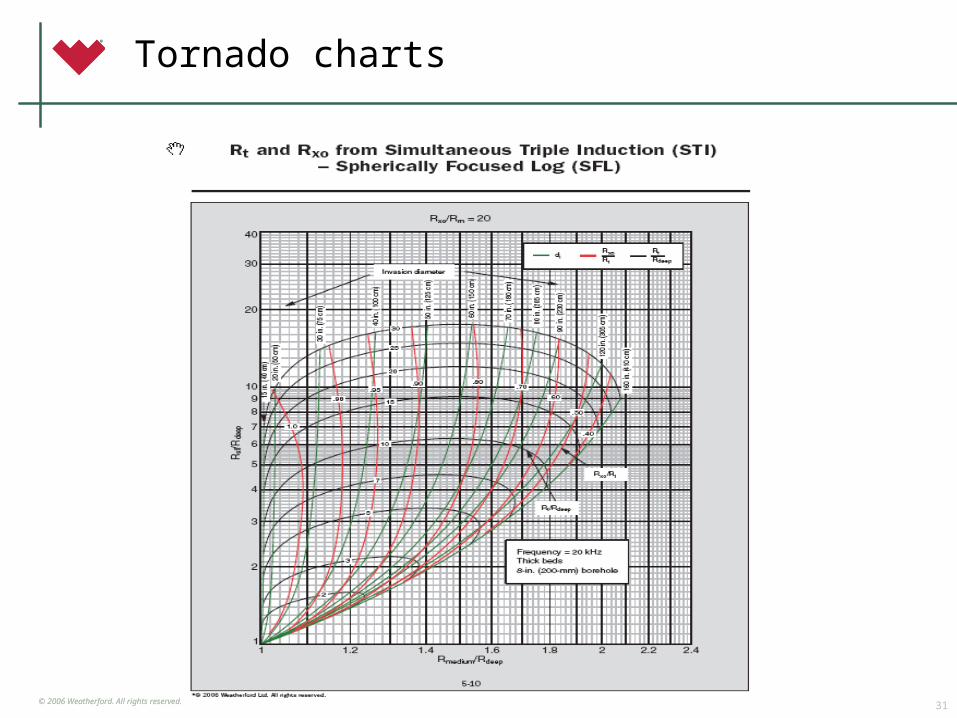
Rt Measurements
• Normally,Rt is directly read from the deep resistivity measurement
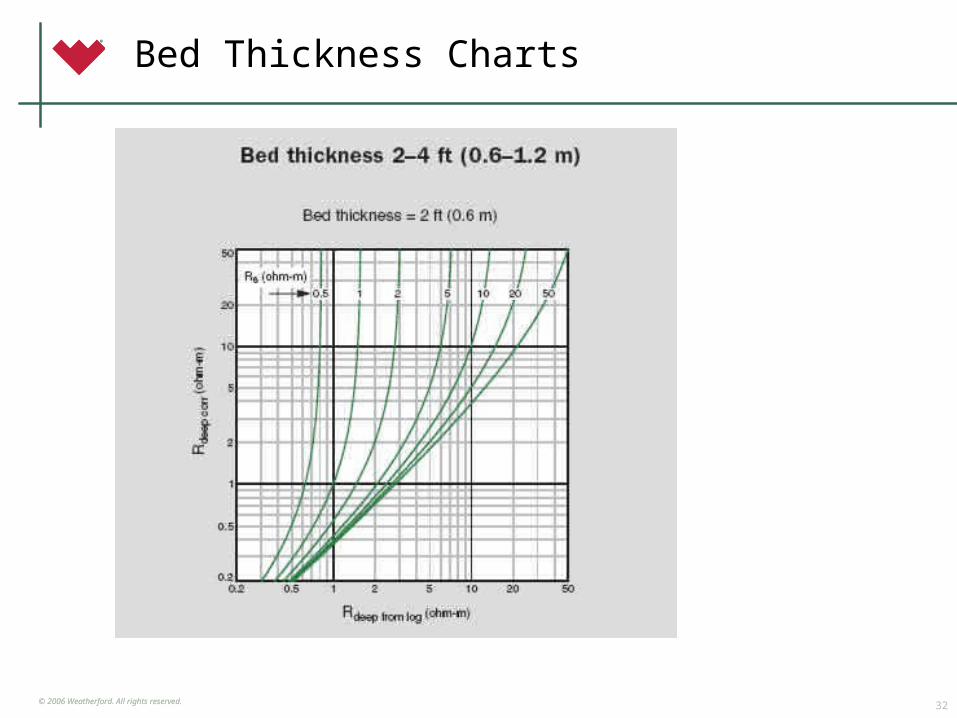
• In the case of thin beds or a formation with invasion, there should be a correction done for Rt
• This can be done from the chart books or can be software related (RtAP for Compact)
30© 2006 Weatherford. All rights reserved.© 2006 Weatherford. All rights reserved.
Tornado charts
• Used to correct for Rt in an invaded zone
31© 2006 Weatherford. All rights reserved.© 2006 Weatherford. All rights reserved.
Tornado charts
32© 2006 Weatherford. All rights reserved.© 2006 Weatherford. All rights reserved.
Bed Thickness Charts
33© 2006 Weatherford. All rights reserved.© 2006 Weatherford. All rights reserved.
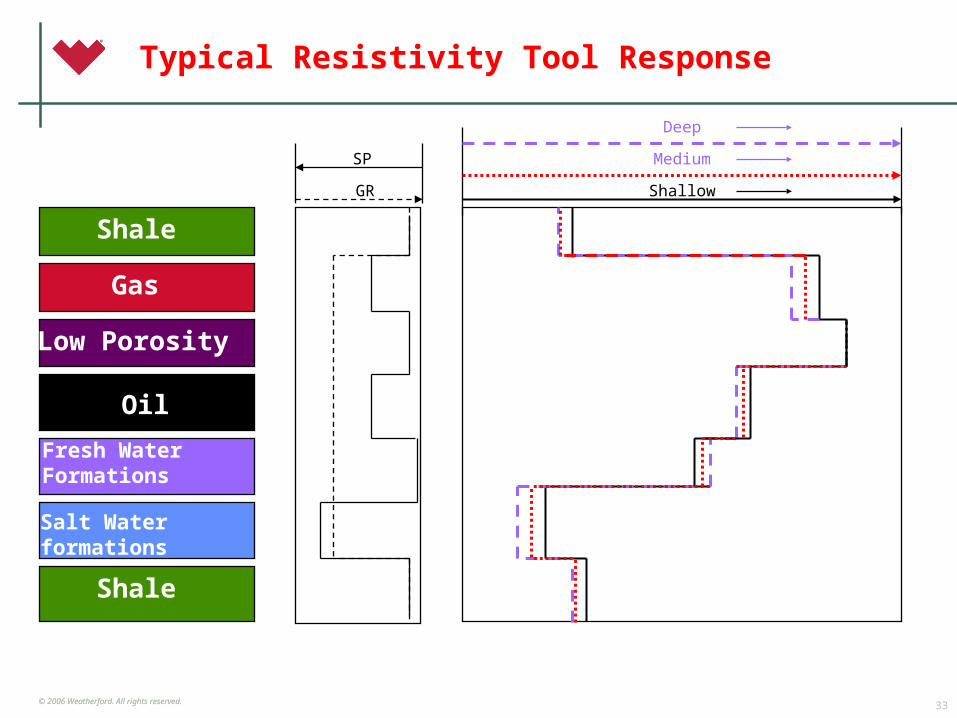
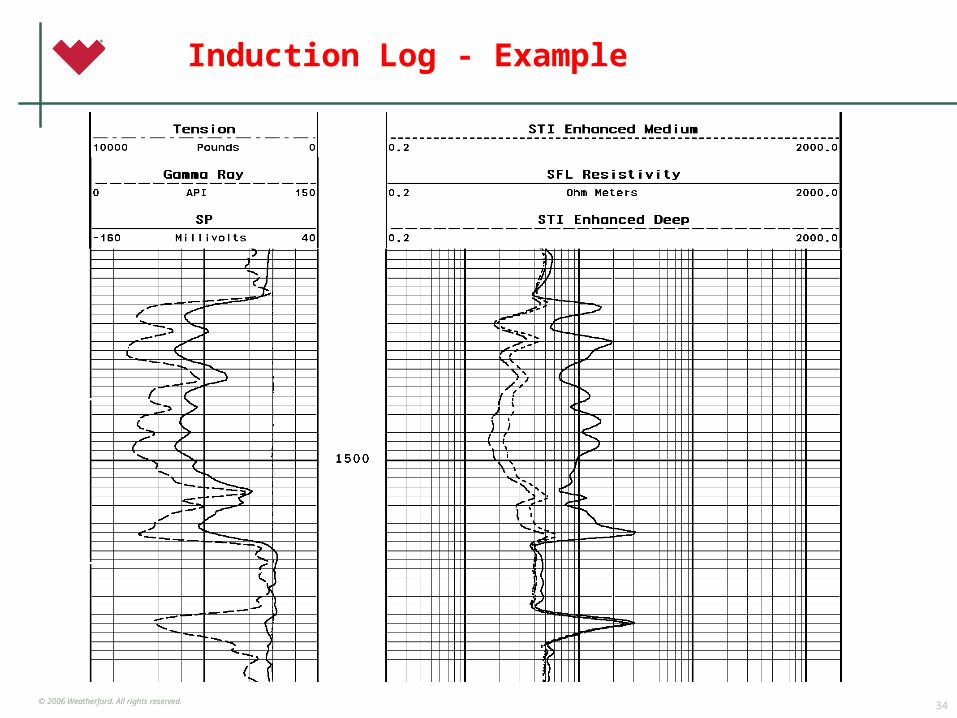
Typical Resistivity Tool Response
Oil
Shale
Shale
Gas
Salt Water formations
Low Porosity
Fresh Water Formations
SP
GR
Deep
Shallow
Medium
34© 2006 Weatherford. All rights reserved.© 2006 Weatherford. All rights reserved.
Induction Log - Example
35© 2006 Weatherford. All rights reserved.© 2006 Weatherford. All rights reserved.
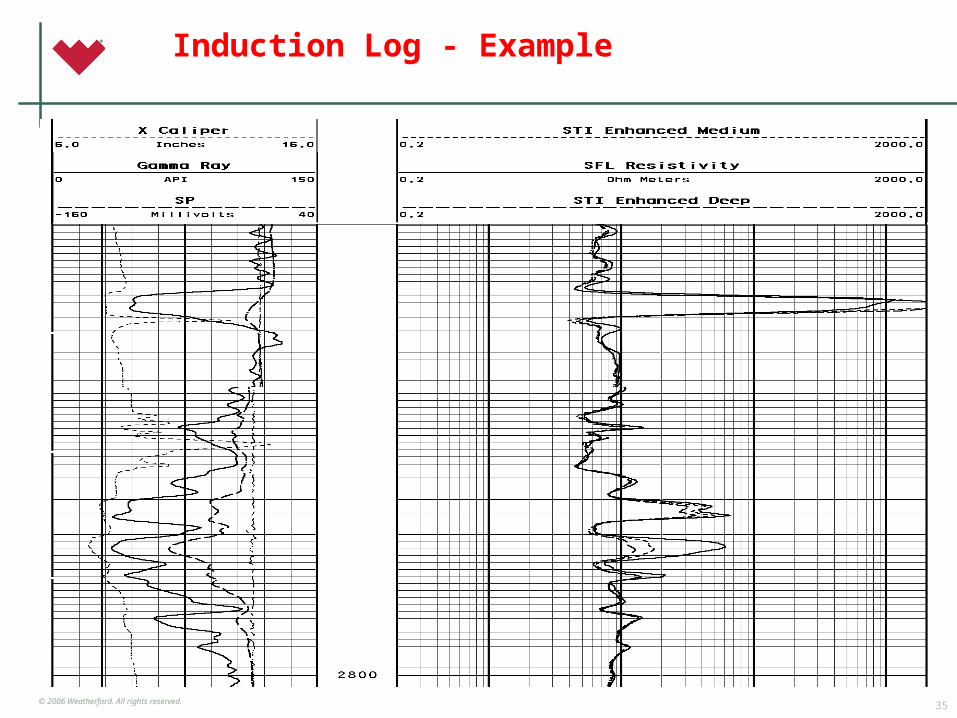
Induction Log - Example
© 2006 Weatherford. All rights reserved.© 2006 Weatherford. All rights reserved.
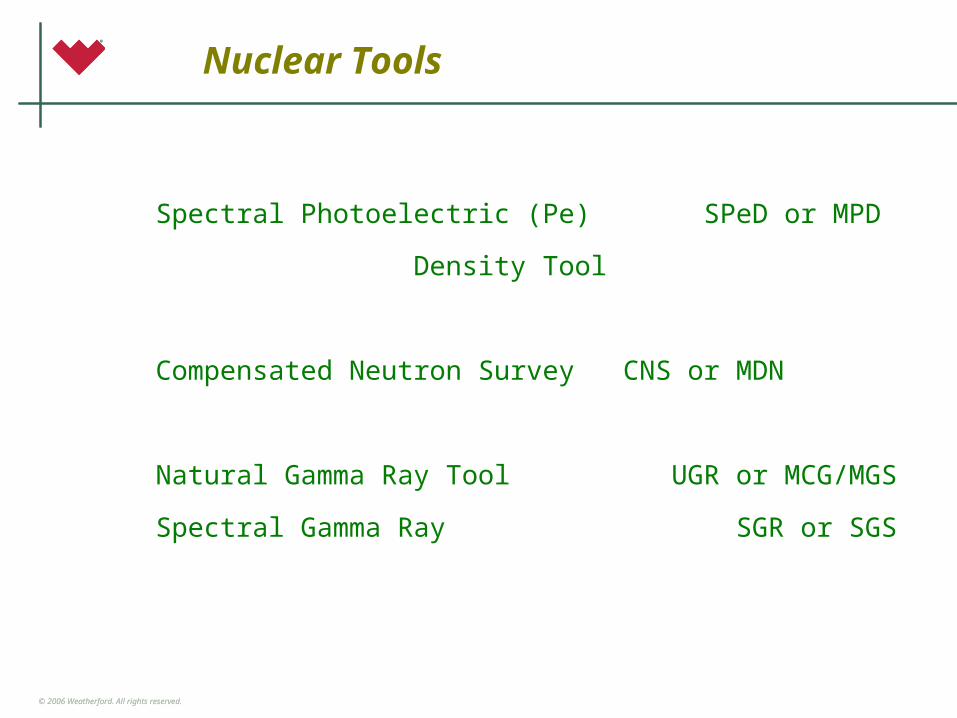
Nuclear Tools
Spectral Photoelectric (Pe) SPeD or MPD
Density Tool
Compensated Neutron Survey CNS or MDN
Natural Gamma Ray Tool UGR or MCG/MGS
Spectral Gamma Ray SGR or SGS
42© 2006 Weatherford. All rights reserved.© 2006 Weatherford. All rights reserved.
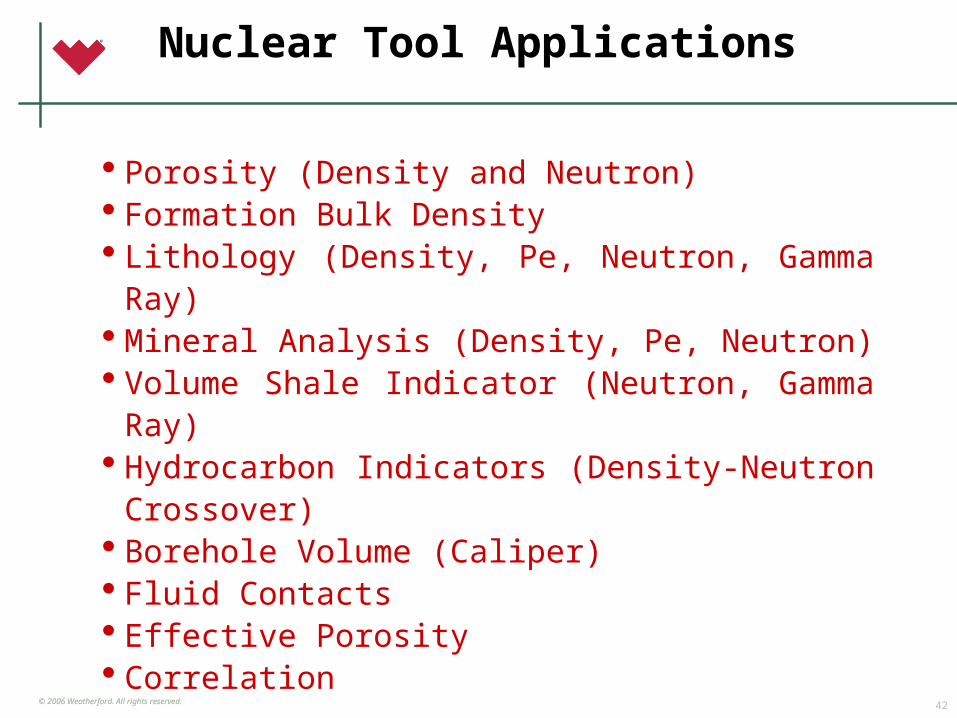
Porosity (Density and Neutron) Formation Bulk Density Lithology (Density, Pe, Neutron, Gamma Ray) Mineral Analysis (Density, Pe, Neutron) Volume Shale Indicator (Neutron, Gamma Ray) Hydrocarbon Indicators (Density-Neutron Crossover) Borehole Volume (Caliper) Fluid Contacts Effective Porosity Correlation
Nuclear Tool Applications
43© 2006 Weatherford. All rights reserved.© 2006 Weatherford. All rights reserved.
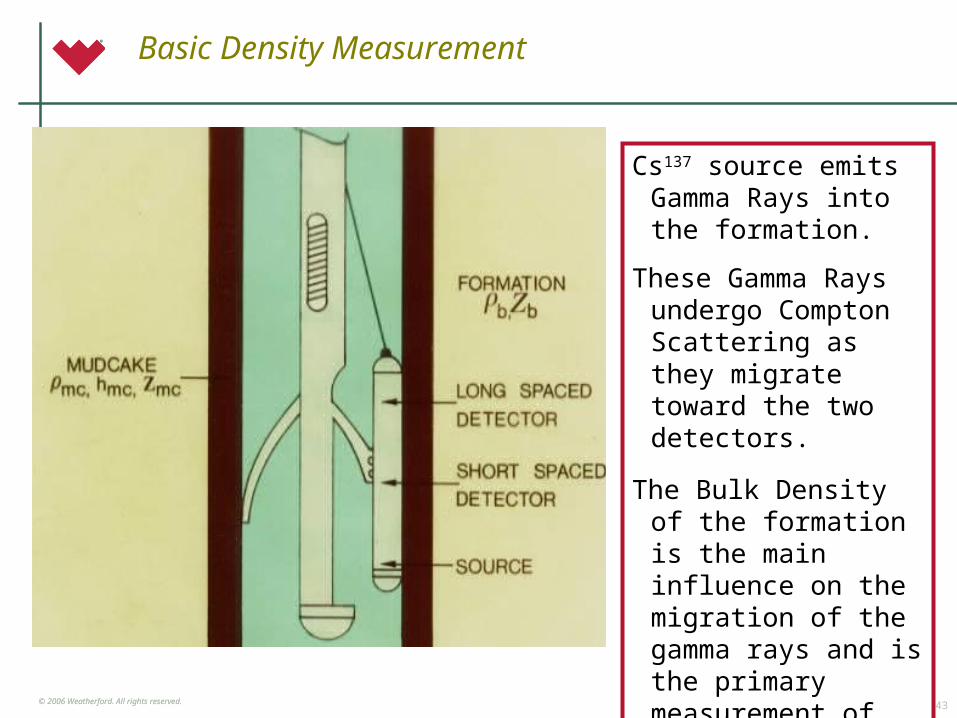
Basic Density Measurement
Cs137 source emits Gamma Rays into the formation.
These Gamma Rays undergo Compton Scattering as they migrate toward the two detectors.
The Bulk Density of the formation is the main influence on the migration of the gamma rays and is the primary measurement of the
density tool.
44© 2006 Weatherford. All rights reserved.© 2006 Weatherford. All rights reserved.
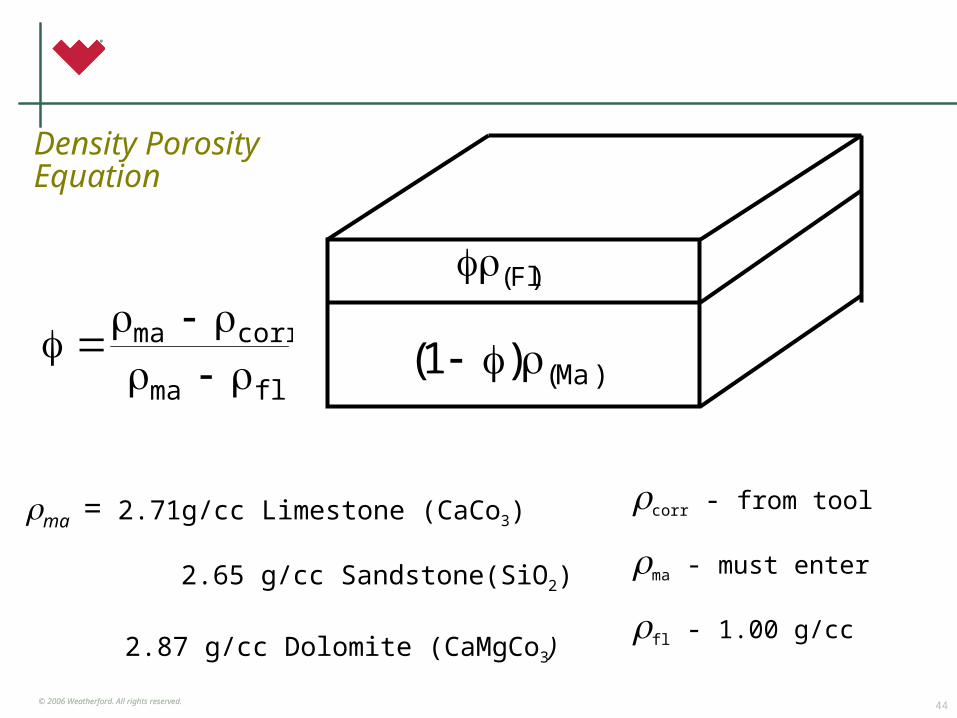
Density PorosityEquation
corr - from tool
ma - must enter
fl - 1.00 g/cc
)Fl(
)Ma()( 1flma
corrma
ma = 2.71g/cc Limestone (CaCo3)
2.65 g/cc Sandstone(SiO2)
2.87 g/cc Dolomite (CaMgCo3)
45© 2006 Weatherford. All rights reserved.© 2006 Weatherford. All rights reserved.
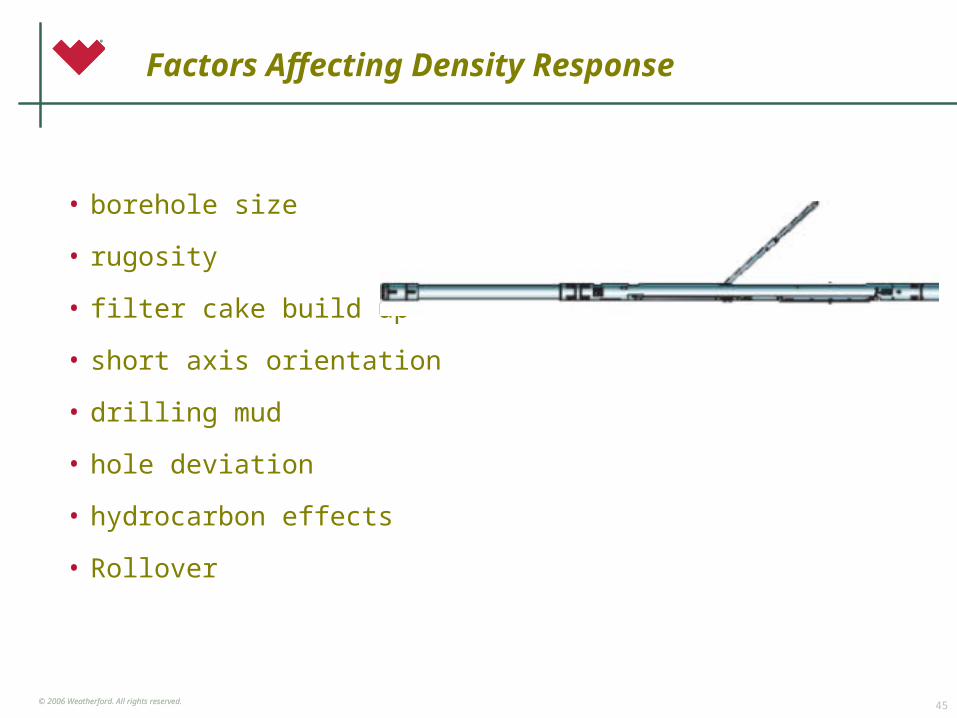
Factors Affecting Density Response
• borehole size
• rugosity
• filter cake build up
• short axis orientation
• drilling mud
• hole deviation
• hydrocarbon effects
• Rollover
47© 2006 Weatherford. All rights reserved.© 2006 Weatherford. All rights reserved.
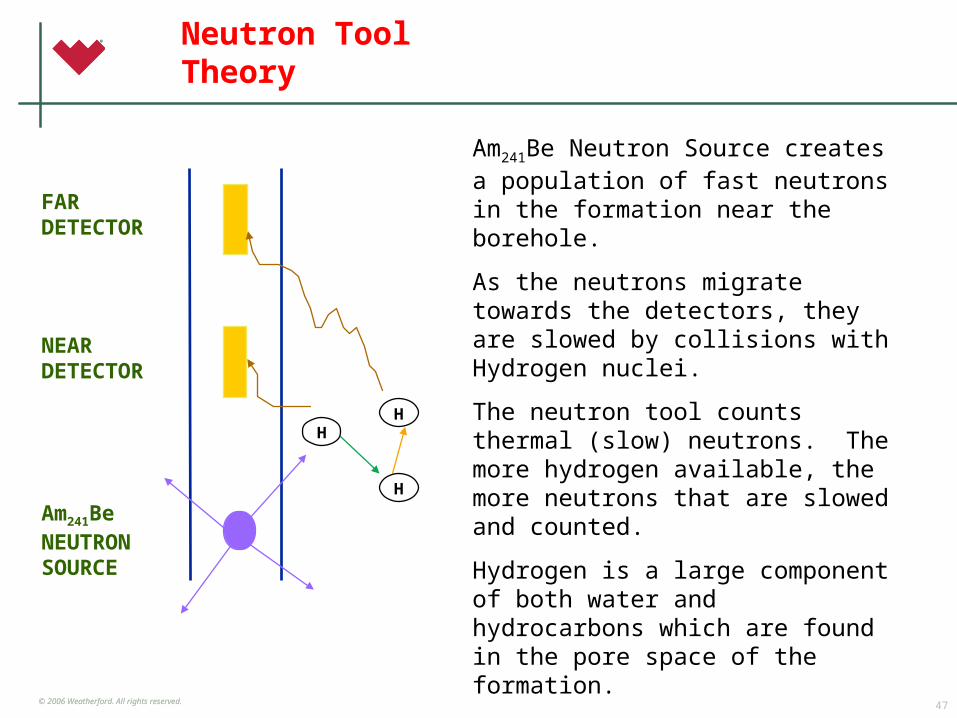
Neutron Tool Theory
Am241Be Neutron Source creates a population of fast neutrons in the formation near the borehole.
As the neutrons migrate towards the detectors, they are slowed by collisions with Hydrogen nuclei.
The neutron tool counts thermal (slow) neutrons. The more hydrogen available, the more neutrons that are slowed and counted.
Hydrogen is a large component of both water and hydrocarbons which are found in the pore space of the formation.
The ratio of the counts at each detector is then converted to porosity.
FARDETECTOR
NEARDETECTOR
Am241BeNEUTRONSOURCE
H
H
H
48© 2006 Weatherford. All rights reserved.© 2006 Weatherford. All rights reserved.
Factors Affecting Neutron Measurement
• Porosity
• Matrix (Elemental Makeup is different changing the capture cross-sections)
• Formation Fluid (water, gas, oil)
• Formation Fluid Salinity (Chlorine has a high capture ability)
• Formation Temperature
• Mud Type (density, salinity, temp, fluid type)
• Borehole Geometry (Diameter, Mudcake, Standoff, Shape)
49© 2006 Weatherford. All rights reserved.© 2006 Weatherford. All rights reserved.
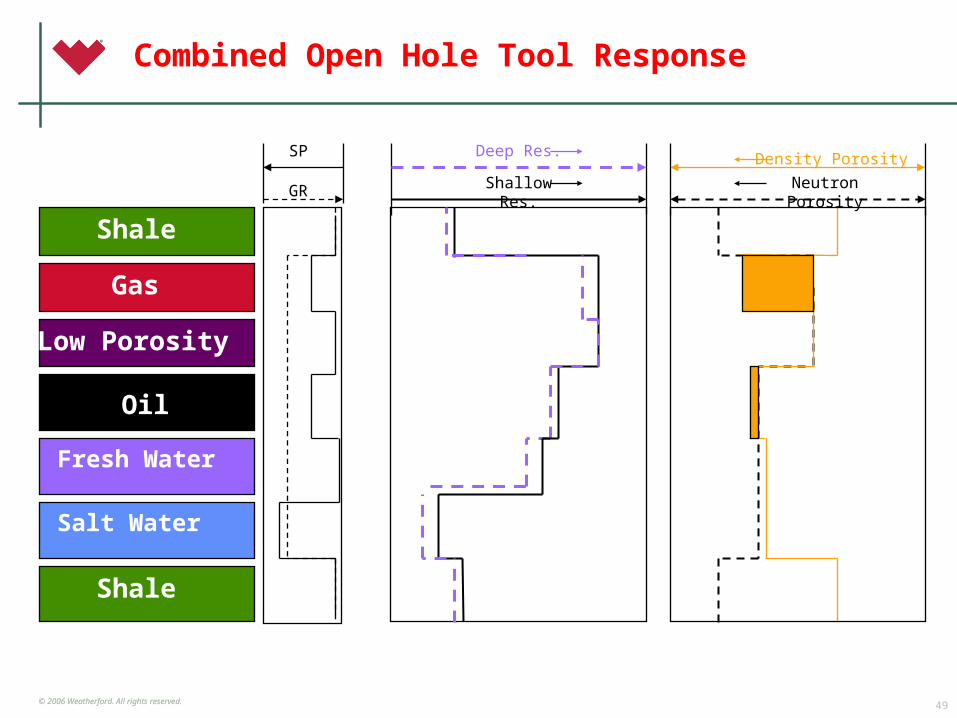
Combined Open Hole Tool Response
Oil
Shale
Shale
Gas
Salt Water
Neutron PorosityGR
Low Porosity
Fresh Water
Density PorosityDeep Res.SP
Shallow Res.
50© 2006 Weatherford. All rights reserved.© 2006 Weatherford. All rights reserved.
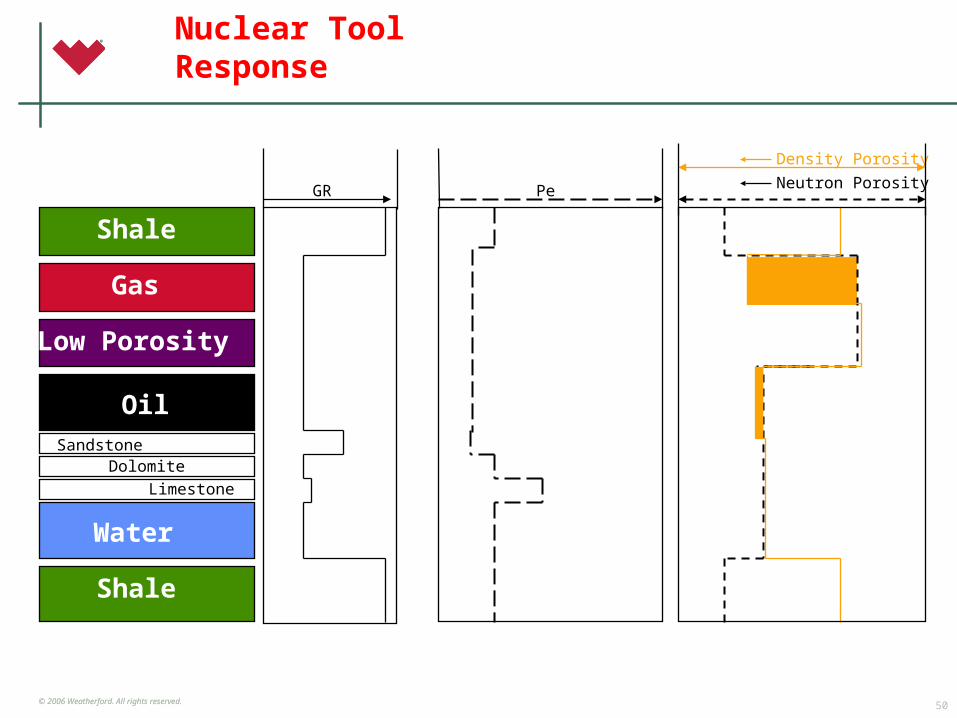
Nuclear Tool Response
Shale
Shale
Gas
Water
Low Porosity
Neutron Porosity
Density Porosity
GR Pe
Limestone
Dolomite Sandstone
Oil
51© 2006 Weatherford. All rights reserved.© 2006 Weatherford. All rights reserved.
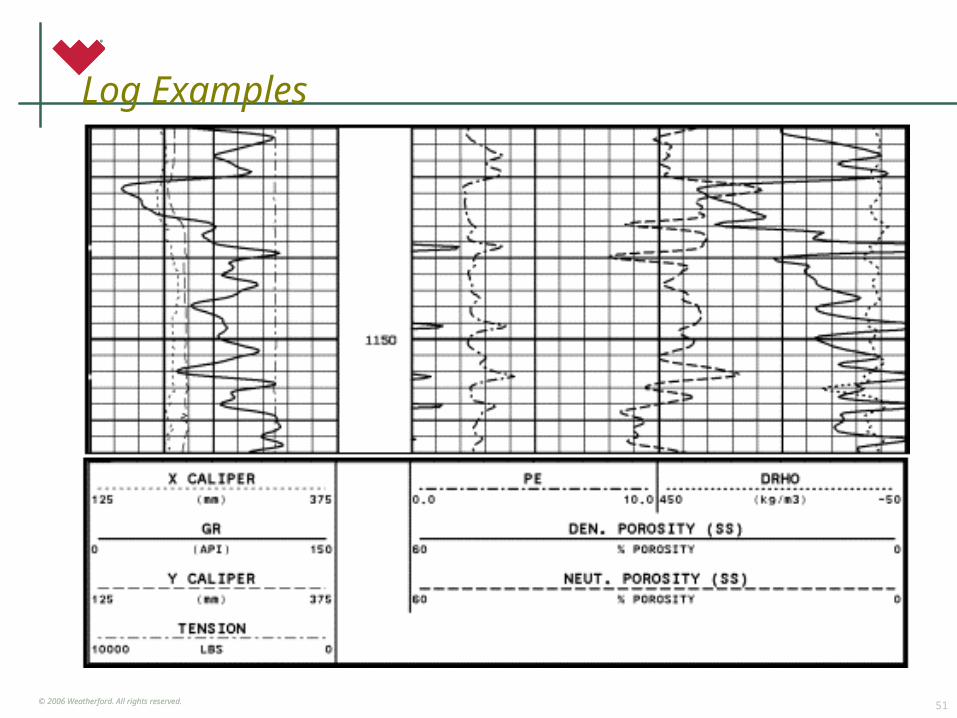
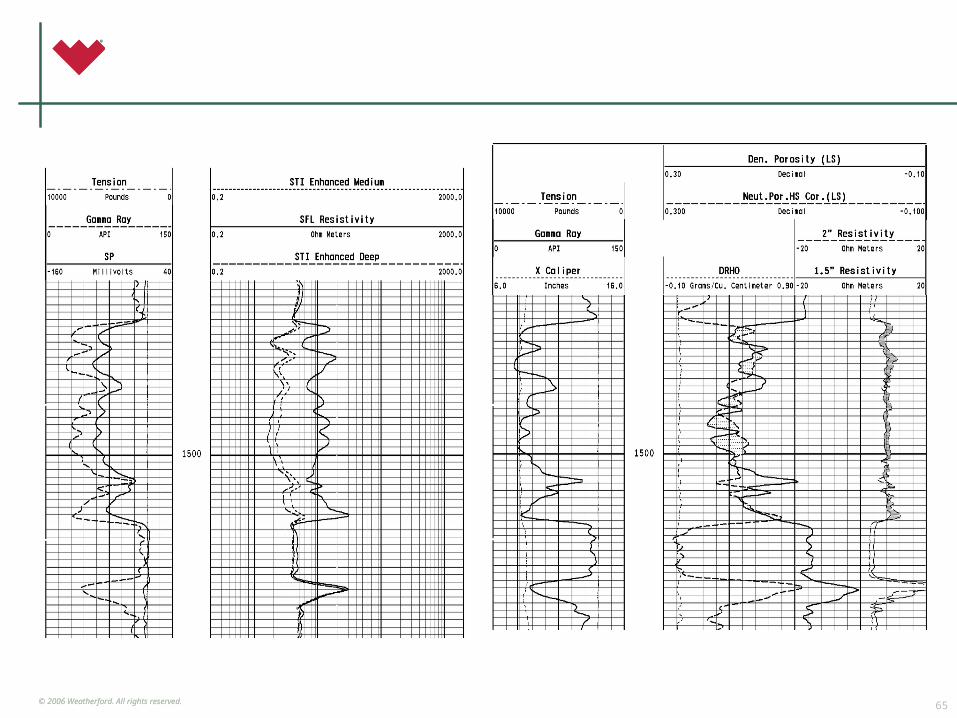
Log Examples
54© 2006 Weatherford. All rights reserved.© 2006 Weatherford. All rights reserved.
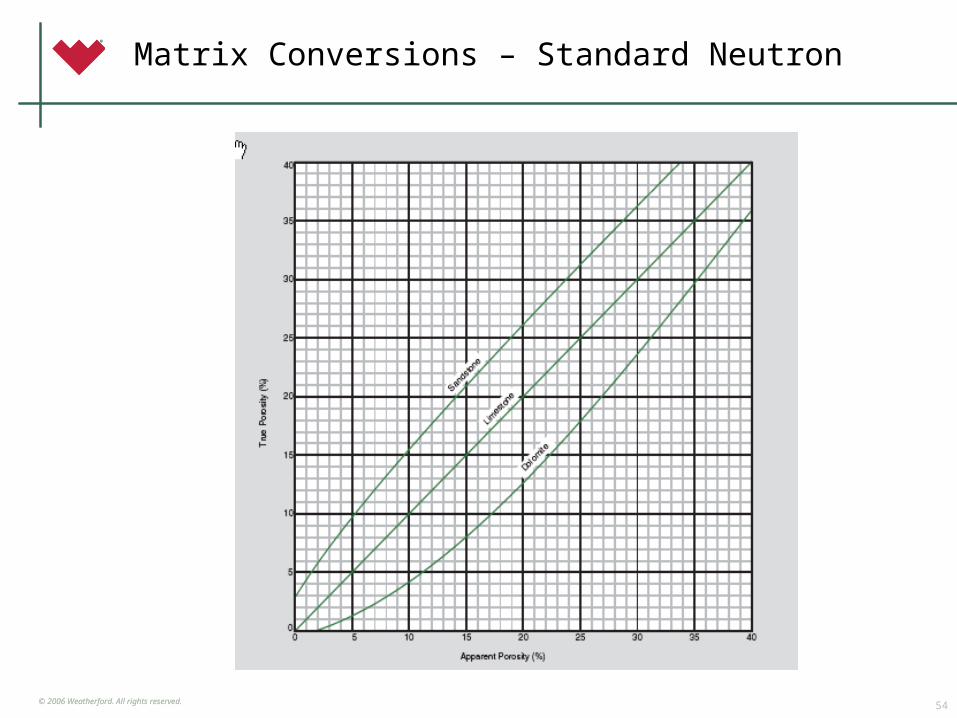
Matrix Conversions – Standard Neutron
© 2006 Weatherford. All rights reserved.© 2006 Weatherford. All rights reserved.
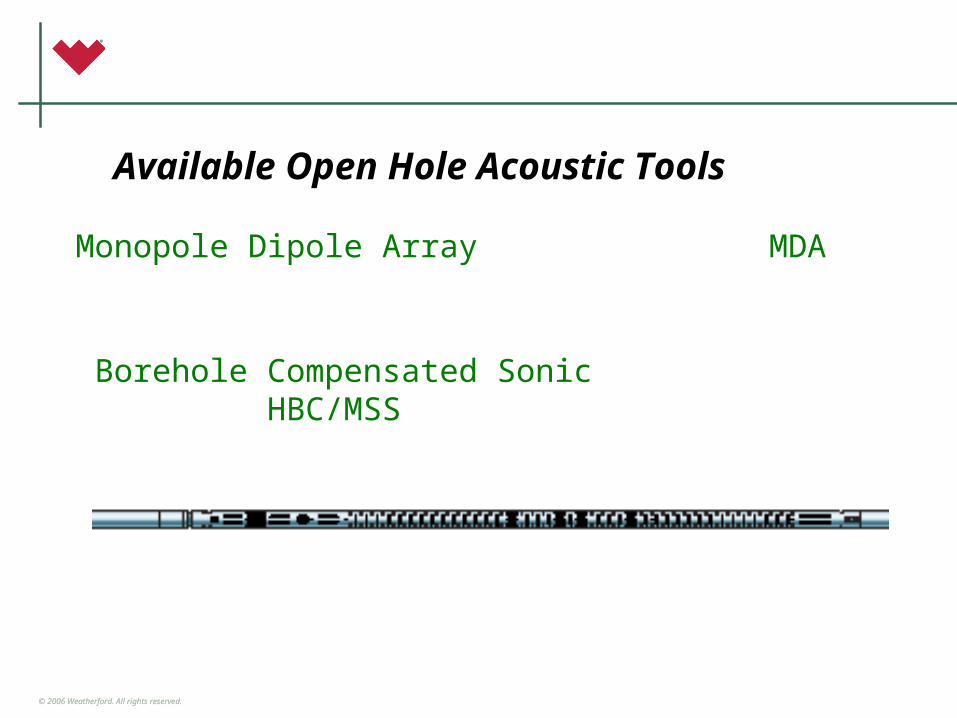
Available Open Hole Acoustic Tools
Monopole Dipole Array MDA
Borehole Compensated Sonic HBC/MSS
56© 2006 Weatherford. All rights reserved.© 2006 Weatherford. All rights reserved.
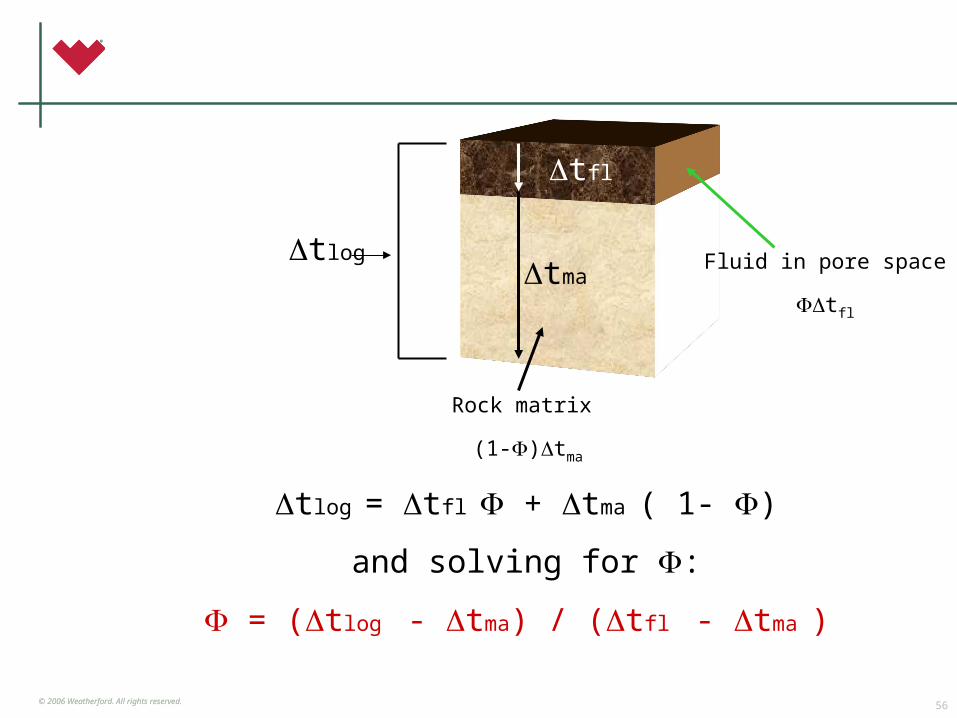
tlog
Rock matrix
(1-)tma
Fluid in pore space
tfl
tma
tfl
tlog = tfl + tma ( 1- )
and solving for :
= (tlog - tma) / (tfl - tma )
57© 2006 Weatherford. All rights reserved.© 2006 Weatherford. All rights reserved.
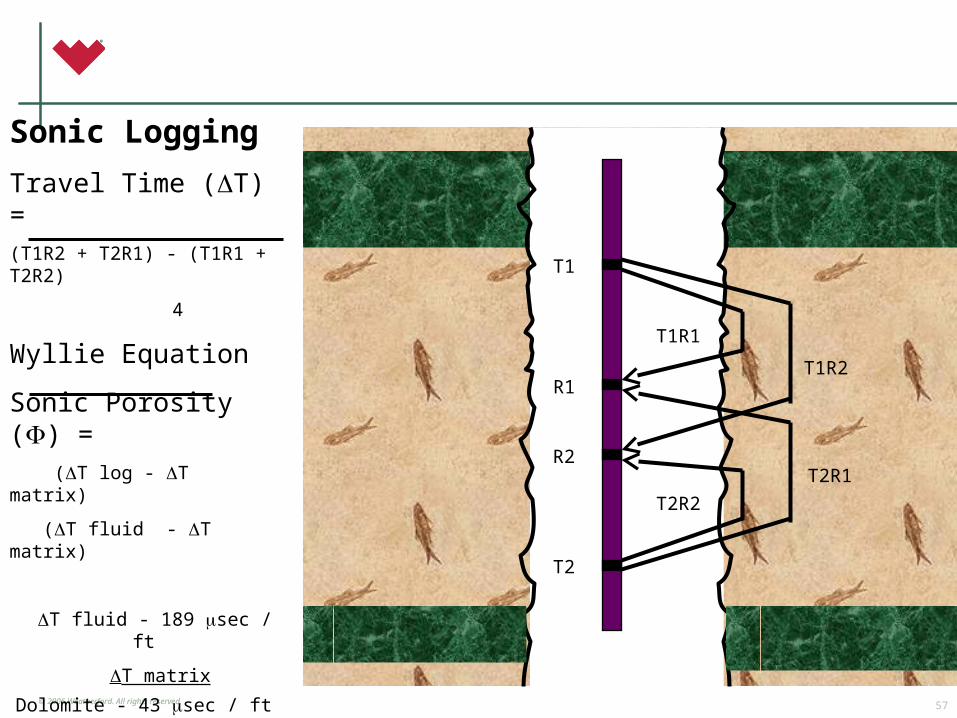
Sonic Logging
Travel Time (T) =(T1R2 + T2R1) - (T1R1 + T2R2)
4
Wyllie Equation
Sonic Porosity () = (T log - T matrix)
(T fluid - T matrix)
T fluid - 189 sec / ft
T matrix
Dolomite - 43 sec / ft
Limestone – 47.5 sec / ft
Anhydrite - 50 sec / ft
Sandstone – 55.5 sec / ft
Shale - 60 to 170 sec / ft
T1
R1
R2
T2
T1R2
T2R1
T1R1
T2R2
58© 2006 Weatherford. All rights reserved.© 2006 Weatherford. All rights reserved.
Advantages of sonic logs
• Borehole salinity and mudcake have little effect on response
• Formation fluid has little effect unless it is gas
• Borehole size has little effect when diameter is constant
• Indicator of secondary porosity
59© 2006 Weatherford. All rights reserved.© 2006 Weatherford. All rights reserved.
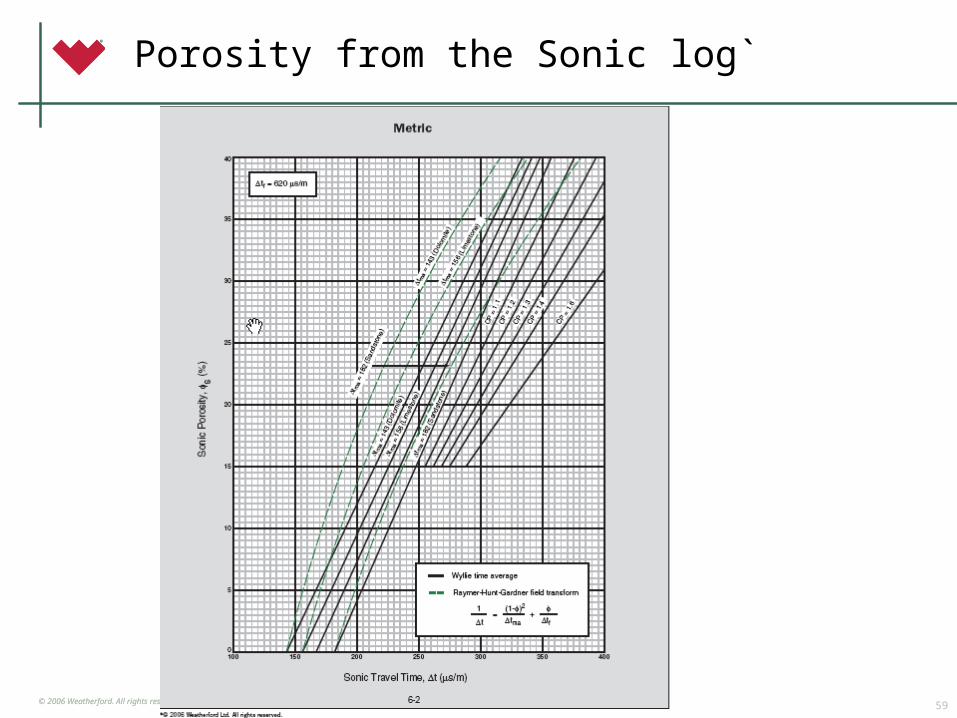
Porosity from the Sonic log`
60© 2006 Weatherford. All rights reserved.© 2006 Weatherford. All rights reserved.
Factors affecting sonic logs
• Borehole size
• Residual gas saturations
• Compaction factors
• Ignores vugular porosity to certain degree
• Can NOT be run in air or gas filled boreholes
61© 2006 Weatherford. All rights reserved.© 2006 Weatherford. All rights reserved.
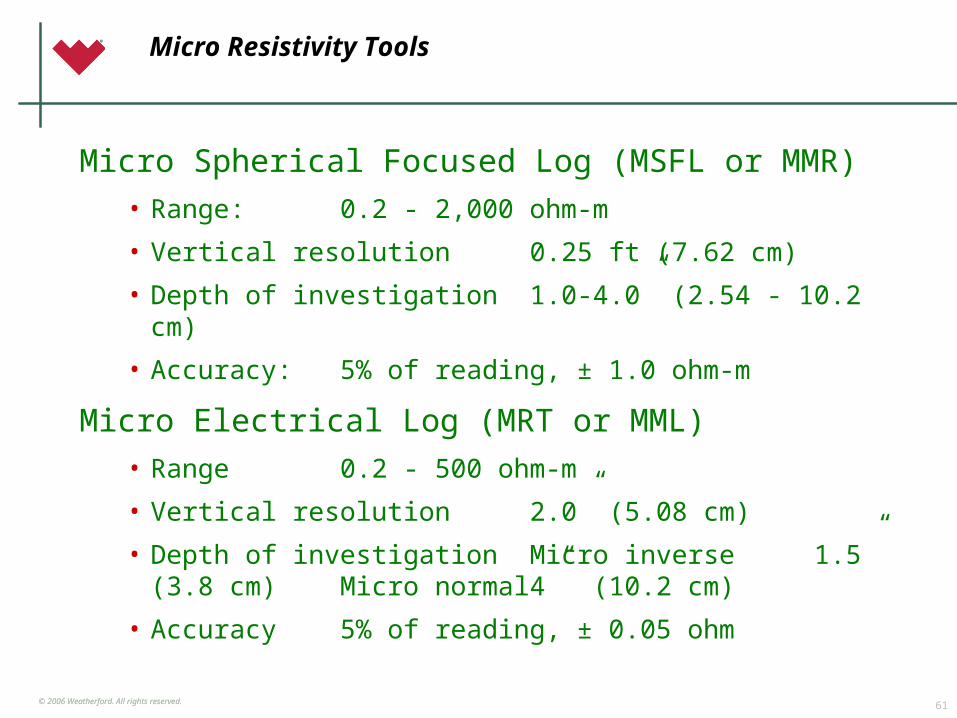
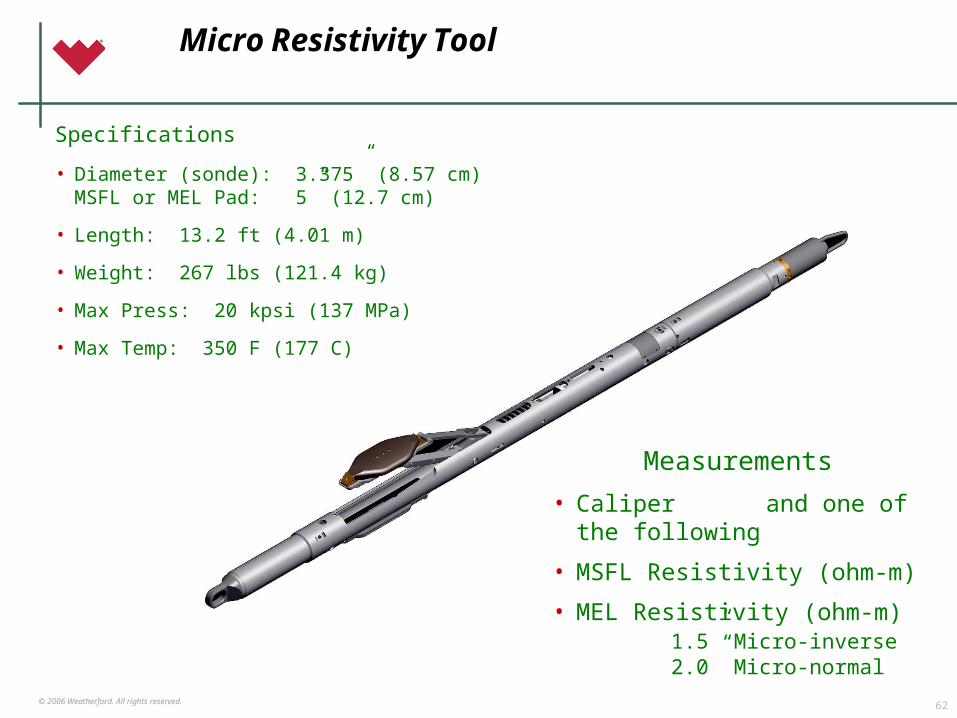
Micro Resistivity Tools
Micro Spherical Focused Log (MSFL or MMR)
• Range: 0.2 - 2,000 ohm-m
• Vertical resolution 0.25 ft (7.62 cm)
• Depth of investigation 1.0-4.0” (2.54 - 10.2 cm)
• Accuracy: 5% of reading, ± 1.0 ohm-m
Micro Electrical Log (MRT or MML)
• Range 0.2 - 500 ohm-m
• Vertical resolution 2.0” (5.08 cm)
• Depth of investigationMicro inverse 1.5” (3.8 cm)
Micro normal4” (10.2 cm)
• Accuracy 5% of reading, ± 0.05 ohm
62© 2006 Weatherford. All rights reserved.© 2006 Weatherford. All rights reserved.
Measurements
• Caliper and one of the following
• MSFL Resistivity (ohm-m)
• MEL Resistivity (ohm-m) 1.5” Micro-inverse 2.0” Micro-normal
Specifications
• Diameter (sonde): 3.375” (8.57 cm) MSFL or MEL Pad: 5” (12.7 cm)
• Length: 13.2 ft (4.01 m)
• Weight: 267 lbs (121.4 kg)
• Max Press: 20 kpsi (137 MPa)
• Max Temp: 350 F (177 C)
Micro Resistivity Tool
63© 2006 Weatherford. All rights reserved.© 2006 Weatherford. All rights reserved.
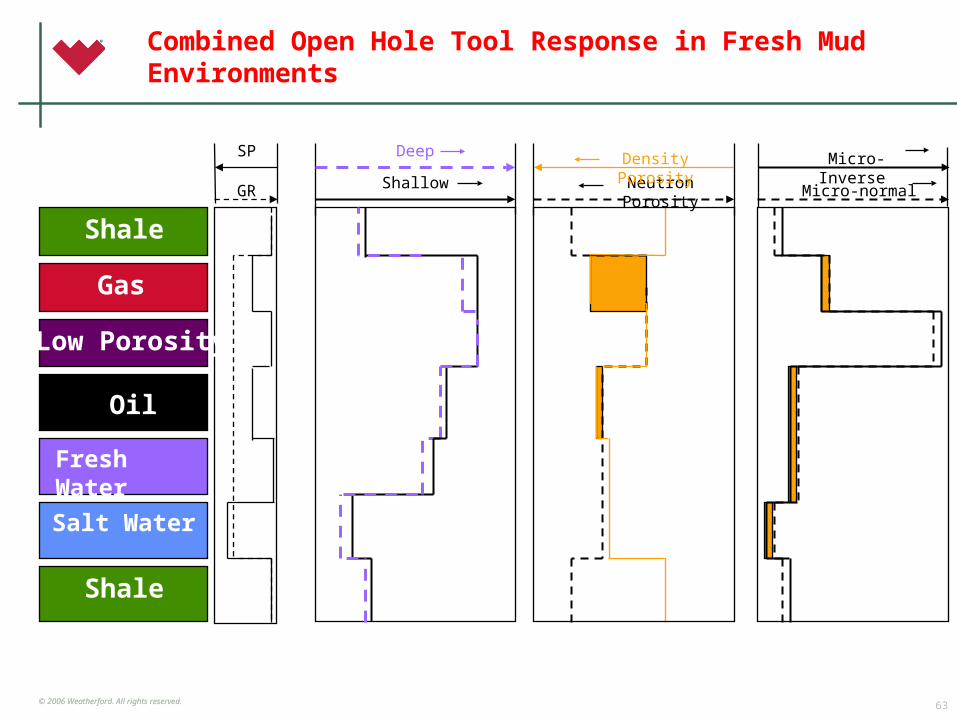
Combined Open Hole Tool Response in Fresh Mud Environments
Oil
Shale
Shale
Gas
Salt Water
Neutron PorosityGR
Low Porosity
Fresh Water
Density PorosityDeepSP
Shallow
Micro-Inverse
Micro-normal
64© 2006 Weatherford. All rights reserved.© 2006 Weatherford. All rights reserved.
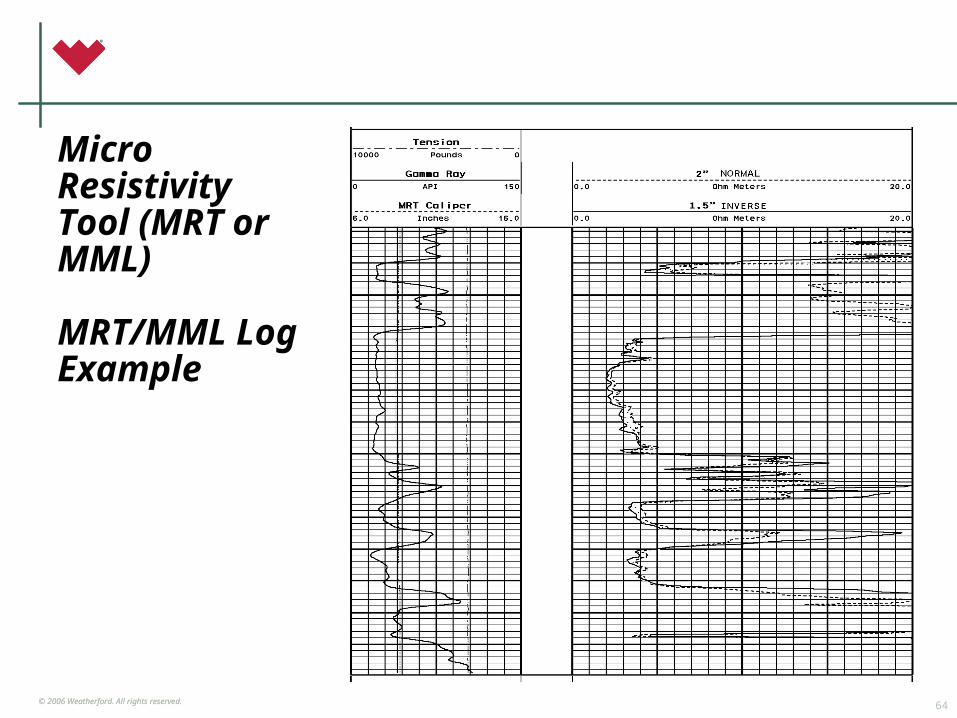
Micro Resistivity Tool (MRT or MML)
MRT/MML Log Example
65© 2006 Weatherford. All rights reserved.© 2006 Weatherford. All rights reserved.
75© 2006 Weatherford. All rights reserved.© 2006 Weatherford. All rights reserved.
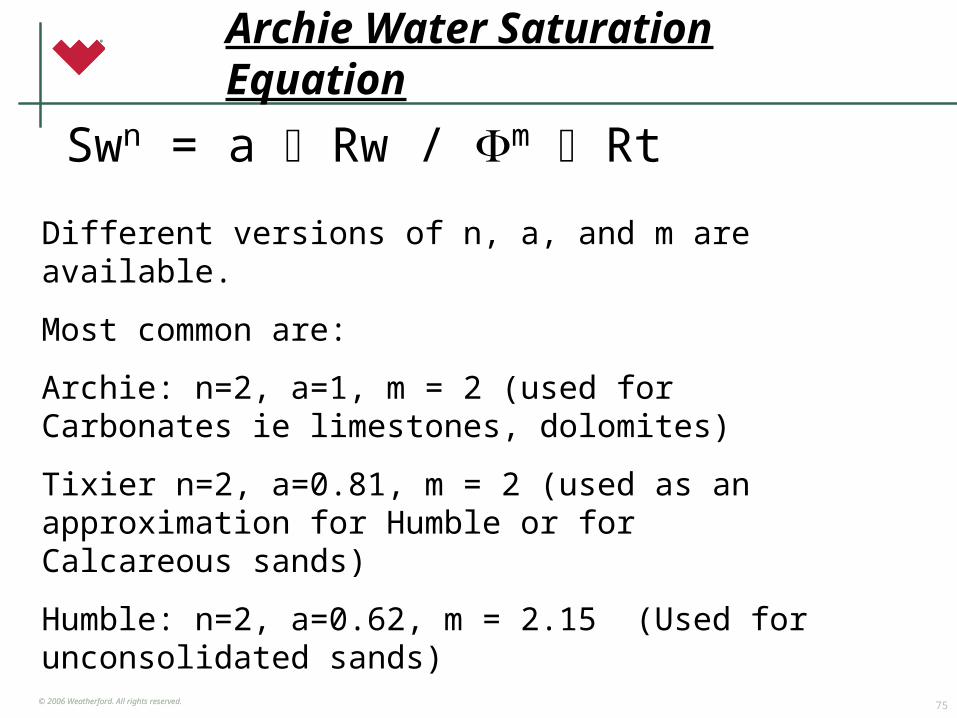
Archie Water Saturation Equation
Swn = a Rw / m Rt
Different versions of n, a, and m are available.
Most common are:
Archie: n=2, a=1, m = 2 (used for Carbonates ie limestones, dolomites)
Tixier n=2, a=0.81, m = 2 (used as an approximation for Humble or for Calcareous sands)
Humble: n=2, a=0.62, m = 2.15 (Used for unconsolidated sands)