baseline study madagascar tcpf - home | food and ...€¦ · baseline study of the shrimp trawl...
TRANSCRIPT
TCP/MAG/3201 – REBYC2
BASELINE STUDY OF THE SHRIMP TRAWL FISHERY IN MADAGASCAR
AND STRATEGIES FOR BYCATCH MANAGEMENT
Final Report
Hajanirina RAZAFINDRAINIBE
August 2010
TCP/MAG/3201 – REBYC2
Abstract
To establish the baseline situation of bycatch and discards in Madagascar’s shrimp
trawl fishery and the strategies for their management, a desk review of literature
coupled with information collection from various actors including Fisheries
Administration, related agencies, fishing companies and research centers was carried
out between November 2009 and February 2010. Information gathered was
presented to stakeholders from public and private sector institutions (including
relevant NGOS) through a series of focus group meetings, in June 2010, for validation
and updating. Information compiled was then presented to a one-day national
bycatch workshop held in the FAO Madagascar Office where input on the findings
was discussed in an open forum. 35 persons participated in the individual and group
workshops.
The key findings include: (i) the paucity of data on bycatch in the various shrimp
fisheries, the situation being more severe for the traditional sector, (ii) the significant
increase in catch and effort in the traditional multi gear shrimp fishery and dramatic
decreases in the landings by the industrial fleet, (iii) insufficiency of human, technical
and financial resources allocated to the sector to effectively manage the resources -
specifically to resources assessment, monitoring and surveillance. Great concern has
been raised by the public and private sector regarding interactions between the
industrial and traditional sectors and their mutual impacts, as well as the lack of
appropriate zoning and compliance, all contributing to declines in resources.
Participants to the various meetings and the national workshop recommended that
the overall objective of shrimp fisheries management should ensure the viability/
sustainability of the resources. For this, the traditional multi gear and the trawl
sectors should be managed as an integral unit. Both fisheries should be supported by
collection of scientific data including bycatch and discards as well as by an enhanced
monitoring, control and surveillance. Additional measures for resource and habitat
conservation should be through a network of Biologically Sensitive Shrimp Zones
(biology-based protected areas), appropriate zoning and governance. Together these
measures will contribute towards meeting the management objectives of shrimp and
the bycatch species concerned.
Workshop participants agreed that urgent actions are required to re-establish
traditional and industrial fisheries on a sustainable basis and that this could best be
achieved through a joint program of research and development involving public and
private sector partners including the Fisheries Administration, shrimp companies and
fishers, local communities, NGOs and all those concerned by the marine and coastal
areas, with the assistance from FAO for the development of technical cooperation
project.
TCP/MAG/3201 – REBYC2
Résumé
Une revue de littérature, conduite de pair avec une collecte d’information et de
données auprès de divers acteurs, incluant l’Administration Halieutique et de ses
agences rattachées, les sociétés de pêche et les centres de recherche, a été réalisée
de Novembre 2009 à Février 2010, afin d’établir la situation des captures
accessoires et des rejets de la pêche chalutière à la crevette à Madagascar. Les
informations collectées ont été présentées aux responsables des institutions du
secteur public et privé (dont les ONGs pertinentes), pour validation et mise à jour, au
cours d’une série de réunions par groupe cible organisée en Juin 2010. Les résultats
de ces réunions ont été compilés et restitués lors d’un atelier national sur les pêches
accessoires, tenu au siège de la FAO Madagascar. Le processus a vu la participation
de 35 personnes aux réunions et à l’atelier.
La revue a mis en exergue : (i) la rareté des données sur les captures accessoires des
différentes pêcheries, la situation étant plus sévère pour le secteur traditionnel ; (ii)
l’augmentation significative des captures et de l’effort de la pêche traditionnelle
multi-engin et la diminution spectaculaire des débarquements de la pêche
industrielle; (iii) l’insuffisance de moyens humains, techniques et financiers alloués
au secteur pour pouvoir gérer efficacement les ressources - spécifiquement pour
l’évaluation des ressources, le suivi et la surveillance. Les secteurs public et privé ont
exprimé leurs inquiétudes face aux interactions entre les secteurs industriel et
traditionnel et leurs impacts mutuels, ainsi qu’à l’absence d’aménagement spatial
approprié et son respect, tout ceci contribuant au déclin des ressources.
Les participants aux réunions et à l’atelier national ont recommandé comme objectif
global de la gestion des pêcheries crevettières d’assurer la viabilité/ durabilité des
ressources. Pour cela, la pêche traditionnelle multi- engin et la pêche chalutière
doivent être gérées comme une unité intégrale. Ces deux pêcheries devraient être
soutenues par une collecte de données scientifiques, dont des données sur les
captures accessoires et les rejets, ainsi que par un système de suivi, contrôle et
surveillance renforcé. Les mesures additionnelles pour la conservation de la
ressource et de l’habitat devraient considérer un réseau de Zones Crevettières
Biologiquement Sensibles (aires protégées basées sur la biologie), une gouvernance
et un aménagement spatial appropriés. L’ensemble de ces mesures contribueront à
l’atteinte des objectifs de gestion des ressources crevettières et des espèces
d’accompagnement concernées.
Les participants à l’atelier national ont reconnu que des actions urgentes s’imposent
pour restaurer les pêcheries industrielle et traditionnelle sur une base durable, et
qu’un programme conjoint de recherche et de développement impliquant les
partenaires des secteurs public et privé, incluant l’Administration Halieutique, les
sociétés de pêche, les pêcheurs traditionnels, les communautés locales , les ONGs et
tous ceux concernés par les zones marines et côtières, avec l’assistance de la FAO
pour le développement d’un projet de coopération technique, permettrait
d’atteindre cet objectif dans les meilleures conditions.
TCP/MAG/3201 – REBYC2
Acknowledgements
The author wishes to thank FAO for its support in preparing this report, in particular,
Mr. Amadou Moustapha KAMARA, FAO Representative Madagascar, Comoros,
Mauritius and the Seychelles, as well as Mr Honoré RAZAFIMBELO, Assistant
Représentant (Programme) and his staff of the FAO office in Madagascar.
Our acknowledgements go also to the Fisheries Administration and related Agencies
Officers for their precious contributions, specifically to Mr Njaka Ratsimanarisoa who
facilitated the work and contacts with various stakeholders, and to all shrimp fishing
companies who shared openly their points of view regarding the topic.
Special appreciation goes to Dr. Steve Kennelly for his guidance and his efforts in
reviewing an early manuscript and to FAO Rome for their support in technical
backstopping.
TCP/MAG/3201 – REBYC2
ABBREVIATIONS
AFD French Agency for Development
AGU Artisanal Gear Unit
BANACEM Base Nationale Crevettière de Madagascar
BRD By-catch Reducing Device
BSSZ Biologically Sensitive Shrimp Areas (ZCBS)
CNRO Centre National de Recherche Océanographique
CSP Centre de Surveillance des Pêches
EEZ Economic Exclusive Zone
FAO Food and Agricultural Organization
GAPCM Groupement des Aquaculteurs et Pêcheurs de Crevettes de Madagascar
HP Horse Power
IGU Industrial Gear Unit
IOTC Indian Ocean Tuna Commission
JICA Japanese International Cooperation Agency
OFCF Overseas Fisheries Cooperation Foundation
PNRC Programme National de Recherche Crevettière
SWIOFC South West Indian Ocean Fisheries Committee
TED Turtle Excluding Device
UNDP United Nations Development Programme
TCP/MAG/3201 – REBYC2
TABLE OF CONTENTS
1 OVERVIEW OF SHRIMP FISHERIES 1
1.1. Overview of bottom trawl fisheries, catch quantities, catch values and production
trends, overview of fishing effort. 1
1.2. Overview of employment in the trawl fisheries sub-sector 3
1.3. Distribution / marketing of bycatch nationally and for export 3
1.4. General condition of coastal trawl resources 5
1.4.1. Status of stocks 5
1.4.2. Shrimp species harvested, spatial and temporal distribution and variation 5
1.4.3. Quantities of low value / trash fish captured 8
1.5. Overview of traditional shrimp fisheries 9
1.6. The traditional fishing gears 9
1.6.1. Fishing efforts and catch 10
1.6.2. Shrimp size composition 11
2 DESCRIPTION OF SPECIFIC TRAWL FISHERIES: 12
2.1. Description of coastal bottom trawl fisheries in which shrimp are part of the catch by
main fleet segments. 12
2.1.1. Major fishing ports or landing sites 12
2.1.2. Number of vessels and type and size of vessels (including photos) 12
2.1.3. Fishing gears 13
2.1.4. Employment 14
2.1.5. Catches 14
2.1.6. Catch utilization and marketing: 17
2.2. Coastal fishing grounds for shrimp 18
3.1. Review of legal definitions and terms related to by-catch and discards 19
3.2. Review of management measures applied to each fleet 19
3.2.1. Licensing schemes 19
3.2.2. Effort control 19
3.2.3. Closures and Marine Protected Areas (MPAs) 20
3.2.4. Gear regulations to improve species and size selectivity 21
3.2.5. Bycatch reduction measures 21
3.2.6. National legislation related to bycatch and discards 21
3.2.7. Interactions of coastal trawl fisheries with prohibited, protected and threatened species 22
4 CONFLICTS BETWEEN DIFFERENT FLEET SEGMENTS, FISHERIES AND OTHER RESOURCE USERS 22
4.1. Nature of conflict 22
4.2. How the conflicts are addressed 22
5 COMPLIANCE WITH REGULATIONS 23
5.1. A review of MCS systems in place for trawl fisheries including use of VMS for monitoring
trawl vessels 23
5.2. Level of compliance with regulations 24
6 RESEARCH CONDUCTED TO MINIMIZE IMPACTS OF FISHING 26
6.1. Reviews of bycatch and discards studies 26
6.2. Reviews of technologies introduced to reduce bycatch and discards 27
6.3. Reviews of bycatch postharvest utilization, product / marketing improvements and
demand analyses 28
6.4. Reviews of success / failure with bycatch management and discard reduction measures 28
6.5. Reviews of studies of the impact of trawling on seabed habitats 29
7 BYCATCH MANAGEMENT AND REDUCTION OF DISCARDS 29
7.1. Specific problems encountered with respect to bycatch management and discard
reduction 29
TCP/MAG/3201 – REBYC2
7.2. Results of the consultation workshops 30
7.2.1. Focus group consultation workshops 30
7.2.1.1 Consultation of the Fisheries Administration 30
7.2.1.2 Consultation of the GAPCM 31
7.2.2. Recommendations of the final consultation workshop 32
LIST OF FIGURES
Figure 1. Evolution of shrimp catch per management zone from 1995 to 2007(Source:
BANACREM, 2009) .....................................................................................................................2
Figure 2. Evolution of shrimp trawl industry bycatch landings from 1995 to 2007 (source:
BANACREM) ...............................................................................................................................2
Figure 3. Monthly variation of target species yield and bycatch discarding rates in the
industrial shrimp trawling fishery in Madagascar (source : Ioniarilala, 2003) ...........................3
Figure 4. Evolution of employment in the Madagascar shrimp trawl industry from 2001 to
2008 (source: Observatoire Economique) .................................................................................3
Figure 5. Evolution of the relative abundance of F. indicus, P. semisulcatus and M.
monoceros with depth on the west coast of Madagascar(Source: Rafalimanana,
2003) ..........................................................................................................................................6
Figure 6. Monthly evolution of the main shrimp species in the trawlers’ catch in the 4
shrimp fishery management areas of Madagascar. (Source: Razafindrakoto,
2008) ..........................................................................................................................................7
Figure 7. Inter annual evolution of the shrimp species composition in the trawlers’ catch in
the 4 shrimp fishery management areas of Madagascar. (Source: Razafindrakoto,
2008) ..........................................................................................................................................8
Figure 8. Number of vessels according to their length............................................................................12
Figure 9. Evolution of number of industrial trawlers ..............................................................................13
Figure 10. Map of Madagascar - Isobaths 30 m and 200m, and statistic grids of 20 x 20
miles (Source : PNRC and Centre de Surveillance des Pêches – Madagascar).........................18
Figure 11. Location of the Biologically Sensitive Shrimp Zones in Bay of Ambaro, North West
Madagascar..............................................................................................................................21
Figure 12. Diagram of the TED model used by shrimp trawlers in Madagascar .......................................28
Figure 13. Schema and diagram of a shrimp trawl with BRD ....................................................................28
LIST OF TABLES
Table 1. Key information on shrimp industry from 2004 to 2007 (Source: Observatoire
économique de la filière crevettière).........................................................................................1
Table 2. Categorization and quantity per category of bycatch of one Shrimp Company on
the west coast in 2007 ...............................................................................................................4
Table 3. Estimates of shallow water shrimp Maximum Sustainable Yields by management
zones in Madagascar (source: Ralison, 1987) ............................................................................5
Table 4. The shrimp species caught by trawlers along the coast of Madagascar ....................................5
Table 5. Estimated bycatch quantity in 2002 (source: Ioniarilala, 2003) .................................................9
Table 6. Shrimp species composition of the catch of valakira in Ambaro Bay. (Source:
Rabarison, 1987) ........................................................................................................................9
Table 7. Evolution of the number of valakira in Ambaro Bay from 1971 to 1984. (Source:
Rabarison, 1987) ......................................................................................................................10
Table 8. Inventory of valakira in Ambaro Bay in 1988(Source: Rabarison, 1988) ..................................10
Table 9. Evolution of the number of the main traditional fishing gears in Ambaro Bay
from 2003 to 2005. (Source: PNRC, cited by Rakotondratsimba et al, 2008) ..........................11
Table 10. Size composition (in percent) of the shrimp caught by the valakira, the poto, the
kaokobe, the periky and the trawler in Ambaro Bay (Source: De Rodelec du
Porzic and Caverivière, 2008)...................................................................................................11
Table 11. Types and size of vessels ..........................................................................................................12
Table 12. Evolution of employee structure within Madagascar shrimp trawl industry from
2001 to 2008 (source: Observatoire Economique, 2009) ........................................................14
TCP/MAG/3201 – REBYC2
Table 13. Estimated by-catch and discards during the low season in 2004 and the high
season in 2005, in Tons (source : Randriarilala et al, 2005).....................................................14
Table 14. Composition of the main bycatch indicator species during the low season in
2004 and the high season in 2005 off the east coast (source : Randriarilala et al,
2005) ........................................................................................................................................14
Table 15. Composition of by-catch indicator species during the low season in 2004 and the
high season in 2005 off the west coast (source : Randriarilala et al, 2005).............................15
Table 16. Bycatch species discarded during the low season in 2004 in zone A. (source:
Randriarilala et al, 2005) ..........................................................................................................15
Table 17. Bycatch species discarded during the low season in 2004 in zone B. (source :
Randriarilala et al, 2005) ..........................................................................................................16
Table 18. Bycatch species discarded during the low season in 2004 in zone Northern C.
(source : Randriarilala et al, 2005) ...........................................................................................16
Table 19. Bycatch species discarded during the low season in 2004 in zone Southern C.
(source : Randriarilala et al, 2005) ...........................................................................................16
Table 20. Bycatch species discarded during the low season in 2004 in zone Northern D.
(source : Randriarilala et al, 2005) ...........................................................................................16
Table 21. Bycatch species discarded during the low season in 2004 in zone Southern D.
(source : Randriarilala et al, 2005) ...........................................................................................17
Table 22. Incidental catch of turtles as observed by CSP in 2004 and 2005 ............................................17
Table 23. Evolution of shrimp catch value and by-catch value from 2000 to 2008 .................................17
Table 24. Characteristics and number of authorized traditional fishing gears in
management zone A ................................................................................................................19
Table 25. Maximum effort units in shrimp trawl fisheries in Madagascar ..............................................20
Table 26. Number of regulation violation recorded in 2004, 2005 and 2006..........................................24
Table 27. Records of regulation violation in 2007 and 2008 (source: CSP)..............................................25
Table 28. Initiatives, studies and workshops on shrimp trawling fishery bycatch in
Madagascar..............................................................................................................................26
LIST OF ANNEXES
ANNEX 1. Catch and effort data by each demersal trawl fishery
ANNEX 2. Fleet statistics for each trawl fishery: Distribution of fishing licenses
ANNEX 3. Map of fishing grounds, mangroves and major fishing ports
ANNEX 4. Current Fisheries legislation and policy documents related to
ANNEX 5. The main species recorded in by-catch of shrimp trawl industry in Madagascar in 2001
ANNEX 6. Species composition of by-catch in zones 1, 2 &3
ANNEX 7. Exportation of fisheries products from 2005 to 2008
ANNEX 8. Restitution of data and information collected
ANNEX 9. Results of the focus group workshops
ANNEX 10. Discussions, proposals and recommendations of the final workshop based on the
consolidated results of the focus group workshops
TCP/MAG/3201 – REBYC2
1
1 OVERVIEW OF SHRIMP FISHERIES
1.1. Overview of bottom trawl fisheries, catch quantities, catch values and production trends,
overview of fishing effort.
Though the first surveys were undertaken in early 1950’s (Fourmanoir, 1952), the shrimp trawl fishery in
Madagascar commenced in 1967. Since then, the fishery developed rapidly to reach a maximum of 77
trawlers in 1996, then dropped to 61 in 2006. Such a rapid growth raised concerns about the
sustainability of the stocks.
The fishery started in 1967 along the north west coast and off Morondava. On the east coast,
commercial shrimp trawling became consistent since 1981. In the beginning, only one company
operated in Antongil Bay and more generally in northern Toamasina. More recently, new fishing grounds
were discovered in southern Toamasina.
In Madagascar, the shrimp fishery has 3 legally defined parts: the industrial trawl fishery, the artisanal
trawl fishery and the traditional multi-gear fishery.
The industrial fishery operates between 5 to 30 m depth, focusing on adult peneids. The number of
trawlers increased annually until 1996, then stabilized at around 70 vessels. After a peak of 79 vessels in
2001, the fishing fleet decreased continuously to 53 vessels in 2007. In 2010, most of the companies
intend to reduce the number of their operating vessels, as they do not expect catches to increase.
Trawlers are equipped with electronic devices (sounder, radar, standard telecommunication equipment,
etc.). Usually double twin Floridian trawl gear is used. The trawlers are classified into 3 categories
according to their length, power, on-board conservation facilities and autonomy.
By 2004, fishing and aquaculture had become the most dynamic primary industry in the national
economy. It was listed as the major foreign currency earner with mining and tourism. The trawl fishery
sector generated 5,000 direct jobs within a GDP of about US$ 55 Million.
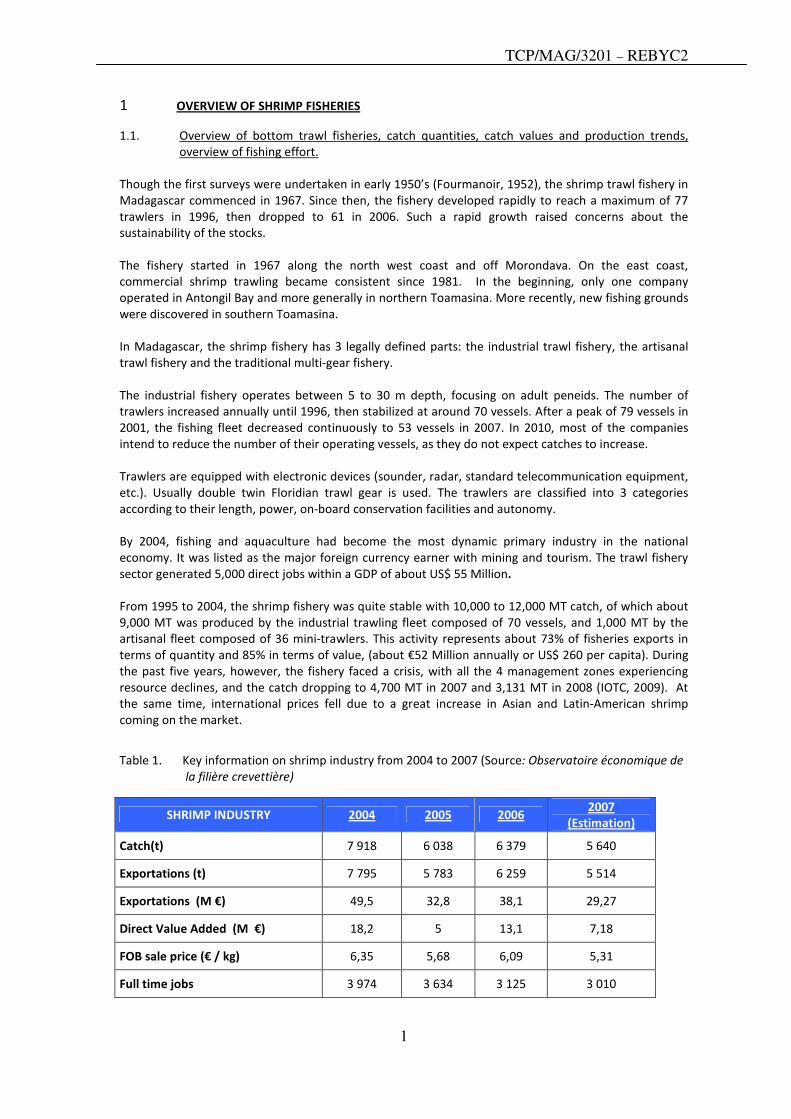
From 1995 to 2004, the shrimp fishery was quite stable with 10,000 to 12,000 MT catch, of which about
9,000 MT was produced by the industrial trawling fleet composed of 70 vessels, and 1,000 MT by the
artisanal fleet composed of 36 mini-trawlers. This activity represents about 73% of fisheries exports in
terms of quantity and 85% in terms of value, (about €52 Million annually or US$ 260 per capita). During
the past five years, however, the fishery faced a crisis, with all the 4 management zones experiencing
resource declines, and the catch dropping to 4,700 MT in 2007 and 3,131 MT in 2008 (IOTC, 2009). At
the same time, international prices fell due to a great increase in Asian and Latin-American shrimp
coming on the market.
Table 1. Key information on shrimp industry from 2004 to 2007 (Source: Observatoire économique de
la filière crevettière)
SHRIMP INDUSTRY 2004 2005 2006 2007
(Estimation)
Catch(t) 7 918 6 038 6 379 5 640
Exportations (t) 7 795 5 783 6 259 5 514
Exportations (M €) 49,5 32,8 38,1 29,27
Direct Value Added (M €) 18,2 5 13,1 7,18
FOB sale price (€ / kg) 6,35 5,68 6,09 5,31
Full time jobs 3 974 3 634 3 125 3 010
TCP/MAG/3201 – REBYC2
2
Figure 1. Evolution of shrimp catch per management zone from 1995 to 2007(Source: BANACREM,
2009)
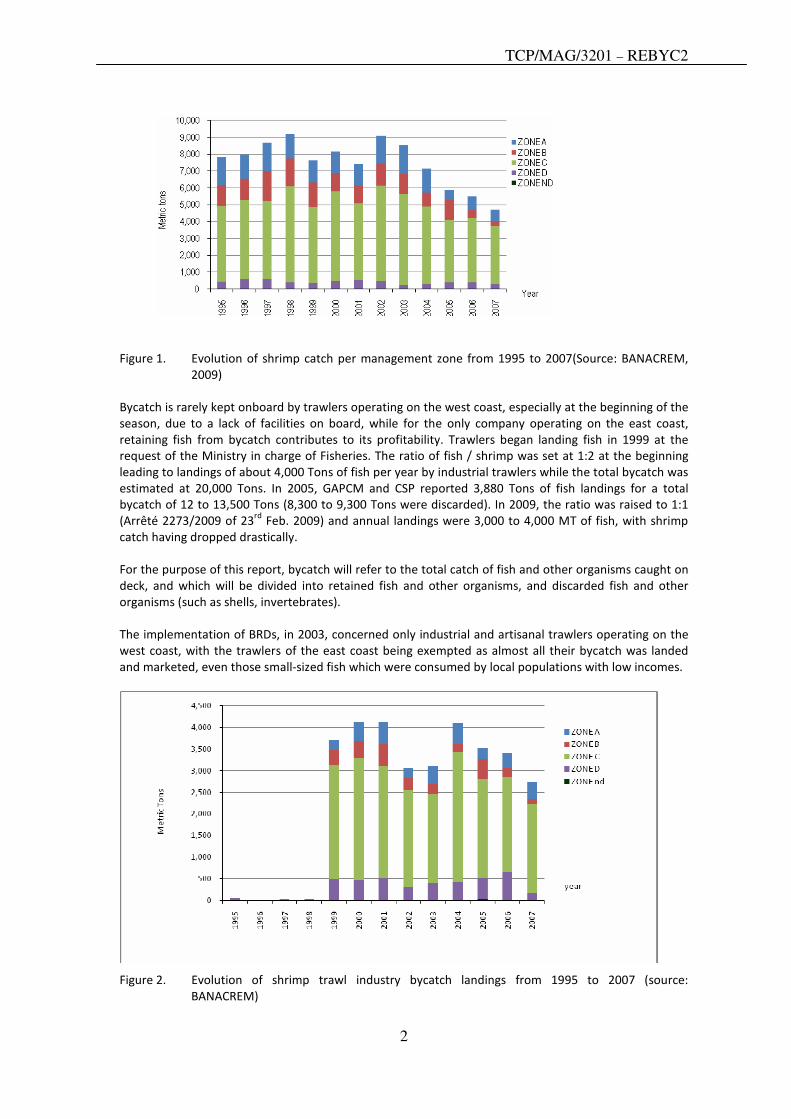
Bycatch is rarely kept onboard by trawlers operating on the west coast, especially at the beginning of the
season, due to a lack of facilities on board, while for the only company operating on the east coast,
retaining fish from bycatch contributes to its profitability. Trawlers began landing fish in 1999 at the
request of the Ministry in charge of Fisheries. The ratio of fish / shrimp was set at 1:2 at the beginning
leading to landings of about 4,000 Tons of fish per year by industrial trawlers while the total bycatch was
estimated at 20,000 Tons. In 2005, GAPCM and CSP reported 3,880 Tons of fish landings for a total
bycatch of 12 to 13,500 Tons (8,300 to 9,300 Tons were discarded). In 2009, the ratio was raised to 1:1
(Arrêté 2273/2009 of 23rd
Feb. 2009) and annual landings were 3,000 to 4,000 MT of fish, with shrimp
catch having dropped drastically.
For the purpose of this report, bycatch will refer to the total catch of fish and other organisms caught on
deck, and which will be divided into retained fish and other organisms, and discarded fish and other
organisms (such as shells, invertebrates).
The implementation of BRDs, in 2003, concerned only industrial and artisanal trawlers operating on the
west coast, with the trawlers of the east coast being exempted as almost all their bycatch was landed
and marketed, even those small-sized fish which were consumed by local populations with low incomes.
Figure 2. Evolution of shrimp trawl industry bycatch landings from 1995 to 2007 (source:
BANACREM)
TCP/MAG/3201 – REBYC2
3
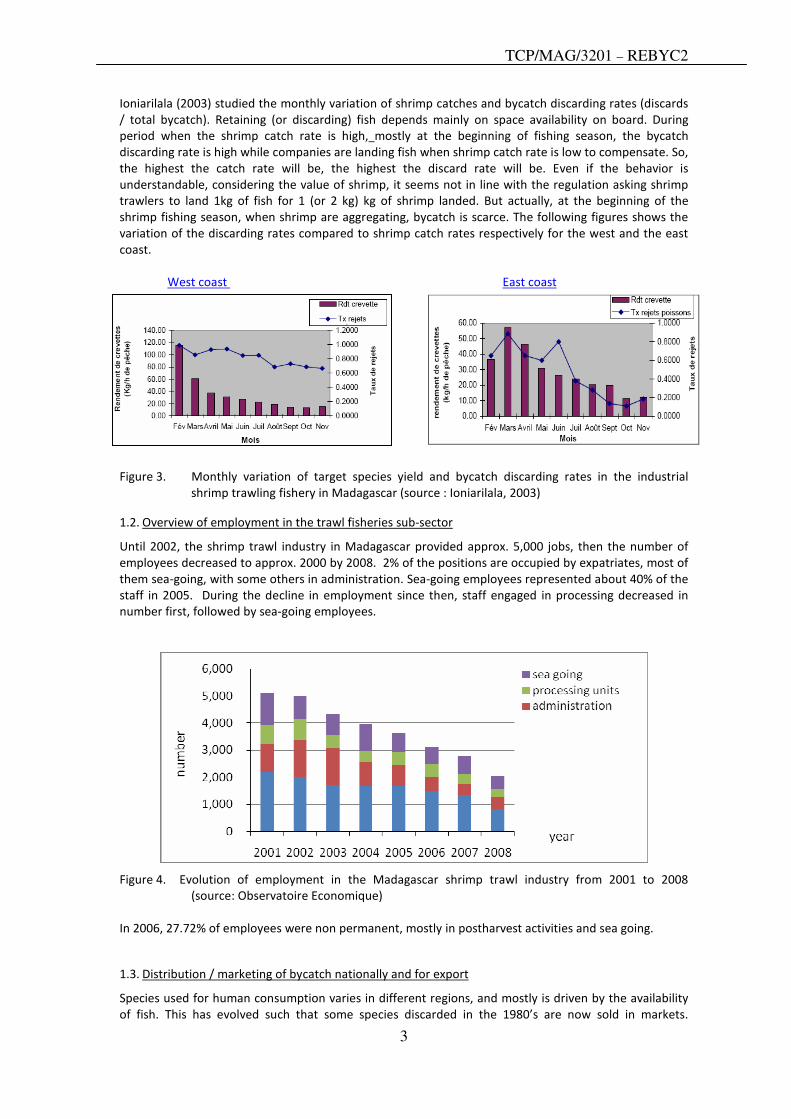
Ioniarilala (2003) studied the monthly variation of shrimp catches and bycatch discarding rates (discards
/ total bycatch). Retaining (or discarding) fish depends mainly on space availability on board. During
period when the shrimp catch rate is high, mostly at the beginning of fishing season, the bycatch
discarding rate is high while companies are landing fish when shrimp catch rate is low to compensate. So,
the highest the catch rate will be, the highest the discard rate will be. Even if the behavior is
understandable, considering the value of shrimp, it seems not in line with the regulation asking shrimp
trawlers to land 1kg of fish for 1 (or 2 kg) kg of shrimp landed. But actually, at the beginning of the
shrimp fishing season, when shrimp are aggregating, bycatch is scarce. The following figures shows the
variation of the discarding rates compared to shrimp catch rates respectively for the west and the east
coast.
West coast East coast
Figure 3. Monthly variation of target species yield and bycatch discarding rates in the industrial
shrimp trawling fishery in Madagascar (source : Ioniarilala, 2003)
1.2. Overview of employment in the trawl fisheries sub-sector
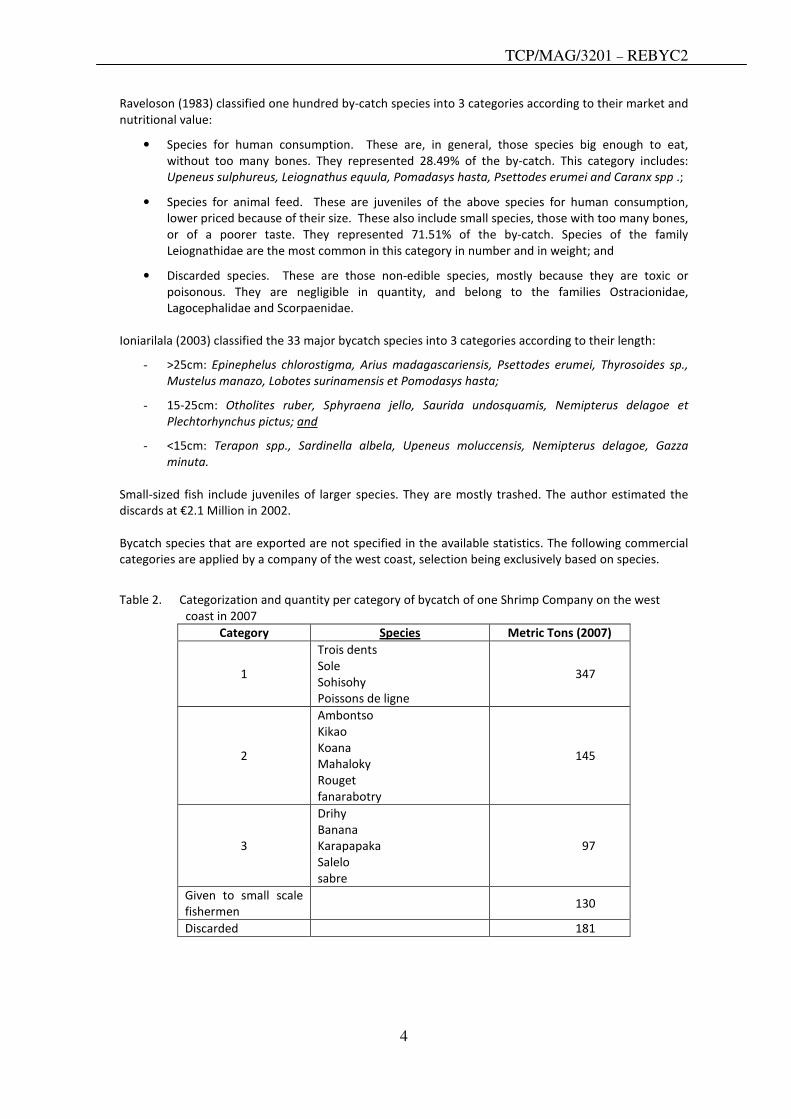
Until 2002, the shrimp trawl industry in Madagascar provided approx. 5,000 jobs, then the number of
employees decreased to approx. 2000 by 2008. 2% of the positions are occupied by expatriates, most of
them sea-going, with some others in administration. Sea-going employees represented about 40% of the
staff in 2005. During the decline in employment since then, staff engaged in processing decreased in
number first, followed by sea-going employees.
Figure 4. Evolution of employment in the Madagascar shrimp trawl industry from 2001 to 2008
(source: Observatoire Economique)
In 2006, 27.72% of employees were non permanent, mostly in postharvest activities and sea going.
1.3. Distribution / marketing of bycatch nationally and for export
Species used for human consumption varies in different regions, and mostly is driven by the availability
of fish. This has evolved such that some species discarded in the 1980’s are now sold in markets.
TCP/MAG/3201 – REBYC2
4
Raveloson (1983) classified one hundred by-catch species into 3 categories according to their market and
nutritional value:
• Species for human consumption. These are, in general, those species big enough to eat,
without too many bones. They represented 28.49% of the by-catch. This category includes:
Upeneus sulphureus, Leiognathus equula, Pomadasys hasta, Psettodes erumei and Caranx spp .;
• Species for animal feed. These are juveniles of the above species for human consumption,
lower priced because of their size. These also include small species, those with too many bones,
or of a poorer taste. They represented 71.51% of the by-catch. Species of the family
Leiognathidae are the most common in this category in number and in weight; and
• Discarded species. These are those non-edible species, mostly because they are toxic or
poisonous. They are negligible in quantity, and belong to the families Ostracionidae,
Lagocephalidae and Scorpaenidae.
Ioniarilala (2003) classified the 33 major bycatch species into 3 categories according to their length:
- >25cm: Epinephelus chlorostigma, Arius madagascariensis, Psettodes erumei, Thyrosoides sp.,
Mustelus manazo, Lobotes surinamensis et Pomodasys hasta;
- 15-25cm: Otholites ruber, Sphyraena jello, Saurida undosquamis, Nemipterus delagoe et
Plechtorhynchus pictus; and
- <15cm: Terapon spp., Sardinella albela, Upeneus moluccensis, Nemipterus delagoe, Gazza
minuta.
Small-sized fish include juveniles of larger species. They are mostly trashed. The author estimated the
discards at €2.1 Million in 2002.
Bycatch species that are exported are not specified in the available statistics. The following commercial
categories are applied by a company of the west coast, selection being exclusively based on species.
Table 2. Categorization and quantity per category of bycatch of one Shrimp Company on the west
coast in 2007
Category Species Metric Tons (2007)
1
Trois dents
Sole
Sohisohy
Poissons de ligne
347
2
Ambontso
Kikao
Koana
Mahaloky
Rouget
fanarabotry
145
3
Drihy
Banana
Karapapaka
Salelo
sabre
97
Given to small scale
fishermen
130
Discarded 181
TCP/MAG/3201 – REBYC2
5
1.4. General condition of coastal trawl resources
1.4.1. Status of stocks
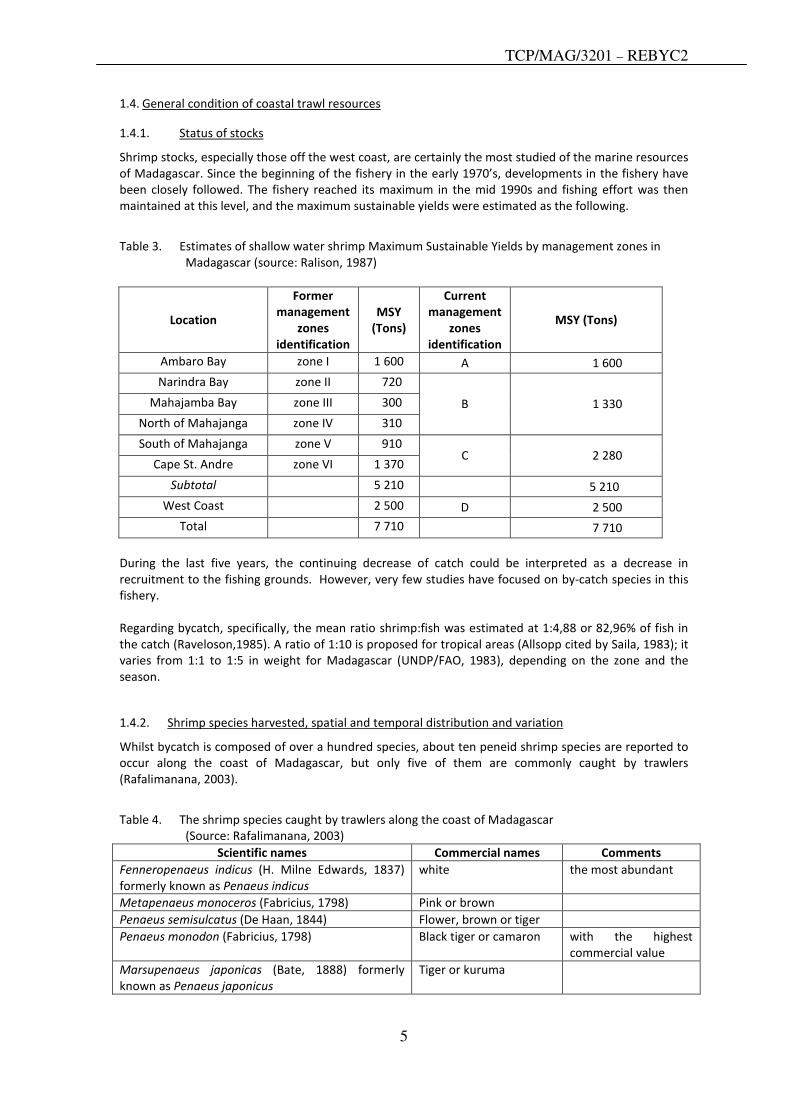
Shrimp stocks, especially those off the west coast, are certainly the most studied of the marine resources
of Madagascar. Since the beginning of the fishery in the early 1970’s, developments in the fishery have
been closely followed. The fishery reached its maximum in the mid 1990s and fishing effort was then
maintained at this level, and the maximum sustainable yields were estimated as the following.
Table 3. Estimates of shallow water shrimp Maximum Sustainable Yields by management zones in
Madagascar (source: Ralison, 1987)
Location
Former
management
zones
identification
MSY
(Tons)
Current
management
zones
identification
MSY (Tons)
Ambaro Bay zone I 1 600 A 1 600
Narindra Bay zone II 720
Mahajamba Bay zone III 300
North of Mahajanga zone IV 310
B 1 330
South of Mahajanga zone V 910
Cape St. Andre zone VI 1 370 C 2 280
Subtotal 5 210 5 210
West Coast 2 500 D 2 500
Total 7 710 7 710
During the last five years, the continuing decrease of catch could be interpreted as a decrease in
recruitment to the fishing grounds. However, very few studies have focused on by-catch species in this
fishery.
Regarding bycatch, specifically, the mean ratio shrimp:fish was estimated at 1:4,88 or 82,96% of fish in
the catch (Raveloson,1985). A ratio of 1:10 is proposed for tropical areas (Allsopp cited by Saila, 1983); it
varies from 1:1 to 1:5 in weight for Madagascar (UNDP/FAO, 1983), depending on the zone and the
season.
1.4.2. Shrimp species harvested, spatial and temporal distribution and variation
Whilst bycatch is composed of over a hundred species, about ten peneid shrimp species are reported to
occur along the coast of Madagascar, but only five of them are commonly caught by trawlers
(Rafalimanana, 2003).
Table 4. The shrimp species caught by trawlers along the coast of Madagascar
(Source: Rafalimanana, 2003)
Scientific names Commercial names Comments
Fenneropenaeus indicus (H. Milne Edwards, 1837)
formerly known as Penaeus indicus
white the most abundant
Metapenaeus monoceros (Fabricius, 1798) Pink or brown
Penaeus semisulcatus (De Haan, 1844) Flower, brown or tiger
Penaeus monodon (Fabricius, 1798) Black tiger or camaron with the highest
commercial value
Marsupenaeus japonicas (Bate, 1888) formerly
known as Penaeus japonicus
Tiger or kuruma
TCP/MAG/3201 – REBYC2
6
A sixth shrimp species is rarely caught by trawlers, Metapenaeus stebbengi (Nobilis, 1994). Due to its
size, this species is mostly confused with M. monoceros.
The trawlers’ captains are mostly adapting their fishing strategy to their knowledge of the shrimp species
spatio-temporal distribution and behavior: the 3 major species caught by trawlers varies with depth and
season.
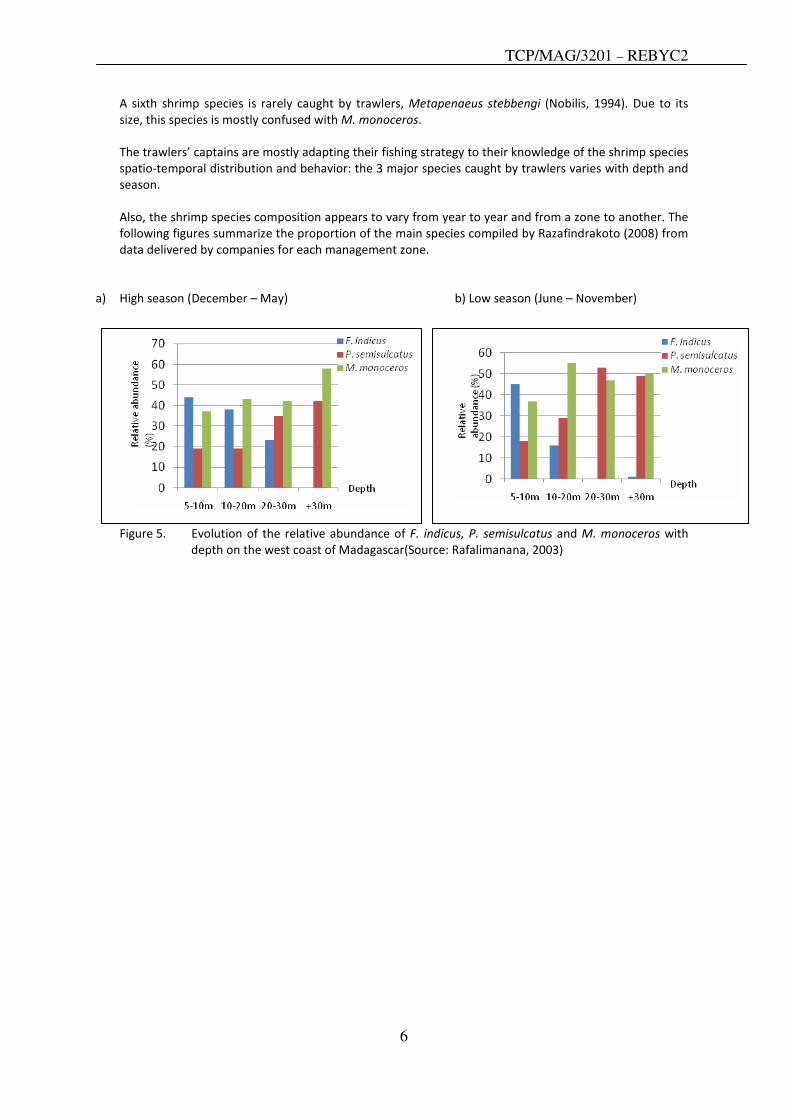
Also, the shrimp species composition appears to vary from year to year and from a zone to another. The
following figures summarize the proportion of the main species compiled by Razafindrakoto (2008) from
data delivered by companies for each management zone.
a) High season (December – May) b) Low season (June – November)
Figure 5. Evolution of the relative abundance of F. indicus, P. semisulcatus and M. monoceros with
depth on the west coast of Madagascar(Source: Rafalimanana, 2003)
TCP/MAG/3201 – REBYC2
7
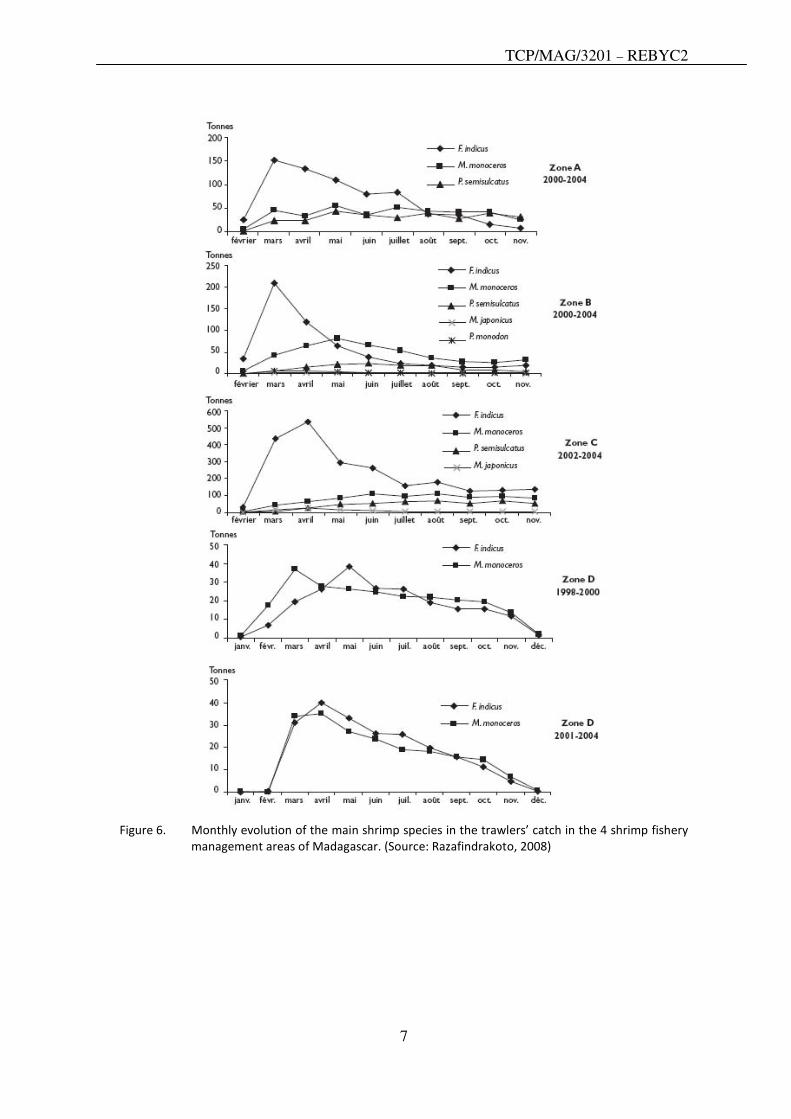
Figure 6. Monthly evolution of the main shrimp species in the trawlers’ catch in the 4 shrimp fishery
management areas of Madagascar. (Source: Razafindrakoto, 2008)
TCP/MAG/3201 – REBYC2
8
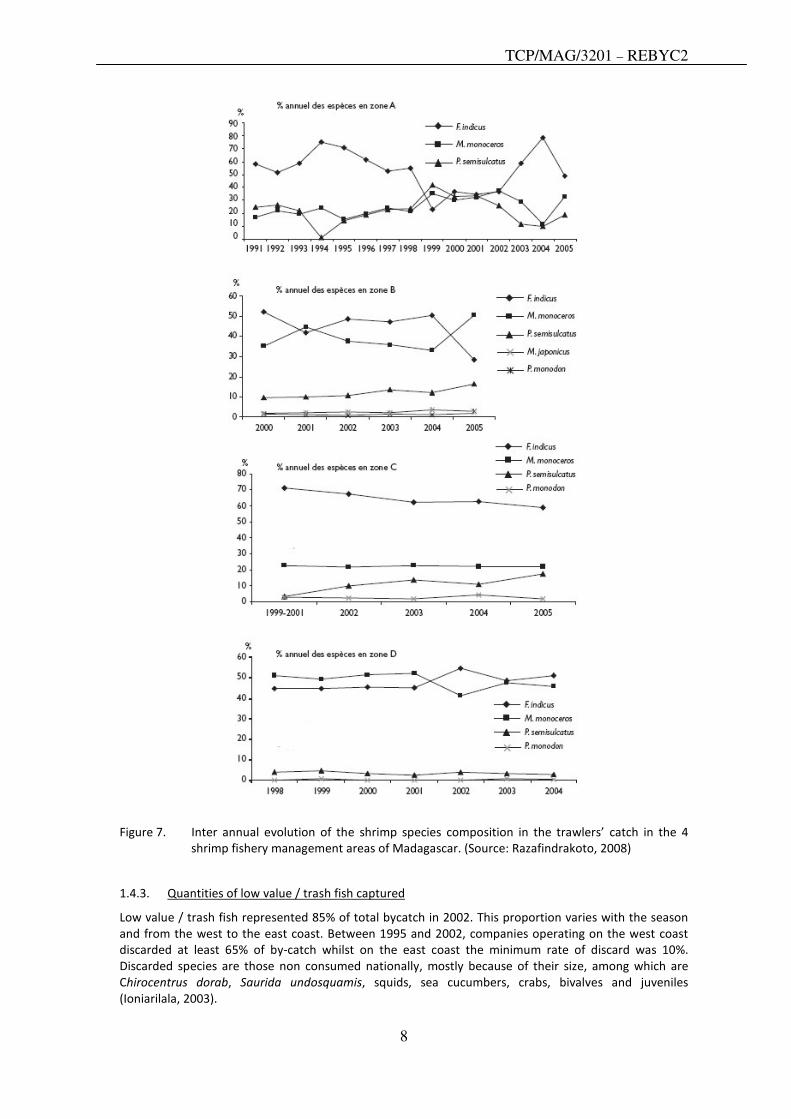
Figure 7. Inter annual evolution of the shrimp species composition in the trawlers’ catch in the 4
shrimp fishery management areas of Madagascar. (Source: Razafindrakoto, 2008)
1.4.3. Quantities of low value / trash fish captured
Low value / trash fish represented 85% of total bycatch in 2002. This proportion varies with the season
and from the west to the east coast. Between 1995 and 2002, companies operating on the west coast
discarded at least 65% of by-catch whilst on the east coast the minimum rate of discard was 10%.
Discarded species are those non consumed nationally, mostly because of their size, among which are
Chirocentrus dorab, Saurida undosquamis, squids, sea cucumbers, crabs, bivalves and juveniles
(Ioniarilala, 2003).
TCP/MAG/3201 – REBYC2
9
Companies we visited in the end 2009 and in early 2010 specified lower discard rate: about 10% on the
east coast (shells, crustaceans, non marketable or very low priced species like sardines, Indian mackerel),
and about between 3 and 11% on the west coast, depending on the company.
Table 5. Estimated bycatch quantity in 2002 (source: Ioniarilala, 2003)
Length % by-catch Total catch
(in 2002)
> 25 cm 2 % 214 t
15 cm - 25 cm 13 % 1 400 t
< 15 cm 85 % 9 150 t
1.5. Overview of traditional shrimp fisheries
The most important traditional shrimp fishery occurs in zone A, particularly in Ambaro Bay, (see Figure
11 and Annexe 3) where it coexists with the trawl fishery. The fishing grounds range from mangrove
channels to estuaries, intertidal areas and deeper waters on trawl fishing grounds. The traditional
valakira shrimp fishery in Ambaro Bay is the best known of the Madagascan small scale shrimp fisheries.
Catch is composed mainly of juveniles of shrimp and brackish water species.
Five shrimp species were reported to occur in the catch of valakira in Ambaro Bay, Penaeus indicus being
the most important with 73% of the catch.
Table 6. Shrimp species composition of the catch of valakira in Ambaro Bay. (Source: Rabarison, 1987)
Species Proportion in Catches
(%)
Penaeus indicus 73%
Penaeus monodon 11%
Metapenaeus stebbingi 10%
Metapenaeus monoceros 4%
Penaeus semisulcatus 2%
1.6. The traditional fishing gears
The traditional shrimp fishery has existed since a long time in Ambaro Bay and used only one type of
fishing gear which was the valakira. The use of other types of fishing gear, gill nets and seines, was
reported for the first time by Razafindrainibe & al in 1993. De Rodelec and Caverivière (2008) described
the gears currently in use in this bay, which are the following:
- The vonosaha, mosquito nets of 1-2 mm mesh size or with lathwork of about 1-2 mm spacing,
set up across mangrove channels. Shrimp catch is composed of small juveniles (for 90%) of
about 2,1 g;
- The sihitra net or mosquito net is mostly operated by women and children along the shoreline
for catching the brackish water Sergestidae, Acetes erythraeus and juveniles of shrimp;
- The valakira, a V-shaped fixed trap set in front of estuaries in intertidal zones, using thin
wooden poles-made fence which are set during low tides of new and full moon periods and
removed during half-moon periods. Its low selectivity results in the capture of juveniles of
shrimp and fish.
- The poto, a fixed trawl-like multi filament net, is operating like a valakira during the transition
from high to low tide. Several traps are placed at the mouth of the estuary in the same areas as
the valakira. The poto is catching juveniles leaving the mangroves. It appeared in the end 1990s.
TCP/MAG/3201 – REBYC2
10
Regional law prohibits the use of this fishing technique because it stops any marine species
migrating from the mangrove to the sea;
- The kopiko net looks like a small trawl, and is pulled by men. Its use is in decrease in Ambaro
Bay since the 1990s, but was common in zone B, between Mahajamba Bay and Cape Saint
André;
- The kaokobe is actually a monofilament net, operated by 4 fishers in a circular movement, in 4 –
5 m water deep beyond the valakira. It appeared in 1974 on the west coast of Madagascar (De
Rodelec du Porzic and Caverivière, 2008); and
- The periky is a monofilament net of 20 – 25 mm mesh size, placed on the seabed during the
transition from low to high tide, mostly on the same fishing grounds as the trawlers, causing
conflicts with these latter. It is operated by two persons. Its use developed rapidly under
collectors demand for medium and large-sized shrimp.
1.6.1. Fishing efforts and catch
Rabarison (1987) reported the evolution of the traditional shrimp fishery in Ambaro Bay, in terms of
number of operational valakira and respective catch from 1971 to 1984.
Table 7. Evolution of the number of valakira in Ambaro Bay from 1971 to 1984. (Source: Rabarison,
1987)
Year
No. of
valakira
units
Shrimp
catch
(tonnes)
Year
No. of
valakira
units
Shrimp
catch
(tonnes)
1971 - 153 1978 - 159
1972 35 166 1979 - 167
1973 - 273 1980 - 145
1974 - 291 1981 125 153
1975 300 243 1982 - 178
1976 - 245 1983 128 180
1977 - 180 1984 183 104
Even though all fishers’ villages are using the valakira in Ambaro Bay, two villages are considered as the
most important. In 1988, the same author inventoried over 285 valakira in Ambaro Bay, distributed as
follow:
Table 8. Inventory of valakira in Ambaro Bay in 1988(Source: Rabarison, 1988)
Village Number of valakira
Ambavanankarana ?
Antenina 19
Ampanasina 4
Ampangahia 18
Port St Louis ?
Andavanemboka ?
Ankazomborona 111
Antsatrana 97
Ampapamena 45
Ankigny 32
Maropamba ?
Total 285

TCP/MAG/3201 – REBYC2
11
Since the 1990s, new fishing gears and techniques appeared in the traditional shrimp fishery. The
following table resumes the evolution of the number of the main traditional fishing gears in Ambaro Bay.
Table 9. Evolution of the number of the main traditional fishing gears in Ambaro Bay from 2003 to
2005. (Source: PNRC, cited by Rakotondratsimba et al, 2008)
Fishers
Periky
20 mm
Periky
25 mm
Kaokobe
12 mm
Kaokobe
15 mm
Kaokobe
15 mm Valakira Poto
2003 2 256 867 - 243 - 144 203
2004 2 271 529 850 71 - 24 57
2005 2 863 149 347 147 33 37 280
The difference in the operating mode of the various traditional fishing gears makes the assessment of
the fishing effort complex. Actually, some of these gears are used only during the high tides of full and
new moon periods, such as the valakira and the poto, whilst the others can be used all the month
through, mostly the kaokobe and the periky. Razafindrainibe & al (1994) estimated that only one third of
the valakira were operational at the same time in Ambaro Bay.
1.6.2. Shrimp size composition
To allow comparison between the size of shrimp caught with traditional fishing gears and the size of
those caught by industrial trawlers, the same size categorization as in industrial fishery was adopted.
The size is expressed in number of shrimp per kg, thus, the size 10/20 means that for this size-class, there
is 10 to 20 individuals per kg. The higher the size number is, the smaller the shrimp are. The figure shows
that the periky is catching less small-sized shrimp than the trawlers, and the valakira and the poto are
catching the highest quantity of small shrimp.
Table 10. Size composition (in percent) of the shrimp caught by the valakira, the poto, the kaokobe, the
periky and the trawler in Ambaro Bay (Source: De Rodelec du Porzic and Caverivière, 2008)
Val. = valakira
Po12 = poto of 12 mm mesh size
Po15 = poto of 15 mm mesh size
K12 = Kaokobe of 12 mm mesh size
K15 = kaokobe of 15 mm mesh size
Pe20 = periky of 20 mm mesh size
Pe25 = periky of 25 mm mesh size
Chal. = industrial shrimp trawlers, for year 2000
TCP/MAG/3201 – REBYC2
12
2 DESCRIPTION OF SPECIFIC TRAWL FISHERIES:
2.1. Description of coastal bottom trawl fisheries in which shrimp are part of the catch by main fleet
segments.
2.1.1. Major fishing ports or landing sites
Five shrimp fishing ports are located along the west coast, from the North to the South: Nosy-Be,
Mahajanga, Maintirano, Morondava and Toliara, while landing sites are located in nearby processing
units operated by shrimp companies in Nosy-Be, Mahajanga and Morondava (see Annexe 3)
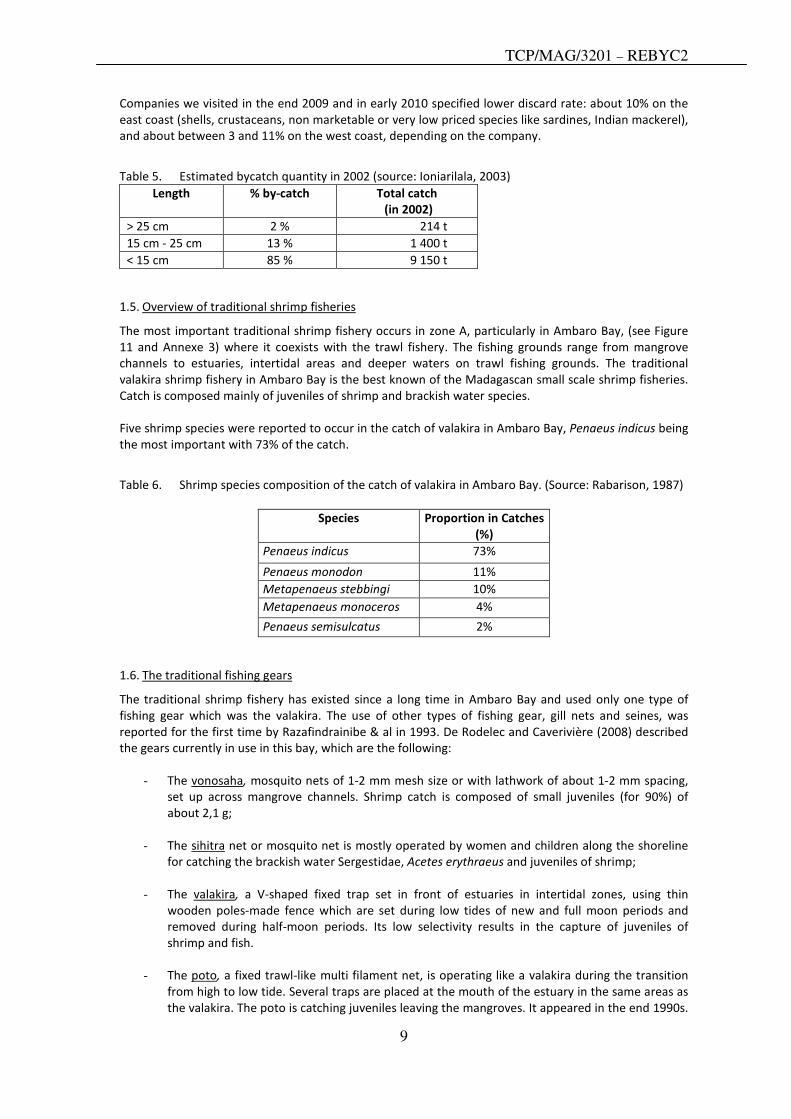
2.1.2. Number of vessels and type and size of vessels (including photos)
The number of trawlers increased annually until 1996, then remained at around 70 vessels. After a peak
of 79 vessels in 2001, the fishing fleet decreased continuously to 45 vessels in 2008. Before 2000,
trawlers were classified into 3 categories according to their length, power, on-board conservation
facilities and autonomy:
Table 11. Types and size of vessels
Type Length (m) Power (main
engine) in HP
Onboard conservation
facility
autonomy
Ice trawlers 15 - 17 150 - 270 None (products are
conserved in ice)
≤ 1 week
Semi freezer
trawlers
23 270 Freezer About 18 days
Freezer
trawlers
26 - 30 400 - 500 Freezing tunnel – processed
products
20 – 30 days
Figure 8. Number of vessels according to their length
Since 2001, shrimp trawling industry has replaced or converted all operating vessels into freezers
regardless of their length, engine power or autonomy.
TCP/MAG/3201 – REBYC2
13
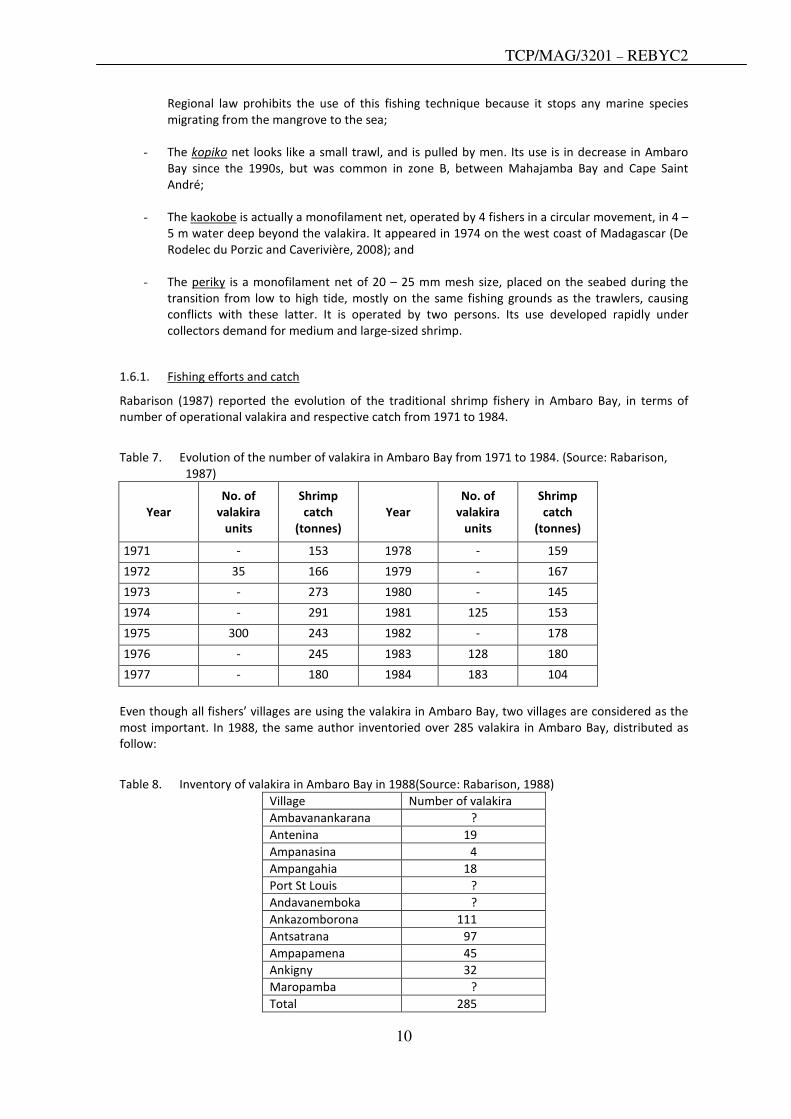
Figure 9. Evolution of number of industrial trawlers
In 2010, most of the companies intend to reduce the number of their operating vessels, as they do not
expect catch increase.
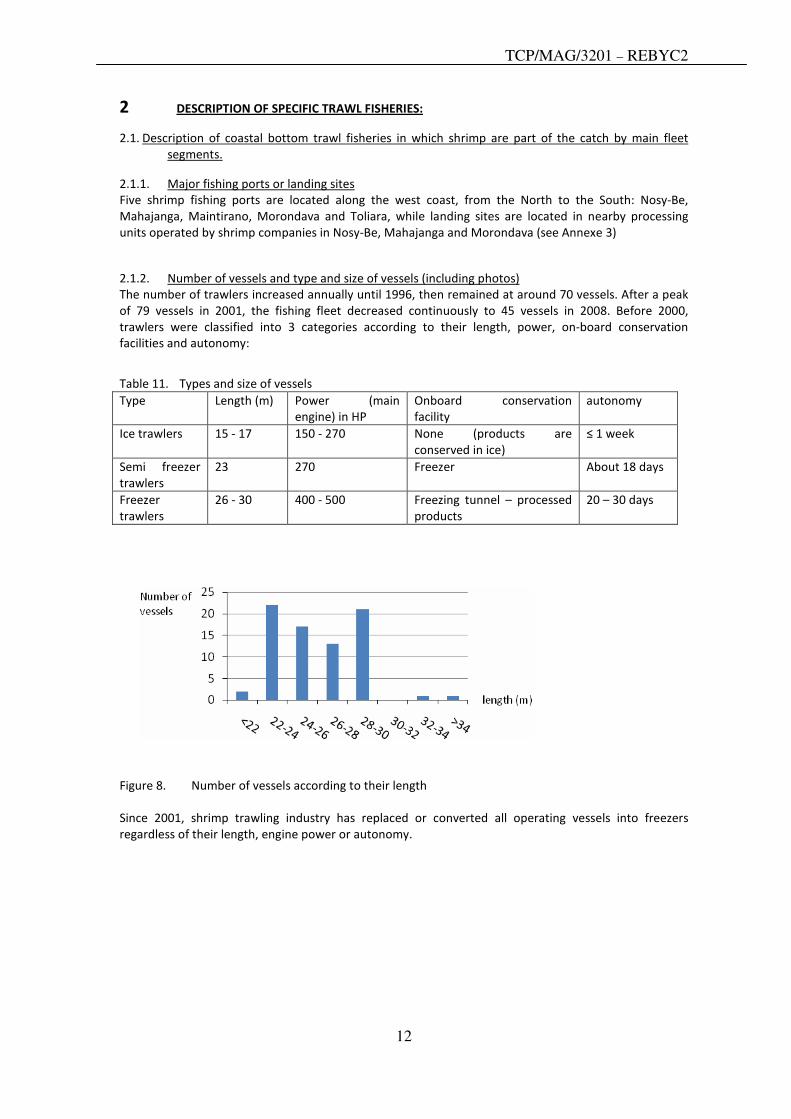
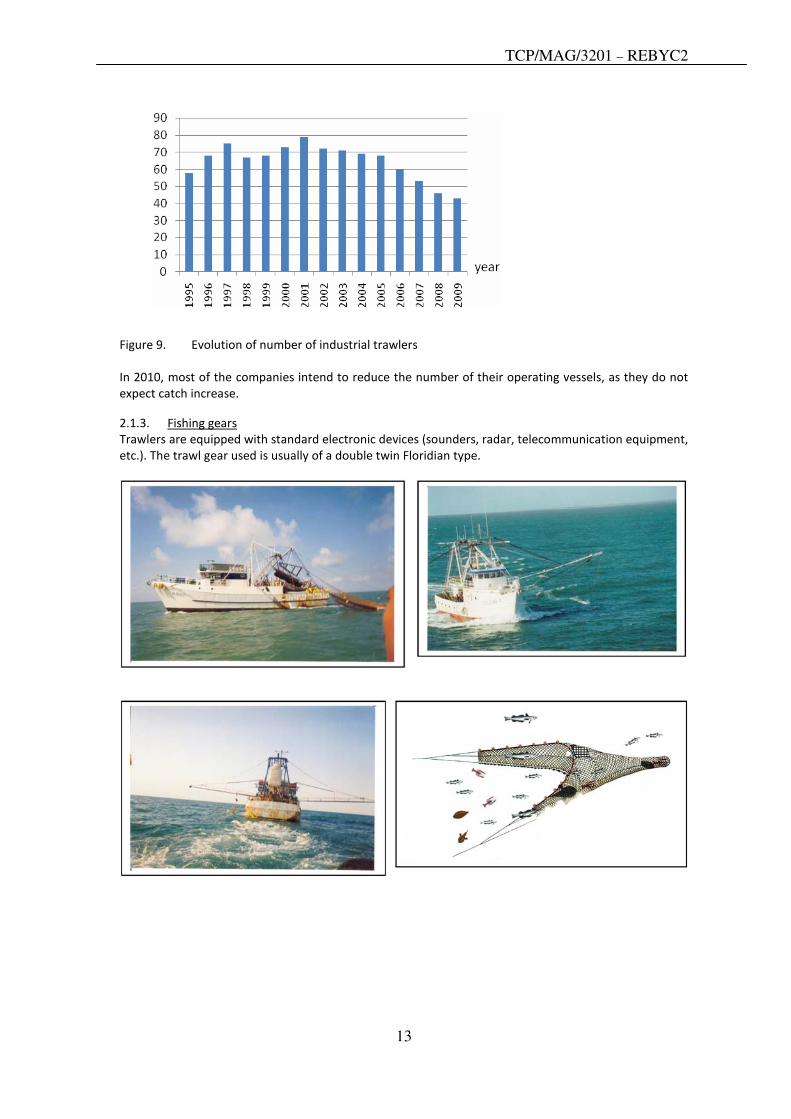
2.1.3. Fishing gears
Trawlers are equipped with standard electronic devices (sounders, radar, telecommunication equipment,
etc.). The trawl gear used is usually of a double twin Floridian type.
TCP/MAG/3201 – REBYC2
14
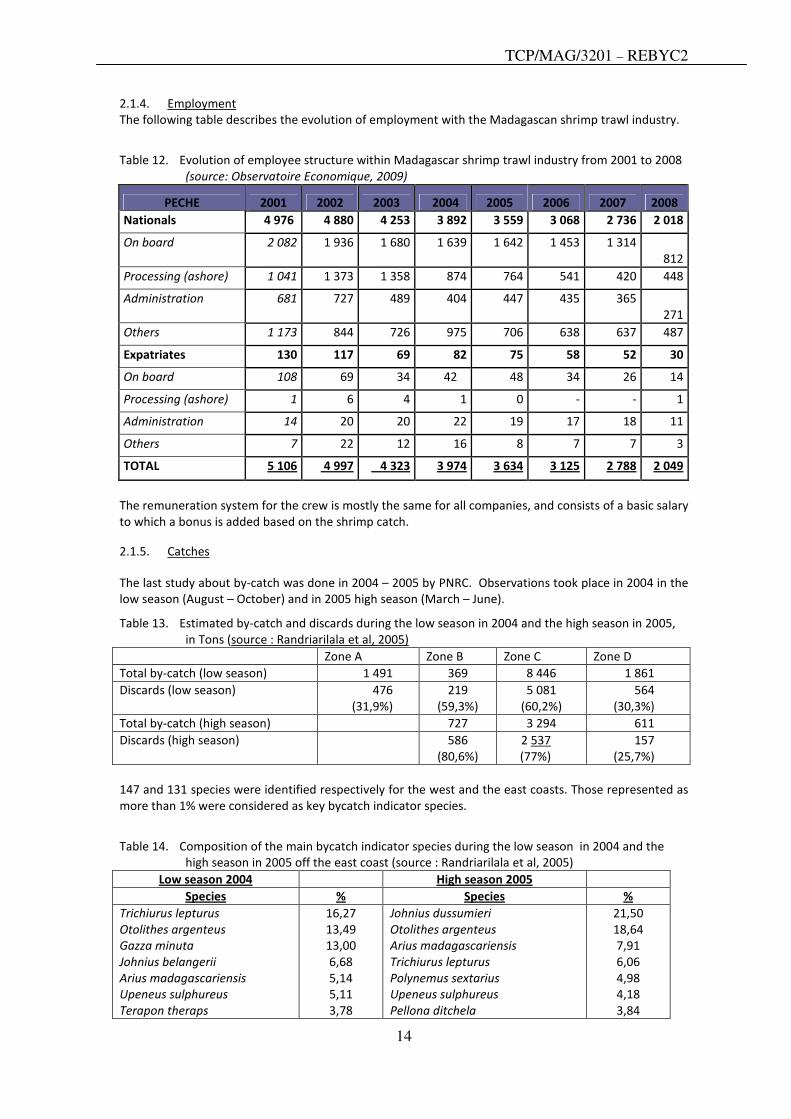
2.1.4. Employment
The following table describes the evolution of employment with the Madagascan shrimp trawl industry.
Table 12. Evolution of employee structure within Madagascar shrimp trawl industry from 2001 to 2008
(source: Observatoire Economique, 2009)
PECHE 2001 2002 2003 2004 2005 2006 2007 2008
Nationals 4 976 4 880 4 253 3 892 3 559 3 068 2 736 2 018
On board 2 082 1 936 1 680 1 639 1 642 1 453 1 314
812
Processing (ashore) 1 041 1 373 1 358 874 764 541 420 448
Administration 681 727 489 404 447 435 365
271
Others 1 173 844 726 975 706 638 637 487
Expatriates 130 117 69 82 75 58 52 30
On board 108 69 34 42 48 34 26 14
Processing (ashore) 1 6 4 1 0 - - 1
Administration 14 20 20 22 19 17 18 11
Others 7 22 12 16 8 7 7 3
TOTAL 5 106 4 997 4 323 3 974 3 634 3 125 2 788 2 049
The remuneration system for the crew is mostly the same for all companies, and consists of a basic salary
to which a bonus is added based on the shrimp catch.
2.1.5. Catches
The last study about by-catch was done in 2004 – 2005 by PNRC. Observations took place in 2004 in the
low season (August – October) and in 2005 high season (March – June).
Table 13. Estimated by-catch and discards during the low season in 2004 and the high season in 2005,
in Tons (source : Randriarilala et al, 2005)
Zone A Zone B Zone C Zone D
Total by-catch (low season) 1 491 369 8 446 1 861
Discards (low season) 476
(31,9%)
219
(59,3%)
5 081
(60,2%)
564
(30,3%)
Total by-catch (high season) 727 3 294 611
Discards (high season) 586
(80,6%)
2 537
(77%)
157
(25,7%)
147 and 131 species were identified respectively for the west and the east coasts. Those represented as
more than 1% were considered as key bycatch indicator species.
Table 14. Composition of the main bycatch indicator species during the low season in 2004 and the
high season in 2005 off the east coast (source : Randriarilala et al, 2005)
Low season 2004 High season 2005
Species % Species %
Trichiurus lepturus
Otolithes argenteus
Gazza minuta
Johnius belangerii
Arius madagascariensis
Upeneus sulphureus
Terapon theraps
16,27
13,49
13,00
6,68
5,14
5,11
3,78
Johnius dussumieri
Otolithes argenteus
Arius madagascariensis
Trichiurus lepturus
Polynemus sextarius
Upeneus sulphureus
Pellona ditchela
21,50
18,64
7,91
6,06
4,98
4,18
3,84
TCP/MAG/3201 – REBYC2
15
Sardinella gibbosa
Pomadasys maculatum
Polynemus sextarius
Sphyraena obtusata
Leiognathus equulus
Secutor insidiator
Pelates quadrilineatus
Upeneus moluccensis
Upeneus vittatus
Johnius dussumieri
Himantura uarnak
Gerres punctatus
Pellona ditchela
3,48
3,39
3,10
2,91
2,18
1,87
1,84
1,69
1,59
1,52
1,46
1,36
1,33
Sphyraena barracuda
Gazza minuta
Rastrelliger kanagurta
Pomadasys maculatum
Saurida micropectoralis
Psettodes erumei
Pelates quadrilineatus
Lobotes surinamensis
Anguilla bicolor
Terapon theraps
Leiognathus equulus
3,54
3,10
2,85
1,98
1,77
1,59
1,55
1,30
1,27
1,26
1,20
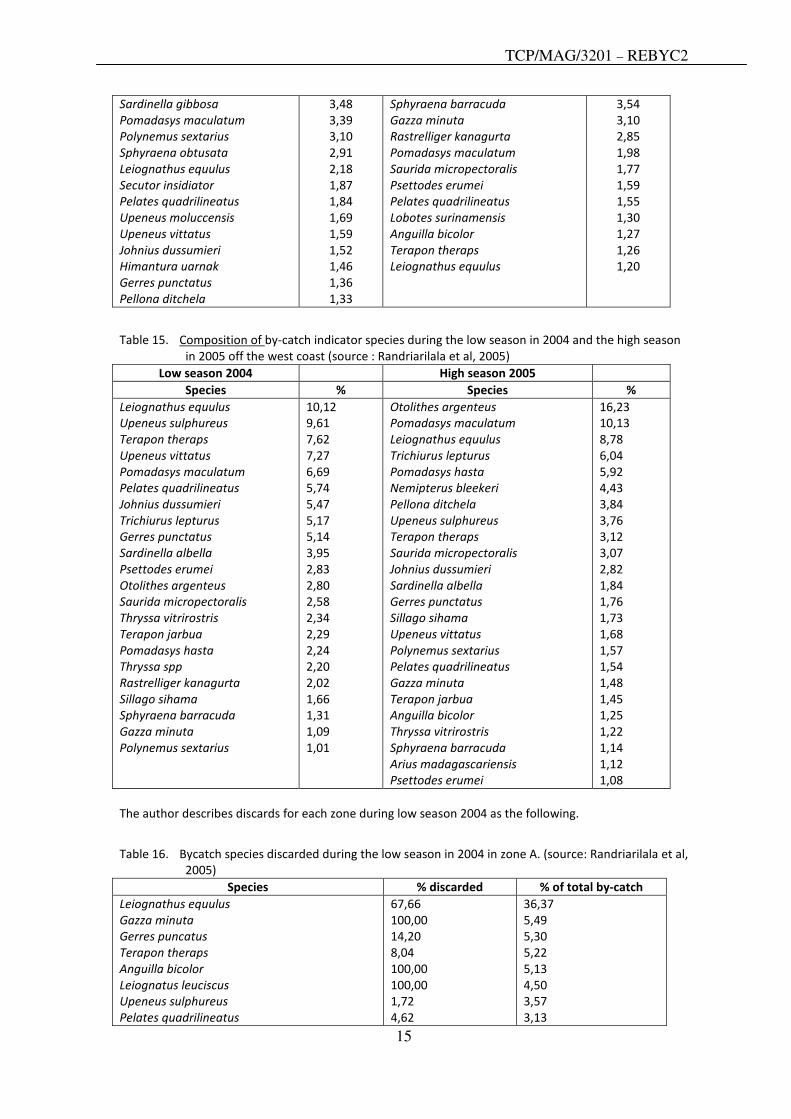
Table 15. Composition of by-catch indicator species during the low season in 2004 and the high season
in 2005 off the west coast (source : Randriarilala et al, 2005)
Low season 2004 High season 2005
Species % Species %
Leiognathus equulus
Upeneus sulphureus
Terapon theraps
Upeneus vittatus
Pomadasys maculatum
Pelates quadrilineatus
Johnius dussumieri
Trichiurus lepturus
Gerres punctatus
Sardinella albella
Psettodes erumei
Otolithes argenteus
Saurida micropectoralis
Thryssa vitrirostris
Terapon jarbua
Pomadasys hasta
Thryssa spp
Rastrelliger kanagurta
Sillago sihama
Sphyraena barracuda
Gazza minuta
Polynemus sextarius
10,12
9,61
7,62
7,27
6,69
5,74
5,47
5,17
5,14
3,95
2,83
2,80
2,58
2,34
2,29
2,24
2,20
2,02
1,66
1,31
1,09
1,01
Otolithes argenteus
Pomadasys maculatum
Leiognathus equulus
Trichiurus lepturus
Pomadasys hasta
Nemipterus bleekeri
Pellona ditchela
Upeneus sulphureus
Terapon theraps
Saurida micropectoralis
Johnius dussumieri
Sardinella albella
Gerres punctatus
Sillago sihama
Upeneus vittatus
Polynemus sextarius
Pelates quadrilineatus
Gazza minuta
Terapon jarbua
Anguilla bicolor
Thryssa vitrirostris
Sphyraena barracuda
Arius madagascariensis
Psettodes erumei
16,23
10,13
8,78
6,04
5,92
4,43
3,84
3,76
3,12
3,07
2,82
1,84
1,76
1,73
1,68
1,57
1,54
1,48
1,45
1,25
1,22
1,14
1,12
1,08
The author describes discards for each zone during low season 2004 as the following.
Table 16. Bycatch species discarded during the low season in 2004 in zone A. (source: Randriarilala et al,
2005)
Species % discarded % of total by-catch
Leiognathus equulus
Gazza minuta
Gerres puncatus
Terapon theraps
Anguilla bicolor
Leiognatus leuciscus
Upeneus sulphureus
Pelates quadrilineatus
67,66
100,00
14,20
8,04
100,00
100,00
1,72
4,62
36,37
5,49
5,30
5,22
5,13
4,50
3,57
3,13
TCP/MAG/3201 – REBYC2
16
Platycephalus indicus
Fistularia petimba
100,00
100,00
2,89
2,54
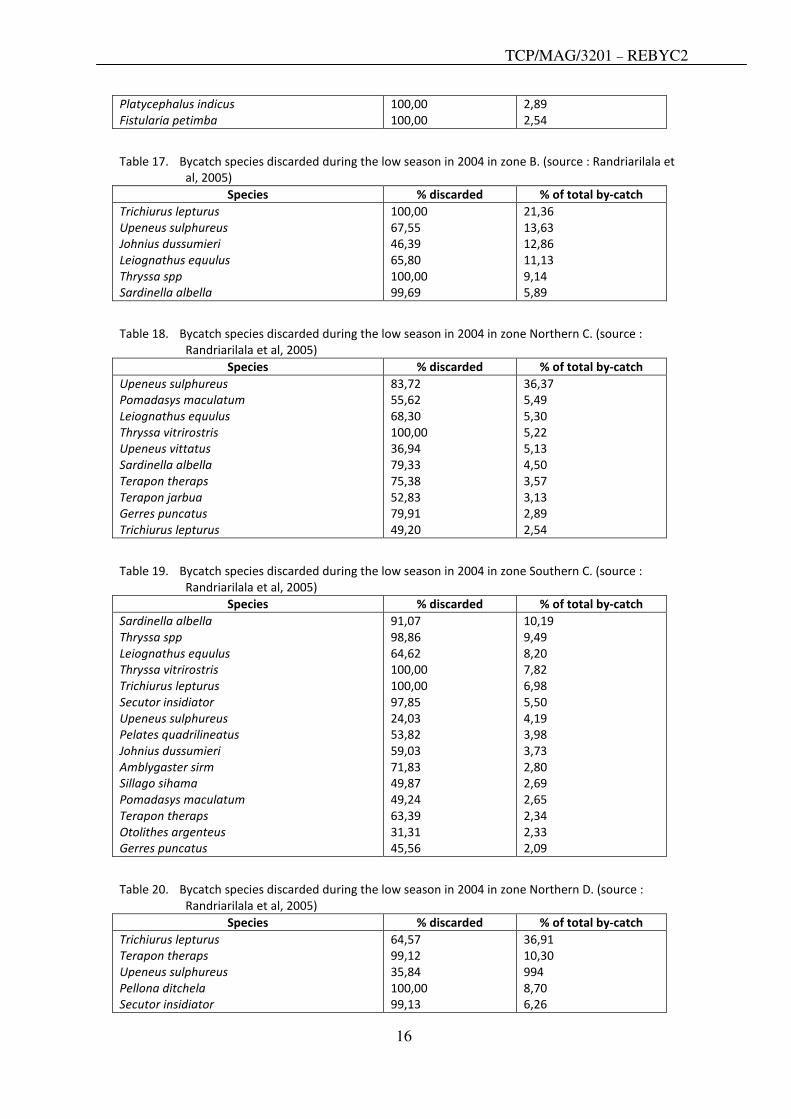
Table 17. Bycatch species discarded during the low season in 2004 in zone B. (source : Randriarilala et
al, 2005)
Species % discarded % of total by-catch
Trichiurus lepturus
Upeneus sulphureus
Johnius dussumieri
Leiognathus equulus
Thryssa spp
Sardinella albella
100,00
67,55
46,39
65,80
100,00
99,69
21,36
13,63
12,86
11,13
9,14
5,89
Table 18. Bycatch species discarded during the low season in 2004 in zone Northern C. (source :
Randriarilala et al, 2005)
Species % discarded % of total by-catch
Upeneus sulphureus
Pomadasys maculatum
Leiognathus equulus
Thryssa vitrirostris
Upeneus vittatus
Sardinella albella
Terapon theraps
Terapon jarbua
Gerres puncatus
Trichiurus lepturus
83,72
55,62
68,30
100,00
36,94
79,33
75,38
52,83
79,91
49,20
36,37
5,49
5,30
5,22
5,13
4,50
3,57
3,13
2,89
2,54
Table 19. Bycatch species discarded during the low season in 2004 in zone Southern C. (source :
Randriarilala et al, 2005)
Species % discarded % of total by-catch
Sardinella albella
Thryssa spp
Leiognathus equulus
Thryssa vitrirostris
Trichiurus lepturus
Secutor insidiator
Upeneus sulphureus
Pelates quadrilineatus
Johnius dussumieri
Amblygaster sirm
Sillago sihama
Pomadasys maculatum
Terapon theraps
Otolithes argenteus
Gerres puncatus
91,07
98,86
64,62
100,00
100,00
97,85
24,03
53,82
59,03
71,83
49,87
49,24
63,39
31,31
45,56
10,19
9,49
8,20
7,82
6,98
5,50
4,19
3,98
3,73
2,80
2,69
2,65
2,34
2,33
2,09
Table 20. Bycatch species discarded during the low season in 2004 in zone Northern D. (source :
Randriarilala et al, 2005)
Species % discarded % of total by-catch
Trichiurus lepturus
Terapon theraps
Upeneus sulphureus
Pellona ditchela
Secutor insidiator
64,57
99,12
35,84
100,00
99,13
36,91
10,30
994
8,70
6,26

TCP/MAG/3201 – REBYC2
17
Table 21. Bycatch species discarded during the low season in 2004 in zone Southern D. (source :
Randriarilala et al, 2005)
Species % discarded % of total by-catch
Trichiurus lepturus
Sardinella gibbosa
Johnius belangeri
Leiognathus equulus
Secutor insidiator
85,24
87,63
33,48
60,15
94,79
40,50
15,81
8,40
5,69
5,34
Table 22. Incidental catch of turtles as observed by CSP in 2004 and 2005
2004 (99 embarkments) 2005 (53 embarkments) Zones
caught alive dead caught alive dead
A 30 24 2 0 0 0
B 16 14 1 0 0 0
C 63 56 6 1 1 0
D 11 8 3 1 1 0
Total 120 102 12 2 2 0
2.1.6. Catch utilization and marketing:
Bycatch from the shrimp fishing industry is mainly sold on local and national markets for human
consumption and for animal feeds. The following table details the estimated value of bycatch from 2000
to 2008 as compared to exported and locally marketed shrimp and others products.
Table 23. Evolution of shrimp catch value and by-catch value from 2000 to 2008
Year 2000 2001 2002 2003 2004 2005 2006 2007 2008
Exchange rate : EUR 1 235 1 181 1 274 1 399 2 320 2 496 2 688 2 650 2 509
EXPORTATIONS
SHRIMP Tons 8 295 8 793 9 727 9 321 7 795 5 783 6 259 5 067 3 361
MMGA
64
984 73 363 82 971 73 348
114
757 81 981 100 932 76 087 42 772
Eq. MEuro 53 62 65 52 49 33 38 29 17
Crabs Tons 29 338 374 381 454 420 529 658 663
MMGA 77 1 048 1 134 1 151 2 854 2 519 3 327 4 543 5 101
Eq. MEuro 0,06 0,89 0,89 0,82 1,23 1,01 1,24 1,71 2,03
LOCAL MARKETS
SHRIMP Tons 170 109 96 184 123 254 120 172 200
MMGA 840 480 339 495 502 1 731 915 681 1 491
Eq. MEuro 0,68 0,41 0,27 0,35 0,22 0,69 0,34 0,26 0,59
By-catch Tons 2 478 4 782 3 000 2 703 3 324 2 486 3 544 3 005 2 088
(fish and
others) MMGA 2 137 2 169 2 924 1 762
2 218 2 198 4 807 4 145 4 785
Eq. MEuro 1,73 1,84 2,30 1,26 0,96 0,88 1,79 1,56 1,91
Others MMGA 3 026 3 253 2 847 6 505 5 068 9 633 8 343 7 025 2 349
Eq. MEuro 2,45 2,75 2,23 4,65 2,18 3,86 3,10 2,65 0,94
Prod. stockée 1 471 1 950 2 471 3 577 486 1 354 1 686 1 448 795
TCP/MAG/3201 – REBYC2
18
PROD. TOTALE
73
117 82 262 93 141 86 838
125
885 99 417 120 011 94 572 57 293
Bycatch species are mostly frozen and sold at local markets or in other urban areas, most often in
Antananarivo. Customers are usually wholesalers from urban areas even if some are sold directly to
consumers.
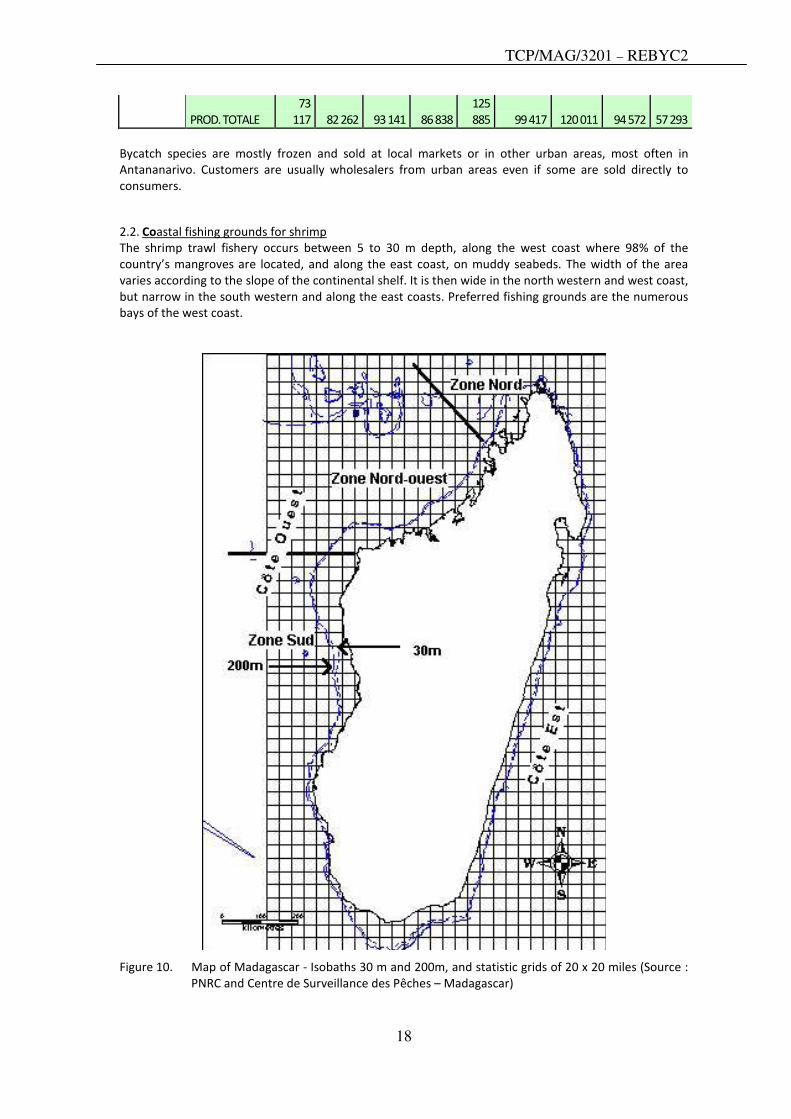
2.2. Coastal fishing grounds for shrimp
The shrimp trawl fishery occurs between 5 to 30 m depth, along the west coast where 98% of the
country’s mangroves are located, and along the east coast, on muddy seabeds. The width of the area
varies according to the slope of the continental shelf. It is then wide in the north western and west coast,
but narrow in the south western and along the east coasts. Preferred fishing grounds are the numerous
bays of the west coast.
Figure 10. Map of Madagascar - Isobaths 30 m and 200m, and statistic grids of 20 x 20 miles (Source :
PNRC and Centre de Surveillance des Pêches – Madagascar)
TCP/MAG/3201 – REBYC2
19
3 FISHERIES LEGISLATION
3.1. Review of legal definitions and terms related to by-catch and discards
At the national level, no legal definitions related to bycatch and discards are available.
3.2. Review of management measures applied to each fleet
3.2.1. Licensing schemes
The Decree n.2007-957 defines the exploitation rules for the shallow water shrimp fishery. The shrimp
fishing license is given to a company by the Ministry in charge of Fisheries, allowing this company to use
one vessel in one specified management zone, and the license is subject to the payment of annual fees.
Each industrial or artisanal license is given for 20 years, the validity of which runs from January 2000.
Permits for traditional “valakira” owners are valid until 31st
December 2016
The company can transfer (sell, give or lend) their license(s) to another operator, as long as one company
or group of companies doesn’t hold more than 40% of total fishing licenses regardless of whether the
license was transferred, rented or bought
Each annual shrimp fishing permit can be transferred from one vessel to another within the same
company or group of companies, as long as the fishery category (industrial of artisanal) and fishing zone
remain the same.
Amount of License fees are fixed by the Economic Observatory and are composed of a fixed and a
varying part.
3.2.2. Effort control
The same Decree n.2007-957 defines methods of effort control for both traditional and the trawl fishery.
Parameters used include characteristics of each gear type, and the number of gears allowed per
management zone.
The traditional fishery
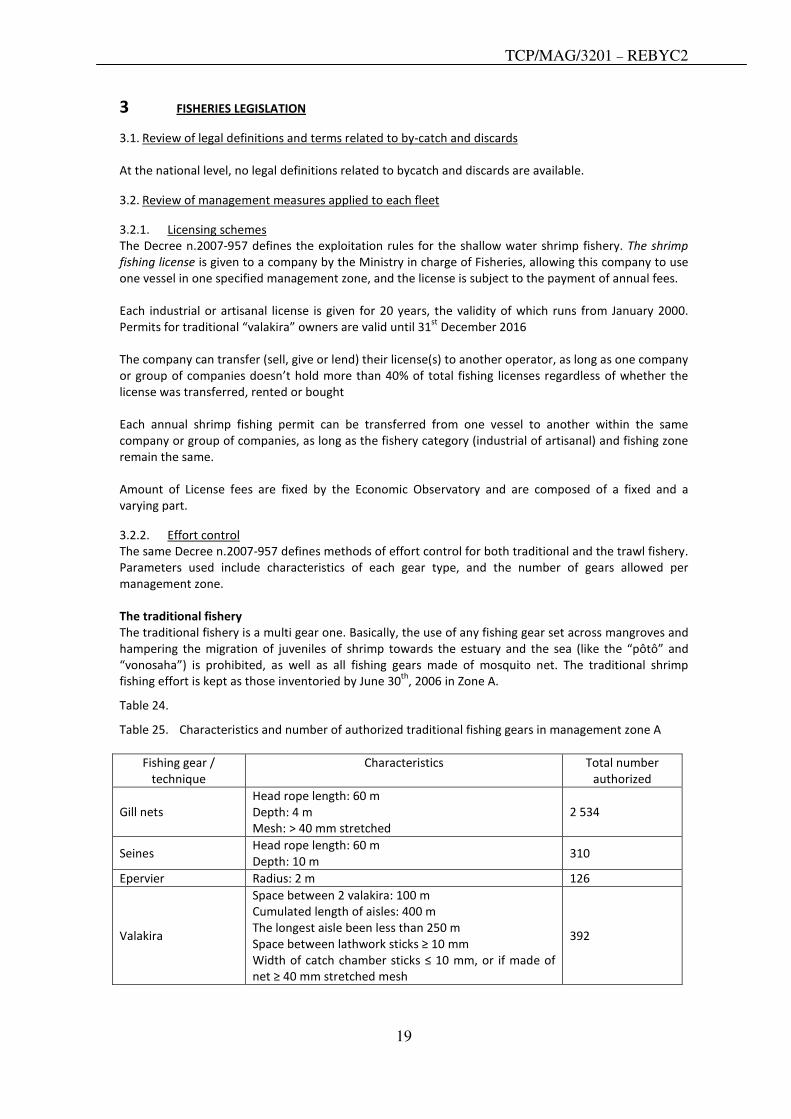
The traditional fishery is a multi gear one. Basically, the use of any fishing gear set across mangroves and
hampering the migration of juveniles of shrimp towards the estuary and the sea (like the “pôtô” and
“vonosaha”) is prohibited, as well as all fishing gears made of mosquito net. The traditional shrimp
fishing effort is kept as those inventoried by June 30th
, 2006 in Zone A.
Table 24.
Table 25. Characteristics and number of authorized traditional fishing gears in management zone A
Fishing gear /
technique
Characteristics Total number
authorized
Gill nets
Head rope length: 60 m
Depth: 4 m
Mesh: > 40 mm stretched
2 534
Seines Head rope length: 60 m
Depth: 10 m 310
Epervier Radius: 2 m 126
Valakira
Space between 2 valakira: 100 m
Cumulated length of aisles: 400 m
The longest aisle been less than 250 m
Space between lathwork sticks ≥ 10 mm
Width of catch chamber sticks ≤ 10 mm, or if made of
net ≥ 40 mm stretched mesh
392
TCP/MAG/3201 – REBYC2
20
A valakira can be replaced into 4 gill nets on demand.
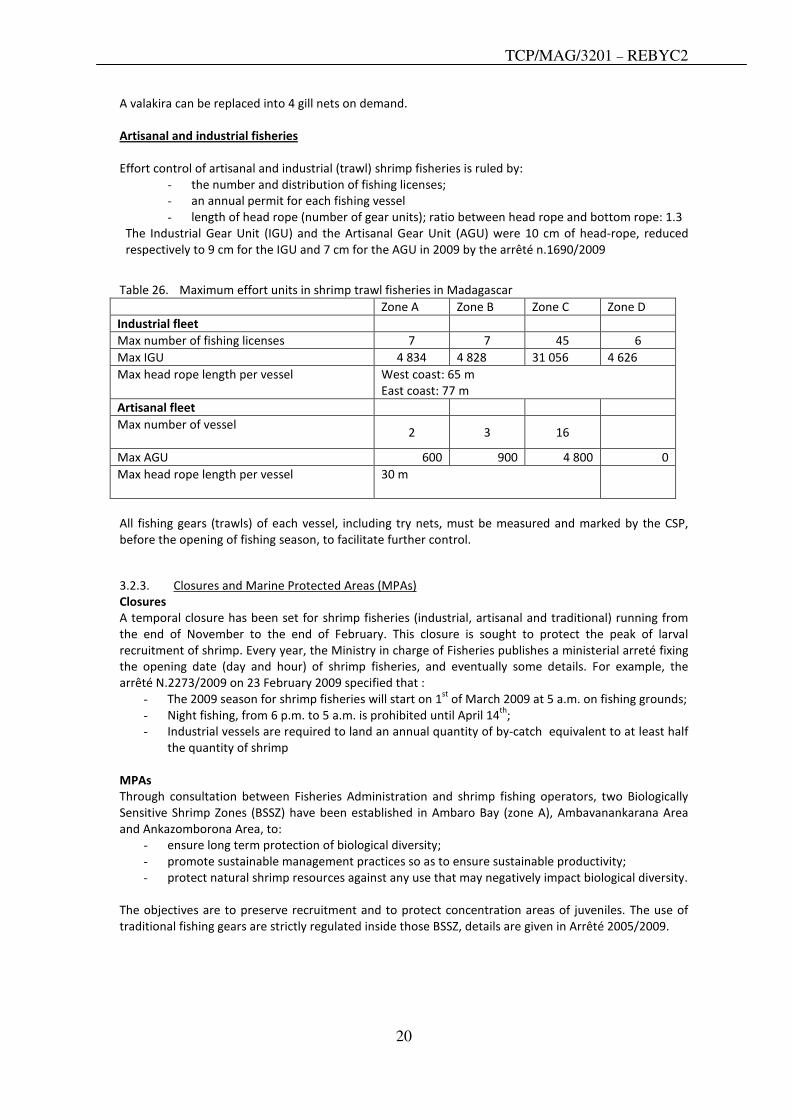
Artisanal and industrial fisheries
Effort control of artisanal and industrial (trawl) shrimp fisheries is ruled by:
- the number and distribution of fishing licenses;
- an annual permit for each fishing vessel
- length of head rope (number of gear units); ratio between head rope and bottom rope: 1.3
The Industrial Gear Unit (IGU) and the Artisanal Gear Unit (AGU) were 10 cm of head-rope, reduced
respectively to 9 cm for the IGU and 7 cm for the AGU in 2009 by the arrêté n.1690/2009
Table 26. Maximum effort units in shrimp trawl fisheries in Madagascar
Zone A Zone B Zone C Zone D
Industrial fleet
Max number of fishing licenses 7 7 45 6
Max IGU 4 834 4 828 31 056 4 626
Max head rope length per vessel West coast: 65 m
East coast: 77 m
Artisanal fleet
Max number of vessel 2 3 16
Max AGU 600 900 4 800 0
Max head rope length per vessel 30 m
All fishing gears (trawls) of each vessel, including try nets, must be measured and marked by the CSP,
before the opening of fishing season, to facilitate further control.
3.2.3. Closures and Marine Protected Areas (MPAs)
Closures
A temporal closure has been set for shrimp fisheries (industrial, artisanal and traditional) running from
the end of November to the end of February. This closure is sought to protect the peak of larval
recruitment of shrimp. Every year, the Ministry in charge of Fisheries publishes a ministerial arreté fixing
the opening date (day and hour) of shrimp fisheries, and eventually some details. For example, the
arrêté N.2273/2009 on 23 February 2009 specified that :
- The 2009 season for shrimp fisheries will start on 1st
of March 2009 at 5 a.m. on fishing grounds;
- Night fishing, from 6 p.m. to 5 a.m. is prohibited until April 14th
;
- Industrial vessels are required to land an annual quantity of by-catch equivalent to at least half
the quantity of shrimp
MPAs
Through consultation between Fisheries Administration and shrimp fishing operators, two Biologically
Sensitive Shrimp Zones (BSSZ) have been established in Ambaro Bay (zone A), Ambavanankarana Area
and Ankazomborona Area, to:
- ensure long term protection of biological diversity;
- promote sustainable management practices so as to ensure sustainable productivity;
- protect natural shrimp resources against any use that may negatively impact biological diversity.
The objectives are to preserve recruitment and to protect concentration areas of juveniles. The use of
traditional fishing gears are strictly regulated inside those BSSZ, details are given in Arrêté 2005/2009.

TCP/MAG/3201 – REBYC2
21
Figure 11. Location of the Biologically Sensitive Shrimp Zones in Bay of Ambaro, North West
Madagascar
A : Biologically Sensitive Shrimp Zone of Ambavanankarana
B : Biologically Sensitive Shrimp Zone of Ankazomborona
3.2.4. Gear regulations to improve species and size selectivity
Regulating mesh size for each type of fishing gear and making mandatory the use of BRD and TED were
implemented to improve species and size selectivity. For traditional fishery, the stretched mesh of
gillnets targeting shrimp should be at least of 40 mm. However, this kind of gear is also common for
fishing other species. Specifically in zone A, when this gear is used as surface drift nets, the legal
stretched mesh size is about 30 mm when the target species are anchovies (Thryssa spp), indian
mackerel (Rastrelliger kanagurta) or white sardine (Herklotsichthys sp), at least 40 mm if the target
species is “bika”, and at least 50 mm for other species.
For shrimp trawls, the codend mesh is 40 mm stretched.
3.2.5. Bycatch reduction measures
The only regulated measures to reduce bycatch are the use of BRDs and TEDs. They became mandatory
under Decree 2003-1101 of 23rd
November 2003. However, no description of these devices was given.
Companies adopted and adapted the systems tested by IFREMER. Vessels operating on the west and the
east coasts are concerned about TED while only those operating on the west coast are concerned about
using BRD.
3.2.6. National legislation related to bycatch and discards
The general fisheries policy encourages by-catch landings for human consumption. The ratio fish / shrimp
landing has varied through years, and has even reached 1/1. In 2000, companies were required to land 1
kg of fish for every 2 kg of shrimp under decree 2000-415. This disposition was cumbersome to
TCP/MAG/3201 – REBYC2
22
implement and compliance was considered by the Administration as poor. In any case, with support of
fleet performance analyses by the Economic Observatory, this ratio was maintained for 2009.
According to most of the companies, the policy on use of BRD to minimize bycatch is not consistent with
the regulation requiring shrimp trawl companies to land fish bycatch.
3.2.7. Interactions of coastal trawl fisheries with prohibited, protected and threatened species
Threatened species recognized under international conventions are protected in Madagascar, and the
country also follows the FAO Code of Conduct for Responsible Fisheries. Some shark species and sea
turtles are vulnerable to shrimp trawl fisheries. No legal disposition has been taken regarding sharks, but
the use of TEDs has become mandatory since 2004 shrimp fishery campaign. This device has contributed
to reduce significantly the number of sea turtles caught incidentally since the first year of use from 120
individuals from 64 vessels in 2004 to 2 specimen from 63 vessels in 2005. However, the TEDs allow also
big fauna (including largefish and sharks …) to escape.
On the other hand, the 5 vessels operating on the East coast caught 20 turtles in 2007, from February to
July, composed of the 5 species encountered in Madagascar. The green turtle is the main and most
commonly found species.
Madagascar report to SWIOFC in 2005 indicated that TEDs were implemented only for the industrial fleet
(up to 69 vessels) on the west coast, for which no more monitoring and tagging studies results were
expected, despite the decree specifying that this disposition is also valid for the fleet operating on the
East coast. Actually, research is continuing to identify an operational and appropriate TED system for the
east coast.
4 CONFLICTS BETWEEN DIFFERENT FLEET SEGMENTS, FISHERIES AND OTHER RESOURCE
USERS
The coexistence of different types of fisheries and decision on management measures are not always
perceived in the same way by the different resource users and stakeholder groups and generate
conflicts.
4.1. Nature of conflict
Sources of conflicts and misunderstandings can be summarized as follows:
o Overlap of the fishing grounds used by the traditional and the shrimp trawl fisheries. Until the
mid 1990’s, it has been assumed that shrimp trawlers should operate beyond 2 nautical miles
from the coast, inside which the traditional fisheries would operate. Because no physical
demarcation was established, trawlers were reported to enter into the traditional zone, while
on the other side, small scale fishers set their fishing gears on industrial fishing grounds. Since
then, it has been understood that no coastal limits are established for any sector;
o The sequential activities of the shrimp fisheries causing probable biological overexploitation is a
perpetual cause of mutual accusation between small scale fishers and industrial trawlers. Small
scale fishers harvest mostly juveniles of shrimps while industrial boats are operating on adults
reproductive stock;
o Research is mostly delayed and so is unable to address particular issues in an appropriate time.
Some industrial companies complained against the use of BRDs, considering it as inconsistent with
fisheries regulation requiring the landing of bycatch.
4.2. How the conflicts are addressed
Solutions adopted to address these issues include:
o implementation of dialogues between all concerned stakeholders, initiated at the beginning by
shrimp fishing industry, and supported by the Administration;
TCP/MAG/3201 – REBYC2
23
o participation of representatives of all shrimp fishery segments to the periodical updates of
shrimp fisheries management;
o Implementation of the PNRC. Activities of this institution are oriented by the sector and the
Fisheries Administration;
o specific project aimed at developing and implementing Concerted Management Zones;
o generalizing the closure to all fishery segments;
o implementation of biologically sensitive shrimp zones
5 COMPLIANCE WITH REGULATIONS
5.1. A review of MCS systems in place for trawl fisheries including use of VMS for monitoring trawl
vessels
Monitoring, control and surveillance of fishing activities is the responsibility of the Fisheries Surveillance
Centre (CSP), whose mandate is to enforce regulations on fisheries and aquaculture, as well as fishing
agreements. Its competences cover all Madagascan waters, including the EEZ and the national territory
including continental fisheries. Its priority focuses on controlling illegal fishing and monitoring activities
of authorized fishing vessels. In close collaboration with other departments of the ministry in charge of
fisheries, the CSP ensures:
- Inspection of vessels, fishing gears and equipments;
- Control of fishing areas;
- Compliance with fishing and aquaculture regulations;
- Control of catch, transshipping, and monitoring of landings;
- Communication between CSP, coastal stations, surveillance units and vessels;
- Implementation of Fisheries Agreements;
- Management and supervision of sea-going observers ;
- Supervision and coordination of local surveillance committees activities in liaison with
secondary stations;
- Participation, with other technical departments of the Ministry in charge of Fisheries, to
elaborate fisheries management plans and legal instruments related to the sector;
- Education and sensitization of fishermen regarding fisheries and aquaculture regulations and
legislation; and
- Any other activity related to fishing and aquaculture
The mode of operation includes:
- Inspection and compliance control of licenses, fishing gears, onboard catch;
- Maritime patrol;
- 24 hours round satellite monitoring of all authorized fishing vessels operating in the
Madagascan jurisdiction;
- Flying over the Madagascan EEZ;
- Organization of onboard observers; and
- Management of databases (licenses, vessels, catch, the web site, etc)
All authorized vessels have to be equipped with VMS unsing the Inmarsat or Argos system.
TCP/MAG/3201 – REBYC2
24
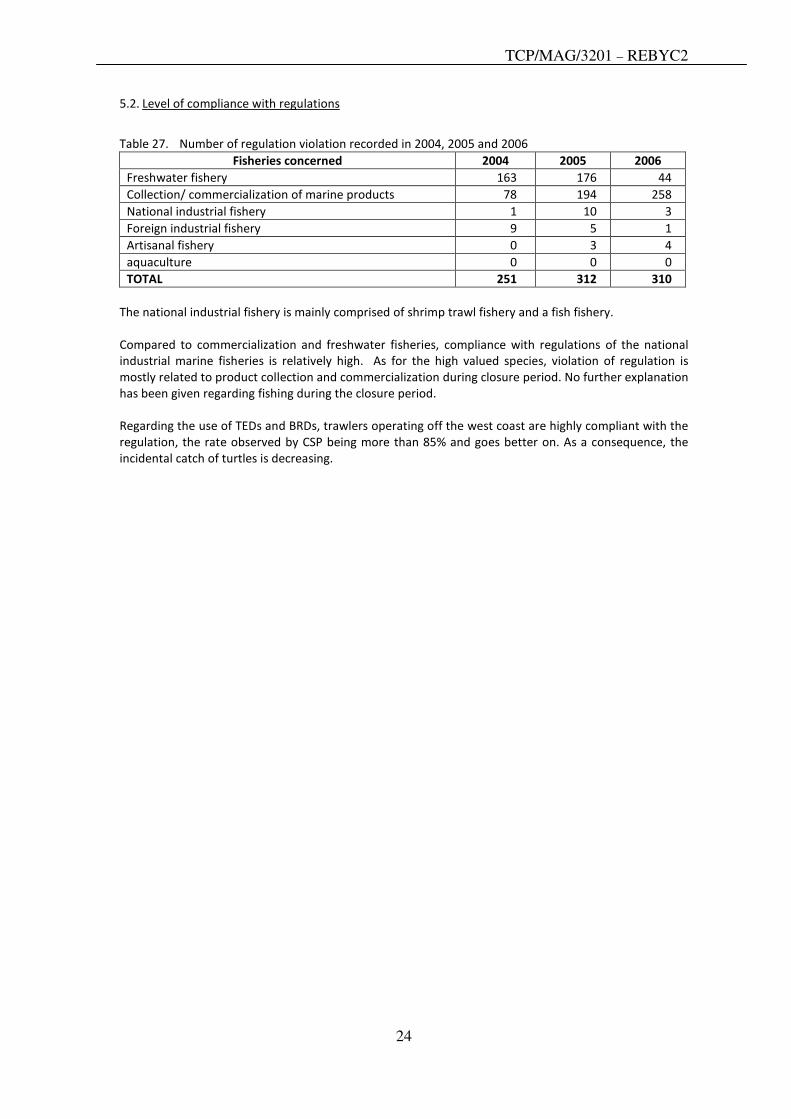
5.2. Level of compliance with regulations
Table 27. Number of regulation violation recorded in 2004, 2005 and 2006
Fisheries concerned 2004 2005 2006
Freshwater fishery 163 176 44
Collection/ commercialization of marine products 78 194 258
National industrial fishery 1 10 3
Foreign industrial fishery 9 5 1
Artisanal fishery 0 3 4
aquaculture 0 0 0
TOTAL 251 312 310
The national industrial fishery is mainly comprised of shrimp trawl fishery and a fish fishery.
Compared to commercialization and freshwater fisheries, compliance with regulations of the national
industrial marine fisheries is relatively high. As for the high valued species, violation of regulation is
mostly related to product collection and commercialization during closure period. No further explanation
has been given regarding fishing during the closure period.
Regarding the use of TEDs and BRDs, trawlers operating off the west coast are highly compliant with the
regulation, the rate observed by CSP being more than 85% and goes better on. As a consequence, the
incidental catch of turtles is decreasing.
TCP/MAG/3201 – REBYC2
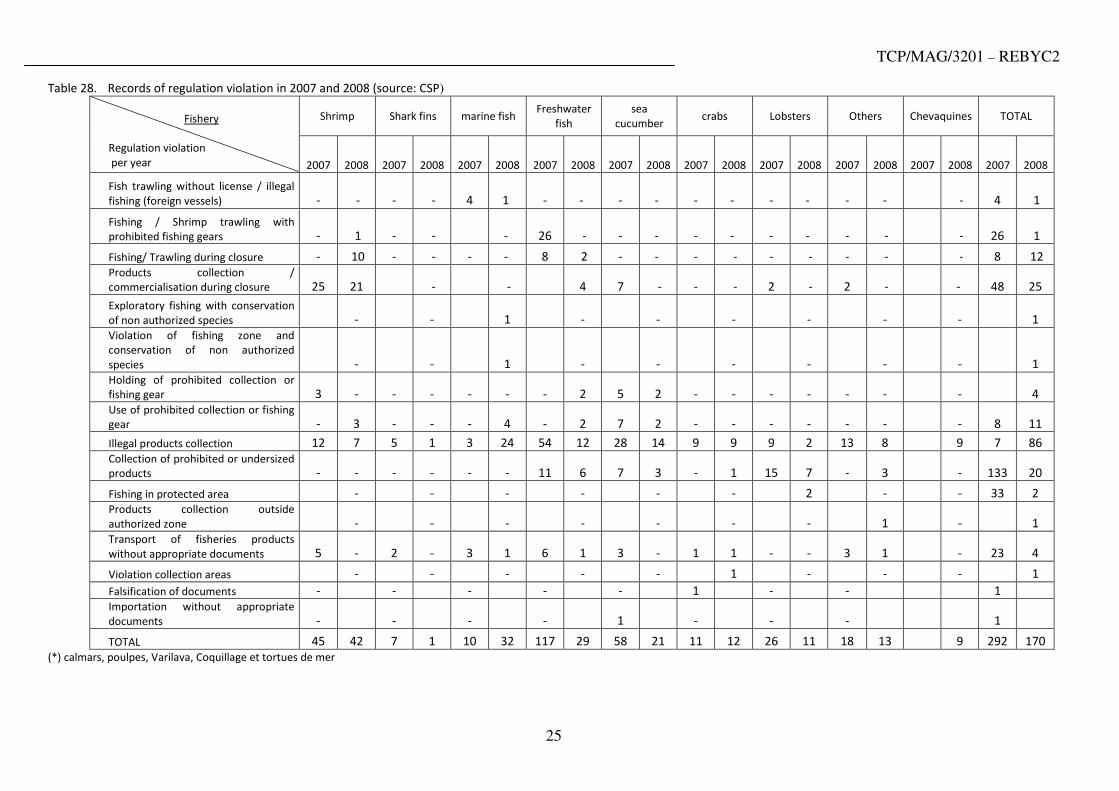
25
Table 28. Records of regulation violation in 2007 and 2008 (source: CSP)
Shrimp Shark fins marine fish Freshwater
fish
sea
cucumber crabs Lobsters Others Chevaquines TOTAL
Fishery
Regulation violation
per year 2007 2008 2007 2008 2007 2008 2007 2008 2007 2008 2007 2008 2007 2008 2007 2008 2007 2008 2007 2008
Fish trawling without license / illegal
fishing (foreign vessels) - - - - 4 1 - - - - - - - - - - - 4 1
Fishing / Shrimp trawling with
prohibited fishing gears - 1 - - - 26 - - - - - - - - - - 26 1
Fishing/ Trawling during closure - 10 - - - - 8 2 - - - - - - - - - 8 12
Products collection /
commercialisation during closure 25 21 - - 4 7 - - - 2 - 2 - - 48 25
Exploratory fishing with conservation
of non authorized species - - 1 - - - - - - 1
Violation of fishing zone and
conservation of non authorized
species - - 1 - - - - - - 1
Holding of prohibited collection or
fishing gear 3 - - - - - - 2 5 2 - - - - - - - 4
Use of prohibited collection or fishing
gear - 3 - - - 4 - 2 7 2 - - - - - - - 8 11
Illegal products collection 12 7 5 1 3 24 54 12 28 14 9 9 9 2 13 8 9 7 86
Collection of prohibited or undersized
products - - - - - - 11 6 7 3 - 1 15 7 - 3 - 133 20
Fishing in protected area - - - - - - 2 - - 33 2
Products collection outside
authorized zone - - - - - - - 1 - 1
Transport of fisheries products
without appropriate documents 5 - 2 - 3 1 6 1 3 - 1 1 - - 3 1 - 23 4
Violation collection areas - - - - - 1 - - - 1
Falsification of documents - - - - - 1 - - 1
Importation without appropriate
documents - - - - 1 - - - 1
TOTAL 45 42 7 1 10 32 117 29 58 21 11 12 26 11 18 13 9 292 170
(*) calmars, poulpes, Varilava, Coquillage et tortues de mer
TCP/MAG/3201 – REBYC2
26
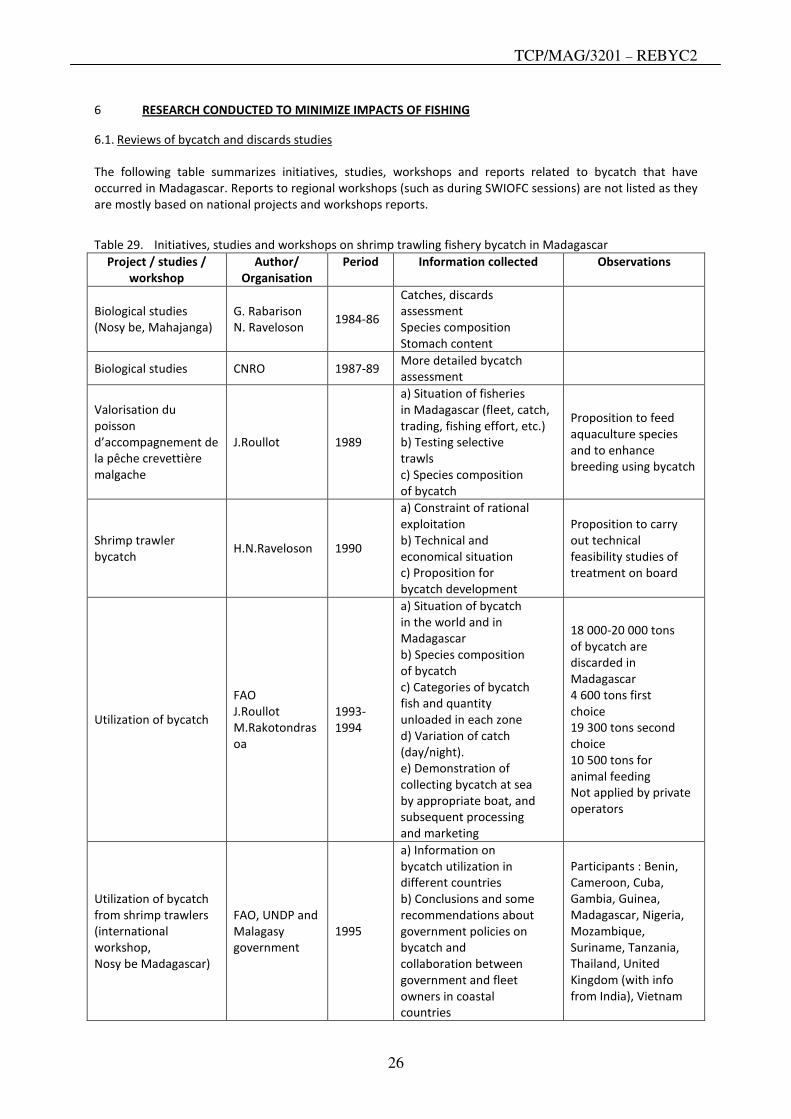
6 RESEARCH CONDUCTED TO MINIMIZE IMPACTS OF FISHING
6.1. Reviews of bycatch and discards studies
The following table summarizes initiatives, studies, workshops and reports related to bycatch that have
occurred in Madagascar. Reports to regional workshops (such as during SWIOFC sessions) are not listed as they
are mostly based on national projects and workshops reports.
Table 29. Initiatives, studies and workshops on shrimp trawling fishery bycatch in Madagascar
Project / studies /
workshop
Author/
Organisation
Period Information collected Observations
Biological studies
(Nosy be, Mahajanga)
G. Rabarison
N. Raveloson 1984-86
Catches, discards
assessment
Species composition
Stomach content
Biological studies CNRO 1987-89 More detailed bycatch
assessment
Valorisation du
poisson
d’accompagnement de
la pêche crevettière
malgache
J.Roullot 1989
a) Situation of fisheries
in Madagascar (fleet, catch,
trading, fishing effort, etc.)
b) Testing selective
trawls
c) Species composition
of bycatch
Proposition to feed
aquaculture species
and to enhance
breeding using bycatch
Shrimp trawler
bycatch H.N.Raveloson 1990
a) Constraint of rational
exploitation
b) Technical and
economical situation
c) Proposition for
bycatch development
Proposition to carry
out technical
feasibility studies of
treatment on board
Utilization of bycatch
FAO
J.Roullot
M.Rakotondras
oa
1993-
1994
a) Situation of bycatch
in the world and in
Madagascar
b) Species composition
of bycatch
c) Categories of bycatch
fish and quantity
unloaded in each zone
d) Variation of catch
(day/night).
e) Demonstration of
collecting bycatch at sea
by appropriate boat, and
subsequent processing
and marketing
18 000-20 000 tons
of bycatch are
discarded in
Madagascar
4 600 tons first
choice
19 300 tons second
choice
10 500 tons for
animal feeding
Not applied by private
operators
Utilization of bycatch
from shrimp trawlers
(international
workshop,
Nosy be Madagascar)
FAO, UNDP and
Malagasy
government
1995
a) Information on
bycatch utilization in
different countries
b) Conclusions and some
recommendations about
government policies on
bycatch and
collaboration between
government and fleet
owners in coastal
countries
Participants : Benin,
Cameroon, Cuba,
Gambia, Guinea,
Madagascar, Nigeria,
Mozambique,
Suriname, Tanzania,
Thailand, United
Kingdom (with info
from India), Vietnam

TCP/MAG/3201 – REBYC2
27
Project on best use of
bycatch
OFCF (Overseas
Fisheries
Cooperation
Foundation)
Japan
cooperation
with Malagasy
government
1997-
2000
a) Promotion of bycatch
marketing by giving
material for storage and
transport
b) Training of fishermen
and sellers
c) Promotion bycatch
consumption (testing a
new process )
d) Processing (smoked,
dried, etc.)
Bycatch in Mahajanga
C.
Andriamizara.
(participation in
national shrimp
workshop)
1998
a) Information from three
fishing companies
working in Mahajanga
b) Species composition,
ratio of shrimp/fish
c) Bycatch marketing
(price, destination, etc.)
Project on developing
bycatch storage
JICA
Japanese
cooperation
with Malagasy
government
2002
a) Feasibility studies
(information about
society and bycatch at
Mahajanga)
b) Gift of cold storage
unit (900 m3, 300 t, -
20°C) and means of
transport
Storage on land is one
solution to improve
quality and quantity of
bycatch. Need
collaboration between
administration and
fleet owners. Status of
unit is private but it
belongs to the fisheries
administration
Shrimp associated
fauna: bycatch of
artisanal and industrial
fisheries
T.
Rafalimanana,
PNRC
2004
Species composition
Ratios fish to shrimp and
retained fish to discarded
fish
Proposition to analyze
impacts of key fish
species indicator of
shrimp fishing grounds
Observations on
industrial shrimp
trawling fishery by-
catch in Madagascar
(campaign 2005)
F. Randriarilala
PNRC 2006
Assessment of by-catch
Species composition and
relative abundance
Use of by-catch
Length frequency data for
the most abundant species
and most retained species
Study focused on
zones B, C and D
(literature not made
public)
6.2. Reviews of technologies introduced to reduce bycatch and discards
The first experiments with BRDs and TEDs were initiated by one company, in 1999, in order to obtain
certification for an environmental friendly fishery. The models introduced were refined and tailored to fit the
fishery. Devices tested significantly reduced bycatch (up to 57%), some increased shrimp catch. No big animals
were caught. Then, IFREMER helped in optimizing the TED rigging. Finally, the industry agreed with one
developed model, considered to minimize shrimp loss.
The TED is composed of a metal grid installed at a certain angle the exit is above it and covered by a flap of
webbing.
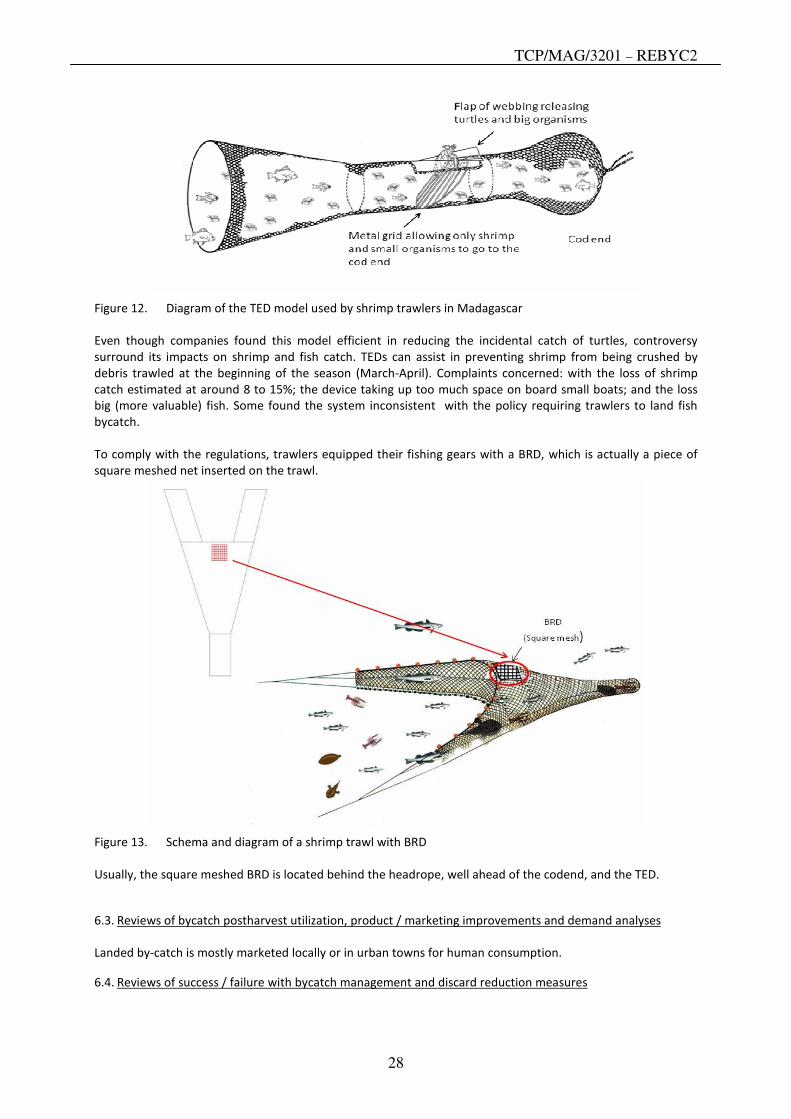
TCP/MAG/3201 – REBYC2
28
Figure 12. Diagram of the TED model used by shrimp trawlers in Madagascar
Even though companies found this model efficient in reducing the incidental catch of turtles, controversy
surround its impacts on shrimp and fish catch. TEDs can assist in preventing shrimp from being crushed by
debris trawled at the beginning of the season (March-April). Complaints concerned: with the loss of shrimp
catch estimated at around 8 to 15%; the device taking up too much space on board small boats; and the loss
big (more valuable) fish. Some found the system inconsistent with the policy requiring trawlers to land fish
bycatch.
To comply with the regulations, trawlers equipped their fishing gears with a BRD, which is actually a piece of
square meshed net inserted on the trawl.
Figure 13. Schema and diagram of a shrimp trawl with BRD
Usually, the square meshed BRD is located behind the headrope, well ahead of the codend, and the TED.
6.3. Reviews of bycatch postharvest utilization, product / marketing improvements and demand analyses
Landed by-catch is mostly marketed locally or in urban towns for human consumption.
6.4. Reviews of success / failure with bycatch management and discard reduction measures
TCP/MAG/3201 – REBYC2
29
Success: Because of the demand in urban areas, diminution of shrimp catch, and requests for fish at low prices
in rural areas, trawlers landed tons of bycatch. The use of TEDs prevents shrimp getting crushed by debris,
value-adding the final product.
Failure: Companies do not use the BRD at the appropriate location in the trawl. Thus, its efficacy is mitigated in
terms of reducing bycatch. Its position is also probably losing shrimp. The use of the BRD at the start of the
fishing season for 2 months (during which shrimp are aggregating and rivers flush away lots of debris), is
criticized for lowering shrimp catch. Debris block the metal grid of the TED preventing shrimp going to the cod
end. TEDs allow the catch of small sized fish whilst the big fish escape. There is no ongoing monitoring of the
amount of by-catch.
6.5. Reviews of studies of the impact of trawling on seabed habitats
No study on the impact of trawling or discards on seabed habitats is recorded for Madagascar. However, some
fishing zones have already faced infestation with urchins, having causing losses of shrimp catch. This kind of
situation has been attributed as being caused by habitat degradation due to trawling. No further study on this
issue has been conducted.
7 BYCATCH MANAGEMENT AND REDUCTION OF DISCARDS
The first initiative to using BRD was undertaken by a fishing company with the view to obtaining certification of
environmental friendly fishing. Further tests were conducted with IFREME but, in general, few projects have
focused on bycatch in Madagascar.
As far as is understood, industry complies very well with projects and activities concerning bycatch. Actually,
PNRC and CSP collected / are collecting data on board trawlers through observers’ programs. PNRC activities
are dedicated to shrimp related studies, thus serving the interest of shrimp industry, whilst CSP, as mandated
to monitor any fishing activities, has the right to send observers on board. On the other hand, delivering
completed log sheets is a request from the Administration responsible for licensing but it is difficult to assess
industry volunteering to participate to such projects.
Nonetheless, most of the companies visited welcome the testing and tailoring of BRDs to the specific context of
shrimp fishing areas so as to allow valueless species to escape from the trawls, and marketable ones to be
retained.
In some areas, such as the west coast (Morondava zone), small scale fishermen are looking for discarded fish
for additional income or to be used as baits. Handing over these discards to traditional fishermen instead of
dumping them at sea raised various points of view. Some see it as helping to improve the income of local
fishermen and communities but also criticize this as contributing to lessening the price of bycatch species, thus
jeopardizing the profitability of bycatch landed in developing parallel market.
7.1. Specific problems encountered with respect to bycatch management and discard reduction
In the beginning, the availability of space on board for the conservation of fish bycatch raised the issue of
profitability. Some companies reported that TEDs have significantly reduced catch of turtles. The flap of
webbing also releases big fish that cannot enter into the cod end because of the bar spacing of the TED. Only
small sized fish are caught.
The currently used square mesh panel used as the BRD is in the wrong location in the trawl and needs to be
moved back behind the TED and just in front of the codend. If this is done, more small fish should escape and
more shrimp should be retained.
The licensing system doesn’t automatically stop the renewal permits in case of non- compliance with the rate
of bycatch landings. Moreover, official statistics rely on declaration from companies, which are processed with
a delay of one to two years.
TCP/MAG/3201 – REBYC2
30
A new management system implies a more intensive monitoring, control and surveillance, specifically of
fishing gears, at the beginning and throughout the fishing season, and of the catch composition as needed.
The workshop on shrimp fishery management, held in 2005, stressed on some key points:
- the necessity of an inclusive management process, extending regulations to collectors and
small scale fishers;
- rehabilitation of the competitiveness of the sector and its profitability;
- improvement of the knowledge on bio economic impacts of the traditional fishery trough a
support to the Economic Observatory;
- eco-certification of the fishery;
- implementation and institutionalization of dialogue between the 3 fisheries segments,
including the formalization of the traditional fishery in partnership with Fisheries
Administration;
- encouraging the industrial fishery to support the improvement of living conditions for
traditional fishers;
- formalization of annual mangrove restoration; and
- reinforcement of the public and fishers’ attitudes and awareness of the need for resources
preservation.
In conclusion, evidence is made on a close collaboration between Administration and the very proactive shrimp
industry in shrimp and related resources management is important.
7.2. Results of the consultation workshops
7.2.1. Focus group consultation workshops
To fix the issue of bycatch management with the various actors, a series of focus group workshops were
organized. The purpose was to:
- To present, on a powerpoint support (Annexe 8) the data collected through literature, from
institutions and from the industrial shrimp companies on bycatch situation (statistics, …) and
their related issues;
- To discuss the current situation of the Madagascan shrimp fishery bycatch; and
- To gather suggestions and identify the key points to be addressed.
The results of each workshop are summarized here below while details and attendance lists are given in
annexes 9.
7.2.1.1 Consultation of the Fisheries Administration
Two consultation workshops were organized to gather the Fisheries Administration concerns and suggestions,
the first one with the Central Administration, the second with decentralized and central Administration.
The concerns of the Central Administration were the following:
- Regarding the two devices (BRD and TED), their characteristics should be defined legally and the
pertinence of their simultaneous use proven;
- The economic and socioeconomic aspects of bycatch should be considered: necessity of preliminary
market chains studies, availability of bycatch all the year through;
- Scientific data on bycatch species and stocks are fundamental to ensure the sustainability / viability of
the resources; and
- The monitoring system needs to be improved to cover bycatch parameters (on-board observer
programme, effective collaboration of shrimp operators).
- The session with decentralized and central Fisheries Administration raised the following concerns and
suggestions:
- The implementation of a comprehensive and collaborative data collection system for a science based
management is a priority area: logsheets including bycatch, on board observer programme,
TCP/MAG/3201 – REBYC2
31
collaboration between Administration, operators and research centers, monitoring of bycatch,
impacts of the traditional fishery, stocks assessment and monitoring;
- The adjustment of the in situ fishing effort can help to reduce bycatch of (limited duration of a haul,
use of a try net);
- Fisheries related research needs to be reinforced: appropriate staffing of the research centers, funding
by the Government of research activities;
- Regarding the Fisheries Administration itself, the needs concern the recruitment of economists and
local staff ; and
- The issue of State continuity (and or political stability) is impacting the implementation of any
decision.
7.2.1.2 Consultation of the GAPCM
The shrimp trawling industries gathered under GAPCM raised the following:
- The formal sector of the industrial shrimp fishery is facing economic concerns in terms of profitability,
purchasing power of local populations and continuity of market supply. The existence of a non formal
market chain resulting from bycatch transshipping to local fishermen is worsening the situation;
- The TED and BRD should be fine tuned and the most appropriate option validated;
- The monitoring and control system need to be intensified and extended to the traditional fishery, the
bycatch of shrimp trawlers and the ecological impacts of the fishery;
- A better knowledge of the resources is crucial: level of sustainable yields, inventory / biology/
demography of species, stock viability etc; and
- Obtaining the MSC (Marine Stewardship Council) certification is still pending, requiring (i) the control
of the traditional fishery, the reduction of the fishing mortality of juveniles and the updating of shrimp
stock assessment; (ii) the monitoring of shrimp trawlers’ bycatch and the ecological impacts of the
fishery; and (iii) the future and direction of the research of the PNRC.
7.2.1.3 Consultation of projects staff and NGOs
The concerns raised by projects staff and NGOs were the following:
- The knowledge on the resources encompasses the reliable data on both artisanal and industrial
fishery, species distribution/evolution/fishing mortality, stocks;
- A bio indicator based monitoring should be implemented;
- Local communities should be involved in resources/ areas management and conservation;
- The endemic threatened species should be protected; and
- The selectivity of the traditional fishing gears needs to be addressed.
Summary:
All the focus groups raised and insisted on the following:
- A strategy for bycatch management should consider the discards. The term “bycatch” refers to the
total catch of all organisms but the target species that are brought on board; one part of this catch will
be retained and landed, the other part will be discarded. The “discards” refer to all organisms dumped
into the sea;
- The techniques / devices for reducing or selecting bycatch species need to be fine tuned / adapted to
the fishing conditions (resource behavior, fishing grounds, fishing operating mode, …) ;
- The bycatch management should include / consider all types of shrimp fisheries (industrial,
artisanal/traditional), and other existing or potential fisheries; and
- The Administration must adopt a clear policy for bycatch management and for fisheries management
in general.
TCP/MAG/3201 – REBYC2
32
All these points meet the Code of Conduct for a Responsible Fishery and the Ecosystem Approach to Fisheries.
7.2.2. Recommendations of the final consultation workshop
The results of the series of focus group workshops were put together, categorized by theme and presented
during a final workshop for discussion. All those who participated in the focus group workshops were invited
(Annexes 10). The conclusions and recommendations of this workshop can be summarized as follows.
- The overall objective should meet the viability/ sustainability of the resources in general.
- Considering the interactions and combined impacts of the traditional and industrial fisheries on the resources,
actions and management of these two sectors should be combined.
- A network of Biologically Sensitive Shrimp Zones (biology based protected areas) may help meeting the
management objectives as both shrimp and bycatch species are concerned. NGOs can help in the areas of
resources and habitats conservation, zoning and governance.
- Research should take a more, in not the core, important place in resources and fisheries management.
Research themes should include stocks assessment, and stress more on discards in the near future. Specifically
for the Ambaro Bay (zone A), scientific works should be continued and consolidated. Lack of resources (human
and material) in the domain of research need to be addressed.
- In terms of management, a responsible and viable fishery should be targeted. To address the continuing
decrease in shrimp stocks and catch, integrated management measures should be taken as a matter of
urgency, among which monitoring, surveillance and control need to be enhanced. The GAPCM ensures its
collaboration. The roles of and partnership with local communities in spatial and resources management
should be considered and enhanced. In general, there is a great need for coordination and involvement of all
those concerned by the marine and coastal areas, and thus, the involvement of the National Committee for
Integrated Coastal Zone Management is critical.
Considering the importance, the number and the urgency of issues raised, the initiative is left with the
Department of Fisheries to develop and provide FAO with an outline for a future project.
TCP/MAG/3201 – REBYC2
33
REFERENCES
ANONYME, : La pêche à Madagascar. 13p
FAO, 2008 : Report of the second session of the scientific committee of the South West Indian Ocean Fisheries
Commission. Mauritius, 3-7 August 2007. FAO Fisheries and Aquaculture Report No. 875, 88p.
FAO, 2009 : Report of the Workshop on bycatch, particularly in prawn fisheries, and on the implementation of
an ecosystem approach to fisheries management. Maputo-Mozambique, 15-24 November 2005.
FAO Fisheries and Aquaculture Report No. 873 SFS/R873 (En), 56 p.
IONIARILALA Radonirina, 2003 – La valorisation économique des captures accessoires de la pêche industrielle
crevettière à Madagascar. Mém. CESA ENSAR, 2003. 90p
IOTC, 2009 : La pêche à Madagascar. 13p.
LEZ, P., ROJAT, D. : La crevette de Madagascar : responsabilité sociale et environnementale des entreprises.
20p.
PNUD/FAO, 1983 : Développement des pêches maritimes à Madagascar. Conclusions et recommandations.
FI :DP/MAG/80/008. Rapport Final.
RABARISON ANDRIAMIRADO, G.A., 1989: Summary description and economic performance of the traditional
shrimp fishery in zone I. In SWIOP/CNRO 1989: Proceedings of the shallow water shrimp fishery of
Northwest Madagascar. FAO/UNDP RAF/87/008/DR/50/89/E, pp: 68-73
RABARISON ANDRIAMIRADO, G.A., 1987: La pêche de la crevette par la méthode de valakira. In Proceedings of
the Crustacean Management Workshop. Mauritius, October 1-11, 1988. FAO/UNDP
RAF/79/065/WP/38/87, pp : 60-65
RABARISON, A.G.A., RAVELOSON, H.N., 1988: Les captures secondaires dans la pêcherie de crevette côtière à
Madagascar première estimation CNRO., 23p.
RAFALIMANANA, T., 2003 : Les crevettes pénéides exploitées sur la côte ouest de Madagascar : variabilités
spatio-temporelles des paramètres biologiques et dynamique des populations. Thèse Doct., Dép.
Halieutique UPR MESH ENSA Rennes – France, 268 p.
RAKOTONDRATSIMBA,B.A., CHABOUD, C., RASOANANDRASANA, N., 2008 : Résultats des travaux menés sur la
pêche traditionnelle crevettière depuis 2003. In Caverivière, A., Chaboud, C., Rafalimanana, T.,
(Eds. Sci.) 2008 : Les crevettes côtières de Madagascar : biologie, exploitation, gestion. IRD Editions,
Marseille, 2008, pp 143-167.
RALISON, A., 1987: Summary of fisheries and resources information for Madagascar. In: Sanders, M.J., P. Sparre
and S.C. Venema (Eds.), 1988: Proceedings of the workshop on the assessment of the fishery
resources in the Southwest Indian Ocean. FAO/UNDP: RAF/79/065/WP/41/88/E: 277p

TCP/MAG/3201 – REBYC2
34
ANNEXES
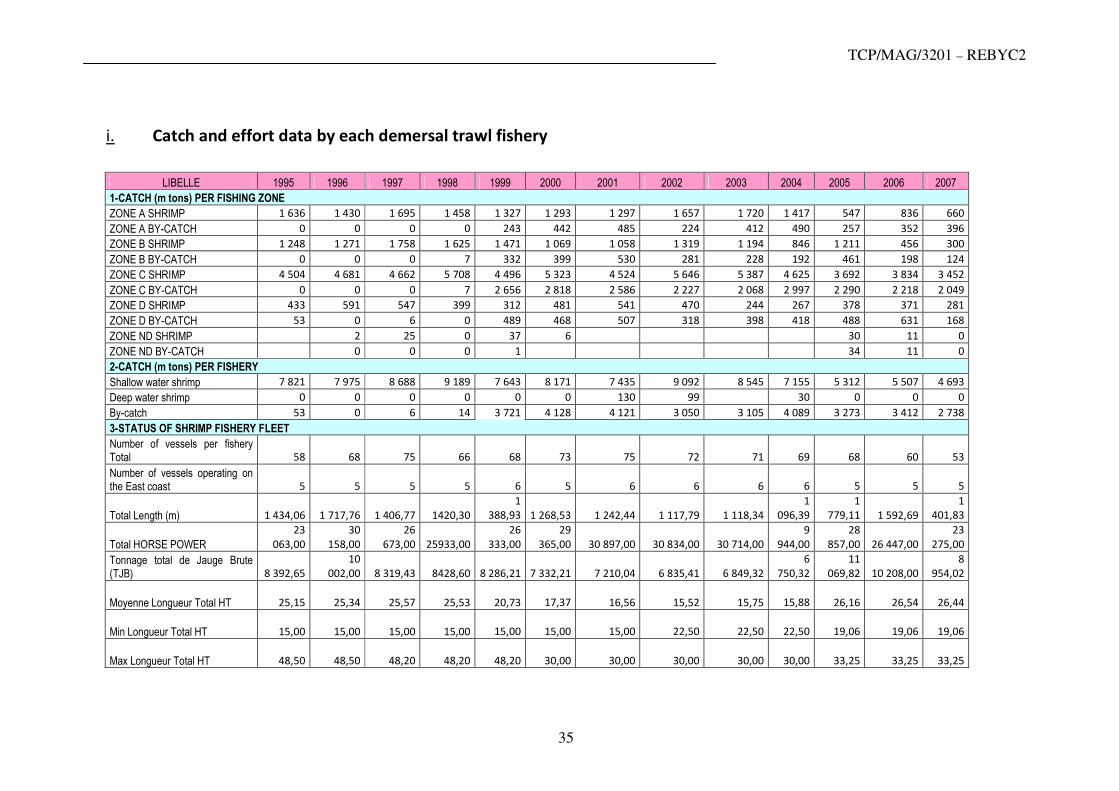
TCP/MAG/3201 – REBYC2
35
i. Catch and effort data by each demersal trawl fishery
LIBELLE 1995 1996 1997 1998 1999 2000 2001 2002 2003 2004 2005 2006 2007
1-CATCH (m tons) PER FISHING ZONE
ZONE A SHRIMP 1 636 1 430 1 695 1 458 1 327 1 293 1 297 1 657 1 720 1 417 547 836 660
ZONE A BY-CATCH 0 0 0 0 243 442 485 224 412 490 257 352 396
ZONE B SHRIMP 1 248 1 271 1 758 1 625 1 471 1 069 1 058 1 319 1 194 846 1 211 456 300
ZONE B BY-CATCH 0 0 0 7 332 399 530 281 228 192 461 198 124
ZONE C SHRIMP 4 504 4 681 4 662 5 708 4 496 5 323 4 524 5 646 5 387 4 625 3 692 3 834 3 452
ZONE C BY-CATCH 0 0 0 7 2 656 2 818 2 586 2 227 2 068 2 997 2 290 2 218 2 049
ZONE D SHRIMP 433 591 547 399 312 481 541 470 244 267 378 371 281
ZONE D BY-CATCH 53 0 6 0 489 468 507 318 398 418 488 631 168
ZONE ND SHRIMP 2 25 0 37 6 30 11 0
ZONE ND BY-CATCH 0 0 0 1 34 11 0
2-CATCH (m tons) PER FISHERY
Shallow water shrimp 7 821 7 975 8 688 9 189 7 643 8 171 7 435 9 092 8 545 7 155 5 312 5 507 4 693
Deep water shrimp 0 0 0 0 0 0 130 99 30 0 0 0
By-catch 53 0 6 14 3 721 4 128 4 121 3 050 3 105 4 089 3 273 3 412 2 738
3-STATUS OF SHRIMP FISHERY FLEET
Number of vessels per fishery Total 58 68 75 66
68
73 75 72 71
69
68
60
53
Number of vessels operating on the East coast 5 5 5 5
6 5 6 6 6
6
5
5
5
Total Length (m) 1 434,06 1 717,76 1 406,77 1420,30
1
388,93 1 268,53 1 242,44 1 117,79 1 118,34
1
096,39
1
779,11 1 592,69
1
401,83
Total HORSE POWER
23
063,00
30
158,00
26
673,00 25933,00
26
333,00
29
365,00 30 897,00 30 834,00 30 714,00
9
944,00
28
857,00 26 447,00
23
275,00
Tonnage total de Jauge Brute (TJB) 8 392,65
10
002,00 8 319,43 8428,60 8 286,21 7 332,21 7 210,04 6 835,41 6 849,32
6
750,32
11
069,82 10 208,00
8
954,02
Moyenne Longueur Total HT 25,15 25,34 25,57 25,53 20,73
17,37 16,56 15,52 15,75
15,88 26,16 26,54 26,44
Min Longueur Total HT 15,00 15,00 15,00 15,00
15,00
15,00
15,00
22,50
22,50
22,50
19,06
19,06
19,06
Max Longueur Total HT 48,50 48,50 48,20 48,20
48,20
30,00
30,00
30,00
30,00
30,00
33,25
33,25
33,25

TCP/MAG/3201 – REBYC2
36
Moyenne Puissance Totale (CV) 404,61 407,50 398,00 392,00
393,02
402,26
411,96
428,25
432,59
433,97
424,36
440,00
440,00
Min Puissance Totale (CV) 150,00 150,00 150,00 150,00
150,00
150,00
150,00
250,00
250,00
250,00
250,00
250,00
250,00
Max Puissance Totale (CV) 775,00 775,00 500,00 500,00
500,00
500,00
500,00
500,00
500,00
500,00
500,00
500,00
500,00
Moyenne TJB (Tonnage total de Jauge Brute) 147,23 147,20 151,26 150,68
123,67
100,44 96,13
94,93
96,46
97,83
162,79
170,13
175,56
Min TJB (Tonnage total de Jauge Brute) 30,44 30,44 30,44 30,44
30,44
30,44
30,44
100,00
100,00
100,00
100,00
100,00
100,00
Max TJB (Tonnage total de Jauge Brute) 433,00 433,00 433,00 433,00
433,00
238,27
238,27
238,27
238,27
238,27
432,00
432,00
432,00
4-EVOLUTION OF SOME FISHING EFFORT DESCRIPTORS ( En l'état actuel des validations BANACREM)
LIBELLE 1995 1996 1997 1998 1999 2000 2001 2002 2003 2004 2005 2006 2007
Number of vessels having filled in logsheets 58 68 75 66
68
73 75 72 71
69
68
60
53
Number of fishing days
13
490,00
15
054,00
15
176,00
14
795,00
14
394
16
667
16
067
16
297
15
674
13 036 13 176 12 236 9 853
Number of fishing hours
213
120,80
244
487,70
249
923,20
254
154,00
253
623,00
280
282,00
280
350,00
285
007,00
257
478,00
212
476,00
204
782,00
198
060,00
157
030,00
days/vessel 228,60 221,40 202,34 224,00
212,00
228,00
214,00
226,00
220,00
193,00
194,00
204,00 183,41
fishing hours / vessel 3 612,22 3 595,40 3 332,30 3 850,82
3
730,00
3
839,00
3
738,00
3
958,00
3
626,00
3
079,00 3 011,00 3 301,00
2
962,83
fishing hours / day 15,80 16,24 16,46 17,00
18,00
17,00
17,00
17,00
16,00
16,00
16,00
16,00 16,00
Number of hauls 75 872 85 594 103 242 107 788
109
621
123
945
117
635
121
580
110
572
65 453 101 270 91 548 81 613
mean depth (m) 11,76 13,24 13,54 12,19
11,73
11,86
11,38
11,63
12,18
14,09
9,55
12,90 13,28
yield/hour(kg) 36,70 32,62 34,76 36,16
30,14
29,15
26,52
31,90
33,19
53,78
25,94
27,51
29,88
% shrimp "white" 68,44 56,03 60,37 60,43
64,89
75,10
76,34
76,95
76,31
79,71
94,21
82,44
88,44
% other types of shrimp 31,56 43,97 39,63 39,57
35,11
24,90
23,66
23,05
23,69
20,29
5,79
17,56
11,56
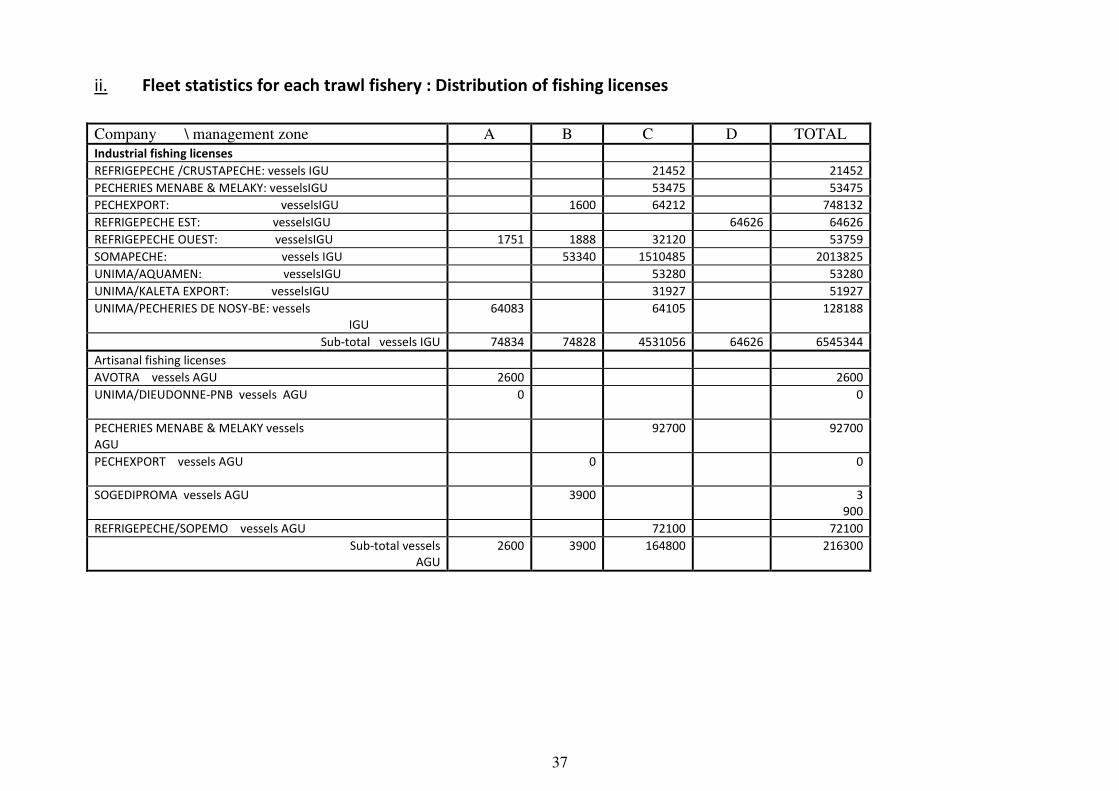
37
ii. Fleet statistics for each trawl fishery : Distribution of fishing licenses
Company \ management zone A B C D TOTAL
Industrial fishing licenses
REFRIGEPECHE /CRUSTAPECHE: vessels IGU 21452 21452
PECHERIES MENABE & MELAKY: vesselsIGU 53475 53475
PECHEXPORT: vesselsIGU 1600 64212 748132
REFRIGEPECHE EST: vesselsIGU 64626 64626
REFRIGEPECHE OUEST: vesselsIGU 1751 1888 32120 53759
SOMAPECHE: vessels IGU 53340 1510485 2013825
UNIMA/AQUAMEN: vesselsIGU 53280 53280
UNIMA/KALETA EXPORT: vesselsIGU 31927 51927
UNIMA/PECHERIES DE NOSY-BE: vessels
IGU
64083 64105 128188
Sub-total vessels IGU 74834 74828 4531056 64626 6545344
Artisanal fishing licenses
AVOTRA vessels AGU 2600 2600
UNIMA/DIEUDONNE-PNB vessels AGU 0
0
PECHERIES MENABE & MELAKY vessels
AGU
92700 92700
PECHEXPORT vessels AGU 0
0
SOGEDIPROMA vessels AGU 3900 3
900
REFRIGEPECHE/SOPEMO vessels AGU 72100 72100
Sub-total vessels
AGU
2600 3900 164800 216300
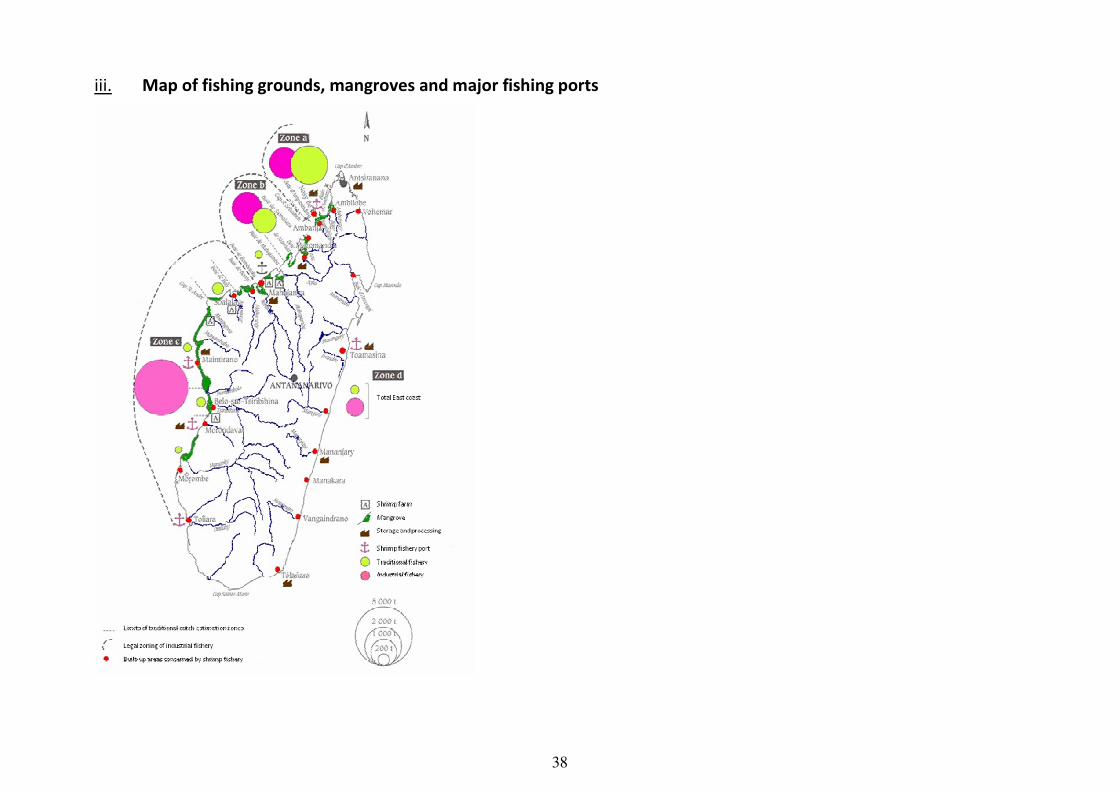
38
iii. Map of fishing grounds, mangroves and major fishing ports
39
iv. Current Fisheries legislation and policy documents related to
Licensing of trawl fleets
Decree 2007-957 Defining conditions for shallow water shrimp fishing
practice
40
41
42
43
44
45
46

47
48
49
50
51
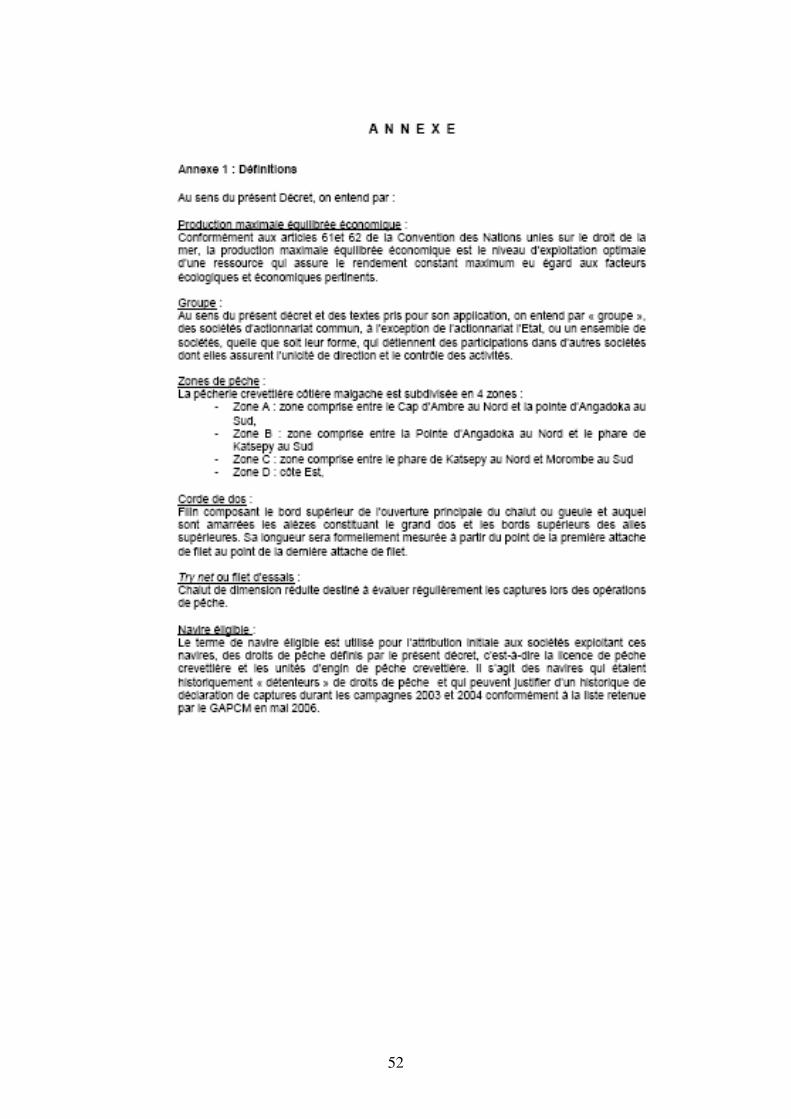
52
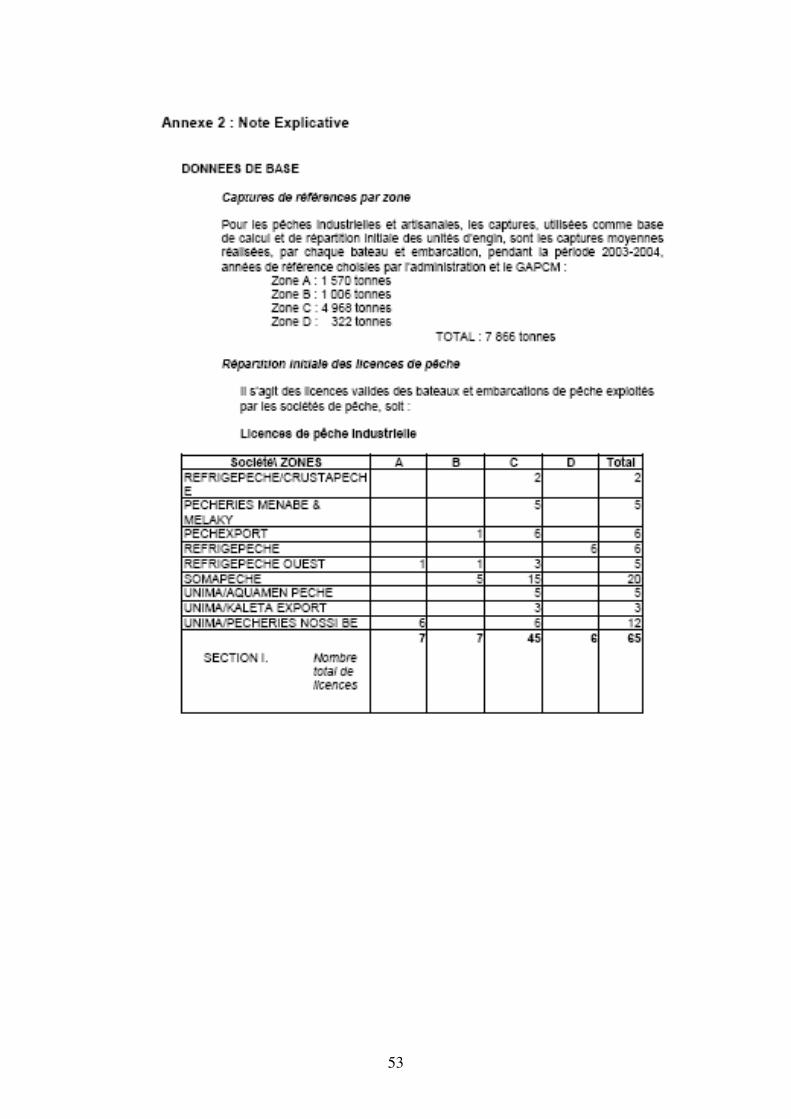
53

54
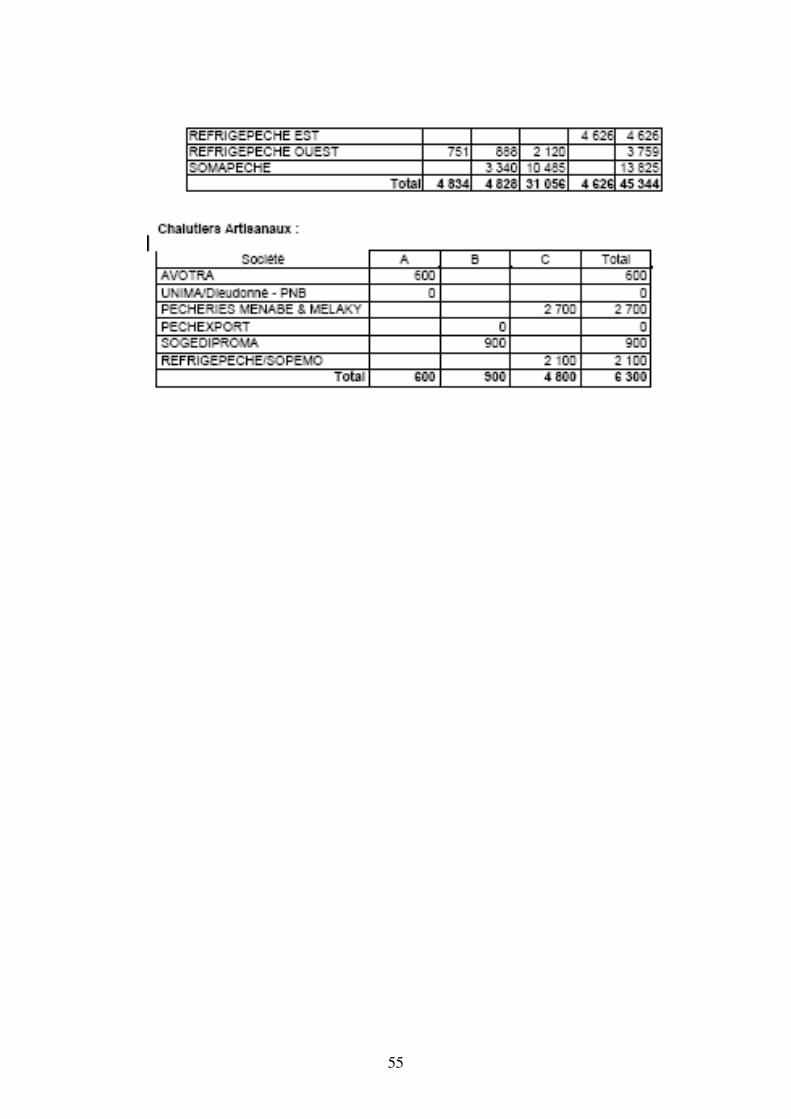
55
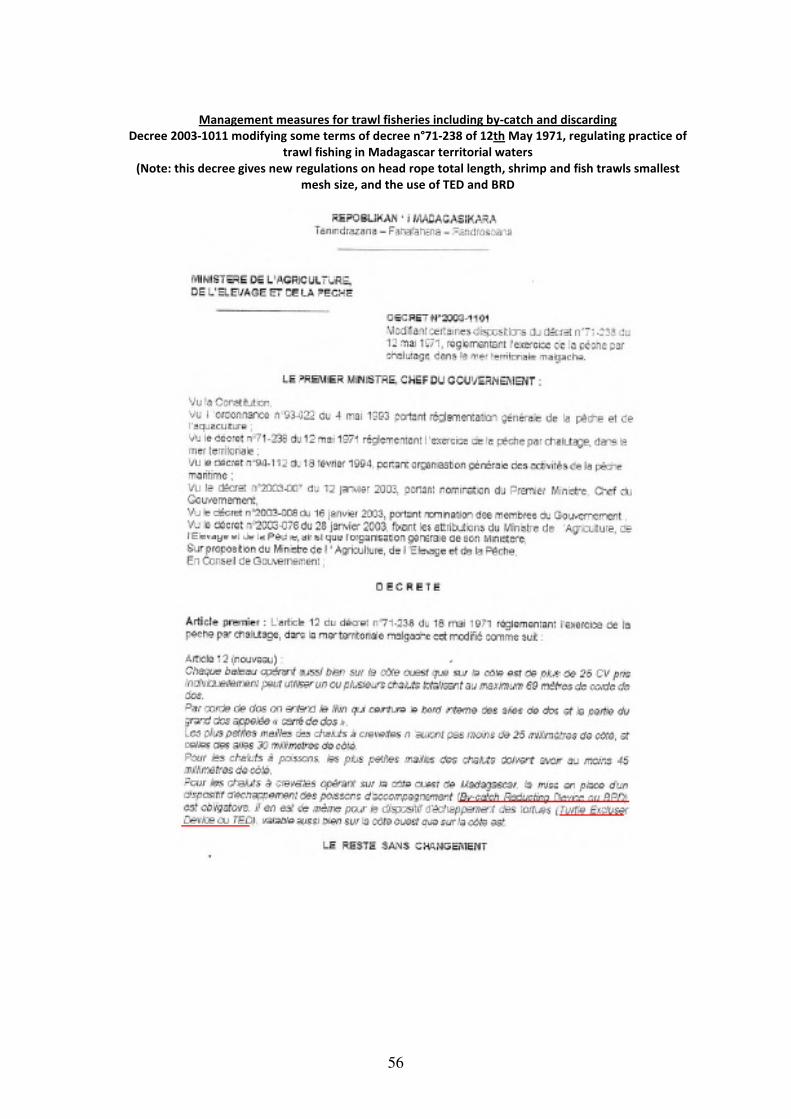
56
Management measures for trawl fisheries including by-catch and discarding
Decree 2003-1011 modifying some terms of decree n°71-238 of 12th May 1971, regulating practice of
trawl fishing in Madagascar territorial waters
(Note: this decree gives new regulations on head rope total length, shrimp and fish trawls smallest
mesh size, and the use of TED and BRD

57
Arrêté n°16953/2008 fixing regulations pertaining to head rope of trawls used by industrial and
artisanal shrimp fishing vessels

58
59
60
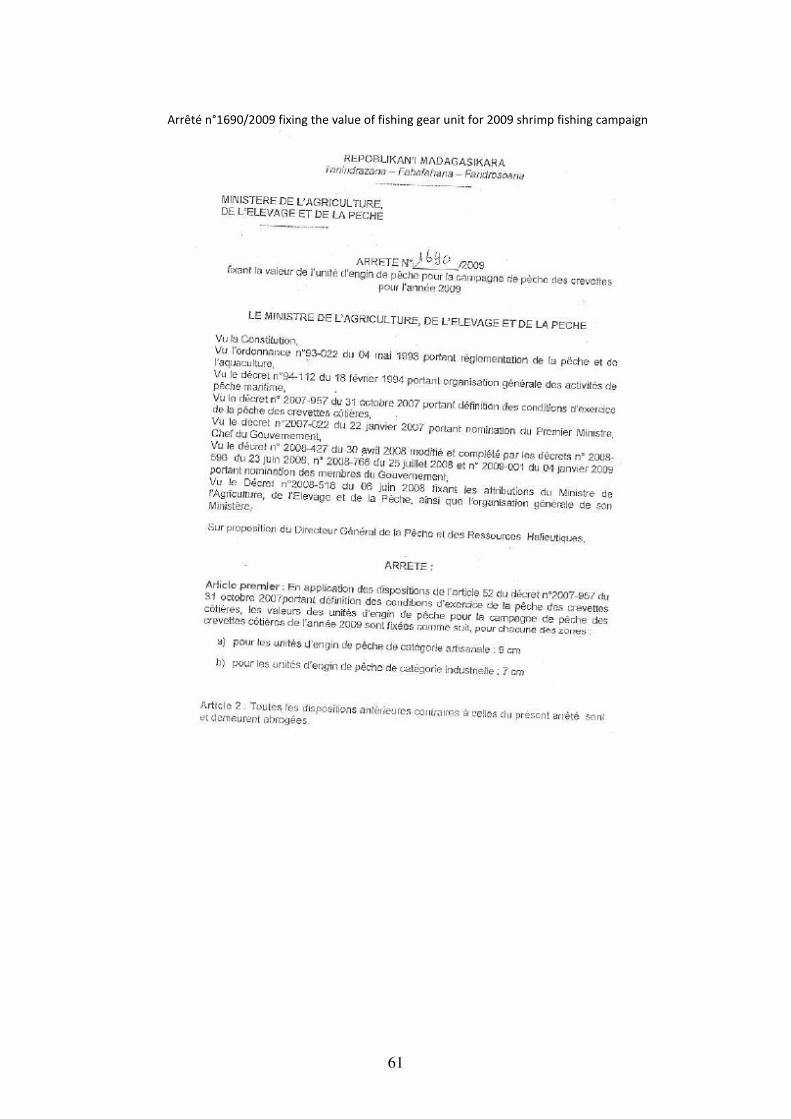
61
Arrêté n°1690/2009 fixing the value of fishing gear unit for 2009 shrimp fishing campaign
62
63
Arrêté n°844/2006 Freezing the level of shallow water shrimp fishing effort in zone comprised between
Cape St Sebastian in the North and the Pointe of Angadoka in the South
64
65
Monitoring, Control and Surveillance
Arrêté n°413-99/MEP, Creating the Fisheries Surveillance Centre of the Malagasy Slope and the
Continental Shelf
66
67
68
69

70
Arrêté n°13277-2000 Reorganizing the Fisheries Surveillance Centre
71
72
73
74
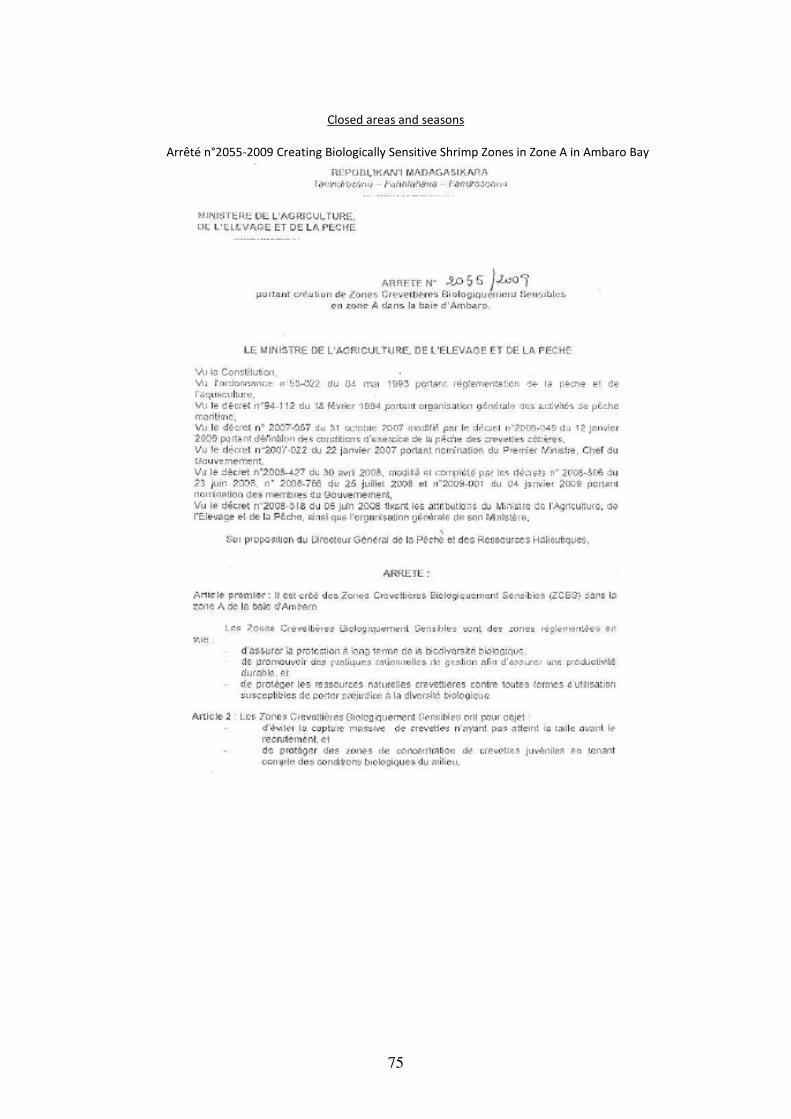
75
Closed areas and seasons
Arrêté n°2055-2009 Creating Biologically Sensitive Shrimp Zones in Zone A in Ambaro Bay
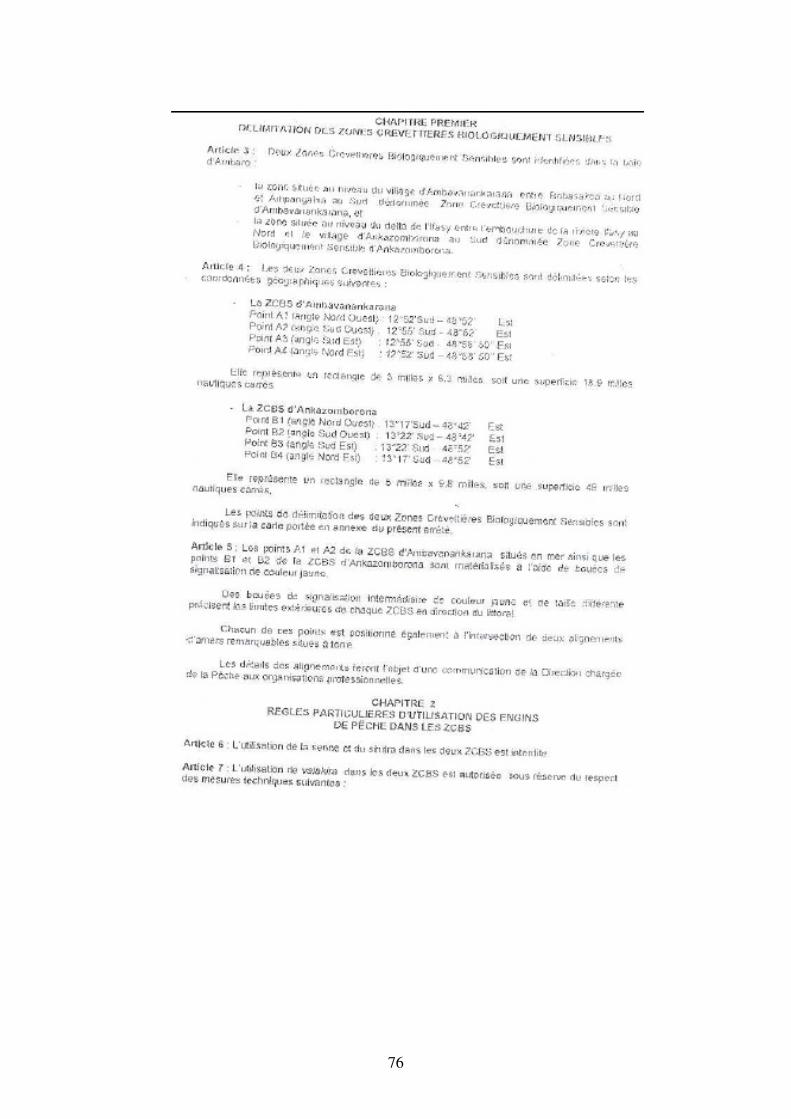
76
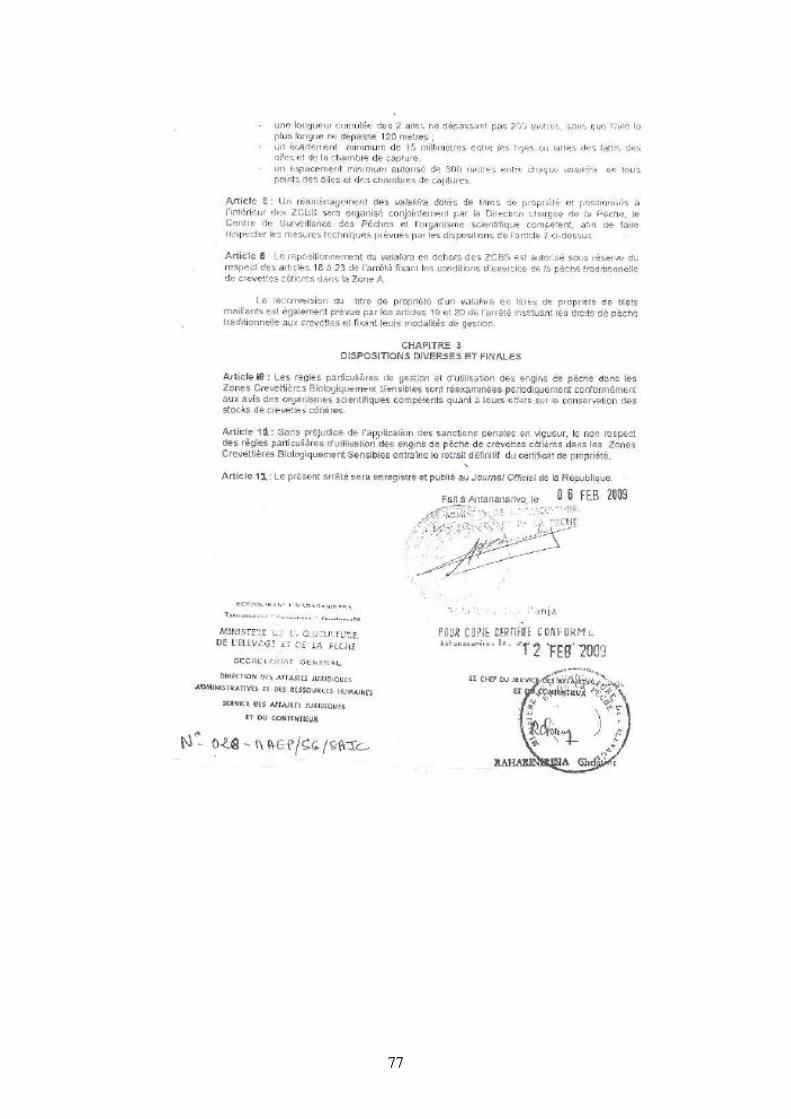
77
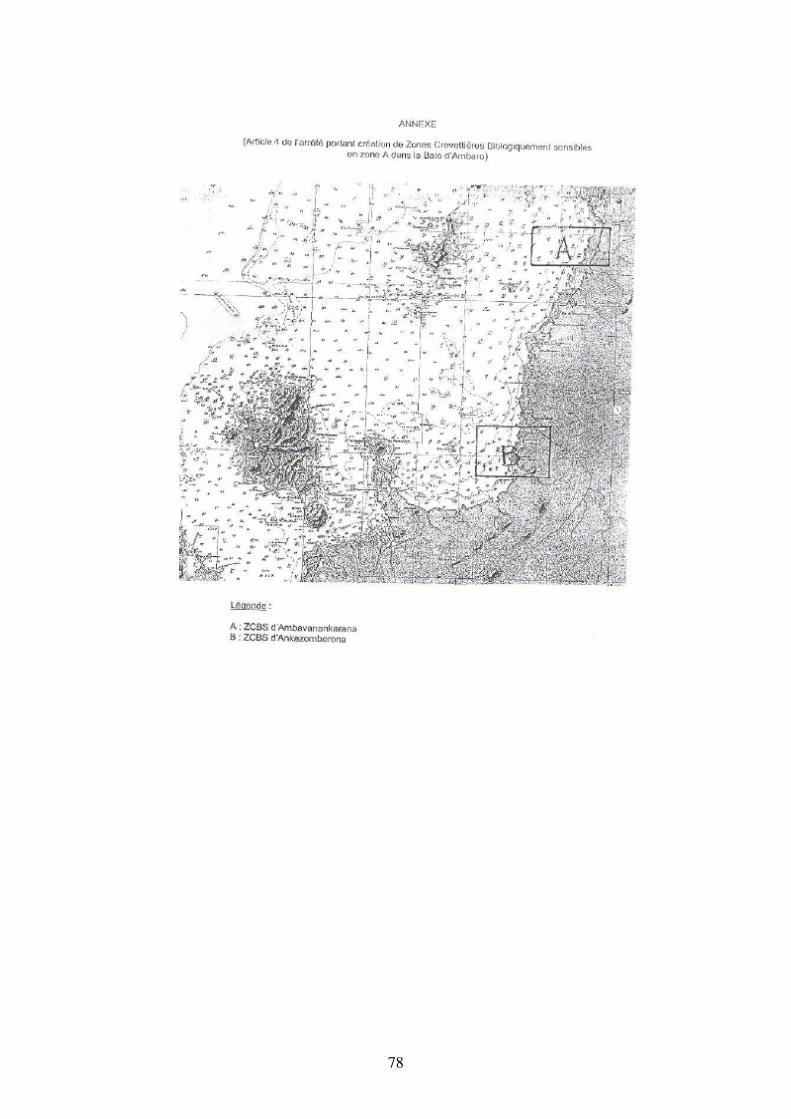
78
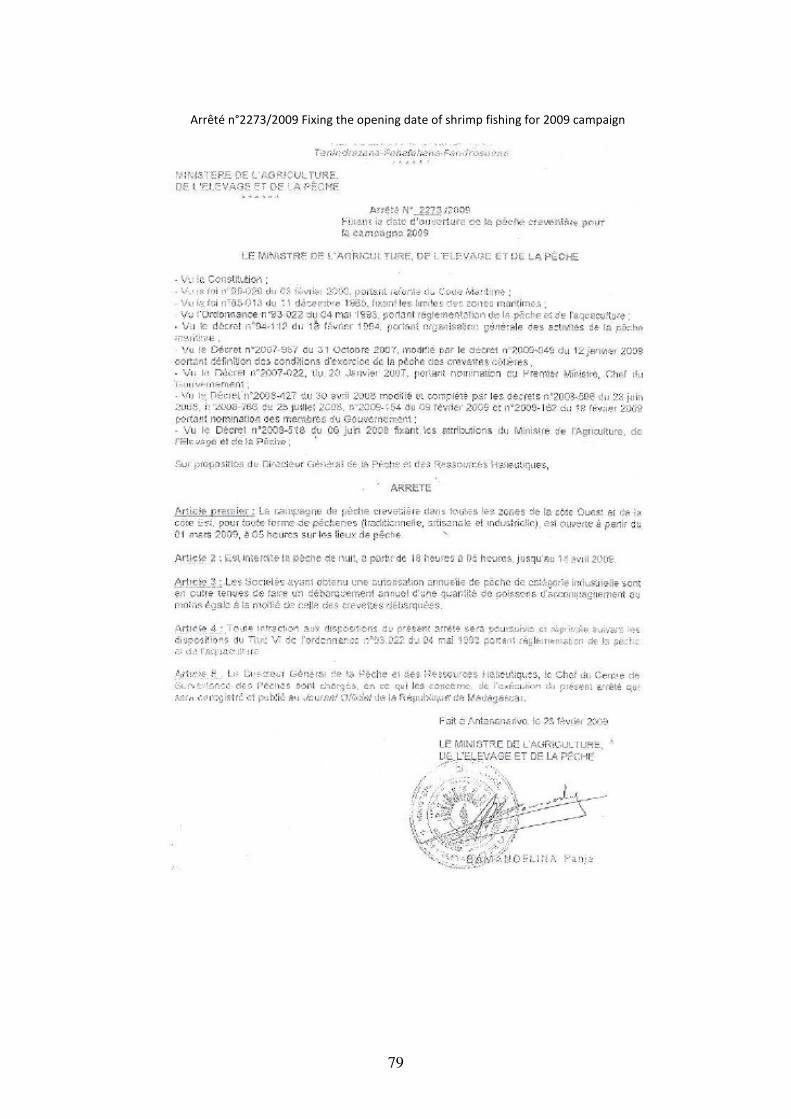
79
Arrêté n°2273/2009 Fixing the opening date of shrimp fishing for 2009 campaign
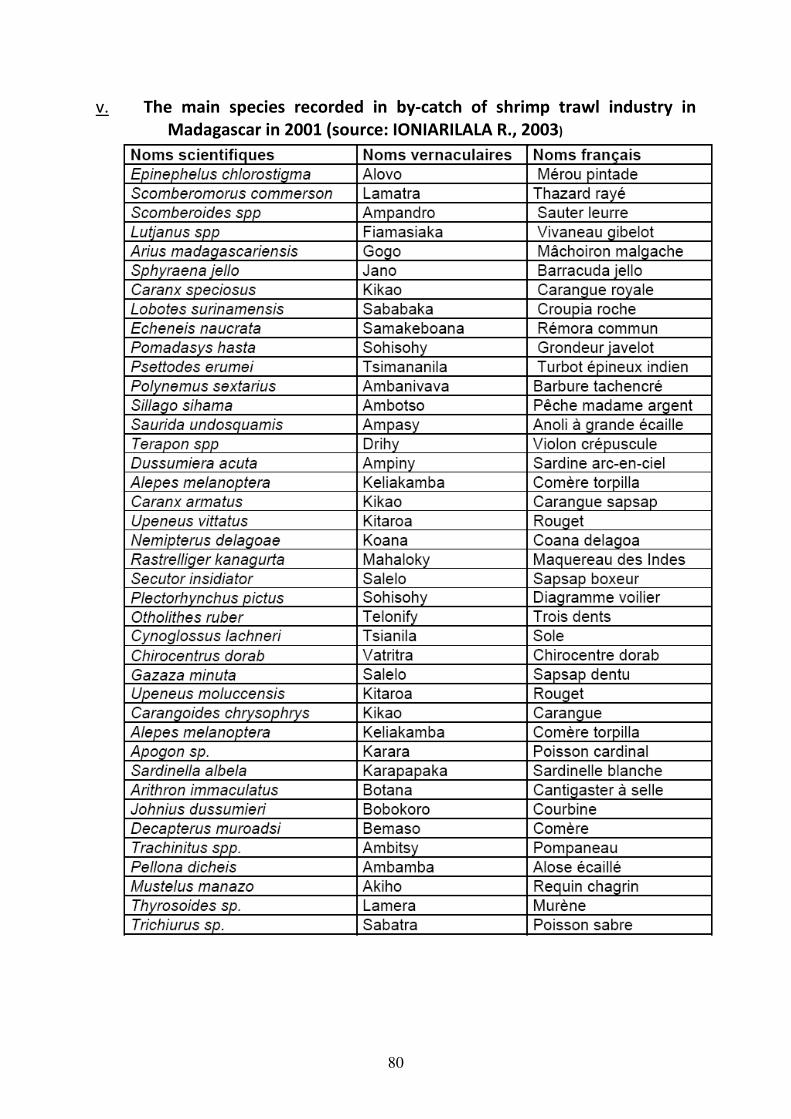
80
v. The main species recorded in by-catch of shrimp trawl industry in
Madagascar in 2001 (source: IONIARILALA R., 2003)
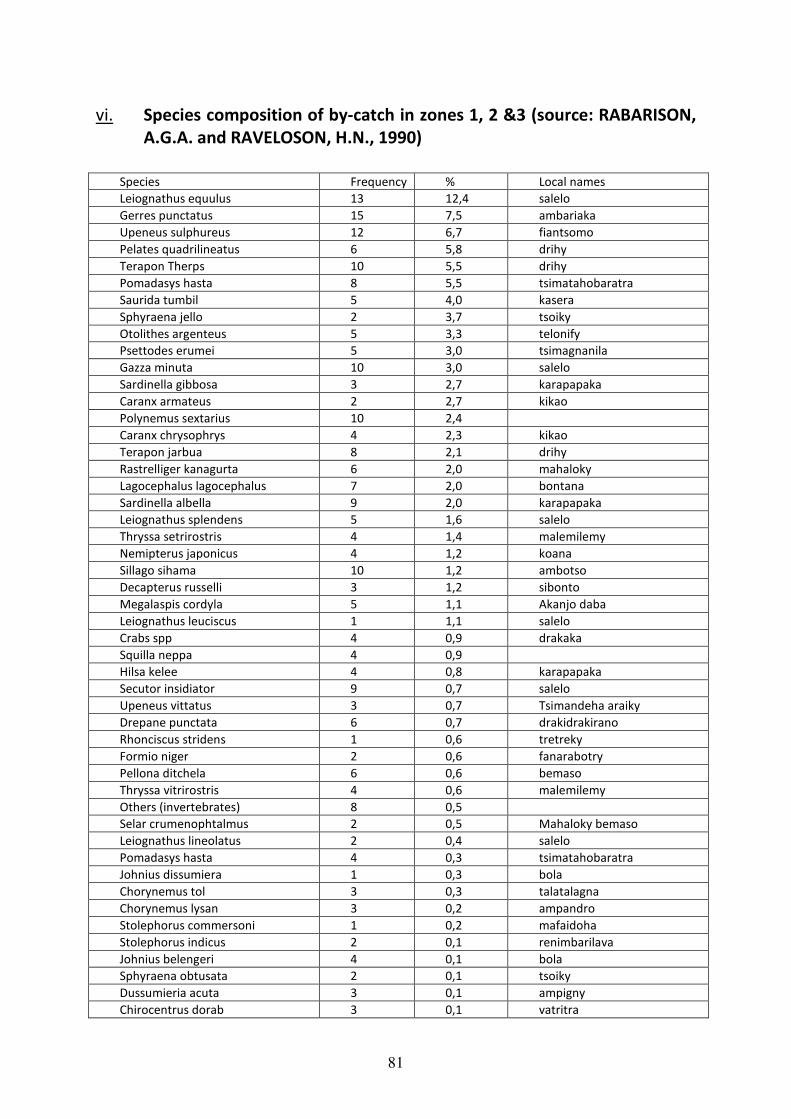
81
vi. Species composition of by-catch in zones 1, 2 &3 (source: RABARISON,
A.G.A. and RAVELOSON, H.N., 1990)
Species Frequency % Local names
Leiognathus equulus 13 12,4 salelo
Gerres punctatus 15 7,5 ambariaka
Upeneus sulphureus 12 6,7 fiantsomo
Pelates quadrilineatus 6 5,8 drihy
Terapon Therps 10 5,5 drihy
Pomadasys hasta 8 5,5 tsimatahobaratra
Saurida tumbil 5 4,0 kasera
Sphyraena jello 2 3,7 tsoiky
Otolithes argenteus 5 3,3 telonify
Psettodes erumei 5 3,0 tsimagnanila
Gazza minuta 10 3,0 salelo
Sardinella gibbosa 3 2,7 karapapaka
Caranx armateus 2 2,7 kikao
Polynemus sextarius 10 2,4
Caranx chrysophrys 4 2,3 kikao
Terapon jarbua 8 2,1 drihy
Rastrelliger kanagurta 6 2,0 mahaloky
Lagocephalus lagocephalus 7 2,0 bontana
Sardinella albella 9 2,0 karapapaka
Leiognathus splendens 5 1,6 salelo
Thryssa setrirostris 4 1,4 malemilemy
Nemipterus japonicus 4 1,2 koana
Sillago sihama 10 1,2 ambotso
Decapterus russelli 3 1,2 sibonto
Megalaspis cordyla 5 1,1 Akanjo daba
Leiognathus leuciscus 1 1,1 salelo
Crabs spp 4 0,9 drakaka
Squilla neppa 4 0,9
Hilsa kelee 4 0,8 karapapaka
Secutor insidiator 9 0,7 salelo
Upeneus vittatus 3 0,7 Tsimandeha araiky
Drepane punctata 6 0,7 drakidrakirano
Rhonciscus stridens 1 0,6 tretreky
Formio niger 2 0,6 fanarabotry
Pellona ditchela 6 0,6 bemaso
Thryssa vitrirostris 4 0,6 malemilemy
Others (invertebrates) 8 0,5
Selar crumenophtalmus 2 0,5 Mahaloky bemaso
Leiognathus lineolatus 2 0,4 salelo
Pomadasys hasta 4 0,3 tsimatahobaratra
Johnius dissumiera 1 0,3 bola
Chorynemus tol 3 0,3 talatalagna
Chorynemus lysan 3 0,2 ampandro
Stolephorus commersoni 1 0,2 mafaidoha
Stolephorus indicus 2 0,1 renimbarilava
Johnius belengeri 4 0,1 bola
Sphyraena obtusata 2 0,1 tsoiky
Dussumieria acuta 3 0,1 ampigny
Chirocentrus dorab 3 0,1 vatritra
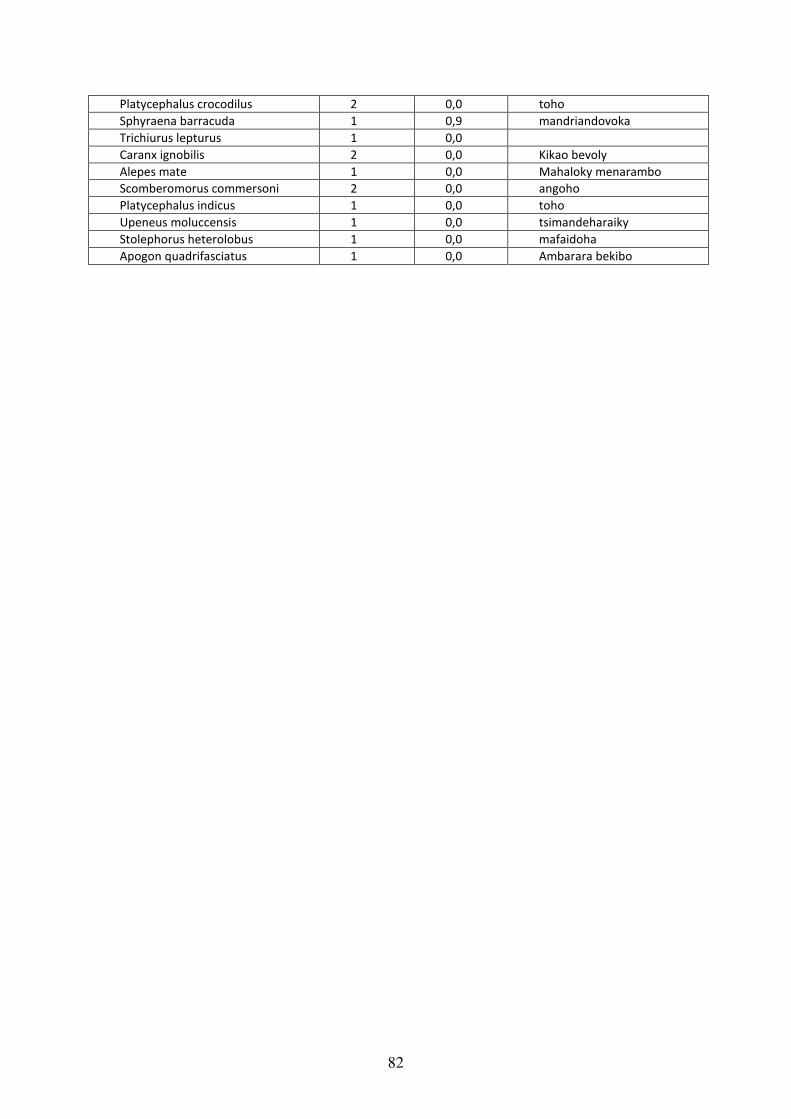
82
Platycephalus crocodilus 2 0,0 toho
Sphyraena barracuda 1 0,9 mandriandovoka
Trichiurus lepturus 1 0,0
Caranx ignobilis 2 0,0 Kikao bevoly
Alepes mate 1 0,0 Mahaloky menarambo
Scomberomorus commersoni 2 0,0 angoho
Platycephalus indicus 1 0,0 toho
Upeneus moluccensis 1 0,0 tsimandeharaiky
Stolephorus heterolobus 1 0,0 mafaidoha
Apogon quadrifasciatus 1 0,0 Ambarara bekibo
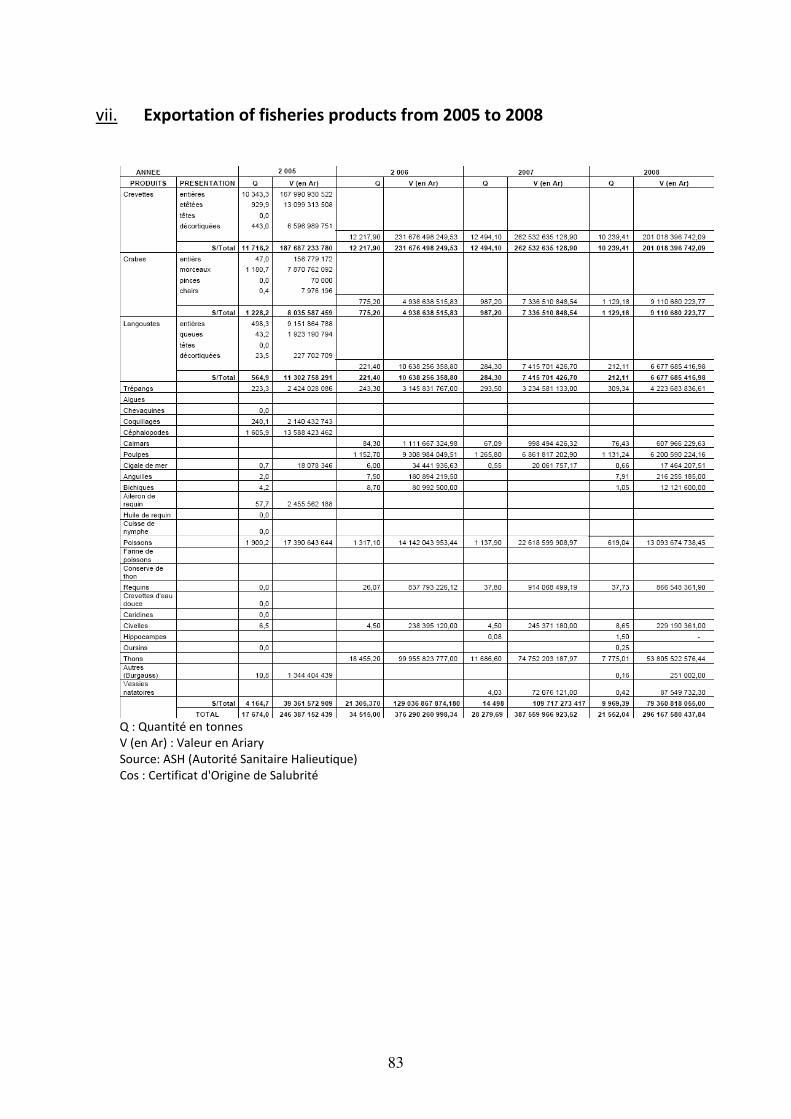
83
vii. Exportation of fisheries products from 2005 to 2008
Q : Quantité en tonnes
V (en Ar) : Valeur en Ariary
Source: ASH (Autorité Sanitaire Halieutique)
Cos : Certificat d'Origine de Salubrité
84
viii. Summary of data collected and presented to Stakeholders
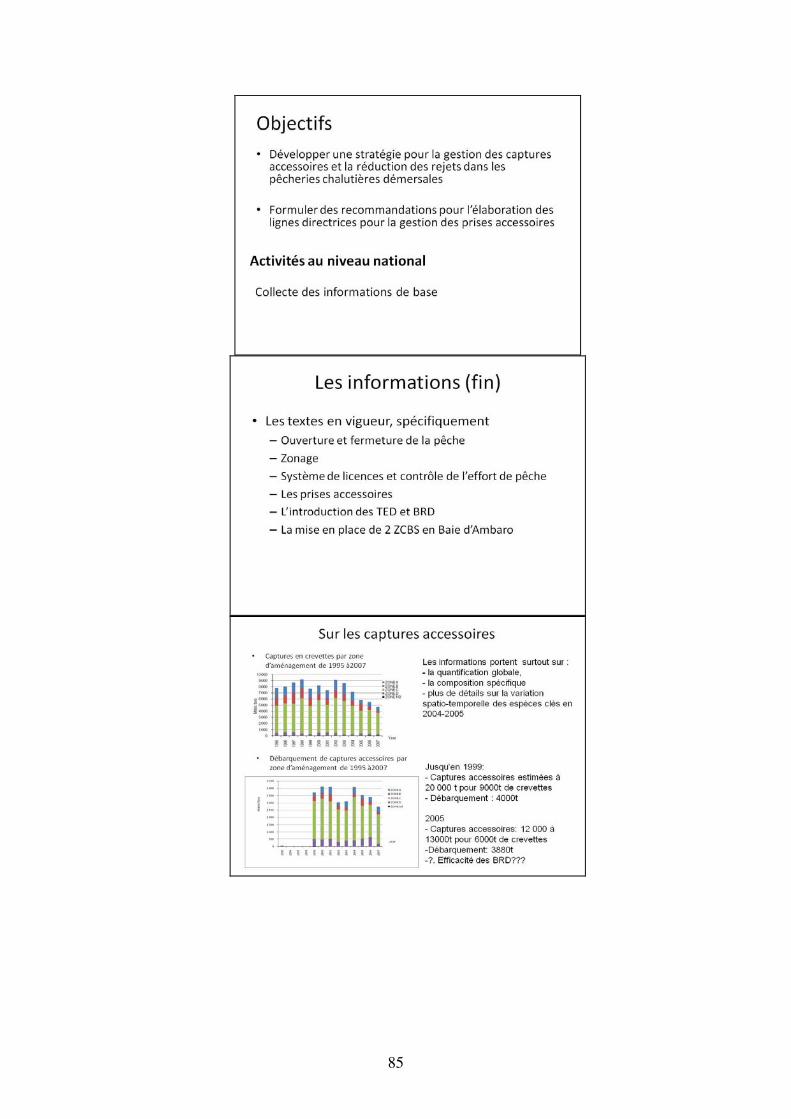
85
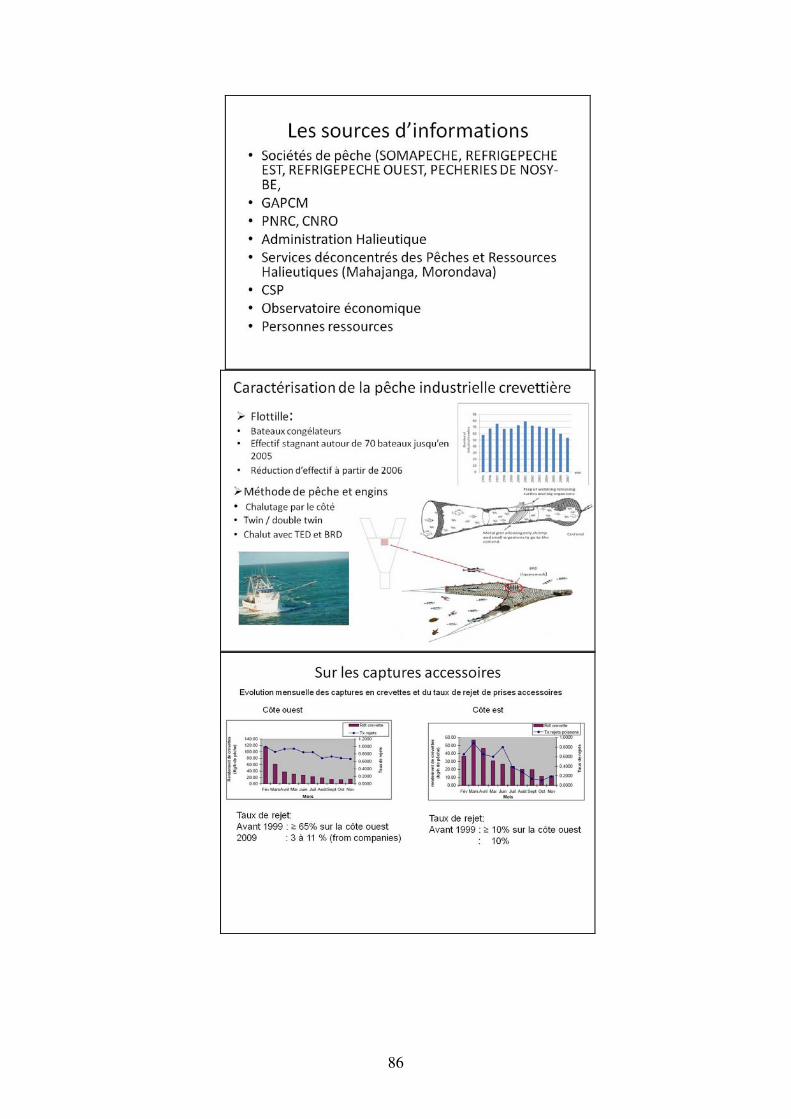
86
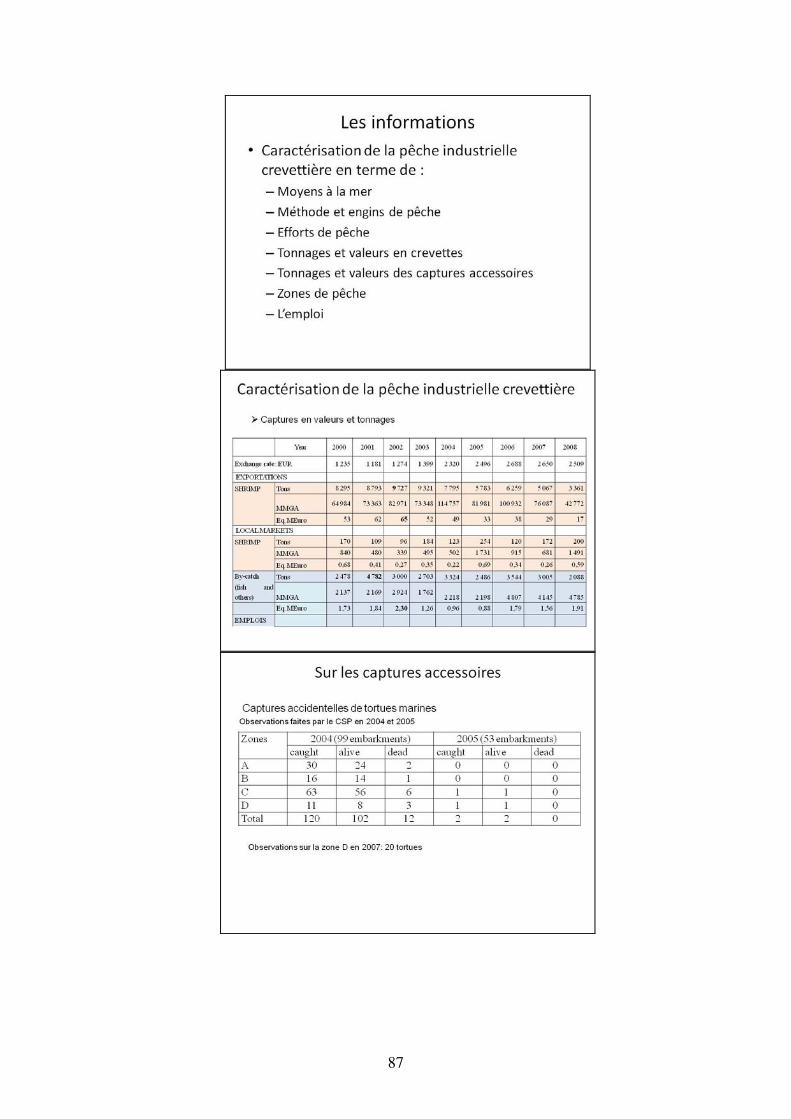
87
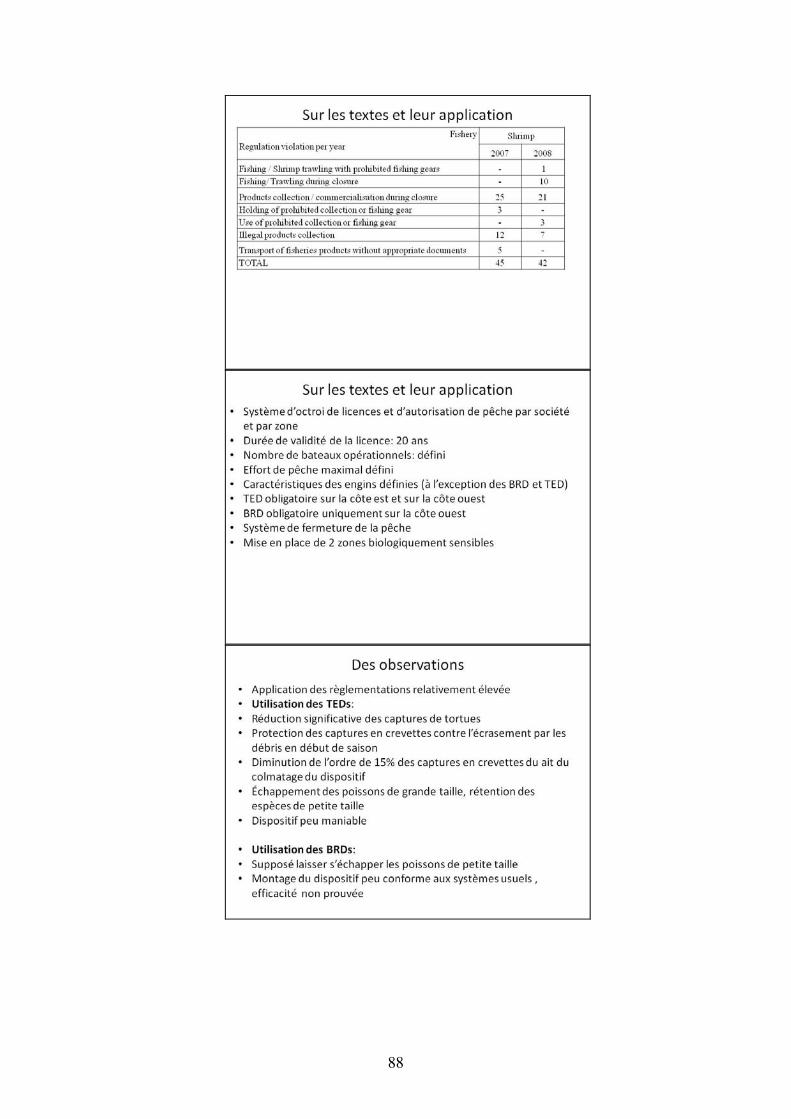
88
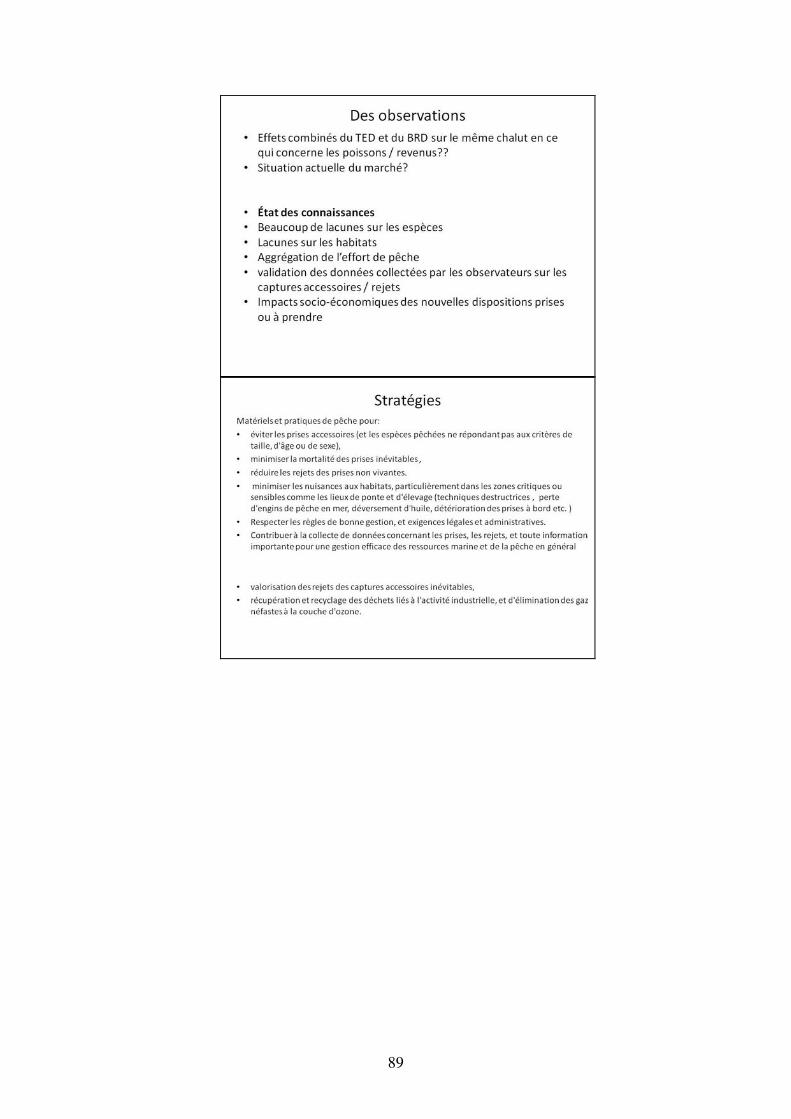
89
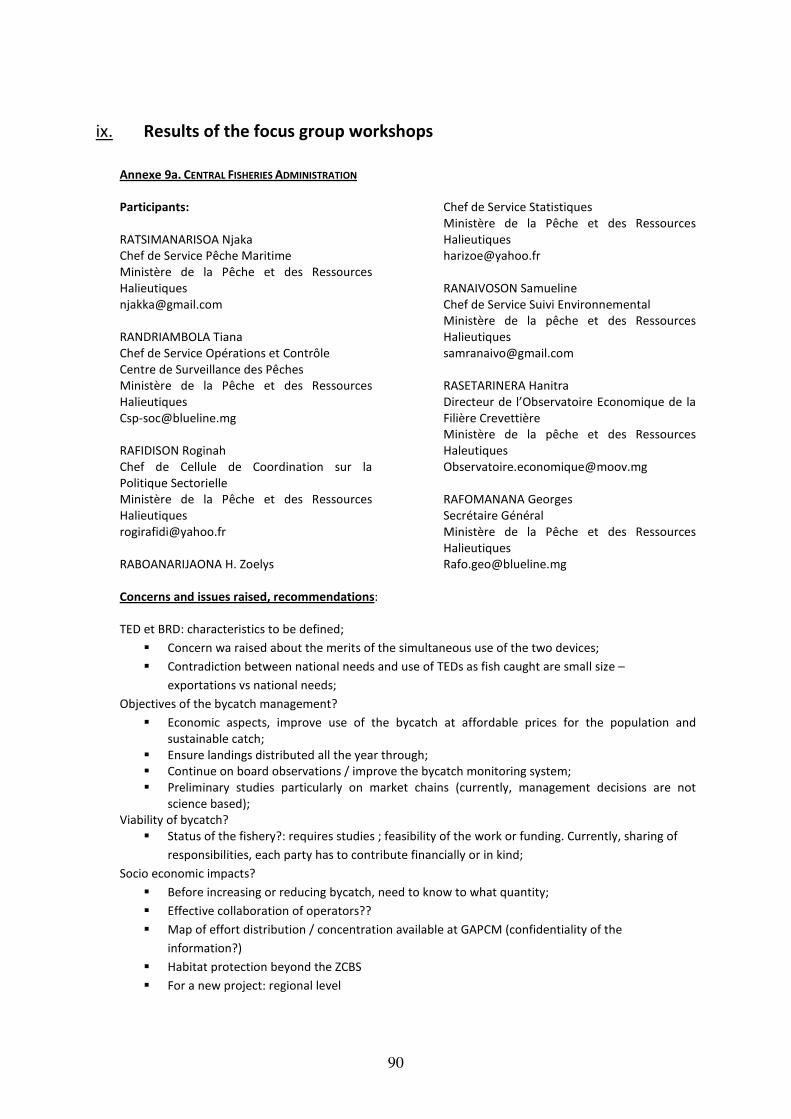
90
ix. Results of the focus group workshops
Annexe 9a. CENTRAL FISHERIES ADMINISTRATION
Participants:
RATSIMANARISOA Njaka
Chef de Service Pêche Maritime
Ministère de la Pêche et des Ressources
Halieutiques
RANDRIAMBOLA Tiana
Chef de Service Opérations et Contrôle
Centre de Surveillance des Pêches
Ministère de la Pêche et des Ressources
Halieutiques
RAFIDISON Roginah
Chef de Cellule de Coordination sur la
Politique Sectorielle
Ministère de la Pêche et des Ressources
Halieutiques
RABOANARIJAONA H. Zoelys
Chef de Service Statistiques
Ministère de la Pêche et des Ressources
Halieutiques
RANAIVOSON Samueline
Chef de Service Suivi Environnemental
Ministère de la pêche et des Ressources
Halieutiques
RASETARINERA Hanitra
Directeur de l’Observatoire Economique de la
Filière Crevettière
Ministère de la pêche et des Ressources
Haleutiques
RAFOMANANA Georges
Secrétaire Général
Ministère de la Pêche et des Ressources
Halieutiques
Concerns and issues raised, recommendations:
TED et BRD: characteristics to be defined;
� Concern wa raised about the merits of the simultaneous use of the two devices;
� Contradiction between national needs and use of TEDs as fish caught are small size –
exportations vs national needs;
Objectives of the bycatch management?
� Economic aspects, improve use of the bycatch at affordable prices for the population and
sustainable catch;
� Ensure landings distributed all the year through;
� Continue on board observations / improve the bycatch monitoring system;
� Preliminary studies particularly on market chains (currently, management decisions are not
science based);
Viability of bycatch?
� Status of the fishery?: requires studies ; feasibility of the work or funding. Currently, sharing of
responsibilities, each party has to contribute financially or in kind;
Socio economic impacts?
� Before increasing or reducing bycatch, need to know to what quantity;
� Effective collaboration of operators??
� Map of effort distribution / concentration available at GAPCM (confidentiality of the
information?)
� Habitat protection beyond the ZCBS
� For a new project: regional level

91
Annexe 9b . GAPCM
Participants:
QUINOT Christian
Directeur Financier
Groupe REFRIGEPECHE
RANDRIANJAFY Harinony Liva
Responsable Logistique
OSO Madagascar
RALISON Andrianirina
Secretary General
Groupement des Aquaculteurs et Pêcheurs de
Crevettes de Madagascar
RASOLONIRIANA Rindra
Projects Coordinator
Groupement des Aquaculteurs et Pêcheurs de
Crevettes de Madagascar
Concerns and issues raised, recommendations:
Retain big sized fish and allow the small sized ones to escape vs local households needs (purchasing
power);
Economic dimension of bycatch / profitability ;
VAT to be consistent with local needs / purchasing power
The issue of illicit fish transshipping from trawlers to traditional fishermen: the product is already frozen;
There is not enough high quality products for the Antananarivo markets ;
The fishery closure vs continuity of supply, raising the issue of inshore storage – lack of storage structure
(except in Mahajanga); a cold storage is needed for Tana to keep the prices at the same level;
TED &BRD: more in-depth studies are needed and the appropriate to be validated / impacts;
Fine tuning the TEDs may help reducing catch loss;
The objectives of bycatch management should not include reduction objective. What is the authorized
catch?
The transshipping from trawlers to traditional fishermen (not authorized by the law) penalizes the
industrial fisher operating in the formal market sector;
Intensify the control ;
Some species have significantly decreased / have disappeared in the catch (eg Psettodes erumei) :
overexploited??? (fish of the east coast are smaller);
Stress on research and studies (species biology, demography …);
MSC Eco certification : the pre evaluation is done, the weaknesses relate to the non managed traditional
fishery, absence of monitoring of the shrimp resources, the need for a more in depth knowledge of the
bycatch, deficiency of research progamme;
The obstacles to the MSC eco certification are :
� The control of the traditional fishery, the reduction of the fishing mortality of shrimp juveniles
and the updating of shrimp stock assessment;
� The monitoring of shrimp trawlers bycatch and the ecological impacts of the fishery;
The future and the research orientation of the PNRC
� It comes under the Administration responsibility to take measures to overcome these obstacles.
For the recovery of the shrimp fishery, these issues should be addressed and appropriate
measures taken.
92
Annexe 9c. NGOS AND PROJECTS STAFF
Participants
RAZAFINDRAKOTO Herimamy L.
National coordinator of SWIOFP Component 2
“crustaceans”
Programme National de Recherche
Crevettière
Ministère de la Pêche et des Ressources
Halieutiques
RABOANARIJAONA H. Zoelys
Chef de Service Statistiques
Ministère de la Pêche et des Ressources
Halieutiques
RANAIVOSON Samueline
Chef de Service Suivi Environnemental
Ministère de la pêche et des Ressources
Halieutiques
RAZAFINDRAKOTO Yvette
Marine Mammals Specialist
Wildlife Conservation Society
RANDRIAMANANTSOA Bemahafaly
Marine Programme Coordinator
Wildlife Conservation Society
Concerns and issues raised, recommendations:
Collect reliable information and data on the bycatch of both industrial and artisanal fisheries ;
� More in depth analyses of bycatch is available at CSP;
� Mapping of concentration zones will help to distribute the fishing effort and reduce bycatch;
� Zoning of the fishing grounds to reduce bycatch ;
� Improve data collection (on board observers)
� Degradation of the economic situation: the industry will reduce the fleet ;
� Transformation of the vessels to target fish? Long line fishing for large pelagic fish? Some
companies are conducting experimental long line fishing during the shrimp fishery closure;
� No study available on the evolution of bycatch species size ;
� The fishing mortality of bycatch species are not controlled;
Stocks assessment/ monitoring for defining the capacity of charge of the fishing grounds ;
� Elaborate ZCBS conservation strategies in collaboration with local communities ;
� Involving local communities in co-management will improve the surveillance ;
� PNRC is starting a programme on traditional fishery bycatch monitoring ;
� Key issue: How to improve the selectivity of traditional fishing gears? Their mesh size are
regulated;
� Revenue from exportations vs resources conservation;
� Impacts of TEDs and BRDs vs natural variations of the catch are not known/ documented;
� In general, a fine tuned TED will result in catch reduction of only 2 to 3%;
Is the level of effort to high?
� Exhaustive inventory of bycatch species, whether they are marketable or not, considering their
ecological role. The issue is that they are too much numerous;
� Identify / adopt indicator species to be monitored/ studied (the MSC evaluators asked for the
biology and spatio temporal distribution of 14 commercial species being monitored);
� A threatened species of the Scianidae family is exclusively caught on the east coast nearby
estuaries. This species should be protected ;
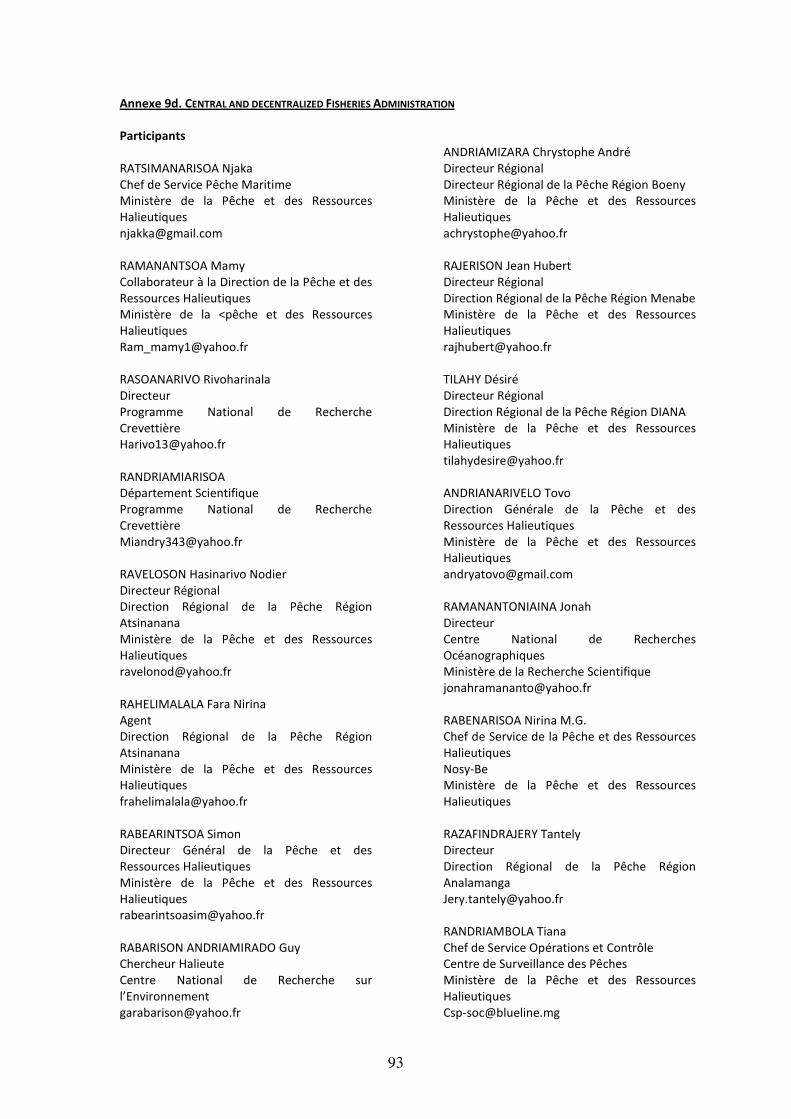
93
Annexe 9d. CENTRAL AND DECENTRALIZED FISHERIES ADMINISTRATION
Participants
RATSIMANARISOA Njaka
Chef de Service Pêche Maritime
Ministère de la Pêche et des Ressources
Halieutiques
RAMANANTSOA Mamy
Collaborateur à la Direction de la Pêche et des
Ressources Halieutiques
Ministère de la <pêche et des Ressources
Halieutiques
RASOANARIVO Rivoharinala
Directeur
Programme National de Recherche
Crevettière
RANDRIAMIARISOA
Département Scientifique
Programme National de Recherche
Crevettière
RAVELOSON Hasinarivo Nodier
Directeur Régional
Direction Régional de la Pêche Région
Atsinanana
Ministère de la Pêche et des Ressources
Halieutiques
RAHELIMALALA Fara Nirina
Agent
Direction Régional de la Pêche Région
Atsinanana
Ministère de la Pêche et des Ressources
Halieutiques
RABEARINTSOA Simon
Directeur Général de la Pêche et des
Ressources Halieutiques
Ministère de la Pêche et des Ressources
Halieutiques
RABARISON ANDRIAMIRADO Guy
Chercheur Halieute
Centre National de Recherche sur
l’Environnement
ANDRIAMIZARA Chrystophe André
Directeur Régional
Directeur Régional de la Pêche Région Boeny
Ministère de la Pêche et des Ressources
Halieutiques
RAJERISON Jean Hubert
Directeur Régional
Direction Régional de la Pêche Région Menabe
Ministère de la Pêche et des Ressources
Halieutiques
TILAHY Désiré
Directeur Régional
Direction Régional de la Pêche Région DIANA
Ministère de la Pêche et des Ressources
Halieutiques
ANDRIANARIVELO Tovo
Direction Générale de la Pêche et des
Ressources Halieutiques
Ministère de la Pêche et des Ressources
Halieutiques
RAMANANTONIAINA Jonah
Directeur
Centre National de Recherches
Océanographiques
Ministère de la Recherche Scientifique
RABENARISOA Nirina M.G.
Chef de Service de la Pêche et des Ressources
Halieutiques
Nosy-Be
Ministère de la Pêche et des Ressources
Halieutiques
RAZAFINDRAJERY Tantely
Directeur
Direction Régional de la Pêche Région
Analamanga
RANDRIAMBOLA Tiana
Chef de Service Opérations et Contrôle
Centre de Surveillance des Pêches
Ministère de la Pêche et des Ressources
Halieutiques
94
RABOANARIJAONA H. Zoelys
Chef de Service Statistiques
Ministère de la Pêche et des Ressources
Halieutiques
RASETARINERA Hanitra
Directeur de l’Observatoire Economique de la
Filière Crevettière
Ministère de la pêche et des Ressources
Halieutiques
RAFOMANANA Georges
Secrétaire Général
Ministère de la Pêche et des Ressources
Halieutiques
Concerns, issues raised and recommendations:
Gather all documents relating to the sector ;
How to implement a long term data collection system at operators level so as to integrate it in
Administration activities;
� Make log sheets for data collection available for operators (improved log sheets) including
details required; what is the capacity of decentralized Administration to check ?? mettre à la
disposition des opérateurs des fiches d’acquisition de données (fiches améliorer à remplir) avec
les détails demandées; capacité des services déconcentrés à vérifier?? Expedition documents
can help- better address the issue of discards (quantity, common species …)
Roles of on board observers (integrity)
Orientation of a project: checking the reliability of the data collection system ;
Rough data of the PNRC have disappeared
quidance of the cooperation with operators: The companies are not willing to provide data (eg.
Experiments on deep water fish undertaken by REFRIGEPECHE), including scientific on board observer ;
Recognize the deficiency / weaknesses of the Administration including the relationship between the
Administration and operators. reconnaître qu’il y a eu des déficiences / faiblesses au niveau de
l’Administration, y compris les rapports entre l’Administration et les opérateurs; in addition, the
ecosystem approach is pretty new in Madagascar ;
If necessary, renew the obligations of operators to provide copies of log sheets to the research centers, to
accept on board scientific observers (the CSP has the right to put on board observers ; this right could be
used for research);
Instead of replacing CSP’s observers, add scientists? Or in alternation ?
Research institutions have to request (to the Administration) embarkation of scientists;
Embarkation of observers on board foreign vessels (cf Fishing Agreement)
Interactions / relationships / collaboration between the Administration, research centers and CSP to be
enhanced;
Implementation of decisions, including clarification of the roles of each entity ;
Re-staffing of the CNRO;
Ability of research centers to provide on time scientific support to decision makings?
Make the use of try net mandatory (already regulated) to lessen bycatch specifically during low season of
shrimp fishery;
Set a maximum duration for hauls, specifically during low season (less bycatch during low season);
arrêté on the traditional effort freeze : quid of the implementation?
Bycatch studies in Ambaro Bay for 3 months since June 2009 (PNRC funded by AFD): exhaustive species
inventory;
Periodical reports on the bycatch status to be implemented;
Funding of fisheries research: the budget needs to be established since the beginning to ensure a better
autonomy vis-à-vis the operators;
95
Support from the Administration for lobbying for priority research themes being funded by the
Government ;
Decentralized administration understaffed for ensuring the monitoring ;
� Need for economics specialists ;
� Address the previous weaknesses ;
� Issue of the continuity of State for the sustainability of decisions.
Priority areas are:
� Implementation of log sheets for data collection ;
� Identify / develop appropriate priority research programme including parameters to be
collected ;
� Organize the on board observer programme;
� Quantitative catch assessment ;
� Adjustment of the in situ effort (try net)
� The PNRC programme on bycatch to be continued for management purpose;
� Impacts of the traditional fishery ;
� Stocks assessment.
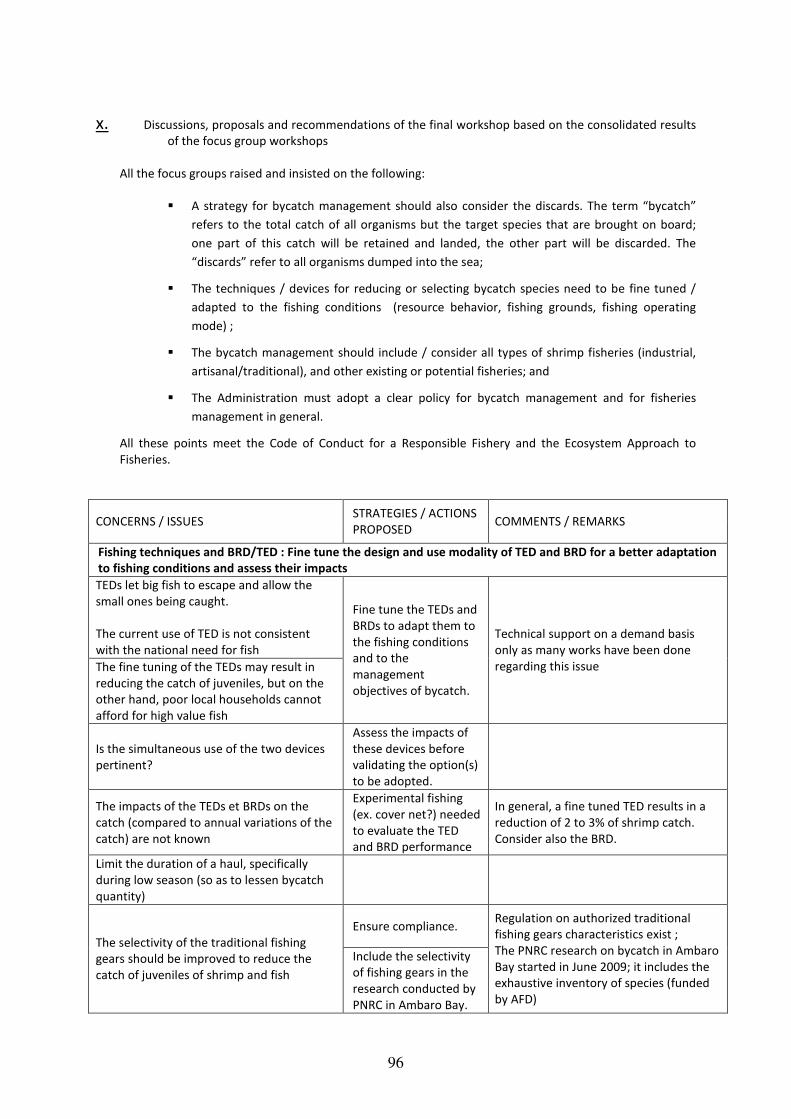
96
x. Discussions, proposals and recommendations of the final workshop based on the consolidated results
of the focus group workshops
All the focus groups raised and insisted on the following:
� A strategy for bycatch management should also consider the discards. The term “bycatch”
refers to the total catch of all organisms but the target species that are brought on board;
one part of this catch will be retained and landed, the other part will be discarded. The
“discards” refer to all organisms dumped into the sea;
� The techniques / devices for reducing or selecting bycatch species need to be fine tuned /
adapted to the fishing conditions (resource behavior, fishing grounds, fishing operating
mode) ;
� The bycatch management should include / consider all types of shrimp fisheries (industrial,
artisanal/traditional), and other existing or potential fisheries; and
� The Administration must adopt a clear policy for bycatch management and for fisheries
management in general.
All these points meet the Code of Conduct for a Responsible Fishery and the Ecosystem Approach to
Fisheries.
CONCERNS / ISSUES STRATEGIES / ACTIONS
PROPOSED COMMENTS / REMARKS
Fishing techniques and BRD/TED : Fine tune the design and use modality of TED and BRD for a better adaptation
to fishing conditions and assess their impacts
TEDs let big fish to escape and allow the
small ones being caught.
The current use of TED is not consistent
with the national need for fish
The fine tuning of the TEDs may result in
reducing the catch of juveniles, but on the
other hand, poor local households cannot
afford for high value fish
Fine tune the TEDs and
BRDs to adapt them to
the fishing conditions
and to the
management
objectives of bycatch.
Technical support on a demand basis
only as many works have been done
regarding this issue
Is the simultaneous use of the two devices
pertinent?
Assess the impacts of
these devices before
validating the option(s)
to be adopted.
The impacts of the TEDs et BRDs on the
catch (compared to annual variations of the
catch) are not known
Experimental fishing
(ex. cover net?) needed
to evaluate the TED
and BRD performance
In general, a fine tuned TED results in a
reduction of 2 to 3% of shrimp catch.
Consider also the BRD.
Limit the duration of a haul, specifically
during low season (so as to lessen bycatch
quantity)
Ensure compliance.
The selectivity of the traditional fishing
gears should be improved to reduce the
catch of juveniles of shrimp and fish
Include the selectivity
of fishing gears in the
research conducted by
PNRC in Ambaro Bay.
Regulation on authorized traditional
fishing gears characteristics exist ;
The PNRC research on bycatch in Ambaro
Bay started in June 2009; it includes the
exhaustive inventory of species (funded
by AFD)
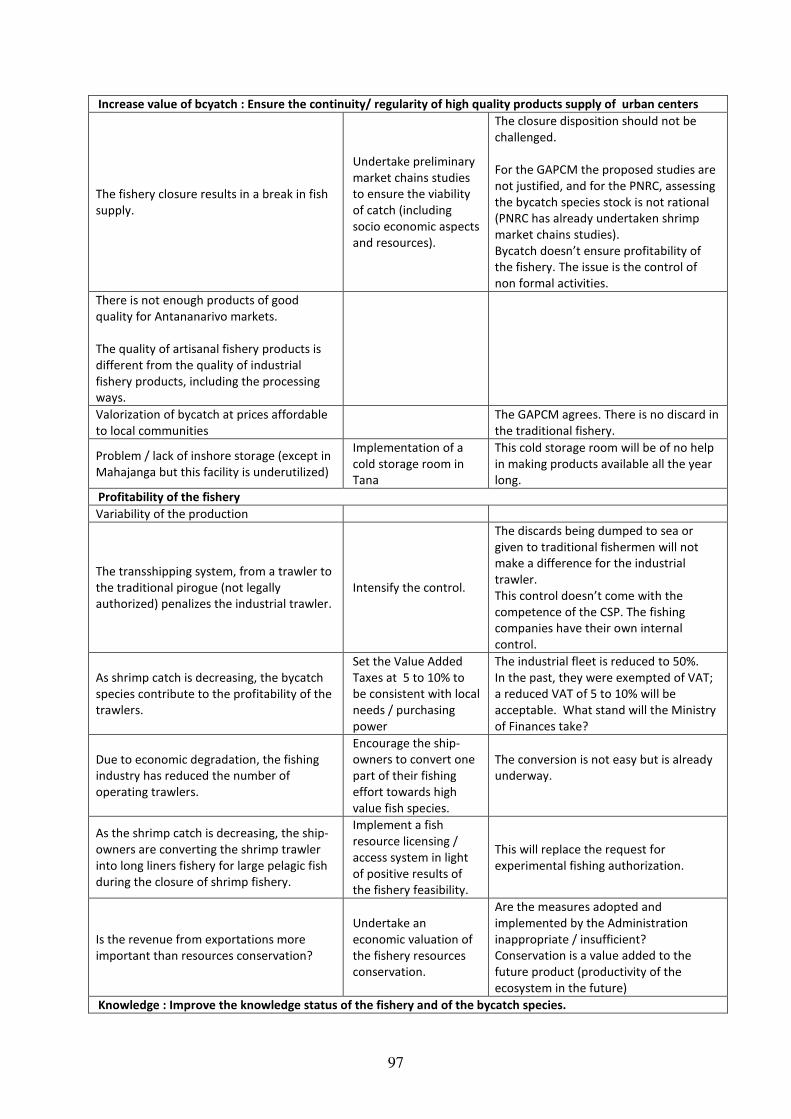
97
Increase value of bcyatch : Ensure the continuity/ regularity of high quality products supply of urban centers
The fishery closure results in a break in fish
supply.
Undertake preliminary
market chains studies
to ensure the viability
of catch (including
socio economic aspects
and resources).
The closure disposition should not be
challenged.
For the GAPCM the proposed studies are
not justified, and for the PNRC, assessing
the bycatch species stock is not rational
(PNRC has already undertaken shrimp
market chains studies).
Bycatch doesn’t ensure profitability of
the fishery. The issue is the control of
non formal activities.
There is not enough products of good
quality for Antananarivo markets.
The quality of artisanal fishery products is
different from the quality of industrial
fishery products, including the processing
ways.
Valorization of bycatch at prices affordable
to local communities
The GAPCM agrees. There is no discard in
the traditional fishery.
Problem / lack of inshore storage (except in
Mahajanga but this facility is underutilized)
Implementation of a
cold storage room in
Tana
This cold storage room will be of no help
in making products available all the year
long.
Profitability of the fishery
Variability of the production
The transshipping system, from a trawler to
the traditional pirogue (not legally
authorized) penalizes the industrial trawler.
Intensify the control.
The discards being dumped to sea or
given to traditional fishermen will not
make a difference for the industrial
trawler.
This control doesn’t come with the
competence of the CSP. The fishing
companies have their own internal
control.
As shrimp catch is decreasing, the bycatch
species contribute to the profitability of the
trawlers.
Set the Value Added
Taxes at 5 to 10% to
be consistent with local
needs / purchasing
power
The industrial fleet is reduced to 50%.
In the past, they were exempted of VAT;
a reduced VAT of 5 to 10% will be
acceptable. What stand will the Ministry
of Finances take?
Due to economic degradation, the fishing
industry has reduced the number of
operating trawlers.
Encourage the ship-
owners to convert one
part of their fishing
effort towards high
value fish species.
The conversion is not easy but is already
underway.
As the shrimp catch is decreasing, the ship-
owners are converting the shrimp trawler
into long liners fishery for large pelagic fish
during the closure of shrimp fishery.
Implement a fish
resource licensing /
access system in light
of positive results of
the fishery feasibility.
This will replace the request for
experimental fishing authorization.
Is the revenue from exportations more
important than resources conservation?
Undertake an
economic valuation of
the fishery resources
conservation.
Are the measures adopted and
implemented by the Administration
inappropriate / insufficient?
Conservation is a value added to the
future product (productivity of the
ecosystem in the future)
Knowledge : Improve the knowledge status of the fishery and of the bycatch species.
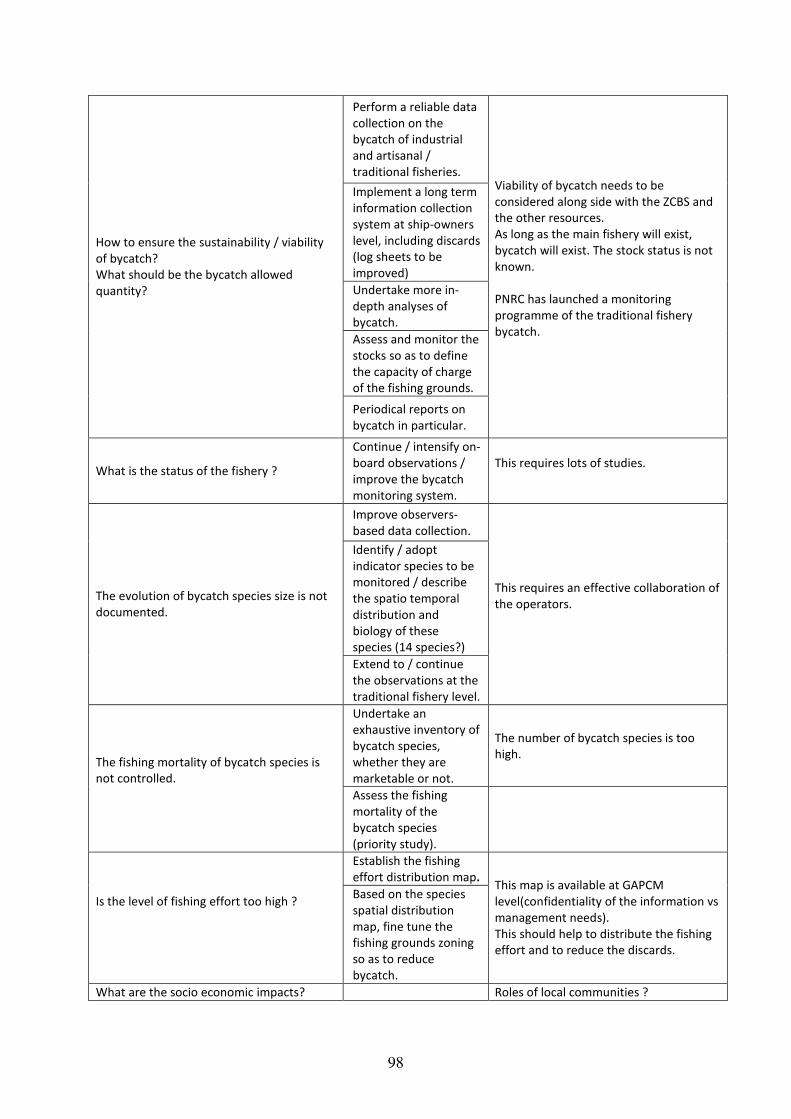
98
Perform a reliable data
collection on the
bycatch of industrial
and artisanal /
traditional fisheries.
Implement a long term
information collection
system at ship-owners
level, including discards
(log sheets to be
improved)
Undertake more in-
depth analyses of
bycatch.
Assess and monitor the
stocks so as to define
the capacity of charge
of the fishing grounds.
How to ensure the sustainability / viability
of bycatch?
What should be the bycatch allowed
quantity?
Periodical reports on
bycatch in particular.
Viability of bycatch needs to be
considered along side with the ZCBS and
the other resources.
As long as the main fishery will exist,
bycatch will exist. The stock status is not
known.
PNRC has launched a monitoring
programme of the traditional fishery
bycatch.
What is the status of the fishery ?
Continue / intensify on-
board observations /
improve the bycatch
monitoring system.
This requires lots of studies.
Improve observers-
based data collection.
Identify / adopt
indicator species to be
monitored / describe
the spatio temporal
distribution and
biology of these
species (14 species?)
The evolution of bycatch species size is not
documented.
Extend to / continue
the observations at the
traditional fishery level.
This requires an effective collaboration of
the operators.
Undertake an
exhaustive inventory of
bycatch species,
whether they are
marketable or not.
The number of bycatch species is too
high. The fishing mortality of bycatch species is
not controlled.
Assess the fishing
mortality of the
bycatch species
(priority study).
Establish the fishing
effort distribution map.
Is the level of fishing effort too high ?
Based on the species
spatial distribution
map, fine tune the
fishing grounds zoning
so as to reduce
bycatch.
This map is available at GAPCM
level(confidentiality of the information vs
management needs).
This should help to distribute the fishing
effort and to reduce the discards.
What are the socio economic impacts? Roles of local communities ?
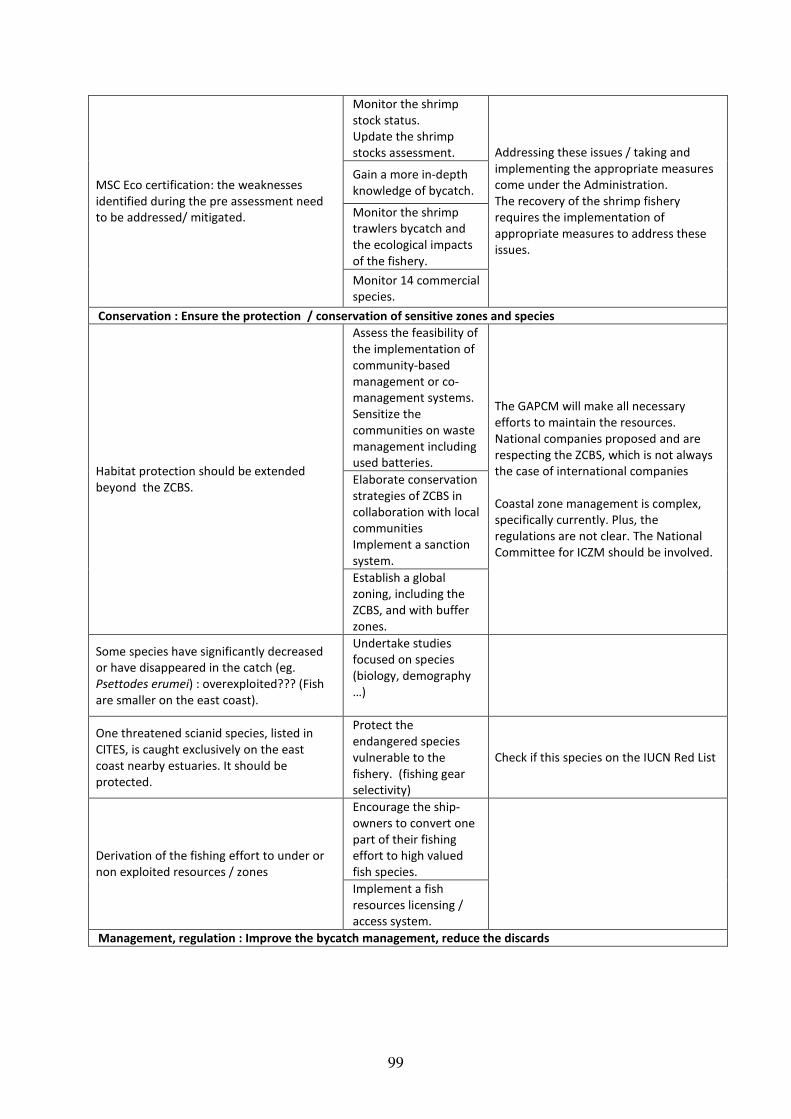
99
Monitor the shrimp
stock status.
Update the shrimp
stocks assessment.
Gain a more in-depth
knowledge of bycatch.
Monitor the shrimp
trawlers bycatch and
the ecological impacts
of the fishery.
MSC Eco certification: the weaknesses
identified during the pre assessment need
to be addressed/ mitigated.
Monitor 14 commercial
species.
Addressing these issues / taking and
implementing the appropriate measures
come under the Administration.
The recovery of the shrimp fishery
requires the implementation of
appropriate measures to address these
issues.
Conservation : Ensure the protection / conservation of sensitive zones and species
Assess the feasibility of
the implementation of
community-based
management or co-
management systems.
Sensitize the
communities on waste
management including
used batteries.
Elaborate conservation
strategies of ZCBS in
collaboration with local
communities
Implement a sanction
system.
Habitat protection should be extended
beyond the ZCBS.
Establish a global
zoning, including the
ZCBS, and with buffer
zones.
The GAPCM will make all necessary
efforts to maintain the resources.
National companies proposed and are
respecting the ZCBS, which is not always
the case of international companies
Coastal zone management is complex,
specifically currently. Plus, the
regulations are not clear. The National
Committee for ICZM should be involved.
Some species have significantly decreased
or have disappeared in the catch (eg.
Psettodes erumei) : overexploited??? (Fish
are smaller on the east coast).
Undertake studies
focused on species
(biology, demography
…)
One threatened scianid species, listed in
CITES, is caught exclusively on the east
coast nearby estuaries. It should be
protected.
Protect the
endangered species
vulnerable to the
fishery. (fishing gear
selectivity)
Check if this species on the IUCN Red List
Encourage the ship-
owners to convert one
part of their fishing
effort to high valued
fish species.
Derivation of the fishing effort to under or
non exploited resources / zones
Implement a fish
resources licensing /
access system.
Management, regulation : Improve the bycatch management, reduce the discards
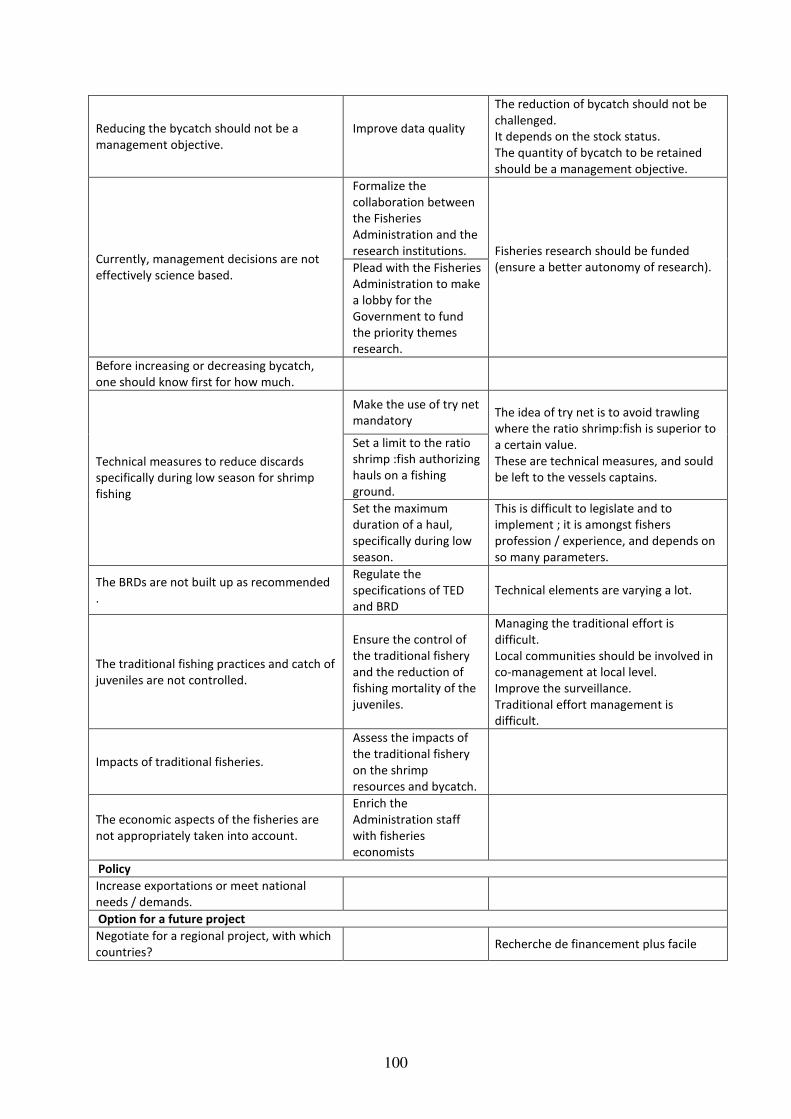
100
Reducing the bycatch should not be a
management objective.
Improve data quality
The reduction of bycatch should not be
challenged.
It depends on the stock status.
The quantity of bycatch to be retained
should be a management objective.
Formalize the
collaboration between
the Fisheries
Administration and the
research institutions. Currently, management decisions are not
effectively science based. Plead with the Fisheries
Administration to make
a lobby for the
Government to fund
the priority themes
research.
Fisheries research should be funded
(ensure a better autonomy of research).
Before increasing or decreasing bycatch,
one should know first for how much.
Make the use of try net
mandatory
Set a limit to the ratio
shrimp :fish authorizing
hauls on a fishing
ground.
The idea of try net is to avoid trawling
where the ratio shrimp:fish is superior to
a certain value.
These are technical measures, and sould
be left to the vessels captains.
Technical measures to reduce discards
specifically during low season for shrimp
fishing Set the maximum
duration of a haul,
specifically during low
season.
This is difficult to legislate and to
implement ; it is amongst fishers
profession / experience, and depends on
so many parameters.
The BRDs are not built up as recommended
.
Regulate the
specifications of TED
and BRD
Technical elements are varying a lot.
The traditional fishing practices and catch of
juveniles are not controlled.
Ensure the control of
the traditional fishery
and the reduction of
fishing mortality of the
juveniles.
Managing the traditional effort is
difficult.
Local communities should be involved in
co-management at local level.
Improve the surveillance.
Traditional effort management is
difficult.
Impacts of traditional fisheries.
Assess the impacts of
the traditional fishery
on the shrimp
resources and bycatch.
The economic aspects of the fisheries are
not appropriately taken into account.
Enrich the
Administration staff
with fisheries
economists
Policy
Increase exportations or meet national
needs / demands.
Option for a future project
Negotiate for a regional project, with which
countries? Recherche de financement plus facile
101
Develop a national project
identify / develop
priority research
programme including
needs for information
The feasibility of these proposals needs
funding. (FAO?)
Actually, responsibilities are shared, thus,
all parties should contribute financially or
in kinds.
Development of partnership
Enhance the interactions / relationship /
collaboration between the Administration,
research centers and the CSP.
Ability of research centers to provide on
time scientific for decision makings.
Formalize the
collaboration between
the Fisheries
Administration and the
research centers
Re-staffing of the CNRO is underway
In the past, copies of the fishing log sheets
were sent to the CNRO , and this institution
had the right to put scientific observers on
board
Formalize the
partnership between
ship-owners and the
research institutions.
The right of the CSP to put observers on
board could be used for research
Observation on board should include
scientific data collection.
Develop a joint CSP-
PNRC on board
observer programme .
The CSP can put observers on board
fishing vessels.
The on board data collection conditions
may influence data quality
The overall objective should meet the viability / sustainability of the resource in general.
Participants
RATSIMANARISOA Njaka
Chef de Service Pêche Maritime
Ministère de la Pêche et des Ressources
Halieutiques
RANDRIAMBOLA Tiana
Chef de Service Opérations et Contrôle
Centre de Surveillance des Pêches
Ministère de la Pêche et des Ressources
Halieutiques
RABOANARIJAONA H. Zoelys
Chef de Service Statistiques
Ministère de la Pêche et des Ressources
Halieutiques
QUINOT Christian
Directeur Financier
Groupe REFRIGEPECHE
RAZAFINDRAKOTO Herimamy Lalaniaina
National coordinator of SWIOFP Component 2
“crustaceans”
Programme National de Recherche
Crevettière
Ministère de la Pêche et des Ressources
Halieutiques
RANDRIAMAHAZO Herilala
Directeur du Programme Marin
Wildlife Conservation Society
RASOANARIVO Rivoharinala
Directeur
Programme National de Recherche
Crevettière
RANDRIAMIARISOA
Département Scientifique
Programme National de Recherche
Crevettière
RAVELOSON Hasinarivo Nodier
Directeur Régional
Direction Régional de la Pêche Région
Atsinanana
Ministère de la Pêche et des Ressources
Halieutiques
102
RAHELIMALALA Fara Nirina
Agent
Direction Régional de la Pêche Région
Atsinanana
Ministère de la Pêche et des Ressources
Halieutiques
RABEARINTSOA Simon
Directeur Général de la Pêche et des
Ressources Halieutiques
Ministère de la Pêche et des Ressources
Halieutiques
RABARISON ANDRIAMIRADO Guy
Chercheur Halieute
Centre National de Recherche sur
l’Environnement
ANDRIAMIZARA Chrystophe André
Directeur Régional
Directeur Régional de la Pêche Région Boeny
Ministère de la Pêche et des Ressources
Halieutiques
RAJERISON Jean Hubert
Directeur Régional
Direction Régional de la Pêche Région Menabe
Ministère de la Pêche et des Ressources
Halieutiques
TILAHY Andrianaranintsoa Désiré
Directeur Régional
Direction Régional de la Pêche Région DIANA
Ministère de la Pêche et des Ressources
Halieutiques
RAMANANTONIAINA Jonah
Directeur
Centre National de Recherches
Océanographiques
Ministère de la Recherche Scientifique
RABENARISOA Nirina Marie Gilberte
Chef de Service de la Pêche et des Ressources
Halieutiques
Nosy-Be
Ministère de la Pêche et des Ressources
Halieutiques
RAZAFINDRAJERY Tantely
Directeur Régional
Direction Régional de la Pêche Région
Analamanga
RALISON Harifidy Olivier
Coordinateur Programme Marin
World WildLife Fund Madagascar and West
Indian Ocean
ANDRIAMAHARO Tantely
Responsable Service Pêche Industrielle
Ministère de la Pêche et des Ressources
Halieutiques
RASOLONJATOVO Harimandimby
Chef
Centre de Surveillance des Pêches
Ministère de la Pêche et des Ressources
Halieutiques
RASOLOFO Voahirana
Chercheur
Centre National de Recherche sur
l’Environnement
Ministère de la Recherche
RAMANAMANDIMBY Fihaonantsoa
FAO Madagascar
RAZAFIMBELO Honoré
Assistant Représentant FAO
COUTEAUX Bertrand
Secrétaire Général de l’UNIMA
RANDRIAMANANTSOA Bemahafaly
Marine Programme Coordinator
Wildlife Conservation Society
RANDRIANJAFY Harinosy Liva
Responsable Logistique
OSO Madagascar
BRUNOT Claude
Représentant de SOMAPECHE
103
Président du Groupement des Aquaculteurs et
Pêcheurs de Crevettes de Madagascar
RAFIDISON Roginah
Chef de Cellule de Coordination sur la
Politique Sectorielle
Ministère de la Pêche et des Ressources
Halieutiques
RAKOTOARIVONY Hanitriniala
UNIMA
RANAIVOSON Eulalie
Professeur
Institut Halieutique et des Sciences Marines