barsky and killian 2004 oil_and_the_macroeconomy
TRANSCRIPT
Oil and the Macroeconomy Since the1970s
Robert B Barsky and Lutz Kilian
Economists have long been intrigued by empirical evidence that suggests thatoil price shocks may be closely related to macroeconomic performanceThis interest dates back to the 1970s The 1970s were a period of growing
dependence on imported oil unprecedented disruptions in the global oil marketand poor macroeconomic performance in the United States Thus it was natural tosuspect a causal relationship from oil prices to US macroeconomic aggregatesSince then a large body of work has accumulated that purports to establish this linkon theoretical grounds and to provide empirical evidence in its support We do notattempt a comprehensive survey of this literature but rather provide an idiosyn-cratic synthesis of what we view as the key issues in this debate and the insightsgained over the last 30 years
The timing seems right for such an account Although the experience of the1970s continues to play an important role in discussions of the link between oil andthe macroeconomy there have been a number of new ldquooil price shocksrdquo since the1970s notably the 1986 collapse of oil prices and the 2000 boom in oil prices as wellas the oil price increases associated with the 1990ndash1991 Gulf war and the 2003 Iraqwar Given this richer case history we are arguably in a better position than twodecades ago to distinguish the idiosyncratic features of each oil crisis from thesystematic effects
Increases in oil prices have been held responsible for recessions periods ofexcessive inflation reduced productivity and lower economic growth In this paperwe review the arguments supporting such views First we highlight some of theconceptual difficulties in assigning a central role to oil price shocks in explaining
y Robert B Barsky is Professor of Economics University of Michigan Ann Arbor Michiganand Research Associate National Bureau of Economic Research Cambridge MassachusettsLutz Kilian is Associate Professor of Economics University of Michigan Ann Arbor Mich-igan and Research Fellow Centre for Economic Policy Research London United Kingdom
Journal of Economic PerspectivesmdashVolume 18 Number 4mdashFall 2004mdashPages 115ndash134
macroeconomic fluctuations and we trace how the arguments of proponents of theoil view have evolved in response to these difficulties Second we challenge thenotion that at least the major oil price movements can be viewed as exogenous withrespect to the US macroeconomy We examine critically the evidence that has ledmany economists to ascribe a central role to exogenous political events in modelingthe oil market and we provide arguments in favor of reverse causality frommacroeconomic variables to oil prices Third although none of the more recent oilprice shocks has been associated with stagflation in the US economy a majorreason for the continued popularity of the oil shock hypothesis has been theperception that only oil price shocks are able to explain the US stagflation of the1970s We show that this is not the case
Why Oil Seems to Matter for the Macroeconomy
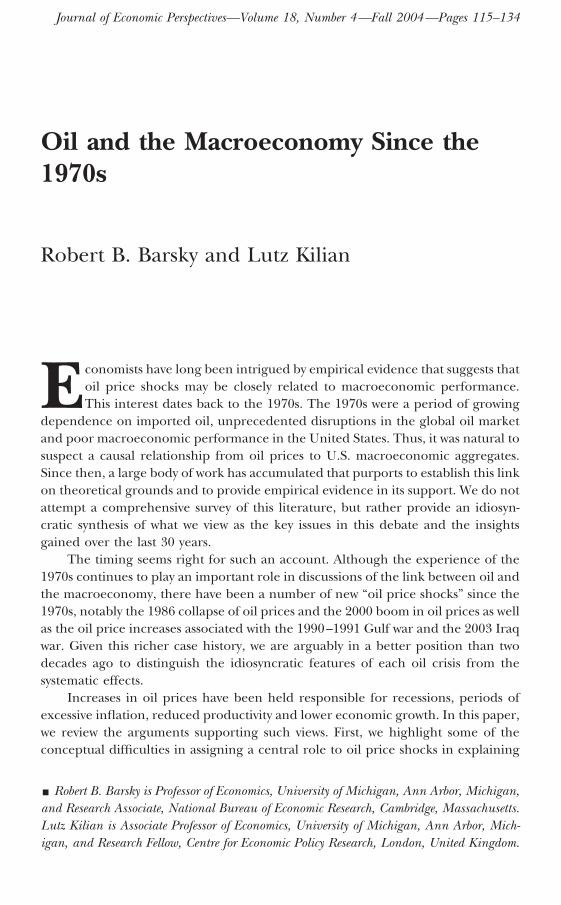
There is a widespread belief that exogenous political events in the Middle Eastcause recessions in industrialized countries through their effect on the price of oilThis belief is fueled by the close statistical relationship between political events inthe Middle East and recessions in the United States Table 1 provides a list of thestarting dates of US recessions since 1972 as dated by the National Bureau ofEconomic Research Most of these recessions were preceded by political events inthe Middle East that in some popular readings of events were responsible for asubsequent increase in the price of oil which in turn caused the recession Theprima facie evidence for such a linkage is marred by the long and variable delaysbetween oil events and recessions in some cases For example the March 1999OPEC meeting (if it was an exogenous political event) preceded the March 2001recession by two full years Similarly there is a long delay between the Iranianrevolution and the January 1980 recession and between the outbreak of the
Table 1The Coincidence of Oil Dates and Recessions after 1972
Business cycle peakEvents associated with subsequent major
oil price increase
November 1973 October War and Oil EmbargoOctober 1973ndashearly 1974
January 1980 Iranian RevolutionOctober 1978ndashFebruary 1979
July 1981 Outbreak of Iran-Iraq WarSeptember 1980
July 1990 Invasion of KuwaitAugust 1990
March 2001 OPEC MeetingMarch 1999
Source The business cycle dates are from the National Bureau of Economic Research at httpwwwnberorgcycles
116 Journal of Economic Perspectives
Iran-Iraq war and the July 1981 recession On the other hand the November 1973recession immediately followed the October war and the start of the oil embargoand the onset of the July 1990 recession even preceded the August 1990 invasion ofKuwait This irregular pattern argues against a monocausal role for oil but is stillconsistent with the view that oil events at least contribute to recessions Thus it iseasy to see why many observers continue to assign an important role to politicalevents in the Middle East in explaining US recessions
Even if we do not necessarily accept the view that exogenous political events inthe Middle East cause recessions in the United States it is undoubtedly true thatmany recessions since 1972 have been associated with major oil price increasesalthough again the association is less than perfect Figure 1 plots the real price ofoil since 1972 with business cycle peaks imposed as vertical lines The recessionsthat started in November 1973 and July 1990 occurred right before major oil priceincreases The January 1980 recession followed a sustained oil price increase in1979 In contrast the recessions starting in July 1981 and March 2001 actuallyoccurred during declines of the real price of oil albeit within months of a peakThus it seems difficult to maintain that the two phenomena are unrelated
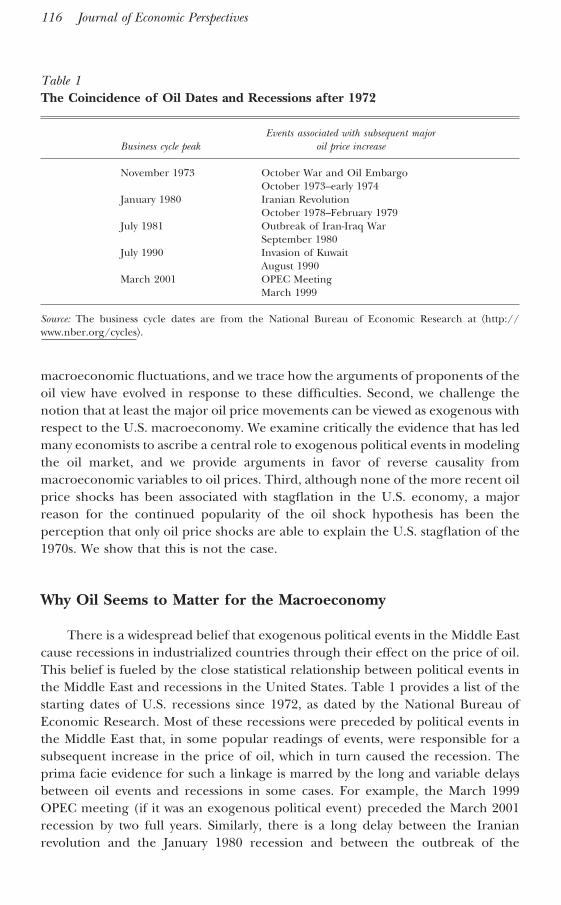
In addition to the perceived link between major oil price increases andrecessions oil has been held responsible for the productivity slowdown in the1970s Table 2 relates the growth rate of total factor productivity to the real priceof oil for selected subperiods The overall relationship is heavily influenced by aperiod of unusually low growth in total factor productivity in 1974ndash1985 that
Figure 1Real Price of US Crude Oil Imports and Recessions 19713ndash200312
35
30
25
20
15
10
5
0
40
45
50
1975 1980
1982
ndash19
84 d
olla
rs
1985 1990 1995 2000
RecessionNovember1973
RecessionJuly1981
RecessionJuly1990
RecessionJanuary
1980
RecessionMarch2001
Source Department of Energy Federal Reserve Economic Database (FRED) and National Bureau ofEconomic Research The oil price data are constructed as in Barsky and Kilian (2002) The oil pricehas been deflated by the US CPI for urban consumers
Robert B Barsky and Lutz Kilian 117
coincides with an unusually high real price of oil This phenomenon has promptedinterest in establishing a theoretical link between oil prices and productivity thatcontinues to this day
Oil price shocks have also been said to cause inflation Figure 2 plots theConsumer Price Index (CPI) inflation rates for the United States with major oildates indicated as vertical lines Figure 2 shows that indeed events such as theinvasion of Kuwait in 1990 the collapse of OPEC in 1986 or the 1999 OPECmeeting were followed by sharp if short-lived spikes in CPI inflation On the otherhand the relationship between oil price shocks and CPI inflation is not as apparentas one might have expected Some oil dates such as the outbreak of the Iran-Iraqwar in 1980 seem to have had little impact on CPI inflation and others such as theoutbreak of the war in Afghanistan in 2001 and of the Iraq war of 2003 werefollowed by a fall in consumer prices1
Conversely several large spikes in the CPI inflation rate are clearly unrelatedto oil events Indeed the largest spike in monthly CPI inflation occurred in August1973 well before the October 1973 war which by most accounts was unanticipatedThe strongest case for a relationship emerges from focusing on medium-termtrends in inflation In particular the period of sustained high inflation in the 1970sincluded two major oil events which has given credence to the notion that both theeconomic stagnation and the high inflation rates of the 1970s were related to oilprice shocks The next section will review the explanations that have been proposedfor such a relationship
How Oil Price Shocks May Affect the Macroeconomy
To the extent that disturbances in the oil market do have a causal effect onoutput prices and productivity through what channels do they operate Below wewill discuss a number of mechanisms that might provide a causal link from oilprices to recessions inflation and economic growth
1 In the case of the Iraq war of 2003 it may be argued that the war was well anticipated causing the priceof oil and hence the inflation rate to spike before the outbreak of hostilities The observed spike in CPIinflation is not large however by historical standards
Table 2Growth in Total Factor Productivity and the Real Price of Oil Imports
1950ndash1959 1960ndash1973 1974ndash1985 1986ndash2001
Real price of oil 2047 1772 4342 2082TFP growth (percent) 199 118 031 134
Source FRED The productivity series is annual multifactor productivity in the private manufacturingsector The oil price data are constructed as in Barsky and Kilian (2002) The oil price index has beendeflated by the US GDP deflator and expressed in 2000 dollars
118 Journal of Economic Perspectives
How Oil Price Shocks May Cause RecessionsSuppose gross output Y is given by the production function Y Q[K L O]
where O L and K denote the quantities of imported oil labor and capital servicesA key insight that recurs in the literature on oil and macroeconomics is that themagnitude of the effect of an oil price shock on gross outputmdashholding L and Kconstantmdashmust be small A 1 percent reduction in oil usage reduces grossoutputmdashto a first-order approximationmdashby a percentage amount correspondingto the cost share of oil This share of oil in output is thought to be no larger than4 percent and may be much smaller With a unit elasticity of substitution betweenoil and value added a 10 percent increase in oil prices for example will result ina less than 05 percent reduction in gross output (Rotemberg and Woodford1996) Empirically increases in oil prices appear to raise the share of oil in outputThis implies that the elasticity of substitution must be less than unity suggestingthat the actual drop in gross output is even smaller
The corresponding effect of an oil price shock on value added in contrast isless clear Suppose for example that Y Q[V(K L) O] where V(K L) isdomestic value-added (which may be thought of as real GDP) Then under perfectcompetition there will not be a direct effect of an oil price shock on value addedat all because changes in the quantity of oil do not shift the demand curve for laborand capital services as a function of the wage and rental rates measured in terms ofvalue added This benchmark result is weakened somewhat if we drop the assump-tion of perfect competition and allow for a fixed mark-up Under mark-up pricing
Figure 2Monthly CPI Inflation Rates and Oil Dates 19713ndash20043
5
10
0
5
10
15
20
25
30
1975 1980 1985 1990 1995 2000
Perc
ent
Octoberwar1973
Iranianrevolution
1979
Iran-Iraqwar1980
OPECcollapse1986
Kuwaitinvasion1990
OPECmeeting
1999AfghanWar2001
IraqWar2003
Source Federal Reserve Economic Database (FRED)
Oil and the Macroeconomy since the 1970s 119
an oil price increase does lower factor demand because firms apply the mark-up toall cost components including imported oil not just to capital services and labor(Rotemberg and Woodford 1996) The magnitude of this effect on value addedhowever is likely to be small for reasonable mark-up ratios unless we allow inaddition for substantial changes in the mark-up over time The latter possibility isdiscussed by Rotemberg and Woodford (1996) who present a model involvingimplicit collusion between oligopolists in the goods market that can yield outputresponses to an oil price shock that are quantitatively important though highlydependent on the particular setup
Another way of undermining the benchmark result is to allow for capital-energy complementarities in production In the presence of capital-energy comple-mentarities one would expect an oil price increase to lower real GDP by loweringthe demand for capital services For example it is sometimes claimed that the risein energy prices during the 1970s made part of the existing energy-intensive capitalstock obsolete causing a reduction in output without any apparent change inmeasured capital inputs If true this economic depreciation of capital should bereflected in lower prices for used equipment There is however no real empiricalsupport for this notion For example Hulten Robertson and Wykoff (1989) foundthat the price of used equipment did not change much after the 1973 oil shock andthat the price of energy-intensive equipment actually increased in some cases Theobsolescence hypothesis was also rejected by Bohi (1991) who found no relation-ship between the energy intensity of industries and their output and employmentchanges following the oil price shocks of the 1970s Moreover to the extent that oldenergy-inefficient capital depreciates one would expect increased investment innew energy-saving equipment that will offset at least in part the recessionary effectsof the oil price shock
Another potential channel of transmission is the transfer of wealth involved inpaying higher oil import bills The total wealth transfer from the industrializedcountries to the oil-producing countries however will tend to be small given thesmall expenditure on foreign oil relative to GDP Olson (1988) computes estimatesof the extra import costs of about 1 percent of GDP for 1974ndash1978 and for1982ndash1985 and of about 2ndash3 percent for 1979ndash1981 Further the reduction inaggregate demand due to the wealth transfer occurs only to the extent that oilproducers have a lower propensity to purchase industrial countriesrsquo output thandomestic consumers
In response to the difficulties with the preceding theoretical arguments theliterature has shifted toward indirect effects set in motion by the response ofeconomic agents to the higher price of oil We already mentioned models withtime-varying mark-ups (Rotemberg and Woodford 1996) Another model thatexplains how an oil price shock may lower real GDP is the sectoral shifts model ofHamilton (1988) The principal propagation mechanism in this model is that an oilprice increase will depress purchases of energy-using goods such as automobilesThe dollar value of such purchases may be large relative to the cost of gasoline Theshift in demand causes reallocation of labor across sectors If the movement oflabor is costly potentially large reductions in value added may result One impor-
120 Journal of Economic Perspectives
tant implication of this model is that the response of output should be symmetricwhether the price of oil increases or decreases For example the predicted rise inunemployment following the oil price increase of 1979ndash1980 and that following thecollapse of OPEC prices in 1986 should have been about the same given thesimilarity of the overall magnitude of these oil price shocks Clearly however therewas no increase in unemployment in 1986 casting doubt on the realism of thismodel
A related channel has been discussed by Bernanke (1983) who shows in apartial equilibrium model that oil price shocks will tend to lower value addedbecause firms will postpone investment as they attempt to find out whether theincrease in the price of oil is transitory or permanent Gauging the importance ofsuch indirect effects of oil on output is far less straightforward than the correspond-ing exercise for the direct effects Yet there is evidence that the ldquowaitingrdquo effectdiscussed by Bernanke (1983)mdashif it existsmdashis small relative to the apparent mag-nitudes that need explanation
The upper panel of Figure 3 plots monthly auto sales (millions of units sold)in the United States The oil dates are imposed as vertical lines and indicate periodsof large increases in uncertainty about the price of oil If uncertainty is an impor-tant channel by which oil price shocks cause recessions we would expect to see asharp drop in sales of energy-using durables such as cars after each major oil pricechange Although there is some evidence that car sales fell after the shocks of 19741979 and 1990 the drops are rather small by historical standards and occur onlygradually Moreover in each case they merely represent the continuation of adecline that started well before the oil date For example car sales in the UnitedStates had peaked nearly a year before the October 1973 war They also peaked wellbefore the Iranian revolution and the invasion of Kuwait In some cases there is noevidence at all of a decline in car sales notably in the year following the 1980 and1999 oil dates Nor was there a change in trend after the 2001 and 2003 oil datesFinally in the year following the collapse of OPEC in 1986 car sales on averageincreased This finding suggests that the negative effect on car sales of the increaseduncertainty about oil prices in 1986 must have been small relative to the directpositive effect of lower oil prices Thus the evidence that oil price shocks operatevia a reduction in demand for durables such as cars is weak The data cast doubtboth on the importance of the Bernanke (1983) uncertainty effect and on theHamilton (1988) model that relied on reductions in the demand for consumerdurables such as cars2
2 An alternative approach is to use the volatility of oil prices as a proxy for uncertainty A more formalanalysis shows that there typically is an increase in oil price volatility following the oil dates but oftenwith a substantial delay The formal volatility measure that we used is the conditional variance of thepercentage change of the nominal oil price It was computed based on the fitted values of a generalizedautoregressive conditional heteroskedasticity model There is some evidence that increases in oil pricevolatility in 1973ndash1974 1979ndash1980 and 1990ndash1991 may have been associated with subsequent declinesin car sales but the lags are long and variable There are no sudden and sharp drops as one might haveexpected based on the Bernanke (1983) model Moreover it is not clear to what extent these declinesare a cause of the recession or an effect
Robert B Barsky and Lutz Kilian 121
Other evidence paints a similar picture The bottom panel of Figure 3 focuseson a broader measure of monthly real consumption of durables The qualitativeconclusions are the same as for car sales There is no evidence of sharp drops inconsumer spending after oil dates In fact durables consumption appears largelystable after the 1973 and 1979 oil dates It actually increases after the 1980 19861999 2001 and 2003 dates Only in 1990 is there evidence of a slight decline afterthe oil date
Similar results hold if we focus on the investment decisions of firms Figure 4shows the corresponding data for real fixed nonresidential investment and realinvestment in equipment and software Neither series shows a sharp drop after oildates as one might have expected in response to an increase in uncertainty Evenaccounting for the long-run trend in investment these aggregate data provide nosupport for the notion that increased uncertainty leads to a sharp fall in investmentthat in turn contributes to a recession
Yet another line of reasoning as to why oil price shocks may have indirecteffects has focused on the monetary policy response to oil price shocks Forinstance Bohi (1989) and Bernanke Gertler and Watson (1997) have investigatedthe possibility that the 1974 recession may be understood as a consequence of the
Figure 3Oil Price Uncertainty and Real Consumption of Durables 19713ndash20037
6
8
10
12
14
16
1975 1980 1985 1990 1995 2000
Mill
ion
s
0
200
400
600
800
1000
1975 1980 1985
Real durables consumption
Auto sales in the United States
1990 1995 2000
Bill
ion
s of
200
0 do
llars
Octoberwar1973
Iranianrevolution
1979 Iran-Iraqwar1980
OPECcollapse1986
Kuwaitinvasion1990
OPECmeeting
1999
AfghanWar2001
IraqWar2003
Octoberwar1973
Iranianrevolution
1979
Iran-Iraqwar1980
Kuwaitinvasion1990
OPECcollapse1986
OPECmeeting
1999
AfghanWar2001
IraqWar2003
Source Federal Reserve Economic Database (FRED) Department of Energy and BEANotes Oil dates have been imposed as vertical lines
122 Journal of Economic Perspectives
Federal Reserversquos policy response to the inflation triggered by an oil price shockThe output effect arises in this view because the Fed responds to evidence of risinginflation with a monetary tightening thereby inducing a recession Whether mon-etary policy actually did respond to oil price shocks in this way continues to be amatter of debate For example in the 1973ndash1974 episode the monetary tighteningstarted eight months prior to the 1973 oil date (for example Bernanke and Mihov1998)
A second indirect monetary effect on output is due to the ldquowage-price spiralrdquowhich occurs if nominal wages are set in line with past price increases while pricesare set in line with past wage increases In this setting an initial inflationary shockdue to oil may be propagated if wage increases are accommodated by the centralbank To the extent that the real wage is prevented from falling a decline in valueadded will be required in response to an oil shock (Bruno and Sachs 1985)Although this explanation is popular empirical studies suggest that US real wagesactually did fall in response to higher oil prices (Bohi 1989 1991 Keane andPrasad 1996 Rotemberg and Woodford 1996) Even for Europe and Japan thereis at best limited support for this explanation Thus again the case that oil priceshocks create recessions is weak
Figure 4Oil Price Uncertainty and Real Investment Quarterly 1971Indash2003IV
200
0
400
800
600
1000
1200
1400
1975 1980 1985 1990 1995 2000
0
200
400
600
800
1000
1975 1980 1985
Real investment in equipment and software
Real nonresidential fixed investment
1990 1995 2000
Bill
ion
s of
200
0 do
llars
Bill
ion
s of
200
0 do
llars
Iranianrevolution
1979
Kuwaitinvasion1990
OPECmeeting
1999
AfghanWar2001
IraqWar2003
Octoberwar1973
Iranianrevolution
1979
Iran-Iraqwar1980
Octoberwar1973
Iran-Iraqwar1980
Kuwaitinvasion1990
OPECcollapse1986
OPECcollapse1986
OPECmeeting
1999
AfghanWar2001
IraqWar2003
Source Federal Reserve Economic Database (FRED)Notes Oil dates have been imposed as vertical lines
Oil and the Macroeconomy since the 1970s 123
How Oil Price Shocks May Affect InflationTheories that can explain how oil might cause a recession still do not in
general generate stagflation a phenomenon especially important for understandingthe historical experience of the 1970s Thus it is important to address the addi-tional role of oil price shocks if any in explaining inflation Interestingly theexisting literature has focused on the effect of oil price shocks on aggregate outputand left unchallenged the common notion that oil price shocks are by necessityinflationary Recently Barsky and Kilian (2002) using an illustrative example thatbuilds on Gordon (1984) and Rotemberg and Woodford (1996) have verified thatan oil price shock indeed is unambiguously inflationary for the price of grossoutput Hence following an oil price shock one would expect stagflation in theform of a decline in industrial production and increased inflation in the CPI Thesame model however also implies that there is no theoretical presumption that theGDP deflator would increase in response to an oil price shock although it mightunder certain conditions This analysis is important because it explains importantdifferences between the observed response of CPI inflation and of inflation in theGDP deflator to oil price shocks
Of course in principle a more complicated theoretical modelmdashinvolving saymark-ups and wage-price interactionsmdashcould deliver an unambiguous increase inthe GDP deflator in response to an oil price shock It is important however not tolose sight of the fact that there is no convincing empirical evidence that oil priceshocks are associated with higher inflation rates in the GDP deflator There isstrong evidence only of sharp changes in the CPI inflation rate following major oilprice changes (Barsky and Kilian 2002)
How Oil Price Shocks May Affect Economic GrowthOil price shocks may also have long-term consequences for economic growth
Notably the rise in the price of oil in 1974 has been blamed for the productivityslowdown which is often dated as beginning in 1973 (although there is a case thatit began earlier perhaps in the late 1960s as discussed in Hansen 2001) Therelationship between oil price increases and changes in total factor productivity wasexplored extensively in the Fall 1988 ldquoSymposium on the Productivity Slowdownrdquo inthis journal Olson (1988) in that issue concluded that ldquothe evidence has not beenkindrdquo to oil-based explanations of the productivity slowdown The fundamentalproblem is that the cost of energy is too small a part of GDP to explain theproductivity slowdown Olson quantified the US productivity losses that may beattributed to substitution away from oil and concluded that they were much toosmall to explain the productivity slowdown He also noted that the opportunitiesfor substitution were sharply limited during the initial years following the 1973 oilprice shock This view is now widely accepted
In response some economists have focused on alternative channels of trans-mission that operate through some other variable with important effects on pro-ductivity One possibility is that energy-inefficient capital was made obsolete byhigher oil prices resulting in an unmeasured decline in the capital stock whichwould look like a decline in productivity in the data As we have discussed earlier
124 Journal of Economic Perspectives
there is no empirical support for that notion Although a number of additional andmore elaborate arguments have been advanced that in principle might establish alink from oil prices to productivity changes none of these models can claim solidempirical support
Where Do Oil Price Shocks Come From
Conventional wisdom suggests that major increases in the price of oil tend tobe driven by exogenous political events in the Middle East Even if we accept thenotion that turmoil in the Middle East may cause sharp increases in the price of oilhowever recent history demonstrates that Middle East disturbances do not neces-sarily raise the price of oil and that major oil price increases may occur even in theabsence of such shocks For example the increase in the real price of oil betweenMarch 1999 and November 2000 was certainly a major one but during that periodmilitary conflicts in the Middle East were conspicuously absent Even more difficultto explain for adherents of the conventional view is the fact that after November2000 the oil price fell despite Middle East turmoil and the high likelihood thatmost of Iraqrsquos oil exports would remain off global markets on top of low invento-ries that were further strained by one of the coldest winters in recent memoryNeither the terrorist attacks of September 11 2001 nor the outbreak of the war inAfghanistan and the stocking up of the US Strategic Petroleum Reserve couldstem the decline in crude oil prices in 2001
Many observers would be willing to concede that major movements in oilprices are possible even in the absence of exogenous political shocks but wouldargue that the 1999ndash2000 oil price increase must have been engineered by theOPEC oil cartel This interpretation begs the question of how this cartel suddenlyacquired new powers in March 1999 having been unable to force a sustainedincrease in oil prices since 1986 and how the same cartel just two years later seemedto be on the verge of collapse It seems implausible that the Mexican oil ministerby his eloquence alone in 1998 managed to unify a cartel that had steadily lostinfluence since 1986 Nor is it obvious why those rhetorical powers failed the oilminister in 2001 There have been many OPEC meetings since 1986 but only theMarch 1999 decision was followed by a sustained increase in oil prices Clearly ittakes more than a cartel meeting to drive up prices What then was different about1999ndash2000 One plausible answer is that OPEC decisions are far from exogenousand in fact respond to global macroeconomic conditions
The Role of CartelsThe view that worldwide demand for oil is essential in understanding oil prices
does not imply that OPEC was inconsequential A key channel that links the stabilityof oil cartels to macroeconomic forces is described in standard theoretical modelsof cartels such as Rotemberg and Saloner (1986) and Green and Porter (1984)Producers trade off the immediate gains from abandoning the cartel against thepresent value of the future cartel rents foregone This logic suggests that all else
Robert B Barsky and Lutz Kilian 125
equal unusually low real interest rates as in the 1970s should be conducive to theformation of cartels and that high real interest rates should be detrimentalFurthermore the work of Green and Porter implies that the ability of cartels tokeep prices high will be procyclical if producers are unable to tell whether othercartel members are cheating by exceeding their production quota More specifi-cally in times of unexpectedly low demand when prices fall below a trigger pointcartel members will choose to flood the market with their output The assumptionof imperfectly observable output is particularly appealing for crude oil producersThe actual production level of crude oil can only be estimated in many cases andreliable output statistics become available at best after a long lag Thus strongeconomic expansions all else equal should strengthen oil cartels and majorrecessions weaken them3
This model helps to explain the surplus production of oil following the Asiancrisis of 1997ndash1998 as well as the apparent success of OPEC during 1999ndash2000Although real interest rates were not unusually low by historical standards over thelatter period cumulative GDP growth in the United States was extraordinarilyhighmdashhigh enough to offset the less-than-stellar growth performance of Europeand Japan The same economic theory suggests that (all else equal) a pendingrecession should undermine the stability of OPEC As Figure 1 shows the turningpoint for oil prices indeed occurred as the first signs of a possible US recessionemerged in late 2000 Within weeks the oil price began to slip and its fallaccelerated throughout 2001 Shortly thereafter the New York Times referred to theprospect of a devastating price war (Banerjee 2001) as OPEC was unable toenforce its goal of a major cut in oil production in the face of falling demand Thisanalysis does not deny the importance of political efforts aimed at strengthening orsustaining the oil cartel rather the point is that such activitiesmdashunlike warsmdasharenot exogenous and that the sustainability of cartels will be determined to animportant extent by the macroeconomic environment
The above discussion abstracts from international features of the oil market Afurther element in OPECrsquos price decisions is likely to be the exchange rate of thedollar vis-a-vis other major currencies Indeed the depreciation of the dollar was animportant element in OPECrsquos justification for higher oil prices in the 1970s (forexample Terzian 1985) To the extent that the dollar depreciates with respect toEuropean or Japanese currencies goods denominated in those currencies becomemore expensive and there will be an incentive to make up for the loss in OPECpurchasing power by increasing the price of oil in dollar terms At the same timea weaker dollar also will tend to stimulate demand for oil in the rest of the worldthereby strengthening the cartel and driving up the price of oil
3 Rotemberg and Saloner (1986) in sharp contrast to Green and Porter argue that cartels should breakup in booms That conclusion is not empirically supported for the oil market however and indeeddriven by the counterfactual assumption of perfectly observable output
126 Journal of Economic Perspectives
The Role of Major Political Events in the Middle East An OverviewOnce one accepts that the 1999ndash2000 tripling of oil prices was not caused by
exogenous political events in the Middle East the question arises naturally to whatextent previous oil price increases were perhaps driven by the same endogenousforces It is useful to start with the anatomy of major oil price increases It is widelybelieved that sudden and large changes in the price of oil tend to be caused byunpredictable exogenous political events in the Middle East that represent shifts ofthe supply curve for oil Often these ldquoshocksrdquo are associated with military eventssuch as the outbreak of wars Figure 5 shows the percentage change in the nominalprice of oil since March 1971 when US oil production reached full capacity andthe United States became dependent on foreign oil Episodes of major wars ormajor civil unrest are indicated by vertical bars and include the October war of1973 the Iranian revolution in late 1978 the outbreak of the Iran-Iraq war in late1980 the invasion of Kuwait in 1990 the start of the war in Afghanistan in October2001 and of the war in Iraq in March 2003 We also included the collapse of OPECin 1986 and the period of possible OPEC price management since March 1999 forcomparison
Clearly not all so-called oil shocks follow the same pattern For example theperiod after the October war of 1973 the period after the collapse of OPEC in late1985 and the period immediately after the invasion of Kuwait in 1990 are charac-terized by sharp spikes in oil prices The period following the Iranian revolution of1978ndash1979 and that following the 1999 OPEC meeting are in contrast character-ized by relatively small but persistent positive rates of change Nor are the 2001 and2003 wars associated with sharp spikes in oil prices These differences suggest
Figure 5Percentage Change in the Nominal Price of Crude Oil Imports 19713ndash200312
40
30
20
50
0
10
10
30
40
20
50
1975 1980 1985 1990 1995 2000
Perc
ent
Octoberwar1973
Iranianrevolution
1979
Iran-Iraqwar1980
OPECcollapse1986
Kuwaitinvasion1990
OPECmeeting
1999AfghanWar2001
IraqWar2003
Source See Figure 1
Oil and the Macroeconomy since the 1970s 127
important differences in the genesis of these oil events For example the casualobserver would be led to conclude that the 1999ndash2000 increase in oil prices is muchmore akin to the 1979ndash1980 increase than to the 1973ndash1974 or the 1990 episode
We conclude that there may have been many plausibly exogenous politicalevents in the Middle East but the magnitude and pattern of the subsequentchanges in the price of crude oil varies greatly Thus it is far from obvious what theprecise channel is by which exogenous events affect the price of oil and whetherthere is a link at all This is the question we turn to next
The Role of WarsIt may seem that wars in the Middle East are natural candidates for inducing
major changes in oil prices but this link is far from obvious A perhaps simplisticview is that oil price shocks reflect shocks to the supply of oil in the form ofinterruptions of the production (or shipments) of crude oil from the Middle EastAs we will show this interpretation is difficult to sustain A more sophisticated viewis that in response to wars or the threat of war in the Middle East there will be anincrease in precautionary demand for oil which may cause sharp increases in theprice of oil when the supply of oil is inelastic as is especially likely in times ofcapacity constraints In this latter interpretation wars shift the demand for oilrather than the supply of oil Demand for oil shifts because oil consumers attemptto stockpile oil when they feel that the likelihood of a major oil supply interruptionhas increased This second explanation may help explain seeming discrepancies inthe timing and in the magnitude of the oil price shock Its main limitation is thatthe effect depends on largely unobserved shifts in expectations
A first way of seeing that the oil supply shock view must be missing somethingimportant is to note that supply cuts of similar magnitude seem to have had verydifferent effects on the price of oil For example although the case for anexogenous production cut following the outbreak of the Iran-Iraq war in late 1980is strong the data in Figures 1 and 5 reveal that the apparent effect on the price ofoil was quite small compared to the effect of the invasion of Kuwait This seemsrather curious given that the magnitudes of the production cuts were almost thesame with a 72 percent and 88 percent drop relative to pre-war levels respectively(Hamilton 2003)
A second reason to doubt the oil supply shock view is the timing of some majoroil price increases and commonly cited political events For example most of the1979 increase in the price of oil occurred more than half a year after the Iranianrevolution broke out (but before the outbreak of the Iran-Iraq war in late 1980)Thus the exogeneity of the production cut during the revolution is not in doubtbut the extent to which the observed temporary production cut after October 1978is actually related to the rapid oil price increases after May 1979 is not clear
Even more curious is the fact that this particular oil price increase in 1979ndash1980 very much unlike the sharp oil price spike following the 1990 war occurredin the form of small but persistent price increases extending over a period ofalmost two years It is unclear why the typical response of oil prices to a productioncut should look so qualitatively different when the nature of the shock is presum-
128 Journal of Economic Perspectives
ably identical and why these increases only occurred when Iran had resumed oilexports
This evidence argues against the existence of a mechanical link betweenwar-induced cuts in oil supplies and the price of oil Instead the effect of a supplycut will depend very much on the response of other suppliers of oil (includingSaudi Arabia as the country with the most spare capacity) and on demand condi-tions in the oil market reflecting both the overall macroeconomic environment inthe world and the degree of anxiety of oil consumers about future suppliesMoreover increased uncertainty about future oil supplies may shift the price of oileven in the absence of a war-induced production cut A case in point is the 2003Iraq war The 2003 Iraq war unlike many of the other events in Figure 5 was clearlyanticipated By definition at the time of the oil price increase no war-relatedproduction cutbacks had occurred (nor was there significant damage to oil facilitiesduring the war) Thus all of the observed oil price increase may be attributed touncertainty Comparing oil price data in the summer of 2002 (when the possibilityof a war was first openly discussed) to the price in March 2003 right beforehostilities broke out suggests an uncertainty premium of about $5 or $6 per barrelThis is roughly the same amount by which the price fell after the war had ended
Of course increased fears about future oil supplies may arise from events otherthan the threat of war in major oil producing countries in the Middle Eastmdashanyevent with adverse effects on the political stability of these countries could generatesuch fears Arguably conflicts such as the terrorist attacks of September 11 2001the war in Afghanistan the 1982 invasion of Lebanon by Israel and subsequentclashes with Syria or the Palestinian uprising in Israel and its occupied territories allhave repercussions for the political stability of major oil-producing nations andhence would be expected to raise the price of oil If such increases do not seemlarge as the evidence suggests this fact only reinforces our point that no automaticlink exists between political events and fears of supply interruptions As noted byMabro (1998) in the absence of taut demand conditions in the oil market politicalflare-ups are unlikely to cause dramatic shifts in the price of oil4
The Role of EmbargoesThe 1973 oil price shock took the form of a sharp spike similar to that of 1990
in magnitude At first sight this fact is suggestive of a war-based explanation butthe observed increase in the price of oil in late 1973 and early 1974 occurs only aftera delay It does not appear to be directly related to the October 1973 war nor todamaged oil facilities in that conflict In fact most countries involved in military
4 A case in point is the rise in oil prices in early May 2004 following terrorist attacks on oil facilities inSaudi Arabia As the New York Times (Sachs 2004) notes ldquoit is the combination of fears of what mighthappen and the fundamental tightness of the market that has sent prices higherrdquo The article elaboratesthat ldquowhile recent attacks on oil facilities did not do much damage traders worry that a more seriousdisruption of Middle East oil production remains possible and that it would shake the fragile stability ofthe already strained oil marketrdquo
Robert B Barsky and Lutz Kilian 129
actionmdashEgypt Jordan Syria Iraqmdashwere not even major oil producers at the time5
Rather the fall in oil supplies is mainly related to the tightening of the oil embargoimposed by Arab OPEC countries in late 1973 An embargo unlike a war is likelyto be endogenous with respect to macroeconomic conditions
The key question then is to what extent that embargo decision was driven bypolitical as opposed to economic considerations Hamilton (2003) rightly pointsout that political considerations did play some role in the embargo decision Barskyand Kilian (2002) instead stress historical and institutional evidence in support ofthe endogeneity of the 1973 embargo decision to macroeconomic conditions Inthe latter view there was no trade-off between political and economic objectives atthe time when the embargo and the associated production cuts were instituted6
Once the economic objective of a higher price of oil had been achieved in early1974 however the political objectives of the embargo were quietly discarded alongwith the embargo itself
Moreover the observed price increases for oil over that 1973ndash1974 period werenot much different from those of some industrial commodities for which politicalconsiderations can be ruled out casting doubt on the importance of the oilembargo This fact is consistent with the view that the observed spike in the priceof oil in late 1973 can be explained as the result of unique institutional features inthe oil market which led to a delayed adjustment of the price of oil to a precedingdemand boom (Barsky and Kilian 2002) If there was a component of the 1973ndash1974 oil price increase that can be attributed to the war it is likely to have beenfears about future oil supplies in late 1973 but as noted earlier those fears mustalso be viewed against the macroeconomic background of a world economy thatwas booming at that time
The Role of Global Macroeconomic ConditionsAs shown earlier neither cartel decisions nor the imposition of oil embargoes
nor the effects of political uncertainty on the price of oil are independent of globalmacroeconomic conditions Apart from their indirect effects through institutionsmacroeconomic conditions also affect the price of oil directly by shifting thedemand for oil This view has long been recognized by oil economists For examplethe survey by Mabro (1998) ldquoOPEC Behavior 1960ndash1998 A Review of the Litera-turerdquo in the Journal of Energy Literature gives considerable (favorable) attention tothe endogenous elements of oil price determination Curiously mainstream econ-omists have often been slow to embrace the notion that oil prices respond toeconomic forces as one would expect of other industrial commodity prices
The importance of shocks to the demand for oil was strikingly illustrated by the
5 Egypt Jordan and Syria were not even members of OPEC Iraqrsquos oil output amounted to about38 percent of world oil production in September of 1973 (US Energy Information Administration1994) Its share fell to 33 percent in October 1973 (covering the period during and after the war)6 This situation is not unlike that of the Spanish conquistadores who aimed to procure ships from theSpanish king to serve the double objective of finding gold and converting heathens across the AtlanticIs it reasonable to presume that the Spanish would have sailed just for the latter objective
130 Journal of Economic Perspectives
drop in the price of oil following the Asian crisis of 1997ndash1998 It also is essentialin understanding the upswing in oil prices in 1999ndash2001 as discussed earlierBarsky and Kilian (2002) suggest that some of the same forces that help usunderstand oil price movements in 1997ndash2001 also help explain the sustainedincreases in oil prices in the 1970s Unlike in the late 1990s the upward pressureon oil prices in the 1970s in this view was caused not by a shift in productivity butby worldwide monetary expansions that drove output levels above potential forsustained periods and were followed by periods of unusually low real interest ratesAs these booms gave way to recessions and increases in real interest rates oil pricesstarted falling in the early 1980s and ultimately collapsed in early 1986 despite thebest efforts of the OPEC cartel to sustain them at higher levels
Central to this demand-driven account of oil price movements is that in theshort run the effective supply curve for oilmdashwhich depends on pipelines andtanker capacity at least as much as on oil reserves in the groundmdashcan be very steepThat view is consistent with oil industry sources that suggest that the industrytended to be at capacity in times of high world economic activity In the long runhigh oil prices due to strong demand for oil stimulate an expansion of capacity Itstands to reason that the collapse of oil prices in the 1980s would not havehappened as fast as it did if the high oil price in 1974 had not induced manycountries to increase oil production Given the considerable delays in expandingoil production however the shift in the long-run supply curve did not havematerial effects on the price of oil until more than half a decade later
Are Oil Price Shocks Essential in Explaining Stagflation
We have shown that the evidence for the alleged link from oil price changes tomacroeconomic performance may have been overstated Some of our points arenew but many of the arguments have been known for years Despite the mountingevidence to the contrary the oil shock view has proved surprisingly resilientbecause of another piece of evidence thatmdashat first sightmdashappears as the ldquosmokinggunrdquo in this controversy the appearance of stagflation during the 1970s Stagflationhas been defined as a period of high unemployment in combination with risinginflation or alternatively a high level of inflation The choice of definition mattersUntil the 1970s it was commonly accepted that inflation is caused by excessdemand In its modern guise this view has been embedded in the so-calledaccelerationist Phillips curve which implies that inflation increases when theeconomy is overheated and declines when there is slack in the economy
The perception that the early 1970s unlike earlier periods were characterizedby increasing inflation in combination with unemployment in excess of the naturalrate (as is sometimes claimed even today as in Blanchard 2002 p 185) cast doubton the accelerationist model Evidence that the economy remains below potentialwhile inflation continues to rise is inconsistent with the standard accelerationistmodel of the macroeconomy and thus would seem to require a different explana-tion presumably one based on supply shocks that shift the Phillips curve This fact
Oil and the Macroeconomy since the 1970s 131
helps explain the increased focus on oil price increases as supply shifters in theearly 1970s However there never was a significant period of rising inflation alongwith excess unemployment in 1973ndash1975 Rather stagflation in the data occurredin the form of periods of slow or negative economic growth alongside high levelsof inflation Thus the data are consistent with the accelerationist model making itunnecessary to appeal to special factors such as oil shocks
Figure 6 shows quarterly data (at annual rates) for 1973I to 1975IV onunemployment the deviation of log real GDP from trend inflation in the CPI andinflation in the GDP deflator7 The unemployment rate is presented relative to therate of 55 percent which roughly corresponds to zero deviation of output from thetrend and is a plausible estimate of the natural rate of unemployment Over theperiod 1973I to 1974III the economy was in decline but unemployment was stillbelow the natural rate Inflation tended to rise over this period8 In contrastinflation tended to fall from late 1974 through the end of 1975mdashthe part of therecession in which unemployment exceeded the natural rate This behavior isstrikingly consistent with the accelerationist Phillips curve withmdashof coursemdashsomedisturbance but not one larger than is found in other historical periods9
Once it is clear that rising deflator inflation in combination with abnormallyhigh unemployment is not a strong feature of the data a definition of stagflationbased on such a pattern becomes largely irrelevant as does the demonstration thatan accelerationist model cannot account for this hypothetical pattern Our analysisalso helps us to understand the conspicuous absence of stagflationary patternsfollowing subsequent oil price shocks In fact none of the major oil price increasessince the 1980s have been associated with stagflation
Conclusion
It is commonly believed that there is a close link from political events in theMiddle East to changes in the price of oil and in turn from oil price changes tomacroeconomic performance in the United States As to the first belief we stressedthat exogenous political events in the Middle East are but one of several factorsdriving oil prices and that the effect of seemingly similar political events may differgreatly from one episode to the next in accordance with variations in demandconditions in the oil market and global macroeconomic conditions As to the
7 The deviations of output from trend were computed using the Hodrick-Prescott (HP) filter Hodrickand Prescott (1997) proposed that we view the time series for log real GDP as the sum of a cyclicalcomponent and a growth component The latter may be removed by a statistical filter that leaves anestimate of the business cycle component in the form of deviations from a smooth time trend Thedegree of smoothness may be regulated by choosing a constraint parameter We estimated the growthcomponent over 1960 to 2003 with the conventional parameter choice of 16008 The spike in CPI inflation in 1974I reflects the temporary effect of the OPEC oil price increase Thedifferential effect of the oil price increase on CPI and deflator inflation data is consistent with the theoryon the price of gross output and value added discussed previously9 For example although the increase in the deflator inflation rate slowed down considerably in 1974IVdeflator inflation started declining only in 1975I
132 Journal of Economic Perspectives
second belief we showed that the timing of oil price increases and recessions isconsistent with the notion that oil price shocks may contribute to recessions withoutnecessarily being pivotal We investigated several leading theoretical explanationsfor a contractionary effect of oil price increases but found little empirical supportfor any one explanation either because the magnitude of the predicted effect canbe shown to be small a priori or because the theory has implications that are notsupported by US macroeconomic data We also showed that oil price shocks areneither necessary nor sufficient to explain stagflation in real GDP and in theimplicit GDP deflator Thus we conclude that disturbances in the oil market arelikely to matter less for US macroeconomic performance than has commonly beenthought
y The authors thank Brad De Long Timothy Taylor and Michael Waldman for helpfulcomments Part of this paper was written while the second author was serving as an adviserto the European Central Bank The opinions expressed in this paper do not necessarily reflectthe views of the European Central Bank or its staff
Figure 6CPI Inflation Inflation in the GDP Deflator Detrended Log Real GDP and theUnemployment Rate in Excess of 55 Percent(quarterly 1973I to 1975IV)
0
1
2
3
4
11973II 1974 1974II
Unemployment rate 551975 1975II 1976
6
8
10
12
14
41973II 1974 1974II
GDP deflator inflation1975 1975II 1976
0
005
0051973II 1974 1974II
HP-detrended log real GDP1975 1975II 1976
6
8
10
12
14
41973II 1974 1974II
CPI inflation1975 1975II 1976
Source Federal Reserve Economic Database (FRED)
Robert B Barsky and Lutz Kilian 133
References
Ball Laurence and N Gregory Mankiw 2002ldquoThe NAIRU in Theory and Practicerdquo Journal ofEconomic Perspectives Fall 164 pp 115ndash36
Banerjee Neela 2001 ldquoOil Prices in Flux asOPEC Decides Against Cut in Outputrdquo New YorkTimes November 15 C1
Barsky Robert B and Lutz Kilian 2002 ldquoDoWe Really Know that Oil Caused the Great Stag-flation A Monetary Alternativerdquo in NBER Mac-roeconomics Annual 2001 B S Bernanke and KRogoff eds Cambridge Mass MIT Presspp 137ndash83
Bernanke Ben S 1983 ldquoIrreversibility Uncer-tainty and Cyclical Investmentrdquo Quarterly Journalof Economics February 981 pp 85ndash106
Bernanke Ben S and Ilian Mihov 1998 ldquoMea-suring Monetary Policyrdquo Quarterly Journal of Eco-nomics 1133 pp 869ndash902
Bernanke Ben S Mark Gertler and Mark WWatson 1997 ldquoSystematic Monetary Policy andthe Effects of Oil Price Shocksrdquo Brookings Paperson Economic Activity 1 pp 91ndash148
Blanchard Olivier 2002 ldquoComments on lsquoDoWe Really Know that Oil Caused the Great Stag-flation A Monetary Alternativersquo by Robert Bar-sky and Lutz Kilianrdquo in NBER MacroeconomicsAnnual 2001 B S Bernanke and K Rogoff edsCambridge Mass MIT Press pp 183ndash92
Bohi Douglas R 1989 Energy Price Shocks andMacroeconomic Performance Washington DC Re-sources for the Future
Bohi Douglas R 1991 ldquoOn the Macroeco-nomic Effects of Energy Price Shocksrdquo Resourcesand Energy June 132 pp 145ndash62
Bruno Michael and Jeffrey D Sachs 1985Economics of Worldwide Stagflation CambridgeMass Harvard University Press
Friedman Milton 1968 ldquoThe Role of Mone-tary Policyrdquo American Economic Review March581 pp 1ndash17
Green Edward J and Robert H Porter 1984ldquoNoncooperative Collusion under ImperfectPrice Informationrdquo Econometrica January 521pp 87ndash100
Gordon Robert J 1984 ldquoSupply Shocks andMonetary Policy Revisitedrdquo American EconomicReview May 742 pp 38ndash43
Hamilton James D 1988 ldquoA NeoclassicalModel of Unemployment and the Business Cy-clerdquo Journal of Political Economy June 963pp 593ndash617
Hamilton James D 2003 ldquoWhat is an Oil
Shockrdquo Journal of Econometrics April 1132pp 363ndash98
Hansen Bruce E 2001 ldquoThe New Economet-rics of Structural Change Dating Breaks in USLabor Productivityrdquo Journal of Economic Perspec-tives 154 pp 117ndash28
Hodrick Robert J and Edward C Prescott1997 ldquoPostwar US Business Cycles An Empiri-cal Investigationrdquo Journal of Money Credit andBanking February 291 pp 1ndash16
Hulten Charles R James W Robertson andFrank C Wykoff 1989 ldquoEnergy Obsolescenceand the Productivity Slowdownrdquo in Technologyand Capital Formation Dale W Jorgenson andRalph Landau eds Cambridge Mass MITPress pp 225ndash58
Keane Michael P and Eswar S Prasad 1996ldquoThe Employment and Wage Effects of Oil PriceChanges A Sectoral Analysisrdquo Review of Econom-ics and Statistics 783 pp 389ndash400
Mabro Robert 1998 ldquoOPEC Behavior 1960ndash1998 A Review of the Literaturerdquo Journal of En-ergy Literature June 41 pp 3ndash27
Olson Mancur 1988 ldquoThe Productivity Slow-down the Oil Shocks and the Real Cyclerdquo Jour-nal of Economic Perspectives Fall 24 pp 43ndash69
Phelps Edmund S 1968 ldquoMoney-Wage Dy-namics and Labor Market Equilibriumrdquo Journalof Political Economy Part 2 764 pp 678ndash711
Roberts John M 1995 ldquoNew Keynesian Eco-nomics and the Phillips Curverdquo Journal of MoneyCredit and Banking Part 1 November 274pp 975ndash84
Rotemberg Julio J and Garth Saloner 1986ldquoA Supergame-Theoretic Model of Business Cy-cles and Price Wars During Boomsrdquo AmericanEconomic Review June 763 pp 390ndash407
Rotemberg Julio J and Michael Woodford1996 ldquoImperfect Competition and the Effects ofEnergy Price Increases on Economic ActivityrdquoJournal of Money Credit and Banking Part 1 No-vember 284 pp 550ndash77
Sachs Susan 2004 ldquoAttacks in Mideast RaiseFear of More at Oil Installationsrdquo New YorkTimes May 8 C1
Terzian P 1985 OPEC The Inside Story Lon-don Zed books
United States Energy Information Administra-tion 1994 Historical Monthly Energy Review 1973ndash1992 Washington DC US Government Print-ing Office
134 Journal of Economic Perspectives
macroeconomic fluctuations and we trace how the arguments of proponents of theoil view have evolved in response to these difficulties Second we challenge thenotion that at least the major oil price movements can be viewed as exogenous withrespect to the US macroeconomy We examine critically the evidence that has ledmany economists to ascribe a central role to exogenous political events in modelingthe oil market and we provide arguments in favor of reverse causality frommacroeconomic variables to oil prices Third although none of the more recent oilprice shocks has been associated with stagflation in the US economy a majorreason for the continued popularity of the oil shock hypothesis has been theperception that only oil price shocks are able to explain the US stagflation of the1970s We show that this is not the case
Why Oil Seems to Matter for the Macroeconomy
There is a widespread belief that exogenous political events in the Middle Eastcause recessions in industrialized countries through their effect on the price of oilThis belief is fueled by the close statistical relationship between political events inthe Middle East and recessions in the United States Table 1 provides a list of thestarting dates of US recessions since 1972 as dated by the National Bureau ofEconomic Research Most of these recessions were preceded by political events inthe Middle East that in some popular readings of events were responsible for asubsequent increase in the price of oil which in turn caused the recession Theprima facie evidence for such a linkage is marred by the long and variable delaysbetween oil events and recessions in some cases For example the March 1999OPEC meeting (if it was an exogenous political event) preceded the March 2001recession by two full years Similarly there is a long delay between the Iranianrevolution and the January 1980 recession and between the outbreak of the
Table 1The Coincidence of Oil Dates and Recessions after 1972
Business cycle peakEvents associated with subsequent major
oil price increase
November 1973 October War and Oil EmbargoOctober 1973ndashearly 1974
January 1980 Iranian RevolutionOctober 1978ndashFebruary 1979
July 1981 Outbreak of Iran-Iraq WarSeptember 1980
July 1990 Invasion of KuwaitAugust 1990
March 2001 OPEC MeetingMarch 1999
Source The business cycle dates are from the National Bureau of Economic Research at httpwwwnberorgcycles
116 Journal of Economic Perspectives
Iran-Iraq war and the July 1981 recession On the other hand the November 1973recession immediately followed the October war and the start of the oil embargoand the onset of the July 1990 recession even preceded the August 1990 invasion ofKuwait This irregular pattern argues against a monocausal role for oil but is stillconsistent with the view that oil events at least contribute to recessions Thus it iseasy to see why many observers continue to assign an important role to politicalevents in the Middle East in explaining US recessions
Even if we do not necessarily accept the view that exogenous political events inthe Middle East cause recessions in the United States it is undoubtedly true thatmany recessions since 1972 have been associated with major oil price increasesalthough again the association is less than perfect Figure 1 plots the real price ofoil since 1972 with business cycle peaks imposed as vertical lines The recessionsthat started in November 1973 and July 1990 occurred right before major oil priceincreases The January 1980 recession followed a sustained oil price increase in1979 In contrast the recessions starting in July 1981 and March 2001 actuallyoccurred during declines of the real price of oil albeit within months of a peakThus it seems difficult to maintain that the two phenomena are unrelated
In addition to the perceived link between major oil price increases andrecessions oil has been held responsible for the productivity slowdown in the1970s Table 2 relates the growth rate of total factor productivity to the real priceof oil for selected subperiods The overall relationship is heavily influenced by aperiod of unusually low growth in total factor productivity in 1974ndash1985 that
Figure 1Real Price of US Crude Oil Imports and Recessions 19713ndash200312
35
30
25
20
15
10
5
0
40
45
50
1975 1980
1982
ndash19
84 d
olla
rs
1985 1990 1995 2000
RecessionNovember1973
RecessionJuly1981
RecessionJuly1990
RecessionJanuary
1980
RecessionMarch2001
Source Department of Energy Federal Reserve Economic Database (FRED) and National Bureau ofEconomic Research The oil price data are constructed as in Barsky and Kilian (2002) The oil pricehas been deflated by the US CPI for urban consumers
Robert B Barsky and Lutz Kilian 117
coincides with an unusually high real price of oil This phenomenon has promptedinterest in establishing a theoretical link between oil prices and productivity thatcontinues to this day
Oil price shocks have also been said to cause inflation Figure 2 plots theConsumer Price Index (CPI) inflation rates for the United States with major oildates indicated as vertical lines Figure 2 shows that indeed events such as theinvasion of Kuwait in 1990 the collapse of OPEC in 1986 or the 1999 OPECmeeting were followed by sharp if short-lived spikes in CPI inflation On the otherhand the relationship between oil price shocks and CPI inflation is not as apparentas one might have expected Some oil dates such as the outbreak of the Iran-Iraqwar in 1980 seem to have had little impact on CPI inflation and others such as theoutbreak of the war in Afghanistan in 2001 and of the Iraq war of 2003 werefollowed by a fall in consumer prices1
Conversely several large spikes in the CPI inflation rate are clearly unrelatedto oil events Indeed the largest spike in monthly CPI inflation occurred in August1973 well before the October 1973 war which by most accounts was unanticipatedThe strongest case for a relationship emerges from focusing on medium-termtrends in inflation In particular the period of sustained high inflation in the 1970sincluded two major oil events which has given credence to the notion that both theeconomic stagnation and the high inflation rates of the 1970s were related to oilprice shocks The next section will review the explanations that have been proposedfor such a relationship
How Oil Price Shocks May Affect the Macroeconomy
To the extent that disturbances in the oil market do have a causal effect onoutput prices and productivity through what channels do they operate Below wewill discuss a number of mechanisms that might provide a causal link from oilprices to recessions inflation and economic growth
1 In the case of the Iraq war of 2003 it may be argued that the war was well anticipated causing the priceof oil and hence the inflation rate to spike before the outbreak of hostilities The observed spike in CPIinflation is not large however by historical standards
Table 2Growth in Total Factor Productivity and the Real Price of Oil Imports
1950ndash1959 1960ndash1973 1974ndash1985 1986ndash2001
Real price of oil 2047 1772 4342 2082TFP growth (percent) 199 118 031 134
Source FRED The productivity series is annual multifactor productivity in the private manufacturingsector The oil price data are constructed as in Barsky and Kilian (2002) The oil price index has beendeflated by the US GDP deflator and expressed in 2000 dollars
118 Journal of Economic Perspectives
How Oil Price Shocks May Cause RecessionsSuppose gross output Y is given by the production function Y Q[K L O]
where O L and K denote the quantities of imported oil labor and capital servicesA key insight that recurs in the literature on oil and macroeconomics is that themagnitude of the effect of an oil price shock on gross outputmdashholding L and Kconstantmdashmust be small A 1 percent reduction in oil usage reduces grossoutputmdashto a first-order approximationmdashby a percentage amount correspondingto the cost share of oil This share of oil in output is thought to be no larger than4 percent and may be much smaller With a unit elasticity of substitution betweenoil and value added a 10 percent increase in oil prices for example will result ina less than 05 percent reduction in gross output (Rotemberg and Woodford1996) Empirically increases in oil prices appear to raise the share of oil in outputThis implies that the elasticity of substitution must be less than unity suggestingthat the actual drop in gross output is even smaller
The corresponding effect of an oil price shock on value added in contrast isless clear Suppose for example that Y Q[V(K L) O] where V(K L) isdomestic value-added (which may be thought of as real GDP) Then under perfectcompetition there will not be a direct effect of an oil price shock on value addedat all because changes in the quantity of oil do not shift the demand curve for laborand capital services as a function of the wage and rental rates measured in terms ofvalue added This benchmark result is weakened somewhat if we drop the assump-tion of perfect competition and allow for a fixed mark-up Under mark-up pricing
Figure 2Monthly CPI Inflation Rates and Oil Dates 19713ndash20043
5
10
0
5
10
15
20
25
30
1975 1980 1985 1990 1995 2000
Perc
ent
Octoberwar1973
Iranianrevolution
1979
Iran-Iraqwar1980
OPECcollapse1986
Kuwaitinvasion1990
OPECmeeting
1999AfghanWar2001
IraqWar2003
Source Federal Reserve Economic Database (FRED)
Oil and the Macroeconomy since the 1970s 119
an oil price increase does lower factor demand because firms apply the mark-up toall cost components including imported oil not just to capital services and labor(Rotemberg and Woodford 1996) The magnitude of this effect on value addedhowever is likely to be small for reasonable mark-up ratios unless we allow inaddition for substantial changes in the mark-up over time The latter possibility isdiscussed by Rotemberg and Woodford (1996) who present a model involvingimplicit collusion between oligopolists in the goods market that can yield outputresponses to an oil price shock that are quantitatively important though highlydependent on the particular setup
Another way of undermining the benchmark result is to allow for capital-energy complementarities in production In the presence of capital-energy comple-mentarities one would expect an oil price increase to lower real GDP by loweringthe demand for capital services For example it is sometimes claimed that the risein energy prices during the 1970s made part of the existing energy-intensive capitalstock obsolete causing a reduction in output without any apparent change inmeasured capital inputs If true this economic depreciation of capital should bereflected in lower prices for used equipment There is however no real empiricalsupport for this notion For example Hulten Robertson and Wykoff (1989) foundthat the price of used equipment did not change much after the 1973 oil shock andthat the price of energy-intensive equipment actually increased in some cases Theobsolescence hypothesis was also rejected by Bohi (1991) who found no relation-ship between the energy intensity of industries and their output and employmentchanges following the oil price shocks of the 1970s Moreover to the extent that oldenergy-inefficient capital depreciates one would expect increased investment innew energy-saving equipment that will offset at least in part the recessionary effectsof the oil price shock
Another potential channel of transmission is the transfer of wealth involved inpaying higher oil import bills The total wealth transfer from the industrializedcountries to the oil-producing countries however will tend to be small given thesmall expenditure on foreign oil relative to GDP Olson (1988) computes estimatesof the extra import costs of about 1 percent of GDP for 1974ndash1978 and for1982ndash1985 and of about 2ndash3 percent for 1979ndash1981 Further the reduction inaggregate demand due to the wealth transfer occurs only to the extent that oilproducers have a lower propensity to purchase industrial countriesrsquo output thandomestic consumers
In response to the difficulties with the preceding theoretical arguments theliterature has shifted toward indirect effects set in motion by the response ofeconomic agents to the higher price of oil We already mentioned models withtime-varying mark-ups (Rotemberg and Woodford 1996) Another model thatexplains how an oil price shock may lower real GDP is the sectoral shifts model ofHamilton (1988) The principal propagation mechanism in this model is that an oilprice increase will depress purchases of energy-using goods such as automobilesThe dollar value of such purchases may be large relative to the cost of gasoline Theshift in demand causes reallocation of labor across sectors If the movement oflabor is costly potentially large reductions in value added may result One impor-
120 Journal of Economic Perspectives
tant implication of this model is that the response of output should be symmetricwhether the price of oil increases or decreases For example the predicted rise inunemployment following the oil price increase of 1979ndash1980 and that following thecollapse of OPEC prices in 1986 should have been about the same given thesimilarity of the overall magnitude of these oil price shocks Clearly however therewas no increase in unemployment in 1986 casting doubt on the realism of thismodel
A related channel has been discussed by Bernanke (1983) who shows in apartial equilibrium model that oil price shocks will tend to lower value addedbecause firms will postpone investment as they attempt to find out whether theincrease in the price of oil is transitory or permanent Gauging the importance ofsuch indirect effects of oil on output is far less straightforward than the correspond-ing exercise for the direct effects Yet there is evidence that the ldquowaitingrdquo effectdiscussed by Bernanke (1983)mdashif it existsmdashis small relative to the apparent mag-nitudes that need explanation
The upper panel of Figure 3 plots monthly auto sales (millions of units sold)in the United States The oil dates are imposed as vertical lines and indicate periodsof large increases in uncertainty about the price of oil If uncertainty is an impor-tant channel by which oil price shocks cause recessions we would expect to see asharp drop in sales of energy-using durables such as cars after each major oil pricechange Although there is some evidence that car sales fell after the shocks of 19741979 and 1990 the drops are rather small by historical standards and occur onlygradually Moreover in each case they merely represent the continuation of adecline that started well before the oil date For example car sales in the UnitedStates had peaked nearly a year before the October 1973 war They also peaked wellbefore the Iranian revolution and the invasion of Kuwait In some cases there is noevidence at all of a decline in car sales notably in the year following the 1980 and1999 oil dates Nor was there a change in trend after the 2001 and 2003 oil datesFinally in the year following the collapse of OPEC in 1986 car sales on averageincreased This finding suggests that the negative effect on car sales of the increaseduncertainty about oil prices in 1986 must have been small relative to the directpositive effect of lower oil prices Thus the evidence that oil price shocks operatevia a reduction in demand for durables such as cars is weak The data cast doubtboth on the importance of the Bernanke (1983) uncertainty effect and on theHamilton (1988) model that relied on reductions in the demand for consumerdurables such as cars2
2 An alternative approach is to use the volatility of oil prices as a proxy for uncertainty A more formalanalysis shows that there typically is an increase in oil price volatility following the oil dates but oftenwith a substantial delay The formal volatility measure that we used is the conditional variance of thepercentage change of the nominal oil price It was computed based on the fitted values of a generalizedautoregressive conditional heteroskedasticity model There is some evidence that increases in oil pricevolatility in 1973ndash1974 1979ndash1980 and 1990ndash1991 may have been associated with subsequent declinesin car sales but the lags are long and variable There are no sudden and sharp drops as one might haveexpected based on the Bernanke (1983) model Moreover it is not clear to what extent these declinesare a cause of the recession or an effect
Robert B Barsky and Lutz Kilian 121
Other evidence paints a similar picture The bottom panel of Figure 3 focuseson a broader measure of monthly real consumption of durables The qualitativeconclusions are the same as for car sales There is no evidence of sharp drops inconsumer spending after oil dates In fact durables consumption appears largelystable after the 1973 and 1979 oil dates It actually increases after the 1980 19861999 2001 and 2003 dates Only in 1990 is there evidence of a slight decline afterthe oil date
Similar results hold if we focus on the investment decisions of firms Figure 4shows the corresponding data for real fixed nonresidential investment and realinvestment in equipment and software Neither series shows a sharp drop after oildates as one might have expected in response to an increase in uncertainty Evenaccounting for the long-run trend in investment these aggregate data provide nosupport for the notion that increased uncertainty leads to a sharp fall in investmentthat in turn contributes to a recession
Yet another line of reasoning as to why oil price shocks may have indirecteffects has focused on the monetary policy response to oil price shocks Forinstance Bohi (1989) and Bernanke Gertler and Watson (1997) have investigatedthe possibility that the 1974 recession may be understood as a consequence of the
Figure 3Oil Price Uncertainty and Real Consumption of Durables 19713ndash20037
6
8
10
12
14
16
1975 1980 1985 1990 1995 2000
Mill
ion
s
0
200
400
600
800
1000
1975 1980 1985
Real durables consumption
Auto sales in the United States
1990 1995 2000
Bill
ion
s of
200
0 do
llars
Octoberwar1973
Iranianrevolution
1979 Iran-Iraqwar1980
OPECcollapse1986
Kuwaitinvasion1990
OPECmeeting
1999
AfghanWar2001
IraqWar2003
Octoberwar1973
Iranianrevolution
1979
Iran-Iraqwar1980
Kuwaitinvasion1990
OPECcollapse1986
OPECmeeting
1999
AfghanWar2001
IraqWar2003
Source Federal Reserve Economic Database (FRED) Department of Energy and BEANotes Oil dates have been imposed as vertical lines
122 Journal of Economic Perspectives
Federal Reserversquos policy response to the inflation triggered by an oil price shockThe output effect arises in this view because the Fed responds to evidence of risinginflation with a monetary tightening thereby inducing a recession Whether mon-etary policy actually did respond to oil price shocks in this way continues to be amatter of debate For example in the 1973ndash1974 episode the monetary tighteningstarted eight months prior to the 1973 oil date (for example Bernanke and Mihov1998)
A second indirect monetary effect on output is due to the ldquowage-price spiralrdquowhich occurs if nominal wages are set in line with past price increases while pricesare set in line with past wage increases In this setting an initial inflationary shockdue to oil may be propagated if wage increases are accommodated by the centralbank To the extent that the real wage is prevented from falling a decline in valueadded will be required in response to an oil shock (Bruno and Sachs 1985)Although this explanation is popular empirical studies suggest that US real wagesactually did fall in response to higher oil prices (Bohi 1989 1991 Keane andPrasad 1996 Rotemberg and Woodford 1996) Even for Europe and Japan thereis at best limited support for this explanation Thus again the case that oil priceshocks create recessions is weak
Figure 4Oil Price Uncertainty and Real Investment Quarterly 1971Indash2003IV
200
0
400
800
600
1000
1200
1400
1975 1980 1985 1990 1995 2000
0
200
400
600
800
1000
1975 1980 1985
Real investment in equipment and software
Real nonresidential fixed investment
1990 1995 2000
Bill
ion
s of
200
0 do
llars
Bill
ion
s of
200
0 do
llars
Iranianrevolution
1979
Kuwaitinvasion1990
OPECmeeting
1999
AfghanWar2001
IraqWar2003
Octoberwar1973
Iranianrevolution
1979
Iran-Iraqwar1980
Octoberwar1973
Iran-Iraqwar1980
Kuwaitinvasion1990
OPECcollapse1986
OPECcollapse1986
OPECmeeting
1999
AfghanWar2001
IraqWar2003
Source Federal Reserve Economic Database (FRED)Notes Oil dates have been imposed as vertical lines
Oil and the Macroeconomy since the 1970s 123
How Oil Price Shocks May Affect InflationTheories that can explain how oil might cause a recession still do not in
general generate stagflation a phenomenon especially important for understandingthe historical experience of the 1970s Thus it is important to address the addi-tional role of oil price shocks if any in explaining inflation Interestingly theexisting literature has focused on the effect of oil price shocks on aggregate outputand left unchallenged the common notion that oil price shocks are by necessityinflationary Recently Barsky and Kilian (2002) using an illustrative example thatbuilds on Gordon (1984) and Rotemberg and Woodford (1996) have verified thatan oil price shock indeed is unambiguously inflationary for the price of grossoutput Hence following an oil price shock one would expect stagflation in theform of a decline in industrial production and increased inflation in the CPI Thesame model however also implies that there is no theoretical presumption that theGDP deflator would increase in response to an oil price shock although it mightunder certain conditions This analysis is important because it explains importantdifferences between the observed response of CPI inflation and of inflation in theGDP deflator to oil price shocks
Of course in principle a more complicated theoretical modelmdashinvolving saymark-ups and wage-price interactionsmdashcould deliver an unambiguous increase inthe GDP deflator in response to an oil price shock It is important however not tolose sight of the fact that there is no convincing empirical evidence that oil priceshocks are associated with higher inflation rates in the GDP deflator There isstrong evidence only of sharp changes in the CPI inflation rate following major oilprice changes (Barsky and Kilian 2002)
How Oil Price Shocks May Affect Economic GrowthOil price shocks may also have long-term consequences for economic growth
Notably the rise in the price of oil in 1974 has been blamed for the productivityslowdown which is often dated as beginning in 1973 (although there is a case thatit began earlier perhaps in the late 1960s as discussed in Hansen 2001) Therelationship between oil price increases and changes in total factor productivity wasexplored extensively in the Fall 1988 ldquoSymposium on the Productivity Slowdownrdquo inthis journal Olson (1988) in that issue concluded that ldquothe evidence has not beenkindrdquo to oil-based explanations of the productivity slowdown The fundamentalproblem is that the cost of energy is too small a part of GDP to explain theproductivity slowdown Olson quantified the US productivity losses that may beattributed to substitution away from oil and concluded that they were much toosmall to explain the productivity slowdown He also noted that the opportunitiesfor substitution were sharply limited during the initial years following the 1973 oilprice shock This view is now widely accepted
In response some economists have focused on alternative channels of trans-mission that operate through some other variable with important effects on pro-ductivity One possibility is that energy-inefficient capital was made obsolete byhigher oil prices resulting in an unmeasured decline in the capital stock whichwould look like a decline in productivity in the data As we have discussed earlier
124 Journal of Economic Perspectives
there is no empirical support for that notion Although a number of additional andmore elaborate arguments have been advanced that in principle might establish alink from oil prices to productivity changes none of these models can claim solidempirical support
Where Do Oil Price Shocks Come From
Conventional wisdom suggests that major increases in the price of oil tend tobe driven by exogenous political events in the Middle East Even if we accept thenotion that turmoil in the Middle East may cause sharp increases in the price of oilhowever recent history demonstrates that Middle East disturbances do not neces-sarily raise the price of oil and that major oil price increases may occur even in theabsence of such shocks For example the increase in the real price of oil betweenMarch 1999 and November 2000 was certainly a major one but during that periodmilitary conflicts in the Middle East were conspicuously absent Even more difficultto explain for adherents of the conventional view is the fact that after November2000 the oil price fell despite Middle East turmoil and the high likelihood thatmost of Iraqrsquos oil exports would remain off global markets on top of low invento-ries that were further strained by one of the coldest winters in recent memoryNeither the terrorist attacks of September 11 2001 nor the outbreak of the war inAfghanistan and the stocking up of the US Strategic Petroleum Reserve couldstem the decline in crude oil prices in 2001
Many observers would be willing to concede that major movements in oilprices are possible even in the absence of exogenous political shocks but wouldargue that the 1999ndash2000 oil price increase must have been engineered by theOPEC oil cartel This interpretation begs the question of how this cartel suddenlyacquired new powers in March 1999 having been unable to force a sustainedincrease in oil prices since 1986 and how the same cartel just two years later seemedto be on the verge of collapse It seems implausible that the Mexican oil ministerby his eloquence alone in 1998 managed to unify a cartel that had steadily lostinfluence since 1986 Nor is it obvious why those rhetorical powers failed the oilminister in 2001 There have been many OPEC meetings since 1986 but only theMarch 1999 decision was followed by a sustained increase in oil prices Clearly ittakes more than a cartel meeting to drive up prices What then was different about1999ndash2000 One plausible answer is that OPEC decisions are far from exogenousand in fact respond to global macroeconomic conditions
The Role of CartelsThe view that worldwide demand for oil is essential in understanding oil prices
does not imply that OPEC was inconsequential A key channel that links the stabilityof oil cartels to macroeconomic forces is described in standard theoretical modelsof cartels such as Rotemberg and Saloner (1986) and Green and Porter (1984)Producers trade off the immediate gains from abandoning the cartel against thepresent value of the future cartel rents foregone This logic suggests that all else
Robert B Barsky and Lutz Kilian 125
equal unusually low real interest rates as in the 1970s should be conducive to theformation of cartels and that high real interest rates should be detrimentalFurthermore the work of Green and Porter implies that the ability of cartels tokeep prices high will be procyclical if producers are unable to tell whether othercartel members are cheating by exceeding their production quota More specifi-cally in times of unexpectedly low demand when prices fall below a trigger pointcartel members will choose to flood the market with their output The assumptionof imperfectly observable output is particularly appealing for crude oil producersThe actual production level of crude oil can only be estimated in many cases andreliable output statistics become available at best after a long lag Thus strongeconomic expansions all else equal should strengthen oil cartels and majorrecessions weaken them3
This model helps to explain the surplus production of oil following the Asiancrisis of 1997ndash1998 as well as the apparent success of OPEC during 1999ndash2000Although real interest rates were not unusually low by historical standards over thelatter period cumulative GDP growth in the United States was extraordinarilyhighmdashhigh enough to offset the less-than-stellar growth performance of Europeand Japan The same economic theory suggests that (all else equal) a pendingrecession should undermine the stability of OPEC As Figure 1 shows the turningpoint for oil prices indeed occurred as the first signs of a possible US recessionemerged in late 2000 Within weeks the oil price began to slip and its fallaccelerated throughout 2001 Shortly thereafter the New York Times referred to theprospect of a devastating price war (Banerjee 2001) as OPEC was unable toenforce its goal of a major cut in oil production in the face of falling demand Thisanalysis does not deny the importance of political efforts aimed at strengthening orsustaining the oil cartel rather the point is that such activitiesmdashunlike warsmdasharenot exogenous and that the sustainability of cartels will be determined to animportant extent by the macroeconomic environment
The above discussion abstracts from international features of the oil market Afurther element in OPECrsquos price decisions is likely to be the exchange rate of thedollar vis-a-vis other major currencies Indeed the depreciation of the dollar was animportant element in OPECrsquos justification for higher oil prices in the 1970s (forexample Terzian 1985) To the extent that the dollar depreciates with respect toEuropean or Japanese currencies goods denominated in those currencies becomemore expensive and there will be an incentive to make up for the loss in OPECpurchasing power by increasing the price of oil in dollar terms At the same timea weaker dollar also will tend to stimulate demand for oil in the rest of the worldthereby strengthening the cartel and driving up the price of oil
3 Rotemberg and Saloner (1986) in sharp contrast to Green and Porter argue that cartels should breakup in booms That conclusion is not empirically supported for the oil market however and indeeddriven by the counterfactual assumption of perfectly observable output
126 Journal of Economic Perspectives
The Role of Major Political Events in the Middle East An OverviewOnce one accepts that the 1999ndash2000 tripling of oil prices was not caused by
exogenous political events in the Middle East the question arises naturally to whatextent previous oil price increases were perhaps driven by the same endogenousforces It is useful to start with the anatomy of major oil price increases It is widelybelieved that sudden and large changes in the price of oil tend to be caused byunpredictable exogenous political events in the Middle East that represent shifts ofthe supply curve for oil Often these ldquoshocksrdquo are associated with military eventssuch as the outbreak of wars Figure 5 shows the percentage change in the nominalprice of oil since March 1971 when US oil production reached full capacity andthe United States became dependent on foreign oil Episodes of major wars ormajor civil unrest are indicated by vertical bars and include the October war of1973 the Iranian revolution in late 1978 the outbreak of the Iran-Iraq war in late1980 the invasion of Kuwait in 1990 the start of the war in Afghanistan in October2001 and of the war in Iraq in March 2003 We also included the collapse of OPECin 1986 and the period of possible OPEC price management since March 1999 forcomparison
Clearly not all so-called oil shocks follow the same pattern For example theperiod after the October war of 1973 the period after the collapse of OPEC in late1985 and the period immediately after the invasion of Kuwait in 1990 are charac-terized by sharp spikes in oil prices The period following the Iranian revolution of1978ndash1979 and that following the 1999 OPEC meeting are in contrast character-ized by relatively small but persistent positive rates of change Nor are the 2001 and2003 wars associated with sharp spikes in oil prices These differences suggest
Figure 5Percentage Change in the Nominal Price of Crude Oil Imports 19713ndash200312
40
30
20
50
0
10
10
30
40
20
50
1975 1980 1985 1990 1995 2000
Perc
ent
Octoberwar1973
Iranianrevolution
1979
Iran-Iraqwar1980
OPECcollapse1986
Kuwaitinvasion1990
OPECmeeting
1999AfghanWar2001
IraqWar2003
Source See Figure 1
Oil and the Macroeconomy since the 1970s 127
important differences in the genesis of these oil events For example the casualobserver would be led to conclude that the 1999ndash2000 increase in oil prices is muchmore akin to the 1979ndash1980 increase than to the 1973ndash1974 or the 1990 episode
We conclude that there may have been many plausibly exogenous politicalevents in the Middle East but the magnitude and pattern of the subsequentchanges in the price of crude oil varies greatly Thus it is far from obvious what theprecise channel is by which exogenous events affect the price of oil and whetherthere is a link at all This is the question we turn to next
The Role of WarsIt may seem that wars in the Middle East are natural candidates for inducing
major changes in oil prices but this link is far from obvious A perhaps simplisticview is that oil price shocks reflect shocks to the supply of oil in the form ofinterruptions of the production (or shipments) of crude oil from the Middle EastAs we will show this interpretation is difficult to sustain A more sophisticated viewis that in response to wars or the threat of war in the Middle East there will be anincrease in precautionary demand for oil which may cause sharp increases in theprice of oil when the supply of oil is inelastic as is especially likely in times ofcapacity constraints In this latter interpretation wars shift the demand for oilrather than the supply of oil Demand for oil shifts because oil consumers attemptto stockpile oil when they feel that the likelihood of a major oil supply interruptionhas increased This second explanation may help explain seeming discrepancies inthe timing and in the magnitude of the oil price shock Its main limitation is thatthe effect depends on largely unobserved shifts in expectations
A first way of seeing that the oil supply shock view must be missing somethingimportant is to note that supply cuts of similar magnitude seem to have had verydifferent effects on the price of oil For example although the case for anexogenous production cut following the outbreak of the Iran-Iraq war in late 1980is strong the data in Figures 1 and 5 reveal that the apparent effect on the price ofoil was quite small compared to the effect of the invasion of Kuwait This seemsrather curious given that the magnitudes of the production cuts were almost thesame with a 72 percent and 88 percent drop relative to pre-war levels respectively(Hamilton 2003)
A second reason to doubt the oil supply shock view is the timing of some majoroil price increases and commonly cited political events For example most of the1979 increase in the price of oil occurred more than half a year after the Iranianrevolution broke out (but before the outbreak of the Iran-Iraq war in late 1980)Thus the exogeneity of the production cut during the revolution is not in doubtbut the extent to which the observed temporary production cut after October 1978is actually related to the rapid oil price increases after May 1979 is not clear
Even more curious is the fact that this particular oil price increase in 1979ndash1980 very much unlike the sharp oil price spike following the 1990 war occurredin the form of small but persistent price increases extending over a period ofalmost two years It is unclear why the typical response of oil prices to a productioncut should look so qualitatively different when the nature of the shock is presum-
128 Journal of Economic Perspectives
ably identical and why these increases only occurred when Iran had resumed oilexports
This evidence argues against the existence of a mechanical link betweenwar-induced cuts in oil supplies and the price of oil Instead the effect of a supplycut will depend very much on the response of other suppliers of oil (includingSaudi Arabia as the country with the most spare capacity) and on demand condi-tions in the oil market reflecting both the overall macroeconomic environment inthe world and the degree of anxiety of oil consumers about future suppliesMoreover increased uncertainty about future oil supplies may shift the price of oileven in the absence of a war-induced production cut A case in point is the 2003Iraq war The 2003 Iraq war unlike many of the other events in Figure 5 was clearlyanticipated By definition at the time of the oil price increase no war-relatedproduction cutbacks had occurred (nor was there significant damage to oil facilitiesduring the war) Thus all of the observed oil price increase may be attributed touncertainty Comparing oil price data in the summer of 2002 (when the possibilityof a war was first openly discussed) to the price in March 2003 right beforehostilities broke out suggests an uncertainty premium of about $5 or $6 per barrelThis is roughly the same amount by which the price fell after the war had ended
Of course increased fears about future oil supplies may arise from events otherthan the threat of war in major oil producing countries in the Middle Eastmdashanyevent with adverse effects on the political stability of these countries could generatesuch fears Arguably conflicts such as the terrorist attacks of September 11 2001the war in Afghanistan the 1982 invasion of Lebanon by Israel and subsequentclashes with Syria or the Palestinian uprising in Israel and its occupied territories allhave repercussions for the political stability of major oil-producing nations andhence would be expected to raise the price of oil If such increases do not seemlarge as the evidence suggests this fact only reinforces our point that no automaticlink exists between political events and fears of supply interruptions As noted byMabro (1998) in the absence of taut demand conditions in the oil market politicalflare-ups are unlikely to cause dramatic shifts in the price of oil4
The Role of EmbargoesThe 1973 oil price shock took the form of a sharp spike similar to that of 1990
in magnitude At first sight this fact is suggestive of a war-based explanation butthe observed increase in the price of oil in late 1973 and early 1974 occurs only aftera delay It does not appear to be directly related to the October 1973 war nor todamaged oil facilities in that conflict In fact most countries involved in military
4 A case in point is the rise in oil prices in early May 2004 following terrorist attacks on oil facilities inSaudi Arabia As the New York Times (Sachs 2004) notes ldquoit is the combination of fears of what mighthappen and the fundamental tightness of the market that has sent prices higherrdquo The article elaboratesthat ldquowhile recent attacks on oil facilities did not do much damage traders worry that a more seriousdisruption of Middle East oil production remains possible and that it would shake the fragile stability ofthe already strained oil marketrdquo
Robert B Barsky and Lutz Kilian 129
actionmdashEgypt Jordan Syria Iraqmdashwere not even major oil producers at the time5
Rather the fall in oil supplies is mainly related to the tightening of the oil embargoimposed by Arab OPEC countries in late 1973 An embargo unlike a war is likelyto be endogenous with respect to macroeconomic conditions
The key question then is to what extent that embargo decision was driven bypolitical as opposed to economic considerations Hamilton (2003) rightly pointsout that political considerations did play some role in the embargo decision Barskyand Kilian (2002) instead stress historical and institutional evidence in support ofthe endogeneity of the 1973 embargo decision to macroeconomic conditions Inthe latter view there was no trade-off between political and economic objectives atthe time when the embargo and the associated production cuts were instituted6
Once the economic objective of a higher price of oil had been achieved in early1974 however the political objectives of the embargo were quietly discarded alongwith the embargo itself
Moreover the observed price increases for oil over that 1973ndash1974 period werenot much different from those of some industrial commodities for which politicalconsiderations can be ruled out casting doubt on the importance of the oilembargo This fact is consistent with the view that the observed spike in the priceof oil in late 1973 can be explained as the result of unique institutional features inthe oil market which led to a delayed adjustment of the price of oil to a precedingdemand boom (Barsky and Kilian 2002) If there was a component of the 1973ndash1974 oil price increase that can be attributed to the war it is likely to have beenfears about future oil supplies in late 1973 but as noted earlier those fears mustalso be viewed against the macroeconomic background of a world economy thatwas booming at that time
The Role of Global Macroeconomic ConditionsAs shown earlier neither cartel decisions nor the imposition of oil embargoes
nor the effects of political uncertainty on the price of oil are independent of globalmacroeconomic conditions Apart from their indirect effects through institutionsmacroeconomic conditions also affect the price of oil directly by shifting thedemand for oil This view has long been recognized by oil economists For examplethe survey by Mabro (1998) ldquoOPEC Behavior 1960ndash1998 A Review of the Litera-turerdquo in the Journal of Energy Literature gives considerable (favorable) attention tothe endogenous elements of oil price determination Curiously mainstream econ-omists have often been slow to embrace the notion that oil prices respond toeconomic forces as one would expect of other industrial commodity prices
The importance of shocks to the demand for oil was strikingly illustrated by the
5 Egypt Jordan and Syria were not even members of OPEC Iraqrsquos oil output amounted to about38 percent of world oil production in September of 1973 (US Energy Information Administration1994) Its share fell to 33 percent in October 1973 (covering the period during and after the war)6 This situation is not unlike that of the Spanish conquistadores who aimed to procure ships from theSpanish king to serve the double objective of finding gold and converting heathens across the AtlanticIs it reasonable to presume that the Spanish would have sailed just for the latter objective
130 Journal of Economic Perspectives
drop in the price of oil following the Asian crisis of 1997ndash1998 It also is essentialin understanding the upswing in oil prices in 1999ndash2001 as discussed earlierBarsky and Kilian (2002) suggest that some of the same forces that help usunderstand oil price movements in 1997ndash2001 also help explain the sustainedincreases in oil prices in the 1970s Unlike in the late 1990s the upward pressureon oil prices in the 1970s in this view was caused not by a shift in productivity butby worldwide monetary expansions that drove output levels above potential forsustained periods and were followed by periods of unusually low real interest ratesAs these booms gave way to recessions and increases in real interest rates oil pricesstarted falling in the early 1980s and ultimately collapsed in early 1986 despite thebest efforts of the OPEC cartel to sustain them at higher levels
Central to this demand-driven account of oil price movements is that in theshort run the effective supply curve for oilmdashwhich depends on pipelines andtanker capacity at least as much as on oil reserves in the groundmdashcan be very steepThat view is consistent with oil industry sources that suggest that the industrytended to be at capacity in times of high world economic activity In the long runhigh oil prices due to strong demand for oil stimulate an expansion of capacity Itstands to reason that the collapse of oil prices in the 1980s would not havehappened as fast as it did if the high oil price in 1974 had not induced manycountries to increase oil production Given the considerable delays in expandingoil production however the shift in the long-run supply curve did not havematerial effects on the price of oil until more than half a decade later
Are Oil Price Shocks Essential in Explaining Stagflation
We have shown that the evidence for the alleged link from oil price changes tomacroeconomic performance may have been overstated Some of our points arenew but many of the arguments have been known for years Despite the mountingevidence to the contrary the oil shock view has proved surprisingly resilientbecause of another piece of evidence thatmdashat first sightmdashappears as the ldquosmokinggunrdquo in this controversy the appearance of stagflation during the 1970s Stagflationhas been defined as a period of high unemployment in combination with risinginflation or alternatively a high level of inflation The choice of definition mattersUntil the 1970s it was commonly accepted that inflation is caused by excessdemand In its modern guise this view has been embedded in the so-calledaccelerationist Phillips curve which implies that inflation increases when theeconomy is overheated and declines when there is slack in the economy
The perception that the early 1970s unlike earlier periods were characterizedby increasing inflation in combination with unemployment in excess of the naturalrate (as is sometimes claimed even today as in Blanchard 2002 p 185) cast doubton the accelerationist model Evidence that the economy remains below potentialwhile inflation continues to rise is inconsistent with the standard accelerationistmodel of the macroeconomy and thus would seem to require a different explana-tion presumably one based on supply shocks that shift the Phillips curve This fact
Oil and the Macroeconomy since the 1970s 131
helps explain the increased focus on oil price increases as supply shifters in theearly 1970s However there never was a significant period of rising inflation alongwith excess unemployment in 1973ndash1975 Rather stagflation in the data occurredin the form of periods of slow or negative economic growth alongside high levelsof inflation Thus the data are consistent with the accelerationist model making itunnecessary to appeal to special factors such as oil shocks
Figure 6 shows quarterly data (at annual rates) for 1973I to 1975IV onunemployment the deviation of log real GDP from trend inflation in the CPI andinflation in the GDP deflator7 The unemployment rate is presented relative to therate of 55 percent which roughly corresponds to zero deviation of output from thetrend and is a plausible estimate of the natural rate of unemployment Over theperiod 1973I to 1974III the economy was in decline but unemployment was stillbelow the natural rate Inflation tended to rise over this period8 In contrastinflation tended to fall from late 1974 through the end of 1975mdashthe part of therecession in which unemployment exceeded the natural rate This behavior isstrikingly consistent with the accelerationist Phillips curve withmdashof coursemdashsomedisturbance but not one larger than is found in other historical periods9
Once it is clear that rising deflator inflation in combination with abnormallyhigh unemployment is not a strong feature of the data a definition of stagflationbased on such a pattern becomes largely irrelevant as does the demonstration thatan accelerationist model cannot account for this hypothetical pattern Our analysisalso helps us to understand the conspicuous absence of stagflationary patternsfollowing subsequent oil price shocks In fact none of the major oil price increasessince the 1980s have been associated with stagflation
Conclusion
It is commonly believed that there is a close link from political events in theMiddle East to changes in the price of oil and in turn from oil price changes tomacroeconomic performance in the United States As to the first belief we stressedthat exogenous political events in the Middle East are but one of several factorsdriving oil prices and that the effect of seemingly similar political events may differgreatly from one episode to the next in accordance with variations in demandconditions in the oil market and global macroeconomic conditions As to the
7 The deviations of output from trend were computed using the Hodrick-Prescott (HP) filter Hodrickand Prescott (1997) proposed that we view the time series for log real GDP as the sum of a cyclicalcomponent and a growth component The latter may be removed by a statistical filter that leaves anestimate of the business cycle component in the form of deviations from a smooth time trend Thedegree of smoothness may be regulated by choosing a constraint parameter We estimated the growthcomponent over 1960 to 2003 with the conventional parameter choice of 16008 The spike in CPI inflation in 1974I reflects the temporary effect of the OPEC oil price increase Thedifferential effect of the oil price increase on CPI and deflator inflation data is consistent with the theoryon the price of gross output and value added discussed previously9 For example although the increase in the deflator inflation rate slowed down considerably in 1974IVdeflator inflation started declining only in 1975I
132 Journal of Economic Perspectives
second belief we showed that the timing of oil price increases and recessions isconsistent with the notion that oil price shocks may contribute to recessions withoutnecessarily being pivotal We investigated several leading theoretical explanationsfor a contractionary effect of oil price increases but found little empirical supportfor any one explanation either because the magnitude of the predicted effect canbe shown to be small a priori or because the theory has implications that are notsupported by US macroeconomic data We also showed that oil price shocks areneither necessary nor sufficient to explain stagflation in real GDP and in theimplicit GDP deflator Thus we conclude that disturbances in the oil market arelikely to matter less for US macroeconomic performance than has commonly beenthought
y The authors thank Brad De Long Timothy Taylor and Michael Waldman for helpfulcomments Part of this paper was written while the second author was serving as an adviserto the European Central Bank The opinions expressed in this paper do not necessarily reflectthe views of the European Central Bank or its staff
Figure 6CPI Inflation Inflation in the GDP Deflator Detrended Log Real GDP and theUnemployment Rate in Excess of 55 Percent(quarterly 1973I to 1975IV)
0
1
2
3
4
11973II 1974 1974II
Unemployment rate 551975 1975II 1976
6
8
10
12
14
41973II 1974 1974II
GDP deflator inflation1975 1975II 1976
0
005
0051973II 1974 1974II
HP-detrended log real GDP1975 1975II 1976
6
8
10
12
14
41973II 1974 1974II
CPI inflation1975 1975II 1976
Source Federal Reserve Economic Database (FRED)
Robert B Barsky and Lutz Kilian 133
References
Ball Laurence and N Gregory Mankiw 2002ldquoThe NAIRU in Theory and Practicerdquo Journal ofEconomic Perspectives Fall 164 pp 115ndash36
Banerjee Neela 2001 ldquoOil Prices in Flux asOPEC Decides Against Cut in Outputrdquo New YorkTimes November 15 C1
Barsky Robert B and Lutz Kilian 2002 ldquoDoWe Really Know that Oil Caused the Great Stag-flation A Monetary Alternativerdquo in NBER Mac-roeconomics Annual 2001 B S Bernanke and KRogoff eds Cambridge Mass MIT Presspp 137ndash83
Bernanke Ben S 1983 ldquoIrreversibility Uncer-tainty and Cyclical Investmentrdquo Quarterly Journalof Economics February 981 pp 85ndash106
Bernanke Ben S and Ilian Mihov 1998 ldquoMea-suring Monetary Policyrdquo Quarterly Journal of Eco-nomics 1133 pp 869ndash902
Bernanke Ben S Mark Gertler and Mark WWatson 1997 ldquoSystematic Monetary Policy andthe Effects of Oil Price Shocksrdquo Brookings Paperson Economic Activity 1 pp 91ndash148
Blanchard Olivier 2002 ldquoComments on lsquoDoWe Really Know that Oil Caused the Great Stag-flation A Monetary Alternativersquo by Robert Bar-sky and Lutz Kilianrdquo in NBER MacroeconomicsAnnual 2001 B S Bernanke and K Rogoff edsCambridge Mass MIT Press pp 183ndash92
Bohi Douglas R 1989 Energy Price Shocks andMacroeconomic Performance Washington DC Re-sources for the Future
Bohi Douglas R 1991 ldquoOn the Macroeco-nomic Effects of Energy Price Shocksrdquo Resourcesand Energy June 132 pp 145ndash62
Bruno Michael and Jeffrey D Sachs 1985Economics of Worldwide Stagflation CambridgeMass Harvard University Press
Friedman Milton 1968 ldquoThe Role of Mone-tary Policyrdquo American Economic Review March581 pp 1ndash17
Green Edward J and Robert H Porter 1984ldquoNoncooperative Collusion under ImperfectPrice Informationrdquo Econometrica January 521pp 87ndash100
Gordon Robert J 1984 ldquoSupply Shocks andMonetary Policy Revisitedrdquo American EconomicReview May 742 pp 38ndash43
Hamilton James D 1988 ldquoA NeoclassicalModel of Unemployment and the Business Cy-clerdquo Journal of Political Economy June 963pp 593ndash617
Hamilton James D 2003 ldquoWhat is an Oil
Shockrdquo Journal of Econometrics April 1132pp 363ndash98
Hansen Bruce E 2001 ldquoThe New Economet-rics of Structural Change Dating Breaks in USLabor Productivityrdquo Journal of Economic Perspec-tives 154 pp 117ndash28
Hodrick Robert J and Edward C Prescott1997 ldquoPostwar US Business Cycles An Empiri-cal Investigationrdquo Journal of Money Credit andBanking February 291 pp 1ndash16
Hulten Charles R James W Robertson andFrank C Wykoff 1989 ldquoEnergy Obsolescenceand the Productivity Slowdownrdquo in Technologyand Capital Formation Dale W Jorgenson andRalph Landau eds Cambridge Mass MITPress pp 225ndash58
Keane Michael P and Eswar S Prasad 1996ldquoThe Employment and Wage Effects of Oil PriceChanges A Sectoral Analysisrdquo Review of Econom-ics and Statistics 783 pp 389ndash400
Mabro Robert 1998 ldquoOPEC Behavior 1960ndash1998 A Review of the Literaturerdquo Journal of En-ergy Literature June 41 pp 3ndash27
Olson Mancur 1988 ldquoThe Productivity Slow-down the Oil Shocks and the Real Cyclerdquo Jour-nal of Economic Perspectives Fall 24 pp 43ndash69
Phelps Edmund S 1968 ldquoMoney-Wage Dy-namics and Labor Market Equilibriumrdquo Journalof Political Economy Part 2 764 pp 678ndash711
Roberts John M 1995 ldquoNew Keynesian Eco-nomics and the Phillips Curverdquo Journal of MoneyCredit and Banking Part 1 November 274pp 975ndash84
Rotemberg Julio J and Garth Saloner 1986ldquoA Supergame-Theoretic Model of Business Cy-cles and Price Wars During Boomsrdquo AmericanEconomic Review June 763 pp 390ndash407
Rotemberg Julio J and Michael Woodford1996 ldquoImperfect Competition and the Effects ofEnergy Price Increases on Economic ActivityrdquoJournal of Money Credit and Banking Part 1 No-vember 284 pp 550ndash77
Sachs Susan 2004 ldquoAttacks in Mideast RaiseFear of More at Oil Installationsrdquo New YorkTimes May 8 C1
Terzian P 1985 OPEC The Inside Story Lon-don Zed books
United States Energy Information Administra-tion 1994 Historical Monthly Energy Review 1973ndash1992 Washington DC US Government Print-ing Office
134 Journal of Economic Perspectives
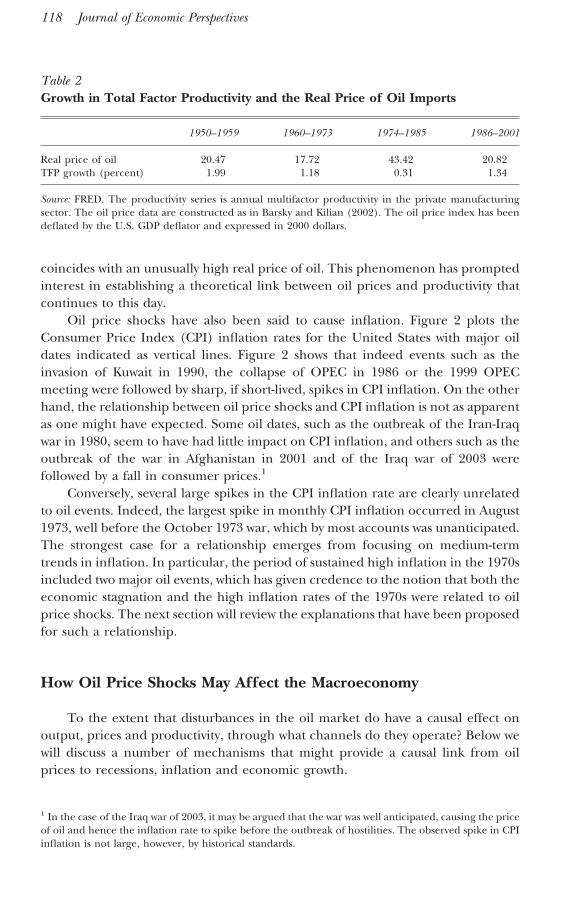
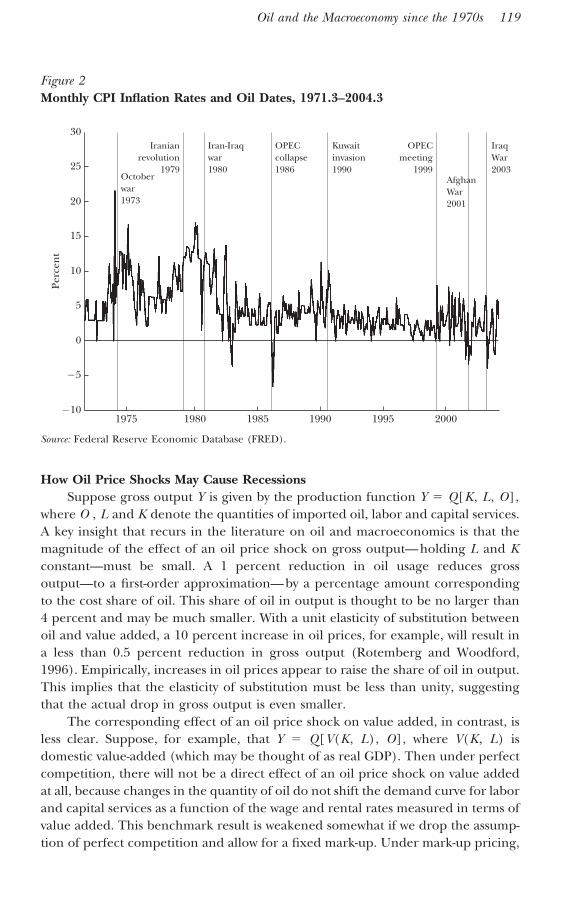
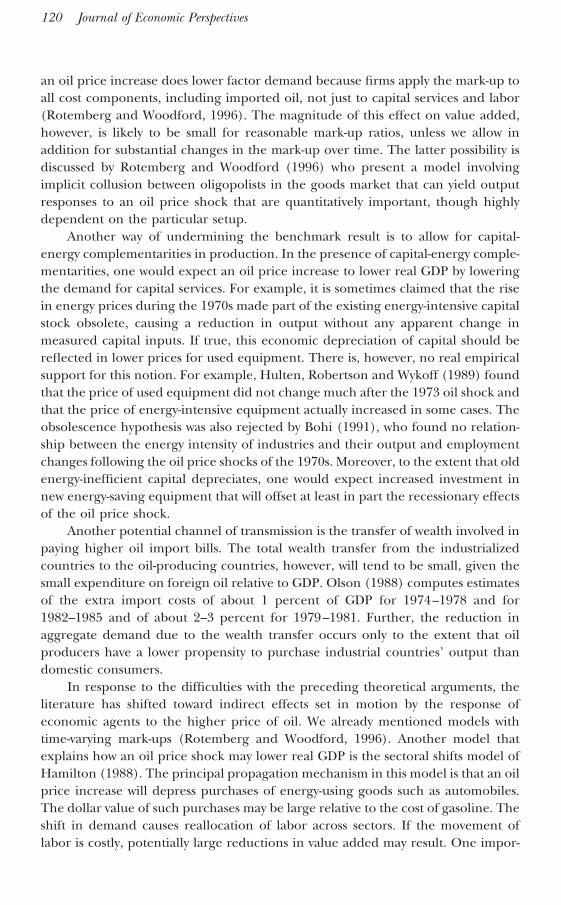
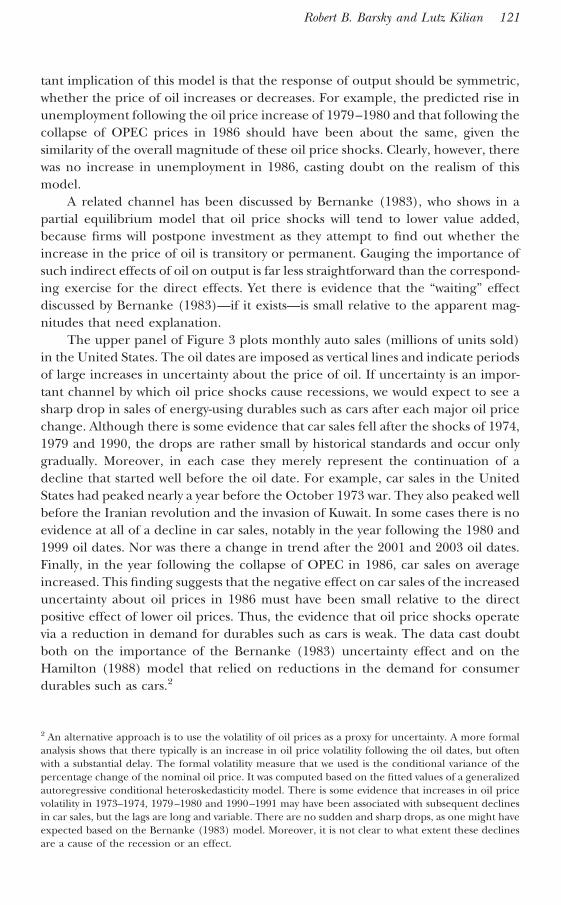
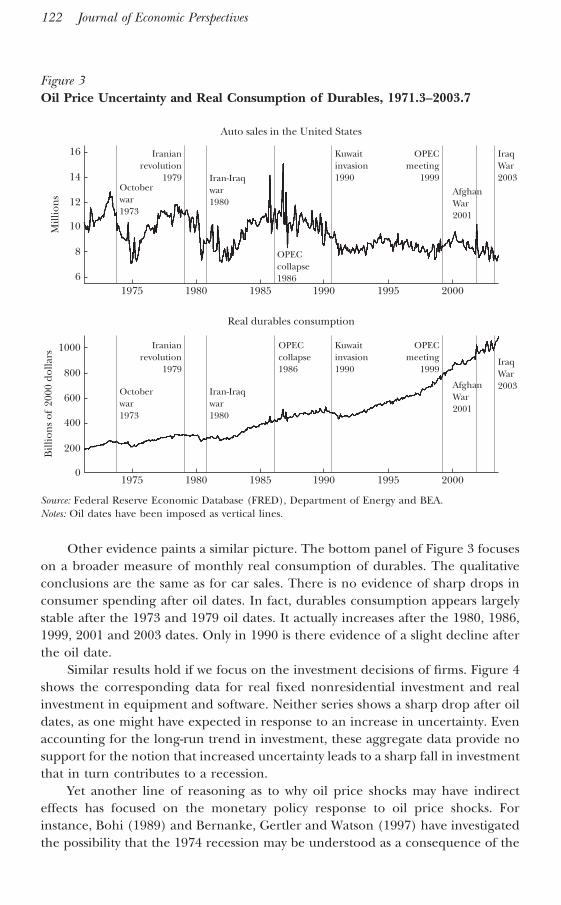
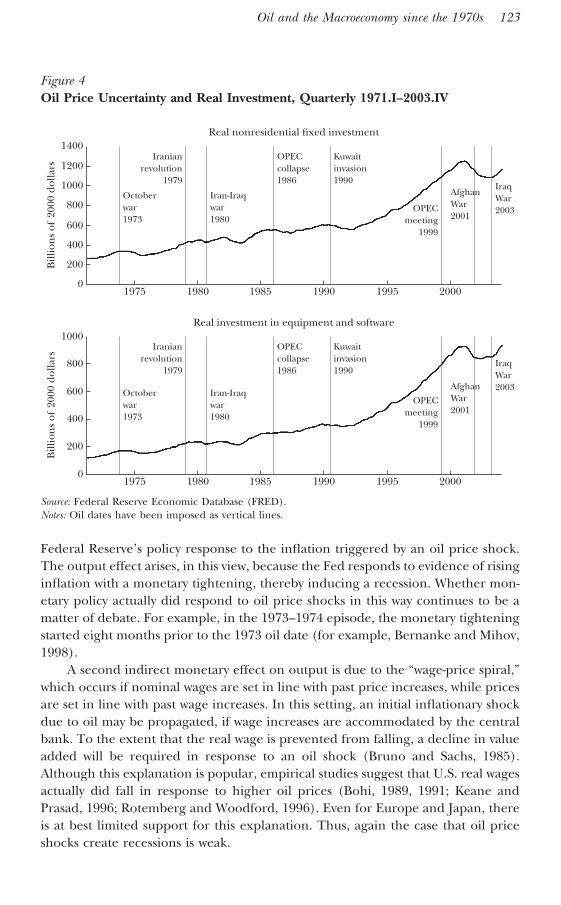
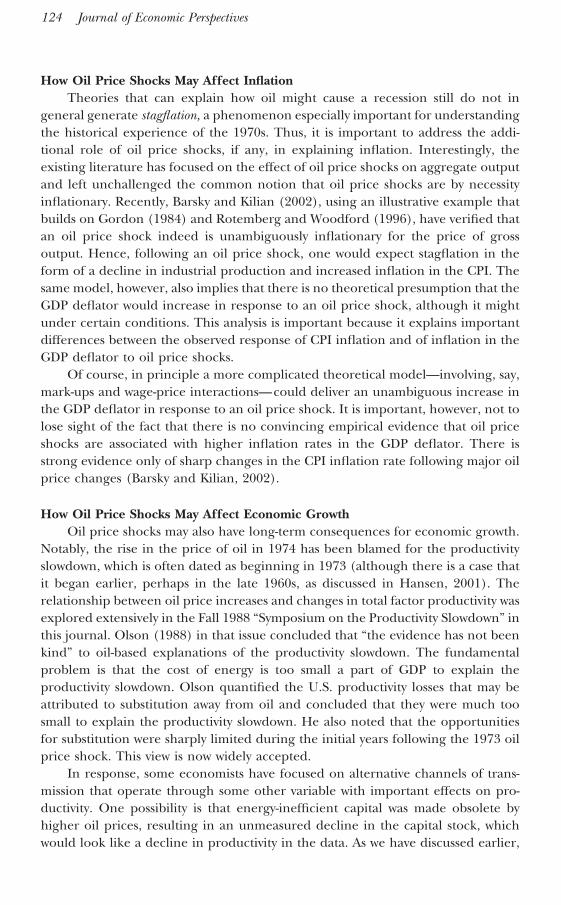
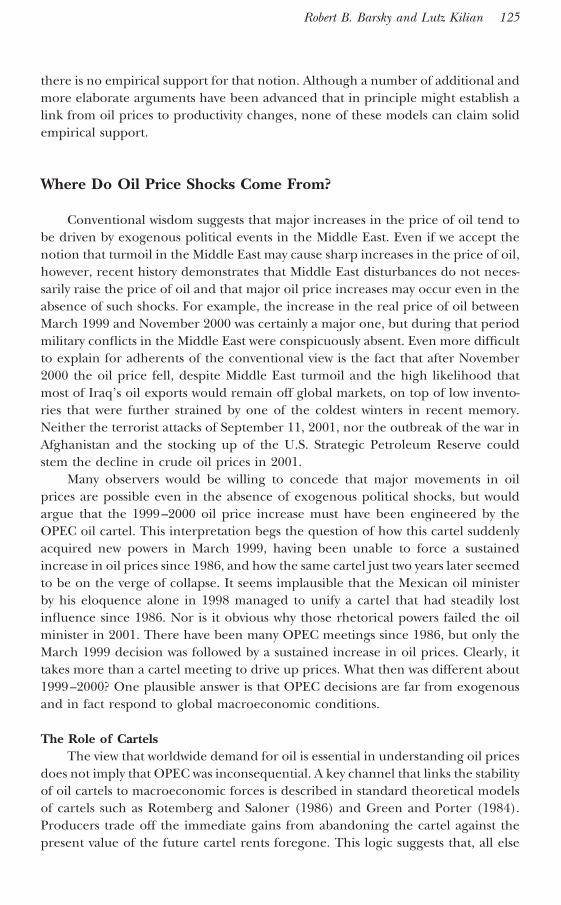
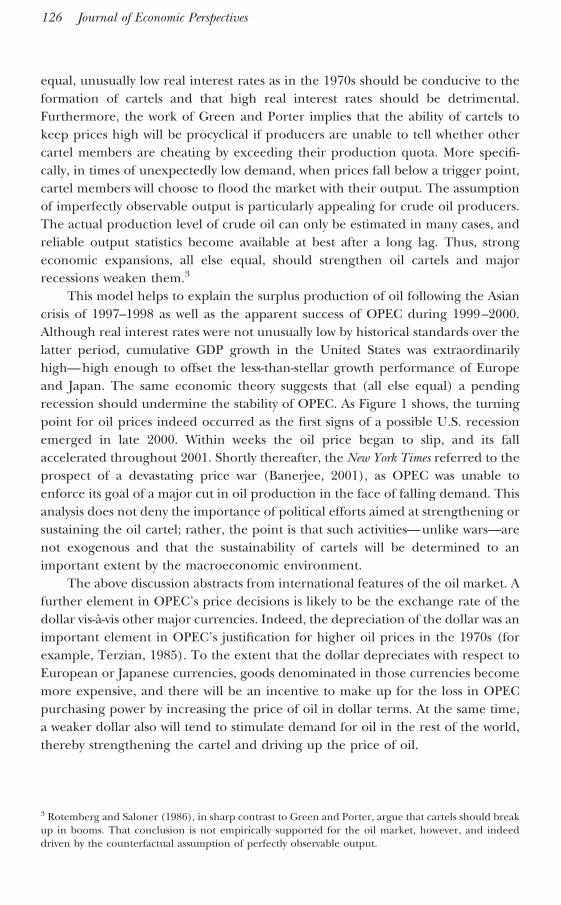
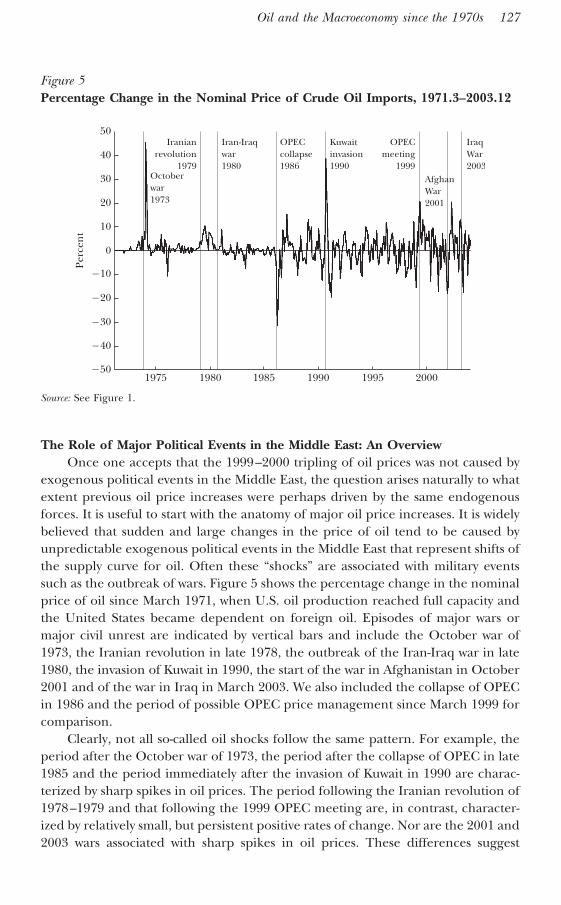
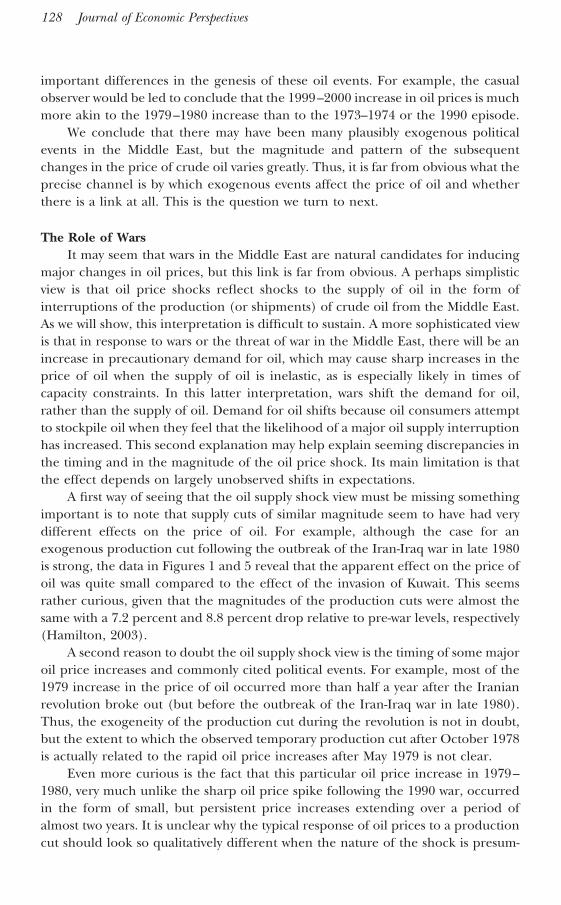
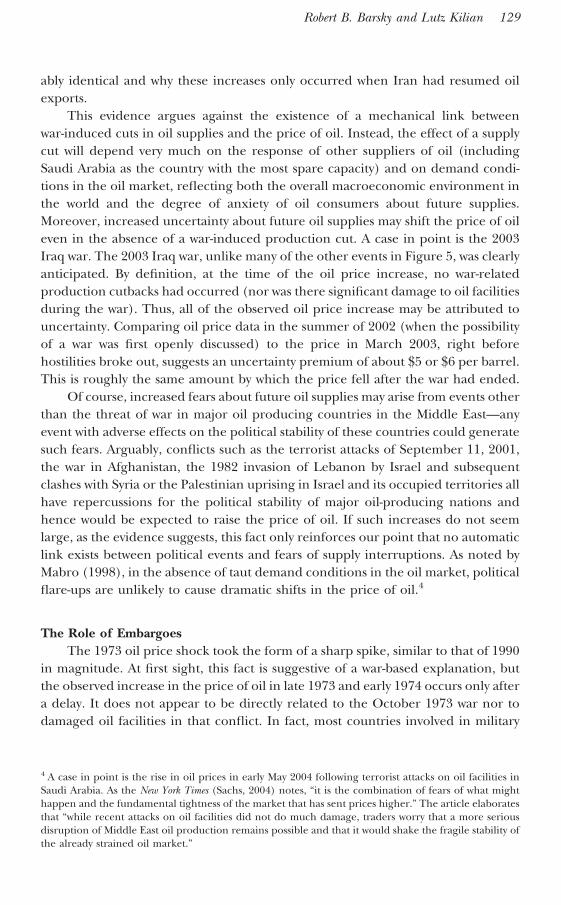
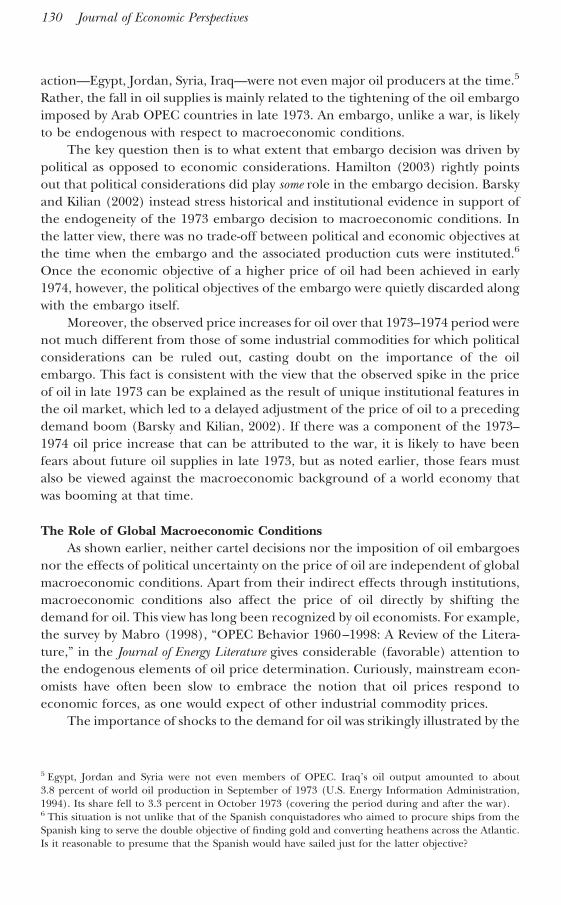
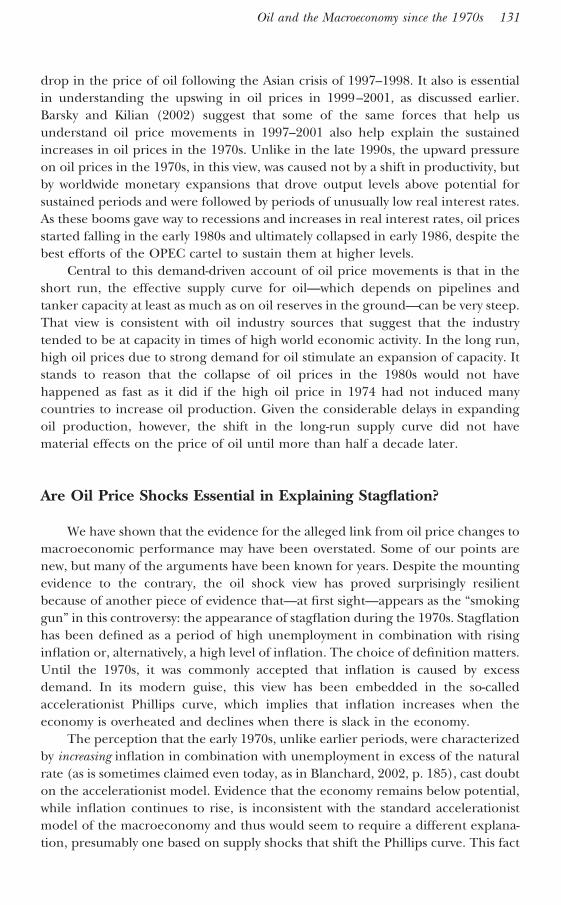
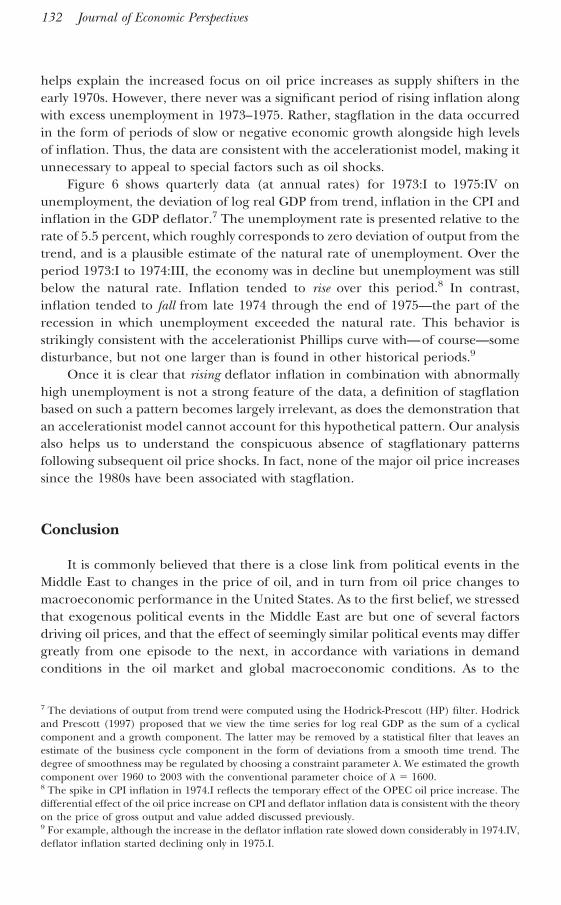
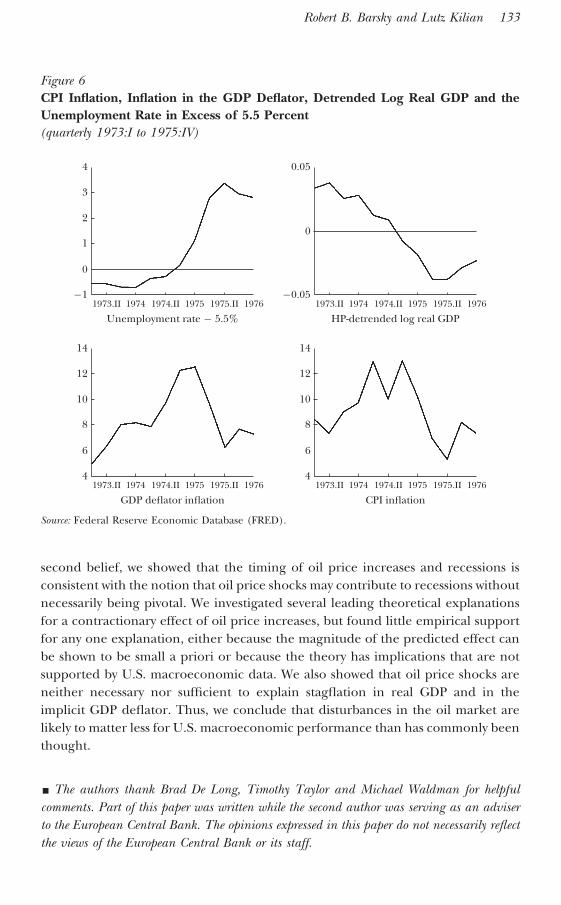