bargaining structure, wage determination, and...
TRANSCRIPT
IRLE
IRLE WORKING PAPER#47-92
August 1992
Josef Zweimuller and Erling Barth
Bargaining Structure, Wage Determination, and Wage Dispersion In 6 OECD-Countries
Cite as: Josef Zweimuller and Erling Barth. (1992). “Bargaining Structure, Wage Determination, and Wage Dispersion In 6 OECD-Countries.” IRLE Working Paper No. 47-92. http://irle.berkeley.edu/workingpapers/47-92.pdf
irle.berkeley.edu/workingpapers
eScholarship provides open access, scholarly publishingservices to the University of California and delivers a dynamicresearch platform to scholars worldwide.
Institute for Research on Labor andEmploymentUC Berkeley
Title:Bargaining Structure, Wage Determination, and Wage Dispersion in 6 OECD-Countries
Author:Zweimuller, Josef, University of California, BerkeleyBarth, Erling, University of California, Berkeley
Publication Date:08-01-1992
Series:Working Paper Series
Publication Info:Working Paper Series, Institute for Research on Labor and Employment, UC Berkeley
Permalink:http://escholarship.org/uc/item/5hk5x5hk
Keywords:Zweimuller, Barth, bargaining structure, wage determination, wage dispersion, OECD
Abstract:The paper examines the role of collective bargaining systems as a determinant of the inter-industrywage structure. It compares wage patterns of six countries: Austria, Canada, Germany, Norway,Sweden and the U.S.. We use comparable wage regressions from micro cross-sections data tocalculate inequality in pay across sectors. Our findings suggest the following: First, high (low)wage sectors in one country tend to be high (low) wage sectors in others, irrespective of the(dis)similarity in labor market institutions. Second, differences in the amount of pay inequality arelikely to be the result of differences in collective bargaining: more centralized bargaining structurestend to narrow pay differentials across industries.
Copyright Information:All rights reserved unless otherwise indicated. Contact the author or original publisher for anynecessary permissions. eScholarship is not the copyright owner for deposited works. Learn moreat http://www.escholarship.org/help_copyright.html#reuse
BARGAINING STRUCTURE. WAGE DETERMINATION.
AND WAGE DISPERSION IN 6 OECD-COUNTRIES
Josef ZWEIMULLER
University of California, Berkeley and
University of Linz, Austria
and
Erling EARTH
University of California, Berkeley and
Institute for Social Research, Oslo, Norway
August 1992
We are indebted to the Institute of Industrial Relation, UC,Berkeley for its support and hospitality. This research wassupported by the Austrian 'Fonds zur Forderung derwissenschaftlichen Forschung' under the project J0548-SOZ(Zweimiiller) and by the Norwegian NORAS under the LOS-program (Earth). We thank Bill Dickens for access to the US-CPS 1983, and Mahmood Arai for cooperation concerningSwedish data as well as Lutz Bellmann and Masao Nakamura,for regression results for Germany and Canada, repectively.
Abstract.
The paper examines the role of collective bargaining
systems as a determinant of the inter-industry wage
structure. It compares wage patterns of six countries:
Austria, Canada, Germany, Norway, Sweden and the U.S.. We
use comparable wage regressions from micro cross-sections
data to calculate inequality in pay across sectors. Our
findings suggest the following: First, high (low) wage
sectors in one country tend to be high (low) wage sectors in
others, irrespective of the (dis)similarity in labor market
institutions. Second, differences in the amount of pay
inequality are likely to be the result of differences in
collective bargaining: more centralized bargaining
structures tend to narrow pay differentials across
industries.
1. Introduction
Persistent inter-industry wage differentials are a
common phenomenon in almost all countries. Despite this
undisputed fact, however, the nature of these differentials
is still not clearly understood.
The evidence has been interpreted in support of non-
competitive theories of wage determination. Workers who move
from one industry to another face wage changes which are
comparable in size to average differentials among stayers.
(Krueger and Summers, 1988). In addition, industry pay gaps
remain, even within narrowly defined occupational groups.
(Dickens and Katz, 1987). The former observation is
inconsistent with a theory relying on unobserved
productivity as the driving force behind wage differences;
the latter rules out that (unobserved) job attributes
account for observed differentials.
Apart from efficiency wage mechanisms, alternative
approaches focus on workers' ability to extract profits from
the firm. Although these theories do not necessarily rely on
the presence of organized labor , unionism - or, more
generally, labor market institutions - should play an
important role. If the institutional environment had
sufficient explanatory power as a variable determining the
inter-industry wage structure, wage patterns should vary
systematically with differences in the systems of wage
determination.
Among the first multi-country studies of sectoral pay
variation is the paper by Lebergott (1947)2. He concludes
that rank correlations in industry wages in the 1940's were
1 Dickens (1986) puts emphasis on union threat: in order toprevent workers form unionizing, employers pay above marketclearing wages even in non-unionized industries. The powerof incumbent workers in the Lindbeck and Snower (1988) modelcomes from their ability to refuse cooperation with (or toharrass) outsiders.2 His set of countries includes Canada, the Soviet Union,Sweden, Switzerland, the U.K., and the U.S..
rather high across six different countries. More recent
evidence comes, among others, from Krueger and Summers
(1987). They find high correlations even if capitalist are
compared with communist economies, or developing are
compared with developed countries. Thus, given this
evidence, it is unlikely that institutional factors are the
underlying mechanism behind the industry wage structure.
These results, however, are based on aggregate industry
wage data, and the usual objection applies: the failure of
correcting for individual, especially labor quality
characteristics, might lead to spourious correlations. This
is because the relevant control variables are likely to be
correlated across industries as well.
In addition, the evidence, is not unambigous. Wagner
(1990) e.g. finds, that there is no case for a similarity in
the wage structure across 5 industrialized countries. He
uses standard human-capital wage equations based on micro
cross-sections data from the ISSP (International Social
Survey Programme). This is a unique multi-country data set,
based on identical questionnaires in the participating
nations, so that data between countries are quite well
comparable. The main problem of this study is the rather
small number of observations within each country, so that
the results may well be subject to sampling errors.
Another comparative study by Arai et al (1992) finds
rather high cross-national correlations. However, they focus
on the very homogeneous group of the Nordic countries, so
that it is difficult to draw general conclusions about the*
role of specific institutions on the industry wage
structure.
Even if the wage structure happens to be very similar
across countries with very different structures of
collective bargaining, we might not conclude that
institutions do not matter. This is because in many European
countries unions are organized along industry lines. They
might not determine the ranking of high versus low wage
industries, but very well the size of the pay gaps. The role
of wage negotiations is even more important since in many
European countries the outcome of wage negotiations is
extended by law to all workers . This is quite different
from the U.S. or Canada, where union density is low,
especially in the private sector; and union coverage and
union membership are basically the same thing.
Within countries with strong unions, there is an
additional dimension, which received quite a bit attention
in the literature: the degree of centralization in wage
bargaining. In a recent paper, Rowthorne (1992) showed
evidence that wage inequality decreases with the degree of
coordination among national unions. Again, this evidence is
drawn from aggregate statistics and refers to wage disperson
within the manufacturing sector only.
In the following, we will analyze empirically the
questions mentioned above: (i) the similarity of the wage
structure across countries with rather different systems of
wage determination, (ii) the effect of unionism on the
degree of wage dispersion, and (iii) the role of bargaining
centralization for distributional outcomes across
industries.
For this purpose, we present evidence from human-capital
wage equations estimated from micro cross-sections data. We
compare the inter-industry wage structure of six countries:
Austria, Canada, Germany, Norway, Sweden, and the U.S.. It
is obvious, that this set of economies is useful to address
the question of institutional influences. Austria, Norway
and Sweden are outstanding examples of corporatist
economies. German unions, although less coordinated,
negotiate labor contracts which are extended by law also to
non-union workers in the industry. The U.S. and Canada are
3 For a compact overview of institutional aspect of wagedetermination in OECD-countries see Layard, Nickell andJackman (1991) , for an extensive discussion of Europeansystems see Flanagan, Soskice and Ulmann (1983).
on the opposite side of the scale; neither is unionism very
important , nor is there any coordination: unions are
operating mainly on the firm or on the plant level.
We begin by describing the data sources in the next
section. Section 3 present the results, and section 4
concludes.
2. Data and Specifications
Table 1 displays the data sets underlying our subsequent
estimates. All surveys were collected at a roughly similar
period: the beginning of the 1980s. This is important since
wage inequality is not constant over longer periods of
time.5 In addition, all samples are of sufficient size in
order to avoid small sample errors. With the exception of
the German data set, the number of observations in Table 1
refers to male and female employees in the private, non-
agricultural sector, for which complete information on all
variables used in the subsequent regressions were
available.6
Table 1
There are, however, important differences in data sets
which limit their comparability. First, data from Germany
are for males only, and there is no information on hours of
work. Second, Austrian data report net rather than gross
earnings. Because of the progressivity of the tax system we
will underestimate true wage inequality. Third, results from
4 This is especially true for the private sector in theU.S.. Troy (1992) shows that unionism in the Canadianprivate sector follows the U.S. developments very closely.5 Davidson and Reich (1987) find that the U.S. industrystructure varies considerably over time, Pollan (1990) showssimilar evidence for Austria.6 Non-response is considerable in the Austrian sample, butunlikely to have a large effect on the estimatedcoefficients, see Zweimiiller (1992).
Canada do not allow us to disaggregate within the
manufacturing sector. Fourth, we dispose of results from
only one specification in the case of Germany, Canada and
Sweden. Due to different sample restrictions, different wage
measures and different sets of control variables these
regressions are not directly comparable.
According to these limitations we use three
specifications for the wage regressions to assess inter-
industry wage differentials:
Specification I:dependent variable:log hourly wage rate;controls: years of schooling, experience, experiencesquared, dummies for sex, race, non-manual worker, urbanarea (SMSA), and industry dummies (single dummy formanufacturing).
Specification II:dependent variable: log earnings;controls: years of schooling, experience, experiencesquared, and industry dummies (manufacturing disaggregated).(sample restricted to males only).
Specification III:dependent variable: log hourly wage rate;controls: years of schooling, experience, experiencesquared, dummies for sex and industries (manufacturingdisaggregated).
3. Results
We first present the estimates of the industry
coefficients. In all regressions the inclusion of industry
dummies significantly improved the explanatory power of the
regression. Table 2 shows the industry coefficients'
deviation from the employment weighted mean. Thus, the
numbers in Table 2 have a simple interpretation: a negative
sign indicates that the respective industry pays below
average and vice versa. The underlying results are based on
7 Full regression results are available on request from theauthors.
specification III for Austria, Norway, Sweden and the U.S.,
specification I for Canada, and specification II for
Germany. Despite the limited comparability of the data,
Table 2 gives some indication certain industries (like
Mining, Insurance-Banking) pay above average in all
countries. Retail Trade, Hotels-Restaurants and
Personal/Household Services are low-wage industries. This is
a first hint, that wage patterns are similar across
countries.
Table 2
There is considerable variation in the range of pay
differentials. E.g., the hotels and restaurants sector in
the U.S. pays 29.0 % (=l-exp(-.342)) below average, whereas
workers in the mining industry earn 37.7 % (=l-exp(.320))
more than average. This is quite different from Sweden,
where the gap ranges from - 14.0 % (=l-exp(-.151)) for
personal/household services to + 16.4 % (=l-exp(.152)) in
the insurance sector.
The get a more compact picture on the similarity in wage
patterns we calculated correlations in industry pay gaps
across the six countries (Table 3). Figures of limited
comparability, due to different underlying specifications,
are shown in parantheses. All correlations involving
Austria, Norway, and/or the U.S. were calculated from
regressions with an identical set of covariates, sample
restrictions, and earnings measure.
Table 3
Table 3 supplies two correlation measures: within each
entry in the matrix the upper figure is obtained from the
finer industry classification (manufacturing disaggregated),
the lower figure from the coarser classification. Where
necessary, industry coefficients were aggregated to the
finest common classification, using relative employment
shares as weights.
The results in Table 3 make a clear statement: the
industry wage structure is very similar across countries.
From the 25 numbers displayed in the matrix 13 are higher
than .70, and only three are lower than .50. It is also
worth noting, that the results do not change very much with
the underlying specification. Both findings suggest, that
biases from correlating aggregate industry wages are likely
to be small.
Next, we turn to the size of wage differentials (Table
4). We calculated the standard deviation of the coefficients
based on the different specifications, weighted by
employment share and adjusted for randomness of the
estimates.8 Weighting by employment shares turns out to beQ
not very important . This means that the differences in the
figures reflect differentials in pay rather than differences
in the employment structure across countries.
Table 4
Table 4 shows that there is a hugh difference in
standard deviations of industry wage differentials between
the U.S. and Canada, on the one hand, and Austria, Germany,
Norway, and Sweden on the other. Where available, the
figures turn out not to be very sensible to the choice of
specification. Canada and the U.S. have a very similar
8 Note that the estimated coefficient for industry j can bewritten as b j = 6 j+ e-j, where 6j denotes the 'true' and bjthe estimated coefficient; and ej is an error term with meanzero. Ignoring covariance terms, the variance of the 'true'industry coefficients is given by var(6) = var(b) - var(e).9 Taking simply unweighted figures generally increases thestandard deviations slightly: this stems from the fact thatin the samples very high and very low paying industries alsohave small employment shares.10 It is worth noting, that the results in Table 3 aresimilar to the findings obtained in other studies. See e.g.Winter-Ebmer (1992) for Austria, Earth and Zweimiiller (1992)
degree of wage dispersion. This reproduces the evidence
available from aggregate data (e.g. Krueger and Summers,
1987). The same holds for Germany,Norway and Sweden. With
respect to Austria, however, the evidence contradicts
aggregate statistics. The results of Freeman (1988) as well
as Rowthorne (1992) suggest an industry wage dispersion in
Austria as high as in Canada or the U.S.. In the Austrian
sample aggregate industry dispersion (i.e. the standard
deviation of coefficients obtained from a regression
including industry dummies only) is high (.17).11 The
inclusion of human capital variables and the sex-dummy,
however, decreases wage dispersion strongly.
4. Conclusions
Three conclusions arise from the analysis above: First,
rather homogenous wage patterns persist across countries,
even after controlling for labor quality. This casts doubt
that labor market institutions are the underlying force
behind the inter-industry wage structure. Not only are the
estimated correlations high, when countries with very
different systems of wage determination are compared. There
is also no evidence that the size of the correlations varies
according to the degree of similarity in the institutional
environment: according to our estimates, the correlation
between the Norwegian and Swedish wage structure is about as
high as the correlations between Sweden and the U.S..
Second, unionism and collective agreements influence the
size of wage differentials. As far as the Scandinavian
countries are concerned, this result is not surprising:
for Austria and Norway, Bellmann (1992) and Zancchi (1991)for Germany, Arai (1990) and Edin and Zetterberg (1992) forSweden, and Krueger and Summers (1988) for the U.S..11 Recall, that Austrian figures are calculated from netrather that gross figures, so that this measure is likely tobe somewhat underestimated.
here, wage solidarity has always been an important argument
in the unions' objective. In countries where basically all
workers are covered by collective labor contracts, where
unions are organized along industry lines, a strong emphasis
on wage equality in unions' demands is likely to lead to
small industry pay gaps. However, the cases of Austria and
Germany show, that this is not a necessary condition. In
Austria and Germany unions are much less concerned withi ?distributional issues.
Table 5
Third, coordination of wage bargaining, seems to be an
important determinant of industry wage dispersion. Table 5
shows the ranking various authors gave the six countries
investigated in this paper with respect to the degree of
cooperation in wage bargaining. The U.S. and Canada are
commonly ranked as the most decentralized systems, as
opposed to Austria, Norway, and Sweden which are exemplar
corporatist economies. But also in Germany, coordinated
union strategies are very common: pattern bargaining (with
the IG Metall as the leader and the remaining unions as
followers) is an important feature of the German system of
wage determination. This ranking more or less coincides with
the ranking we obtain from Table 4 with respect to the size
of industry wage differentials.
12 Small industry differentials do, of course, not mean thatwage inequality is low in general. In Austria, e.g.occupational wage differences, the gender pay gap, as wellas the dispersion in the returns to human capital is muchhigher than e.g. in Norway. (Earth and Zweimuller, 1992).
10
References
Aral, M. (1990), Industry Wage Premiums and EfficiencyWages: A Study of the Industry Wage Structure in Sweden,mimeo, University of Stockholm.
Arai, M., Asplund, R., Earth, E., and Stroyer Madsen E.(1992), Industry Wage Differentials in the Nordic Countries,mimeo, University of Stockholm.
Earth, E. and Zweimiiller, J. (1992) , Labor MarketInstitutions and the Industry Wage Distribution: Evidencefrom Austria, Norway, and the U.S., Working Paper No.39,Institute of Industrial Relations, UC Berkeley.
Bellmann, L. (1991), Effizienzlohntheorie undSektorlohndifferentiale. Eine Panelanalyse derBeschaftigtenstatistik, Institut fur Arbeitsmarkt- undBerufsforschung, Nuremberg.
Calmfors, L., and Driffil, J. (1988), Bargaining Structure,Corporatism and Macroeconomic Performance, Economic Policy6:13-61.
Davidson and Reich (1987), Income Inequality: An Inter-Industry Analysis, Industrial Relations 27:263-286.
Dickens, W.T. (1986), Wages, Employment and the Threat ofCollective Action by Workers, NBER Working Paper No.1856.
Dickens, W.T. and Katz, L.F. (1987), Industry WageDifferences and Theories of Wage Determination, NBER WorkingPaper No.2271.
Edin, P.-A. and Zetterberg, J. (1992), Inter-Industry WageDifferentials: Evidence from Sweden and a Comparison withthe United States, mimeo, Uppsala University.
Flanagan, R.J., Soskice, D.W. and Ulmann, L. (1983),Unionism, Economic Stabilization, and Incomes Policy:European Experience, Brookings Institution, Washington DC.
Freeman, R. (1988), Labor Market Institutions andMacroeconomic Performance, Economic Policy 6:63-78.
Krueger, A. and Summers, L.H. (1988), Efficiency Wages andthe Inter-Industry Wage Structure, Econometrica 56:259-293.
Krueger, A. and Summers, L.H. (1987), Reflections on theInter-Industry Wage Structure, in: Leonard, J.S. and Lang,K. (eds.), Unemployment and the Structure of Labor Markets,pp. 17-47, Basil Blackwell, New York, Oxford.
11
Layard, R., Nickell, S. and Jackman R. (1991), Unemployment.Macroeconomic Performance and the Labor Market, OxfordUniversity Press, Oxford.
Lebergott, S. (1947), Wage Structures, Review of Economicsand Statistics 29:274-285.
Lindbeck, A. and Snower, D. (198 ), Cooperation, Harassment,and Involuntary Unemployment: An Insider-Outsider Approach,American Economic Review 78:167-188.
Pollan, W. (1990), Lohnunterschiede in der Industrie, WifoMonatsberichte 11/90:616-622, Vienna.
Rowthorne, R. (1992), Centralization, Employment and WageDispersion, Economic Journal 102:506-523.
Troy, L. (1992), Convergence in International Unionism, etc.The Case of Canada and the USA, British Journal ofIndustrial Relations 30: 1-43.
Wagner J. (1990), An International Comparison of Sector WageDifferentials, Economics Letters 34:93-97.
Winter-Ebmer, R. (1992), Endogenous Growth, Human Capital,and Industry Wages, mimeo, University of Linz.
Zancchi, L. (1991), Inter-Industry Wage Differentials andInstitutional Conditions for Wage Bargaining: EmpiricalEvidence for Germany Using Microdata and a Comparison withthe U.S. and Sweden, mimeo, European University Institute,Florence.
Zweimuller, J. (1992), Survey Non-Response and Biases inWage Regressions, Economics Letters (forthcoming).
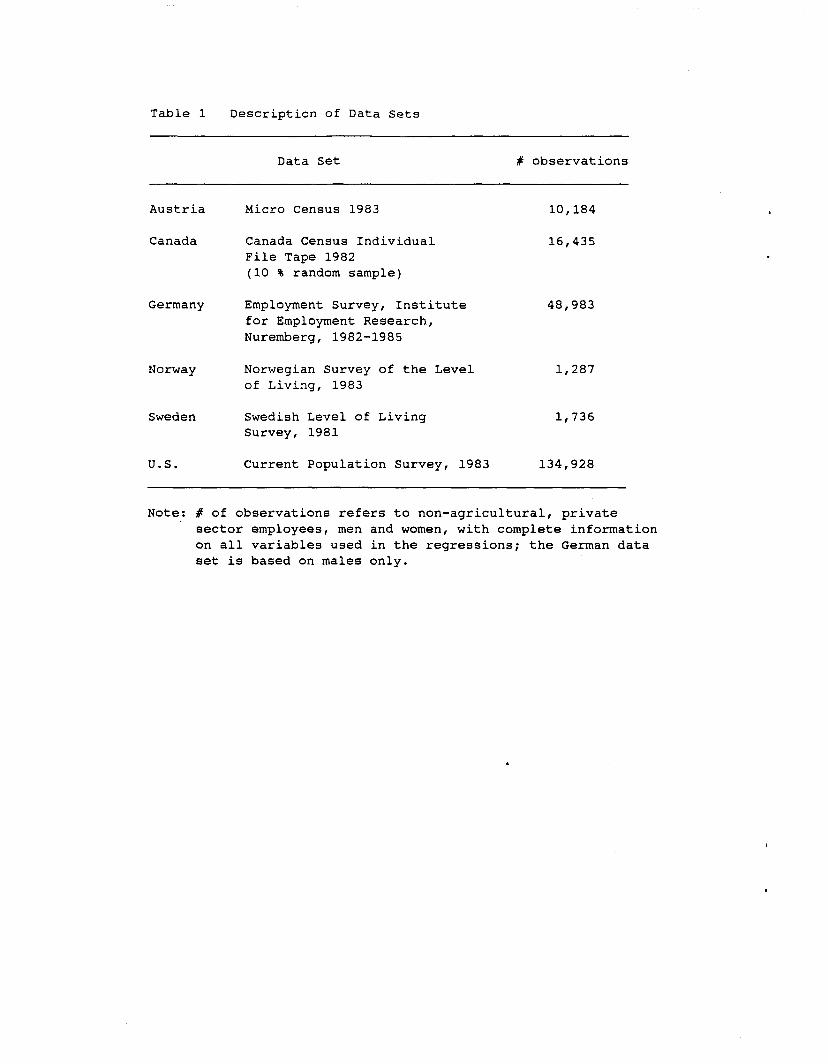
Table 1 Description of Data Sets
Data Set # observations
Austria Micro Census 1983 10,184
Canada Canada Census Individual 16,435File Tape 1982(10 % random sample)
Germany Employment Survey, Institute 48,983for Employment Research,Nuremberg, 1982-1985
Norway Norwegian Survey of the Level 1,287of Living, 1983
Sweden Swedish Level of Living 1,736Survey, 1981
U.S. Current Population Survey, 1983 134,928
Note: # of observations refers to non-agricultural, privatesector employees, men and women, with complete informationon all variables used in the regressions; the German dataset is based on males only.
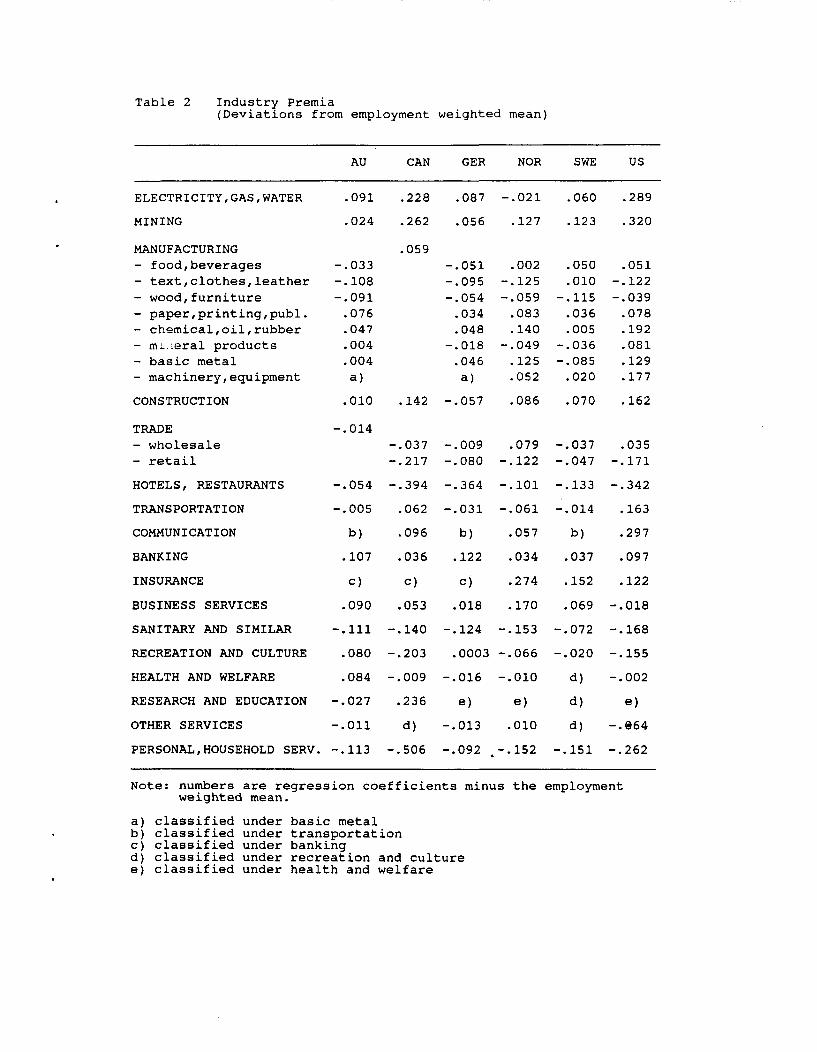
Table 2 Industry Premia(Deviations from employment weighted mean)
ELECTRICITY , GAS , WATER
MINING
MANUFACTURING- food, beverages- text, clothes, leather- wood, furniture- paper, printing, publ.- chemical, oil, rubber- mi.ieral products- basic metal- machinery, equipment
CONSTRUCTION
TRADE- wholesale- retail
HOTELS, RESTAURANTS
TRANSPORTATION
COMMUNICATION
BANKING
INSURANCE
BUSINESS SERVICES
SANITARY AND SIMILAR
RECREATION AND CULTURE
HEALTH AND WELFARE
RESEARCH AND EDUCATION
OTHER SERVICES
PERSONAL, HOUSEHOLD SERV.
AU
.091
.024
-.033-.108-.091.076.047.004.004a)
.010
-.014
-.054
-.005
b)
.107
c)
.090
-.111
.080
.084
-.027
-.011
-.113
CAN
.228
.262
.059
.142
-.037-.217
-.394
.062
.096
.036
c)
.053
-.140
-.203
-.009
.236
d)
-.506
GER
.087
.056
-.051-.095-.054.034.048
-.018.046
a)
-.057
-.009-.080
-.364
-.031
b)
.122
c)
.018
-.124
.0003
-.016
e)
-.013
-.092
NOR
-.021
.127
.002-.125-.059.083.140
-.049.125.052
.086
.079-.122
-.101
-.061
.057
.034
.274
.170
-.153
-.066
-.010
e)
.010
-.152
SWE
.060
.123
.050
.010-.115.036.005
-.036-.085.020
.070
-.037-.047
-.133
-.014
b)
.037
.152
.069
-.072
-.020
d)
d)
d)
-.151
US
.289
.320
.051-.122-.039.078.192.081.129.177
.162
.035-.171
-.342
.163
.297
.097
.122
-.018
-.168
-.155
-.002
e)
-.964
-.262
Note: numbers are regression coefficients minus the employmentweighted mean.
a) classified under basic metalb) classified under transportationc) classified under bankingd) classified under recreation and culturee) classified under health and welfare
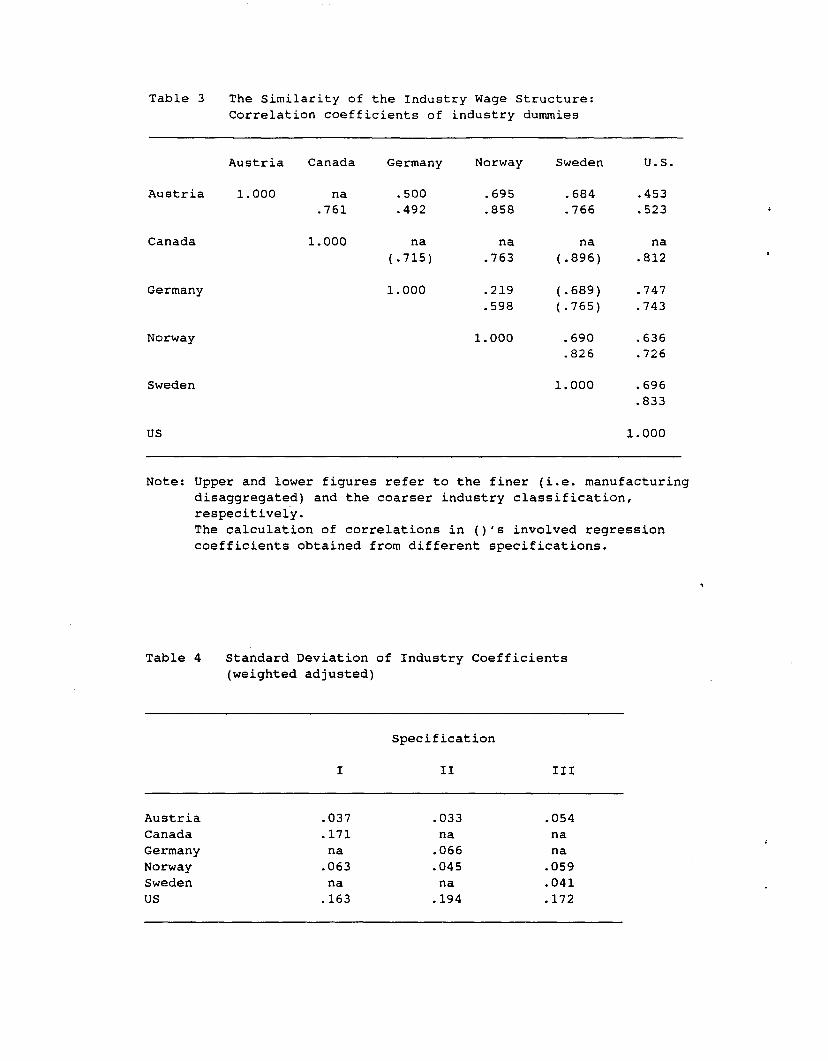
Table 3 The Similarity of the Industry Wage Structure:Correlation coefficients of industry dummies
Austria Canada Germany Norway Sweden U.S,
Austria 1.000 na .500.761 .492
Canada 1.000 na(.715)
Germany 1 . 000
Norway
Sweden
US
.695
.858
na.763
.219
.598
1.000
.684
.766
na(.896)
(.689)(.765)
.690
.826
1.000
.453
.523
na.812
.747
.743
.636
.726
.696
.833
1.000
Note: Upper and lower figures refer to the finer (i.e. manufacturingdisaggregated) and the coarser industry classification,respecitively.The calculation of correlations in ()'s involved regressioncoefficients obtained from different specifications.
Table 4 Standard Deviation of Industry Coefficients(weighted adjusted)
Specification
II III
AustriaCanadaGermanyNorwaySwedenUS
.037
.171na.063na.163
.033na.066.045na.194
.054nana.059.041.172
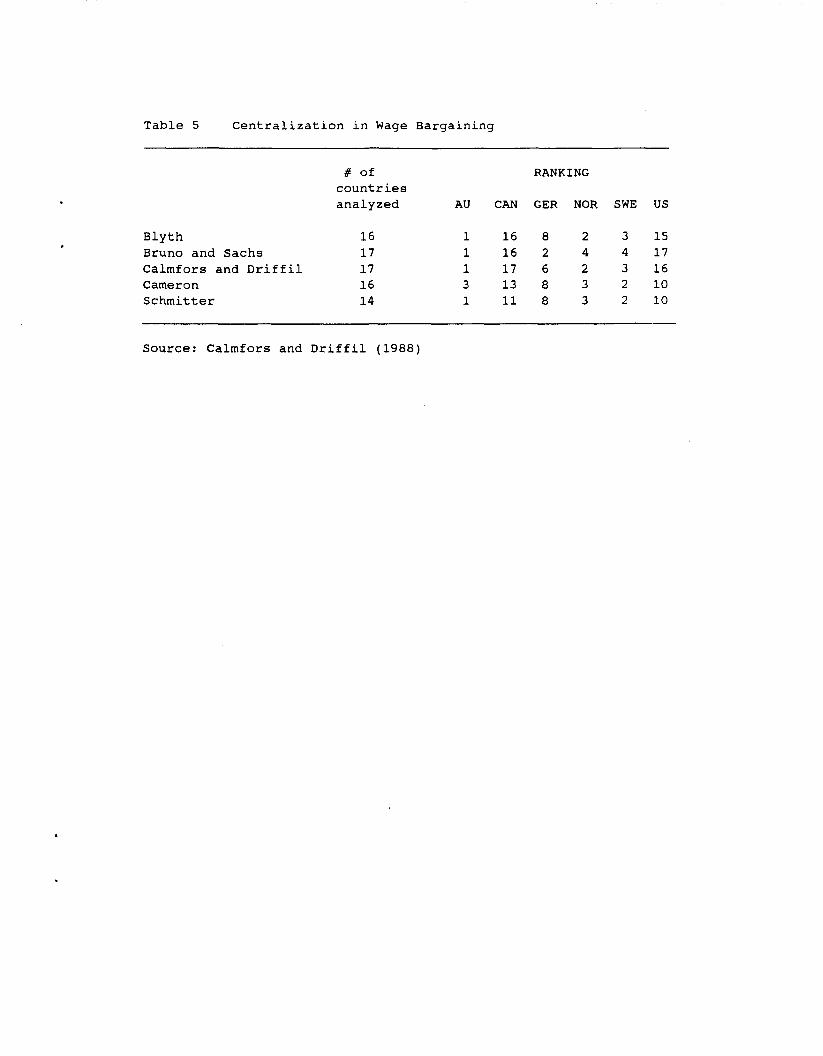
Table 5 Centralization in Wage Bargaining
BlythBruno and SachsCalmfors and DriffilCameronSchmitter
# ofcountriesanalyzed
1617171614
RANKING
AU
11131
CAN
1616171311
GER
82688
NOR
24233
SWE
34322
US
1517161010
Source: Calmfors and Driffil (1988)