barclays industrial select conference - lennox … 02 20 lii barclays presentation.pdflennox...
TRANSCRIPT

Barclays Industrial Select Conference February 2014
FORWARD-LOOKING STATEMENTS
This presentation contains forward-looking statements within the meaning of the Private
Securities Litigation Reform Act of 1995. These statements are subject to numerous risks and
uncertainties that could cause actual results to differ materially from such statements. Such
risks and uncertainties include, but are not limited to, the impact of higher raw material and
commodity prices, the impact of unfavorable weather, and the ability of the company to
execute its strategic plans. For more information concerning these and other risks and
uncertainties, see Lennox International’s Form 10-K and other publicly available filings with
the Securities and Exchange Commission. LII disclaims any intention or obligation to update
or revise any forward-looking statements, whether as a result of new information, future
events or otherwise.
Use of Non-GAAP Financial Measures A reconciliation of non-GAAP financial measures appearing in this presentation to financial
measures prepared in accordance with U.S. Generally Accepted Accounting Principles
(GAAP) is posted on the company’s website at www.lennoxinternational.com.
2
Who We Are
Businesses & Strategic Priorities
Financial Guidance
3
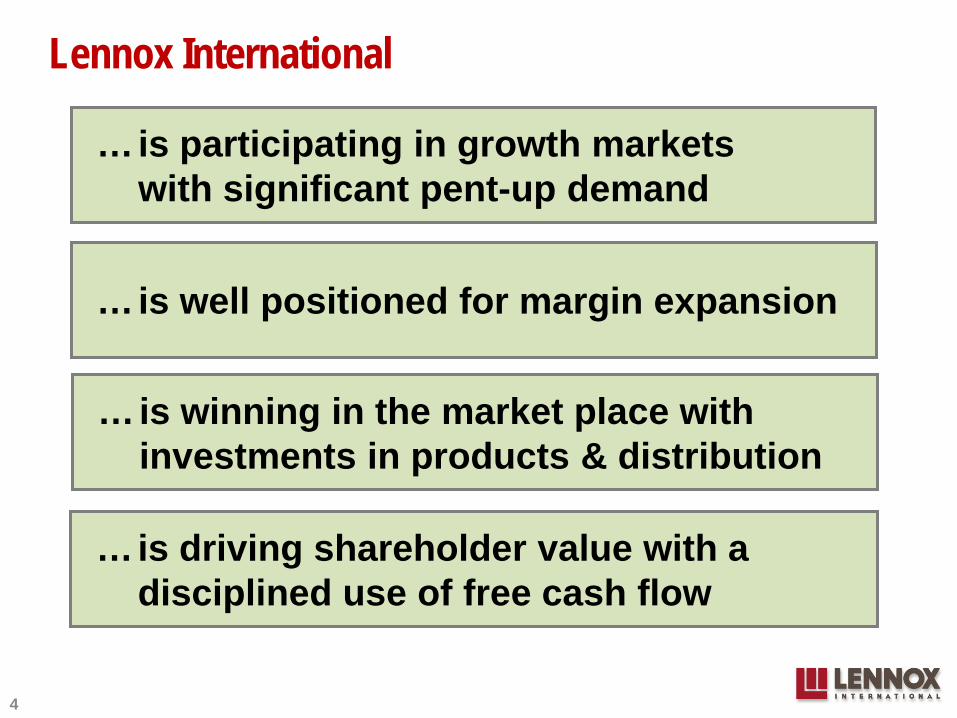
Lennox International
… is winning in the market place with investments in products & distribution
… is well positioned for margin expansion
… is participating in growth markets with significant pent-up demand
… is driving shareholder value with a disciplined use of free cash flow
4
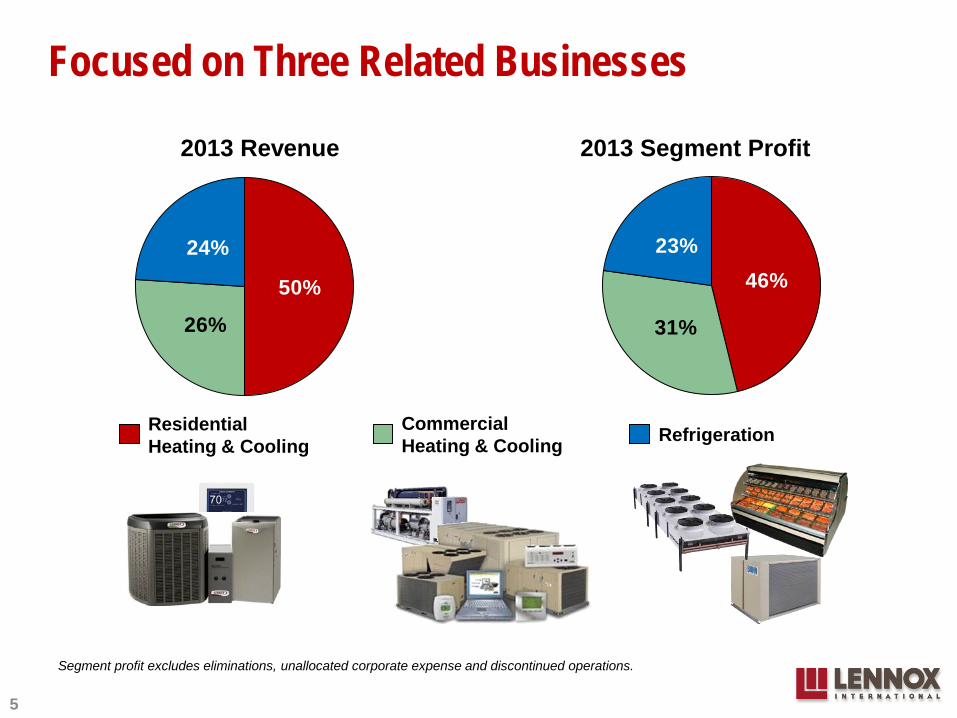
50%
26%
24%46%
31%
23%
Refrigeration Residential Heating & Cooling
Focused on Three Related Businesses
2013 Revenue 2013 Segment Profit
Commercial Heating & Cooling
Segment profit excludes eliminations, unallocated corporate expense and discontinued operations.
5
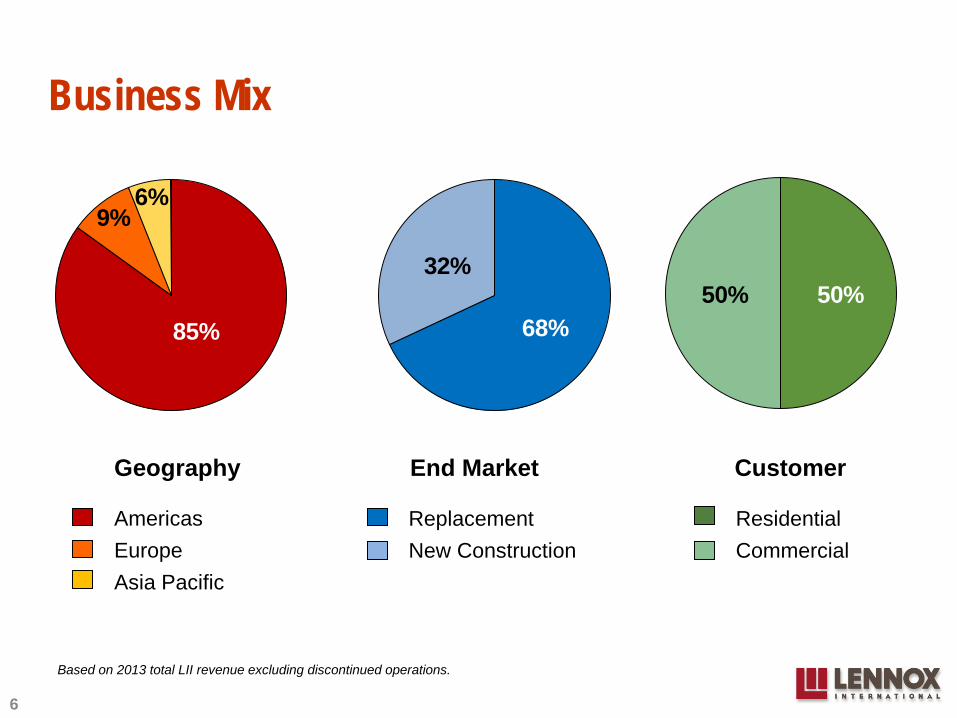
68%
32%
Business Mix
Customer
Residential Commercial
Based on 2013 total LII revenue excluding discontinued operations.
Americas Europe Asia Pacific
Geography
Replacement New Construction
End Market
85%
9%6%
50%50%
6
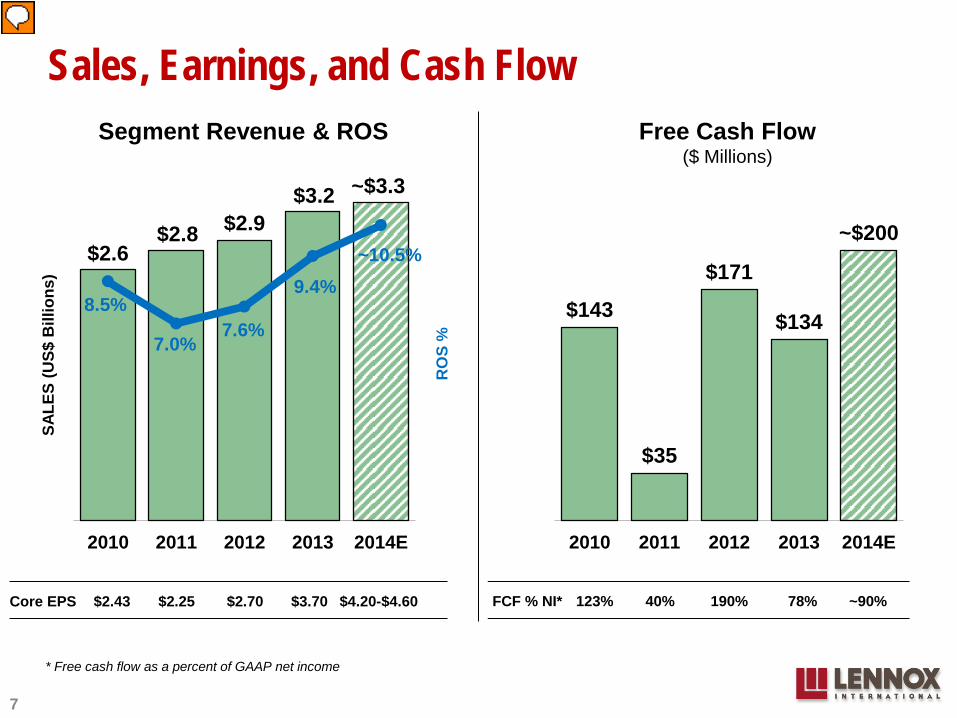
$143
$35
$171
$134
~$200
$0
$50
$100
$150
$200
$250
2010 2011 2012 2013 2014E
Sales, Earnings, and Cash Flow
Segment Revenue & ROS Free Cash Flow ($ Millions)
Core EPS $2.43 $2.25 $2.70 $3.70 $4.20-$4.60
* Free cash flow as a percent of GAAP net income
$2.6 $2.8 $2.9
$3.2 ~$3.3
8.5%
7.0% 7.6%
9.4% ~10.5%
0%
2%
4%
6%
8%
10%
12%
$0
$1
$2
$3
2010 2011 2012 2013 2014E
RO
S %
SALE
S (U
S$ B
illio
ns)
7
FCF % NI* 123% 40% 190% 78% ~90%
Who We Are
Businesses & Strategic Priorities
Financial Guidance
8
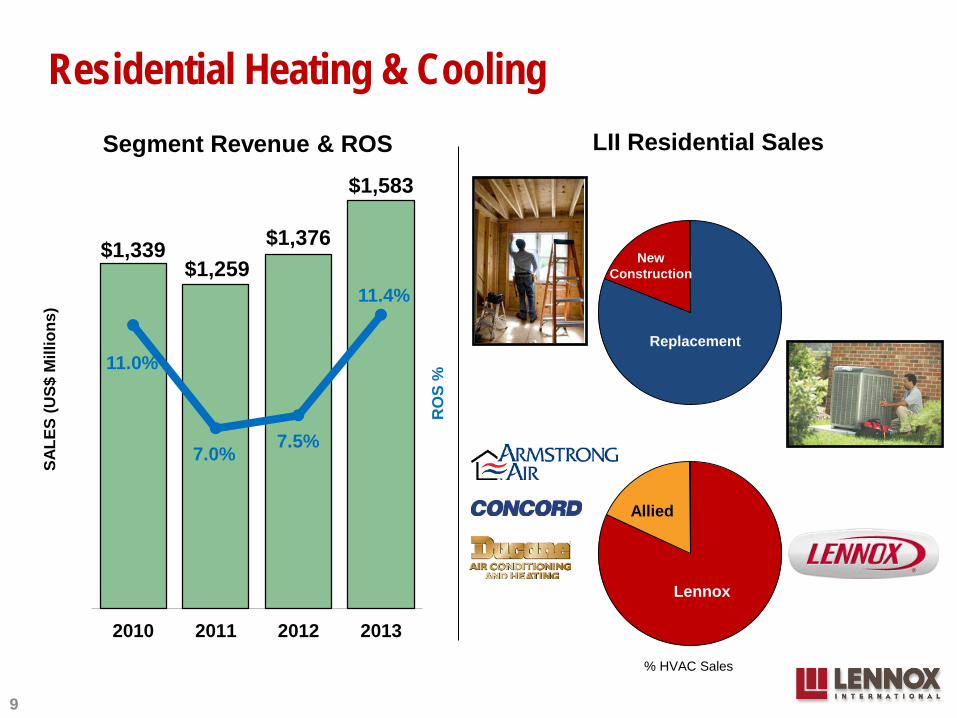
$1,339 $1,259
$1,376
$1,583
11.0%
7.0% 7.5%
11.4%
0%
2%
4%
6%
8%
10%
12%
14%
16%
$0
$1,500
2010 2011 2012 2013
RO
S %
SALE
S (U
S$ M
illio
ns)
Residential Heating & Cooling Segment Revenue & ROS
Replacement
NC
LII Residential Sales
Allied
Lennox
NC
Replacement
Allied
Lennox
% HVAC Sales
New Construction
Replacement
9
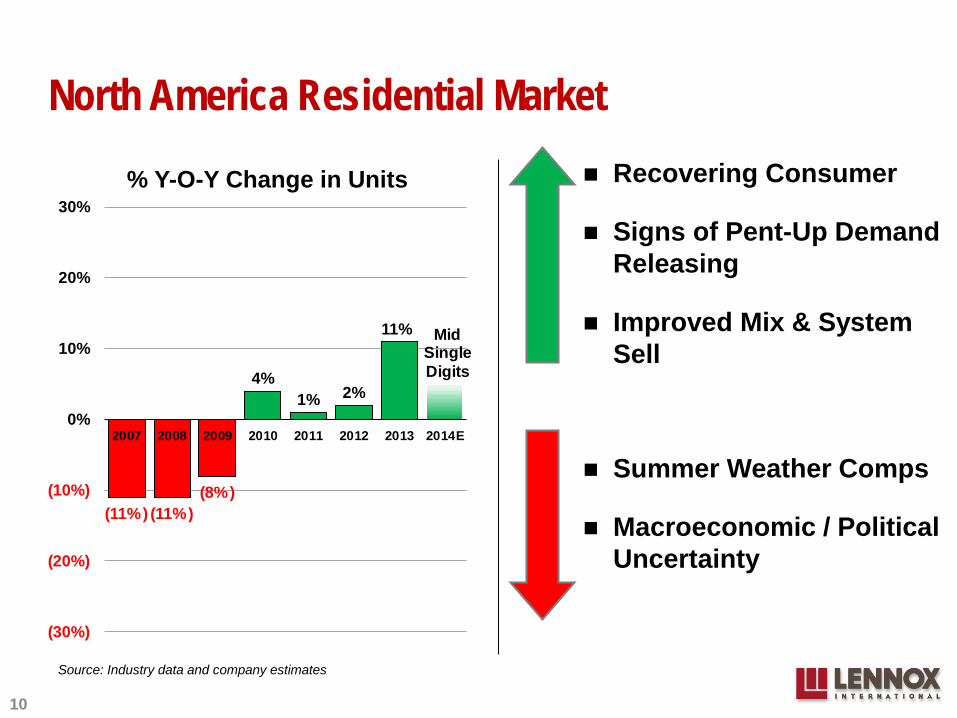
(11%) (11%)(8%)
4%1% 2%
11% MidSingle Digits
(30%)
(20%)
(10%)
0%
10%
20%
30%
2007 2008 2009 2010 2011 2012 2013 2014E
North America Residential Market
Source: Industry data and company estimates
% Y-O-Y Change in Units
10
Recovering Consumer
Signs of Pent-Up Demand Releasing
Improved Mix & System Sell
Summer Weather Comps
Macroeconomic / Political Uncertainty
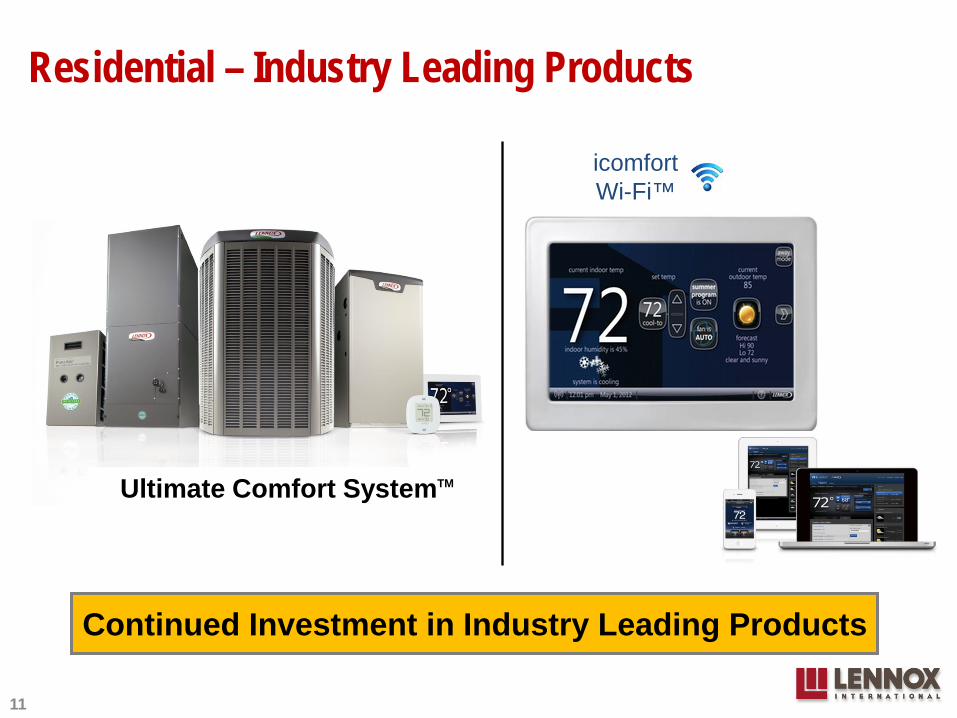
icomfort Wi-Fi™
Continued Investment in Industry Leading Products
11
Residential – Industry Leading Products
Ultimate Comfort SystemTM
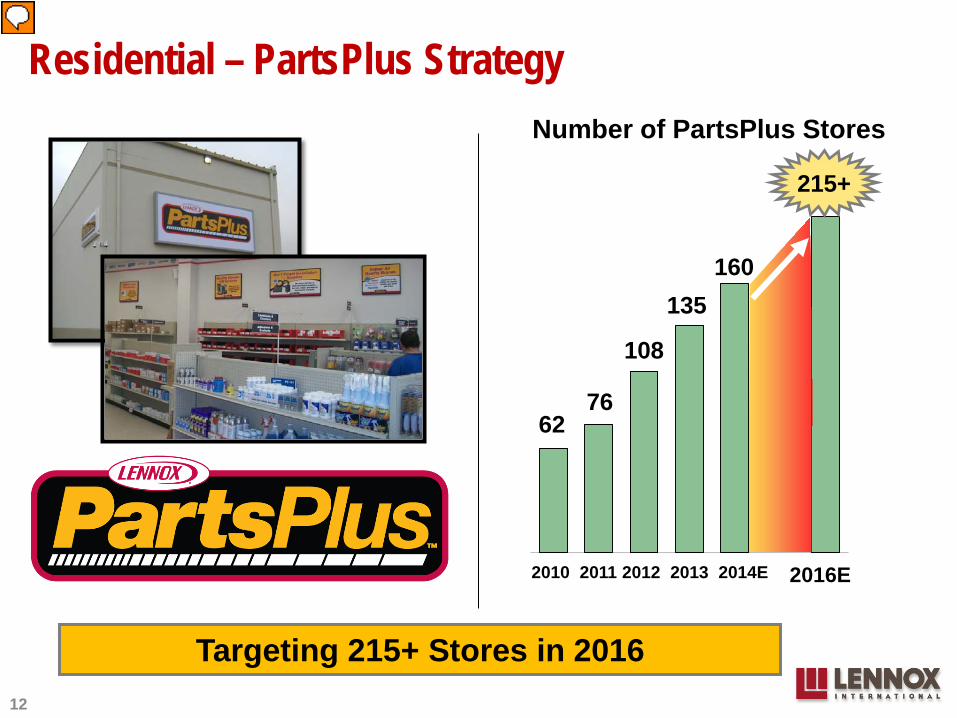
Number of PartsPlus Stores
62 76
108
135
200+
2010 2011 2012 2013 2014 2015TGT
Targeting 215+ Stores in 2016 12
Residential – PartsPlus Strategy
200+
2016E
215+
160
2010 2011 2012 2013 2014E
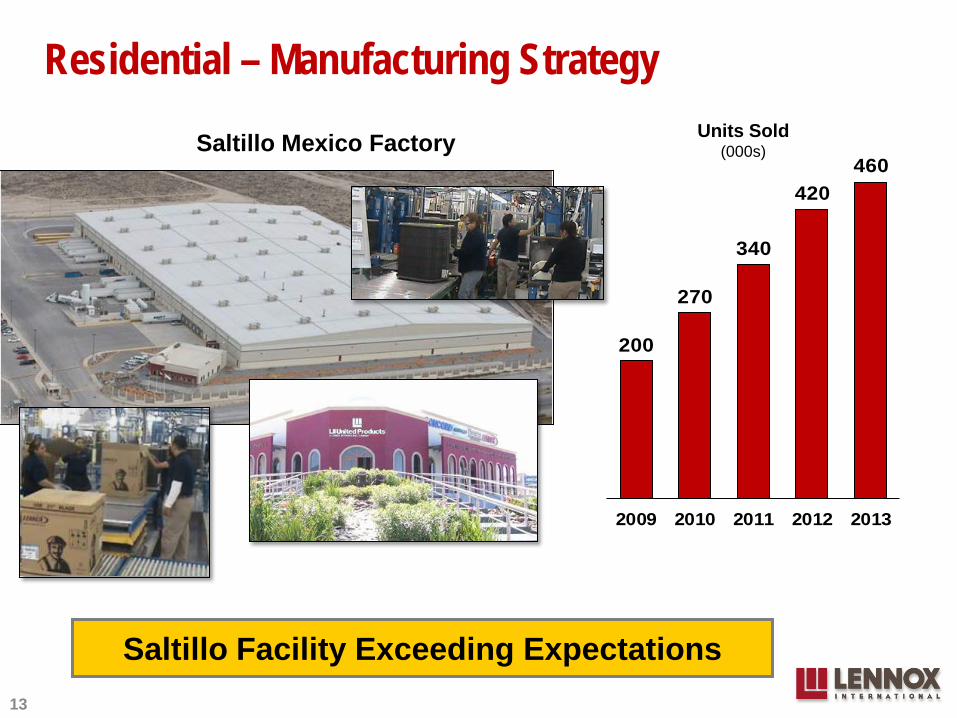
200
270
340
420460
2009 2010 2011 2012 2013
Saltillo Mexico Factory Units Sold (000s)
Saltillo Facility Exceeding Expectations 13
Residential – Manufacturing Strategy
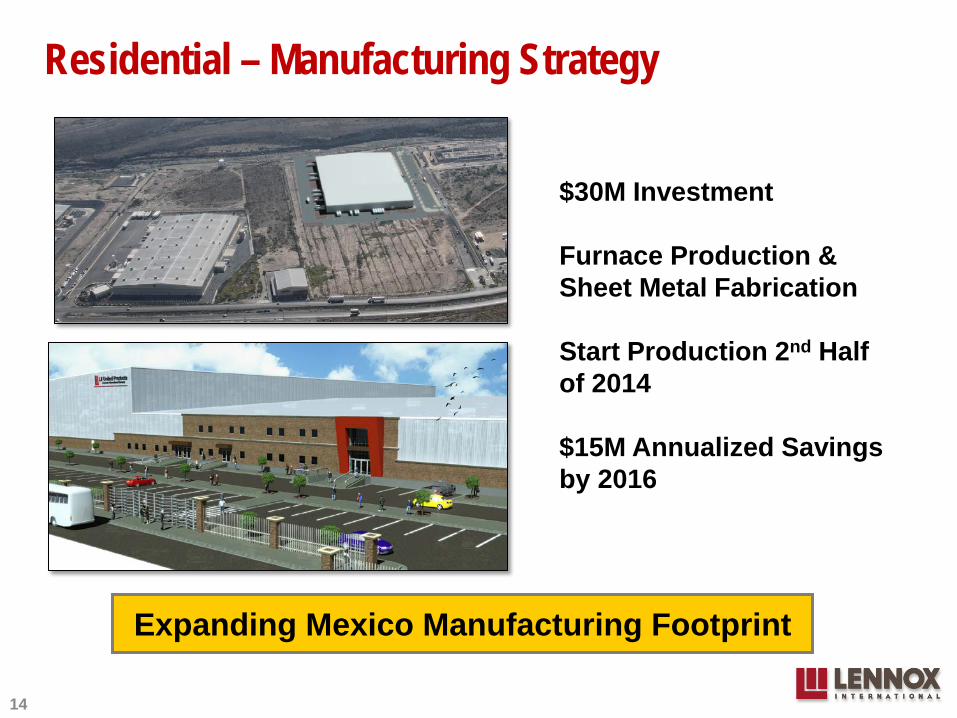
Expanding Mexico Manufacturing Footprint
14
Residential – Manufacturing Strategy
$30M Investment
Furnace Production & Sheet Metal Fabrication
Start Production 2nd Half of 2014
$15M Annualized Savings by 2016
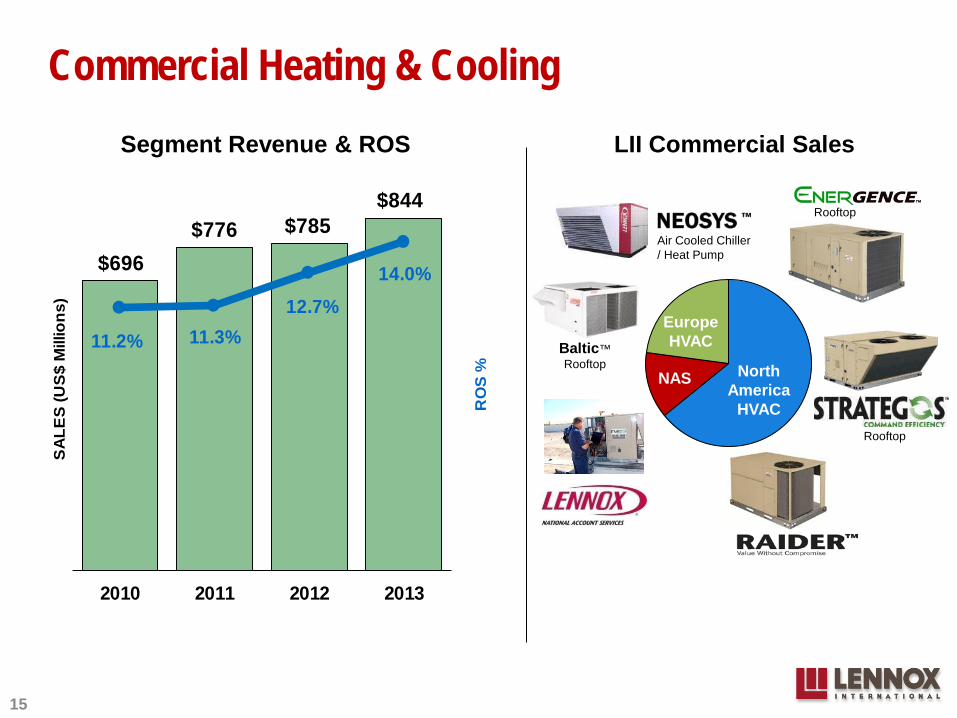
$696$776 $785
$844
11.2% 11.3%12.7%
14.0%
2010 2011 2012 2013
RO
S %
SA
LES
(US
$ M
illio
ns)
Commercial Heating & Cooling
North America
HVAC
Europe HVAC
Segment Revenue & ROS LII Commercial Sales
Rooftop
Baltic™ Rooftop
Rooftop
Air Cooled Chiller / Heat Pump
15
NAS
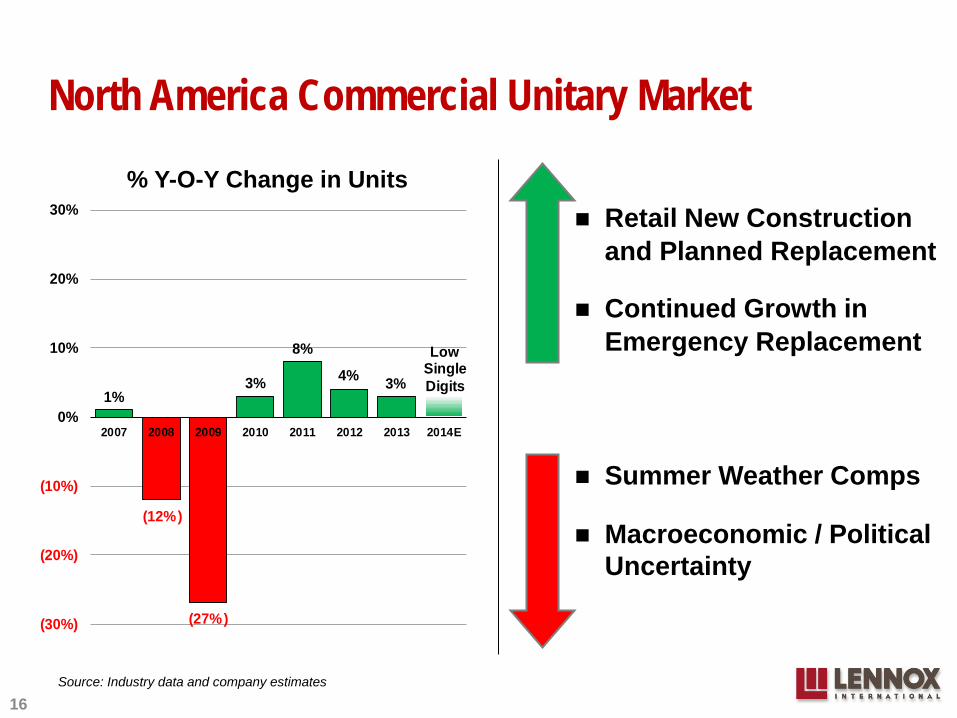
1%
(12%)
(27%)
3%
8%
4% 3%
Low Single Digits
(30%)
(20%)
(10%)
0%
10%
20%
30%
2007 2008 2009 2010 2011 2012 2013 2014E
North America Commercial Unitary Market
Source: Industry data and company estimates
% Y-O-Y Change in Units Retail New Construction
and Planned Replacement
Continued Growth in Emergency Replacement
Summer Weather Comps
Macroeconomic / Political Uncertainty
16
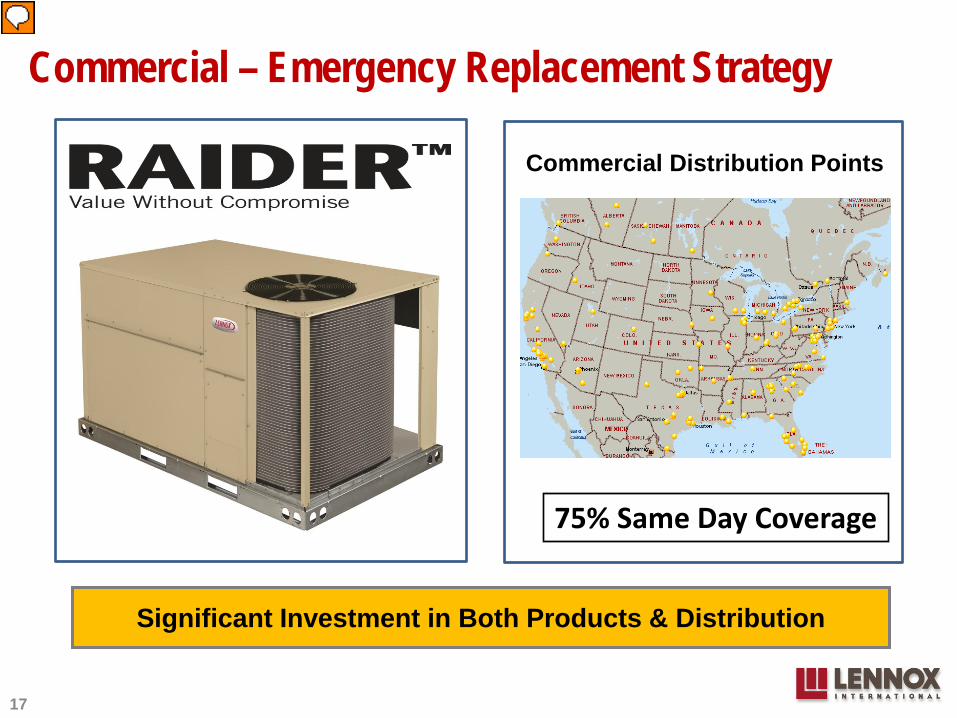
Commercial – Emergency Replacement Strategy
Significant Investment in Both Products & Distribution
17
75% Same Day Coverage
Commercial Distribution Points
18
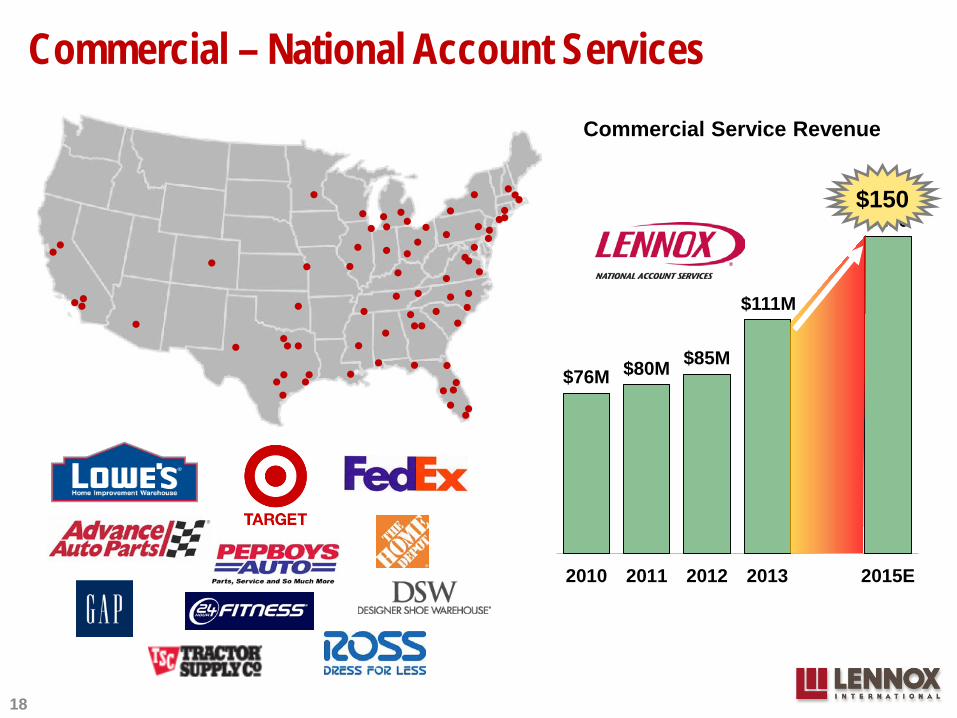
$76M $80M $85M
$111M
$150
2010 2011 2012 2013 2015E
$150
Commercial Service Revenue
Commercial – National Account Services
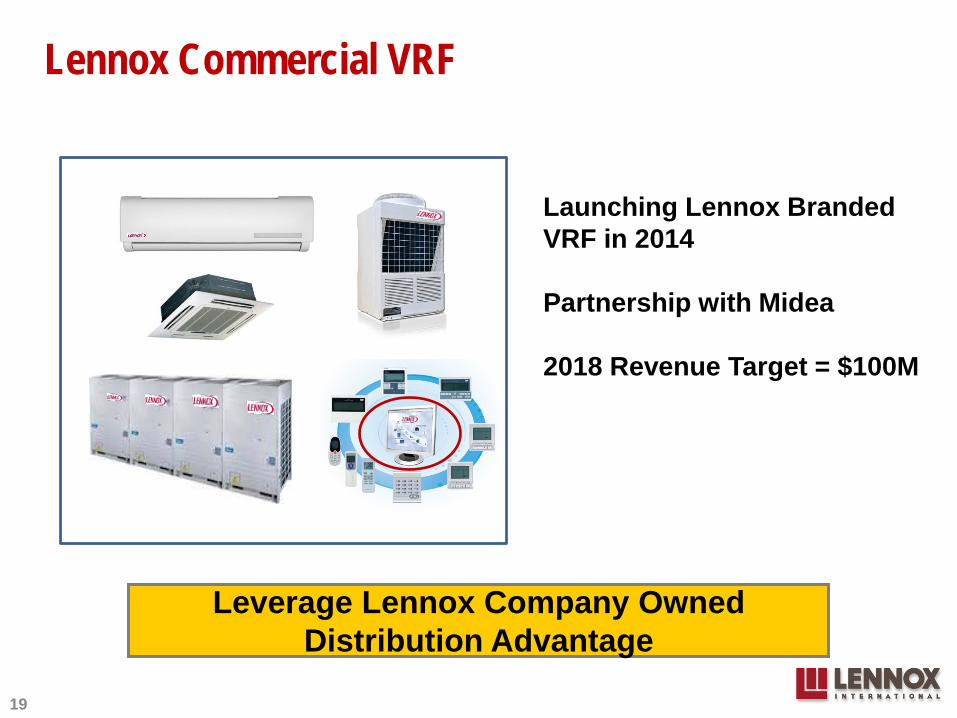
Leverage Lennox Company Owned Distribution Advantage
19
Lennox Commercial VRF
Launching Lennox Branded VRF in 2014
Partnership with Midea
2018 Revenue Target = $100M
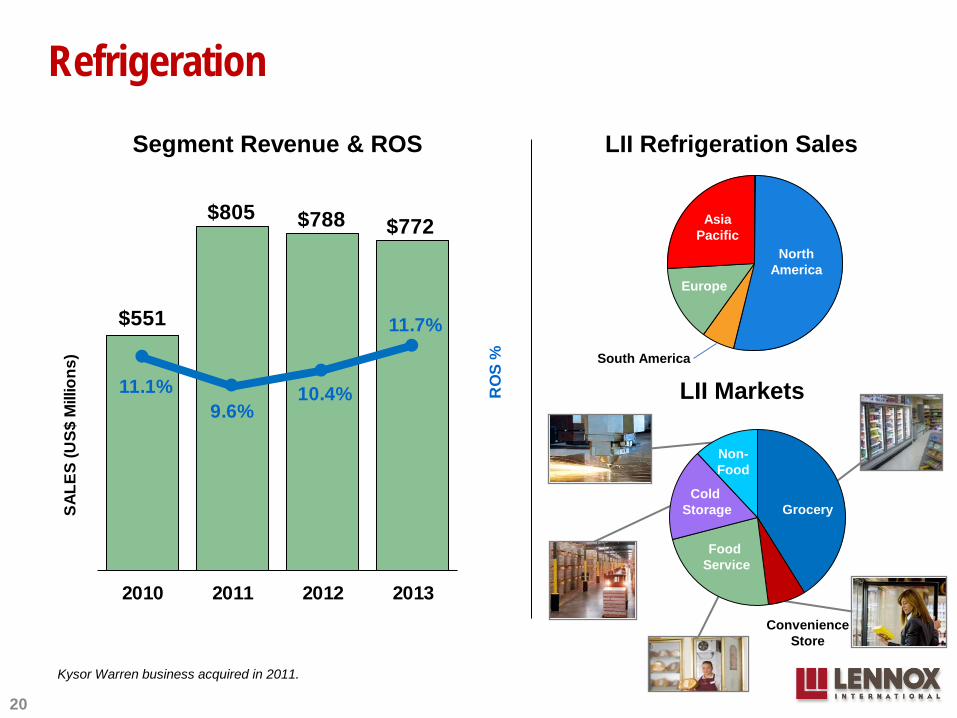
LII Markets
Food Service
Grocery
Convenience Store
Cold Storage
Non- Food
Refrigeration
Segment Revenue & ROS LII Refrigeration Sales
Asia Pacific
North America
Europe
20
Kysor Warren business acquired in 2011.
$551
$805 $788 $772
11.1%9.6%
10.4%
11.7%
2010 2011 2012 2013
RO
S %
SALE
S (U
S$ M
illio
ns)
North America
South America
Asia Pacific
Europe
21
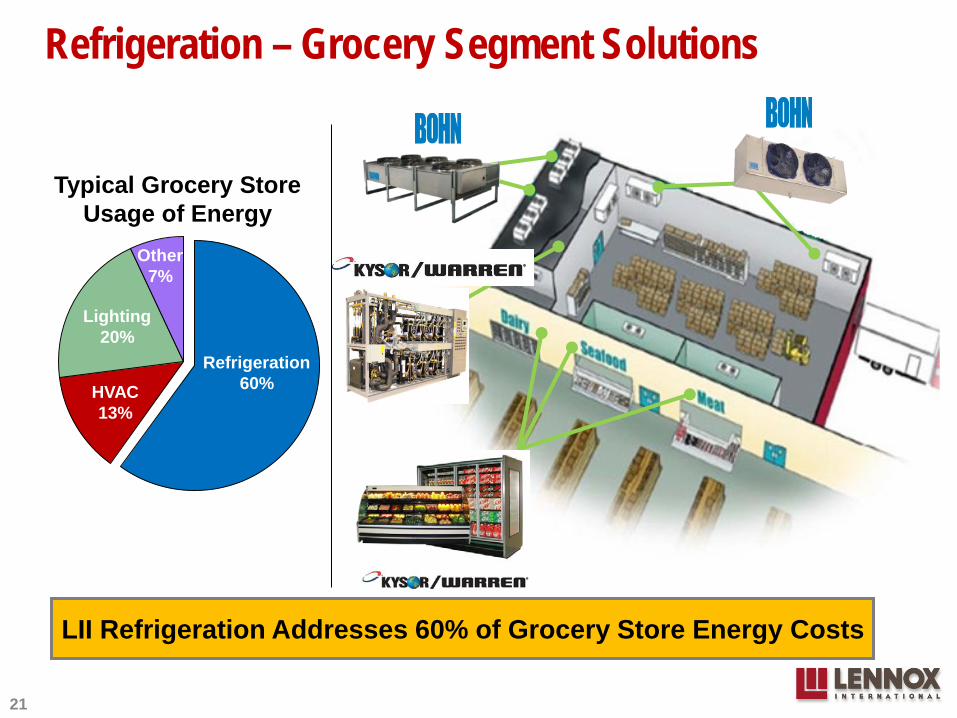
Refrigeration – Grocery Segment Solutions
Lighting
Refrigeration 60%
Lighting 20%
Other 7%
HVAC 13%
Typical Grocery Store Usage of Energy
LII Refrigeration Addresses 60% of Grocery Store Energy Costs
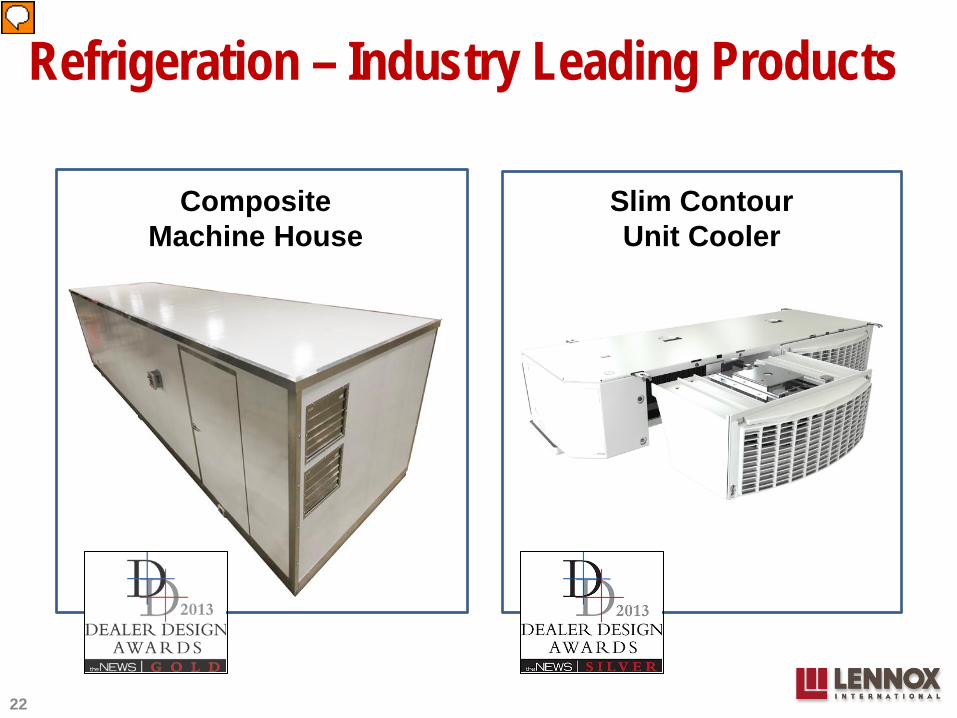
Refrigeration – Industry Leading Products
22
Composite Machine House
Slim Contour Unit Cooler
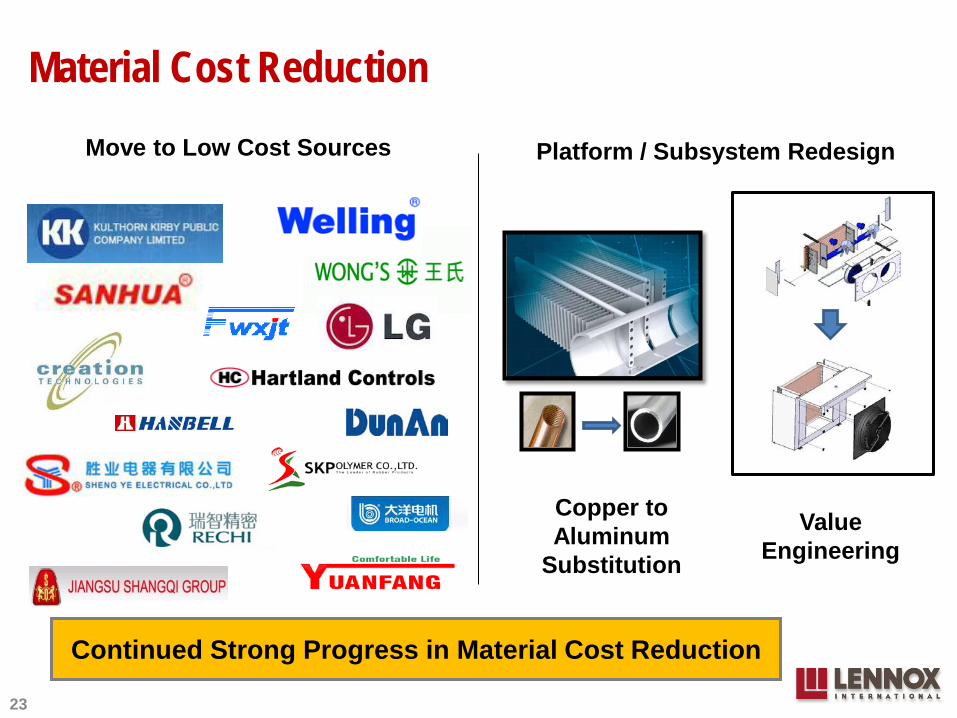
Platform / Subsystem Redesign
Value Engineering
Copper to Aluminum
Substitution
23
Move to Low Cost Sources
Material Cost Reduction
Continued Strong Progress in Material Cost Reduction
Who We Are
Businesses & Strategic Priorities
Financial Guidance
24
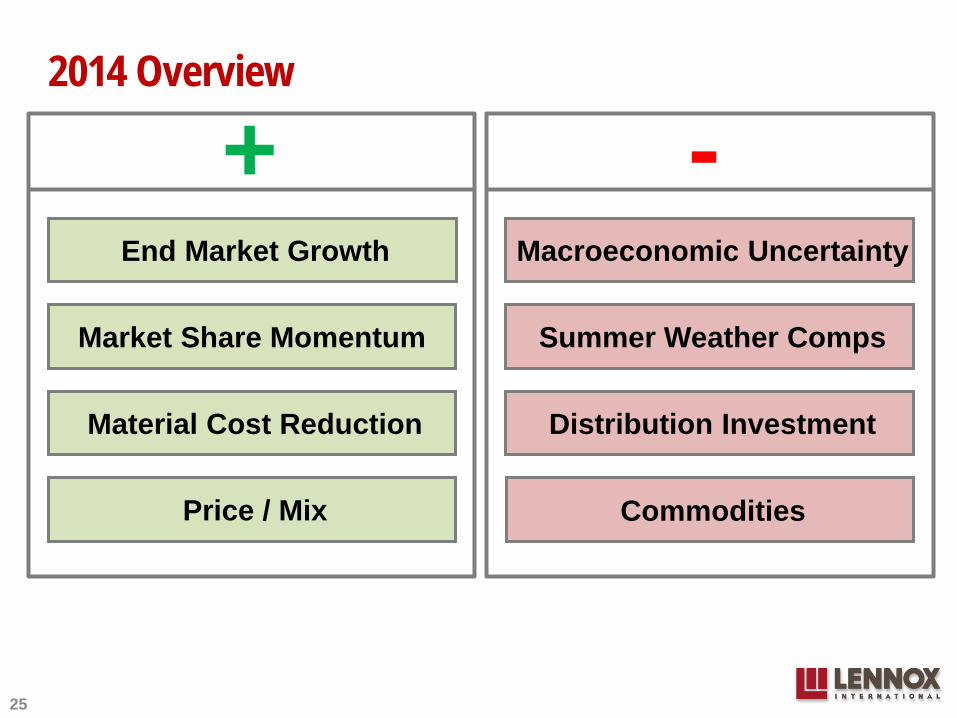
2014 Overview
+ - End Market Growth Macroeconomic Uncertainty
Market Share Momentum
Material Cost Reduction
Summer Weather Comps
Price / Mix
Distribution Investment
25
Commodities
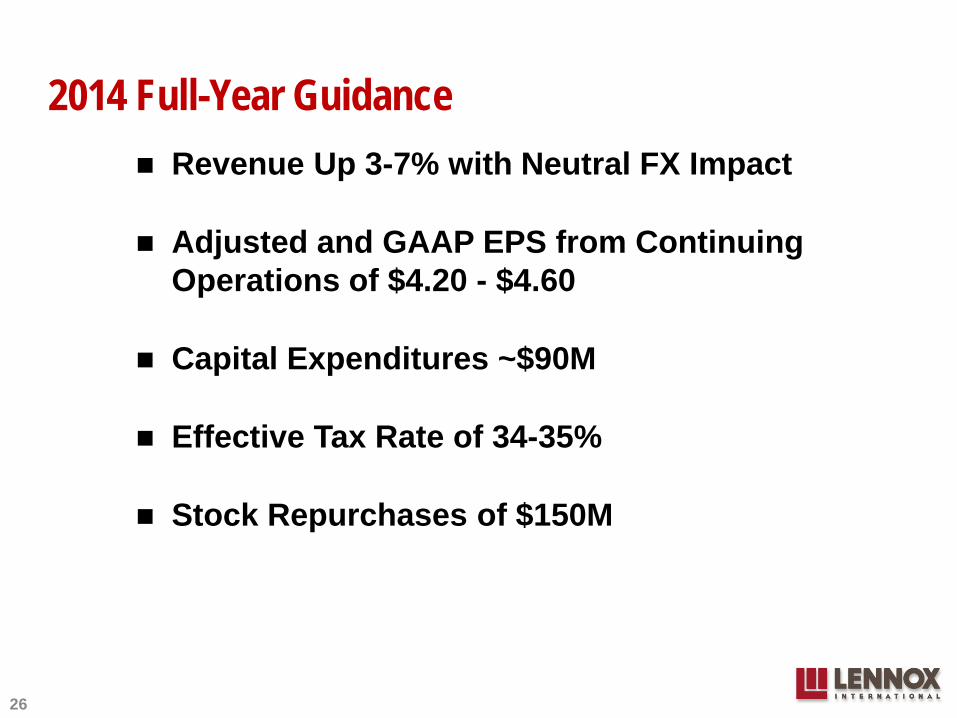
2014 Full-Year Guidance Revenue Up 3-7% with Neutral FX Impact
Adjusted and GAAP EPS from Continuing Operations of $4.20 - $4.60
Capital Expenditures ~$90M
Effective Tax Rate of 34-35%
Stock Repurchases of $150M
26
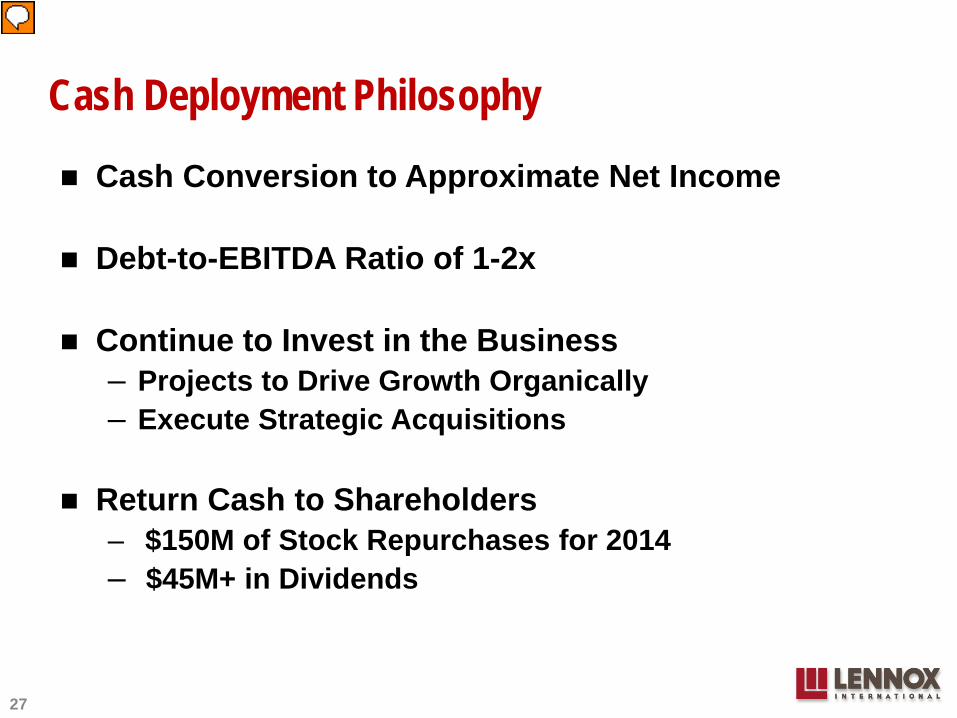
Cash Deployment Philosophy
Cash Conversion to Approximate Net Income
Debt-to-EBITDA Ratio of 1-2x
Continue to Invest in the Business – Projects to Drive Growth Organically – Execute Strategic Acquisitions
Return Cash to Shareholders – $150M of Stock Repurchases for 2014 – $45M+ in Dividends
27
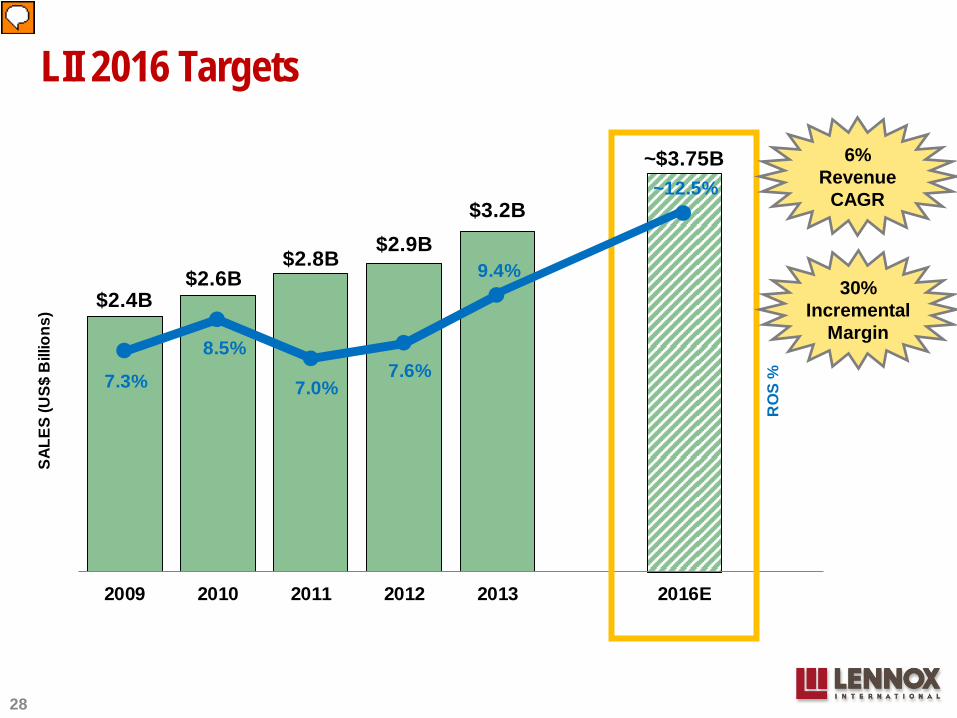
$2.4B$2.6B
$2.8B$2.9B
$3.2B
~$3.75B
7.3%
8.5%
7.0%7.6%
9.4%
~12.5%
2009 2010 2011 2012 2013 2016E
RO
S %
SALE
S (U
S$ B
illio
ns)
LII 2016 Targets
30% Incremental
Margin
28
6% Revenue
CAGR

Lennox International
… is winning in the market place with investments in products & distribution
… is well positioned for margin expansion
… is participating in growth markets with significant pent-up demand
… is driving shareholder value with a disciplined use of free cash flow
29
30
GAAP / Non-GAAP Reconciliations
31
32
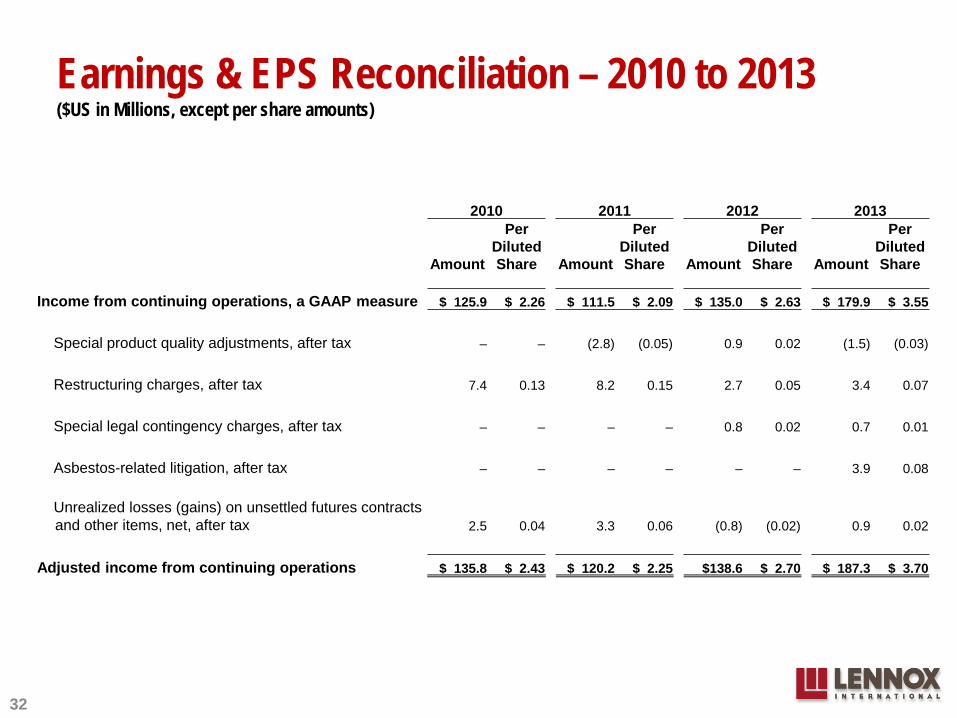
Earnings & EPS Reconciliation – 2010 to 2013 ($US in Millions, except per share amounts)
2010 2011 2012 2013
Amount
Per Diluted Share Amount
Per Diluted Share Amount
Per Diluted Share Amount
Per Diluted Share
Income from continuing operations, a GAAP measure $ 125.9 $ 2.26 $ 111.5 $ 2.09 $ 135.0 $ 2.63 $ 179.9 $ 3.55
Special product quality adjustments, after tax – – (2.8) (0.05) 0.9 0.02 (1.5) (0.03)
Restructuring charges, after tax 7.4 0.13 8.2 0.15 2.7 0.05 3.4 0.07
Special legal contingency charges, after tax – – – – 0.8 0.02 0.7 0.01
Asbestos-related litigation, after tax – – – – – – 3.9 0.08
Unrealized losses (gains) on unsettled futures contracts and other items, net, after tax 2.5 0.04 3.3 0.06 (0.8) (0.02) 0.9 0.02
Adjusted income from continuing operations $ 135.8 $ 2.43 $ 120.2 $ 2.25 $138.6 $ 2.70 $ 187.3 $ 3.70
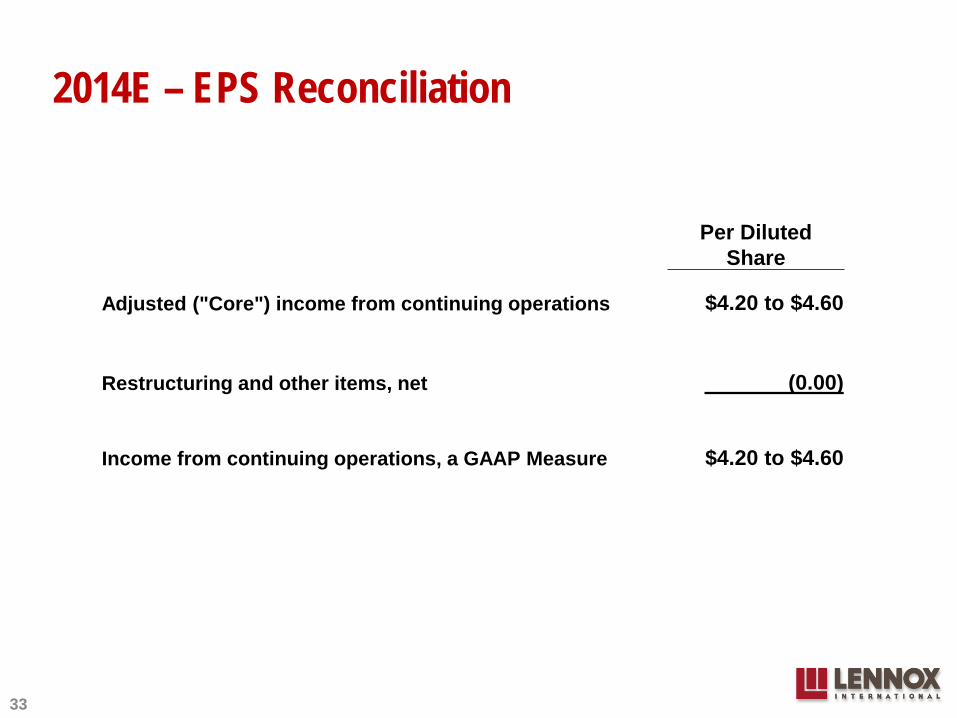
2014E – EPS Reconciliation
33
Per Diluted Share
Adjusted ("Core") income from continuing operations $4.20 to $4.60
Restructuring and other items, net (0.00)
Income from continuing operations, a GAAP Measure $4.20 to $4.60
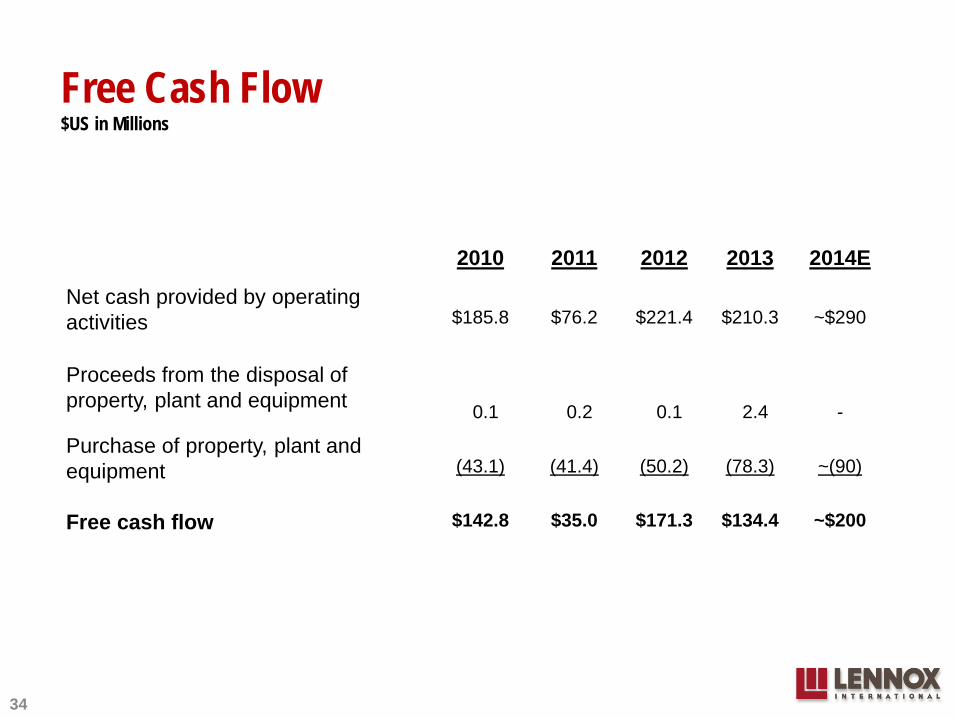
Free Cash Flow $US in Millions
34
2010
2011
2012
2013
2014E
Net cash provided by operating activities
$185.8
$76.2
$221.4
$210.3
~$290
Proceeds from the disposal of property, plant and equipment 0.1 0.2 0.1 2.4 -
Purchase of property, plant and equipment
(43.1)
(41.4)
(50.2)
(78.3)
~(90)
Free cash flow $142.8 $35.0 $171.3 $134.4 ~$200