banking market in poland 2014-2016 cee banking series · banking market in poland 2014-2016, cee...
TRANSCRIPT
BANKING MARKET IN POLAND 2014-2016, CEE BANKING SERIES
by Inteliace Research May 2014
Version: 2014/I/5
Inteliace Research
Ban
king M
arket in P
olan
d 2014–201
6
2
TABLE OF CONTENTS (1/4)
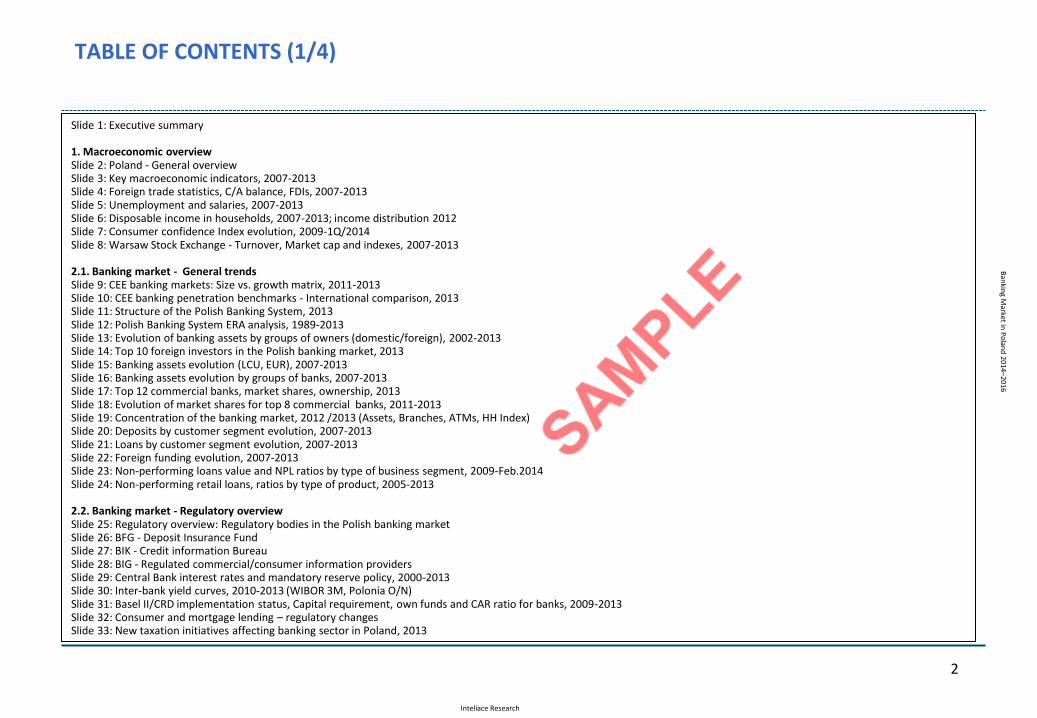
Slide 1: Executive summary 1. Macroeconomic overview Slide 2: Poland - General overview Slide 3: Key macroeconomic indicators, 2007-2013 Slide 4: Foreign trade statistics, C/A balance, FDIs, 2007-2013 Slide 5: Unemployment and salaries, 2007-2013 Slide 6: Disposable income in households, 2007-2013; income distribution 2012 Slide 7: Consumer confidence Index evolution, 2009-1Q/2014 Slide 8: Warsaw Stock Exchange - Turnover, Market cap and indexes, 2007-2013 2.1. Banking market - General trends Slide 9: CEE banking markets: Size vs. growth matrix, 2011-2013 Slide 10: CEE banking penetration benchmarks - International comparison, 2013 Slide 11: Structure of the Polish Banking System, 2013 Slide 12: Polish Banking System ERA analysis, 1989-2013 Slide 13: Evolution of banking assets by groups of owners (domestic/foreign), 2002-2013 Slide 14: Top 10 foreign investors in the Polish banking market, 2013 Slide 15: Banking assets evolution (LCU, EUR), 2007-2013 Slide 16: Banking assets evolution by groups of banks, 2007-2013 Slide 17: Top 12 commercial banks, market shares, ownership, 2013 Slide 18: Evolution of market shares for top 8 commercial banks, 2011-2013 Slide 19: Concentration of the banking market, 2012 /2013 (Assets, Branches, ATMs, HH Index) Slide 20: Deposits by customer segment evolution, 2007-2013 Slide 21: Loans by customer segment evolution, 2007-2013 Slide 22: Foreign funding evolution, 2007-2013 Slide 23: Non-performing loans value and NPL ratios by type of business segment, 2009-Feb.2014 Slide 24: Non-performing retail loans, ratios by type of product, 2005-2013 2.2. Banking market - Regulatory overview Slide 25: Regulatory overview: Regulatory bodies in the Polish banking market Slide 26: BFG - Deposit Insurance Fund Slide 27: BIK - Credit information Bureau Slide 28: BIG - Regulated commercial/consumer information providers Slide 29: Central Bank interest rates and mandatory reserve policy, 2000-2013 Slide 30: Inter-bank yield curves, 2010-2013 (WIBOR 3M, Polonia O/N) Slide 31: Basel II/CRD implementation status, Capital requirement, own funds and CAR ratio for banks, 2009-2013 Slide 32: Consumer and mortgage lending – regulatory changes Slide 33: New taxation initiatives affecting banking sector in Poland, 2013
Inteliace Research
Ban
king M
arket in P
olan
d 2014–201
6
3
TABLE OF CONTENTS (2/4)
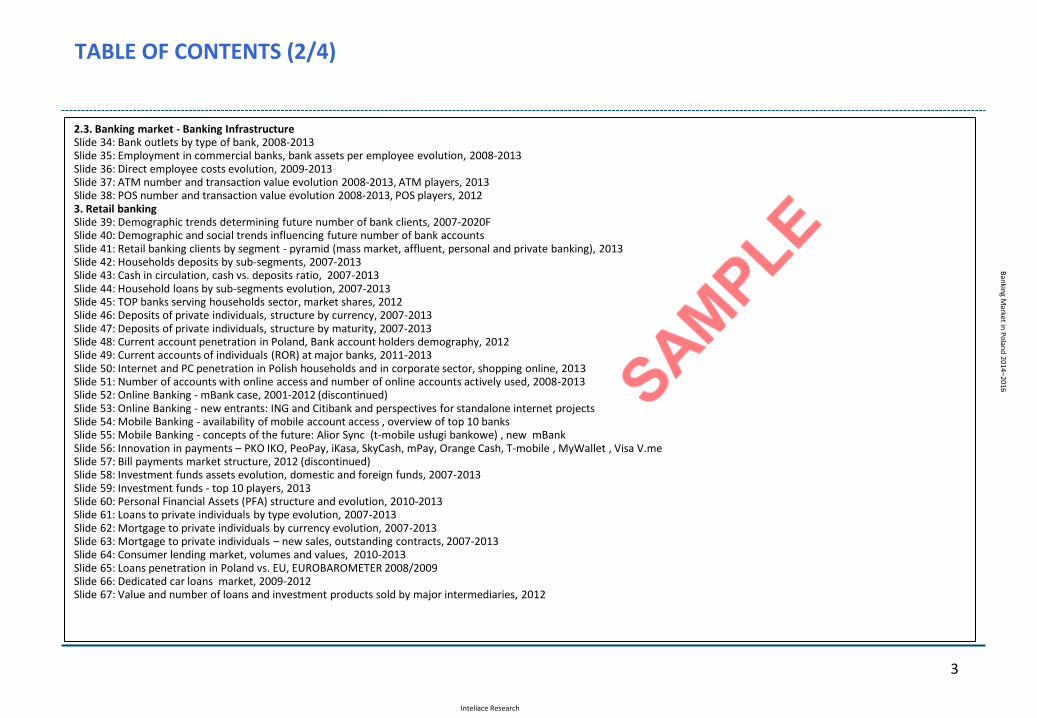
2.3. Banking market - Banking Infrastructure Slide 34: Bank outlets by type of bank, 2008-2013 Slide 35: Employment in commercial banks, bank assets per employee evolution, 2008-2013 Slide 36: Direct employee costs evolution, 2009-2013 Slide 37: ATM number and transaction value evolution 2008-2013, ATM players, 2013 Slide 38: POS number and transaction value evolution 2008-2013, POS players, 2012 3. Retail banking Slide 39: Demographic trends determining future number of bank clients, 2007-2020F Slide 40: Demographic and social trends influencing future number of bank accounts Slide 41: Retail banking clients by segment - pyramid (mass market, affluent, personal and private banking), 2013 Slide 42: Households deposits by sub-segments, 2007-2013 Slide 43: Cash in circulation, cash vs. deposits ratio, 2007-2013 Slide 44: Household loans by sub-segments evolution, 2007-2013 Slide 45: TOP banks serving households sector, market shares, 2012 Slide 46: Deposits of private individuals, structure by currency, 2007-2013 Slide 47: Deposits of private individuals, structure by maturity, 2007-2013 Slide 48: Current account penetration in Poland, Bank account holders demography, 2012 Slide 49: Current accounts of individuals (ROR) at major banks, 2011-2013 Slide 50: Internet and PC penetration in Polish households and in corporate sector, shopping online, 2013 Slide 51: Number of accounts with online access and number of online accounts actively used, 2008-2013 Slide 52: Online Banking - mBank case, 2001-2012 (discontinued) Slide 53: Online Banking - new entrants: ING and Citibank and perspectives for standalone internet projects Slide 54: Mobile Banking - availability of mobile account access , overview of top 10 banks Slide 55: Mobile Banking - concepts of the future: Alior Sync (t-mobile usługi bankowe) , new mBank Slide 56: Innovation in payments – PKO IKO, PeoPay, iKasa, SkyCash, mPay, Orange Cash, T-mobile , MyWallet , Visa V.me Slide 57: Bill payments market structure, 2012 (discontinued) Slide 58: Investment funds assets evolution, domestic and foreign funds, 2007-2013 Slide 59: Investment funds - top 10 players, 2013 Slide 60: Personal Financial Assets (PFA) structure and evolution, 2010-2013 Slide 61: Loans to private individuals by type evolution, 2007-2013 Slide 62: Mortgage to private individuals by currency evolution, 2007-2013 Slide 63: Mortgage to private individuals – new sales, outstanding contracts, 2007-2013 Slide 64: Consumer lending market, volumes and values, 2010-2013 Slide 65: Loans penetration in Poland vs. EU, EUROBAROMETER 2008/2009 Slide 66: Dedicated car loans market, 2009-2012 Slide 67: Value and number of loans and investment products sold by major intermediaries, 2012
Inteliace Research
Ban
king M
arket in P
olan
d 2014–201
6
4
TABLE OF CONTENTS (3/4)
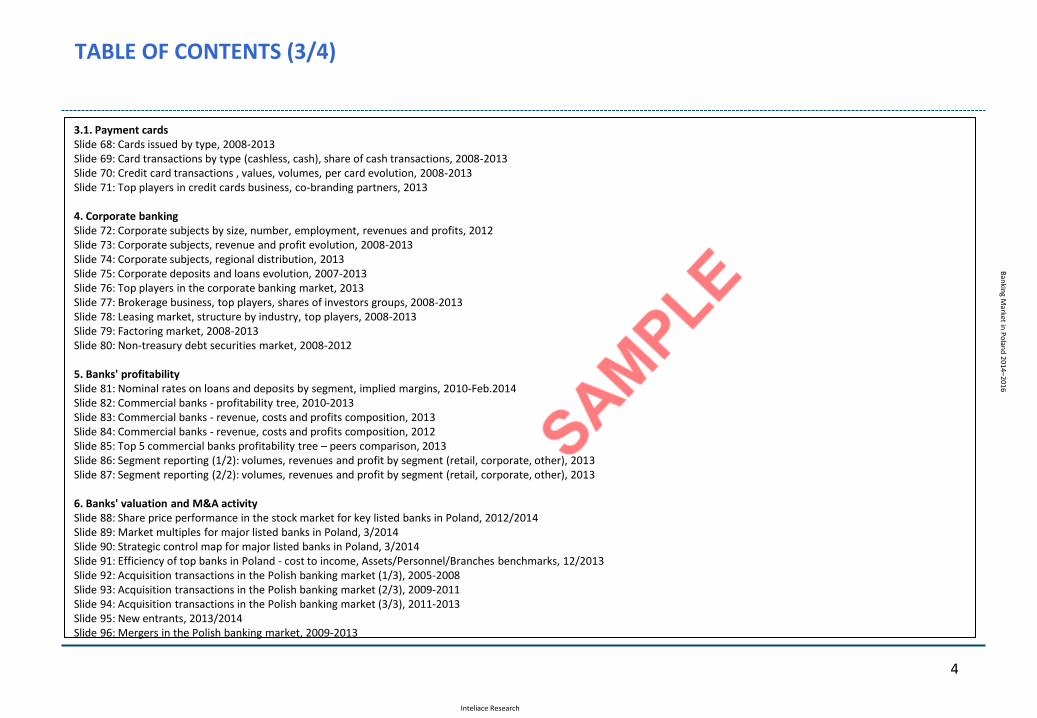
3.1. Payment cards Slide 68: Cards issued by type, 2008-2013 Slide 69: Card transactions by type (cashless, cash), share of cash transactions, 2008-2013 Slide 70: Credit card transactions , values, volumes, per card evolution, 2008-2013 Slide 71: Top players in credit cards business, co-branding partners, 2013 4. Corporate banking Slide 72: Corporate subjects by size, number, employment, revenues and profits, 2012 Slide 73: Corporate subjects, revenue and profit evolution, 2008-2013 Slide 74: Corporate subjects, regional distribution, 2013 Slide 75: Corporate deposits and loans evolution, 2007-2013 Slide 76: Top players in the corporate banking market, 2013 Slide 77: Brokerage business, top players, shares of investors groups, 2008-2013 Slide 78: Leasing market, structure by industry, top players, 2008-2013 Slide 79: Factoring market, 2008-2013 Slide 80: Non-treasury debt securities market, 2008-2012 5. Banks' profitability Slide 81: Nominal rates on loans and deposits by segment, implied margins, 2010-Feb.2014 Slide 82: Commercial banks - profitability tree, 2010-2013 Slide 83: Commercial banks - revenue, costs and profits composition, 2013 Slide 84: Commercial banks - revenue, costs and profits composition, 2012 Slide 85: Top 5 commercial banks profitability tree – peers comparison, 2013 Slide 86: Segment reporting (1/2): volumes, revenues and profit by segment (retail, corporate, other), 2013 Slide 87: Segment reporting (2/2): volumes, revenues and profit by segment (retail, corporate, other), 2013 6. Banks' valuation and M&A activity Slide 88: Share price performance in the stock market for key listed banks in Poland, 2012/2014 Slide 89: Market multiples for major listed banks in Poland, 3/2014 Slide 90: Strategic control map for major listed banks in Poland, 3/2014 Slide 91: Efficiency of top banks in Poland - cost to income, Assets/Personnel/Branches benchmarks, 12/2013 Slide 92: Acquisition transactions in the Polish banking market (1/3), 2005-2008 Slide 93: Acquisition transactions in the Polish banking market (2/3), 2009-2011 Slide 94: Acquisition transactions in the Polish banking market (3/3), 2011-2013 Slide 95: New entrants, 2013/2014 Slide 96: Mergers in the Polish banking market, 2009-2013 .
Inteliace Research
Ban
king M
arket in P
olan
d 2014–201
6
5
TABLE OF CONTENTS (4/4)
7. Top 5 banks - Profiles Slide 97-98: Bank profiles: PKO Bank Polski Slide 99-100: Bank profiles: Bank Pekao Slide 101-102: Bank profiles: mBank Slide 103-104 Bank profiles: ING Bank Śląski Slide 105-106: Bank profiles: BZ WBK 8. Mid-term forecasts Slide 107: Banking assets forecast, 2014-2016 Slide 108: Key retail volumes forecast, 2014-2016 Slide 109: Key corporate volumes forecast, 2014-2016 9. Notes on methodology
Inteliace Research
Ban
king M
arket in P
olan
d 2014–201
6
6
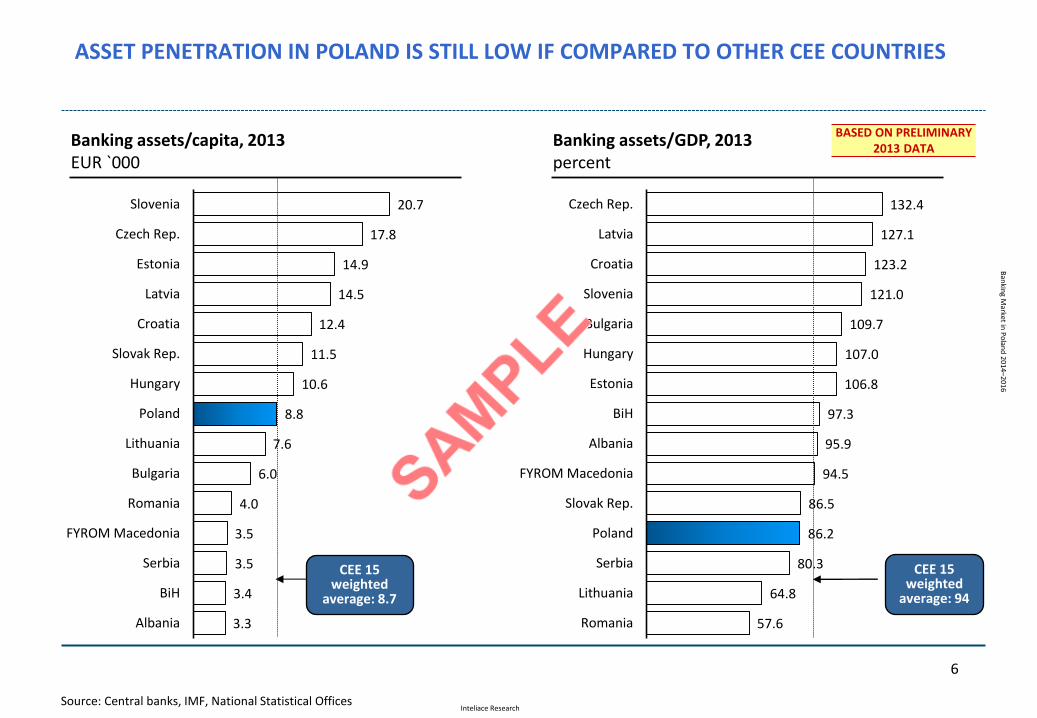
Banking assets/capita, 2013 EUR `000
Banking assets/GDP, 2013 percent
Source: Central banks, IMF, National Statistical Offices
ASSET PENETRATION IN POLAND IS STILL LOW IF COMPARED TO OTHER CEE COUNTRIES
20.7
17.8
14.9
14.5
12.4
11.5
10.6
8.8
7.6
6.0
4.0
3.5
3.5
3.4
3.3
Slovenia
Czech Rep.
Estonia
Latvia
Croatia
Slovak Rep.
Hungary
Poland
Lithuania
Bulgaria
Romania
FYROM Macedonia
Serbia
BiH
Albania
CEE 15 weighted
average: 94
CEE 15 weighted
average: 8.7
132.4
127.1
123.2
121.0
109.7
107.0
106.8
97.3
95.9
94.5
86.5
86.2
80.3
64.8
57.6
Czech Rep.
Latvia
Croatia
Slovenia
Bulgaria
Hungary
Estonia
BiH
Albania
FYROM Macedonia
Slovak Rep.
Poland
Serbia
Lithuania
Romania
BASED ON PRELIMINARY 2013 DATA
Inteliace Research
Ban
king M
arket in P
olan
d 2014–201
6
7
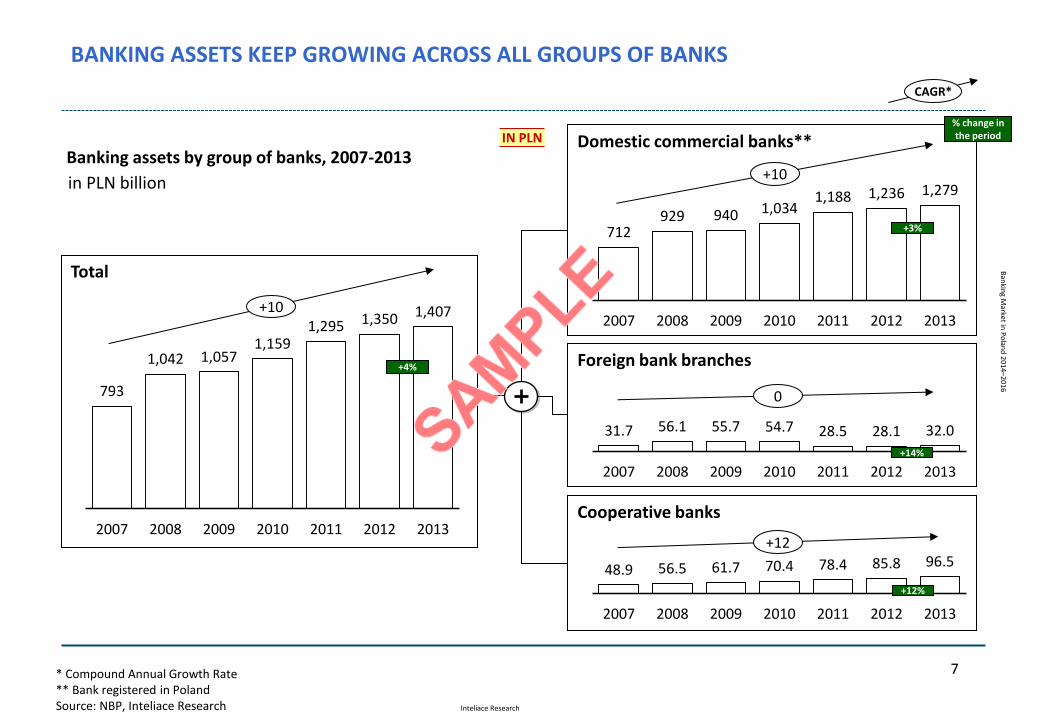
BANKING ASSETS KEEP GROWING ACROSS ALL GROUPS OF BANKS
CAGR*
Total
+10
* Compound Annual Growth Rate ** Bank registered in Poland Source: NBP, Inteliace Research
Banking assets by group of banks, 2007-2013 +10
+12
Foreign bank branches 0 793
1,042 1,057 1,159
1,295 1,350 1,407
2007 2008 2009 2010 2011 2012 2013
712 929 940 1,034
1,188 1,236 1,279
2007 2008 2009 2010 2011 2012 2013
31.7 56.1 55.7 54.7 28.5 28.1 32.0
2007 2008 2009 2010 2011 2012 2013
in PLN billion
48.9 56.5 61.7 70.4 78.4 85.8 96.5
2007 2008 2009 2010 2011 2012 2013
IN PLN
+4%
+3%
+14%
+12%
Domestic commercial banks**
Cooperative banks
% change in the period
Inteliace Research
Ban
king M
arket in P
olan
d 2014–201
6
8
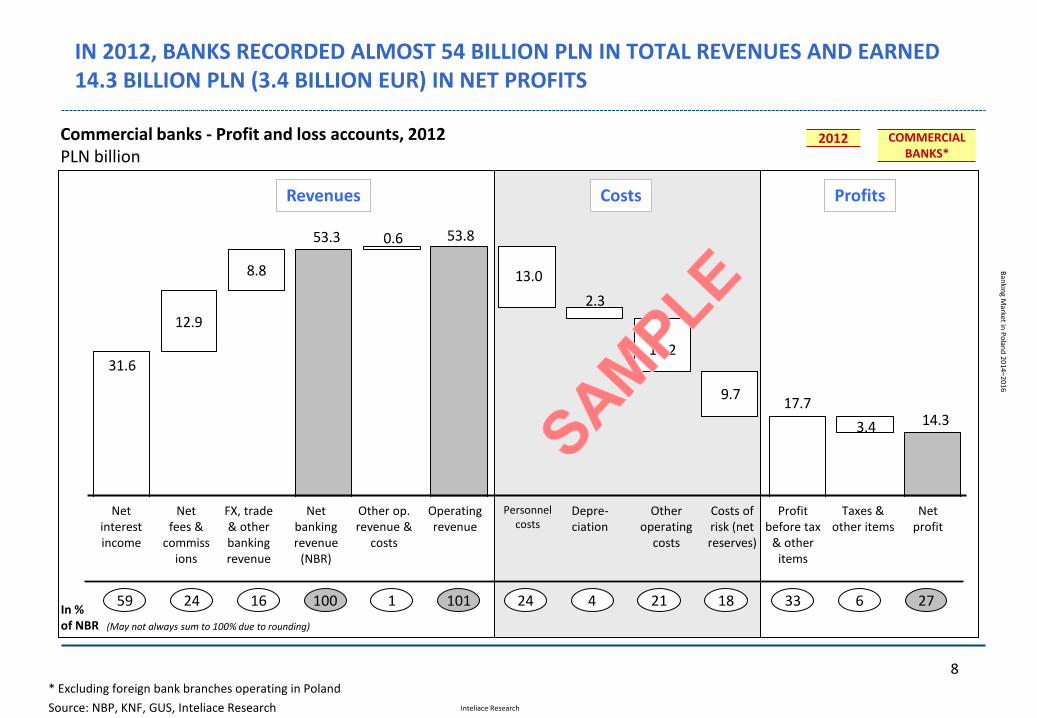
31.6
12.9
8.8
53.3 0.6 53.8
13.0
2.3
11.2
9.717.7
3.4 14.3
IN 2012, BANKS RECORDED ALMOST 54 BILLION PLN IN TOTAL REVENUES AND EARNED 14.3 BILLION PLN (3.4 BILLION EUR) IN NET PROFITS
Net interest income
Net fees &
commissions
FX, trade & other banking revenue
Net banking revenue
(NBR)
Personnel costs
Other operating
costs
Costs of risk (net reserves)
Profit before tax
& other items
Taxes & other items
Net profit
Commercial banks - Profit and loss accounts, 2012 PLN billion
59 In % of NBR
* Excluding foreign bank branches operating in Poland
Source: NBP, KNF, GUS, Inteliace Research
Depre-ciation
24 16
Other op. revenue &
costs
Operating revenue
100 1 101 24 4 21 18 33 6 27
(May not always sum to 100% due to rounding)
Costs Profits Revenues
COMMERCIAL BANKS*
2012
Inteliace Research
Ban
king M
arket in P
olan
d 2014–201
6
9
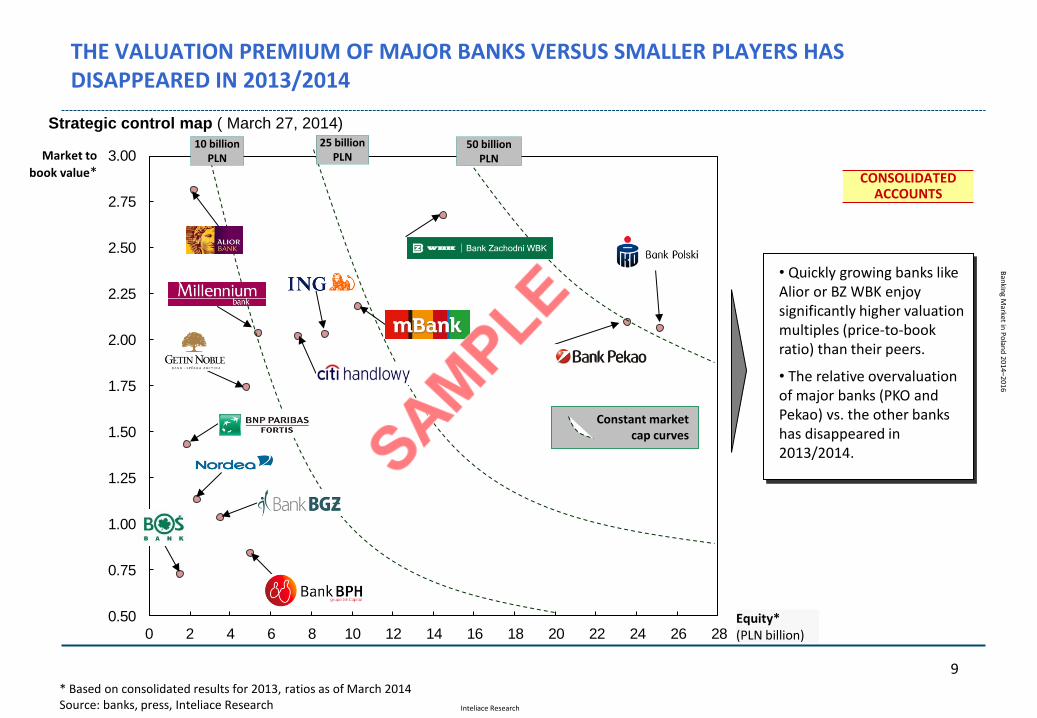
THE VALUATION PREMIUM OF MAJOR BANKS VERSUS SMALLER PLAYERS HAS DISAPPEARED IN 2013/2014
0.50
0.75
1.00
1.25
1.50
1.75
2.00
2.25
2.50
2.75
3.00
0 2 4 6 8 10 12 14 16 18 20 22 24 26 28Equity* (PLN billion)
Market to
book value*
Constant market cap curves
* Based on consolidated results for 2013, ratios as of March 2014 Source: banks, press, Inteliace Research
• Quickly growing banks like Alior or BZ WBK enjoy significantly higher valuation multiples (price-to-book ratio) than their peers.
• The relative overvaluation of major banks (PKO and Pekao) vs. the other banks has disappeared in 2013/2014.
CONSOLIDATED ACCOUNTS
50 billion PLN
10 billion PLN
Strategic control map ( March 27, 2014) 25 billion
PLN
Inteliace Research
Ban
king M
arket in P
olan
d 2014–201
6
10
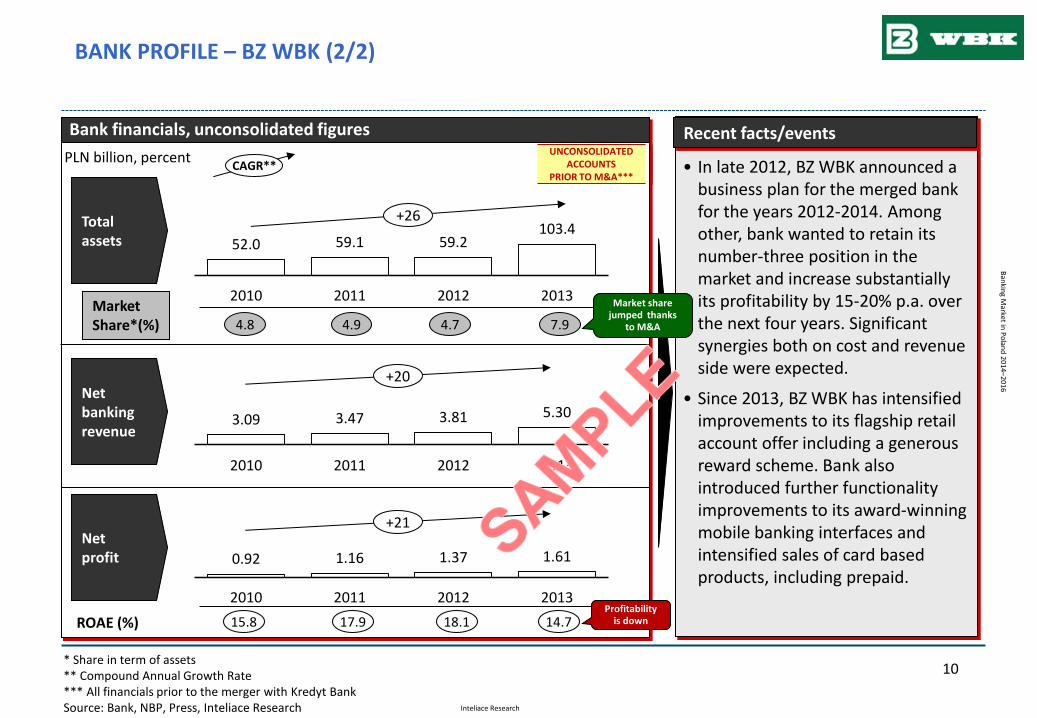
BANK PROFILE – BZ WBK (2/2)
Bank financials, unconsolidated figures
* Share in term of assets ** Compound Annual Growth Rate *** All financials prior to the merger with Kredyt Bank Source: Bank, NBP, Press, Inteliace Research
Total assets
Net banking revenue
Net profit
• In late 2012, BZ WBK announced a business plan for the merged bank for the years 2012-2014. Among other, bank wanted to retain its number-three position in the market and increase substantially its profitability by 15-20% p.a. over the next four years. Significant synergies both on cost and revenue side were expected.
• Since 2013, BZ WBK has intensified improvements to its flagship retail account offer including a generous reward scheme. Bank also introduced further functionality improvements to its award-winning mobile banking interfaces and intensified sales of card based products, including prepaid.
Recent facts/events
ROAE (%)
Market Share*(%)
PLN billion, percent
4.8 4.9 7.9
15.8 17.9 14.7
CAGR** UNCONSOLIDATED
ACCOUNTS PRIOR TO M&A***
52.0 59.1 59.2 103.4
2010 2011 2012 2013
3.09 3.47 3.81 5.30
2010 2011 2012 2013
0.92 1.16 1.37 1.61
2010 2011 2012 2013
Market share jumped thanks
to M&A 4.7
18.1
+26
+20
+21
Profitability is down
Inteliace Research
Ban
king M
arket in P
olan
d 2014–201
6
About this report
This report has been prepared using Inteliace
Research proprietary research and publicly available
sources, including: financial reports, press
publications, industry magazines, directories,
financial databases and expert opinions.
Views presented in this report reflect solely the
independent and unbiased opinion of Inteliace
Research and authors.
All due care has been taken in the production of this
report. However, Inteliace Research does not accept
any responsibility or liability for any omissions or
inaccuracies of the information contained in this
publication.
This report is copyrighted. Any distribution, storage,
replication and usage is restricted to Inteliace
Research clients only. In case of any doubt please
contact us at: [email protected]
About Inteliace Research
Inteliace Research is an independent and privately
owned research firm based in the heart of Eastern
Europe in Warsaw / Poland.
Our company specializes in value-added research
services and tailored business intelligence solutions.
Through our customized research services we help our
clients to better understand their customers,
competitors and overall market dynamics.
The lead researcher and founder of Inteliace Research
is Marcin Mazurek.
Our contact details:
Inteliace Research
Foksal 17B / 31,
00-372 Warszawa, Poland
Tel. +48 22 408 66 20, Tel. +48 502 512 178
Fax. +48 22 349 21 40
mail: [email protected]
http://www.inteliace.com/en/publications.php
11

Inteliace Research
Ban
king M
arket in P
olan
d 2014–201
6
Visit http://www.inteliace.com for more details
Recent Reports:
2013
• February - Mortgage Lending in Poland ’13
• May - Banking Market in Poland ’13
• May - Bank outlets database ’13
• June - Insurance Market in Poland ’13
• September - Top 200 CEE banks ’13
• December - Investment Funds and Asset Mgmt. ’13
2014
• February - Mortgage Lending in Poland ’14
• May - Bank outlets database ’14
• May - Insurance agent commission survey ’14
• May - Banking Market in Poland ’14
upcoming
• June - Insurance Market in Poland ’14
• September - Top 200 CEE banks ’14
• December - Investment Funds and Asset Mgmt. ’14
and many other ...
RECENT PUBLICATIONS BY INTELIACE RESEARCH
Inteliace Research
BA
ZA
PLA
CÓ
WE
K B
AN
KO
WY
CH
W P
OLS
CE
I ST
AT
YS
TY
KA
PO
WIA
TÓ
W, 2
011
1
BANK OUTLETS DENSITY IN POLAND (1/3)GĘSTOŚĆ SIECI PLACÓWEK BANKOWYCH W POLSCE (1/3)
37
59
75
176
35
28
38
4888
52
56
44
59
28
67
66
40-60
< 40
>60
Liczba/Number
Number of bank outlets per 1000 sq km, by region, 2011Liczba placówek na 1000 km2 powierzchni wg. województw, 2011r.
The Southern and Central Poland have the largest density of bank outlets
Południowa oraz centralna Polska są najgęściej pokryte siecią placówek bankowych na km2
Źródło/Source: Inteliace Research
Średnia / Average= 58
Inteliace Research
BA
ZA
PL
AC
ÓW
EK
BA
NK
OW
YC
H W
PO
LS
CE
I ST
AT
YS
TY
KA
PO
WIA
TÓ
W, 2
01
1
1
BANK OUTLETS DENSITY IN POLAND (3/3)GĘSTOŚĆ SIECI PLACÓWEK BANKOWYCH W POLSCE (3/3)
Źródło/Source : Inteliace Research
Number of outlets per 1 million inhabitants, by county „powiat”, 2011Liczba placówek bankowych na 1 milion mieszkańców, wg. powiatów, 2011r.
Minimum: 126
Maximum: 947
MedianaMedian (443) Number of bank outlets per 1 million
inhabitants varies a lot on county level
Na poziomie powiatów gęstość placówekjest bardzo zróżnicowana
100 200 300 400 500 600 700 800 900 1000
37
9 p
ow
iató
w
Inteliace Research
GE MONEY BANK – OVERVIEW
7.4 8.3 9.1
2003 2004 2005
10.9
1.6
AssetsPLN billion
* Although Expander is distributing products from various banks, GE offer / for example mortgage/ is reported to be favoured** Compound Annual Growth RateSource: Inteliace Analysis
CAGR**
Concept Description Results
1.6 1.7
Timeline
History & Background
LoansPLN billion
Net ProfitPLN billion
Target Clients
Products
Channels
20.4 26.7 22.8ROE (%)
Market share(%)
6.6 7.6 8.6
2003 2004 2005
0.14
0.30 0.32
2003 2004 2005
14.2
51.2
• Affluent individuals and professionals looking for mortgage. Valuing quick processing and flexibility, sometimes not fulfilling lending criteria set by other banks (for example job contract or own funds level)• Mass market clients looking for simple and quick consumer loans
Only lending products on offer:• mortgage• refinancing loan• credit cards• installment loans • cash loans• car loans
• GE money bank - 48 branches• GEpard, ~200 used car dealers• Dobry Kredyt consumer finance – 12 outlets and ~1000 POS• Expander - 33 branches - financial products distributor*
• In 1995, GE group purchased a small regional bank: „Solidarność Chase D.T. Bank”. Bank was rebranded soon to GE Capital Bank.
• In 1998, GE group purchased another small bank (PAMBank)and converted it to a mortgage specialist: GE Bank Mieszkaniowy
• In 2004, GE group acquired POS lending specialist :Chrobry with a network of ~1000 POS. Chrobry was renamed to: Dobry Kredyt
• In 2004 , a used car dealers network was created under the GEpard brand, being the main channel for car loans sales
• As of Jan. 2005, all GE activities in Poland wereconsolidated under one roof: GE Capital bank
Shareholders
• Top notch risk management and collection• High performing sales staff• Fast loan processing and flexibility• High margins • Control over distributors (GEpard, Expander, Dobry Kredyt)• Advanced cross-selling between segments
As of March 2006
99
1
General Electric Company
Other