banking industry, market structure and efficiency;...
TRANSCRIPT

BANKING INDUSTRY, MARKET STRUCTURE AND EFFICIENCY: THE REVISITED MODEL TO INTERMEDIARY HYPOTHESES
Sami Mensi; High School of Business of Tunis (ESCT), University of Manouba & PS2D Laboratory, FSEG Tunis. E-mail: [email protected]
Abderrazak ZOUARI; Higher Business Studies Institute (IHEC), .
University of The 7th November at Carthage . E-mail:
ABSTRACT: The object of this article is to propose a new conception of the structure-conduct-performance/ efficient structure relationship. Alongside standard hypotheses, we retain two intermediary hypotheses, named modified efficient structure hypothesis and hybrid efficiency/collusion hypothesis. The models are estimated using a random effects estimating procedure over a sample of Tunisian commercial banks during the period 1990-2005. The results about the variable efficiency cannot reject the efficient structure hypothesis. Besides, the results do not show any support in favour of the classic SCP hypothesis and intermediary hypotheses. This suggests that during the period under consideration, the Tunisian banks adopt a sufficient competitive behaviour and that they generate their performance not through market power exercise, rather through an efficient activity.
JEL Classification: D41, G21, L10. Keywords: Market structure, Market power, Eficiency, Banking, Tunisia. 1. Introduction Several theories of industrial organization have been developed through time as early as the pioneering work of Mason (1939). The author suggests exogenous conditions determining the structure of the market, which affects the behaviour of firms and influences their performance. The major contributions to the development of hypotheses of market structure have been brought by Bain (1951) and Stigler (1964). Based on theories of oligopoly, Stigler (1964) suggests that effective collusion of firms is reinforced in as much as it the concentration of the market increases. Behaviour of firms in collusion determines the performance of each active entity in the market. Thus, firms over a concentrated market do not have as an objective the maximisation of individual profit rather it is the joint profit which is targeted. The traditional Structure-Conduct-Performance approach, treats the relation between the structure and performance through behaviour of firms in the market. A very important contribution to the structure-performance studies is the efficient structure hypothesis proposed by Demsetz (1973, 1974) and Peltzman (1977). The efficient structure paradigm suggests that market structure is determined by the efficiency of the operating firms. The researchers who defend the efficient structure model criticise the traditional market power model since the relationship
between market share, concentration and efficiency is excluded. In this alternative model, important profits are generated by large firms since the concentration is the product of efficiency. These profits are considered as an economic return and not as a return on monopoly. (Chortareas et al, 2009; Seelanatha, 2010). The majority of the recent studies on bank performance take into consideration the effects of efficiency on the relationship structure-performance. These studies are generally divided into two groups. The first group doe not explicitly incorporate the effect of efficiency in the analysis (Smirlock, 1985; Evanoff and Fortier, 1988; Lloyd-Williams et al,1994; Molyneux and Forbes, 1995; Alzaidanin, 2003). The second group of studies explicitly estimate components of efficiency (Berger and Hannan,1993; Berg and Kim,1994; Berger, 1995; Goldberg and Rai,1996; Berger and Hannan, 1995; Maudos,1998; Mendes and Rebelo,2003; Sathye, 2005; Papadoplous, 2004; Katib, 2004; Byeongyong, 2002; Byeongyong and Welss, 2008; Fu and Heffernan, 2009; Chortareas et al, 2009; Seelanatha, 2010). The differences among the two groups of studies hover around measurement of efficiency and the interpretation of the variable market share. Starting with this representation, it is not surprising to be confronted with mitigated results. The differences between these
Sami Mensi et. al., Int. J. Eco. Res., 2011 (2(1), 23-36 ISSN:2229-6158
IJER | JAN-FEB 2011 Available [email protected]
23
studies relate to as well to control variables and to other independent variables. Section 2 of this paper establishes the necessary theoretical framework. A brief description of the efficiency measure is given in section 3. Section 4 discusses intermediary hypotheses and presents model, followed by section 5 which provides the results and interpretations of the current empirical investigation. Section 6 draws conclusions. 2. The theoretical framework Appeared with the works of Mason (1939)and Bain (1951), revisited by Heggestad and Mingo (1976), Heggestad (1977), Rhoades and Ruts (1982) and Clark (1986), then developed by Ahmed and Khababa (2000), Alzaidanin (2003), Sathye (2005), SCP paradigm occupies the interest of the researchers who closely follow the evolution of markets structure. These authors worry about any evolution at the level of market structure and the economic and social repercussions that might result. The SCP model relates to old models, even the oldest models which are concerned with questions about the trilateral connection which relates the three poles of structure, conduct and performance. According to the logic of the SCP, market concentration reduces cost of collusion between firms and produces hyper normal profits. The less there are firms on the market (concentrated structure), the less competitive is the firm’s behaviour (price levels are elevated and/or weak output). The generated profits come from exploitation of market power, which naturally reduces consumer surplus. Simply put, the fundamental idea of the SCP approach is that the structure of the industry determines behaviour and influences performance of this industry. Companies’ results are thus determined by market structure. This paradigm describes how the observable characteristics of a market or of an industry could affect behaviour and performance of this market’s participants. The theoretical predictions of the SCP approach appear to be difficult to conciliate with the reality of the evolution of markets structures and the performance of their institutions. Indeed, research has been focused on new explanations of profit
generation and which do not come under the SCP guidelines. The years 1970s and 80s have witnessed the particular appearance of the works of Demsetz (1973), Peltzman (1977), Brozen (1982) and Smirlok (1985), which brought the theoretical foundation for the counter hypothesis to the SCP model, i.e. Efficient-Structure (ES). Proponents to the ES hypothesis believe that market concentration is not a random event. It is rather the result of a large market share of efficient firms. The most efficient firms are, by definition, those which have low costs. They earn as a consequence of market shares. This is why market share is retained as a proxy to efficiency. In simpler terms, the ES model stipulates that efficient firms could capture a market share and very important economic returns, which naturally leads to elevated concentration. The differences at the level of return rates among large and small firms explain the role of efficiency in the positive structure-profit relationship. Large firms earn elevated returns because of their efficiency. An exhaustive review of the theoretical and empirical literature reveals that the ES hypothesis is explored following serious attempts at modelling it under both versions, i.e. the implicit measurement of efficiency and the explicit measurement efficiency. The writings of Berger (1993), Berger (1995) and Berger and Hannan (1997) constitute the reference articles on the subject. Alzaidanin (2003), Smirlock (1985), Evanoff and Fortier (1988), Pilloff and Rhodes (2002), Ahmed and Khababa (2000), Lloyd-Williams et al (1994) and Molyneux and Forbes (1995), Katib (2004), Samad (2008), Seelanatha (2010) suggest that measurements of market concentration and market share must be jointly examined in empirical studies which test the relationship market-performance. Thus market share is interpreted as an indicator of efficiency: it is an implicit measure of efficiency. The studies which integrate market share as a proxy to efficiency stipulate that the profits generated by firms stream from their efficiency. The most efficient firms accumulate a large market share.
Sami Mensi et. al., Int. J. Eco. Res., 2011 (2(1), 23-36 ISSN:2229-6158
IJER | JAN-FEB 2011 Available [email protected]
24
The problem of the traditional specification is that for similar results the interpretation
is different. If 0CR
and 0MS
=∂∂
∂∂ ππ
,
according to Shepherd (1986), this denotes the existence of a market power. Market share only reflects market power. A divergent interpretation from the first is that of Smirlock (1985) who signals that the most efficient firms have low costs and earn thus market share. It is for this reason that we consider market share as a proxy to efficiency. Shepherd (1986), Timme and Yang (1991) and Berger (1995) criticise. these works because of the absence of direct efficiency measurement. Some authors see in the market share variable an inappropriate representation of bank efficiency since it incorporates dimensions other than efficiency. It is natural to think of an explicit efficiency measurement which we integrate in common regressions. This work is inspired by papers recently published by Sathye (2005), Mendes and Rebelo (2003), Maudos (1998), Fu and Heffernan (2009), Park and Weber (2006), Fiordelisi (2004), Byeongyong and Welss (2008), Katib (2004), Samad (2008), Chortareas et al (2009) and Seelanatha (2010). 3. Brief description of efficiency measurement This approach dates back to the publication of the Aigner et al (1977) and Charnes et al (1978) articles. It is an analysis based on envelopment of data (Data Envelopment Analysis), which requires no hypothesis over the form of the production function, the cost function or profit. It simply calls back linear programming. This method is particularly adapted to efficiency measurement relative to firms when several inputs are used to produce several outputs and, even better; it makes it possible when the production technique is uncertain and unknown. This method is called data envelopment because banks data on best practices envelope data of the remaining banks of the sample.
Farrell (1957) is the first who proposed a construction of a non-parametric efficiency frontier by through the available observations over productive activities. More specifically, this method consists of searching each producer or each decision-making unit; if there exists another producer who bypasses or there exists a producer who produces a large quantity of outputs with a given data input, or if, with a quantity of data outputs, the producer uses a little quantity of inputs. This “best” producer, if it exists, is thus characterized by quantities of inputs and outputs which are solutions of a linear optimization program. (Sathye, 2001; Fu and Heffernan 2007). This method consists of estimating the deviations in relation to efficient costs border. The distance between observed cost and its corresponding position in the border measures the inefficiency of an entity. DEA considers that any deviation from the observation in relation to its projection over the efficiency border represents inefficiency but without the presence of a random effect. Given that the DEA does not need specification of inefficiency, this method is very sensitive to incoherent observations and does not take into account measurement errors in the explanatory variables. Accordingly, we can say that this method overestimates inefficiency which imposes a degree of precaution in the interpretation of the calculated coefficients (Jemrić and Vujčić, 2002; Avkiran, 2006). Mathematically speaking, this method consists of resolving a linear program where the objective function envelopes the observed cases. It is thus a linear programming method which produces the best practice border composed of efficient firms or decision-making units (DMU). We follow the mathematical formulation represented in Fried et al (1993). We consider N banks or DMU, each one of them produces m outputs starting from an n inputs. In order to measure cost efficiency, we should take into account the price of inputs. Indeed, we establish this measure through the following linear program[1].
Sami Mensi et. al., Int. J. Eco. Res., 2011 (2(1), 23-36 ISSN:2229-6158
IJER | JAN-FEB 2011 Available [email protected]
25
∑ =≥
∑ ≤
∑ ≥
∑=
1λr -4 0λr -3
*jsXλrXjr -2
YisλrYir -1
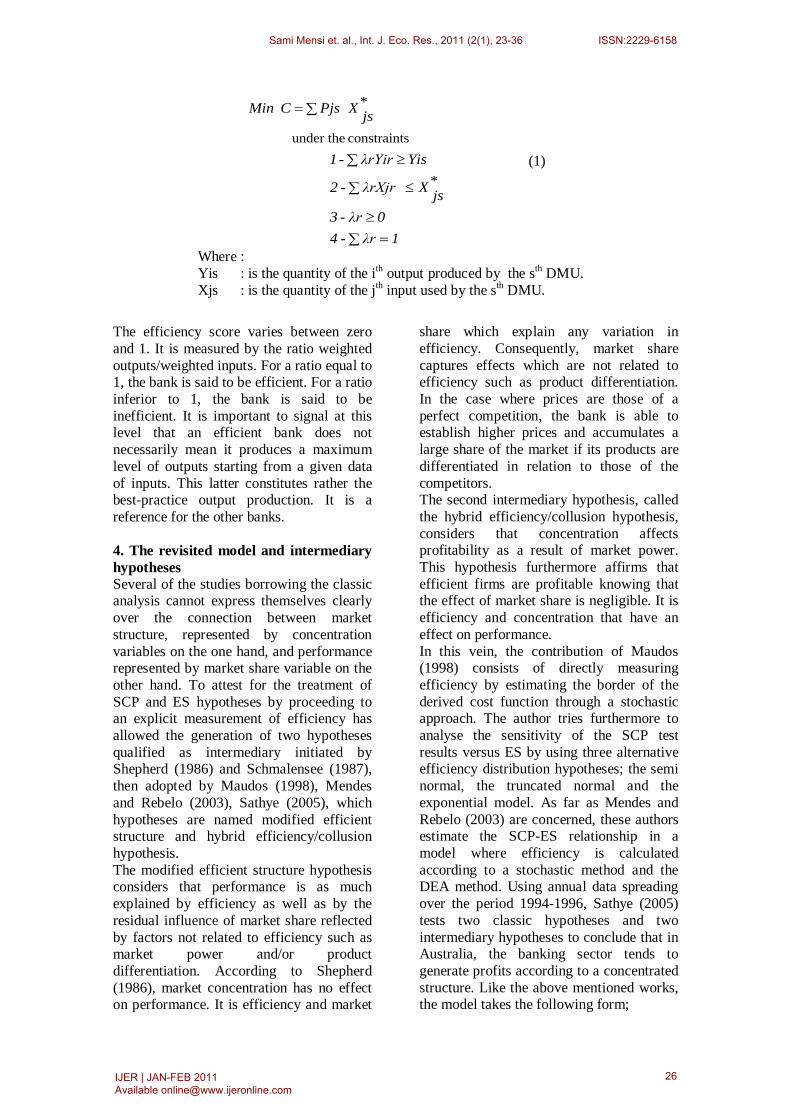
*jsXPjs CMin
sconstraint under the
(1)
Where : Yis : is the quantity of the ith output produced by the sth DMU. Xjs : is the quantity of the jth input used by the sth DMU.
The efficiency score varies between zero and 1. It is measured by the ratio weighted outputs/weighted inputs. For a ratio equal to 1, the bank is said to be efficient. For a ratio inferior to 1, the bank is said to be inefficient. It is important to signal at this level that an efficient bank does not necessarily mean it produces a maximum level of outputs starting from a given data of inputs. This latter constitutes rather the best-practice output production. It is a reference for the other banks. 4. The revisited model and intermediary hypotheses Several of the studies borrowing the classic analysis cannot express themselves clearly over the connection between market structure, represented by concentration variables on the one hand, and performance represented by market share variable on the other hand. To attest for the treatment of SCP and ES hypotheses by proceeding to an explicit measurement of efficiency has allowed the generation of two hypotheses qualified as intermediary initiated by Shepherd (1986) and Schmalensee (1987), then adopted by Maudos (1998), Mendes and Rebelo (2003), Sathye (2005), which hypotheses are named modified efficient structure and hybrid efficiency/collusion hypothesis. The modified efficient structure hypothesis considers that performance is as much explained by efficiency as well as by the residual influence of market share reflected by factors not related to efficiency such as market power and/or product differentiation. According to Shepherd (1986), market concentration has no effect on performance. It is efficiency and market
share which explain any variation in efficiency. Consequently, market share captures effects which are not related to efficiency such as product differentiation. In the case where prices are those of a perfect competition, the bank is able to establish higher prices and accumulates a large share of the market if its products are differentiated in relation to those of the competitors. The second intermediary hypothesis, called the hybrid efficiency/collusion hypothesis, considers that concentration affects profitability as a result of market power. This hypothesis furthermore affirms that efficient firms are profitable knowing that the effect of market share is negligible. It is efficiency and concentration that have an effect on performance. In this vein, the contribution of Maudos (1998) consists of directly measuring efficiency by estimating the border of the derived cost function through a stochastic approach. The author tries furthermore to analyse the sensitivity of the SCP test results versus ES by using three alternative efficiency distribution hypotheses; the semi normal, the truncated normal and the exponential model. As far as Mendes and Rebelo (2003) are concerned, these authors estimate the SCP-ES relationship in a model where efficiency is calculated according to a stochastic method and the DEA method. Using annual data spreading over the period 1994-1996, Sathye (2005) tests two classic hypotheses and two intermediary hypotheses to conclude that in Australia, the banking sector tends to generate profits according to a concentrated structure. Like the above mentioned works, the model takes the following form;
Sami Mensi et. al., Int. J. Eco. Res., 2011 (2(1), 23-36 ISSN:2229-6158
IJER | JAN-FEB 2011 Available [email protected]
26

itEFF3αitMS2αitCR1α0αitπ +++=
it
μjxjα∑ ++ (2)
The variables are defined as follows: π is the profit variable which is taken as one of the three indicators: (1) the Return on Assets (ROA) which is defined as the net results of the bank/total assets, (2) the Return on Equity (ROE) which is defined as the net results of the bank / total capital, and (3) the Net Interest Margin (NIM) = differential interest / total assets. Concentration variables (CR) are taken as (1) Herfindhal-Hirschman Index (HHI) which is defined as the Sum of Squares of individual banks’ market share and (2) as the concentration ratio of the three largest banks (CR3). Market Share (MS) is measured by (1) bank deposits to total deposits which is noted by (MSI1) and (2) by bank assets to total assets which is noted by (MSI2). Finally we define (EF) as the bank cost efficiency. The vector of j control variables, account for firm specific and market specific characteristics. These characteristics are inherent to the size, risk, cost and ownership. They are supposed to affect bank’s profitability as already proved by previous studies [2]. The variable DB [3] measures the size of the bank in terms of total deposits [4]. The relationship between the size of the bank and its profitability is supposed to be positive, in as much as large banks hold a better and strong position to expand, diversify their activities and achieve economies of scale in comparison to small banks (Goldberg and Rai, 1996). If the coefficient associated with the variable DB is negative, this result relates to the presence of scale diseconomies (Maudos, 1998). Another reason that banks might choose to become large is not related to scale economies but is instead the possibility that banks might want to become big so regulators deem them “too big to fail.” (Carmassi et al, 2010). The relationship between risk and profitability of the bank is supposed to be positive since an increase in incurred risk is ordinarily associated with an investment project highly profitable. The firms are
seeking gig returns in compensation for a risk they face. Accordingly, two risk variables are considered: the variable CAPAST defined by the ratio capital over total assets of the bank and the variable BR defined by the ratio total loans over total deposits of the bank. PCI or per capita income is a variable which affects several factors related to offer and demand of credits and deposits. A tendency towards a general consensus which admits a bilateral positive relationship between the real sphere and the financial sphere is under elaboration. According to Mendes and Rebelo (2003) [5],"It is expected that we the economy goes well, so does the bank industry" (p.14). However, banks which are implanted in countries with high income per capita tend to operate in a competitive environment allowing the generation of low interest margins [6]. The associated coefficient will be negative. The expected sign of the ratio personnel fees by the number of employees (WAGE) is negative. WAGE expresses a charge supported by the firm; which firm will have a higher profit so far as WAGE is low. Under the efficient structure hypothesis, this expected sign is justified. Efficient banks are those which operate at the lowest costs. Under the SCP hypothesis, banks in concentrated markets hold a market power which allows them to a monopolist potential. They find themselves in a situation of power and they impose their rules to potential competitors, as well as to personnel. OWNER and THREE are the two dummy variables of the model. The variable OWNER is equal to the unit when the bank is privately owned; equal to zero if it is state owned. According to this representation, private banks are supposed to be more performing than state-owned banks if the expected coefficient is positive. The variable THREE is equal to the unit when the bank belongs to the three largest banks. Expressed differently, it takes the value of zero. We expect a positive sign if the three largest banks are more profitable than the rest.
Sami Mensi et. al., Int. J. Eco. Res., 2011 (2(1), 23-36 ISSN:2229-6158
IJER | JAN-FEB 2011 Available [email protected]
27
The different hypotheses are mathematically formulated as follows: Pure collusion hypothesis
0EFFπ0;
MSπ0;
CRπ
=∂∂
=∂∂
∂∂
Efficient structure hypothesis
0EFFπ0;
MSπ0;
CRπ
∂∂
=∂∂
=∂∂
(3)
Modified efficient structure hypothesis
0EFFπ0;
MSπ0;
CRπ
∂∂
∂∂
=∂∂
The hybrid efficiency /collusion hypothesis
0EFFπ0;
MSπ0;
CRπ
∂∂
=∂∂
∂∂
5. Estimations and interpretations 5.1. Data and measurement of efficiency The Professional Association of Tunisian Banks is our principal source of data through its annual reports. We have as well used balance sheets and account results taken from the banks’ activities reports. The data concerns the period 1990-2005. The choice of the period is a function of the availability of the necessary information. The sample includes 10 banks. We retained the commercial banks having a regular activity over the period under consideration. The sample of banks retained includes three
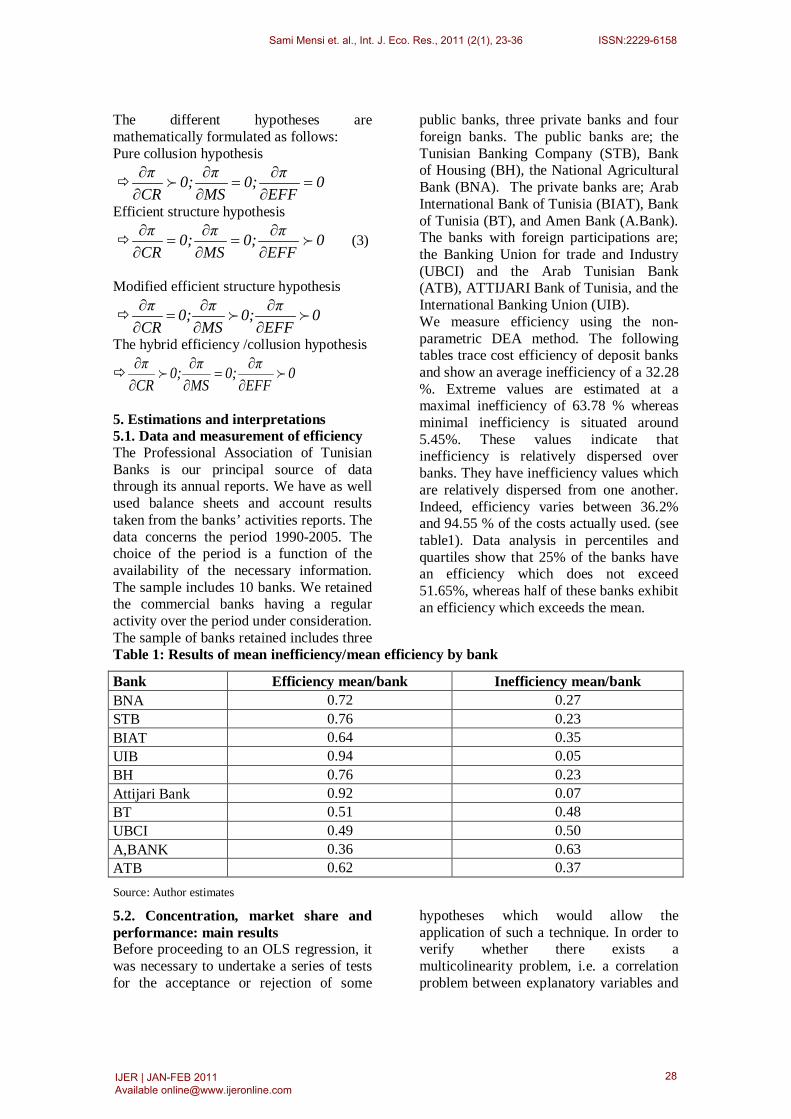
public banks, three private banks and four foreign banks. The public banks are; the Tunisian Banking Company (STB), Bank of Housing (BH), the National Agricultural Bank (BNA). The private banks are; Arab International Bank of Tunisia (BIAT), Bank of Tunisia (BT), and Amen Bank (A.Bank). The banks with foreign participations are; the Banking Union for trade and Industry (UBCI) and the Arab Tunisian Bank (ATB), ATTIJARI Bank of Tunisia, and the International Banking Union (UIB). We measure efficiency using the non-parametric DEA method. The following tables trace cost efficiency of deposit banks and show an average inefficiency of a 32.28 %. Extreme values are estimated at a maximal inefficiency of 63.78 % whereas minimal inefficiency is situated around 5.45%. These values indicate that inefficiency is relatively dispersed over banks. They have inefficiency values which are relatively dispersed from one another. Indeed, efficiency varies between 36.2% and 94.55 % of the costs actually used. (see table1). Data analysis in percentiles and quartiles show that 25% of the banks have an efficiency which does not exceed 51.65%, whereas half of these banks exhibit an efficiency which exceeds the mean.
Table 1: Results of mean inefficiency/mean efficiency by bank
Bank Efficiency mean/bank Inefficiency mean/bank BNA 0.72 0.27 STB 0.76 0.23 BIAT 0.64 0.35 UIB 0.94 0.05 BH 0.76 0.23 Attijari Bank 0.92 0.07 BT 0.51 0.48 UBCI 0.49 0.50 A,BANK 0.36 0.63 ATB 0.62 0.37 Source: Author estimates
5.2. Concentration, market share and performance: main results Before proceeding to an OLS regression, it was necessary to undertake a series of tests for the acceptance or rejection of some
hypotheses which would allow the application of such a technique. In order to verify whether there exists a multicolinearity problem, i.e. a correlation problem between explanatory variables and
Sami Mensi et. al., Int. J. Eco. Res., 2011 (2(1), 23-36 ISSN:2229-6158
IJER | JAN-FEB 2011 Available [email protected]
28
to be explained variables, we proceeded to calculating Variance Inflation Factors criterion which rejected the presence of serious multicolinearity problems [7]. The error homocedasticity hypothesis specifies that the variance of the error term is constant at each level. The heterocedasticity problem concerns the studies which adopted the Cross Section estimation technique; it comes from the heterogeneity of the sample. In order to resolve this problem, one of the solutions is to normalise the sample by dividing it by the size or by applying a loglinearisation technique. The Breusch-Pagan/ Cook-Weisberg test shows that it is rather the hypothesis H1 which is retained, i.e. the presence of heterocedasticity problem. The autocorrelation of errors is also assessed. In the case of a presence of error autocorrelation, the OLS estimator is not skewed but it is not efficient. Correction of this type of problem is done through a GLS estimator. It is the application of the Durbin-Watson test which would allow us detecting whether there exists an error autocorrelation problem. For a value close to 2, the problem does not exist, however, for a value close to zero or 4, autocorrelation is respectively positive or negative. In as far as we are concerned, Durbin-Watson statistic is estimated at 3.15 which allows for signalling the existence of a negative autocorrelation problem. The test for the existence of an individual specificity is also applied over our panel of data. It is the multiplied Breusch and Pagan Lagrangian test. It allows confirming partly the concerns of the heterocedasticity test, i.e. the heterogeneity of the sample. Thus, the individual specificity test joins the conclusions of the autocorrelation and error heterocedasticity tests, mainly the non
efficiency of the OLS procedure for this particular case. Analysis will thus be pushed to cut through the two GLS versions. To this effect, the Haussman test will be used. The results of the Haussman test support the exogeneity of the explanatory variables in relation to error terms. Under H0, it is the error-based model which is more efficient. We adopt it in order to undertake a number of estimations over different regressions. This choice allows us to compute the coefficients associated with the invariant variables of the model, which is impossible to generate for fixed-effects estimations. The contribution of our work in relation to previous studies is to have created binary combinations between the variables market share (MSI1 or MSI2) and the variables concentration (CR3 or HERF), which allowed exploring the market structure-performance relation in different ways. According to the profit specification, the SCP hypothesis is rejected, whereas the efficient structure hypothesis is not accepted only if we consider the ROE variable regressed over the variable CR3 or HERF. According to the price specification, the variables price joined to the dependent variables do not bring any confirmation to one or the other hypotheses. The signs are counter intuitive and non significant. Table 2 reports on the results of our research and shows that two out of twelve estimations exhibit coefficients with signs considered significant according to the exigency of the retained hypothesis, which is the efficient structure hypothesis. The two specifications which represent our interest are the following; ROE=f (CR3, MSI1, control variables) (4) ROE=f(HERF,MSI1,control variables) (5)
Sami Mensi et. al., Int. J. Eco. Res., 2011 (2(1), 23-36 ISSN:2229-6158
IJER | JAN-FEB 2011 Available [email protected]
29
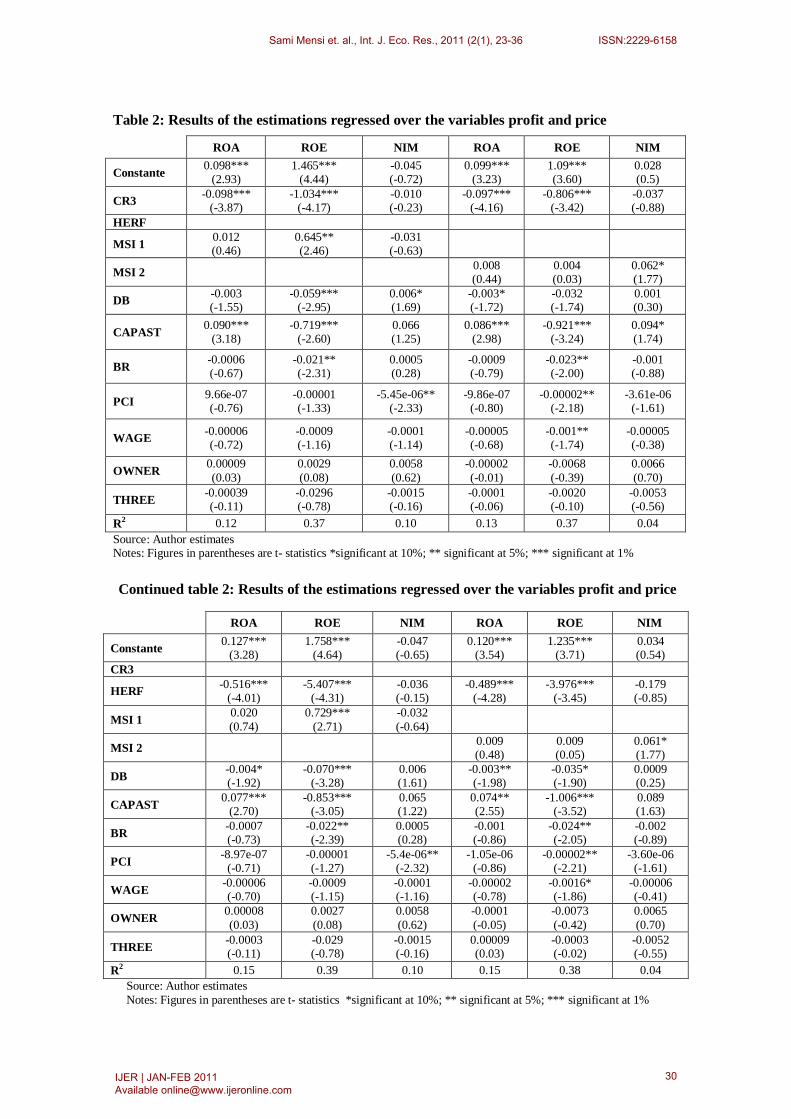
Table 2: Results of the estimations regressed over the variables profit and price
Source: Author estimates Notes: Figures in parentheses are t- statistics *significant at 10%; ** significant at 5%; *** significant at 1%
ROA ROE NIM ROA ROE NIM
Constante 0.098*** (2.93)
1.465*** (4.44)
-0.045 (-0.72)
0.099*** (3.23)
1.09*** (3.60)
0.028 (0.5)
CR3 -0.098*** (-3.87)
-1.034*** (-4.17)
-0.010 (-0.23)
-0.097*** (-4.16)
-0.806*** (-3.42)
-0.037 (-0.88)
HERF
MSI 1 0.012 (0.46)
0.645** (2.46)
-0.031 (-0.63)
MSI 2 0.008 (0.44)
0.004 (0.03)
0.062* (1.77)
DB -0.003 (-1.55)
-0.059*** (-2.95)
0.006* (1.69)
-0.003* (-1.72)
-0.032 (-1.74)
0.001 (0.30)
CAPAST 0.090*** (3.18)
-0.719*** (-2.60)
0.066 (1.25)
0.086*** (2.98)
-0.921*** (-3.24)
0.094* (1.74)
BR -0.0006 (-0.67)
-0.021** (-2.31)
0.0005 (0.28)
-0.0009 (-0.79)
-0.023** (-2.00)
-0.001 (-0.88)
PCI 9.66e-07 (-0.76)
-0.00001 (-1.33)
-5.45e-06** (-2.33)
-9.86e-07 (-0.80)
-0.00002** (-2.18)
-3.61e-06 (-1.61)
WAGE -0.00006 (-0.72)
-0.0009 (-1.16)
-0.0001 (-1.14)
-0.00005 (-0.68)
-0.001** (-1.74)
-0.00005 (-0.38)
OWNER 0.00009 (0.03)
0.0029 (0.08)
0.0058 (0.62)
-0.00002 (-0.01)
-0.0068 (-0.39)
0.0066 (0.70)
THREE -0.00039 (-0.11)
-0.0296 (-0.78)
-0.0015 (-0.16)
-0.0001 (-0.06)
-0.0020 (-0.10)
-0.0053 (-0.56)
R2 0.12 0.37 0.10 0.13 0.37 0.04
Continued table 2: Results of the estimations regressed over the variables profit and price
ROA ROE NIM ROA ROE NIM
Constante 0.127*** (3.28)
1.758*** (4.64)
-0.047 (-0.65)
0.120*** (3.54)
1.235*** (3.71)
0.034 (0.54)
CR3
HERF -0.516*** (-4.01)
-5.407*** (-4.31)
-0.036 (-0.15)
-0.489*** (-4.28)
-3.976*** (-3.45)
-0.179 (-0.85)
MSI 1 0.020 (0.74)
0.729*** (2.71)
-0.032 (-0.64)
MSI 2 0.009 (0.48)
0.009 (0.05)
0.061* (1.77)
DB -0.004* (-1.92)
-0.070*** (-3.28)
0.006 (1.61)
-0.003** (-1.98)
-0.035* (-1.90)
0.0009 (0.25)
CAPAST 0.077*** (2.70)
-0.853*** (-3.05)
0.065 (1.22)
0.074** (2.55)
-1.006*** (-3.52)
0.089 (1.63)
BR -0.0007 (-0.73)
-0.022** (-2.39)
0.0005 (0.28)
-0.001 (-0.86)
-0.024** (-2.05)
-0.002 (-0.89)
PCI -8.97e-07 (-0.71)
-0.00001 (-1.27)
-5.4e-06** (-2.32)
-1.05e-06 (-0.86)
-0.00002** (-2.21)
-3.60e-06 (-1.61)
WAGE -0.00006 (-0.70)
-0.0009 (-1.15)
-0.0001 (-1.16)
-0.00002 (-0.78)
-0.0016* (-1.86)
-0.00006 (-0.41)
OWNER 0.00008 (0.03)
0.0027 (0.08)
0.0058 (0.62)
-0.0001 (-0.05)
-0.0073 (-0.42)
0.0065 (0.70)
THREE -0.0003 (-0.11)
-0.029 (-0.78)
-0.0015 (-0.16)
0.00009 (0.03)
-0.0003 (-0.02)
-0.0052 (-0.55)
R2 0.15 0.39 0.10 0.15 0.38 0.04 Source: Author estimates Notes: Figures in parentheses are t- statistics *significant at 10%; ** significant at 5%; *** significant at 1%
Sami Mensi et. al., Int. J. Eco. Res., 2011 (2(1), 23-36 ISSN:2229-6158
IJER | JAN-FEB 2011 Available [email protected]
30

5.3. Market structure and performance: results of explicit efficiency measurement By introducing the variable efficiency in the initial specification, explanatory power has neatly improved in most regressions, which proves that, independently of our analysis and in absolute terms, market share cannot be interpreted as being a proxy variable for efficiency. The positive effect of market share is an indicator of the existence of market power. Such results support the efficient structure hypothesis. Berger (1995) thinks that if the parameter which accompanies the variable MS is statistically significant and that the coefficient did not change when the effect of efficiency is introduced in the estimation, this is translated by the fact that the MS variable cannot be interpreted as proxy variable in the regression. Besides, if the inclusion of the EFF variable brings nothing in terms of explanatory power, this denotes a lack of relevance of this variable in the model. After including the EFF variable, the specifications of interest are in a new form;
ROE=f (CR3, MSI1, EFF, control variables) (6) ROE=f (HERF, MSI1, EFF, control variables) (7) The estimations show coefficients significantly negative associated with the variables concentration (CR3 and HERF) and the variable EFF. The estimations show as well a coefficient significantly positive associated with the variable MS. Such results cannot reject the efficient structure hypothesis. The presence of the variable EFF does not modify our conclusions in terms of the explanatory hypothesis of the market structure-performance relation. The observations over the irrelevance of the rest of the regressions are confirmed. Indeed, the specifications retaining the variable efficiency cannot reject the efficient structure hypothesis. In addition, the results do not show any support in favour of the classic SCP hypothesis and the intermediary hypotheses because of the non-significance or the incoherence of the coefficients with the theoretical expectations. (See table 3)
Table 3: Results of the regressions with explicit efficiency measurement
ROA ROE NIM ROA ROE NIM
Constante 0.091*** (2.78)
1.512*** (4.71)
-0.034 (-0.54)
0.096*** (3.22)
1.074*** (3.67)
0.033 (0.57)
CR3 -0.093*** (-3.75)
-1.030*** (-4.09)
-0.017 (-0.37)
-0.092*** (-4.10)
-0.770*** (-3.31)
-0.040 (-0.97)
HERF
MSI 1 0.010 (0.39)
0.623** (2.36)
-0.027 (-0.56)
MSI 2 0.016 (0.90)
0.037 (0.20)
0.058* (1.69)
EFF -0.004*** (-3.11)
-0.045*** (-3.03)
0.005* (1.76)
-0.005*** (-3.19)
-0.047*** (-3.08)
0.004 (1.61)
DB -0.002 (-1.20)
-0.059*** (-3.00)
0.005 (1.42)
-0.002 (-1.56)
-0.028 (-1.62)
0.0004 (0.14)
CAPAST 0.083*** (3.01)
-0.913*** (-3.47)
0.076 (1.45)
0.089*** (3.13)
-0.945*** (-3.45)
0.101* (1.89)
BR -0.0009 (-0.99)
-0.026*** (-2.92)
0.0006 (0.36)
-0.0016 (-1.33)
-0.028** (-2.51)
-0.0017 (-0.77)
PCI -1.12e-06 (-0.91)
-0.00001 (-1.35)
-5.18e-06** (-2.25)
-9.88e-07 (-0.83)
-0.00002** (-2.26)
-3.5e-06 (-1.58)
WAGE -0.0001 (-1.31)
-0.0011 (-1.28)
-0.0001 (-0.78)
-0.0001 (-1.26)
-0.0018** (-2.14)
-0.00001 (-0.11
OWNER -0.0002 (-0.07)
-0.0028 (-0.19)
0.0061 (0.47)
-0.0002 (-0.08)
-0.0105 (-0.71)
0.0067 (0.53
THREE -0.0007 (-0.23)
-0.03005 (-1.60)
-0.0011 (-0.09)
-0.0010 (-0.33)
-0.0072 (-0.42)
-0.0046 (-0.37)
R2 0.28 0.47 0.07 0.27 0.45 0.03 Source: Author estimates Notes: Figures in parentheses are t- statistics *significant at 10%; ** significant at 5%; *** significant at 1%
Sami Mensi et. al., Int. J. Eco. Res., 2011 (2(1), 23-36 ISSN:2229-6158
IJER | JAN-FEB 2011 Available [email protected]
31
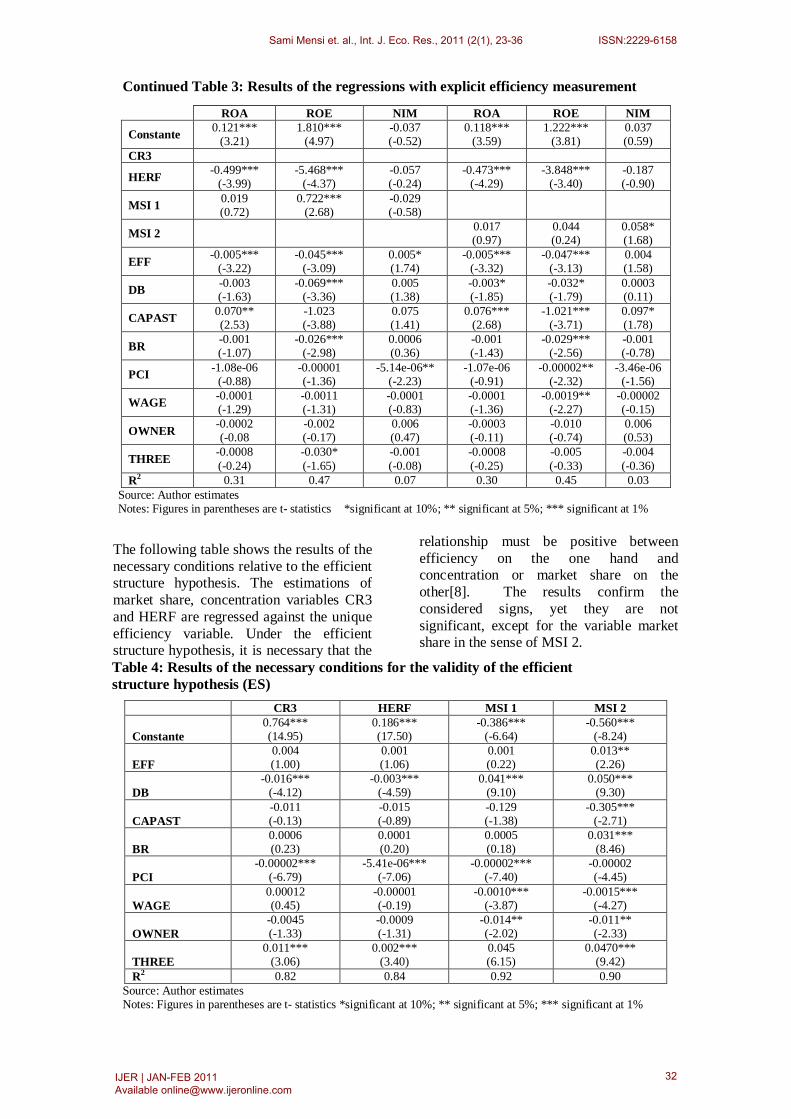
Continued Table 3: Results of the regressions with explicit efficiency measurement
The following table shows the results of the necessary conditions relative to the efficient structure hypothesis. The estimations of market share, concentration variables CR3 and HERF are regressed against the unique efficiency variable. Under the efficient structure hypothesis, it is necessary that the
relationship must be positive between efficiency on the one hand and concentration or market share on the other[8]. The results confirm the considered signs, yet they are not significant, except for the variable market share in the sense of MSI 2.
Table 4: Results of the necessary conditions for the validity of the efficient structure hypothesis (ES)
CR3 HERF MSI 1 MSI 2 Constante
0.764*** (14.95)
0.186*** (17.50)
-0.386*** (-6.64)
-0.560*** (-8.24)
EFF
0.004 (1.00)
0.001 (1.06)
0.001 (0.22)
0.013** (2.26)
DB
-0.016*** (-4.12)
-0.003*** (-4.59)
0.041*** (9.10)
0.050*** (9.30)
CAPAST
-0.011 (-0.13)
-0.015 (-0.89)
-0.129 (-1.38)
-0.305*** (-2.71)
BR
0.0006 (0.23)
0.0001 (0.20)
0.0005 (0.18)
0.031*** (8.46)
PCI
-0.00002*** (-6.79)
-5.41e-06*** (-7.06)
-0.00002*** (-7.40)
-0.00002 (-4.45)
WAGE
0.00012 (0.45)
-0.00001 (-0.19)
-0.0010*** (-3.87)
-0.0015*** (-4.27)
OWNER
-0.0045 (-1.33)
-0.0009 (-1.31)
-0.014** (-2.02)
-0.011** (-2.33)
THREE
0.011*** (3.06)
0.002*** (3.40)
0.045 (6.15)
0.0470*** (9.42)
R2 0.82 0.84 0.92 0.90 Source: Author estimates Notes: Figures in parentheses are t- statistics *significant at 10%; ** significant at 5%; *** significant at 1%
ROA ROE NIM ROA ROE NIM
Constante 0.121*** (3.21)
1.810*** (4.97)
-0.037 (-0.52)
0.118*** (3.59)
1.222*** (3.81)
0.037 (0.59)
CR3
HERF -0.499*** (-3.99)
-5.468*** (-4.37)
-0.057 (-0.24)
-0.473*** (-4.29)
-3.848*** (-3.40)
-0.187 (-0.90)
MSI 1 0.019 (0.72)
0.722*** (2.68)
-0.029 (-0.58)
MSI 2 0.017 (0.97)
0.044 (0.24)
0.058* (1.68)
EFF -0.005*** (-3.22)
-0.045*** (-3.09)
0.005* (1.74)
-0.005*** (-3.32)
-0.047*** (-3.13)
0.004 (1.58)
DB -0.003 (-1.63)
-0.069*** (-3.36)
0.005 (1.38)
-0.003* (-1.85)
-0.032* (-1.79)
0.0003 (0.11)
CAPAST 0.070** (2.53)
-1.023 (-3.88)
0.075 (1.41)
0.076*** (2.68)
-1.021*** (-3.71)
0.097* (1.78)
BR -0.001 (-1.07)
-0.026*** (-2.98)
0.0006 (0.36)
-0.001 (-1.43)
-0.029*** (-2.56)
-0.001 (-0.78)
PCI -1.08e-06 (-0.88)
-0.00001 (-1.36)
-5.14e-06** (-2.23)
-1.07e-06 (-0.91)
-0.00002** (-2.32)
-3.46e-06 (-1.56)
WAGE -0.0001 (-1.29)
-0.0011 (-1.31)
-0.0001 (-0.83)
-0.0001 (-1.36)
-0.0019** (-2.27)
-0.00002 (-0.15)
OWNER -0.0002 (-0.08
-0.002 (-0.17)
0.006 (0.47)
-0.0003 (-0.11)
-0.010 (-0.74)
0.006 (0.53)
THREE -0.0008 (-0.24)
-0.030* (-1.65)
-0.001 (-0.08)
-0.0008 (-0.25)
-0.005 (-0.33)
-0.004 (-0.36)
R2 0.31 0.47 0.07 0.30 0.45 0.03 Source: Author estimates Notes: Figures in parentheses are t- statistics *significant at 10%; ** significant at 5%; *** significant at 1%
Sami Mensi et. al., Int. J. Eco. Res., 2011 (2(1), 23-36 ISSN:2229-6158
IJER | JAN-FEB 2011 Available [email protected]
32

6. Conclusion In order to take into account the evolution of the paradigms treating the market structure-performance relationship and its genuine contribution to performance in terms of market power exercise and efficiency generation, we will attempt to contribute to a theoretical controversy largely debated in the literature between two theories, that of SCP and Efficient Structure. Apart from the classic hypotheses, two intermediary hypotheses are discussed; the modified Efficient Structure hypothesis and the hybrid efficiency/collusion hypothesis. The distinctive feature of the intermediary hypotheses is that they do not retain the market share variable as proxy to efficiency, but they proceed to a direct efficiency measurement. With the help of the DEA technique, we measure cost efficiency of Tunisian commercial banks. We have, then, undertaken a series of empirical validations, using a random effects Generalised Least Square method (GLS), targeting the assessment of the enigmatic market structure-performance relationship over the period 1990-2005. We have been inspired by classic empirical investigations, among which are those of Smirlock (1985), Evanoff and Fortier (1988), Lloyd-Williams and Molyneux (1994), Molyneux and Forbes (1995), and we have used recent models, among which are those of Fiordelisi (2004), Mendes and Rebelo (2003), Maudos (1998), Pilloff and Rhoades (2002), Katib(2004), Sathye (2005), Fu and Heffernan (2009), Park and Weber (2006), Byeongyong and Welss (2008). In line with the works of Chortareas et. al (2009) and Seelanatha (2010), the results of our regression analysis confirm the retention of the Efficient Structure hypothesis and the rejection of the SCP and the intermediary modified efficient structure and efficiency collusion hypotheses. These results suggest that over the period under consideration, the Tunisian banks adopted behaviour sufficiently competitive and that they generate their performances not through market power
exercise, rather through an efficient activity.
References
Ahmed, A.M. and Khababa N. (2000). Performance of the Banking Sector in Saudi Arabia, Journal of Financial Management and Analyses.
Aigner, D.J., Lovell, C.A.K., and Schmidt, S. (1977). Formulation and Estimation of Stochastic Frontier Production Function Models, Journal of Econometrics, N°.6, pp.21-37.
Al-Obaidan, A.M. (2008). Market Structure, Concentration and Performance in the Commercial Banking Industry of Emerging Markets, European Journal of Economics, Finance and Administrative Sciences, No.12.
Alzaidanin, J.S. (2003). An Investigation of Bank Profitability and Market Concentration in the United Arab Emirates Financial System, Bangor Business School Staff Publications & Working Papers.
Avkiran, N.K. (2006). Developing Foreign Bank Efficiency Models for DEA Grounded in Finance Theory, Socio-Economic Planning Sciences, Vol.40, pp.275-296.
Bain, J.S. (1951). Relation of Profit Rate to Industry Concentration, Quaterly Journal of Economics, Vol.65, pp.293-324.
Berg, S.A., and Kim, M. (1994). Oligopolistic Interdependance and the Structure of Production in Banking: An Empirical Evaluation, Journal of Money, Credit and Banking, Vol.26, pp.405-431.
Berger, A.N. (1993). The Profit- Structure RelationShip in Banking –Tests of Market Power and Efficient- Structure Hypotheses, Journal of Money, Credit and Banking, N°.26.
Berger, A.N. (1995). The Profit-Structure Relationship in banking- Tests of Market Power and Efficient-Structure Hypotheses, Journal of Money,
Sami Mensi et. al., Int. J. Eco. Res., 2011 (2(1), 23-36 ISSN:2229-6158
IJER | JAN-FEB 2011 Available [email protected]
33
Credit and Banking, Vol.27,N°.2,pp.404-431.
Berger, A.N., and Hannan, T.H. (1993). Using Efficiency Measures to Distinguish Among Alternative Explanations of the Structure-Performance Relationship in Banking, N°.93-18, Finance and Economics Discussion Series, Federal Reserve Board.
Berger, A.N., and Hannan, T.H. (1997). Using Efficiency Measures to Distinguish Among Alternative Explanations of the Structure-Performance Relationship in Banking”, Managerial Finance, Vol.23, N°.1, pp. 6-31.
Brozen, Y. (1982). Concentration, Mergers, and Public Policy, New York: Macmillan Publishing Company, Inc
Byeongyong, C. (2002). An Empirical Investigation of Market Structure, Efficiency, and Performance in Property-Liability Insurance, Temple University.
Byeongyong, C., and Welss, M.A. (2008). State Regulation and the Structure, Conduct, Efficiency and Performance of US Auto Insurance”, Journal of Banking and Finance, vol.32, N°1.
Carmassi, J., Luchetti, E and Micossi, S. (2010). Overcoming too Big to Fail, A Regulatory Framework to Limit Moral Hazard and Free Riding in the Financial Sector, Report of the CEPS- Assonime Task Force on Bank Crisis Resolution”, Centre for European Policy Studies, Brussels.
Charnes, A., Cooper, W.W., and Rhodes, E. (1978). Measuring Efficiency of Decision Making Units, European Journal of Operational Research, 2, pp 429-444.
Chortareas, G.E., Garza-Garcia, J.G. & C. Girardone, C. (2009). Banking Sector Performance in Latin America: Market Power versus Efficiency, Centre for Global Finance, Working Paper Series No. 01/09
Clark, J.A. (1986). Single-Equation, Multiple Regression Methodology: Is It an Appropriate Methodology for the Structure-Performance Relationship in Banking, Journal of Monetary Economics, Vol.18, N°.3, pp.259-312.
Demsetz, H. (1973). Industry Structure, Market Rivalry and Public Policy, Journal of Law and Economics, Vol.16, N°.1, pp.1-9.
Demsetz, H. (1974). Tow Systems of Belief About Monopoly.
Evanoff, D.D., and Fortier, D.L. (1988). Reevaluation of the Structure-Conduct-Performance Paradigm in Banking, Journal of Financial Services Research, Vol.1, pp.277-94.
Farrell, M.J. (1957). The Measurement of Productive Efficiency, The Journal of the Royal Statistical Society, Serie A (General III), pp. 253-281.
Fiordelisi, F. (2004). The Profit-Structure Relationship Accounting for Technical and Allocative Efficiency: An application to the Italian Factoring Industry, Bangor Business School Staff Publication and Working Papers.
Fu, X., and Heffernan, S. (2007). Cost X-efficiency in Chian’s Banking Sector, China Economic Review, Vol.18, pp.35-53.
Fu, X., and Heffernan, S. (2009). The Effects of Reform on China’s Bank Structure and Performance, Journal of Banking and Finance, Vol.33, N°1, pp.39-52.
Goldberg, L.G., and Rai, A. (1996). The Structure-Performance Relationship for European Banking, Journal of Banking and Finance, Vol. 20, pp. 617-645.
Heggested, A.J. (1977). Market Structure, Risk, and Profitability in Commercial Banking, Journal of Finance, Vol.32, pp. 1207-1216
Sami Mensi et. al., Int. J. Eco. Res., 2011 (2(1), 23-36 ISSN:2229-6158
IJER | JAN-FEB 2011 Available [email protected]
34

Heggested, A.J., and Mingo, J.J. (1976). Prices, Non Prices, and Competition in Commercial Banking, Journal of Money, Credit and Banking, Vol.8, N°.2, pp.107-117.
Jemrić, I., and Vujčić, B. (2002). Efficiency of Banks in Croatia: A DEA Approach, Croatian National Bank, W-7, February 2002.
Katib, M.N. (2004). Market Structure and Performance in the Malaysian Banking Industry: A Robust Estimation, 8th Capital Markets Conference, Indian Institute of Capital Markets Paper.
Lloy-Williams, D.M., Molyneux, P., and Thornton, J. (1994). Market Structure and Performance in Spanish Banking, Journal of Banking and Finance, Vol.18, pp.445-459.
Mason, E.S. (1939). Price and Production Policies of Large-Scale Enterprise, American Economic Review, 29, 61-74.
Maudos, J. (1998). Market Structure and Performance in Spanish Banking Using a Direct Measure of Efficiency, Applied Financial Economics, Vol. 8, pp. 191-200.
Mendes, V., and Rebelo, J. (2003). Structure and Performance in the Portuguese Banking Industry in the Nineties, Portuguese Economic Journal, N°.2, pp.53-68.
Molyneux, P., and Forbes, W. (1995). Market Structure and Performance in European Banking, Applied Economics, Vol.27, pp.155-59.
Papadopoulos, S. (2004).Market Structure, Performance and Efficiency in European Banking, International Journal of Commerce and Management, Vol. 14, N°1.
Park, K.H., and Weber, W. (2006). Profitability of Korean Banks: Test of Market Structure versus Efficient Structure, Journal of Economics and Business, Vol. 58, pp.222-239.
Peltzman, S. (1977). The gains and Losses from Industrial Concentration, Journal of Law, and Economics. Vol.20, N°.3, pp. 229-263.
Pilloff, S.J., and Rhoades, S.A. (2002). Structure and Profitability in Banking markets, Review of Industrial Organization, Vol. 20, N°.1, pp.81-98.
Rhoades, S.A., and Rutz, R.D. (1982). Market Power and Firm Risk: A Test for Quite Life" Hypothesis, Journal of Monetary Economics, Vol.9, N°.1, pp.73-85.
Samad, A. (2008). Market Structure, Conduct and Performance: Evidence From the Bangladesh Banking Industry, Journal of Asian Economics, Vol.19, pp.181-193.
Sathye, M. (2001). X-Efficiency in Australian Banking: An Empirical Investigation, Journal of Banking and Finance, Vol.25, pp. 613-630.
Sathye, M. (2005). Market Structure and Performance in Australian Banking, Review of Accounting and Finance, Vol. 4, N°2, pp.107-122.
Schmalensee, R. (1987). Collusion Versus Differential Efficiency: Testing Alternative Hypotheses, Journal of Industrial Economics, Vol.35, pp. 399-425.
Seelanatha, L. (2010). Market Structure, Efficiency and Performance of Banking Industry in Sri Lanka, Banks and Bank Systems, Vol. 5, No.1.
Shepherd, W.G. (1986). Tobins’q and the Structure-Performance Relationship: Comment, The American Economic Review, Vol.76, N°.5, pp. 1205-1210.
Smirlock, M. (1985). Evidence on the (Non) Relationship Between Concentration and Profitability in Banking, Journal of Money, Credit and Banking, Vol. 17, N°1, pp.69-83.
Stigler, A., 1964. A Theory of Oligopoly, Journal of Political Economy, Vol.72, pp. 44-61.
Sami Mensi et. al., Int. J. Eco. Res., 2011 (2(1), 23-36 ISSN:2229-6158
IJER | JAN-FEB 2011 Available [email protected]
35

Timme, S.G., and Yang, W.K. (1991). On the Use of a Direct Measure of Efficiency in Testing Structure-Performance Relationship, Working Paper, Georgia State University.
Notes
[1] The mathematical programming approach generates a solutions vector represented by inputs of each firm after cost minimisation. In relation to inputs and outputs quantity price vector, the solution vector X* is used to compute cost efficiency (EFF) of each firm. A bank with EFF= 1 is the most cost efficient bank in the sample. A bank with EFF=0.65 might produce the same level of output with only 65 percent of current expenses.
[2] See Ahmed and Khababa (2000); Pilloff and Rhoades (2002).
[3] Like Goldberg and Rai (1996), we loglinearize the variable DB in order to reduce scale effect.
[4] In contrast to our study, Goldberg and Rai (1996) measure the size of the bank by total assets.
[5] The authors consider the variable annual growth rate of GDP instead of PCI.
[6] We owe this interpretation to Goldberg and Rai (1996) under the label maturity hypothesis.
[7] VIF is equal to 0.124 superior to 0.05 eliminates all suppositions of multicolinearity problems.
[8] If we concern ourselves with inefficiency, this relationship must have a negative sign.
Sami Mensi et. al., Int. J. Eco. Res., 2011 (2(1), 23-36 ISSN:2229-6158
IJER | JAN-FEB 2011 Available [email protected]
36