banking and currency crises.0907 - federal reserve … · both foreign and domestic credit...
TRANSCRIPT
Banking and Currency Crises: How Common Are Twins?
September 7, 1999
Reuven Glick Michael HutchisonFederal Reserve Bank of Department of EconomicsSan Francisco University of California, Santa Cruz101 Market Street Social Sciences 1San Francisco, CA Santa Cruz, CA 95064Email: [email protected] Email: [email protected]
We thank Mark Peralta, Rasmus Fatum, and Kathleen McDill for research assistance. The viewspresented in this paper are those of the authors alone and do not necessarily reflect those of theFederal Reserve Bank of San Francisco or the Board of Governors of the Federal Reserve System.
Abstract
The coincidence of banking and currency crises associated with the Asian financial crisishas drawn renewed attention to causal and common factors linking the two phenomena. In thispaper, we analyze the incidence and underlying causes of banking and currency crises in 90industrial and developed countries over the 1975-97 period. We measure the individual and joint(“twin”) occurrence of bank and currency crises and assess the extent to which each type of crisisprovides information about the likelihood of the other.
We find that the twin crisis phenomenon is most common in financially liberalizedemerging markets. The strong contemporaneous correlation between currency and bank crises inemerging markets is robust, even after controlling for a host of macroeconomic and financialstructure variables and possible simultaneity bias. We also find that the occurrence of bankingcrises provides a good leading indicator of currency crises in emerging markets. The conversedoes not hold, however, as currency crises are not a useful leading indicator of the onset of futurebanking crises. We conjecture that the openness of emerging markets to international capitalflows, combined with a liberalized financial structure, make them particularly vulnerable to twincrises.
1
1. Introduction
The joint occurrence of banking and currency crises associated with the recent Asian
financial turmoil has drawn renewed attention to the interrelationship between these two
phenomena. Banking and currency crises appeared to arise virtually at the same time in Thailand,
Indonesia, Malaysia, and Korea in 1997-98. In fact, the incidence of “twin” crises has been
relatively widespread, occurring in such diverse parts of the world as in Latin America in the
early and mid-1980s and in Scandinavia in the early 1990s.
There are good theoretical reasons to expect connections between currency and banking
crises, especially since foreign assets and liabilities are a component in commercial banks’
balance sheets. In principle, the causality between bank and currency crises may run in either
direction. As we discuss in Section 2, bank crises may lead to currency crises under some
circumstances, while under other conditions currency crises may cause bank crises. Moreover,
some recent literature does not distinguish between the two phenomena and regards them as
simultaneous manifestations of underlying common factors (Chang and Velasco, 1999).
Most of the empirical literature on currency and banking crises has involved analyzing
the determinants of each type of crisis independently of the other. Little empirical work to date
has systematically investigated the association of bank and currency crises. The few exceptions
(e.g. Kaminsky and Reinhart, 1999; Rossi, 1999) typically restrict their data sets to a limited
number of countries experiencing crises.1
In this paper, we empirically investigate the causal linkages between bank and currency
crises using a broad country and time-series data set. Using a broad control group of countries
and periods that includes observations with and without crises allows us to draw more general
1 An exception is Eichengreen and Rose (1998) who examine the impact of exchange rate regimes andvariability on the probability of bank crises in a large sample of developing countries.
2
conclusions about the conditions that distinguish crisis from tranquil periods both across
countries and across time.
In our empirical analysis, we first provide a detailed statistical overview of the individual
and joint (“twin”) occurrence of bank and currency crises for 90 industrial and developing
countries over the 1975-97 period. We examine the frequency, regional concentration,
association, and relative timing of the onsets of both bank and currency crises. In addition, we
assess the value of banking crises in helping to predict future currency crises, and vice versa,
using signal-to-noise ratio methodology. We also examine the contemporaneous and lagged
relationship of currency and banking crises more formally by estimating the probabilities of the
onset of currency and banking crises with probit regressions, using bivariate, multivariate, and
simultaneous equation specifications.
We find that the twin crisis phenomenon is concentrated in financially liberalized
emerging market economies and is not a general characteristic of either bank or currency crises
in a broader set of countries. The linkage between the onset of currency and bank crises in
emerging markets is strong, indicating that foreign exchange crises feed into the onset of banking
problems and vice versa. This result is robust to model specification and estimation technique.
Moreover, only in emerging market economies are banking crises a significant leading indicator
of future currency crises. Currency crises do not appear to be a particularly good signal of future
banking problems.
The organization of the paper is as follows: Section 2 describes the relevant literature on
the possible links between bank and currency crises. Section 3 discusses the data used in our
empirical analysis. Section 4 presents the summary statistical features of the data and signal-to-
noise ratio results. Section 5 presents the results of probability model (probit) estimates. Section
6 concludes the paper.
3
2. Linkages Between Currency and Banking Crises
The association of bank and currency crises and the occurrence of “twin” crises may be
attributable to a number of channels of causation: a bank crisis leading to a currency crisis, a
currency crisis leading to a bank crisis, or joint causality. In this section, we provide a brief
survey of the existing literature concerning the linkages between the onset of bank and currency
crises.
2.1. Causality from Banking Sector Distress to Currency Crises
A number of papers discuss the possibility of causality running from banking problems to
currency crises. Obstfeld (1994), for example, argues that a weak banking sector may precipitate
a currency crisis if rational speculators anticipate that policymakers will choose inflation over
exchange rate stability in order to avoid bankruptcies and further strains on the banking sector
rather than endure the costs of defending the domestic currency. Velasco (1987) and Calvo
(1997) argue that a bank run can cause a currency attack if the increased liquidity associated with
a government bailout of the banking system is inconsistent with a stable exchange rate. Miller
(1999) explicitly considers currency devaluation as one of the logical policy options for a
government confronted by a bank run in a fixed exchange rate regime. Gonzalez-Hermosillo
(1996) shows that a bank crisis may lead to a currency crisis in a poorly developed financial
system where agents may substitute foreign assets for domestic assets.
If banking sector unsoundness can contribute to a currency crisis, what causes a banking
crisis? Leading candidate explanations include the well-known “moral hazard” problems in
banking associated with financial liberalization and government deposit insurance, and large
macroeconomic shocks such as a sharp fall in underlying asset values (e.g. “bubble” crash in
asset prices). An alternative, “non-fundamentals,” explanation is that “bank runs” may occur
4
because of the expectations of individual depositors and creditors (see Diamond and Dybvig,
1983).
2.2. Causality from Currency Crises to Banking Sector Distress
A possible reverse chain of causality, from currency crises to the onset of banking crises,
is also well recognized. Miller (1996), for example, shows that a speculative attack on a currency
can lead to a bank crisis if deposit money is used to speculate in the foreign exchange market and
banks are “loaned up.” Rojas-Suarez and Weisbrod (1995) and Obstfeld (1994) argue that a
currency crisis may lead to problems in a vulnerable banking sector if policymakers respond to
the pressure on the exchange rate by sharply raising interest rates. A common feature of these
mechanisms is that banks are already “vulnerable” because of large unhedged foreign liabilities
and/or a maturity mismatch between asset and liabilities, and a shock arising from the currency
market pushes them “over the edge.” A currency crisis shock can adversely alter the banking
sector directly by causing a deterioration of bank balance sheets if the currency depreciates, or
indirectly by causing the central bank to raise interest rates to defend the currency.
If currency crises lead to bank crises, what causes currency crises? Candidate
explanations based on fundamentals, usually termed “first generation” models of the collapse of
fixed exchange rates, include overvalued real exchange rates and other macroeconomic factors
such as inflation, budget deficits, and rapid credit expansion (Krugman, 1979). The main
alternative explanations, based on the role of non-fundamentals, are frequently termed “second-
generation” models of exchange rate regime collapse (Obstfeld, 1994). This literature focuses on
the existence of multiple equilibria and self-fulfilling speculative attacks that can arise from the
willingness of policymakers to give up a pegged exchange rate if output and unemployment costs
exceed a certain threshold.
5
2.3. Joint Causality
The joint occurrence of “twin crises” may also reflect a response to common factors.
Chang and Velasco (1999), for example, emphasize the role of international illiquidity as a
common “fundamental, defined as a situation in which a country’s consolidated financial system
has potential short-term obligations that exceed the amount of foreign currency to which it can
have access on short notice. They argue that an international liquidity shortfall may be a
sufficient, though not necessary, condition to trigger a crisis: “The options left after creditors lose
confidence and stop rolling over and demand immediate payment on existing loans— whether to
the private sector in Asia or to the government in Mexico and Brazil— are painfully few. The
collapse of the currency, of the financial system, or perhaps both is the likely outcome.”
Another common fundamental factor emphasized in this literature is financial
liberalization combined with moral hazard incentives that induce banks to take on particularly
risky portfolios, including unhedged foreign currency liabilities. McKinnon and Pill (1996,
1998), for example, emphasize the role of financial liberalization in generating dynamics leading
to a twin crisis. Financial liberalization and deposit insurance may fuel a lending boom involving
both foreign and domestic credit expansion that eventually leads to a banking and currency
crisis.
More generally, Kaminsky and Reinhart (1999) point out that it is possible that “because
the seeds of the problems are sown at the same time, which event occurs first is a matter of
circumstance.” An example they employ to illustrate a twin crisis, jointly caused by common
factors or events, is the “perverse” dynamics of an exchange rate-based inflation stabilization
plan, such as that of Mexico in 1987 and the Southern Cone countries in the late 1970s. Reinhart
and Vegh (1995) provide empirical evidence that these types of plans have similar dynamics: an
early consumption boom is financed by expansion of bank credit and foreign borrowing. The
6
boom is accompanied by real exchange rate appreciation because domestic inflation only
converges gradually to the international inflation rate due to inertial effects in wage contracting
and price expectations. At some point, the high level of foreign borrowing, reflected in a current
account deficit, may be perceived as unsustainable and trigger an attack on the currency. As
capital inflows turn to outflows and asset markets crash, the banking sector is affected as well.
3. Data
3.1. Defining Currency Crises
Currency crises are typically defined as “large” changes in some indicator of actual or
potential currency value. Some studies focus on episodes of large depreciation alone (e.g.
Frankel and Rose, 1996), while others include episodes of speculative pressure in which the
exchange rate did not always adjust because the authorities successfully defended the currency
by intervening in the foreign exchange market or raising domestic interest rates (e.g.
Eichengreen, Rose, and Wyplosz, 1995; Moreno, 1995; Kaminsky and Reinhart, 1999).
Alternative criteria have been employed in the literature for identifying “large” changes in
currency value or pressure relative to what is considered “normal.” Some studies employ an
exogenous threshold rate of depreciation common to all countries in the analysis (e.g., Frankel
and Rose, 1996; Kumar, Moorthy, and Penaudin, 1998), while others define the threshold in
terms of country-specific moments (e.g., Kaminsky and Reinhart, 1999; Kaminsky, Lizondo, and
Reinhart, 1998; IMF, 1998; Esquivel and Larrain, 1998; Glick and Moreno, 1998; Moreno,
1999).2
2 Furman and Stiglitz (1998) and Berg and Patillo (1999) evaluate the predictive power of a range ofmodel methodologies and definitions for the 1997 Asia crisis.
7
In this study our indicator of currency crises is constructed from “large” changes in an
index of currency pressure, defined as a weighted average of monthly real exchange rate changes
and monthly (percent) reserve losses.3 The weights are inversely related to the variance of
changes of each component over the sample for each country. Our measure presumes that any
nominal currency changes associated with exchange rate pressure should affect the purchasing
power of the domestic currency, i.e. result in a change in the real exchange rate (at least in the
short run). This condition excludes some large depreciations that occur during high inflation
episodes, but it avoids screening out sizable depreciation events in more moderate inflation
periods for countries that have occasionally experienced periods of hyperinflation and extreme
devaluation.4 Large changes in exchange rate pressure are defined as changes in our pressure
index that exceed the mean plus 2 times the country-specific standard deviation.5, 6
3 Our currency pressure measure of crises does not include episodes of defense involving sharp rises ininterest rates. Data for market-determined interest rates are not available for much of the sample periodin many of the developing countries in our dataset.
4 This approach differs from Kaminsky and Reinhart (1999), for example, who deal with episodes ofhyperinflation by separating the nominal exchange rate depreciation observations for each countryaccording to whether or not inflation in the previous 6 months was greater than 150 percent, andcalculate for each sub-sample separate standard deviation and mean estimates with which to defineexchange rate crisis episodes.
5 Kaminsky and Reinhart (1999) use a three standard deviation cut-off. While the choice of cut-off pointis somewhat arbitrary, Frankel and Rose (1996) and Kumar, Moorthy, and Penaudin (1998) suggest thatthe results are not very sensitive to the precise cut-off chosen in selecting crisis episodes.
6 We have also constructed an alternative measure of currency crises following Esquivel and Larrain(1998) that employs a hybrid condition: the monthly depreciation in the (real) exchange rate either (i)exceeds 15 percent, provided that the depreciation rate is also substantially higher than that in theprevious month, or (ii) exceeds the country-specific mean plus 2 standard deviations of the realexchange rate monthly growth rate, provided that it also exceeds 5 percent. The first condition insuresthat any large (real) depreciation is counted as a currency crisis, while the second condition attempts tocapture changes that are sufficiently large relative to the country-specific monthly change of the (real)exchange rate. The results of our analysis are unaffected by use of this alternative measure.
8
3.2. Defining Bank Crises
Banking problems are usually difficult to identify empirically because of data limitations.
The potential for a bank run is not directly observable and, once either a bank run or large-scale
government intervention has occurred, the situation most likely will have been preceded by a
protracted deterioration in the quality of assets held by banks. Identifying banking sector distress
by the deterioration of bank asset quality is also difficult since direct market indicators of asset
value are usually lacking. This is an important limitation since most banking problems in recent
years are not associated with bank runs (liability side of the balance sheet) but with deterioration
in asset quality and subsequent government intervention. Moreover, it is often laxity in
government analysis of banking fragility, and slow follow-up action once a problem is
recognized, that allows the situation to deteriorate to the point of a major bank crisis involving
large-scale government intervention.
Given these conceptual and data limitations, most studies have employed a combination
of events to identify and date the occurrence of a bank crisis. Institutional events usually include
forced closure, merger, or government intervention in the operations of financial institutions,
runs on banks, or the extension of large-scale government assistance. Other indicators frequently
include measures of non-performing assets, problem loans, and so on. We have identified and
dated episodes of banking sector distress following the criteria of Caprio and Klingebiel (1996,
and updated on the IMF WebPage) and Demirgüç-Kunt and Detragiache (1998a). If an episode
of banking distress is identified in either study, it is included in our sample. If there is ambiguity
9
over the timing of the episode, we use the dating scheme of Demirgüç-Kunt and Detragiache
(1998a) since it tends to be more specific about the precise start and end of each episode.7
3.3. Determinants of Currency and Banking Crises
The theoretical and empirical literature has identified a vast array of variables potentially
associated with currency and banking crises (see Kaminsky, Lizondo, and Reinhart, 1998;
Demirgüç-Kunt and Detragiache, 1998a; and Hutchison and McDill, 1999). The choice of
explanatory variables in our analysis was determined by the questions we posed earlier, the
availability of data, and previous results found in the literature. Our objective is to postulate a
“canonical” model of currency and banking crises in order to form a basic starting point to
investigate the linkages between currency and banking crises. We postulate quite simple basic
models with few explanatory variables. The main source of the macro data is the International
Monetary Fund’s International Financial Statistics (CD-ROM). The data series and sources are
described in Appendix B.
The key explanatory variables used in our analysis of currency crises are the degree of
real currency overvaluation, export revenue growth, and the M2/foreign reserves ratio. Prior to
episodes of sharp depreciation, we expect the real trade-weighted exchange rate to be
overvalued. We define overvaluation as deviations from the fitted trend in the real trade
weighted exchange rate, created by taking the trade-weighted sum of the bilateral real exchange
rates (defined in terms of CPI indices) against the U.S. dollar, the deutschemark, and the yen,
7 Demirgüç-Kunt and Detragiache (1998a, 1998b) identify banking sector distress as a situation whereone of the following conditions hold: ratio of non-performing assets to total assets is greater than 2percent of GDP; cost of the rescue operation was at least 2 percent of GDP; banking sector problemsresulted in a large scale nationalization of banks; and extensive bank runs took place or emergencymeasures such as deposit freezes, prolonged bank holidays, or generalized deposit guarantees wereenacted by the government in response to the crisis.
10
where the trade-weights are based on the average bilateral trade with the U.S., Europe, and Japan
in 1980.
We also expect export growth (in U.S. dollars) to be sluggish, and the growth rate of
M2/foreign reserves to be higher, prior to a currency crisis. A slowdown in export growth
indicates a decline in foreign exchange earnings that in turn may set up the expectation— and
speculative pressure— of a currency decline. A rise in the M2/foreign reserves ratio implies a
decline in the foreign currency backing of the short-term domestic currency liabilities of the
banking system. This would make it difficult to stabilize the currency if sentiment shifts against
it.
Several other variables were considered in this study but were not included in the
reported regressions (for brevity) since they did not increase explanatory power: the current
account/GDP ratio, nominal and real M2 growth, nominal and real domestic credit (net of claims
on the public sector), M2/reserve money multiplier (often used as an indicator of the effects of
financial liberalization, as in Calvo and Mendoza, 1996), as well as the budget surplus/GDP
ratio, etc.8
The determinants of bank crises that we considered in the basic canonical model are real
GDP growth, inflation, and financial liberalization. These are found to be significant
determinants (or associations) of banking crises by Demirgüç-Kunt and Detragiache (1998a) and
Hutchison and McDill (1999). The financial liberalization data is from Demirgüç-Kunt and
Detragiache (1998b), supplemented by national and international sources. It is constructed on the
basis of the beginning of observed policy changes to liberalize interest rates, taking on a value of
unity during the liberalized period of market-determined rates and zero otherwise.
8 We also do not consider possible contagion effects during currency crises. See Glick and Rose (1999).
11
Several other variables were considered, but not reported since they did not contribute
significantly to the explanatory power of the model. These variables are real credit growth,
nominal (and real) interest rate changes, the budget position of the general government, and
explicit deposit insurance.9 An index of stock prices was also considered and this entered
significantly in determining the onset of banking crises (see Hutchison and McDill, 1999).
However, stock price data was only available for a small sample of countries and was therefore
not included in the base regressions.10
3.4. Data Sample and Windows
Our data sample is determined by the availability of data on currency market movements
and banking sector health, as well as on the determinants of currency and bank crises, discussed
above. We do not confine our analysis to countries experiencing banking or currency crises. We
also include developed and developing countries that did not experience either a severe banking
problem or currency crisis/speculative attack during the 1975-97 sample period. Using such a
broad control group allows us to make general statements about the conditions distinguishing
between countries encountering crises and others managing to avoid crises.
The minimum data requirements to be included in our study are that GDP are available
for a minimum of 10 consecutive years over the period 1975-97. This requirement results in a
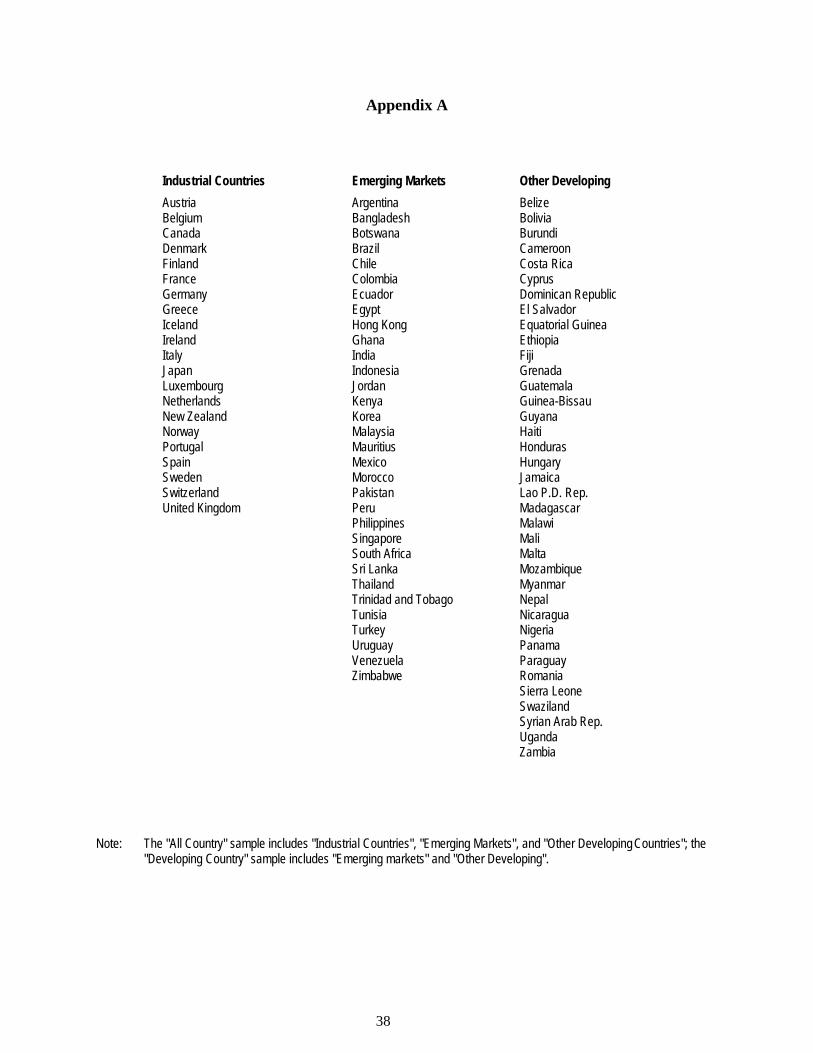
sample of 90 countries. We group the countries into three categories: industrial countries (20),
9 Data on the existence of explicit deposit insurance come from the survey by Kyei (1995). Weconstructed a dummy variable that took on a value of unity if the country, at the time in question, had aformal system of deposit guarantee arrangements in place, and zero otherwise. In the Kyei study, 47explicit arrangements were identified, as against 55 arrangements implicitly guaranteeing governmentsupport for deposits.
10 External conditions may also matter, but were not considered in our analysis. Eichengreen and Rose(1998) find evidence that higher interest rates and slower growth in industrial countries contribute tobank crises in emerging markets.
12
emerging economies with relatively open capital markets (32), and other developing and
transition economies (38).11 The particular countries included in our data set are listed in
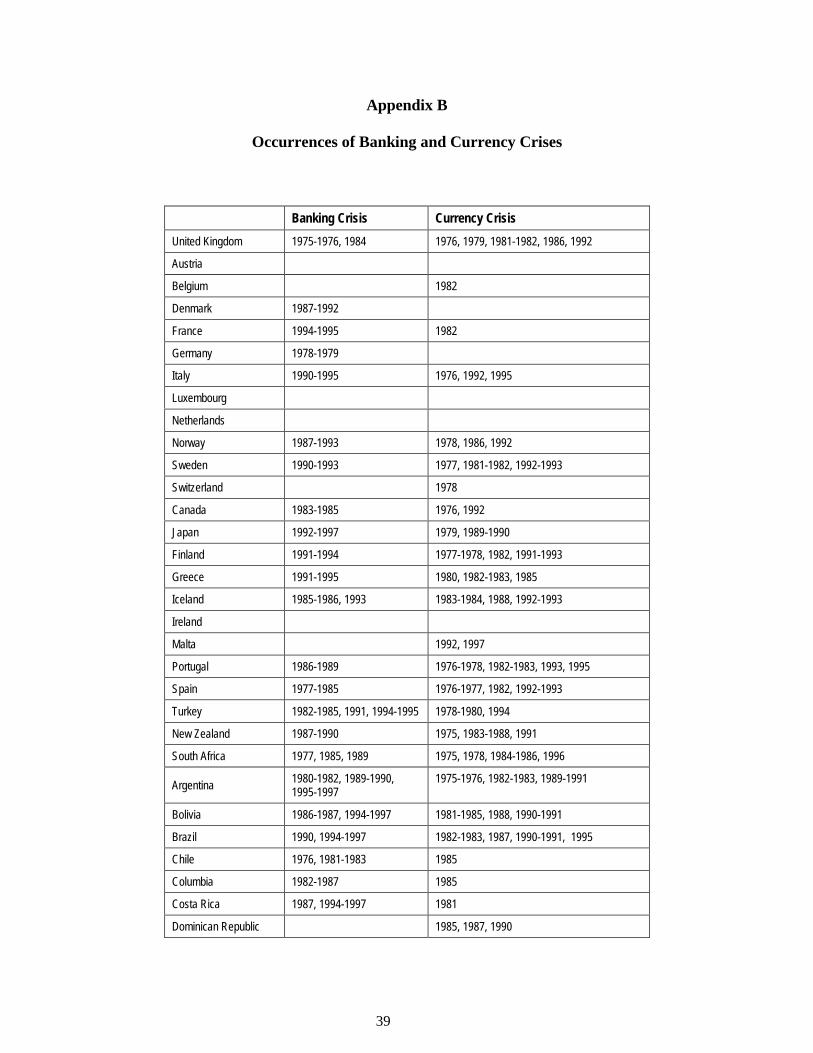
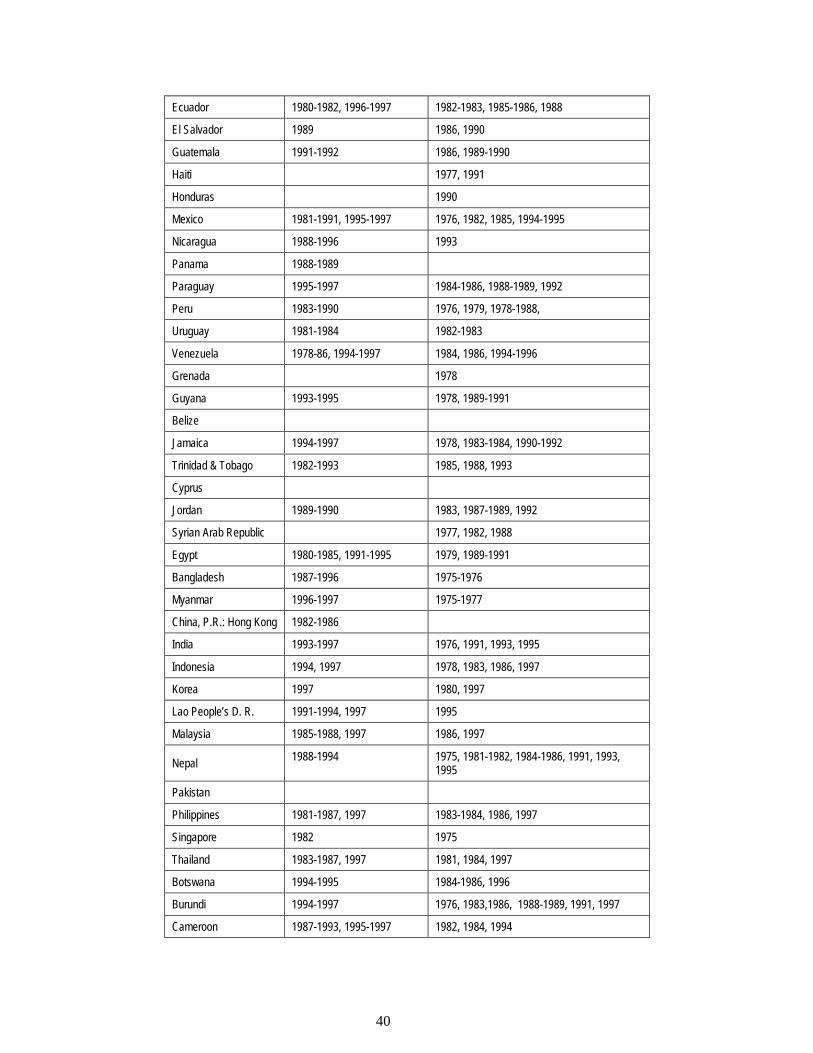
Appendix A. For each country-year in our sample, we construct binary measures of currency and
bank crises, as defined above (1 = crisis, 0 = no crisis, i.e. tranquil). The dates of currency and
bank crises are reported in Appendix B.
Of the 90 countries in our sample, 74 countries had banking problems, and 82 countries
experienced at least one currency crisis at some point during the sample period. Several countries
had multiple occurrences of banking crisis and most had multiple currency crises.
In most of our analysis we are concerned with predicting the onset of currency and
banking crises and their relative timing. To reduce the chances of capturing the continuation of
the same currency or banking episode, we impose windows on our data. In the case of currency
crises, after identifying each “large” change in currency pressure (i.e. two standard deviations
above the mean), we treat any large changes in the following 24-month window as a part of the
same currency episode and skip it before continuing the identification of new crises. In the case
of multi-year banking crises, we use only the first year in a spell of banking distress, i.e. the year
of the banking crisis “onset.” The duration of banking sector distress was greater than one year in
most episodes.
We use annual crisis observations in our study. Attempting to date banking crises by
month (as in Kaminsky and Reinhart, 1999) or by quarter seems arbitrary. We employ monthly
data for our (real) exchange rate pressure index to identify currency crises and date each by the
year in which it occurs. Of course, annual data may obscure or limit some insights about the
11 Our emerging economy sample accords roughly with Furman and Stiglitz’s variant (1998) of that usedby Sachs, Tornell, and Velasco (1996), augmented to include Hong Kong and Uruguay but excludingChina, Israel, the Ivory Coast, and Taiwan. The full developing country sample excludes major oilexporting countries. The United States is excluded from the sample as well.
13
relative timing of the onset of currency and banking crises, since it does not enable us to
distinguish the lead and lag timing of crises to the extent that crises occur at different points of
the same year. However, we do not believe that it is possible to date banking crises with such
precision as monthly data presumes. Moreover, using annual data enables inclusion of a
relatively large number of countries in the analysis (Kaminsky and Reinhart focus on a sample of
only 20 countries).
4. The Incidence of Banking and Currency Crises
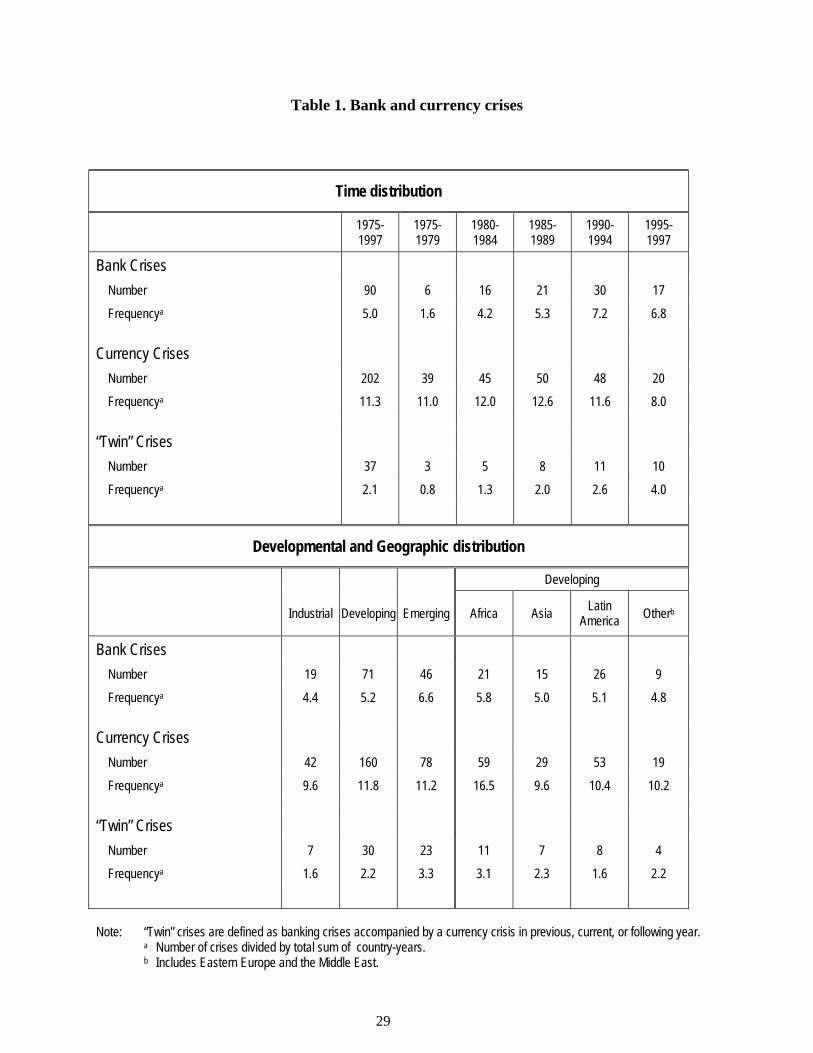
Table 1 summarizes the number and frequency of bank and currency crises according to
our definitions and disaggregates them by 5-year time intervals and development categories.12
The table also reports the incidence of “twin” crises, defined as instances in which a bank crisis
is accompanied by a currency crisis in either the previous, current, or following year.13 The data
for the developing countries are also disaggregated by geographic region.
Our sample includes 90 banking crisis episodes and 202 currency crises; thus currency
crises have been twice as common as bank crises. 14 Of the 90 bank crises, 37, i.e. 41 percent,
have been twins.
12 These figures refer to observations for which data for both bank and currency crises are available; e.g.we exclude observations where banking crisis data are available while currency crisis data are not, andvice versa.
13A larger window would obviously increase the number of “twins” identified. For example, Kaminskyand Reinhart (1999), who define twin crises as bank crises followed by a currency crisis within fouryears, identify 19 crises over the period 1970-1995 with their sample of 20 countries; we identify 37crises – less than twice as many -- in a sample roughly four times as large. We implicitly consider alarger window for classifying twin crises when exploring lag relationships up to two years in lengthbetween bank and currency crises in the probit analysis in Section 5.
14 With our alternative definition of currency crises [see footnote 6], we identify 94 banking crises and210 currency crises.
14
Observe that (the onset of) banking crises has increased over time: bank crises have risen
steadily both in number and frequency over our sample period and were four times as frequent in
the 1990s than in the 1970s. However, the incidence of currency crises has been relatively
constant. In fact, the number and frequency of currency crises were higher in the 1980s than in
the 1990s. The frequency of twin crises appears to have risen in step with that of bank crises: in
comparison to the 1975-79 period, they were more than three times as frequent in 1990-94, and
more than four times as frequent in 1995-97.
Table 1 also indicates that individual banking and currency crises as well as twin crises
have been more frequent in developing and emerging markets than in industrial countries.
Banking and twin crises have been particularly evident in emerging markets. Among developing
countries, the frequency of individual and twin crises has been highest in Africa (though the
African figure may be biased upwards because of heavy CFA zone participation and common
devaluations by former French colonies).
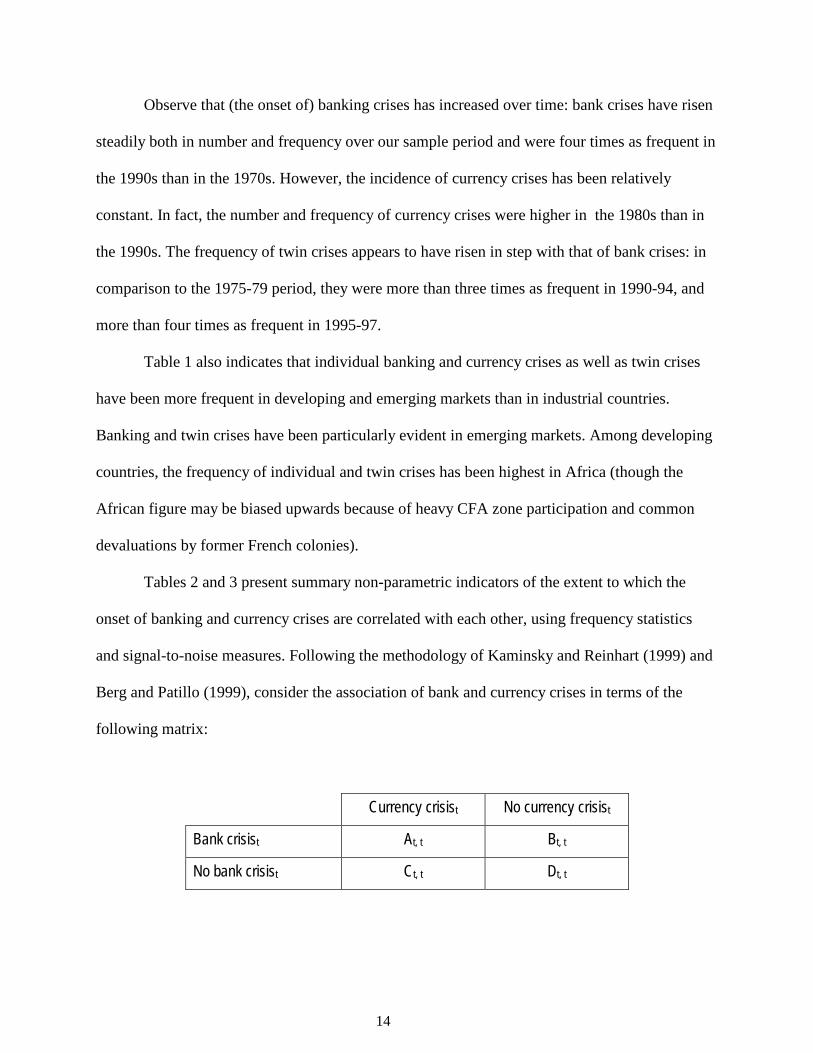
Tables 2 and 3 present summary non-parametric indicators of the extent to which the
onset of banking and currency crises are correlated with each other, using frequency statistics
and signal-to-noise measures. Following the methodology of Kaminsky and Reinhart (1999) and
Berg and Patillo (1999), consider the association of bank and currency crises in terms of the
following matrix:
Currency crisist No currency crisist
Bank crisist At, t Bt, t
No bank crisist Ct, t Dt, t
15
The cell At, t represents the number of instances in which a bank crisis occurring in a
particular year t, was accompanied by a currency crisis in year t (i.e. a bank crisis provides a
“good signal” about the occurrence of currency crises); Bt, t is the number of instances in which a
banking crisis was not accompanied by currency crisis (i.e. a bank crisis provides a “bad signal”
or “noise” about the occurrence of currency crises); Ct, t is the number of instances in which
banking performance failed to provide a good signal about a currency crisis that occurred; and
Dt, t is the number of instances in which neither a banking or currency crisis occurred. An
analogous matrix can be constructed indicating the number of instances in which a banking crisis
in year t was preceded (followed) by a currency crisis in year t-1 (t+1), denoted by At, t-1 (At, t+1),
etc.
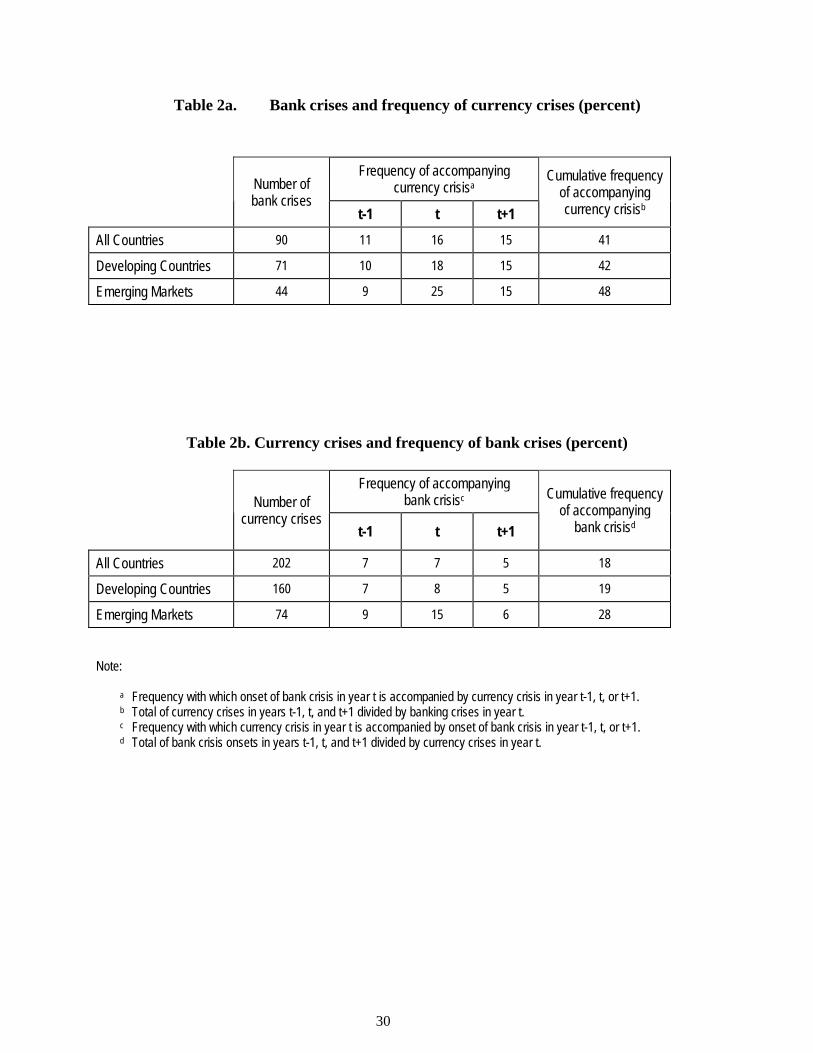
Table 2 presents information about the association of the onset of banking and currency
crises contemporaneously, one period before, and one period ahead. Table 2a shows the
frequency with which the onset of a bank crisis in year t was accompanied by a currency crisis in
either year t-1, t, or t+1, i.e. At, t / (At, t + Bt, t), At, t-1 / (At, t-1 + Bt, t-1), At, t+1 / (At, t+1 + Bt, t+1). The
last column shows the cumulative frequency with which a bank crisis onset in year t is
accompanied by currency crises in years t-1, t, or t+1, i.e. (At, t-1 + At, t + At, t+1) / (At, t + Bt, t).
Table 2b shows the analogous measures of the frequency with which a currency crisis at time t
was accompanied by the onset of a bank crisis at either t-1, t, or t+1.
We calculate these frequencies for three different country data samples— all available
industrial and developing countries (90 countries), developing countries (70 countries), and
emerging markets only (32 countries). We are concerned here with the onset of either a banking
or currency crisis. We do not use windows in this exercise to exclude observations immediately
following or preceding the onset of a crisis, i.e. the onset of a crisis is coded as unity and all
other observations are coded as zero.
16
Comparing Tables 2a and 2b, observe that the frequency of banking crises associated
with currency crises is higher than the frequency of currency crises associated with banking
crises. The cumulative frequency with which the onset of a banking crisis is accompanied by a
currency crisis within one year before or after is 40 percent or higher. Correspondingly, the onset
of a currency crisis is accompanied by a banking crisis within one year by less than 20 percent of
the time for the full and developing country samples, though the frequency rises to 28 percent for
the emerging market sample.
Comparing the figures for the frequency of banking crisis accompanied by currency
crises in years t-1 and t+1 in Table 2a provides weak evidence that the frequency of currency
crises accompanying banking crises is higher in year t+1 than in year t-1. This suggests that
currency crises tend to lag banking crises, or equivalently, that banking crises tend to lead
currency crises. This result is strongest for emerging market countries, where 15 percent of
banking crises in year t are accompanied by a currency crisis in year t+1, but only 9 percent are
at t-1.
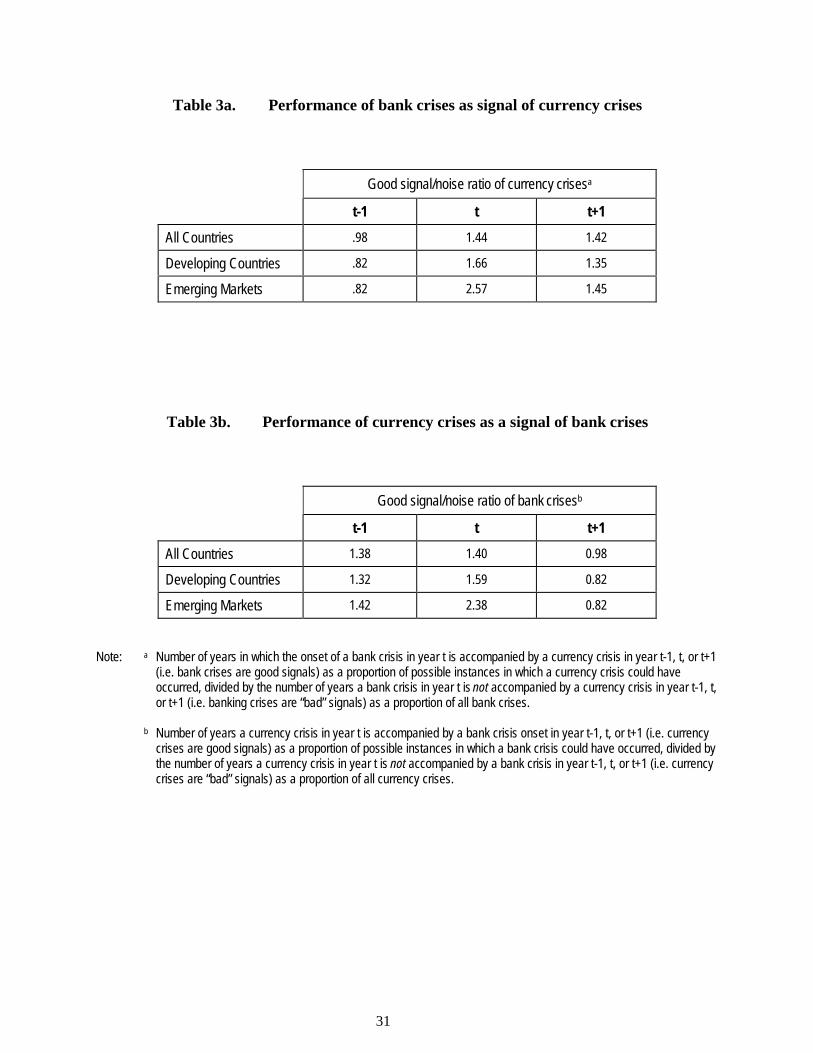
Table 3 calculates the signal-to-noise association of banking and currency crises. Table
3a reports the signal-to-noise performance of banking crises as a lagging (t-1), contemporaneous
(t), and leading (t+1) indicator of currency crises. For the contemporaneous indicator, this is
defined as the number of times a banking crisis is accompanied by a currency crisis (i.e. banking
crises are good signals of currency crises) as a share of total currency crises (i.e. At, t / (At, t + Ct,
t)), all divided by the number of times a banking crisis is not accompanied by a currency crisis
(i.e. banking crises are “noise” or bad signals of currency crises) as a share of all bank crises (i.e.
Bt, t / (Bt, t + Dt, t)). A signal-to-noise greater than 1 implies that when banking crises occur
currency crises are more likely than not. Table 3b reports the corresponding signal/noise
measures for currency crises as an indicator of banking crises.
17
Observe that for the full sample the signal-to-noise ratio of banking crises is higher for
currency crises at time t and t+1 than at time t-1. This is more pronounced for our developing
country and emerging market samples. This suggests that banking crises tend to be a
contemporaneous and/or leading, rather than lagging, indicator of currency crises.
5. Probit Equation Results
This section presents probit estimates involving currency and banking crises alone as well
as with various macroeconomic and institutional determinants of currency and banking crises.
Our use of probit models allows us to go beyond the bivariate relationship to focus on the joint
contribution of macroeconomic and institutional variables to currency and banking crises.
We estimate the probability of either currency or banking sector crises using a
multivariate probit model on an unbalanced panel data set for both developing and developed
countries over the 1975-97 period (or most recent year available). We observe that a country at a
particular time (observation t) is either experiencing onset of a crisis (dummy variable, yt, takes
on a value of unity), or it is not (yt=0). The probability that a crisis will occur, Pr(yt=1), is
hypothesized to be a function of a vector of characteristics associated with observation t, xt , and
the parameter vector ß. The likelihood function of the probit model is constructed across the n
observations (the number of countries times the number of observations for each country) and
(the log of the function) is then maximized with respect to the unknown parameters using non-
linear maximum likelihood
[ ]∑ = −−+= n
t tttt xFyxFyL1
'' ))(1ln()1()(lnln ββ
The function F(.) is the standardized normal distribution.
In these equations we employ windows following the onset of either a currency or
banking crisis. In the currency crisis equation, a 24-month window following the onset of a crisis
18
(or episode of exchange rate pressure) was employed and we eliminated from the data set these
observations. Banking crises are not as frequent as currency crises, so overlapping observations
is not a major problem, but the duration of banking crises is often quite long. We employ a
window in these cases such that every year of a continuing banking crisis, except the initial or
onset year, was eliminated from the data set.
5.1. Bivariate Probits
We start with a discussion of the probit estimates for the currency and banking crisis
onsets alone, i.e. without controlling for macroeconomic variables. These results are reported in
Tables 4a and 4b. Tables 5a and 5b report results with macroeconomic and other control
variables included.15
In each table we report the effect of a one-unit change in each regressor on the probability
of a crisis (expressed in percentage points so that .01=1%), evaluated at the mean of the data. We
include the associated z-statistics in parentheses; these test the null of no effect. Note that the
sample size of the multivariate probit analysis varies depending on the set of variables
considered.
We also report various diagnostic measures. The in-sample probability forecasts are also
evaluated with “pseudo” R2 statistics and analogs of a mean squared error measure, the quadratic
probability score (QPS) and log probability score (LPS), that evaluate the accuracy of probability
forecasts. The QPS ranges from zero to 2, and the LPS ranges from zero to infinity, with a score
15 All probit equations are estimated by maximum likelihood using LIMDEP windows version 7.0.
19
of zero corresponding to perfect accuracy for both.16 For binary dependent variables, it is natural
to ask what fraction of the observations are “correctly called,” where, for example, a crisis
episode is correctly called when the estimated probability of crisis is above a given cut-off level
and a crisis occurs. Such “goodness-of-fit” statistics are shown for two probability cut-offs: 25
percent and 10 percent.
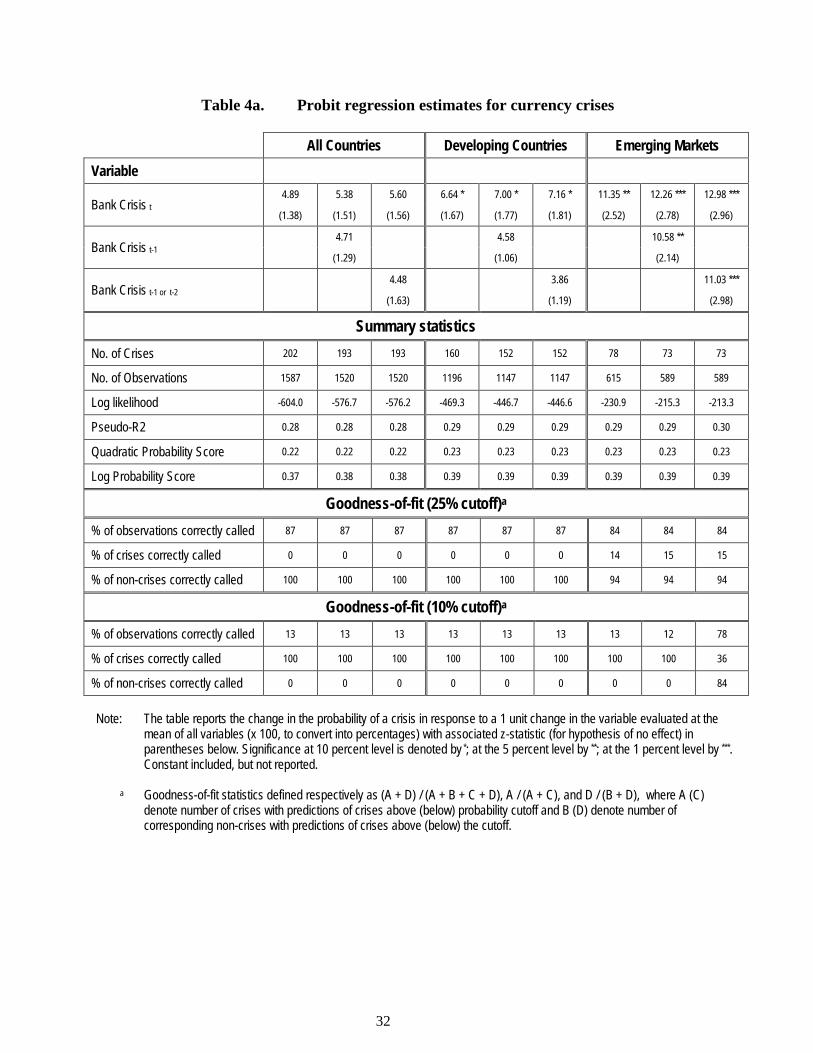
Table 4a shows the simple bivariate link between the onset of currency and banking
crises. In addition to contemporaneous links, we consider a simple one-year lagged effect of
bank crisis onsets as well as a composite lag if a bank crisis began in either of the two previous
years. It is apparent from these tables that currency crises are contemporaneously and
significantly correlated with bank crises for the emerging market and developing country
samples, but not for the full sample of countries. Lagged banking crises, occurring within the
past two years, also help to predict the onset of currency crises in emerging markets. Past
banking crises, however, do not help predict the onset of currency crises in either the developing
country sample or the full set of countries.
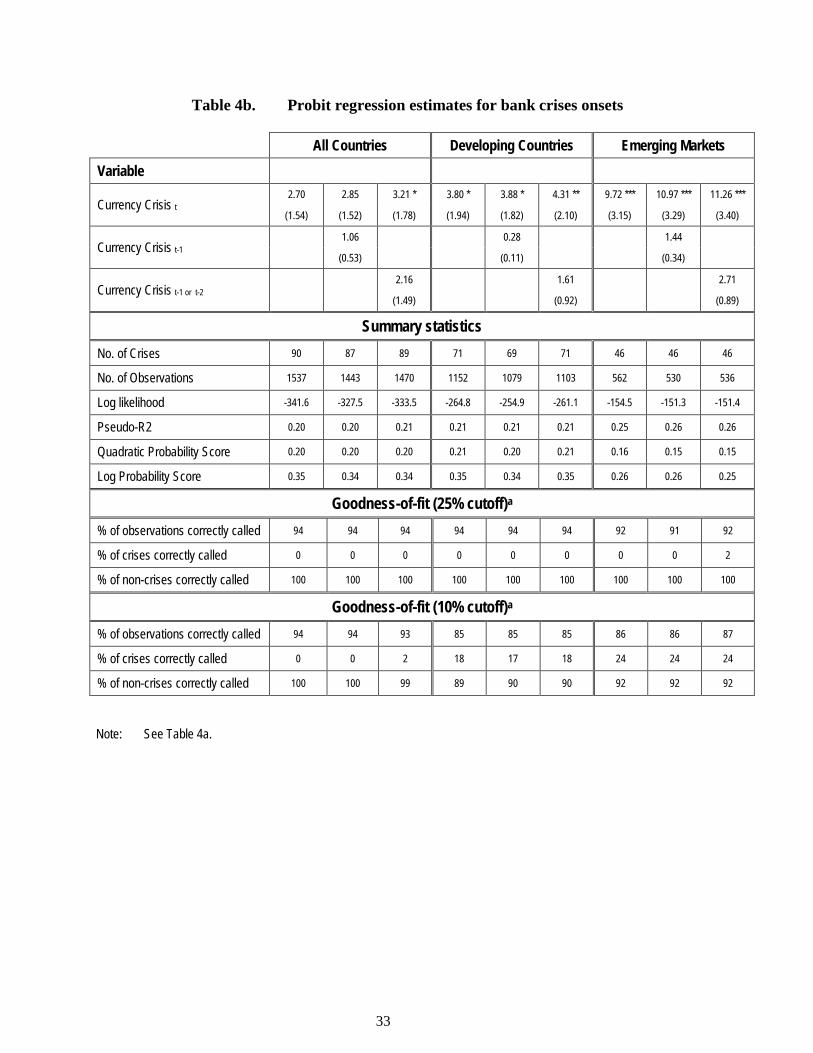
Table 4b reports the corresponding bivariate results for probit regressions of currency
crises on the onset of banking crises. Contemporaneous, but not lagged, currency crises help
explain bank crises in the developing and emerging market samples. The contemporaneous link
is weaker for the full sample of countries, i.e. it is statistically significant at the 10 percent level
16 For each of the methods we can generate n probability forecasts where Pt is the probability of a crisis inthe period t, 0 1≤ ≤Pt . Rt is the actual times series of observations; Rt = 1 if a crisis occurs at time tand equals zero otherwise. The analog to mean squared error for probability forecasts is the QPS:
QPSn
P Rt tt
n
= −=
∑12 2
1b g
Large errors are penalized more heavily under the LPS, given by:
LPSn
R P R Pt t t tt
n
= − − +=
∑11 1
1b g b g b gln ln
20
in only one formulation of the model. Thus lagged banking crises help predict currency crises in
the emerging markets sample, but not vice versa. This asymmetric result, albeit for a different
and smaller sample of countries, is consistent with the findings of Kaminsky and Reinhart
(1999).17
5.2. Multivariate Probits
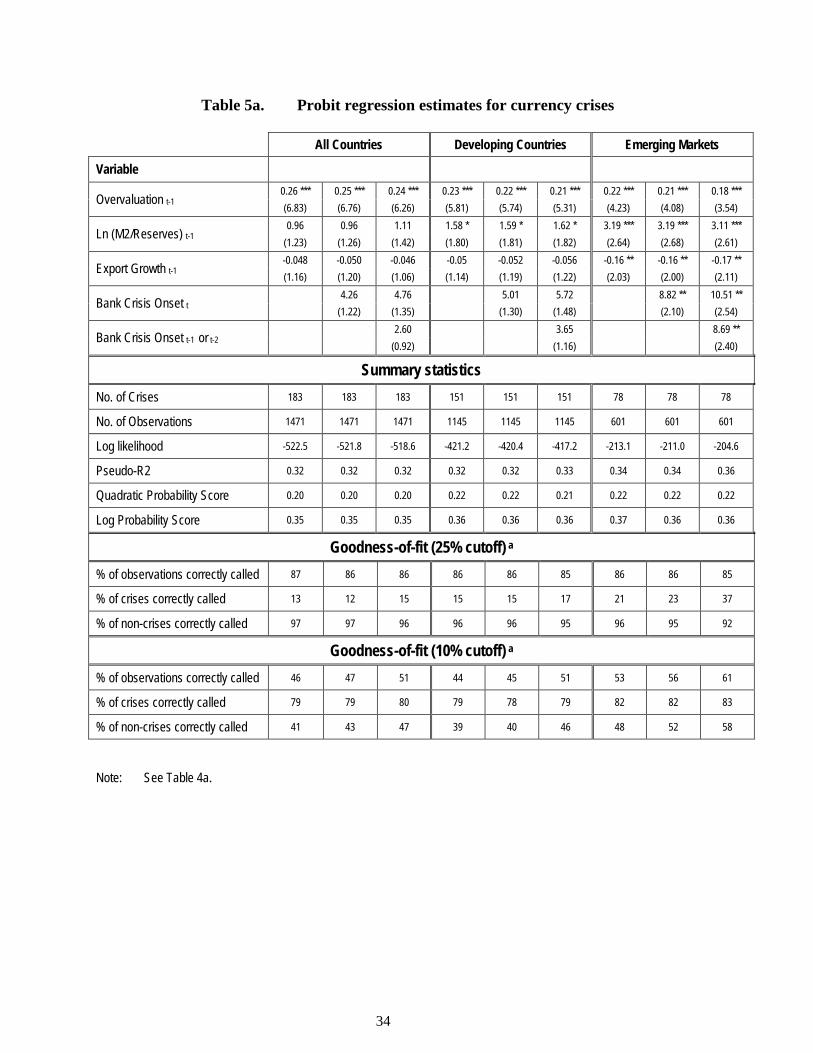
Table 5a reports the results where the onset of currency crises are explained by both the
onset of banking crises and a parsimonious set of macroeconomic variables, i.e. our canonical
model. We find that the macroeconomic variables lead the onset of currency crises and the
estimates are generally consistent with our priors. That is, the probability of a currency crisis
generally rises with greater real overvaluation, higher ratio of (log of) M2/Reserves, and lower
export growth. Overvaluation and M2/Reserves are generally significant for all of our three
country samples; export growth is significant only for the emerging country sample.
The bank crisis variable, as an additional explanatory factor, is only significant for the
emerging country sample. As with the bivariate results, lagged as well as contemporaneous bank
crises help to predict future currency crises.18
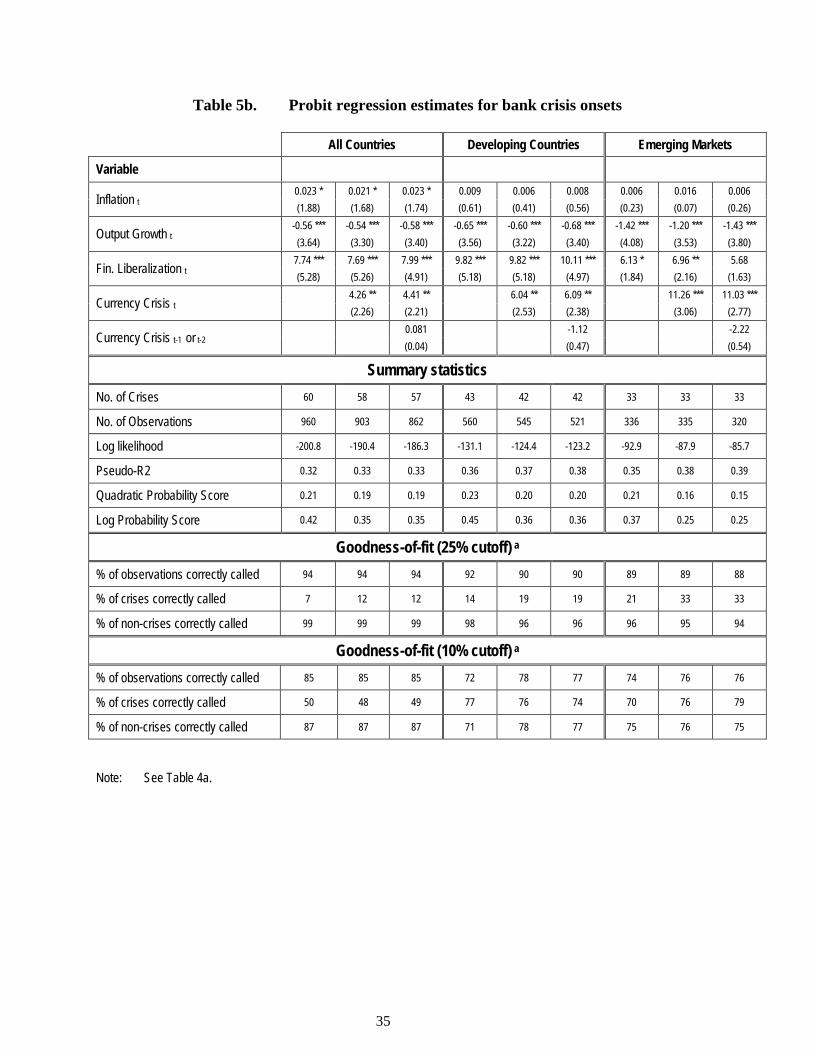
Analogous probit equations for the onset of bank crises with contemporaneous macro and
institutional control variables are reported in Table 5b.19 A decline in output growth and greater
financial liberalization, as measured by a “liberalized” interest rate structure, are each highly
17 In contrast, Eichengreen and Rose (1998) find that neither contemporaneous nor lagged currency“crashes” are significant in explaining bank crises for a large sample of developing countries.
18 These results are robust to excluding all 1997 observations, including the recent Asia crisis episodes,from the data set.
19 Fewer observations are available for the bank crisis equations than for the currency crisis equations,primarily because of limited availability of financial liberalization data.
21
correlated with the onset of banking sector distress. Inflation is only correlated with the onset of
banking sector distress in the full sample, apparently proxying for the developing economies
(developing economies have a higher probability of having a banking crisis and also tend to have
higher inflation than industrialized economies). It is noteworthy that the macroeconomic
variables do not generally help predict the onset of a future banking crisis, i.e. (unreported)
results with lagged values of the macroeconomic variables are insignificant.
It is apparent that the onset of banking sector distress is highly correlated with currency
crises, as indicated by the contemporaneous association reported in Table 5b. In contrast with the
results in the previous table, the significance levels for the contemporaneous correlation between
the onset of banking crises and currency crises range from 1 to 5 percent in all three groups of
countries, i.e. the correlation holds not just in the emerging market sample, but also in the
developing country and full country samples. Once again we find no future predictive power
associated with currency crises— lagged currency crises are not significant in explaining the
onset of bank crises onsets in any of our samples. Lagged banking crises help predict currency
crises in the emerging markets sample, but not vice versa.
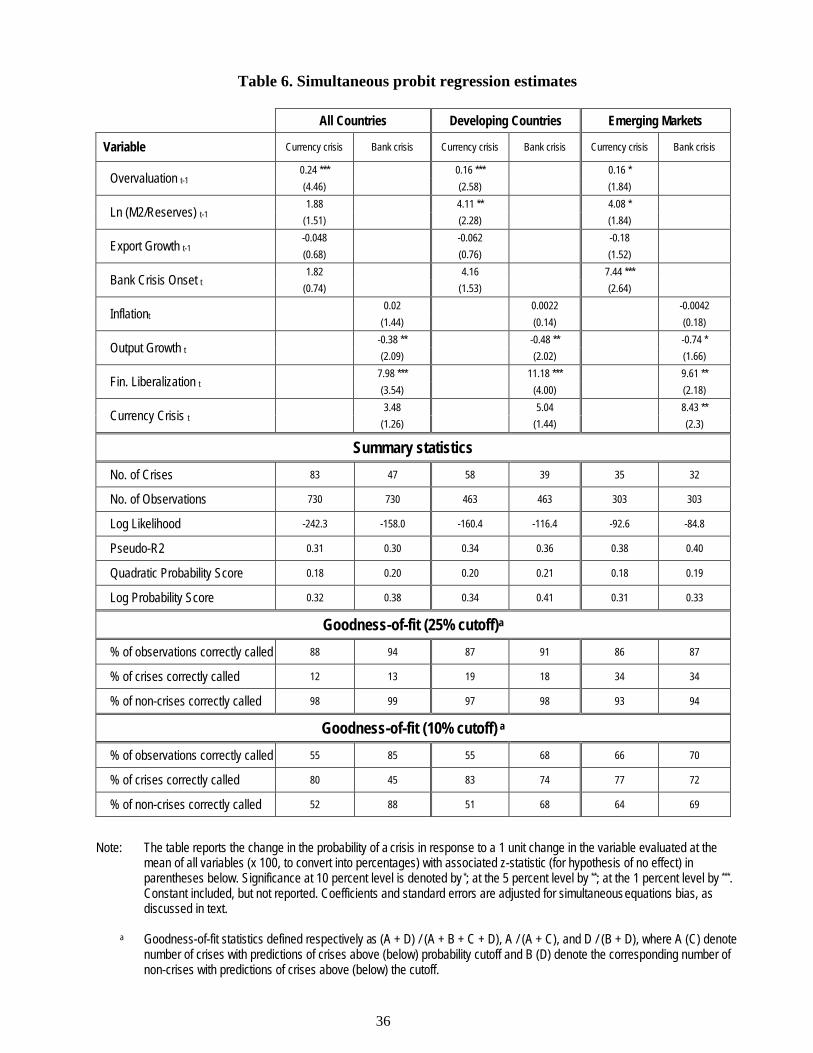
5.3. Simultaneous Equation Probits
We have found significant contemporaneous correlation between banking and currency
crises with single equation probit estimation procedures. Table 6 shows the model estimates
based on simultaneous equation estimates of both the banking sector onset and currency crisis
22
equations.20 As the table indicates, the basic results for the emerging markets sample are robust.
There is clear joint causality between the onset of currency and banking crises in the emerging
markets sample. However, no contemporaneous association is seen in the developing country
sample (in contrast with Tables 4a, 4b, and 5b) or in the full group of countries (in contrast with
Tables 4b and 5b).
In summary, these results suggest a very strong and robust contemporaneous correlation
among the onset of banking and currency crises in emerging market countries, even when
controlling for simultaneity bias and a multitude of other explanatory factors such as financial
liberalization, export growth, real GDP growth, and so on. There is weaker evidence of this
contemporaneous link with a broader sample of developing countries and for the full sample of
countries. The other strong result that emerges is that banking crises are a statistically significant
leading indicator of currency crises in emerging markets.
5.4. Predicted Crisis Probabilities
To further illustrate the magnitude of the links between currency and bank crises we
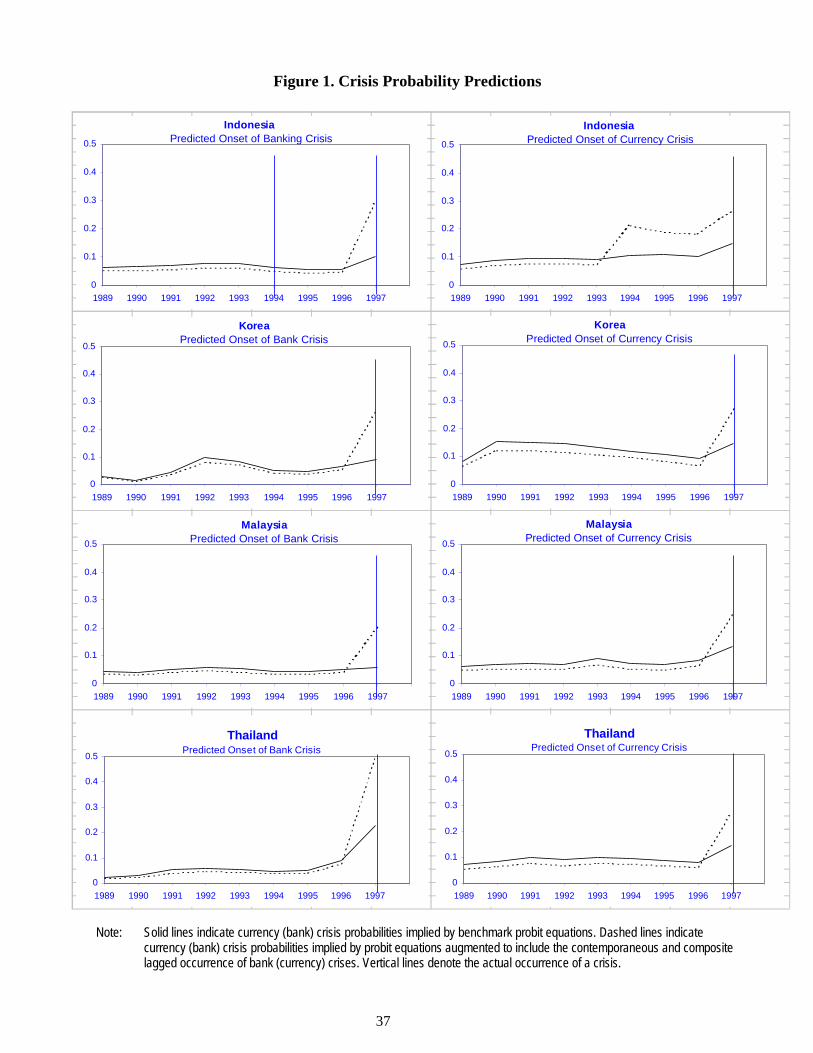
examine how this association affects predicted crisis probabilities. Figure 1 reports crisis
probabilities implied by the single-equation probit estimates in Tables 5a and 5b for four East
Asian emerging market economies— Korea, Malaysia, Indonesia and Thailand -- for the period
1989 to 1997. Two graphs are shown for each country: one depicts the probability predictions for
20 Our simultaneous equation methodology follows Maddala (1983, pp. 246-7), which describes theprocedure for estimating the structural coefficients and standard errors in a two-equation system whereboth dependent binary variables (in a probit context) are endogenous. The two-step procedure involvesfirst estimating the reduced forms for each endogenous crisis variable as a function of all exogenousand predetermined variables by probit, then calculating the fitted values of the endogenous variablesimplied by the reduced forms, and lastly using these fitted values as independent variables in thestructural probit equations. The covariance matrices are calculated as in Maddala (1983, p. 247). We donot use lags of our endogenously-determined crisis variables in these calculations. We assume that allother explanatory variables are exogenous.
23
the onset of banking sector distress; the second depicts the onset of currency crises. Two
prediction lines are plotted in each graph: the solid line plots the predicted crisis probabilities
implied by the benchmark “canonical” probit estimates based only on macroeconomic and
institutional variables; the dashed line plots the predicted probabilities for currency (bank) crises
implied by augmenting the benchmark canonical model to include the occurrence of
contemporaneous and lagged bank (currency) crises. Vertical lines indicate the actual occurrence
of a crisis.
Observe that the predicted probabilities of both currency and bank crises based on the
benchmark model increase in all four countries at the time of the 1997 Asia crisis. Including
information about the occurrence of other crises causes the predicted probabilities to increase
even more sharply. (The occurrence of a banking crisis in Korea in 1994 causes the predicted
probability of a currency crisis to rise even earlier.)
It should be emphasized that these plots are intended not to show the predictive power of
our model, but rather to illustrate the statistical importance of linkages between banking and
currency crises.21
6. Conclusions
This paper investigates the relative timing of the occurrence of banking and currency
crises over the 1975-97 period. For our sample of 90 countries, 74 had at least one case of a
serious banking problem and 82 experienced at least one currency crisis at some point during the
sample period. Several countries experienced multiple occurrences of banking crisis and most
had multiple currency crises. A total of 90 banking crisis episodes, 202 currency crises, and 37
21 It should be noted that these are in-sample probability predictions. An alternative approach is togenerate out-of-sample probabilities for 1997 based on estimates generated from data through 1996.
24
twin crises were identified. While the relative frequency of individual banking and twin crises
has increased over time, the frequency of currency crises has been relatively constant.
Developing and emerging market countries suffered both banking and currency crises more often
than industrial countries.
The twin crisis phenomenon, however, is mainly concentrated in a limited set of
countries— financially liberalized emerging-market economies. Summary statistics indicate an
association between crises in broader country groupings (including lesser developed and
industrial countries), but we find a robust link only in emerging markets. In emerging markets,
banking crises (currency crises) have been associated with currency crises (banking crises)
almost 50 percent (30 percent) of the time. This result holds up to a variety of tests— signal-to-
noise ratios, bivariate probit regressions, multivariate probit equations, and simultaneous probit
estimates. A strong causal, joint feedback, link between banking and currency crises appears
only in this group of countries.
This result implies that, at least in financially liberalized emerging-market economies,
policy measures taken to help avoid a banking crisis (currency crisis) have the additional benefit
of lowering the probability of a currency (banking) crisis. Thus, measures to limit the exposure
of balance sheets and enhance confidence in the banking sector may reduce the incentives for
capital flight and currency runs. Similarly, policies designed to promote exchange rate stability
appear capable of fostering broader stability in domestic banking institutions.
Our analysis also provides evidence that banking crises provide some leading information
about the possibility of future foreign exchange instability, though again only for our emerging
markets group. Currency crises, by contrast, were not a good leading indicator of impending
banking problems. The power of banking crises to predict future currency instability does not
appear to be due to a common experience with financial liberalization (or other factors) since this

25
is explicitly taken into account by other variables in our estimation procedure. Instead, it might
reflect the footloose nature of capital flows into emerging markets, where the onset of banking
problems can quickly lead to capital flight and both current and future currency crises.
26
References
Berg, Andrew and Catherine Patillo (1999). “Are Currency Crises Predictable? A Test”International Monetary Fund Staff Papers, 46, June, 107-138.
Calvo, Guillermo (1997). “Varieties of Capital-Market Crises” in Guillermo Calvo and MervynKing (eds.) The Debt Burden and Its Consequences for Monetary Policy, London: MacMillanPress.
Calvo, Guillermo and Enrique Mendoza (1996). “Mexico’s Balance of Payments Crises. AChronicle of a Death Foretold,” Journal of International Economics, 41, 235-264.
Caprio, Gerald and Daniela Klingebiel (1996). “Bank Insolvencies: Cross-country Experiences.”World Bank Policy Research Paper 1620 (July).
Chang, Roberto and Andres Velasco (1999). “Liquidity Crises in Emerging Markets: Theory andPolicy.” NBER Working Paper 7272 (July).
Demirgüç-Kunt, Asli and Enrica Detragiache. (1998a) “Financial Liberalization and FinancialFragility.” IMF Working Paper WP/98/83 (June).
Demirgüç-Kunt, Asli and Enrica Detragiache (1998b). “The Determinants of Banking Crises inDeveloping and Developed Countries.” IMF Staff Papers, 45, March, 81-109.
Diamond, Douglas and Phillip Dybvig (1983). “Bank Runs, Deposit Insurance, and Liquidity.”Journal of Political Economy, 91, 401-19.
Eichengreen, Barry and Andrew Rose (1998). “Staying Afloat When the Wind Shifts: ExternalFactors and Emerging-Market Banking Crises,” NBER Working Paper 6370 (January).
Eichengreen, Barry, Andrew Rose, and Charles Wyplosz (1995). “Exchange Market Mayhem.The Antecedents and Aftermath of Speculative Attacks,” Economic Policy, 21, October, 249-312.
Esquivel, Gerardo and Felipe Larrain (1998). “Explaining Currency Crises,” Mimeo, HarvardInstitute for International Development (June).
Frankel, Jeffrey and Andrew Rose (1996). “Currency Crashes in Emerging Markets. AnEmpirical Treatment,” Journal of International Economics, 41, November, 351-366.
Furman, Jason and Joseph Stiglitz (1998). “Economic Crises: Evidence and Insights from EastAsia,” Brookings Papers on Economic Activity, No. 2, 1-119.
Glick, Reuven and Ramon Moreno (1998), “Money and Credit, Competitiveness, and CurrencyCrises in Asia and Latin America,” paper prepared for the 13 th Pacific Basin Central BankConference on “Monetary Policy and the Structure of the Capital Account” held in Los Cabos,
27
Mexico, November 7-11, 1998, and issued as Federal Reserve Bank of San Francisco, Center forPacific Basin Studies Working Paper PB98-07.
Glick, Reuven and Andrew Rose (1999). “Contagion and Trade. Why Are Currency CrisesRegional?” Journal of International Money and Finance, 18, August, 603-618. Earlier versionsissued as CEPR Discussion Paper 1947 and NBER Working Paper 6806.
Gonzalez-Hermosillo, Brend (1996). “Banking Sector Fragility and Systemic Sources ofFragility,” IMF Working Paper WP/96/12 (February).
Hutchison, Michael M. and Kathleen McDill (1999). “Are All Banking Crises Alike? TheJapanese Experience in International Comparison,” Federal Reserve Bank of San Francisco,Center for Pacific Basin Studies Working Paper PB99-02.
IMF (1995). World Economic Outlook, May. Chapter 4: “Financial Crises: Characteristics andIndicators of Vulnerability.”
Kaminsky, Graciela, Saul Lizondo, and Carmen Reinhart (1998). “Leading Indicators ofCurrency Crises,” International Monetary Fund Staff Papers, 45, March, 1-48.
Kaminsky, Graciela and Carmen Reinhart (1999). “The Twin Crises. The Causes of Banking andBalance-of-Payments Problems,” American Economic Review, 89, June, 473-500. Earlier versionissued as Board of Governors International Finance Discussion Paper 544 (March).
Krugman, Paul (1979). “A Model of Balance of Payments Crises.” Journal of Money, Credit,and Banking, 11, 311-25.
Kumar, Manmohan, Uma Moorthy, and William Perraudin (1998). “Determinants of EmergingMarket Currency Crises and Contagion Effects,” paper presented at CEPR/World Bankconference “Financial Crises: Contagion and Market Volatility,” London, May 8-9.
Kyei, Alexander (1995). “Deposit Protection Arrangements: A Survey,” International MonetaryFund Working Paper WP/95/134 (December).
Maddala, G.S. (1983). Limited-Dependent and Qualitative Variables in Econometrics.Cambridge, United Kingdom: Cambridge University Press.
McKinnon, Ronald and Huw Pill (1996). “Credible Liberalizations and International CapitalFlows. The Overborrowing Syndrome,” in Takatoshi Ito and Anne Krueger (eds.), FinancialRegulation and Integration in East Asia, Chicago: University of Chicago Press.
McKinnon, Ronald and Huw Pill (1998). “The Overborrowing Syndrome: Are East AsianEconomies Different?” in Reuven Glick (ed.), Managing Capital Flows and Exchange Rates”Perspectives from the Pacific Basin, Cambridge, United Kingdom: Cambridge University Press.
Miller, Victoria (1996). “Speculative Currency Attacks with Endogenously Induced CommercialBank Crises,” Journal of International Money and Finance, 15, June, 385-403.
28
Miller, Victoria (1999). “The Timing and Size of Bank-Financed Speculative Attacks,” Journalof International Money and Finance, 18, June, 459-70.
Moreno, Ramon (1995). “Macroeconomic Behavior during Periods of Speculative Pressure orRealignment. Evidence from Pacific Basin Economies.” Federal Reserve Bank of San FranciscoEconomic Review, 3-15.
Moreno, Ramon (1999). “Was There a Boom in Money and Credit Prior to East Asia’s RecentCurrency Crisis?” Federal Reserve Bank of San Francisco Economic Review No. 1.
Obstfeld, Maurice (1994). “The Logic of Currency Crises.” NBER Working Paper 4640,(September).
Organization for Economic Co-operation and Development (1998). OECD Economic Outlook(June).
Reinhart, Carmen and Carlos Vegh (1995). “Nominal Interest Rates, Consumption Booms, andLack of Credibility— A Quantitative Examination,” Journal of Development Economics, 46,April, 357-378.
Rojas-Suarez, Liliana and Steven Weisbrod (1995). “Financial Fragilities in Latin America: The1980s and 1990s.” International Monetary Fund Occasional Paper 132.
Rossi, Marco (1999). “Financial Fragility and Economic Performance in Developing Countries.”IMF Working Paper WP/99/66 (May).
Sachs, Jeffrey, Aaron Tornell, and Andres Velasco (1996). “Financial Crises in EmergingMarkets. The Lessons from 1995,” Brookings Papers on Economic Activity, No. 1, 147-215.
Velasco, Andres (1987). “Financial Crises and Balance of Payments Crises : A Simple Model ofthe Southern Cone Experience,” Journal of Development Economics, 27, October, 263-283.
29
Table 1. Bank and currency crises
Time distribution
1975-1997
1975-1979
1980-1984
1985-1989
1990-1994
1995-1997
Bank CrisesNumber 90 6 16 21 30 17
Frequencya 5.0 1.6 4.2 5.3 7.2 6.8
Currency CrisesNumber 202 39 45 50 48 20
Frequencya 11.3 11.0 12.0 12.6 11.6 8.0
“Twin” CrisesNumber 37 3 5 8 11 10
Frequencya 2.1 0.8 1.3 2.0 2.6 4.0
Developmental and Geographic distribution
Developing
Industrial Developing Emerging Africa Asia LatinAmerica Otherb
Bank CrisesNumber 19 71 46 21 15 26 9
Frequencya 4.4 5.2 6.6 5.8 5.0 5.1 4.8
Currency CrisesNumber 42 160 78 59 29 53 19
Frequencya 9.6 11.8 11.2 16.5 9.6 10.4 10.2
“Twin” CrisesNumber 7 30 23 11 7 8 4
Frequencya 1.6 2.2 3.3 3.1 2.3 1.6 2.2
Note: “Twin” crises are defined as banking crises accompanied by a currency crisis in previous, current, or following year.a Number of crises divided by total sum of country-years.b Includes Eastern Europe and the Middle East.
30
Table 2a. Bank crises and frequency of currency crises (percent)
Frequency of accompanyingcurrency crisisaNumber of
bank crisest-1 t t+1
Cumulative frequencyof accompanyingcurrency crisisb
All Countries 90 11 16 15 41
Developing Countries 71 10 18 15 42
Emerging Markets 44 9 25 15 48
Table 2b. Currency crises and frequency of bank crises (percent)
Frequency of accompanyingbank crisiscNumber of
currency crisest-1 t t+1
Cumulative frequencyof accompanying
bank crisisd
All Countries 202 7 7 5 18
Developing Countries 160 7 8 5 19
Emerging Markets 74 9 15 6 28
Note:
a Frequency with which onset of bank crisis in year t is accompanied by currency crisis in year t-1, t, or t+1.b Total of currency crises in years t-1, t, and t+1 divided by banking crises in year t.c Frequency with which currency crisis in year t is accompanied by onset of bank crisis in year t-1, t, or t+1.d Total of bank crisis onsets in years t-1, t, and t+1 divided by currency crises in year t.
31
Table 3a. Performance of bank crises as signal of currency crises
Good signal/noise ratio of currency crisesa
t-1 t t+1
All Countries .98 1.44 1.42
Developing Countries .82 1.66 1.35
Emerging Markets .82 2.57 1.45
Table 3b. Performance of currency crises as a signal of bank crises
Good signal/noise ratio of bank crisesb
t-1 t t+1
All Countries 1.38 1.40 0.98
Developing Countries 1.32 1.59 0.82
Emerging Markets 1.42 2.38 0.82
Note: a Number of years in which the onset of a bank crisis in year t is accompanied by a currency crisis in year t-1, t, or t+1(i.e. bank crises are good signals) as a proportion of possible instances in which a currency crisis could haveoccurred, divided by the number of years a bank crisis in year t is not accompanied by a currency crisis in year t-1, t,or t+1 (i.e. banking crises are “bad” signals) as a proportion of all bank crises.
b Number of years a currency crisis in year t is accompanied by a bank crisis onset in year t-1, t, or t+1 (i.e. currencycrises are good signals) as a proportion of possible instances in which a bank crisis could have occurred, divided bythe number of years a currency crisis in year t is not accompanied by a bank crisis in year t-1, t, or t+1 (i.e. currencycrises are “bad” signals) as a proportion of all currency crises.
32
Table 4a. Probit regression estimates for currency crises
All Countries Developing Countries Emerging Markets
Variable4.89 5.38 5.60 6.64 * 7.00 * 7.16 * 11.35 ** 12.26 *** 12.98 ***
Bank Crisis t(1.38) (1.51) (1.56) (1.67) (1.77) (1.81) (2.52) (2.78) (2.96)
4.71 4.58 10.58 **Bank Crisis t-1
(1.29) (1.06) (2.14)
4.48 3.86 11.03 ***Bank Crisis t-1 or t-2
(1.63) (1.19) (2.98)
Summary statistics
No. of Crises 202 193 193 160 152 152 78 73 73
No. of Observations 1587 1520 1520 1196 1147 1147 615 589 589
Log likelihood -604.0 -576.7 -576.2 -469.3 -446.7 -446.6 -230.9 -215.3 -213.3
Pseudo-R2 0.28 0.28 0.28 0.29 0.29 0.29 0.29 0.29 0.30
Quadratic Probability Score 0.22 0.22 0.22 0.23 0.23 0.23 0.23 0.23 0.23
Log Probability Score 0.37 0.38 0.38 0.39 0.39 0.39 0.39 0.39 0.39
Goodness-of-fit (25% cutoff)a
% of observations correctly called 87 87 87 87 87 87 84 84 84
% of crises correctly called 0 0 0 0 0 0 14 15 15
% of non-crises correctly called 100 100 100 100 100 100 94 94 94
Goodness-of-fit (10% cutoff)a
% of observations correctly called 13 13 13 13 13 13 13 12 78
% of crises correctly called 100 100 100 100 100 100 100 100 36
% of non-crises correctly called 0 0 0 0 0 0 0 0 84
Note: The table reports the change in the probability of a crisis in response to a 1 unit change in the variable evaluated at themean of all variables (x 100, to convert into percentages) with associated z-statistic (for hypothesis of no effect) inparentheses below. Significance at 10 percent level is denoted by *; at the 5 percent level by **; at the 1 percent level by ***.Constant included, but not reported.
a Goodness-of-fit statistics defined respectively as (A + D) / (A + B + C + D), A / (A + C), and D / (B + D), where A (C)denote number of crises with predictions of crises above (below) probability cutoff and B (D) denote number ofcorresponding non-crises with predictions of crises above (below) the cutoff.
33
Table 4b. Probit regression estimates for bank crises onsets
All Countries Developing Countries Emerging Markets
Variable2.70 2.85 3.21 * 3.80 * 3.88 * 4.31 ** 9.72 *** 10.97 *** 11.26 ***
Currency Crisis t(1.54) (1.52) (1.78) (1.94) (1.82) (2.10) (3.15) (3.29) (3.40)
1.06 0.28 1.44Currency Crisis t-1
(0.53) (0.11) (0.34)
2.16 1.61 2.71Currency Crisis t-1 or t-2
(1.49) (0.92) (0.89)
Summary statistics
No. of Crises 90 87 89 71 69 71 46 46 46
No. of Observations 1537 1443 1470 1152 1079 1103 562 530 536
Log likelihood -341.6 -327.5 -333.5 -264.8 -254.9 -261.1 -154.5 -151.3 -151.4
Pseudo-R2 0.20 0.20 0.21 0.21 0.21 0.21 0.25 0.26 0.26
Quadratic Probability Score 0.20 0.20 0.20 0.21 0.20 0.21 0.16 0.15 0.15
Log Probability Score 0.35 0.34 0.34 0.35 0.34 0.35 0.26 0.26 0.25
Goodness-of-fit (25% cutoff)a
% of observations correctly called 94 94 94 94 94 94 92 91 92
% of crises correctly called 0 0 0 0 0 0 0 0 2
% of non-crises correctly called 100 100 100 100 100 100 100 100 100
Goodness-of-fit (10% cutoff)a
% of observations correctly called 94 94 93 85 85 85 86 86 87
% of crises correctly called 0 0 2 18 17 18 24 24 24
% of non-crises correctly called 100 100 99 89 90 90 92 92 92
Note: See Table 4a.
34
Table 5a. Probit regression estimates for currency crises
All Countries Developing Countries Emerging Markets
Variable0.26 *** 0.25 *** 0.24 *** 0.23 *** 0.22 *** 0.21 *** 0.22 *** 0.21 *** 0.18 ***
Overvaluation t-1(6.83) (6.76) (6.26) (5.81) (5.74) (5.31) (4.23) (4.08) (3.54)
0.96 0.96 1.11 1.58 * 1.59 * 1.62 * 3.19 *** 3.19 *** 3.11 ***Ln (M2/Reserves) t-1
(1.23) (1.26) (1.42) (1.80) (1.81) (1.82) (2.64) (2.68) (2.61)
-0.048 -0.050 -0.046 -0.05 -0.052 -0.056 -0.16 ** -0.16 ** -0.17 **Export Growth t-1
(1.16) (1.20) (1.06) (1.14) (1.19) (1.22) (2.03) (2.00) (2.11)
4.26 4.76 5.01 5.72 8.82 ** 10.51 **Bank Crisis Onset t
(1.22) (1.35) (1.30) (1.48) (2.10) (2.54)
2.60 3.65 8.69 **Bank Crisis Onset t-1 or t-2
(0.92) (1.16) (2.40)
Summary statistics
No. of Crises 183 183 183 151 151 151 78 78 78
No. of Observations 1471 1471 1471 1145 1145 1145 601 601 601
Log likelihood -522.5 -521.8 -518.6 -421.2 -420.4 -417.2 -213.1 -211.0 -204.6
Pseudo-R2 0.32 0.32 0.32 0.32 0.32 0.33 0.34 0.34 0.36
Quadratic Probability Score 0.20 0.20 0.20 0.22 0.22 0.21 0.22 0.22 0.22
Log Probability Score 0.35 0.35 0.35 0.36 0.36 0.36 0.37 0.36 0.36
Goodness-of-fit (25% cutoff) a
% of observations correctly called 87 86 86 86 86 85 86 86 85
% of crises correctly called 13 12 15 15 15 17 21 23 37
% of non-crises correctly called 97 97 96 96 96 95 96 95 92
Goodness-of-fit (10% cutoff) a
% of observations correctly called 46 47 51 44 45 51 53 56 61
% of crises correctly called 79 79 80 79 78 79 82 82 83
% of non-crises correctly called 41 43 47 39 40 46 48 52 58
Note: See Table 4a.
35
Table 5b. Probit regression estimates for bank crisis onsets
All Countries Developing Countries Emerging Markets
Variable0.023 * 0.021 * 0.023 * 0.009 0.006 0.008 0.006 0.016 0.006
Inflation t(1.88) (1.68) (1.74) (0.61) (0.41) (0.56) (0.23) (0.07) (0.26)
-0.56 *** -0.54 *** -0.58 *** -0.65 *** -0.60 *** -0.68 *** -1.42 *** -1.20 *** -1.43 ***Output Growth t
(3.64) (3.30) (3.40) (3.56) (3.22) (3.40) (4.08) (3.53) (3.80)
7.74 *** 7.69 *** 7.99 *** 9.82 *** 9.82 *** 10.11 *** 6.13 * 6.96 ** 5.68Fin. Liberalization t
(5.28) (5.26) (4.91) (5.18) (5.18) (4.97) (1.84) (2.16) (1.63)
4.26 ** 4.41 ** 6.04 ** 6.09 ** 11.26 *** 11.03 ***Currency Crisis t
(2.26) (2.21) (2.53) (2.38) (3.06) (2.77)
0.081 -1.12 -2.22Currency Crisis t-1 or t-2
(0.04) (0.47) (0.54)
Summary statistics
No. of Crises 60 58 57 43 42 42 33 33 33
No. of Observations 960 903 862 560 545 521 336 335 320
Log likelihood -200.8 -190.4 -186.3 -131.1 -124.4 -123.2 -92.9 -87.9 -85.7
Pseudo-R2 0.32 0.33 0.33 0.36 0.37 0.38 0.35 0.38 0.39
Quadratic Probability Score 0.21 0.19 0.19 0.23 0.20 0.20 0.21 0.16 0.15
Log Probability Score 0.42 0.35 0.35 0.45 0.36 0.36 0.37 0.25 0.25
Goodness-of-fit (25% cutoff) a
% of observations correctly called 94 94 94 92 90 90 89 89 88
% of crises correctly called 7 12 12 14 19 19 21 33 33
% of non-crises correctly called 99 99 99 98 96 96 96 95 94
Goodness-of-fit (10% cutoff) a
% of observations correctly called 85 85 85 72 78 77 74 76 76
% of crises correctly called 50 48 49 77 76 74 70 76 79
% of non-crises correctly called 87 87 87 71 78 77 75 76 75
Note: See Table 4a.
36
Table 6. Simultaneous probit regression estimates
All Countries Developing Countries Emerging Markets
Variable Currency crisis Bank crisis Currency crisis Bank crisis Currency crisis Bank crisis
0.24 *** 0.16 *** 0.16 *Overvaluation t-1
(4.46) (2.58) (1.84)
1.88 4.11 ** 4.08 *Ln (M2/Reserves) t-1
(1.51) (2.28) (1.84)
-0.048 -0.062 -0.18Export Growth t-1
(0.68) (0.76) (1.52)
1.82 4.16 7.44 ***Bank Crisis Onset t
(0.74) (1.53) (2.64)
0.02 0.0022 -0.0042Inflationt
(1.44) (0.14) (0.18)
-0.38 ** -0.48 ** -0.74 *Output Growth t
(2.09) (2.02) (1.66)
7.98 *** 11.18 *** 9.61 **Fin. Liberalization t
(3.54) (4.00) (2.18)
3.48 5.04 8.43 **Currency Crisis t
(1.26) (1.44) (2.3)
Summary statistics
No. of Crises 83 47 58 39 35 32
No. of Observations 730 730 463 463 303 303
Log Likelihood -242.3 -158.0 -160.4 -116.4 -92.6 -84.8
Pseudo-R2 0.31 0.30 0.34 0.36 0.38 0.40
Quadratic Probability Score 0.18 0.20 0.20 0.21 0.18 0.19
Log Probability Score 0.32 0.38 0.34 0.41 0.31 0.33
Goodness-of-fit (25% cutoff)a
% of observations correctly called 88 94 87 91 86 87
% of crises correctly called 12 13 19 18 34 34
% of non-crises correctly called 98 99 97 98 93 94
Goodness-of-fit (10% cutoff) a
% of observations correctly called 55 85 55 68 66 70
% of crises correctly called 80 45 83 74 77 72
% of non-crises correctly called 52 88 51 68 64 69
Note: The table reports the change in the probability of a crisis in response to a 1 unit change in the variable evaluated at themean of all variables (x 100, to convert into percentages) with associated z-statistic (for hypothesis of no effect) inparentheses below. Significance at 10 percent level is denoted by *; at the 5 percent level by **; at the 1 percent level by ***.Constant included, but not reported. Coefficients and standard errors are adjusted for simultaneous equations bias, asdiscussed in text.
a Goodness-of-fit statistics defined respectively as (A + D) / (A + B + C + D), A / (A + C), and D / (B + D), where A (C) denotenumber of crises with predictions of crises above (below) probability cutoff and B (D) denote the corresponding number ofnon-crises with predictions of crises above (below) the cutoff.
37
Figure 1. Crisis Probability Predictions
Note: Solid lines indicate currency (bank) crisis probabilities implied by benchmark probit equations. Dashed lines indicatecurrency (bank) crisis probabilities implied by probit equations augmented to include the contemporaneous and compositelagged occurrence of bank (currency) crises. Vertical lines denote the actual occurrence of a crisis.
Korea Predicted Onset of Currency Crisis
0
0.1
0.2
0.3
0.4
0.5
1989 1990 1991 1992 1993 1994 1995 1996 1997
Indonesia Predicted Onset of Currency Crisis
0
0.1
0.2
0.3
0.4
0.5
1989 1990 1991 1992 1993 1994 1995 1996 1997
Indonesia Predicted Onset of Banking Crisis
0
0.1
0.2
0.3
0.4
0.5
1989 1990 1991 1992 1993 1994 1995 1996 1997
Korea Predicted Onset of Bank Crisis
0
0.1
0.2
0.3
0.4
0.5
1989 1990 1991 1992 1993 1994 1995 1996 1997
Malaysia Predicted Onset of Currency Crisis
0
0.1
0.2
0.3
0.4
0.5
1989 1990 1991 1992 1993 1994 1995 1996 1997
Malaysia Predicted Onset of Bank Crisis
0
0.1
0.2
0.3
0.4
0.5
1989 1990 1991 1992 1993 1994 1995 1996 1997
Thailand Predicted Onset of Currency Crisis
0
0.1
0.2
0.3
0.4
0.5
1989 1990 1991 1992 1993 1994 1995 1996 1997
Thailand Predicted Onset of Bank Crisis
0
0.1
0.2
0.3
0.4
0.5
1989 1990 1991 1992 1993 1994 1995 1996 1997
38
Appendix A
Industrial Countries Emerging Markets Other Developing
Austria Argentina BelizeBelgium Bangladesh BoliviaCanada Botswana BurundiDenmark Brazil CameroonFinland Chile Costa RicaFrance Colombia CyprusGermany Ecuador Dominican RepublicGreece Egypt El SalvadorIceland Hong Kong Equatorial GuineaIreland Ghana EthiopiaItaly India FijiJapan Indonesia GrenadaLuxembourg Jordan GuatemalaNetherlands Kenya Guinea-BissauNew Zealand Korea GuyanaNorway Malaysia HaitiPortugal Mauritius HondurasSpain Mexico HungarySweden Morocco JamaicaSwitzerland Pakistan Lao P.D. Rep.United Kingdom Peru Madagascar
Philippines MalawiSingapore MaliSouth Africa MaltaSri Lanka MozambiqueThailand MyanmarTrinidad and Tobago NepalTunisia NicaraguaTurkey NigeriaUruguay PanamaVenezuela ParaguayZimbabwe Romania
Sierra LeoneSwazilandSyrian Arab Rep.UgandaZambia
Note: The "All Country" sample includes "Industrial Countries", "Emerging Markets", and "Other Developing Countries"; the"Developing Country" sample includes "Emerging markets" and "Other Developing".
39
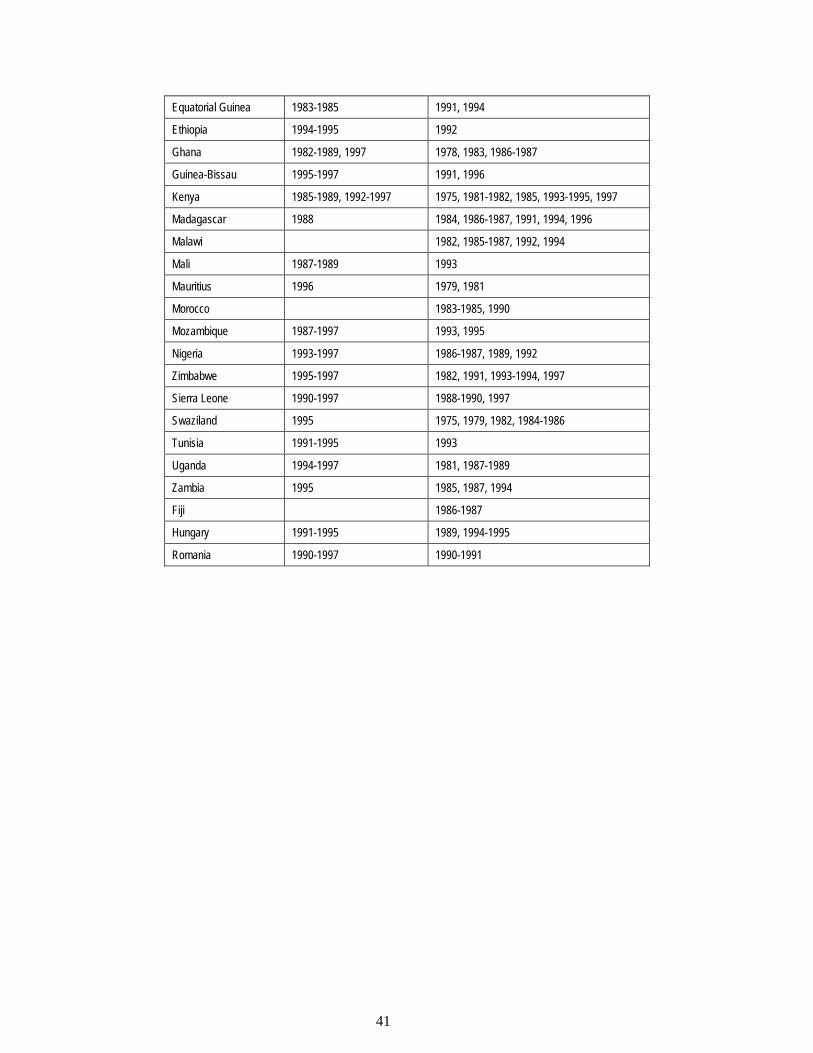
Appendix B
Occurrences of Banking and Currency Crises
Banking Crisis Currency Crisis
United Kingdom 1975-1976, 1984 1976, 1979, 1981-1982, 1986, 1992
Austria
Belgium 1982
Denmark 1987-1992
France 1994-1995 1982
Germany 1978-1979
Italy 1990-1995 1976, 1992, 1995
Luxembourg
Netherlands
Norway 1987-1993 1978, 1986, 1992
Sweden 1990-1993 1977, 1981-1982, 1992-1993
Switzerland 1978
Canada 1983-1985 1976, 1992
Japan 1992-1997 1979, 1989-1990
Finland 1991-1994 1977-1978, 1982, 1991-1993
Greece 1991-1995 1980, 1982-1983, 1985
Iceland 1985-1986, 1993 1983-1984, 1988, 1992-1993
Ireland
Malta 1992, 1997
Portugal 1986-1989 1976-1978, 1982-1983, 1993, 1995
Spain 1977-1985 1976-1977, 1982, 1992-1993
Turkey 1982-1985, 1991, 1994-1995 1978-1980, 1994
New Zealand 1987-1990 1975, 1983-1988, 1991
South Africa 1977, 1985, 1989 1975, 1978, 1984-1986, 1996
Argentina 1980-1982, 1989-1990,1995-1997
1975-1976, 1982-1983, 1989-1991
Bolivia 1986-1987, 1994-1997 1981-1985, 1988, 1990-1991
Brazil 1990, 1994-1997 1982-1983, 1987, 1990-1991, 1995
Chile 1976, 1981-1983 1985
Columbia 1982-1987 1985
Costa Rica 1987, 1994-1997 1981
Dominican Republic 1985, 1987, 1990
40
Ecuador 1980-1982, 1996-1997 1982-1983, 1985-1986, 1988
El Salvador 1989 1986, 1990
Guatemala 1991-1992 1986, 1989-1990
Haiti 1977, 1991
Honduras 1990
Mexico 1981-1991, 1995-1997 1976, 1982, 1985, 1994-1995
Nicaragua 1988-1996 1993
Panama 1988-1989
Paraguay 1995-1997 1984-1986, 1988-1989, 1992
Peru 1983-1990 1976, 1979, 1978-1988,
Uruguay 1981-1984 1982-1983
Venezuela 1978-86, 1994-1997 1984, 1986, 1994-1996
Grenada 1978
Guyana 1993-1995 1978, 1989-1991
Belize
Jamaica 1994-1997 1978, 1983-1984, 1990-1992
Trinidad & Tobago 1982-1993 1985, 1988, 1993
Cyprus
Jordan 1989-1990 1983, 1987-1989, 1992
Syrian Arab Republic 1977, 1982, 1988
Egypt 1980-1985, 1991-1995 1979, 1989-1991
Bangladesh 1987-1996 1975-1976
Myanmar 1996-1997 1975-1977
China, P.R.: Hong Kong 1982-1986
India 1993-1997 1976, 1991, 1993, 1995
Indonesia 1994, 1997 1978, 1983, 1986, 1997
Korea 1997 1980, 1997
Lao People’s D. R. 1991-1994, 1997 1995
Malaysia 1985-1988, 1997 1986, 1997
Nepal 1988-1994 1975, 1981-1982, 1984-1986, 1991, 1993,1995
Pakistan
Philippines 1981-1987, 1997 1983-1984, 1986, 1997
Singapore 1982 1975
Thailand 1983-1987, 1997 1981, 1984, 1997
Botswana 1994-1995 1984-1986, 1996
Burundi 1994-1997 1976, 1983,1986, 1988-1989, 1991, 1997
Cameroon 1987-1993, 1995-1997 1982, 1984, 1994
41
Equatorial Guinea 1983-1985 1991, 1994
Ethiopia 1994-1995 1992
Ghana 1982-1989, 1997 1978, 1983, 1986-1987
Guinea-Bissau 1995-1997 1991, 1996
Kenya 1985-1989, 1992-1997 1975, 1981-1982, 1985, 1993-1995, 1997
Madagascar 1988 1984, 1986-1987, 1991, 1994, 1996
Malawi 1982, 1985-1987, 1992, 1994
Mali 1987-1989 1993
Mauritius 1996 1979, 1981
Morocco 1983-1985, 1990
Mozambique 1987-1997 1993, 1995
Nigeria 1993-1997 1986-1987, 1989, 1992
Zimbabwe 1995-1997 1982, 1991, 1993-1994, 1997
Sierra Leone 1990-1997 1988-1990, 1997
Swaziland 1995 1975, 1979, 1982, 1984-1986
Tunisia 1991-1995 1993
Uganda 1994-1997 1981, 1987-1989
Zambia 1995 1985, 1987, 1994
Fiji 1986-1987
Hungary 1991-1995 1989, 1994-1995
Romania 1990-1997 1990-1991