bank indonesia - seadelt.net · opec organization of petroleum exporting countries pefindo...
TRANSCRIPT
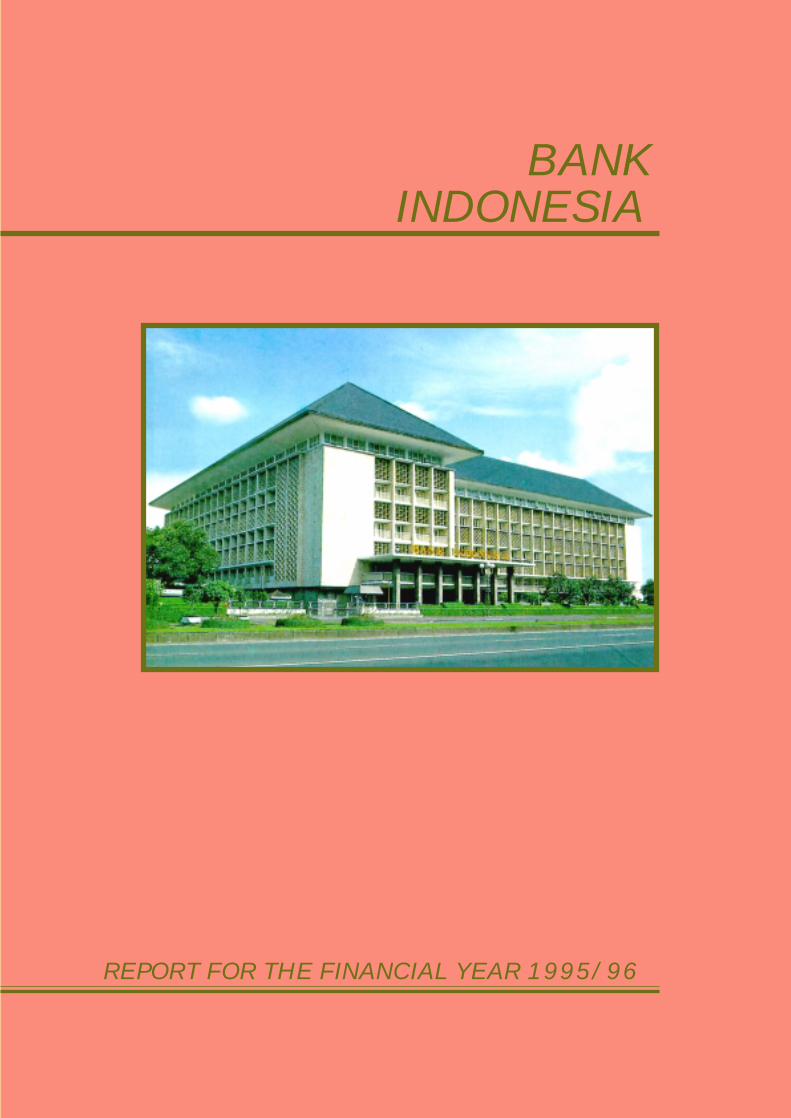
BANKINDONESIA
REPORT FOR THE FINANCIAL YEAR 1995/96
Head Office
Representatives
Branches
ISSN 0854 - 803X
iii
SYMBOLS, REPORTING PERIOD, AND SOURCE OF DATA
r Revised figures* Provisional figures** Incomplete figures (based on incomplete data). . . Data not yet available- Data not availablex Break in comparability before and after the symbol- - Nil or less than the last digit$ United States dollarRp Rupiah
Reporting period is the fiscal year, from April 1, 1995 to March 31, 1996.Source of data is Bank Indonesia, unless mentioned otherwise.
iv
ADBADBADBADBADB Asian Development BankADFADFADFADFADF Asian Development FundAELMAELMAELMAELMAELM APEC Economic Leaders MeetingAFASAFASAFASAFASAFAS ASEAN Framework Agreement on ServicesAFTAAFTAAFTAAFTAAFTA ASEAN Free Trade AreaAPBNAPBNAPBNAPBNAPBN State Budget (Anggaran Pendapatan dan Belanja Negara)APECAPECAPECAPECAPEC Asia-Pacific Economic CooperationApkindoApkindoApkindoApkindoApkindo Indonesian Wood Panel Association (Asosiasi Panel Kayu Indonesia)ASEANASEANASEANASEANASEAN Association of South-east Asian NationsASEMASEMASEMASEMASEM Asian-European MeetingATMATMATMATMATM Automated Teller MachineBapepamBapepamBapepamBapepamBapepam Capital Market Supervisory Agency (Badan Pengawas Pasar Modal)BISBISBISBISBIS Bank for International SettlementsBKDBKDBKDBKDBKD Rural Credit Agency (Badan Kredit Desa)BLSBLSBLSBLSBLS Baseline Economic SurveyBPRBPRBPRBPRBPR Rural Credit Bank (Bank Perkreditan Rakyat)BulogBulogBulogBulogBulog State Logistics Agency (Badan Urusan Logistik)BUMNBUMNBUMNBUMNBUMN State-owned Enterprise (Badan Usaha Milik Negara)CGICGICGICGICGI Consultative Group for IndonesiaC NC NC NC NC N Credit NoteC PC PC PC PC P Commercial PaperCPICPICPICPICPI Cunsumer Price IndexCPOCPOCPOCPOCPO Crude Palm OilCSFCSFCSFCSFCSF Currency Stabilization FundsD ND ND ND ND N Debit NoteDNSDNSDNSDNSDNS Deferred Net SettlementDSRDSRDSRDSRDSR Debt Service RatioDVPSDVPSDVPSDVPSDVPS Delivery versus Payment SystemEFMEFMEFMEFMEFM Emergency Financing MechanismEFTEFTEFTEFTEFT Electronic Fund TransferEPTEEPTEEPTEEPTEEPTE Export Oriented Production Entrepot (Entrepot Produksi untuk Tujuan Ekspor)FKP-PUKFKP-PUKFKP-PUKFKP-PUKFKP-PUK Banking Communication Forum - Small Enterprise Development (Forum
Komunikasi Perbankan untuk Pengembangan Usaha Kecil)GABGABGABGABGAB General Agreement to Borrow
LIST OF ABBREVIATIONS
v
GATTGATTGATTGATTGATT General Agreement on Tariffs and TradeGDPGDPGDPGDPGDP Gross Domestic ProductGWMGWMGWMGWMGWM Statutory Reserve Requirement (Giro Wajib Minimum)HVPSHVPSHVPSHVPSHVPS High Value Payment SystemIBRDIBRDIBRDIBRDIBRD International Bank for Reconstruction and DevelopmentIDAIDAIDAIDAIDA International Development AssociationIDBIDBIDBIDBIDB Islamic Development BankIDTIDTIDTIDTIDT Presidential Instruction on subsidies for least developed village (Inpres Desa
Tertinggal)IGAIGAIGAIGAIGA Investment Guarantee AgreementIMFIMFIMFIMFIMF International Monetary FundJATSJATSJATSJATSJATS Jakarta Automated Trading SystemJSXJSXJSXJSXJSX Jakarta Stock ExchangeKKPAKKPAKKPAKKPAKKPA Primary Cooperative Credit for Member scheme (Kredit Koperasi Primer untuk
Anggota)KKUDKKUDKKUDKKUDKKUD Credit to Village Unit Cooperative (Kredit kepada Koperasi Unit Desa)KUDKUDKUDKUDKUD Village Unit Cooperative (Koperasi Unit Desa)KUKKUKKUKKUKKUK Credit to Small-scale Enterprise (Kredit Usaha Kecil)KUTKUTKUTKUTKUT Credit to Farmer (Kredit Usaha Tani)LDKPLDKPLDKPLDKPLDKP Rural Credit Fund Institution (Lembaga Dana Kredit Pedesaan)LDRLDRLDRLDRLDR Loan to Deposit RatioLIBORLIBORLIBORLIBORLIBOR London Interbank Offered RateLLLLLLLLLLLLLLL Legal Lending LimitLNGLNGLNGLNGLNG Liquefied Natural GasLPGLPGLPGLPGLPG Liquefied Petroleum GasLPILPILPILPILPI Preliminary Feasibility Study (Laporan Peluang Investasi)LPKLPKLPKLPKLPK Bankable Proposal (Laporan Permohonan Kredit)LP2KLP2KLP2KLP2KLP2K Bankable Proposal Appraisal (Laporan Penilaian Permohonan Kredit)LPSMLPSMLPSMLPSMLPSM Self-help Promotion Institution (Lembaga Pengembangan Swadaya Masyarakat)LVPSLVPSLVPSLVPSLVPS Low Value Payment SystemMDFMDFMDFMDFMDF Medium Density FibreboardMMBTUMMBTUMMBTUMMBTUMMBTU Mille Mille (million) British Thermal UnitMWMWMWMWMW MegawattMWhMWhMWhMWhMWh Megawatt/hourNIEsNIEsNIEsNIEsNIEs Newly Industrializing EconomiesNMPNMPNMPNMPNMP Net Material ProductNPSNPSNPSNPSNPS National Payment SystemODAODAODAODAODA Official Development AssistanceOECDOECDOECDOECDOECD Organization for Economic Cooperation and Development
vi
OECFOECFOECFOECFOECF Overseas Economic Cooperation FundOPECOPECOPECOPECOPEC Organization of Petroleum Exporting CountriesPefindoPefindoPefindoPefindoPefindo Indonesian Rating Agency (PT Pemeringkat Efek Indonesia)PERPERPERPERPER Price Earning RatioPHBKPHBKPHBKPHBKPHBK Linking Bank and Self-help Group Project (Proyek Hubungan Bank dengan KSM)PIBSPIBSPIBSPIBSPIBS Parallel Information Bond SystemPJPPJPPJPPJPPJP Long-term Development (Pembangunan Jangka Panjang)PKLPKLPKLPKLPKL Field Consultancy Worker (Petugas Konsultasi Lapangan)PKLNPKLNPKLNPKLNPKLN Commercial Offshore Loan (Pinjaman Komersial Luar Negeri)PKMPKMPKMPKMPKM Micro-credit Project (Proyek Kredit Mikro)PKUKTPKUKTPKUKTPKUKTPKUKT Runway Case Project (Proyek Kemitraan Usaha Kecil Terpadu)PLNPLNPLNPLNPLN State Electric Company (Perusahaan Umum Listrik Negara)PLTDPLTDPLTDPLTDPLTD Diesel-powered electric plant center (Pusat Listrik Tenaga Diesel)PLTUPLTUPLTUPLTUPLTU Hydrothermal electric plant center (Pusat Listrik Tenaga Gas/Uap)PMAPMAPMAPMAPMA Foreign Direct Investment (Penanaman Modal Asing)PMDNPMDNPMDNPMDNPMDN Domestic Investment (Penanaman Modal Dalam Negeri)RepelitaRepelitaRepelitaRepelitaRepelita Five-year Development Plan (Rencana Pembangunan Lima Tahun)RepoRepoRepoRepoRepo Repurchase AgreementR RR RR RR RR R Reserve requirementSBISBISBISBISBI Bank Indonesia Certificate (Sertifikat Bank Indonesia)SBPTSBPTSBPTSBPTSBPT Advice (Surat Bukti Penerimaan Transfer)SBPUSBPUSBPUSBPUSBPU Money Market Securities (Surat Berharga Pasar Uang)SDRSDRSDRSDRSDR Special Drawing RightsSIBORSIBORSIBORSIBORSIBOR Singapore Interbank Offered RateSNASNASNASNASNA System of National AccountSSESSESSESSESSE Surabaya Stock ExchangeSWIFTSWIFTSWIFTSWIFTSWIFT Society for Worldwide Interbank Financial TelecommunicationToFToFToFToFToF Training of FacilitatorsToTToTToTToTToT Training of TrainersUPUKUPUKUPUKUPUKUPUK Local Enterprise Development Unit (Unit Pengembangan Usaha Kecil)USDUSDUSDUSDUSD United States DollarWBUTWBUTWBUTWBUTWBUT Bank Draft (Wesel Bayar untuk Transfer)WTOWTOWTOWTOWTO World Trade OrganizationZ AZ AZ AZ AZ A Zinc Amonium
vii
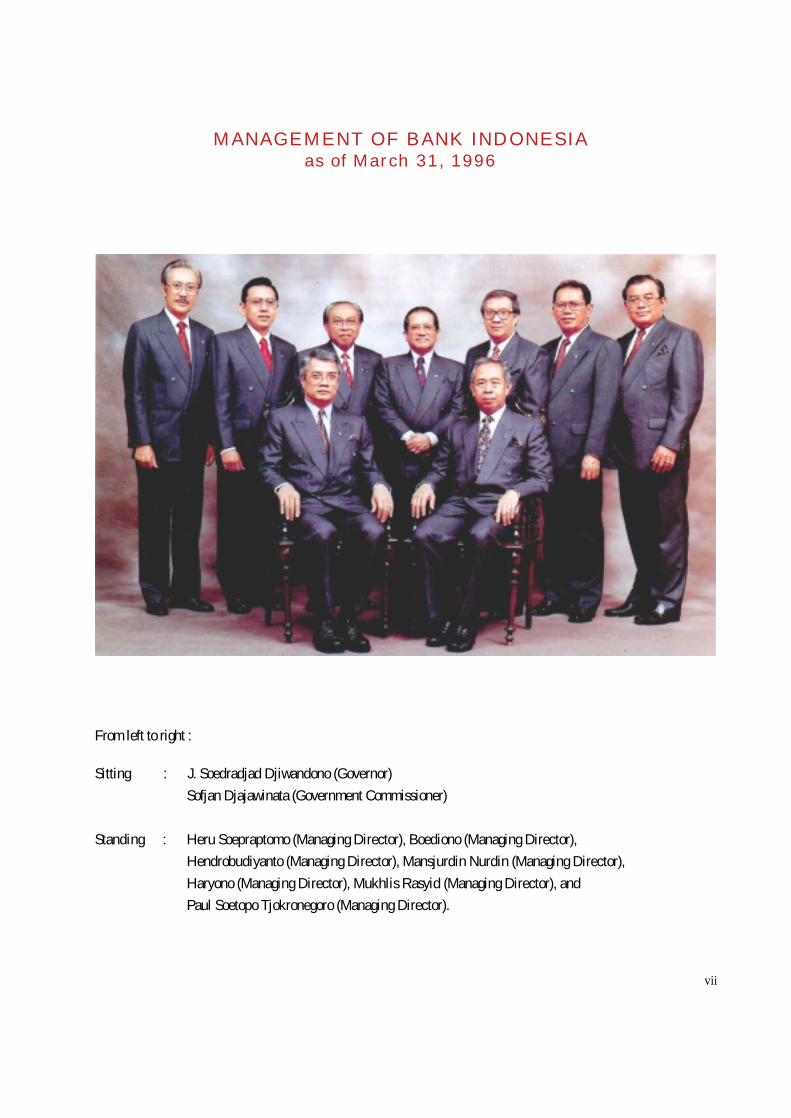
MANAGEMENT OF BANK INDONESIAas of March 31, 1996
From left to right :
Sitting : J. Soedradjad Djiwandono (Governor)
Sofjan Djajawinata (Government Commissioner)
Standing : Heru Soepraptomo (Managing Director), Boediono (Managing Director),
Hendrobudiyanto (Managing Director), Mansjurdin Nurdin (Managing Director),
Haryono (Managing Director), Mukhlis Rasyid (Managing Director), and
Paul Soetopo Tjokronegoro (Managing Director).
viii
FOREWORD
With thanks to God Almighty, I am pleased to present the 1995/ 96 BankIndonesia Annual Report pursuant to Article 46, Act No. 13,1968 on the CentralBank. This report covers comprehensively various key economic and financialdevelopments in Indonesia as well as policies adopted in the preceding year. Theannual report also present Indonesia’s economic prospects and future policydirections.
Fiscal year 1995/96 was the second year of the sixth five-year developmentplan (Repelita VI). In retrospect, we have witnessed various important develop-ments that took place in the real and monetary sectors as well as on the domesticand external front. Furthermore, it is evident that global economic trends areincreasingly moving toward intensive international trade and investment flows,faster world financial market integration, and greater significance of the privatesector as a prime mover of the economy. As a result, international as well asdomestic economic financial relations are becoming more complex, with the con-sequent implication that economic-monetary management has become more com-plicated and multivarious. These have been the experience of Indonesia as wellas the prospects facing Indonesia an open economy which is increasingly inte-grated with the world economy. It is both a challenge and an opportunity for usin the management of the macroeconomy at the present time and in the future.
Several major developments deserve particular emphasis as they coloredIndonesia’s economy in fiscal year 1995/96 and were the factors underlyingvarious policies adopted. Overall, Indonesia’s economic development in fiscalyear 1995/96 showed heartening growth. The previous year’s economic growth of8.1% reflected the dynamism of the economy. Robust expansion has effectivelystimulated greater employment opportunities and optimized the allocation andutilization of resources. This high growth rate, however, signifies developmentswhich are of particular concern to the monetary authority. The national economyhas exhibited signs of overheating as reflected in the high inflation rate and therising current account deficit. A prolongation of this symptom is an indicationthat the economic growth faced production capacity constraints. Expenditureoverruns and high import growth which outpaced export growth, cannot be al-lowed to continue indefinitely.
ix
In fiscal year 1995/96, the robust domestic demand led to strong inflationarypressures. Furthermore, the supply side encountered substantial setbacksincluding adverse weather conditions, distribution problems, and highproduction costs, which also contributed to the strong inflationary pressures. Asa result, the inflation level rose from 8.57% to 8.86% in fiscal year 1995/96,above the 5% annual target of Repelita VI. In view of the circumstance, thegovernment will persist in its efforts to contain the inflation rate to its targetthrough policies aimed at influencing the supply as well as demand side.
On the external side, Indonesia’s balance of payments experienced substantialpressures, particularly in the current account. The buoyant domestic economyhas brought about strong non-oil/gas import growth of 19.8% while non-oil/gasexports only grew 13.9%. This development caused the current account deficit torise substantially from 2% of GDP to 3.3% in 1995/96. The high import rate is acause for concern in view that it surpassed export capacity to earn foreign ex-change, thus widening the current account deficit. For a sustainable currentaccount deficit, the Government will continue to persevere to maintain the ratioat approximately 2%. Nonetheless, the overall balance of payments remainedsecure as the current account deficit was completely financed by increasingcapital inflows, thereby maintaining foreign exchange reserves equivalent to 4-5months non-oil/gas imports.
In the banking sector, Indonesian banks showed strong credit expansion of23.6% in 1995/96. Along with this expansion, the consolidation process proceedssteadily, contributing to the rising profitability and efficiency of banking busi-nesses. Bank efforts to comply with prudential principles also improved, asmeasured by the loan to deposit ratio (LDR), net open position (NOP) and the le-gal lending limit (LLL). Nevertheless, compliance to the capital adequacy ratio(CAR) declined on average owing to strong bank credit expansion. With theprogress of consolidation process, it is expected that national banks will bebetter prepared to compete with foreign banks.
As the dynamics of the existing problems have become more complex, in 1995/96, the Government continued to adopt policies aimed at facilitating the businesscommunity to adjust to this new environment. In the real sector, the governmentpressed ahead with various adjustment measures to promote the competitivenessof Indonesia’s businesses through deregulation policies. In the monetary sector,
x
Bank Indonesia continued to enhance the effectiveness of existing monetary in-struments as monetary management may no longer rely on only a single mon-etary instrument. Hence, besides promoting the effectiveness of open market op-erations, Bank Indonesia also activated and improved the effectiveness of otherinstruments. In this regard, adjustment of the reserve requirement to statutoryreserves, widening of the conversion rate spread, setting the intervention bandand the use of active moral suasion such as requiring banks to submit annualcredit plans to Bank Indonesia, were measures that have been taken to diversifymonetary instruments. To reinforce the effectiveness of monetary management,Bank Indonesia has also begun to involve itself in the supervision of financialinstitutions since last fiscal year. The above measures were supported by effortsto maintain exchange rate stability in which Bank Indonesia has cooperated withsix monetary authorities in the Asia Pacific region and signed securities repur-chase agreements.
Looking ahead, future challenges will undoubtedly be greater. Nonetheless, inview of the existing fundamental factors, as well as robust world economic devel-opment, we are optimistic that we will be able to sustain our economic perfor-mance. Strong investment growth in line with the Government’s persistent effortsto faster a conducive business climate through various’ adjustment policies areexpected to continue to stimulate domestic demand. Meanwhile, improved worldeconomy, particularly in developed industrial countries, is expected to boostIndonesia’s export growth.
Macroeconomic stability continues to be the highest priority on theGovernment’s economic policy agenda. Efforts will be extended to lessen economicoverheating by managing the inflation level and reducing the current accountdeficit, particularly by increasing export. As one of the key responsibilities ofBank Indonesia is to preserve stability, Bank Indonesia will continue to enhancethe effectiveness of monetary management to contain demand as well as thepresent burgeoning current account deficit without jeopardizing stability. Inpart, this will be accomplished through the management of foreign borrowingand foreign exchange reserves. In the long run, however, we must guard againstthe widening of the national saving-investment gap. This represents the challengefor present as well as future monetary and banking policies which constitutepart of prudent macro policies.
Finally, I hope that the 1995/96 Bank Indonesia Annual Report will be useful
xi
to the public who wish to know in depth about developments in the area of eco-nomics, finance, and banking as well as regarding various problems faced andpolicies adopted to overcome those problems.
On behalf of the Board of Directors of Bank Indonesia, I would like to thank allparties who have assisted and cooperated in the production of this annual report.I hope that the cooperation and mutual understanding of all parties involved inthe completion of this report will always be maintained, and improved in thefuture.
Jakarta, May 1996The Governor of Bank Indonesia
J. Soedradjad Djiwandono
1
The Indonesian economy showed
increasingly rapid development in 1995/96. The
accelerating economic performance since mid
1994 was further stimulated by various
developments especially within the country.
Stable macroeconomic conditions and sound
economic fundamentals in the country were the
underlying factors that triggered the expansion
in domestic demand. Improvements in the
business climate through deregulation
measures, especially in investment,
accompanied by rising business confidence in
the economic prospects of Indonesia, were the
major factors behind the investment boom in
the reporting year. Furthermore, another
prominent factor was the higher purchasing
power per capita as a positive effect of the
relatively high national income growth in the
last few years. This has stimulated private
consumption which in turn spurred further
economic expansion in 1995.
On the financial side, financial
institutions, in particular banks which have
been preoccupied with various consolidation
efforts in the last few years, were increasingly
ready to support economic activity in the
reporting year. In line with this development,
bank credit grew rapidly although interest rates
were relatively higher than in 1994. The gap
between funds mobilized and credit extended by
banks widened in the beginning of the reporting
year.
Strong demand for liquidity has caused
banks to increase deposit interest rate which,
in turn, enabled banks to mobilize funds from
the public and other sources within the country.
Relatively tight monetary situation also
encouraged economic agents, including banks,
to source for funds abroad, which was further
stimulated by the widening interest rate
differentials as international rates tended to
decline in 1995. Following these developments
and bullish capital market performance, capital
inflows on the whole rose steeply in the
reporting year. Toward the end of the reporting
year, the gap between funds and bank credit
narrowed again.
Rapid economic developments that were
spurred by the domestic demand have
stimulated economic growth to 8.1% in 1995
and increased the GDP per capita to
$1,023.00. However, the high economic
growth was followed by economic overheating
tendencies. Buoyant investment and
consumption activities have caused sharp
increases in several economic sectors, such
as the construction sector and the
manufacturing sector, especially cement,
paper, and automotive industries. Capacity
utilization in these sectors reached high
levels and symptoms of price increases of
some domestic products began to appear. The
relatively unfavorable agriculture production
and disturbances in the distribution system
1. INDONESIAN ECONOMY
2
have further exacerbated pressures on
supply. As a consequence, inflationary
pressures remained high and the inflation
rate in 1995/96 reached 8.9%. The strong
domestic demand was also reflected in
Indonesia’s external position. Rising demand
that was not fully balanced by rising domestic
production ultimately had to be met by import
which surged substantially in the reporting
year. With relatively slow export growth owing
to various factors on the demand as well as
supply side, the current account deficit rose
steeply from 2.0% of the GDP to 3.3% of the
GDP in 1995/96.
In order to cool down the overheating
tendencies, the Government adopted integrated
economic policies, encompassing macro as well
as sectoral aspects. At the macrolevel, policies
were aimed at managing the accelerating
domestic demand in the reporting year. To that
effect, in the fiscal area, the Government
attempted to further raise revenues and
enhance financial operation by earmarking
expenditures toward infrastructure
development and poverty alleviation.
Furthermore, the Government also attempted
to control import growth by reviewing
government and state enterprise projects. In the
monetary and banking area, policies were
aimed at controlling sources of money supply
expansion, particularly bank credit. The
prevailing rates on monetary instruments
continued to be maintained although
international interest rates tended to decline.
Moreover, Bank Indonesia also extended moral
suasion efforts to urge banks to slow down credit
expansion, especially in the property sector.
This measure was followed by regulations that
required banks to submit their credit expansion
plans for 1996 to Bank Indonesia to be
examined on the aspect of bank prudential
principles. Efforts to manage credit expansion
were also supported by new regulations
requiring higher paid-in capital for foreign
exchange banks and the implementation of
statutory reserve requirement for commercial
banks. These steps were strengthened by the
widening spread of conversion rate and setting
the limits of the intervention band. At the
sectoral level, policies were aimed at raising
efficiency and productivity on the supply side
by fostering a more conducive business climate
and providing better facilities and incentives,
particularly for export-related activities. This
two-pronged economic policy strategy will be
able to avert excessive domestic demand while
improved competitiveness and supply response
will stimulate export. As the sources of growth
become more balanced, the foundation of
economic development will be more solid to
support a sustainable expansion of economic
activity.
International Background
World economic situation in 1995/96
continued to show positive developments. World
economy and trade volume rose at relatively
high levels. These have created opportunities
for export activities in Indonesia although they
were simultaneously followed by increasingly
intense competition from countries such as
China, India, Pakistan, and Vietnam.
3
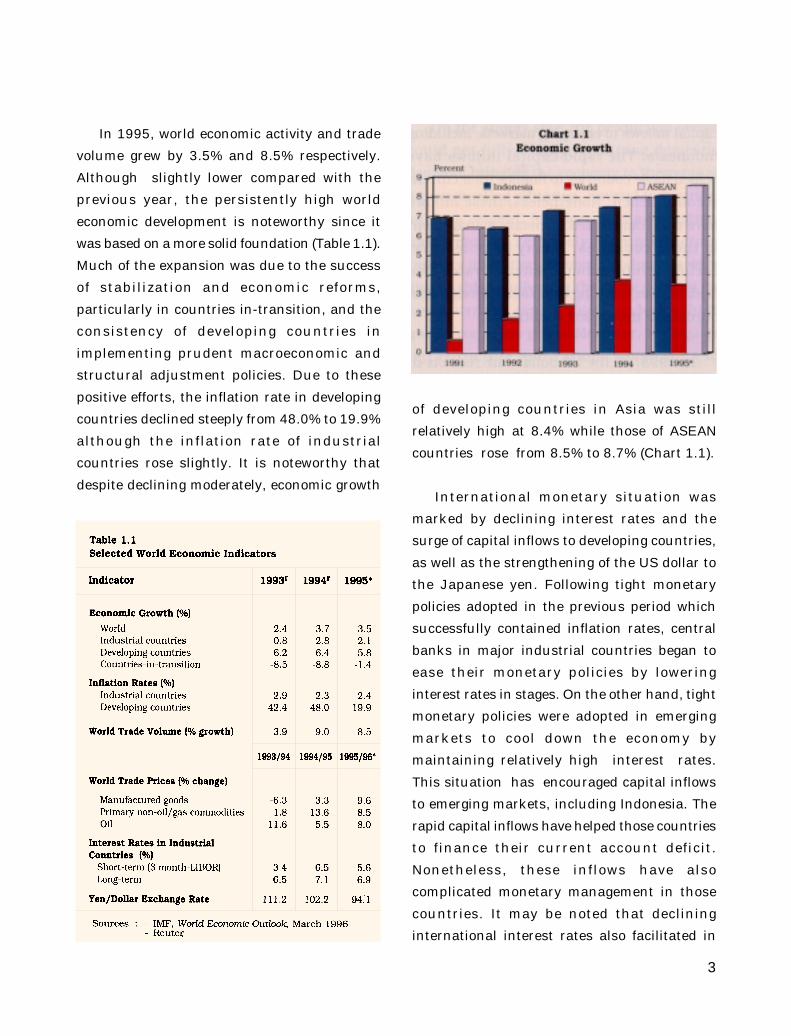
In 1995, world economic activity and trade
volume grew by 3.5% and 8.5% respectively.
Although slightly lower compared with the
previous year, the persistently high world
economic development is noteworthy since it
was based on a more solid foundation (Table 1.1).
Much of the expansion was due to the success
of stabilization and economic reforms,
particularly in countries in-transition, and the
consistency of developing countries in
implementing prudent macroeconomic and
structural adjustment policies. Due to these
positive efforts, the inflation rate in developing
countries declined steeply from 48.0% to 19.9%
although the inflation rate of industrial
countries rose slightly. It is noteworthy that
despite declining moderately, economic growth
of developing countries in Asia was still
relatively high at 8.4% while those of ASEAN
countries rose from 8.5% to 8.7% (Chart 1.1).
International monetary situation was
marked by declining interest rates and the
surge of capital inflows to developing countries,
as well as the strengthening of the US dollar to
the Japanese yen. Following tight monetary
policies adopted in the previous period which
successfully contained inflation rates, central
banks in major industrial countries began to
ease their monetary policies by lowering
interest rates in stages. On the other hand, tight
monetary policies were adopted in emerging
markets to cool down the economy by
maintaining relatively high interest rates.
This situation has encouraged capital inflows
to emerging markets, including Indonesia. The
rapid capital inflows have helped those countries
to finance their current account deficit.
Nonetheless, these inflows have also
complicated monetary management in those
countries. It may be noted that declining
international interest rates also facilitated in
4
reducing the existing foreign debt burdens of
developing countries.
In 1995/96 the US dollar rate rose vis-a-visthe Japanese yen, after dropping drastically in
the previous period. Excessive concerns
regarding the inflation level and the current
account deficit of the United States following
the Mexican crisis have prompted the
weakening of the dollar’s exchange rate against
yen to below ¥80 at the beginning of the
reporting period. Nonetheless, in line with the
accord of the group of G-7 countries and
economic turnaround of the United States, the
dollar’s exchange rate in terms of yen began to
strengthen again since July 1995 and reached
¥107 at the end of the reporting period. For
Indonesia, the weaker yen against the dollar
has decreased the burden on principal and
interest payments of Indonesia’s foreign debt
because part of the debt is denominated in yen.
The year 1995/96 also witnessed stronger
international cooperation to create freer world
trade. In November 1995 in Osaka, Japan,
countries of the Asia Pacific Economic
Cooperation (APEC) agreed on an Initial Action
as a first step toward the creation of a free trade
and investment area in the next 25 years. In
the ASEAN countries, ASEAN leaders also
reconfirmed their commitment to speed up the
implementation of the ASEAN Free Trade Area
(AFTA) that was originally set at the latest by 2008
to 2003. This trade agreement incorporates trade
in services, covering financial services as
outlined in the ASEAN Framework Agreement
on Services (AFAS). In the meantime, in
anticipation of the potential of Asia as a world
economic growth center, leaders of European and
Asian countries held a meeting in Bangkok,
Thailand, in March 1996, to increase economic
cooperation between the two group of countries.
Economic Developments
National Income
As mentioned earlier, robust domestic
demand, particularly in private-sector
investment and consumption, has sustained
the Indonesian economy in 1995. The
accelerating domestic demand outpaced
domestic supply, resulting in pressures on the
internal and external balances. On the internal
side, the imbalance between demand and supply
drove price increases, and as a result, the
inflation rate remained relatively high. On the
external side, the disequilibrium also
encouraged the acceleration in import. This
development which was followed by relatively
slow export growth brought about negative
contribution of the external sector to the GDP.
The rising private investment was
encouraged by a more conducive business
climate owing to positive impacts of various
deregulations in the real sector in the last few
years. Among others, this includes the opening
of broader business opportunities for foreign
investors as well as the reduction of tariff and
non-tariff barriers in stages. Furthermore, the
promising prospects of the Indonesian economy
also attracted domestic and foreign investors. As
a result, foreign direct investment (penanaman
5
modal asing/PMA) and domestic investment
(penanaman modal dalam negeri/PMDN) approvals
surged in the last two years, which were partly
aimed toward domestic needs and
infrastructures, such as petrochemicals,
transportation, electricity, gas, and water projects.
Private consumption also rose rapidly,
primarily because of rising disposable income.
The higher disposable income per capita was
attributed to economic growth that far exceeded
population growth, especially in the last three
years. Moreover, the lowering of income tax rates
since January 1995 and higher regional
minimum wage also encouraged the increase in
the disposable income of the public. The higher
regional minimum wage resulted in the
redistribution of income to the lower-income
group, thereby increasing their disposable
income and consumption. In addition, rising
private consumption was also stimulated by
increasingly sophisticated product development
which was supported by attractive marketing
techniques, including sales on credit terms.
On the supply side, the production sector could
not fully satisfy the strong domestic demand,
bringing the economy to the verge of an
overheating situation. Several industries, such
as cement, fertilizer, and automotive, have
reached relatively high production capacity
utilization. Domestic industries were also
unable to fully meet the rising demand for raw
materials, capital goods, and some high quality
consumer goods. Moreover, inadequate
infrastructure and various constraints in market
mechanism have increased production costs
which, in turn, weakened the competitiveness
of the production sector in domestic as well as
international markets.
Recognizing these problems, the
Government has attempted to raise supply
capacity, efficiency, and competitiveness
through deregulation measures in the real
sector, besides managing domestic demand
through prudent monetary and fiscal policies.
In May 1995, the Government issued a
deregulation package covering investment and
simplification of licensing procedures in the
manufacturing sector. The Government also
continued its efforts to privatize state
enterprises. Besides increasing state revenue,
these measures also helped increase efficiency
in the real sector.
In line with government efforts to reduce the
risk of economic overheating, economic
expansions began to slow down at the end of the
reporting period. In part, this was reflected in
the slowing down of import growth since the
fourth quarter of 1995. However, in 1995, the
GDP continued to register higher growth
compared with the previous year, recording an
8.1% growth (Table 1.2). As a result, average
economic growth for the first two years of the
Sixth Five-year Development Plan (Repelita
VI) was 7.8%.
In sectoral terms, the manufacturing sector
was the major source of economic growth in 1995.
Moreover, improved performance in the
agriculture sector also increased its contribution
to the higher economic growth. On the demand
6
side, the high GDP growth was mainly caused by
a steep 13.3% rise in domestic demand. As
mentioned earlier, rapid private sector
consumption and investment growth were the
major factors boosting domestic demand. Net
external demand contributed larger negative
impacts on GDP growth as import grew much
faster than in the previous year while export
growth declined.
Rising negative contributions from net
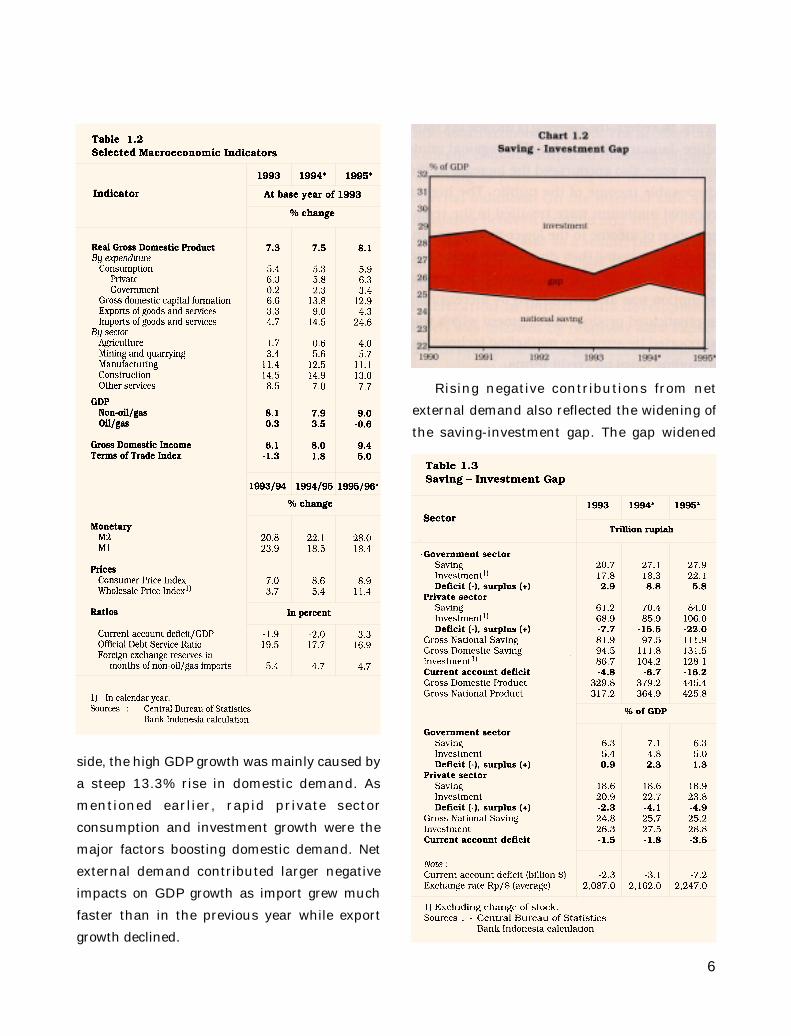
external demand also reflected the widening of
the saving-investment gap. The gap widened
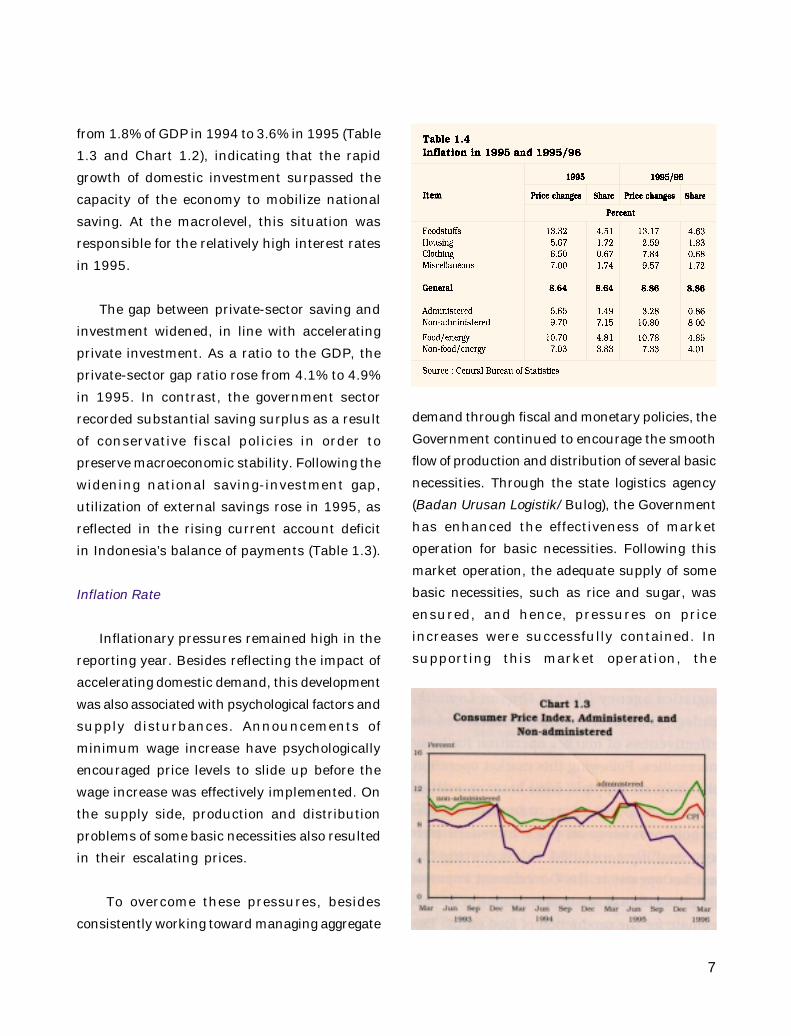
7
from 1.8% of GDP in 1994 to 3.6% in 1995 (Table
1.3 and Chart 1.2), indicating that the rapid
growth of domestic investment surpassed the
capacity of the economy to mobilize national
saving. At the macrolevel, this situation was
responsible for the relatively high interest rates
in 1995.
The gap between private-sector saving and
investment widened, in line with accelerating
private investment. As a ratio to the GDP, the
private-sector gap ratio rose from 4.1% to 4.9%
in 1995. In contrast, the government sector
recorded substantial saving surplus as a result
of conservative fiscal policies in order to
preserve macroeconomic stability. Following the
widening national saving-investment gap,
utilization of external savings rose in 1995, as
reflected in the rising current account deficit
in Indonesia’s balance of payments (Table 1.3).
Inflation Rate
Inflationary pressures remained high in the
reporting year. Besides reflecting the impact of
accelerating domestic demand, this development
was also associated with psychological factors and
supply disturbances. Announcements of
minimum wage increase have psychologically
encouraged price levels to slide up before the
wage increase was effectively implemented. On
the supply side, production and distribution
problems of some basic necessities also resulted
in their escalating prices.
To overcome these pressures, besides
consistently working toward managing aggregate
demand through fiscal and monetary policies, the
Government continued to encourage the smooth
flow of production and distribution of several basic
necessities. Through the state logistics agency
(Badan Urusan Logistik/Bulog), the Government
has enhanced the effectiveness of market
operation for basic necessities. Following this
market operation, the adequate supply of some
basic necessities, such as rice and sugar, was
ensured, and hence, pressures on price
increases were successfully contained. In
supporting this market operation, the
8
Government imported large amounts of rice in
anticipation of adverse climate for the production
of food crops. This effort was taken bearing in
mind that in the last few years disruption in rice
production was one of the critical factors that
spurred the inflation rate. The Government also
imposed export quota on several basic necessities
which were vulnerable to excess demand.
In 1995/96, the inflation rate rose to 8.86%,
compared with 8.57% in the previous period. As
a result, average inflation rate in the first two
years of Repelita VI was 8.72%, still above the
average inflation rate targeted in Repelita VI.
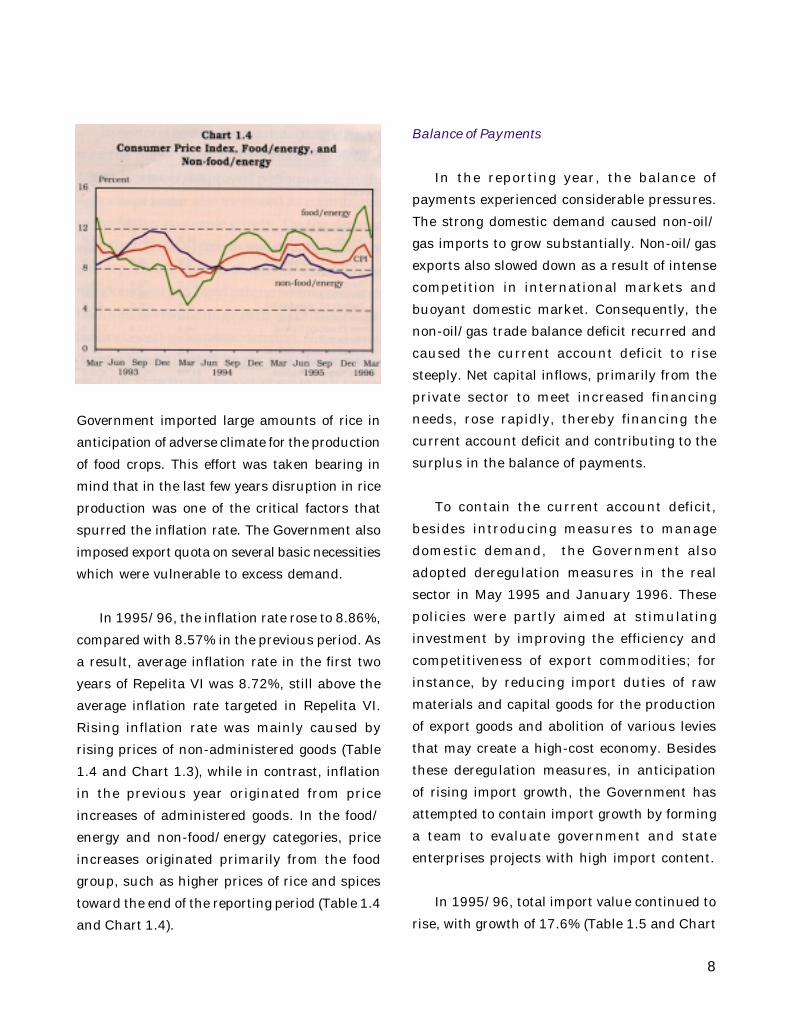
Rising inflation rate was mainly caused by
rising prices of non-administered goods (Table
1.4 and Chart 1.3), while in contrast, inflation
in the previous year originated from price
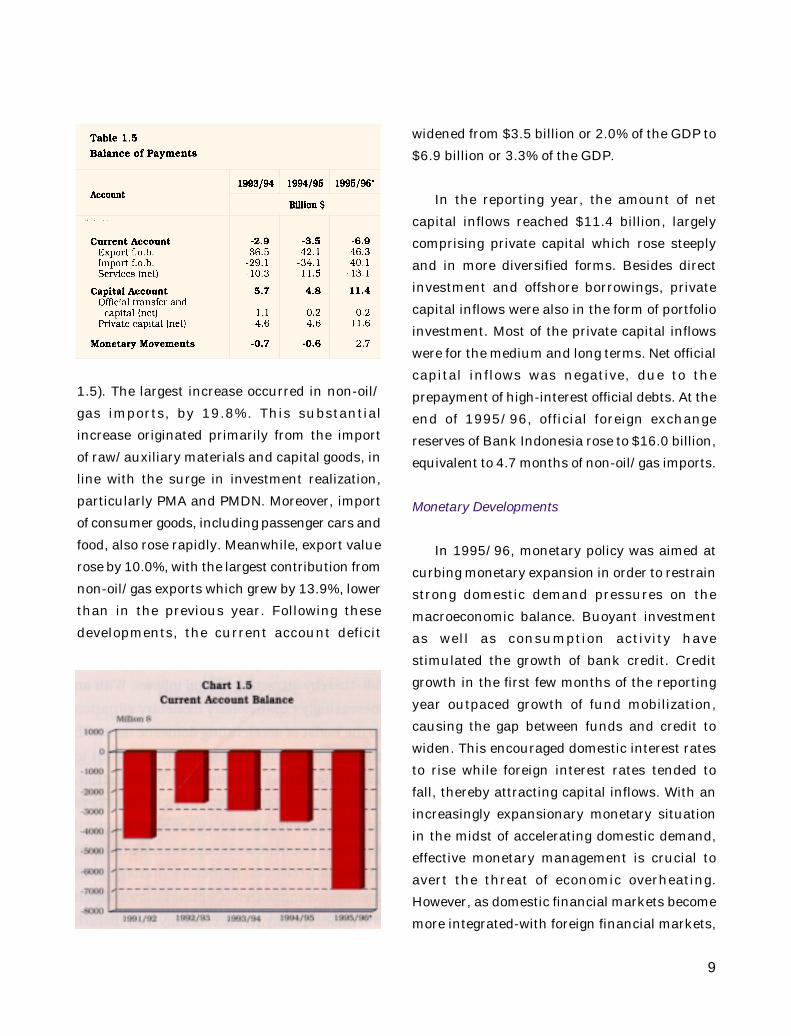
increases of administered goods. In the food/
energy and non-food/energy categories, price
increases originated primarily from the food
group, such as higher prices of rice and spices
toward the end of the reporting period (Table 1.4
and Chart 1.4).
Balance of Payments
In the reporting year, the balance of
payments experienced considerable pressures.
The strong domestic demand caused non-oil/
gas imports to grow substantially. Non-oil/gas
exports also slowed down as a result of intense
competition in international markets and
buoyant domestic market. Consequently, the
non-oil/gas trade balance deficit recurred and
caused the current account deficit to rise
steeply. Net capital inflows, primarily from the
private sector to meet increased financing
needs, rose rapidly, thereby financing the
current account deficit and contributing to the
surplus in the balance of payments.
To contain the current account deficit,
besides introducing measures to manage
domestic demand, the Government also
adopted deregulation measures in the real
sector in May 1995 and January 1996. These
policies were partly aimed at stimulating
investment by improving the efficiency and
competitiveness of export commodities; for
instance, by reducing import duties of raw
materials and capital goods for the production
of export goods and abolition of various levies
that may create a high-cost economy. Besides
these deregulation measures, in anticipation
of rising import growth, the Government has
attempted to contain import growth by forming
a team to evaluate government and state
enterprises projects with high import content.
In 1995/96, total import value continued to
rise, with growth of 17.6% (Table 1.5 and Chart
9
1.5). The largest increase occurred in non-oil/
gas imports, by 19.8%. This substantial
increase originated primarily from the import
of raw/auxiliary materials and capital goods, in
line with the surge in investment realization,
particularly PMA and PMDN. Moreover, import
of consumer goods, including passenger cars and
food, also rose rapidly. Meanwhile, export value
rose by 10.0%, with the largest contribution from
non-oil/gas exports which grew by 13.9%, lower
than in the previous year. Following these
developments, the current account deficit
widened from $3.5 billion or 2.0% of the GDP to
$6.9 billion or 3.3% of the GDP.
In the reporting year, the amount of net
capital inflows reached $11.4 billion, largely
comprising private capital which rose steeply
and in more diversified forms. Besides direct
investment and offshore borrowings, private
capital inflows were also in the form of portfolio
investment. Most of the private capital inflows
were for the medium and long terms. Net official
capital inflows was negative, due to the
prepayment of high-interest official debts. At the
end of 1995/96, official foreign exchange
reserves of Bank Indonesia rose to $16.0 billion,
equivalent to 4.7 months of non-oil/gas imports.
Monetary Developments
In 1995/96, monetary policy was aimed at
curbing monetary expansion in order to restrain
strong domestic demand pressures on the
macroeconomic balance. Buoyant investment
as well as consumption activity have
stimulated the growth of bank credit. Credit
growth in the first few months of the reporting
year outpaced growth of fund mobilization,
causing the gap between funds and credit to
widen. This encouraged domestic interest rates
to rise while foreign interest rates tended to
fall, thereby attracting capital inflows. With an
increasingly expansionary monetary situation
in the midst of accelerating domestic demand,
effective monetary management is crucial to
avert the threat of economic overheating.
However, as domestic financial markets become
more integrated-with foreign financial markets,
10
coupled with rapid innovations in financial
products, monetary management becomes
complicated. Capital inflows which will raise
liquidity in the economy may disturb open
market operations to manage domestic sources
of expansion.
To increase the effectiveness of monetary
management, Bank Indonesia enhanced the
implementation of prudent monetary and
banking policies in an effort to restrain
domestic sources of expansion and reduce
monetary leakage from the external sector. In
an effort to contain domestic sources of
monetary expansion, besides utilizing open
market operations, Bank Indonesia also
activated the use of reserve requirement
instrument. In December 1995, Bank Indonesia
amended the reserve requirement regulation
to statutory reserve. With this new regulation,
the reserve components changed from demand
deposit with Bank Indonesia and cash
originally, to only demand deposit with Bank
Indonesia. Furthermore, the new regulation
requires banks to place 3% of their funds in the
form of demand deposit with Bank Indonesia
effective from February 1996. In addition, in
order to control excessive credit expansion,
Bank Indonesia also continued to adopt moral
suasion to ensure that the rate of credit
extended by banks will be consistent with the
objectives of monetary policy. Moreover, Bank
Indonesia also issued regulations to raise the
paid-in capital and capital adequacy ratio (CAR)
of foreign exchange banks in stages. Although
it was basically aimed at increasing bank
competitiveness, indirectly, this policy will
encourage banks to be more prudent in
extending credit.
In order to curb short-term capital flows,
particularly for speculative purposes, Bank
Indonesia also attempted to increase the
flexibility of the rupiah exchange rate. In June
1995, Bank Indonesia widened its selling and
buying rate spread from Rp30.00 to Rp44.00.
Then in December 1995, Bank Indonesia set
the intervention band with an upper and lower
limit range of Rp66.00. Furthermore, the
Government also limited the amount of offshore
funds which maybe utilized by finance
companies.
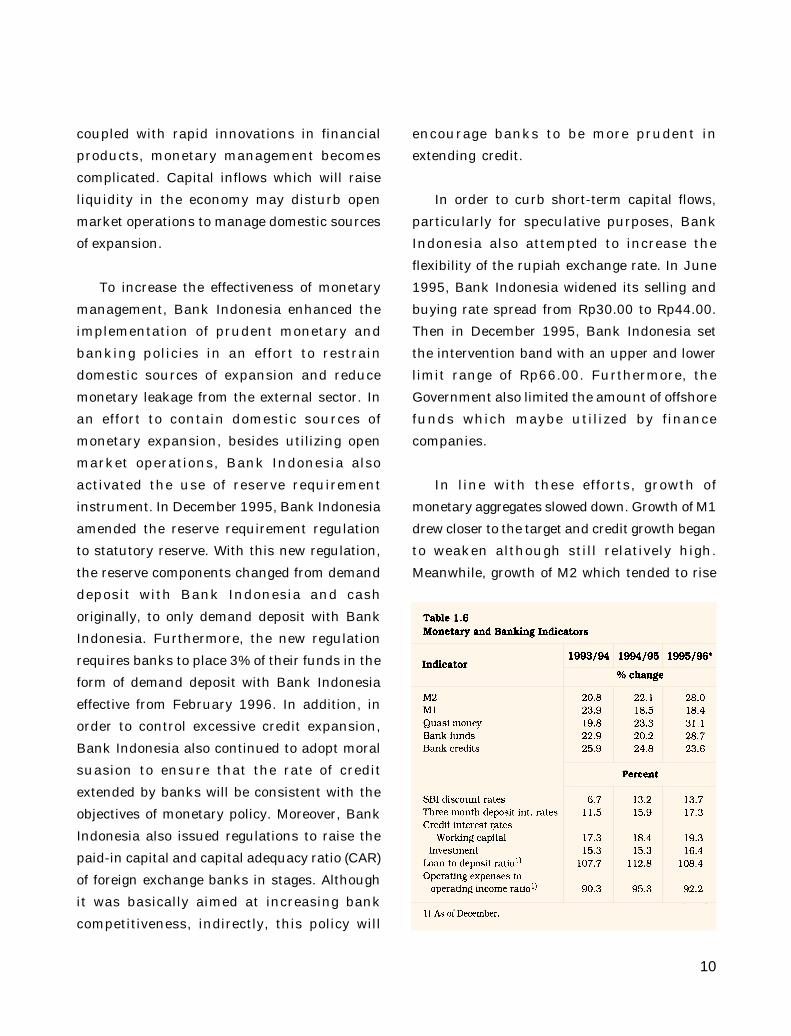
In line with these efforts, growth of
monetary aggregates slowed down. Growth of M1
drew closer to the target and credit growth began
to weaken although still relatively high.
Meanwhile, growth of M2 which tended to rise
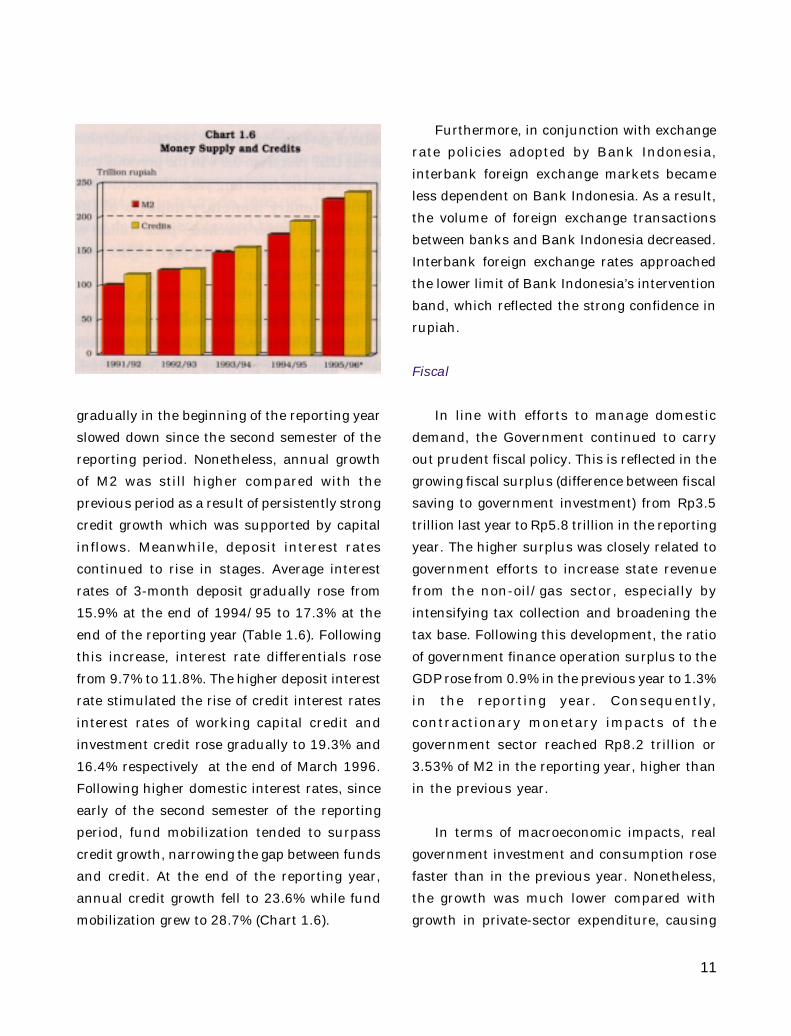
11
gradually in the beginning of the reporting year
slowed down since the second semester of the
reporting period. Nonetheless, annual growth
of M2 was still higher compared with the
previous period as a result of persistently strong
credit growth which was supported by capital
inflows. Meanwhile, deposit interest rates
continued to rise in stages. Average interest
rates of 3-month deposit gradually rose from
15.9% at the end of 1994/95 to 17.3% at the
end of the reporting year (Table 1.6). Following
this increase, interest rate differentials rose
from 9.7% to 11.8%. The higher deposit interest
rate stimulated the rise of credit interest rates
interest rates of working capital credit and
investment credit rose gradually to 19.3% and
16.4% respectively at the end of March 1996.
Following higher domestic interest rates, since
early of the second semester of the reporting
period, fund mobilization tended to surpass
credit growth, narrowing the gap between funds
and credit. At the end of the reporting year,
annual credit growth fell to 23.6% while fund
mobilization grew to 28.7% (Chart 1.6).
Furthermore, in conjunction with exchange
rate policies adopted by Bank Indonesia,
interbank foreign exchange markets became
less dependent on Bank Indonesia. As a result,
the volume of foreign exchange transactions
between banks and Bank Indonesia decreased.
Interbank foreign exchange rates approached
the lower limit of Bank Indonesia’s intervention
band, which reflected the strong confidence in
rupiah.
Fiscal
In line with efforts to manage domestic
demand, the Government continued to carry
out prudent fiscal policy. This is reflected in the
growing fiscal surplus (difference between fiscal
saving to government investment) from Rp3.5
trillion last year to Rp5.8 trillion in the reporting
year. The higher surplus was closely related to
government efforts to increase state revenue
from the non-oil/gas sector, especially by
intensifying tax collection and broadening the
tax base. Following this development, the ratio
of government finance operation surplus to the
GDP rose from 0.9% in the previous year to 1.3%
in the reporting year. Consequently,
contractionary monetary impacts of the
government sector reached Rp8.2 trillion or
3.53% of M2 in the reporting year, higher than
in the previous year.
In terms of macroeconomic impacts, real
government investment and consumption rose
faster than in the previous year. Nonetheless,
the growth was much lower compared with
growth in private-sector expenditure, causing
12
the contribution of government expenditure to
the GDP to decline.
Banking
In line with rising economic activity,
banking activity in 1995/96 grew rapidly.
Besides improving the performance of banking
businesses, the acceleration in banking
activities also posed new challenges. Excessive
credit growth, especially property and consumer
credit, has increased risk exposure faced by
banks. In turn, it was feared that this
development may negatively affect banking
development and contradict the objectives of
monetary policy. Other challenges emerged as
the financial globalization process intensified
competition and encouraged the development
of new financial products, such as commercial
papers and derivatives transactions. Although
derivatives transactions may provide hedging
opportunities on the one hand, it may also result
in substantial losses on the other hand. Stiffer
competition will also be faced by the banking
sector along with the inclusion of trade in
services in AFTA. These various developments
must be closely monitored in order to minimize
their negative effects on the banking sector.
In view of these developments, Bank
Indonesia has adopted banking policies aimed
at ensuring that banks continue to adopt
prudential principles in their activities. To
ensure that credit growth remained within the
limits of bank capacity, both in terms of its
administration and protection toward risk, Bank
Indonesia urged banks to plan their loans and
other investment consistent with bank
capacity and the objective of maintaining
macroeconomic stability. Furthermore, Bank
Indonesia also issued regulations on
investment in securities and derivatives
transactions to prevent excessive risk exposure
for banks conducting these activities. In view
of global competition, Bank Indonesia adopted
more stringent selection process for the
establishment of new banks, increased
minimum capital requirement of foreign
exchange banks, and encouraged banks to
merge and/or consolidate.
To further raise the effectiveness of bank
supervision, Bank Indonesia also evaluated the
interrelation between finance companies and
bank operations. In this respect, the Ministry
of Finance, in cooperation with Bank Indonesia,
started to conduct supervision on finance
companies. Furthermore, Bank Indonesia,
banks, and other related parties have
cooperated to resolve non-performing loans.
Efforts to solve problem banks have showed
significant progress. Nevertheless, Bank
Indonesia continues to work toward ensuring
that the resolution of problem banks may be
carried out comprehensively and will not disrupt
the soundness of the banking system. These
efforts were carried out in adherence to Article
37 of Banking Act No.7 of 1992, comprising
restructurization of capital, management
takeover, management assistance, as well as
providing the opportunity for merger and/or
entry of new investors.
In the reporting period, banking businesses
13
showed rapid growth as reflected in the
substantial increase of total bank assets. This
increase was primarily stimulated by the strong
growth of bank credit that originated primarily
from the rapid credit expansion of national
private commercial banks; increasing their
contribution toward credit expansion. Based on
the recipient sector, bank credit was primarily
absorbed by the manufacturing sector, followed
by the services and trade sectors. Meanwhile,
credit to small-scale enterprises (Kredit UsahaKecil/KUK) grew significantly by 19.3%, and was
also supported by efforts to increase its quality.
In 1995/96, credit collectibility and the
quality of banks’ earning assets improved.
Along with this development, the proportion
of bad debts dec l ined substant ia l ly
compared with the previous year. Banks
were also successful in improving the
efficiency of their business activities. The
average operating costs to operating income
ratio fell from 95.3% in 1994/95 to 92.2%
in 1995/96. This favorable development
caused banking business profitability to
rise steeply.
Bank compl iance wi th prudent ia l
pr inc ip les a lso showed encourag ing
developments. Improvements occurred in
the compliance with regulations on the loan
to deposit ratio (LDR), net open position
(NOP), and legal lending limit (LLL), as
reflected in the smaller number of banks
not comply ing wi th the regulat ions .
However, average CAR declined, in line with
rapid credit growth.
Prospects for 1996/97
In 1996/97, Indonesia’s economic
performance is projected to remain at high
level. Domestic demand is expected to continue
to be the source of high economic growth,
particularly in line with the implementation of
PMA and PMDN projects approved in previous
years. On the other hand, contribution from the
foreign sector may not be as strong as expected.
This is due to the continuing sluggishness of
several major industrial economies and other
trading partners of Indonesia although world
economic growth as a whole is expected to
improve. Following this development, world trade
volume will remain at high levels albeit
declining slightly. Given the situation,
expansion of Indonesia’s export growth will rely
more on raising production capacity and
improving competitiveness.
Pressures on the macroeconomic balance
will remain substantial due to the persistently
high domestic demand. In 1996/97, investment
activities are expected to continue rising as a
positive response to government policies which
have created a conducive business climate.
Furthermore, private consumption also tends
to rise as a result of the public’s growing
purchasing power. Although support from
domestic financial institutions is not expected
to be as strong as in the reporting period, capital
inflows are expected to be persistently strong,
to finance the accelerating domestic demand.
On the external front, non-oil/gas exports will
be confronted by various challenges, such as
the increasing number of new competitors and
14
allegations of dumping by major industrial
countries.
In view of these tendencies, the
Government will continue to give top priority
to preserve macroeconomic stability. As in
the preceding year, monetary policy will be
aimed at managing domestic demand in order
to reduce pressures on inflation and the
current account. Following these
developments, the indicative targets of broad
money supply (M2) and credit growth in 1996/
97, which are the references of monetary
operations, were set at around 17% and 16%
respectively. In addition, interest rate
differentials will be maintained at appropriate
levels to discourage speculative capital
inflows that may disrupt monetary
management. Similarly, domestic interest
rates in real terms are aimed at ensuring that
domestic demand will grow consistently with
efforts to reduce the current account deficit
and inflation. This policy is supported by an
increasingly f lexible managed f loating
exchange rate system in order to maintain
realistic exchange rate development, which
reflects market condition without being anti-
export. Moreover, in order to strengthen the
resilience of the economy to face foreign
exchange market turbulences, Bank
Indonesia will continue to on with central
banks in Asia.
In addition to monetary policy, the
Government also utilizes fiscal policy to manage
domestic demand. To that effect, the
Government will attempt to create significant
budget surplus. The Government will also
continue to extend deregulation and
debureaucratization measures in the real
sector in order to increase the efficiency and
competitiveness of the production sector.
Following these measures to manage
domestic demand, it is estimated that economic
growth in 1996 will be sustained between 7%
and 7.5%, consistent with the long-run path of
sustainable economic growth. It is expected that
the inflation rate will be lower in 1996/97 than
in the reporting year, while the ratio of current
account deficit to GDP is expected to increase.
The relatively high current account deficit is
primarily because of persistently high import,
in line with realization of foreign direct
investment and domestic investment. Non-oil/
gas exports are expected to recover as a result
of persistent efforts by the Government,
improved competitiveness, and expanded
domestic production capacity. Capital inflows
are expected to remain high, with a large portion
used to finance activities in the private sector.
This development suggests that the overall
balance of payments will remain stable and
foreign exchange reserves will continue to be
maintained at safe levels.
15
In the reporting year, relatively rapid growth
of broad money supply (M2) characterized
monetary development as a consequence of
bank credit expansion and strong capital
inflows. This development was stimulated by the
accelerating domestic demand which, in turn,
increased the demand for financing sources.
Rapid growth of monetary aggregates, coupled
with persistently high inflationary pressures
and stronger import growth tendency, will
complicate efforts to maintain macroeconomic
stability. Faced with this situation, Bank
Indonesia adopted prudent monetary policy to
manage domestic demand within sustainable
limits of domestic production capacity.
In line with these efforts, monetary policy
in 1995/96 was aimed at managing growth and
sources of M2 expansion, in particular bank
credits and capital inflows. In this respect, Bank
Indonesia maintained efforts to control money
supply through various monetary instruments,
particularly open market operations (OMO).
This was reflected in the higher interest rates
of Bank Indonesia Certificates (Sertifikat BankIndonesia/SBI) and money market securities
(surat berharga pasar uang/SBPU), from around
13.2% and 15.1% at the end of 1994/95
respectively, to 13.7% and 15.9% at the end of
1995/96. Moreover, in order to enhance the
effectiveness of monetary management, Bank
Indonesia amended the regulation on the
reserve requirement to statutory reserve
requirement by requiring commercial banks to
maintain 3% of their funds in the form of
demand deposit with Bank Indonesia (Box: New
Provisions on Reserve Requirement).1)
Furthermore, in order to ensure sound bank
credit expansion while simultaneously
strengthening banking prudence and reducing
excessive credit risks, Bank Indonesia through
the use of moral suasion, has urged banks to
be more cautious in extending credit. In line
with this effort, Bank Indonesia also introduced
policies which require foreign exchange banks
to increase their capital adequacy ratio (CAR)
in phases up to 12% within six years from
September 1995.2) Besides aiming at increasing
the competitiveness of national banks, this
policy is also directed toward enhancing bank
prudence in expanding their businesses,
especially in lending activities.
Monetary situation tended to be tight as a
result of strong demand for liquidity to finance
investment activities which, in turn, has
stimulated capital inflows. This tendency
became stronger as interest rate differentials
between domestic and international rates
widened. It is noteworthy that interest rate
differentials widened because of lower
international interest rates as a result of easier
2. MONETARY DEVELOPMENTS
1 ) - Decree of the Board of Managing Directors of BankIndonesia No. 28/113/KEP/DIR, dated December 14, 1995.- Circular Letter of Bank Indonesia No. 28/10/UPPB, datedDecember 14, 1995.
2) Decree of the Board of Managing Directors of BankIndonesia No. 28/64/KEP/DIR dated September 7, 1995.- Circular Letter of Bank Indonesia No. 28/4/UPPB,dated September 7, 1995.
16
monetary policies in several major industrial
countries. In response to this situation, Bank
Indonesia took measures to reduce leakages
from capital inflows, while simultaneously
enhancing the effectiveness of monetary
management.
In order to discourage speculative capital
inflows, in particular short-term capital, and to
dampen pressures on the rupiah exchange rate,
Bank Indonesia has attempted to raise the
flexibility of the rupiah exchange rate by further
widening the spread between the selling and
buying rates of, rupiah against the US dollar and
introduced an intervention band with a range of
Rp66.00. These steps were also meant to further
stimulate the development of the interbank
foreign exchange market in order to reduce the
reliance of banks on Bank Indonesia. Moreover,
in cooperation with the Ministry of Finance, Bank
Indonesia also supervised non-bank financial
institutions, particularly finance companies, in
line with the increasing role of these institutions
as alternative fund sources.3) It may be noted that
in maintaining monetary stability, particularly
to fend off speculative attacks on foreign
exchange, Bank Indonesia has conducted
bilateral cooperation with the monetary
authorities of Malaysia, Singapore, Thailand,
Hong Kong, Australia, and the Philippines
through securities repurchase agreement. This
cooperation also includes information exchanges
and cooperation in monetary and exchange rate
management.
As a result of these various policy measures,
monetary situation in 1995/96 remained rela-
tively under control. Annual growth of money
supply (M1) since mid-1995 has slowed gradually.
Moreover, growth of claims on the business sector,
including credit and other claims, also began to slow
down until the end of the reporting year, resulting
in lower growth compared with the previous year.
3) Joint Decree of the Minister of Finance and Governor ofBank Indonesia No. 607/KMK.017/1995 and No. 28/9/Kep/GBI, dated December 19, 1995.
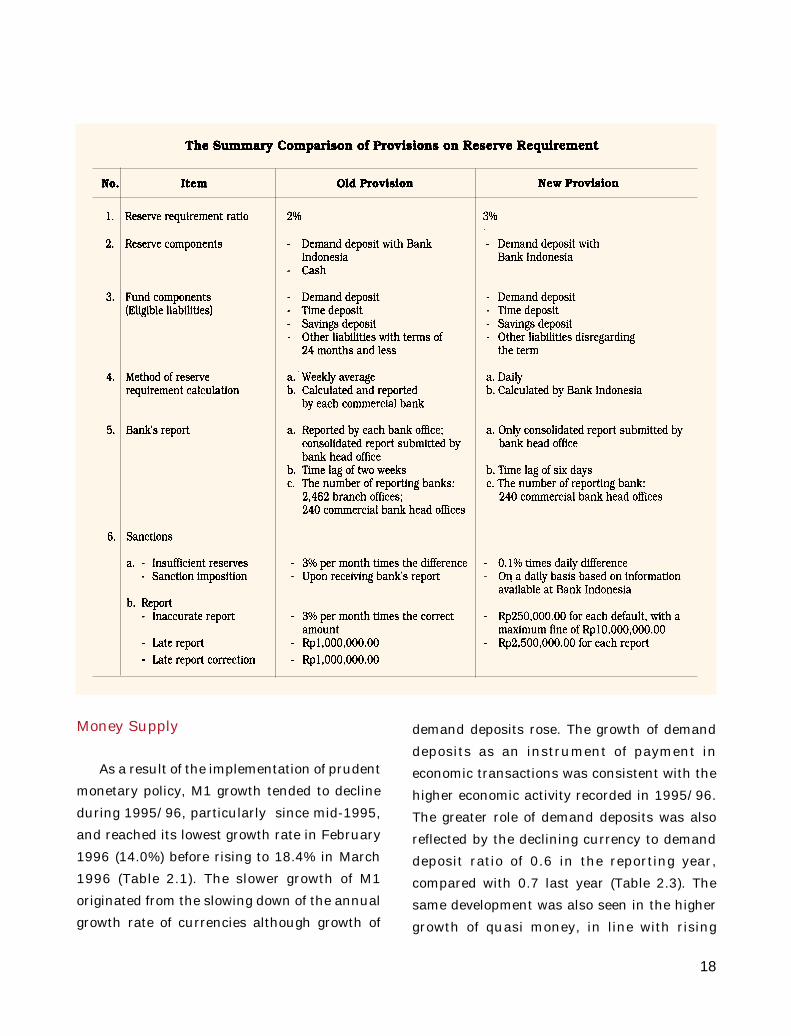
Reserve requirement is a monetary
instrument which requires banks to keep their
reserves in the form of demand deposit with the
central bank and/or cash in vault on a certain
percentage of bank’s funds. In Indonesia the
reserve requirement as a monetary instrument
is rarely used, as reflected in the infrequent
change of reserve requirement ratio.
Since its implementation, the rupiah re-
serve requirement ratio has only changed three
times -- in 1977, 1988, and 1995 --while foreign
exchange reserve ratio has been adjusted four
times, in 1974, 1977, 1988, and 1995.
Based on the provisions issued in 1988, banks
were required to keep 2% of their funds,
NEW PROVISIONS ON RESERVE REQUIREMENT
17
consisting of demand deposit, time deposit,
savings deposit, and other liabilities as required
reserves. The provisions covered both rupiah and
foreign exchange funds separately. To fulfill the
requirement, banks may keep the reserves in
cash on hand and/or demand deposits with Bank
Indonesia.
As the 1988 reserve requirement was
considered relatively low and had been used for
some time, it was no longer optimal in supporting
the management of monetary aggregates. It is
understood that minimum reserves is a
monetary control instrument which can be
applied to curb the growth of money supply (M2),
particularly bank credit. In this regard, to support
monetary stability and enhance the prudent
principles of bank lending, in December 1995,
the reserve requirement was raised to 3% of
bank’s funds and should be placed in Bank
Indonesia as statutory reserves. Under the new
provisions, bank reserves other than statutory
reserves are not regulated (Table: The
Summary Comparison of Provisions on Reserve
Requirement).
The new regulation also covers some
technical improvement to enable timely and
accurate calculation of statutory reserves with
simpler procedures and less administrative cost.
The improvement covers:
a. The statutory reserves is calculated on a daily
basis, while previously it was based on a weekly
average.
b. The calculation is done by Bank Indonesia;
consequently, banks are not required to report
their own calculation.
c. The bank fund position is only reported by the
bank head office using an on-line system,
containing consolidated reports from all its
branch offices.
d. To obtain the data promptly, banks are required
to submit the report within six days from the
last reporting date. Previously, bank branch
offices were required to submit the report
within two weeks.
e. The reporting form is simplified.
In the short run, the implementation of 3%
statutory reserve requirement will raise bank
reserves in Bank Indonesia. The increase, on
the one hand, will drive up the amount of reserve
money (M0) as bank demand deposits with Bank
Indonesia are counted as components of reserve
money. On the other hand, higher reserve
requirement will dampen the ability of banks to
expand their business, particularly in extending
credits. In addition, another impact of the new
reserve requirements is lower money multiplier
which, in turn, could slow down the growth of
money supply.
A month after the implementation of the new
reserve requirement, in February 1996, the M0
rose Rp4,864 billion to Rp29,893 billion.
Meanwhile, MM1 (money multiplier of M1)
decreased from an average of 2.02 in 1995 to 1.81.
Similarly, MM2 (money multiplier of M2) also
declined, to 7.63, from an average of 8.31 in 1995.
With this development, the growth rate of M1 and
M2 in the future are expected to decrease
gradually, hence monetary control, particularly
through bank credit, will be more effective.
18
Money Supply
As a result of the implementation of prudent
monetary policy, M1 growth tended to decline
during 1995/96, particularly since mid-1995,
and reached its lowest growth rate in February
1996 (14.0%) before rising to 18.4% in March
1996 (Table 2.1). The slower growth of M1
originated from the slowing down of the annual
growth rate of currencies although growth of
demand deposits rose. The growth of demand
deposits as an instrument of payment in
economic transactions was consistent with the
higher economic activity recorded in 1995/96.
The greater role of demand deposits was also
reflected by the declining currency to demand
deposit ratio of 0.6 in the reporting year,
compared with 0.7 last year (Table 2.3). The
same development was also seen in the higher
growth of quasi money, in line with rising
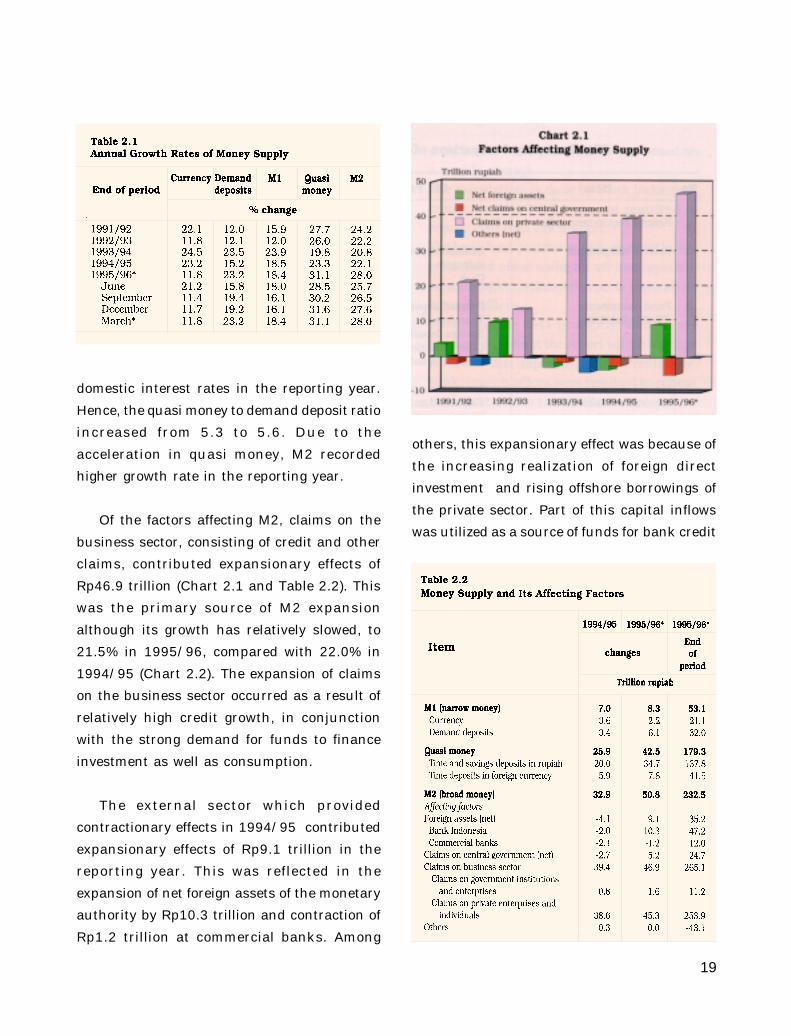
19
domestic interest rates in the reporting year.
Hence, the quasi money to demand deposit ratio
increased from 5.3 to 5.6. Due to the
acceleration in quasi money, M2 recorded
higher growth rate in the reporting year.
Of the factors affecting M2, claims on the
business sector, consisting of credit and other
claims, contributed expansionary effects of
Rp46.9 trillion (Chart 2.1 and Table 2.2). This
was the primary source of M2 expansion
although its growth has relatively slowed, to
21.5% in 1995/96, compared with 22.0% in
1994/95 (Chart 2.2). The expansion of claims
on the business sector occurred as a result of
relatively high credit growth, in conjunction
with the strong demand for funds to finance
investment as well as consumption.
The external sector which provided
contractionary effects in 1994/95 contributed
expansionary effects of Rp9.1 trillion in the
reporting year. This was reflected in the
expansion of net foreign assets of the monetary
authority by Rp10.3 trillion and contraction of
Rp1.2 trillion at commercial banks. Among
others, this expansionary effect was because of
the increasing realization of foreign direct
investment and rising offshore borrowings of
the private sector. Part of this capital inflows
was utilized as a source of funds for bank credit
20
and the balance was utilized as a financing
source for domestic businesses, such as
commercial papers and shares sold
tenon-residents. It may be noted that the high
capital inflows was also influenced by the
widening of interest rate differentials in 1995/
96, besides being stimulated by the relatively
bullish domestic capital market.
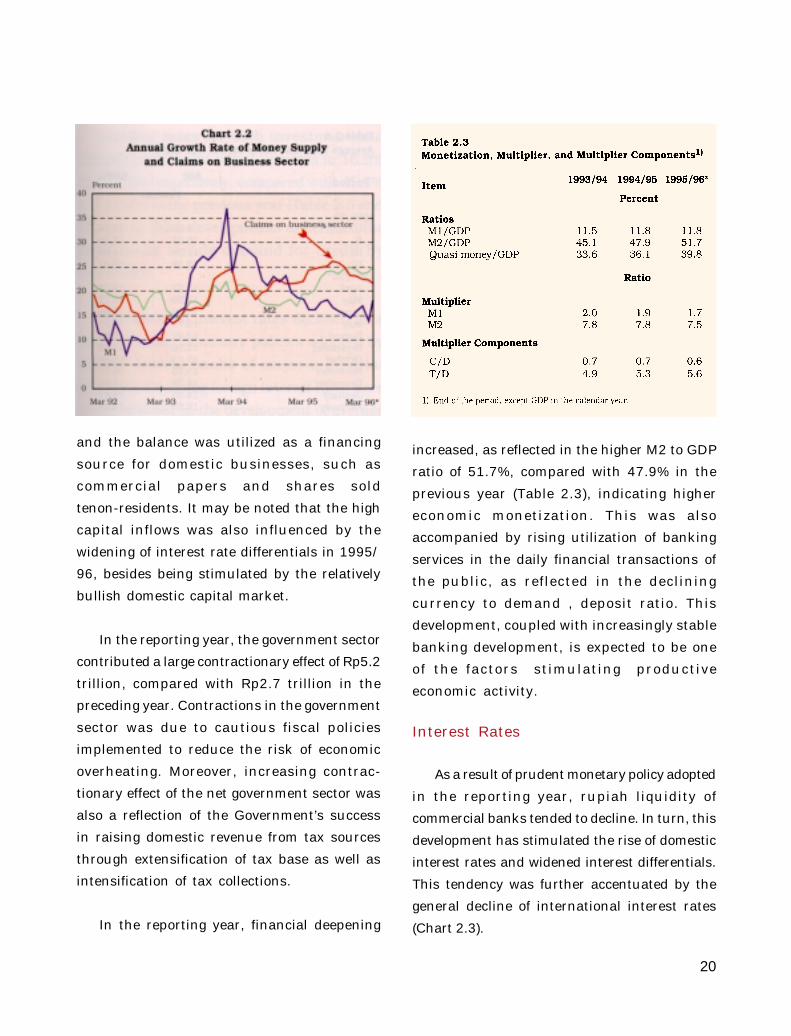
In the reporting year, the government sector
contributed a large contractionary effect of Rp5.2
trillion, compared with Rp2.7 trillion in the
preceding year. Contractions in the government
sector was due to cautious fiscal policies
implemented to reduce the risk of economic
overheating. Moreover, increasing contrac-
tionary effect of the net government sector was
also a reflection of the Government’s success
in raising domestic revenue from tax sources
through extensification of tax base as well as
intensification of tax collections.
In the reporting year, financial deepening
increased, as reflected in the higher M2 to GDP
ratio of 51.7%, compared with 47.9% in the
previous year (Table 2.3), indicating higher
economic monetization. This was also
accompanied by rising utilization of banking
services in the daily financial transactions of
the public, as reflected in the declining
currency to demand , deposit ratio. This
development, coupled with increasingly stable
banking development, is expected to be one
of the factors stimulating productive
economic activity.
Interest Rates
As a result of prudent monetary policy adopted
in the reporting year, rupiah liquidity of
commercial banks tended to decline. In turn, this
development has stimulated the rise of domestic
interest rates and widened interest differentials.
This tendency was further accentuated by the
general decline of international interest rates
(Chart 2.3).
21
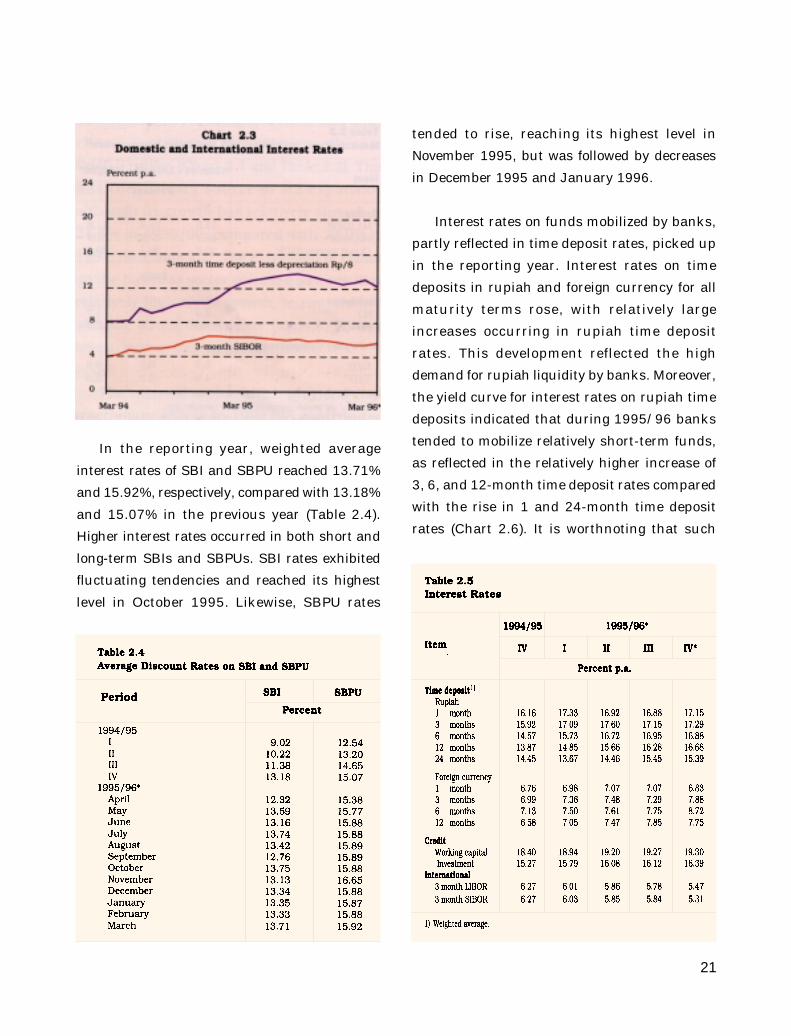
In the reporting year, weighted average
interest rates of SBI and SBPU reached 13.71%
and 15.92%, respectively, compared with 13.18%
and 15.07% in the previous year (Table 2.4).
Higher interest rates occurred in both short and
long-term SBIs and SBPUs. SBI rates exhibited
fluctuating tendencies and reached its highest
level in October 1995. Likewise, SBPU rates
tended to rise, reaching its highest level in
November 1995, but was followed by decreases
in December 1995 and January 1996.
Interest rates on funds mobilized by banks,
partly reflected in time deposit rates, picked up
in the reporting year. Interest rates on time
deposits in rupiah and foreign currency for all
maturity terms rose, with relatively large
increases occurring in rupiah time deposit
rates. This development reflected the high
demand for rupiah liquidity by banks. Moreover,
the yield curve for interest rates on rupiah time
deposits indicated that during 1995/96 banks
tended to mobilize relatively short-term funds,
as reflected in the relatively higher increase of
3, 6, and 12-month time deposit rates compared
with the rise in 1 and 24-month time deposit
rates (Chart 2.6). It is worthnoting that such
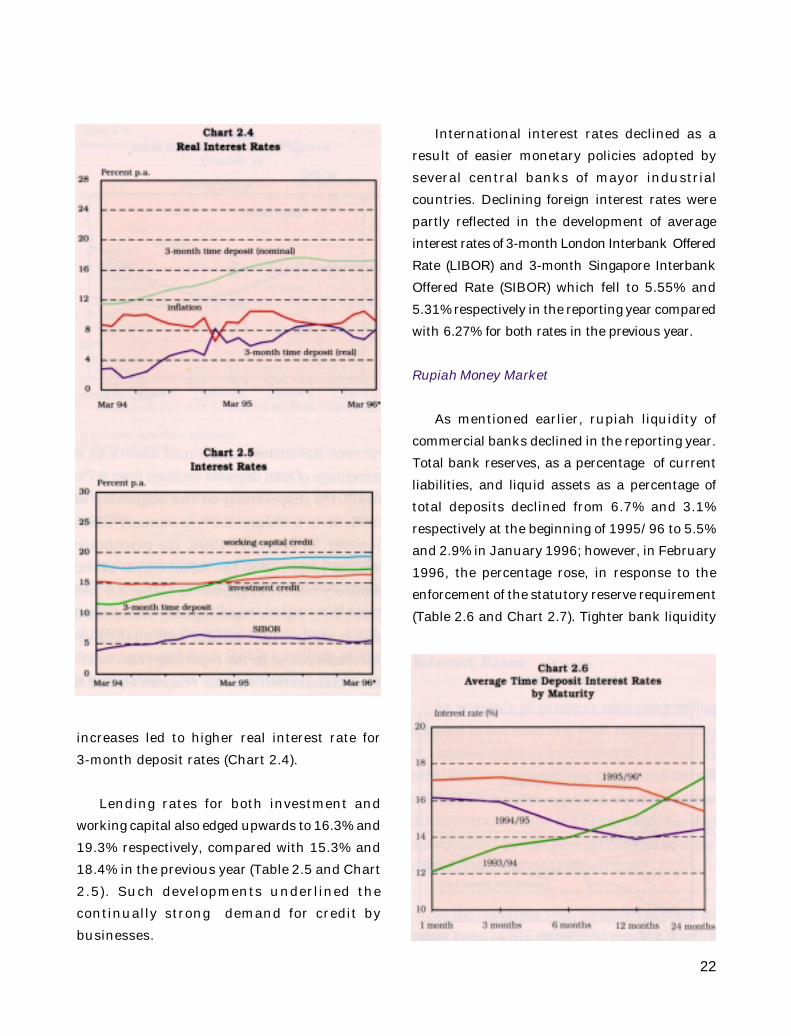
22
increases led to higher real interest rate for
3-month deposit rates (Chart 2.4).
Lending rates for both investment and
working capital also edged upwards to 16.3% and
19.3% respectively, compared with 15.3% and
18.4% in the previous year (Table 2.5 and Chart
2.5). Such developments underlined the
continually strong demand for credit by
businesses.
International interest rates declined as a
result of easier monetary policies adopted by
several central banks of mayor industrial
countries. Declining foreign interest rates were
partly reflected in the development of average
interest rates of 3-month London Interbank Offered
Rate (LIBOR) and 3-month Singapore Interbank
Offered Rate (SIBOR) which fell to 5.55% and
5.31% respectively in the reporting year compared
with 6.27% for both rates in the previous year.
Rupiah Money Market
As mentioned earlier, rupiah liquidity of
commercial banks declined in the reporting year.
Total bank reserves, as a percentage of current
liabilities, and liquid assets as a percentage of
total deposits declined from 6.7% and 3.1%
respectively at the beginning of 1995/96 to 5.5%
and 2.9% in January 1996; however, in February
1996, the percentage rose, in response to the
enforcement of the statutory reserve requirement
(Table 2.6 and Chart 2.7). Tighter bank liquidity
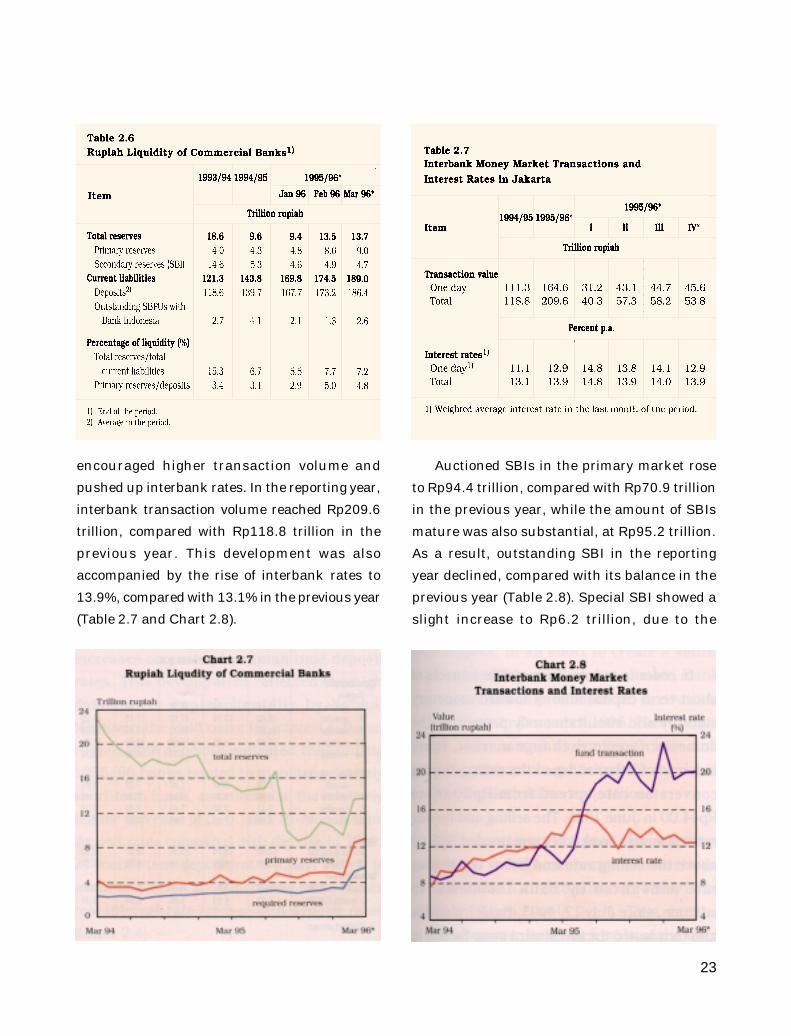
23
encouraged higher transaction volume and
pushed up interbank rates. In the reporting year,
interbank transaction volume reached Rp209.6
trillion, compared with Rp118.8 trillion in the
previous year. This development was also
accompanied by the rise of interbank rates to
13.9%, compared with 13.1% in the previous year
(Table 2.7 and Chart 2.8).
Auctioned SBIs in the primary market rose
to Rp94.4 trillion, compared with Rp70.9 trillion
in the previous year, while the amount of SBIs
mature was also substantial, at Rp95.2 trillion.
As a result, outstanding SBI in the reporting
year declined, compared with its balance in the
previous year (Table 2.8). Special SBI showed a
slight increase to Rp6.2 trillion, due to the
24
capitalization of SBI interest payment the form
of new special SBIs.
In contrast to SBIs auctioned in the primary
market, transaction of SBIs in the secondary
market was apparently less buoyant despite the
rise in SBI rates. In the reporting year, the value
of SBI transactions in the secondary market
declined substantially, to Rp3.2 trillion from
Rp11.4 trillion in the previous year (Table 2.9).
This development indicated rising bank
requirement for rupiah liquidity.
In conjunction with tighter bank liquidity,
SBPU tended to become one of the sources of
rupiah liquidity as reflected in the rapid sales of
SBPU in the reporting year to Rp81.1 trillion,
compared with Rp43.1 trillion in the previous
year. This development has driven the SBPU
rates up; hence, banks tended to utilize SBPUs
only to meet short-term rupiah liquidity
requirement. This was reflected in the increase
of SBPU repayment, at Rp82.4 trillion compared
with Rp41.9 trillion in the preceding year.
On the whole, OMO transactions in the
reporting year brought about contractionary
impact of Rp0.5 trillion compared with
expansions of Rp10.4 trillion last year.
Certificates of deposit (CDs) also experienced
remarkable growth as an increasingly attractive
investment alternative. This may be seen in the
substantial increase in the issuance of CDs, from
Rp7.0 trillion to Rp10.6 trillion (Table 2.10).
25
Foreign Exchange Market
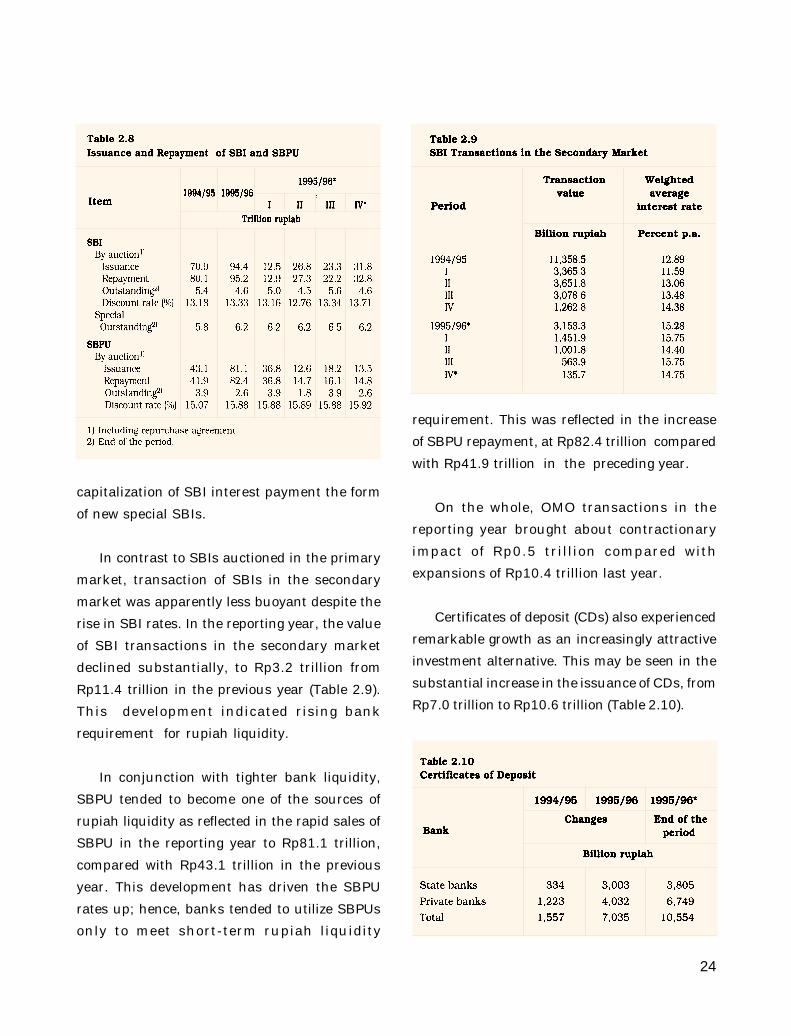
In 1995/96, the domestic foreign exchange
market was characterized by significant capital
inflows. The inflows was associated with PMA
purposes and bullish domestic capital market,
besides being stimulated by the widening of
interest rate differentials. As a consequence,
interbank exchange rates moved toward the
lower limit of Bank Indonesia’s intervention
band (Chart 2.9). Tight rupiah liquidity has
encouraged banks to sell part of their foreign
currencies to Bank Indonesia which, in turn,
resulted in expansionary impacts on the money
supply.
In order to reduce the negative impacts of
short-term capital inflows toward monetary
stability and simultaneously promoting the
domestic foreign exchange market, Bank
Indonesia further widened the selling-buying
conversion rate spread from Rp30.00 to Rp44.00
in June 1995. The selling and buying rates of
foreign bank notes remained at Rp5.00 above
the selling rate and below the buying rate
announced by Bank Indonesia. In addition,
since duly 17, 1995, Bank Indonesia also
terminated the investment swap facility in an
effort to reduce banks’ dependence on Bank
Indonesia. Nonetheless, Bank Indonesia may
still carry out swap transactions with banks at
Bank Indonesia’s discretion. Furthermore,
since January 1996, Bank Indonesia has also
introduced an intervention band with the
difference between the upper and lower limit
at Rp66.00 (Box: New Exchange Rate Provisions,
December 29, 1995).
Domestic foreign exchange market was also
marked by buoyant derivatives transactions by
banks and other market participants. In part,
derivatives transactions could be used to hedge
against assets as well as liability risks,
particularly risks associated with changes in
exchange rates and interest rates,
profit-motivated speculations, and funding
purposes. Use of derivatives transactions for
26
these purposes may be beneficial on the one
hand but, on the other hand, it may also result
in substantial loss potentials for banks as well
as other market participants. In this respect,
in an effort to create a sound banking and
financial market climate, Bank Indonesia
issued provisions on derivatives transactions
in December 1995. These provisions were
aimed at limiting risks and providing minimum
guidelines for banks in conducting derivatives
transactions.
During the reporting year, the volume of
interbank foreign exchange transactions
declined from $1,049.8 billion in 1994/95 to
$893.2 billion (Table 2.11). This decline occurred
particularly since early of the third quarter of
1995/96 and was closely related to the high
demand by banks for rupiah liquidity.
Nonetheless, foreign exchange transactions
throughout 1995 showed an increase of $123.6
billion, from $937.7 billion in 1994 to $1,061.3
billion in 1995. At the same time, the number of
participants in the domestic foreign exchange
market which comprised foreign exchange banks
grew by 18 to 130 banks.
Bank Indonesia’s foreign exchange
transactions with banks in the reporting year
showed an overbought of $5.3 billion.
Contributing to the overbought situation were
spot transactions amounting to $4.5 billion,
export draft of $0.7 billion, and swap transactions
of $9.8 million. In the preceding year, in
contrast, Bank Indonesia experienced an
oversold situation amounting to $0.6 billion.
In the past few years domestic money market
was marked by rapid growth of foreign capital
inflows, owing largely to a rise in the
investment activity of international fund
managers. Factors behind the increasing
investment activity were, among others, the
more attractive interest rate differentials,
rapid growth of the capital market, and
favorable economic growth. Capital inflows,
especially short-term capital for speculative
purposes, have exerted pressures on
monetary stability and the domestic foreign
exchange market.
In an effort to dampen negative impacts
of short-term capital inflows, especially for
speculative activity in the domestic foreign
exchange market, since 1992, Bank
Indonesia has introduced new exchange rate
provisions by widening the rupiah to US dollar
spread. In addition to dampening short-term
capital inflows, the policy is also intended to
foster the development of the domestic
foreign exchange market. To that end, Bank
Indonesia has widened the rupiah exchange
rate band four times, namely in September
16, 1992 from Rp6.00 to Rp10.00; in January
NEW EXCHANGE RATE PROVISIONS DECEMBER 29, 1995
27
3,1994 from Rp10.00 to Rp20.00; in September
5,1994 from Rp20.00 to Rp30.00; and in June
30, 1995 from Rp30.00 to Rp44.00.
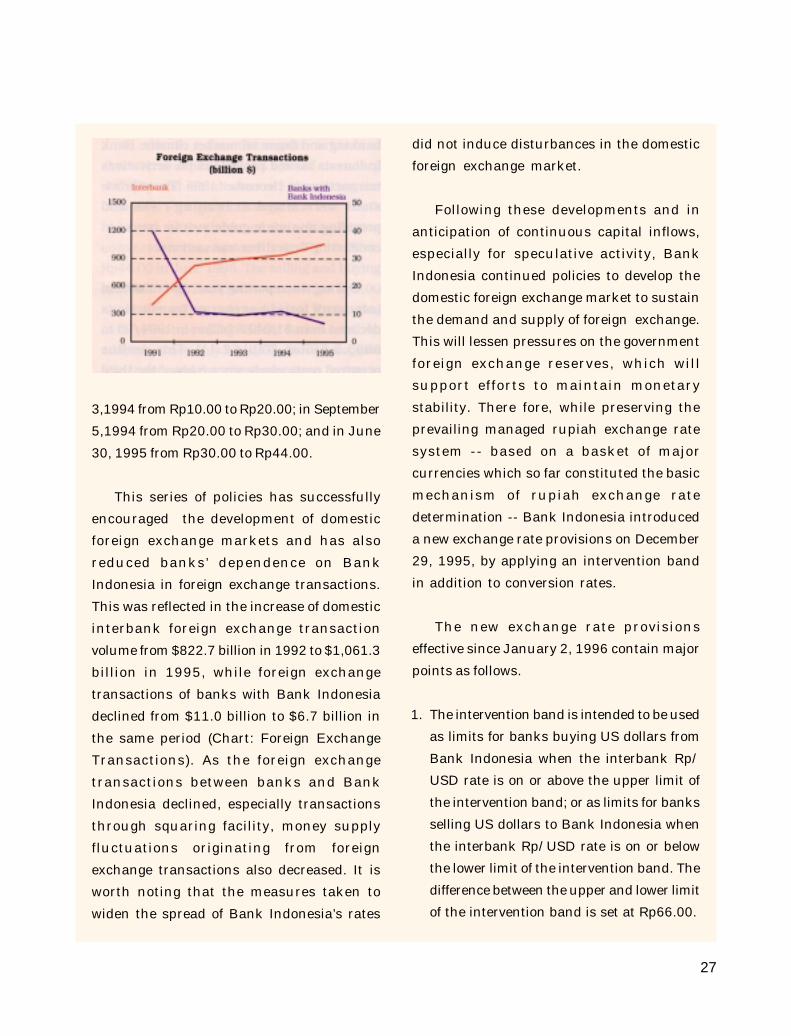
This series of policies has successfully
encouraged the development of domestic
foreign exchange markets and has also
reduced banks’ dependence on Bank
Indonesia in foreign exchange transactions.
This was reflected in the increase of domestic
interbank foreign exchange transaction
volume from $822.7 billion in 1992 to $1,061.3
billion in 1995, while foreign exchange
transactions of banks with Bank Indonesia
declined from $11.0 billion to $6.7 billion in
the same period (Chart: Foreign Exchange
Transactions). As the foreign exchange
transactions between banks and Bank
Indonesia declined, especially transactions
through squaring facility, money supply
fluctuations originating from foreign
exchange transactions also decreased. It is
worth noting that the measures taken to
widen the spread of Bank Indonesia’s rates
did not induce disturbances in the domestic
foreign exchange market.
Following these developments and in
anticipation of continuous capital inflows,
especially for speculative activity, Bank
Indonesia continued policies to develop the
domestic foreign exchange market to sustain
the demand and supply of foreign exchange.
This will lessen pressures on the government
foreign exchange reserves, which will
support efforts to maintain monetary
stability. There fore, while preserving the
prevailing managed rupiah exchange rate
system -- based on a basket of major
currencies which so far constituted the basic
mechanism of rupiah exchange rate
determination -- Bank Indonesia introduced
a new exchange rate provisions on December
29, 1995, by applying an intervention band
in addition to conversion rates.
The new exchange rate provisions
effective since January 2, 1996 contain major
points as follows.
1. The intervention band is intended to be used
as limits for banks buying US dollars from
Bank Indonesia when the interbank Rp/
USD rate is on or above the upper limit of
the intervention band; or as limits for banks
selling US dollars to Bank Indonesia when
the interbank Rp/USD rate is on or below
the lower limit of the intervention band. The
difference between the upper and lower limit
of the intervention band is set at Rp66.00.
28
2. Speard of rupiah/US dollar conversion rate
is maintained at Rp44.00. Basically, the
determination of the conversion rate
follows the interbank mid-rate (market
mid-rate) as a reference, except when the
conversion rates go beyond the
intervention band. Conversion rates for
foreign bank notes and currencies other
than US dollars remain the same.
3. Bank Indonesia announces the
intervention band along with the
conversion rates daily, which will be
effective until the next announcement.
4. Conversion rates are applied to
transactions with the Government,
supranational institutions in the
framework of government borrowing,
transfer of export draft, and setting balance
sheet rate.
5. The prevailing transaction time between
Bank Indonesia and banks remained
between 3.00 to 4.00 pm, Western
Indonesian Time every working day;
preceded by an announcement of the
intervention band and conversion rates. The
time for transaction with the Government,
supranational institutions, and transfer of
export draft remains the same.
29
In a market-based economy, payment is an
important element in the transaction of goods
and services. In many countries, the
importance of a safe, efficient, and stable
payment system was only recently realized.
Until mid-1980s, only a few central banks -- as
monetary authorities or banks -- analyzed in
depth the relations between the payment
system and responsibilities in the monetary
and banking area. The lack of attention to the
payment system at that time was primarily
because of the reliance of economic transaction
settlements on paper-based instruments.1)
These paper-based instruments, despite
lengthy settlement process, do not incur much
systemic risks on the financial system in the
economy. For instance, delays in the
settlement process or the loss of several checks
will not immediately result in disruptions or
cause all economic activities to come to a stand
still. Consequently, central banks were not
overly concerned regarding problems in the
payment system.
This has changed with the emergence of
various new developments in the payment
system. The evolution of the payment system
toward an electronic system, with greater
capacity to process the amount as well as value
of transactions and in additional to domestic and
international network linkages, has raised the
concerns of many central banks due to its risks.
Some examples of the risks are the failure of
Bankhaus Herstatt in Germany (1974) to settle
international foreign exchange transactions
(now known as Herstatt risk), the computer
breakdown at the Bank of New York (1985) which
threatened the continuity of the payment
system in New York before it was rescued by
the Federal Reserve of New York with a $23
billion credit, and various problems in the area
of payment system which have implications on
the implementation of monetary policies and
supervision of bank. Recent development
suggests that the issue of the payment system
lies not only on clearing aspects but also that it
is now a part of the trilogy of central banks
responsibilities, i.e., monetary policy,
establishment and supervision of banks, and
the payment system.2)
Definition of the Payment System
Basically, the payment system is related to
the submission or transfer of an amount of
money from the payer to the recipient. Payment
settlements may be carried out directly between
two related parties or indirectly through an
intermediary, for instance, banks. An example
of a simple process may be seen in Figure 1.
SUPPLEMENT
NATIONAL PAYMENT SYSTEM
1) Sheng. Andrew. Payment Systems in Developing Countries,Lessons for a Small Economy. (Occasional Paper No. 19/1994). Kuala Lumpur: SEACEN Research and TrainingCentre, 1994. p. 2.
2) Corrigan, E. Gerald. The Trilogy of Central Banking in aContemporary Setting. New York Federal Reserve Bank ofNew York, 1992.
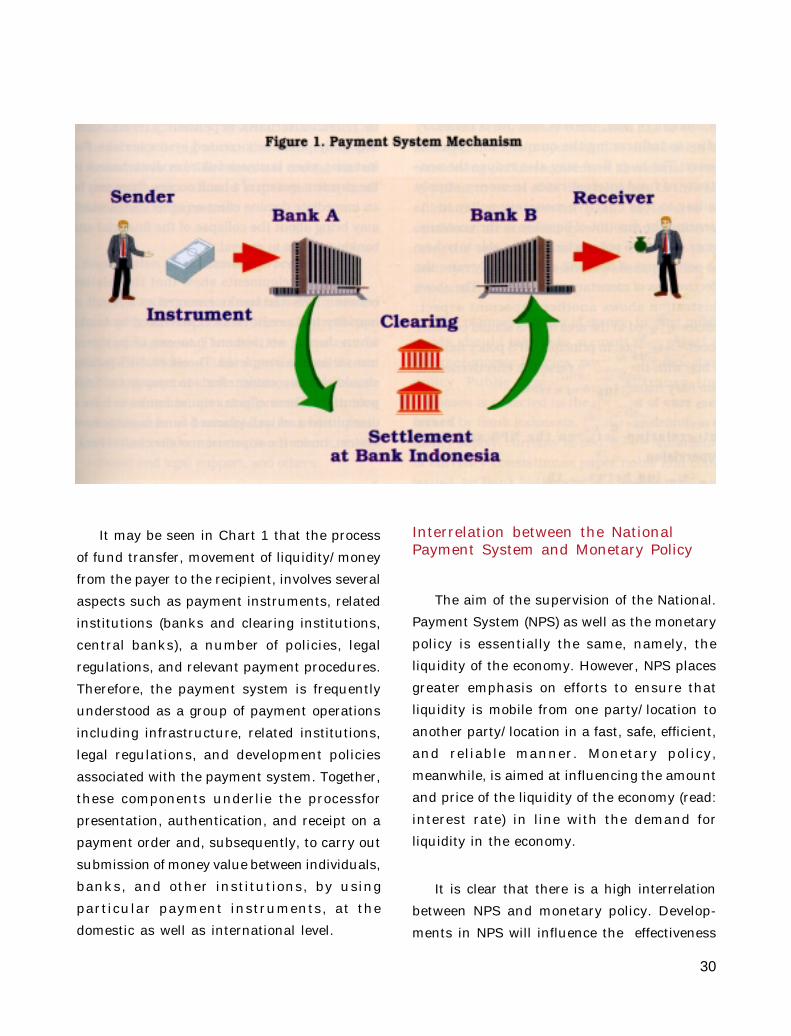
30
It may be seen in Chart 1 that the process
of fund transfer, movement of liquidity/money
from the payer to the recipient, involves several
aspects such as payment instruments, related
institutions (banks and clearing institutions,
central banks), a number of policies, legal
regulations, and relevant payment procedures.
Therefore, the payment system is frequently
understood as a group of payment operations
including infrastructure, related institutions,
legal regulations, and development policies
associated with the payment system. Together,
these components underlie the processfor
presentation, authentication, and receipt on a
payment order and, subsequently, to carry out
submission of money value between individuals,
banks, and other institutions, by using
particular payment instruments, at the
domestic as well as international level.
Interrelation between the NationalPayment System and Monetary Policy
The aim of the supervision of the National.
Payment System (NPS) as well as the monetary
policy is essentially the same, namely, the
liquidity of the economy. However, NPS places
greater emphasis on efforts to ensure that
liquidity is mobile from one party/location to
another party/location in a fast, safe, efficient,
and reliable manner. Monetary policy,
meanwhile, is aimed at influencing the amount
and price of the liquidity of the economy (read:
interest rate) in line with the demand for
liquidity in the economy.
It is clear that there is a high interrelation
between NPS and monetary policy. Develop-
ments in NPS will influence the effectiveness
31
of monetary policy and vice versa. As an
illustration, an inefficient payment system with
slow fund transfer will create an amount of floating
liquidity. This float occurred because funds have
not been effectively received by the relevant party
although the paying party has paid, owing to
delayed final settlement. This means that the
funds are not fully utilized and, in turn, create
inefficiencies in fund management as a whole
at the macrolevel. The larger the amount of float,
the less effective is monetary policy in influencing
the quantity and price of money. The huge float
may also reduce the sensitivity of fund interest
rates to money supply leading to less effective
monetary policy in influencing the amount of
liquidity in the economy. Hence, each NPS policy
which will be able to reduce the occurrence of
float will automatically raise the effectiveness of
monetary management. The above illustration
shows another important aspect; policies adopted
in the area of NPS should consider monetary
aspects. In principle, NPS policy must be in line
with the need to raise the effectiveness of
monetary management operation.
Interrelation between the NPS andBank Supervision
In a modern economy with a high level of
monetization is normally characterized by
increasing role of the banking sector in
providing payment services to all economic
activity. Various fund payments, using paper,
non-paper, or electronic media, will be carried
out through the banking system. Therefore, the
development of NPS will automatically
encourage the development of banking
businesses, particularly in increasing
activities which will produce fee-based
income, besides increasing the capability of
banks in mobilizing and managing funds more
efficiently.
In recent years, the volume of payment
undertaken through banks has reached a large
amount both in terms of the number of
transactions and values. Funds transfer may
be conducted in real time through the
electronic media, 24 hours internationally. The
rapid developrhent of communication and
information technology, the effect of globalized
trading and financial activities, and the
interrelation of financial transaction networks
between financial institutions, particularly
banks, have further increased interbank
dependency levels. Consequently, this has
increased systemic risks. For instance, when
business failure or disturbances in the payment
system of a bank occurs, there may be an
immediate domino effect on other banks which
may bring about the collapse of the financial
and banking system in general.
These developments show that the relation
between NPS and banks emerged as a result of
liquidity and credit risks experienced by banks
when during settlement process of payment
transactions is completed. Therefore, NPS
policies should always consider efforts to
manage such risk potentials. These efforts
require banks to have a disciplined and
well-planned fund management system, under
the supervision of the central bank.
32
Role of the Central Bank in SupervisingNPS
The supervision of NPS by the central bank
comprises both cash and non-cash payments.
Supervision in the case of cash payments is
well understood but it Is not so for non-cash
payments. Supervision of the latter differs
among countries. In this regard, there are two
forms of supervision which may be carried out
by a central bank:
a. Supervision of final settlements
In principle, each party which is involved in
payment wishes not only for a fast, safe, and
reliable payment but also for a final settlement.
The settlement will only be final if there is an
institution which guarantees the payment.
The institution which is able to do this is the
central bank which holds the unique position
as the bankers’ bank. The assurance of
payment settlement is associated with the
central bank’s interest in minimizing the
highest payment system risk, namely,
systemic risks which, in turn, may bring about
the collapse of the financial system. Therefore,
it is crucial that all central banks should
supervise the final settlement of payments.
b. Supervision of settlement procedures
It is also to the interest of central banks to
ensure a smooth and safe final settlement with
effective risk management. Therefore, the
role of central banks in NPS also entails
supervision on the use of various payment
instruments, standardization of instruments,
clearing process including clearing time and
administrative institutions, standard
telecommunication network, institutional and
legal support, and others.
Current Payment System in Indonesia
1. Payment Instruments
There are three methods of payment
currently used in Indonesia, namely, cash
payment, paperbased payments, and non-
paper-based payment. Each of these payment
methods in itself utilizes varied payment
instruments.
a. Cash payments
The printing and circulating of money is one
of the functions of the payment system. In this
respect, Bank Indonesia has exclusive rights to
issue and circulate rupiah notes and coins
pursuant to article 26 of Act No. 13 of 1968.
Therefore, Bank Indonesia has to provide a
sufficient amount of currency to meet the public
demand by taking into account public preference
for currency denomination, time and place of
issuance, and quality of notes and coins.
To that end, money citculation has to be well
managed from its procurement to distribution
by considering public requirement in nominal
terms as well as in terms of its denomination.
In the case of money procurement plan, factors
to be considered are economic growth, inflation,
interest rate, the amount of low quality currency
to be destroyed, and a safe currency stock
position for the central bank.
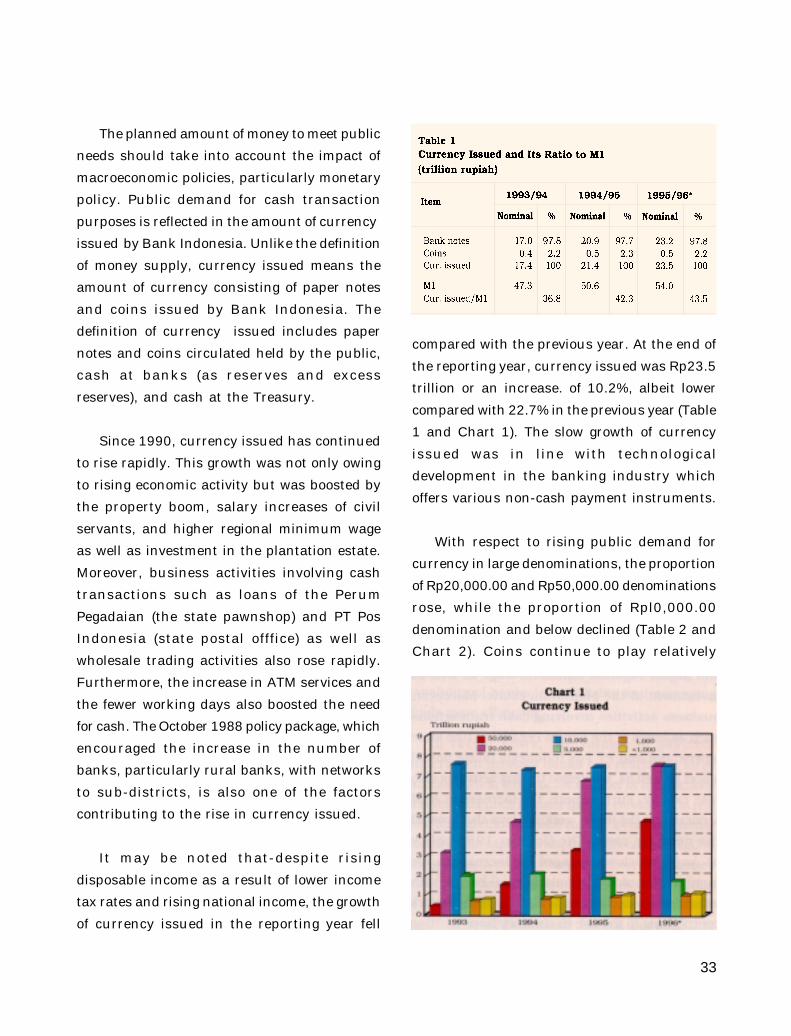
33
The planned amount of money to meet public
needs should take into account the impact of
macroeconomic policies, particularly monetary
policy. Public demand for cash transaction
purposes is reflected in the amount of currency
issued by Bank Indonesia. Unlike the definition
of money supply, currency issued means the
amount of currency consisting of paper notes
and coins issued by Bank Indonesia. The
definition of currency issued includes paper
notes and coins circulated held by the public,
cash at banks (as reserves and excess
reserves), and cash at the Treasury.
Since 1990, currency issued has continued
to rise rapidly. This growth was not only owing
to rising economic activity but was boosted by
the property boom, salary increases of civil
servants, and higher regional minimum wage
as well as investment in the plantation estate.
Moreover, business activities involving cash
transactions such as loans of the Perum
Pegadaian (the state pawnshop) and PT Pos
Indonesia (state postal offfice) as well as
wholesale trading activities also rose rapidly.
Furthermore, the increase in ATM services and
the fewer working days also boosted the need
for cash. The October 1988 policy package, which
encouraged the increase in the number of
banks, particularly rural banks, with networks
to sub-districts, is also one of the factors
contributing to the rise in currency issued.
It may be noted that-despite rising
disposable income as a result of lower income
tax rates and rising national income, the growth
of currency issued in the reporting year fell
compared with the previous year. At the end of
the reporting year, currency issued was Rp23.5
trillion or an increase. of 10.2%, albeit lower
compared with 22.7% in the previous year (Table
1 and Chart 1). The slow growth of currency
issued was in line with technological
development in the banking industry which
offers various non-cash payment instruments.
With respect to rising public demand for
currency in large denominations, the proportion
of Rp20,000.00 and Rp50,000.00 denominations
rose, while the proportion of Rpl0,000.00
denomination and below declined (Table 2 and
Chart 2). Coins continue to play relatively
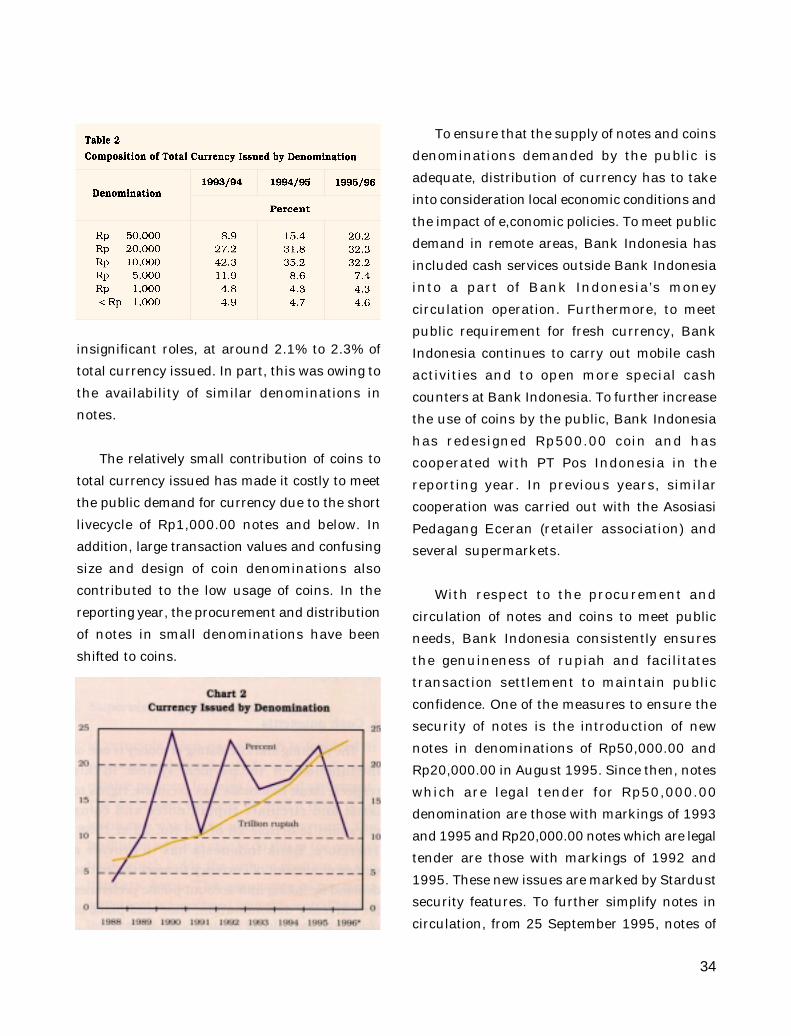
34
insignificant roles, at around 2.1% to 2.3% of
total currency issued. In part, this was owing to
the availability of similar denominations in
notes.
The relatively small contribution of coins to
total currency issued has made it costly to meet
the public demand for currency due to the short
livecycle of Rp1,000.00 notes and below. In
addition, large transaction values and confusing
size and design of coin denominations also
contributed to the low usage of coins. In the
reporting year, the procurement and distribution
of notes in small denominations have been
shifted to coins.
To ensure that the supply of notes and coins
denominations demanded by the public is
adequate, distribution of currency has to take
into consideration local economic conditions and
the impact of e,conomic policies. To meet public
demand in remote areas, Bank Indonesia has
included cash services outside Bank Indonesia
into a part of Bank Indonesia’s money
circulation operation. Furthermore, to meet
public requirement for fresh currency, Bank
Indonesia continues to carry out mobile cash
activities and to open more special cash
counters at Bank Indonesia. To further increase
the use of coins by the public, Bank Indonesia
has redesigned Rp500.00 coin and has
cooperated with PT Pos Indonesia in the
reporting year. In previous years, similar
cooperation was carried out with the Asosiasi
Pedagang Eceran (retailer association) and
several supermarkets.
With respect to the procurement and
circulation of notes and coins to meet public
needs, Bank Indonesia consistently ensures
the genuineness of rupiah and facilitates
transaction settlement to maintain public
confidence. One of the measures to ensure the
security of notes is the introduction of new
notes in denominations of Rp50,000.00 and
Rp20,000.00 in August 1995. Since then, notes
which are legal tender for Rp50,000.00
denomination are those with markings of 1993
and 1995 and Rp20,000.00 notes which are legal
tender are those with markings of 1992 and
1995. These new issues are marked by Stardust
security features. To further simplify notes in
circulation, from 25 September 1995, notes of
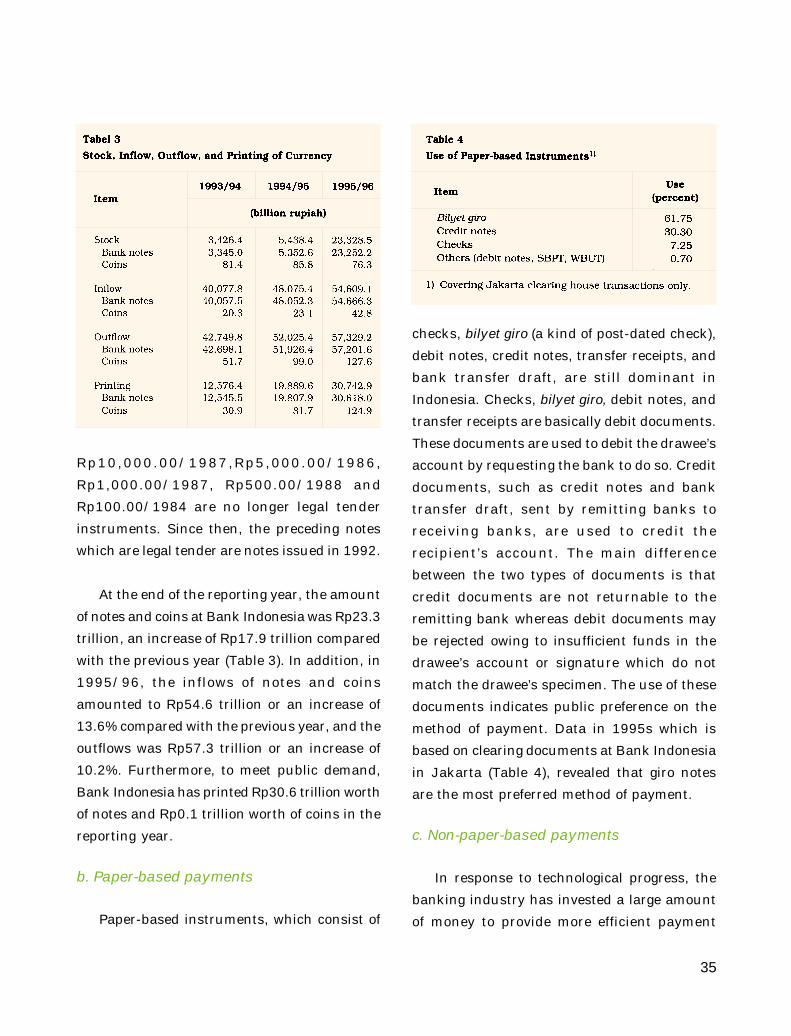
35
Rp10,000.00/1987,Rp5,000.00/1986,
Rp1,000.00/1987, Rp500.00/1988 and
Rp100.00/1984 are no longer legal tender
instruments. Since then, the preceding notes
which are legal tender are notes issued in 1992.
At the end of the reporting year, the amount
of notes and coins at Bank Indonesia was Rp23.3
trillion, an increase of Rp17.9 trillion compared
with the previous year (Table 3). In addition, in
1995/96, the inflows of notes and coins
amounted to Rp54.6 trillion or an increase of
13.6% compared with the previous year, and the
outflows was Rp57.3 trillion or an increase of
10.2%. Furthermore, to meet public demand,
Bank Indonesia has printed Rp30.6 trillion worth
of notes and Rp0.1 trillion worth of coins in the
reporting year.
b. Paper-based payments
Paper-based instruments, which consist of
checks, bilyet giro (a kind of post-dated check),
debit notes, credit notes, transfer receipts, and
bank transfer draft, are still dominant in
Indonesia. Checks, bilyet giro, debit notes, and
transfer receipts are basically debit documents.
These documents are used to debit the drawee’s
account by requesting the bank to do so. Credit
documents, such as credit notes and bank
transfer draft, sent by remitting banks to
receiving banks, are used to credit the
recipient’s account. The main difference
between the two types of documents is that
credit documents are not returnable to the
remitting bank whereas debit documents may
be rejected owing to insufficient funds in the
drawee’s account or signature which do not
match the drawee’s specimen. The use of these
documents indicates public preference on the
method of payment. Data in 1995s which is
based on clearing documents at Bank Indonesia
in Jakarta (Table 4), revealed that giro notes
are the most preferred method of payment.
c. Non-paper-based payments
In response to technological progress, the
banking industry has invested a large amount
of money to provide more efficient payment
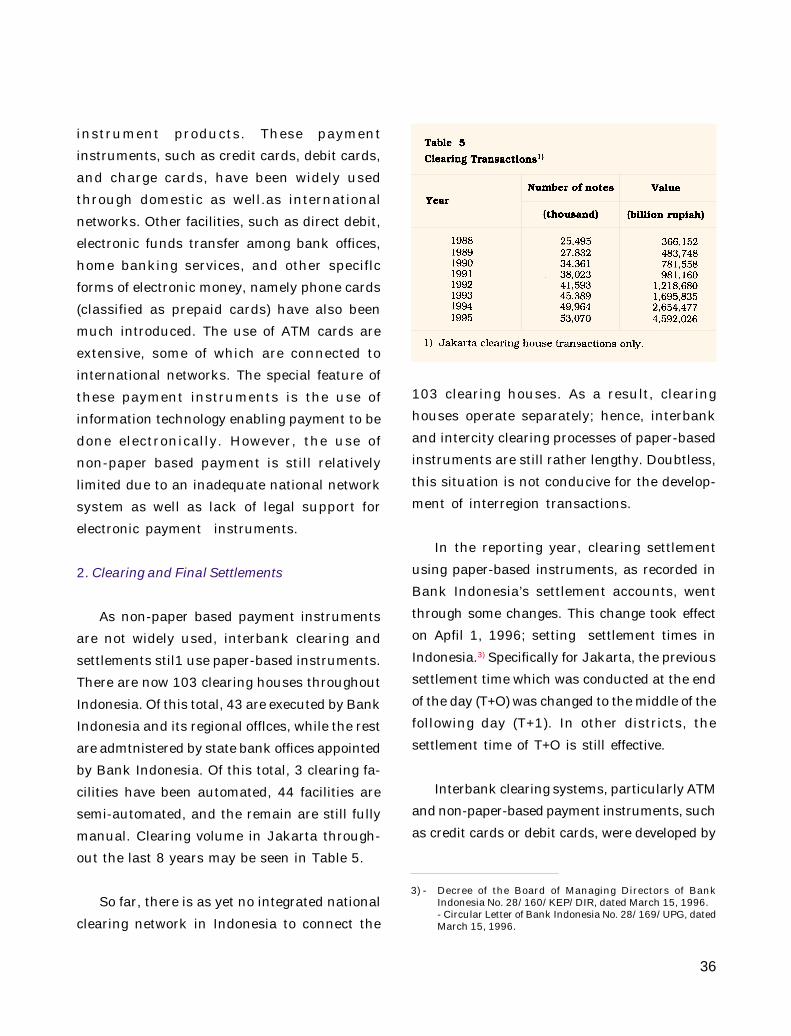
36
3) - Decree of the Board of Managing Directors of BankIndonesia No. 28/160/KEP/DIR, dated March 15, 1996.- Circular Letter of Bank Indonesia No. 28/169/UPG, datedMarch 15, 1996.
instrument products. These payment
instruments, such as credit cards, debit cards,
and charge cards, have been widely used
through domestic as well.as international
networks. Other facilities, such as direct debit,
electronic funds transfer among bank offices,
home banking services, and other speciflc
forms of electronic money, namely phone cards
(classified as prepaid cards) have also been
much introduced. The use of ATM cards are
extensive, some of which are connected to
international networks. The special feature of
these payment instruments is the use of
information technology enabling payment to be
done electronically. However, the use of
non-paper based payment is still relatively
limited due to an inadequate national network
system as well as lack of legal support for
electronic payment instruments.
2. Clearing and Final Settlements
As non-paper based payment instruments
are not widely used, interbank clearing and
settlements stil1 use paper-based instruments.
There are now 103 clearing houses throughout
Indonesia. Of this total, 43 are executed by Bank
Indonesia and its regional offlces, while the rest
are admtnistered by state bank offices appointed
by Bank Indonesia. Of this total, 3 clearing fa-
cilities have been automated, 44 facilities are
semi-automated, and the remain are still fully
manual. Clearing volume in Jakarta through-
out the last 8 years may be seen in Table 5.
So far, there is as yet no integrated national
clearing network in Indonesia to connect the
103 clearing houses. As a result, clearing
houses operate separately; hence, interbank
and intercity clearing processes of paper-based
instruments are still rather lengthy. Doubtless,
this situation is not conducive for the develop-
ment of interregion transactions.
In the reporting year, clearing settlement
using paper-based instruments, as recorded in
Bank Indonesia’s settlement accounts, went
through some changes. This change took effect
on Apfil 1, 1996; setting settlement times in
Indonesia.3) Specifically for Jakarta, the previous
settlement time which was conducted at the end
of the day (T+O) was changed to the middle of the
following day (T+1). In other districts, the
settlement time of T+O is still effective.
Interbank clearing systems, particularly ATM
and non-paper-based payment instruments, such
as credit cards or debit cards, were developed by
37
the banking industry, in line with the develop-
ment of banking products to ease customers’
transactions. So far, this clearing system is not
under Bank Indonesia’s supervision.
For international payment transactions,
Bank Indonesia has pioneered the connection
with the Society for Worldwide Interbank
Financial Telecommunication (SWIFT). It may
be noted that in 1993, SWIFT has officially
started tooperate in Indonesia, with Bank
Indonesia as one of its users.
3. Other Institutions Closely Related to NPS
The provision of payment services is not
solely by banking institutions. In fact, PT Pos
Indonesia has provided funds transfer services
to the public through its nation-wide network.
In addition, to provide faster and more efficient
services, PT Pos Indonesia has currently
developed a Postal - Electronic Funds Transfer
(EFT) system.
In the meantime; the Jakarta Stock
Exchange (JSX) has automated its trading system
since May 1995. In early 1996, JSX introduced a
scripless settlement system allowing the
settlement of stocks traded to be carried out
electronically. This scripless settlement system
will greatly speed up the process of stocks
submission among buyers and sellers at the
bourse. Nonetheless, the scripless system is not
followed by faster financial settlement because
current clearing facilities is limited to
paper-based instruments. As a result, these two
forms of settlements cannot be executed
simultaneously according to the delivery-versus
payment system (DVPS) concept.
NPS Development Plan
Current economic development in Indonesia
is characterized by large trade transactions and
other transactions both domestically and
internationally; inevitably the NPS must be
reformed. The reformation is aimed at
supporting economic activity in the form of
smooth, safe, reliable, and efficient payment
services with wide access for all economic
participants to meet various payment needs.
In line with the NPS development plan,
Bank Indonesia has developed a blueprint for
the reformation of NPS. The reformation is
carried out in stages based on the following
principles.
1. Integration: the payment system should be
integrated nationally with the possibility of
international connection.
2. Confidence: the NPS has to guarantee the
confidence of users and other interested
parties within as well as outside the country.
In this regard, the development of NPS should
take into consideration international
standards. This standard is effective for all
aspects of NPS including risk management,
architecture, format standard, and legal
support.
3. Credibility: NPS may not fail as a failure of
the system, however small, may be fatal.
Therefore, its development require special
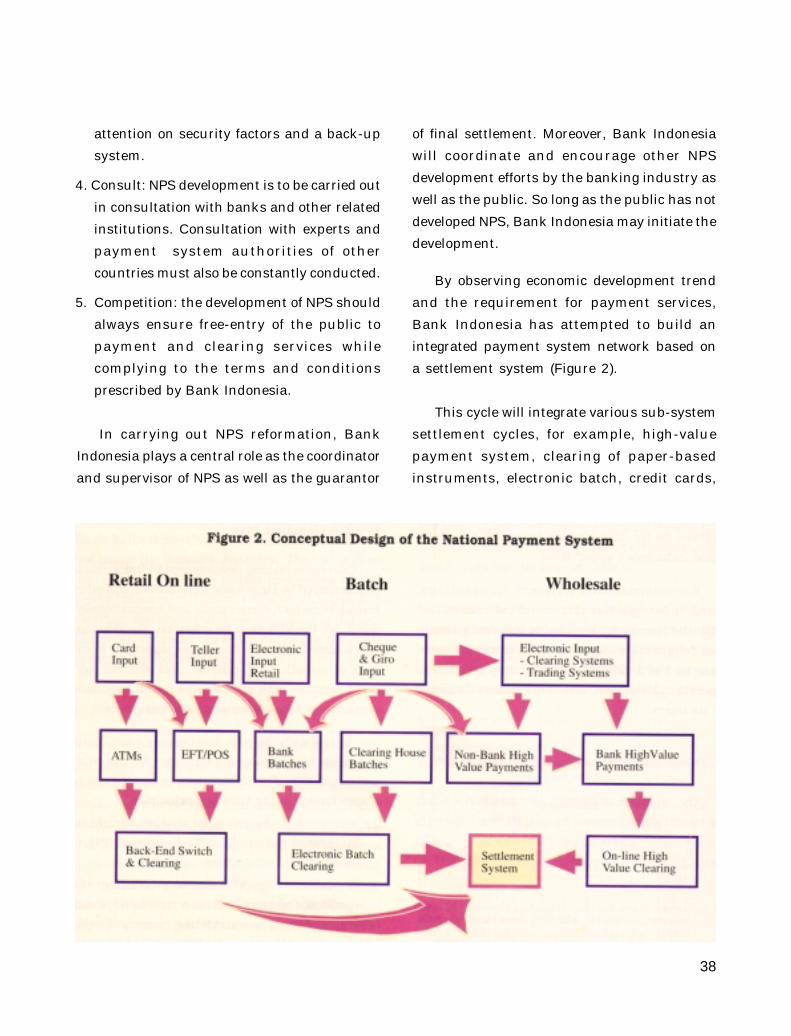
38
attention on security factors and a back-up
system.
4. Consult: NPS development is to be carried out
in consultation with banks and other related
institutions. Consultation with experts and
payment system authorities of other
countries must also be constantly conducted.
5. Competition: the development of NPS should
always ensure free-entry of the public to
payment and clearing services while
complying to the terms and conditions
prescribed by Bank Indonesia.
In carrying out NPS reformation, Bank
Indonesia plays a central role as the coordinator
and supervisor of NPS as well as the guarantor
of final settlement. Moreover, Bank Indonesia
will coordinate and encourage other NPS
development efforts by the banking industry as
well as the public. So long as the public has not
developed NPS, Bank Indonesia may initiate the
development.
By observing economic development trend
and the requirement for payment services,
Bank Indonesia has attempted to build an
integrated payment system network based on
a settlement system (Figure 2).
This cycle will integrate various sub-system
settlement cycles, for example, high-value
payment system, clearing of paper-based
instruments, electronic batch, credit cards,
39
debit cards, charge cards and ATM, automated
clearing house (giro system), money market,
and capital market.
As an initial step, Bank Indonesia has
developed the Bank Indonesia interoffice
electronic funds transfer system (SistemAntarkantor Terpadu Bank Indonesia/SAKTI)
which will be the backbone of NPS toward a real
time payment system. Gradually, SAKTI will
connect transfer systems between banks and
Bank Indonesia as well as interbank on-line
transfers throughout Indonesia. With regards
to electronic fund transfer, Bank Indonesia
together with the National Law Development
Agency (Badan Pengembangan Hukum Nasional)has analyzed the development of a legal
framework for electronic transactions.
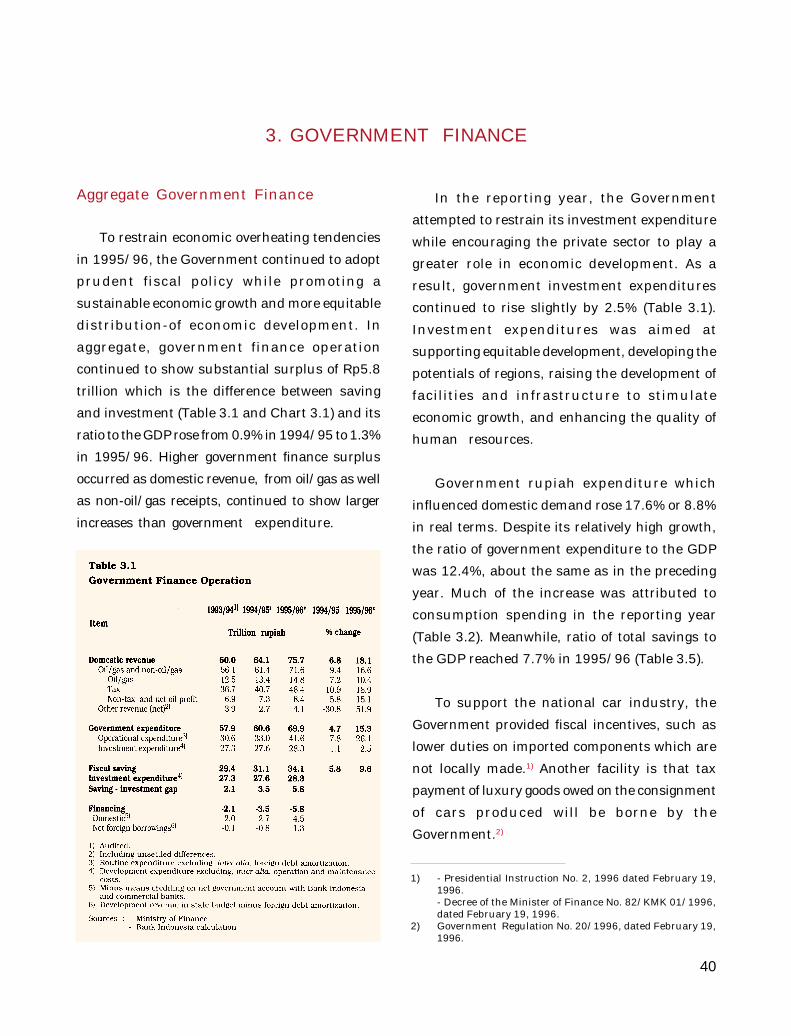
40
Aggregate Government Finance
To restrain economic overheating tendencies
in 1995/96, the Government continued to adopt
prudent fiscal policy while promoting a
sustainable economic growth and more equitable
distribution-of economic development. In
aggregate, government finance operation
continued to show substantial surplus of Rp5.8
trillion which is the difference between saving
and investment (Table 3.1 and Chart 3.1) and its
ratio to the GDP rose from 0.9% in 1994/95 to 1.3%
in 1995/96. Higher government finance surplus
occurred as domestic revenue, from oil/gas as well
as non-oil/gas receipts, continued to show larger
increases than government expenditure.
In the reporting year, the Government
attempted to restrain its investment expenditure
while encouraging the private sector to play a
greater role in economic development. As a
result, government investment expenditures
continued to rise slightly by 2.5% (Table 3.1).
Investment expenditures was aimed at
supporting equitable development, developing the
potentials of regions, raising the development of
facilities and infrastructure to stimulate
economic growth, and enhancing the quality of
human resources.
Government rupiah expenditure which
influenced domestic demand rose 17.6% or 8.8%
in real terms. Despite its relatively high growth,
the ratio of government expenditure to the GDP
was 12.4%, about the same as in the preceding
year. Much of the increase was attributed to
consumption spending in the reporting year
(Table 3.2). Meanwhile, ratio of total savings to
the GDP reached 7.7% in 1995/96 (Table 3.5).
To support the national car industry, the
Government provided fiscal incentives, such as
lower duties on imported components which are
not locally made.1) Another facility is that tax
payment of luxury goods owed on the consignment
of cars produced will be borne by the
Government.2)
3. GOVERNMENT FINANCE
1) - Presidential Instruction No. 2, 1996 dated February 19,1996.- Decree of the Minister of Finance No. 82/KMK 01/1996,dated February 19, 1996.
2) Government Regulation No. 20/1996, dated February 19,1996.
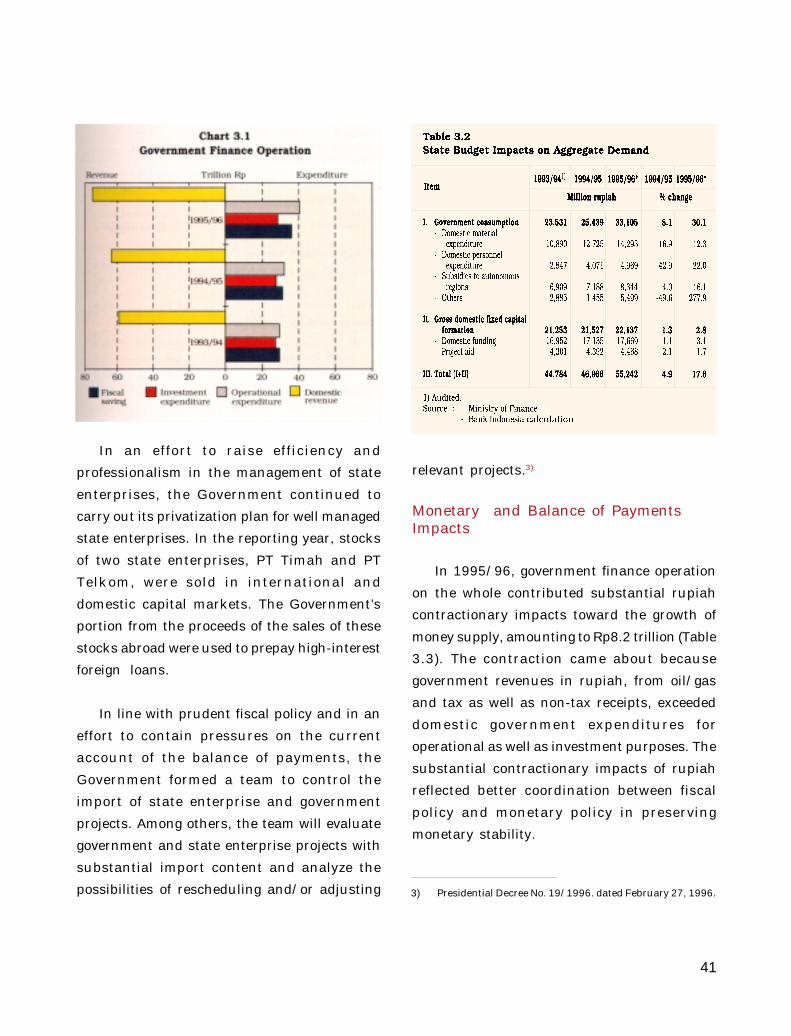
41
In an effort to raise efficiency and
professionalism in the management of state
enterprises, the Government continued to
carry out its privatization plan for well managed
state enterprises. In the reporting year, stocks
of two state enterprises, PT Timah and PT
Telkom, were sold in international and
domestic capital markets. The Government’s
portion from the proceeds of the sales of these
stocks abroad were used to prepay high-interest
foreign loans.
In line with prudent fiscal policy and in an
effort to contain pressures on the current
account of the balance of payments, the
Government formed a team to control the
import of state enterprise and government
projects. Among others, the team will evaluate
government and state enterprise projects with
substantial import content and analyze the
possibilities of rescheduling and/or adjusting
relevant projects.3)
Monetary and Balance of PaymentsImpacts
In 1995/96, government finance operation
on the whole contributed substantial rupiah
contractionary impacts toward the growth of
money supply, amounting to Rp8.2 trillion (Table
3.3). The contraction came about because
government revenues in rupiah, from oil/gas
and tax as well as non-tax receipts, exceeded
domestic government expenditures for
operational as well as investment purposes. The
substantial contractionary impacts of rupiah
reflected better coordination between fiscal
policy and monetary policy in preserving
monetary stability.
3) Presidential Decree No. 19/1996. dated February 27, 1996.
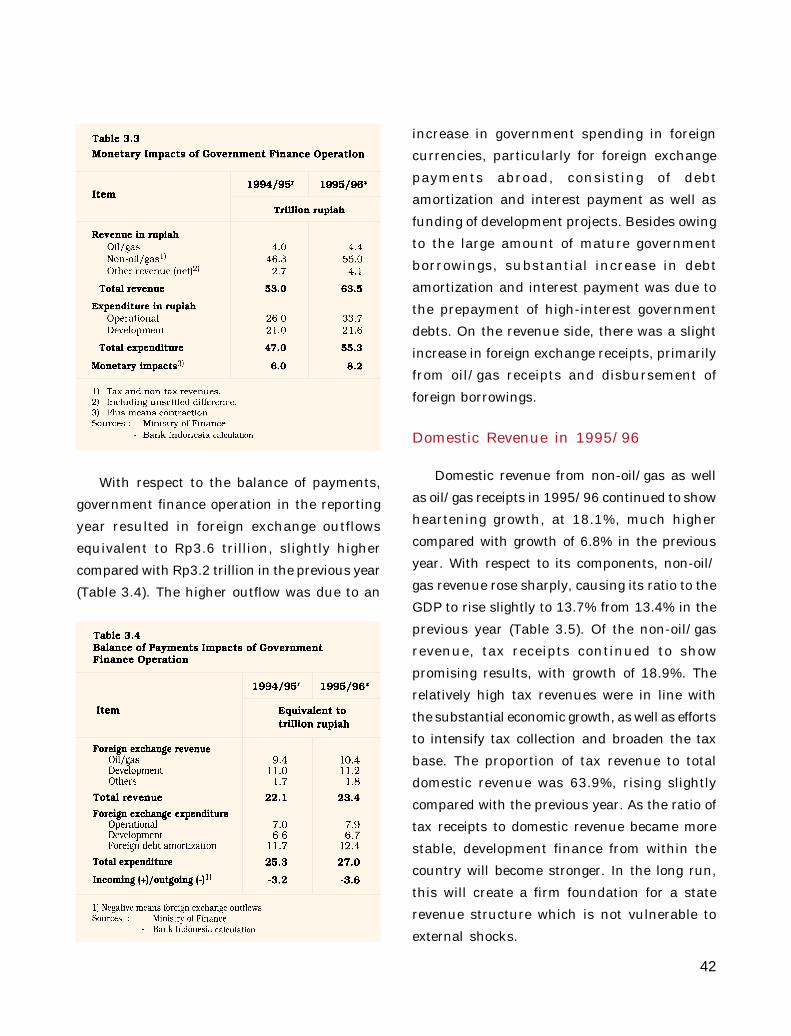
42
With respect to the balance of payments,
government finance operation in the reporting
year resulted in foreign exchange outflows
equivalent to Rp3.6 trillion, slightly higher
compared with Rp3.2 trillion in the previous year
(Table 3.4). The higher outflow was due to an
increase in government spending in foreign
currencies, particularly for foreign exchange
payments abroad, consisting of debt
amortization and interest payment as well as
funding of development projects. Besides owing
to the large amount of mature government
borrowings, substantial increase in debt
amortization and interest payment was due to
the prepayment of high-interest government
debts. On the revenue side, there was a slight
increase in foreign exchange receipts, primarily
from oil/gas receipts and disbursement of
foreign borrowings.
Domestic Revenue in 1995/96
Domestic revenue from non-oil/gas as well
as oil/gas receipts in 1995/96 continued to show
heartening growth, at 18.1%, much higher
compared with growth of 6.8% in the previous
year. With respect to its components, non-oil/
gas revenue rose sharply, causing its ratio to the
GDP to rise slightly to 13.7% from 13.4% in the
previous year (Table 3.5). Of the non-oil/gas
revenue, tax receipts continued to show
promising results, with growth of 18.9%. The
relatively high tax revenues were in line with
the substantial economic growth, as well as efforts
to intensify tax collection and broaden the tax
base. The proportion of tax revenue to total
domestic revenue was 63.9%, rising slightly
compared with the previous year. As the ratio of
tax receipts to domestic revenue became more
stable, development finance from within the
country will become stronger. In the long run,
this will create a firm foundation for a state
revenue structure which is not vulnerable to
external shocks.
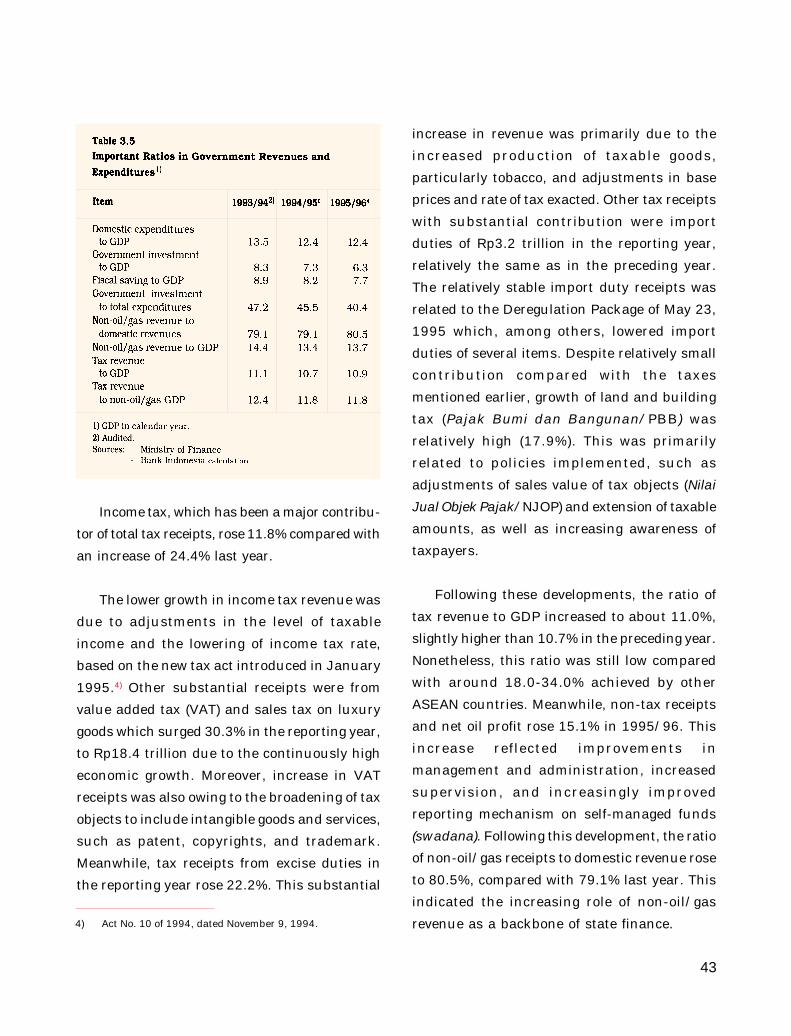
43
Income tax, which has been a major contribu-
tor of total tax receipts, rose 11.8% compared with
an increase of 24.4% last year.
The lower growth in income tax revenue was
due to adjustments in the level of taxable
income and the lowering of income tax rate,
based on the new tax act introduced in January
1995.4) Other substantial receipts were from
value added tax (VAT) and sales tax on luxury
goods which surged 30.3% in the reporting year,
to Rp18.4 trillion due to the continuously high
economic growth. Moreover, increase in VAT
receipts was also owing to the broadening of tax
objects to include intangible goods and services,
such as patent, copyrights, and trademark.
Meanwhile, tax receipts from excise duties in
the reporting year rose 22.2%. This substantial
increase in revenue was primarily due to the
increased production of taxable goods,
particularly tobacco, and adjustments in base
prices and rate of tax exacted. Other tax receipts
with substantial contribution were import
duties of Rp3.2 trillion in the reporting year,
relatively the same as in the preceding year.
The relatively stable import duty receipts was
related to the Deregulation Package of May 23,
1995 which, among others, lowered import
duties of several items. Despite relatively small
contribution compared with the taxes
mentioned earlier, growth of land and building
tax (Pajak Bumi dan Bangunan/PBB) was
relatively high (17.9%). This was primarily
related to policies implemented, such as
adjustments of sales value of tax objects (NilaiJual Objek Pajak/NJOP) and extension of taxable
amounts, as well as increasing awareness of
taxpayers.
Following these developments, the ratio of
tax revenue to GDP increased to about 11.0%,
slightly higher than 10.7% in the preceding year.
Nonetheless, this ratio was still low compared
with around 18.0-34.0% achieved by other
ASEAN countries. Meanwhile, non-tax receipts
and net oil profit rose 15.1% in 1995/96. This
increase reflected improvements in
management and administration, increased
supervision, and increasingly improved
reporting mechanism on self-managed funds
(swadana). Following this development, the ratio
of non-oil/gas receipts to domestic revenue rose
to 80.5%, compared with 79.1% last year. This
indicated the increasing role of non-oil/gas
revenue as a backbone of state finance.4) Act No. 10 of 1994, dated November 9, 1994.
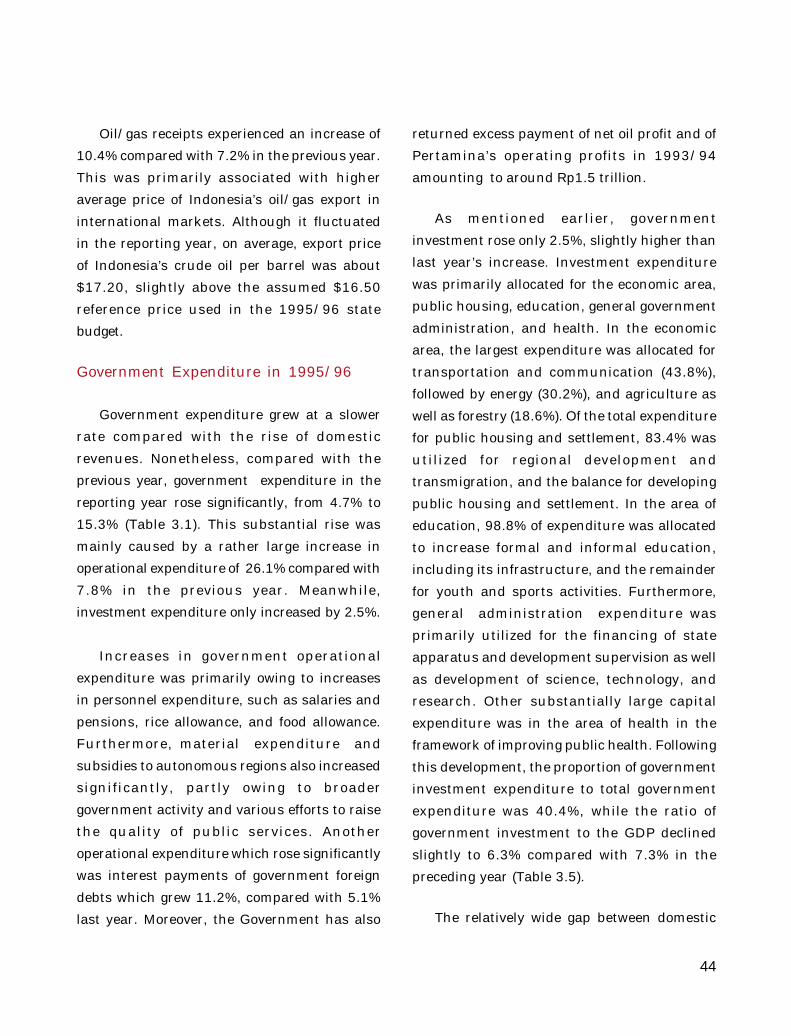
44
Oil/gas receipts experienced an increase of
10.4% compared with 7.2% in the previous year.
This was primarily associated with higher
average price of Indonesia’s oil/gas export in
international markets. Although it fluctuated
in the reporting year, on average, export price
of Indonesia’s crude oil per barrel was about
$17.20, slightly above the assumed $16.50
reference price used in the 1995/96 state
budget.
Government Expenditure in 1995/96
Government expenditure grew at a slower
rate compared with the rise of domestic
revenues. Nonetheless, compared with the
previous year, government expenditure in the
reporting year rose significantly, from 4.7% to
15.3% (Table 3.1). This substantial rise was
mainly caused by a rather large increase in
operational expenditure of 26.1% compared with
7.8% in the previous year. Meanwhile,
investment expenditure only increased by 2.5%.
Increases in government operational
expenditure was primarily owing to increases
in personnel expenditure, such as salaries and
pensions, rice allowance, and food allowance.
Furthermore, material expenditure and
subsidies to autonomous regions also increased
significantly, partly owing to broader
government activity and various efforts to raise
the quality of public services. Another
operational expenditure which rose significantly
was interest payments of government foreign
debts which grew 11.2%, compared with 5.1%
last year. Moreover, the Government has also
returned excess payment of net oil profit and of
Pertamina’s operating profits in 1993/94
amounting to around Rp1.5 trillion.
As mentioned earlier, government
investment rose only 2.5%, slightly higher than
last year’s increase. Investment expenditure
was primarily allocated for the economic area,
public housing, education, general government
administration, and health. In the economic
area, the largest expenditure was allocated for
transportation and communication (43.8%),
followed by energy (30.2%), and agriculture as
well as forestry (18.6%). Of the total expenditure
for public housing and settlement, 83.4% was
utilized for regional development and
transmigration, and the balance for developing
public housing and settlement. In the area of
education, 98.8% of expenditure was allocated
to increase formal and informal education,
including its infrastructure, and the remainder
for youth and sports activities. Furthermore,
general administration expenditure was
primarily utilized for the financing of state
apparatus and development supervision as well
as development of science, technology, and
research. Other substantially large capital
expenditure was in the area of health in the
framework of improving public health. Following
this development, the proportion of government
investment expenditure to total government
expenditure was 40.4%, while the ratio of
government investment to the GDP declined
slightly to 6.3% compared with 7.3% in the
preceding year (Table 3.5).
The relatively wide gap between domestic
45
revenue and operational expenditure increased
fiscal saving to Rp34.1 trillion or an increase of
9.6% compared with 5.8% last year. This
suggests the increasing capability of the
Government to finance development with funds
from domestic sources.
Sources of Government Finance
Government finance operation on the whole
in the reporting year showed an improvement
from the previous year, as reflected in the fiscal
saving surplus on government investment
amounting to Rp5.8 trillion (Table 3.1). Of this
surplus, Rp1.3 trillion was utilized for net
payment of external liabilities while the
balance was deposited into government
accounts with Bank Indonesia as well as
commercial banks. It is noteworthy that lower
disbursements of foreign loans as compared
with payment of foreign debt amortization has
persisted in the last three years. Following this
development and taking into account the effect
of exchange rate changes, outstanding
government foreign debts at the end of 1995/
96 declined to about $58.2 billion, compared with
$62.6 billion at the end of 1994/95.
Government Finance Operation for1996/97
In 1996/97, the Government will maintain
a prudent stance in fiscal policy with the
objective of maintaining economic growth,
promoting equitable development, and
preserving macroeconomic stability.
Government domestic revenue, especially from
non-oil tax, which is generally not affected by
shocks continue to be augmented through the
intensification and extensification of tax. The
Government continues to increase efficiency
on the expenditure side in view that its budget
is increasingly limited. Expenditure will
continue to be prioritized to the development of
infrastructures to encourage the growth of
various sectors, such as manufacturing,
agriculture, and services as well as tourism. In
1996/97, the Government will continue to
provide the private sector greater opportunity
to participate in the development of
infrastructures, such as telecommunication,
electricity generation, and highways.
Furthermore, government expenditure is also
aimed at improving the quality of human
resources and to expedite poverty alleviation or
equitable development, especially in the East
Indonesian region. To that end, the Government
will continue to encourage public participation
in government projects, especially in rural
areas. To develop the economic potential of
regions, the Government gives regencies more
authority to allocate funds under the
Presidential Instruction on least developed
villages (Inpres Desa Tertinggal/IDT) with other
private funds as well as community self-help
funds.
Furthermore, the Government continues to
mobilize domestic financing sources to enable
self-sufficiency in financing economic
development. Tax receipts will continue to be
increased by broadening its coverage ratio.
Furthermore, increased legal enforcement
toward tax evasions, accompanied by the
increased quality of services, capability of tax
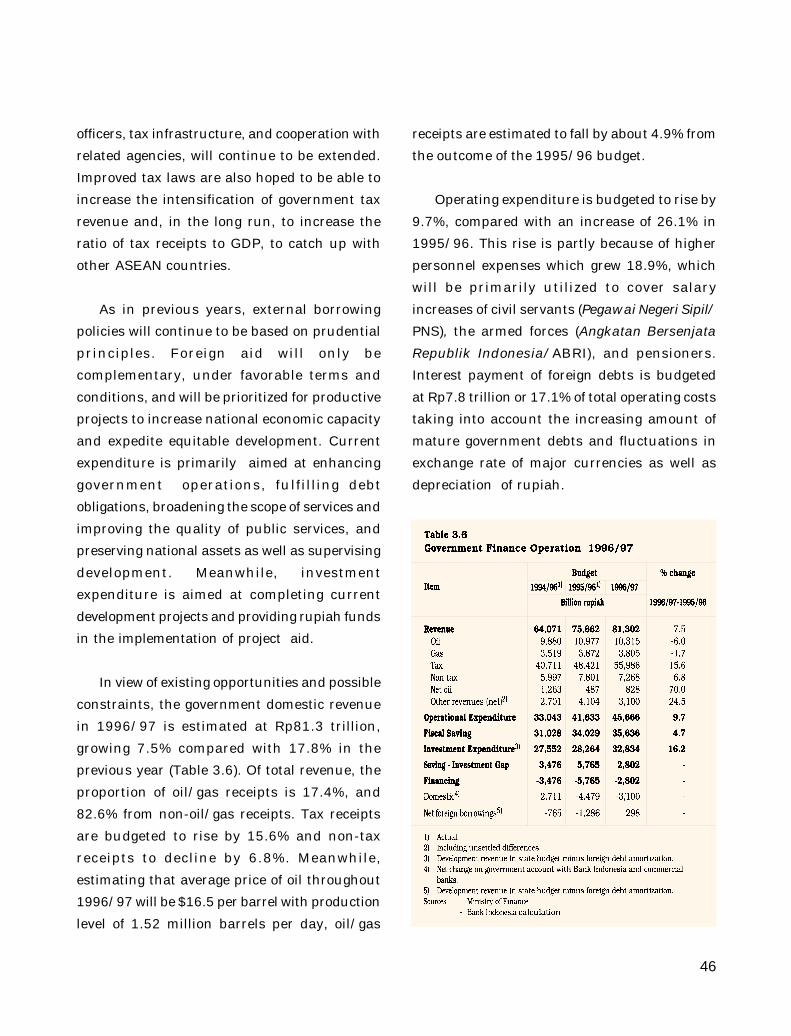
46
officers, tax infrastructure, and cooperation with
related agencies, will continue to be extended.
Improved tax laws are also hoped to be able to
increase the intensification of government tax
revenue and, in the long run, to increase the
ratio of tax receipts to GDP, to catch up with
other ASEAN countries.
As in previous years, external borrowing
policies will continue to be based on prudential
principles. Foreign aid will only be
complementary, under favorable terms and
conditions, and will be prioritized for productive
projects to increase national economic capacity
and expedite equitable development. Current
expenditure is primarily aimed at enhancing
government operations, fulfilling debt
obligations, broadening the scope of services and
improving the quality of public services, and
preserving national assets as well as supervising
development. Meanwhile, investment
expenditure is aimed at completing current
development projects and providing rupiah funds
in the implementation of project aid.
In view of existing opportunities and possible
constraints, the government domestic revenue
in 1996/97 is estimated at Rp81.3 trillion,
growing 7.5% compared with 17.8% in the
previous year (Table 3.6). Of total revenue, the
proportion of oil/gas receipts is 17.4%, and
82.6% from non-oil/gas receipts. Tax receipts
are budgeted to rise by 15.6% and non-tax
receipts to decline by 6.8%. Meanwhile,
estimating that average price of oil throughout
1996/97 will be $16.5 per barrel with production
level of 1.52 million barrels per day, oil/gas
receipts are estimated to fall by about 4.9% from
the outcome of the 1995/96 budget.
Operating expenditure is budgeted to rise by
9.7%, compared with an increase of 26.1% in
1995/96. This rise is partly because of higher
personnel expenses which grew 18.9%, which
will be primarily utilized to cover salary
increases of civil servants (Pegawai Negeri Sipil/PNS), the armed forces (Angkatan BersenjataRepublik Indonesia/ABRI), and pensioners.
Interest payment of foreign debts is budgeted
at Rp7.8 trillion or 17.1% of total operating costs
taking into account the increasing amount of
mature government debts and fluctuations in
exchange rate of major currencies as well as
depreciation of rupiah.
47
Investment expenditure is budgeted at
Rp32.8 trillion or 16.2% from realization of the
1995/96 budget compared with an increase of
2.5% in the previous year. The largest
investment expenditure will continue to be
prioritized for the economic area, followed by
public housing and settlement as well as
education. Most of the expenditure in the
economic area is allocated primarily for
transportation and communication, agriculture
and forestry, as well as energy generation.
Expenses for public housing and settlement are
primarily utilized for regional development and
transmigration as well as for the development
of public housing and settlement. Meanwhile,
expenditure for education is allocated mainly
to increase the infrastructure and quality of
education as well as for youth and sports
activities.
In general, from the operation of
government finance in 1996/97, it is devident
that the Government is consistently
implementing prudent fiscal policies as
reflected in the contractionary effects of
government finance toward the money supply
of around Rp8.9 trillion, higher than in the
previous year. Based on expenditure,
government finance operation in 1996/97 is
estimated to influence aggregate demand in
real terms to grow at slightly lower levels
compared with its budget realization in 1995/
96. Meanwhile, foreign exchange transaction
on the whole is estimated to continue to provide
net outflow impacts on the balance of payments
equivalent to Rp5.8 trillion, primarily because
of the high interest/installment payment of
foreign debts. Fiscal saving is estimated to
continue to rise compared with the previous
year, to Rp35.6 trillion. With investment
expenditure projected at Rp32.8 trillion, on
the whole, government finance operation will
have a saving-investment gap of about Rp2.8
trillion.
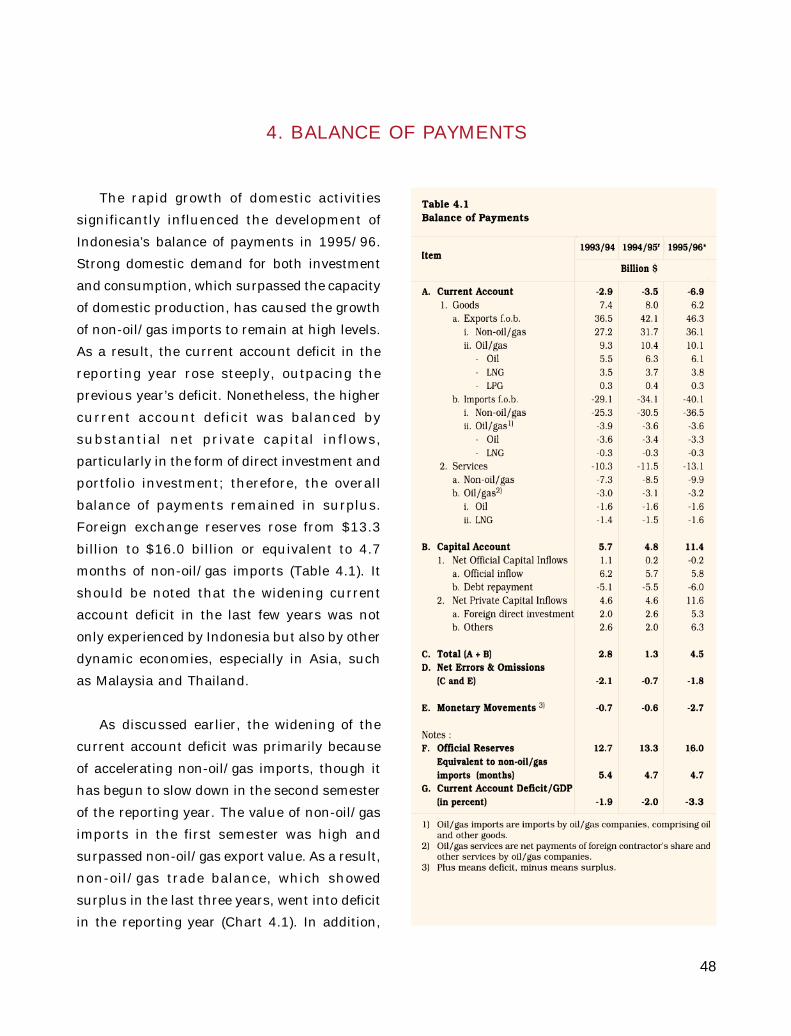
48
The rapid growth of domestic activities
significantly influenced the development of
Indonesia’s balance of payments in 1995/96.
Strong domestic demand for both investment
and consumption, which surpassed the capacity
of domestic production, has caused the growth
of non-oil/gas imports to remain at high levels.
As a result, the current account deficit in the
reporting year rose steeply, outpacing the
previous year’s deficit. Nonetheless, the higher
current account deficit was balanced by
substantial net private capital inflows,
particularly in the form of direct investment and
portfolio investment; therefore, the overall
balance of payments remained in surplus.
Foreign exchange reserves rose from $13.3
billion to $16.0 billion or equivalent to 4.7
months of non-oil/gas imports (Table 4.1). It
should be noted that the widening current
account deficit in the last few years was not
only experienced by Indonesia but also by other
dynamic economies, especially in Asia, such
as Malaysia and Thailand.
As discussed earlier, the widening of the
current account deficit was primarily because
of accelerating non-oil/gas imports, though it
has begun to slow down in the second semester
of the reporting year. The value of non-oil/gas
imports in the first semester was high and
surpassed non-oil/gas export value. As a result,
non-oil/gas trade balance, which showed
surplus in the last three years, went into deficit
in the reporting year (Chart 4.1). In addition,
4. BALANCE OF PAYMENTS
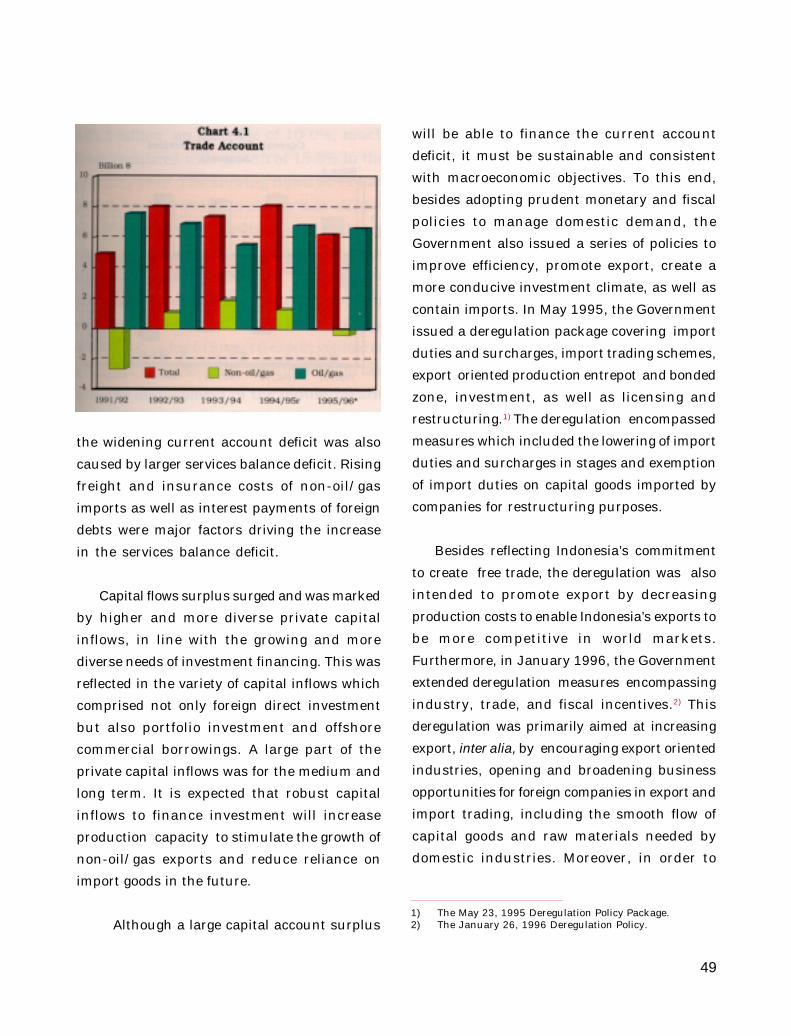
49
the widening current account deficit was also
caused by larger services balance deficit. Rising
freight and insurance costs of non-oil/gas
imports as well as interest payments of foreign
debts were major factors driving the increase
in the services balance deficit.
Capital flows surplus surged and was marked
by higher and more diverse private capital
inflows, in line with the growing and more
diverse needs of investment financing. This was
reflected in the variety of capital inflows which
comprised not only foreign direct investment
but also portfolio investment and offshore
commercial borrowings. A large part of the
private capital inflows was for the medium and
long term. It is expected that robust capital
inflows to finance investment will increase
production capacity to stimulate the growth of
non-oil/gas exports and reduce reliance on
import goods in the future.
Although a large capital account surplus
will be able to finance the current account
deficit, it must be sustainable and consistent
with macroeconomic objectives. To this end,
besides adopting prudent monetary and fiscal
policies to manage domestic demand, the
Government also issued a series of policies to
improve efficiency, promote export, create a
more conducive investment climate, as well as
contain imports. In May 1995, the Government
issued a deregulation package covering import
duties and surcharges, import trading schemes,
export oriented production entrepot and bonded
zone, investment, as well as licensing and
restructuring.1) The deregulation encompassed
measures which included the lowering of import
duties and surcharges in stages and exemption
of import duties on capital goods imported by
companies for restructuring purposes.
Besides reflecting Indonesia’s commitment
to create free trade, the deregulation was also
intended to promote export by decreasing
production costs to enable Indonesia’s exports to
be more competitive in world markets.
Furthermore, in January 1996, the Government
extended deregulation measures encompassing
industry, trade, and fiscal incentives.2) This
deregulation was primarily aimed at increasing
export, inter alia, by encouraging export oriented
industries, opening and broadening business
opportunities for foreign companies in export and
import trading, including the smooth flow of
capital goods and raw materials needed by
domestic industries. Moreover, in order to
1) The May 23, 1995 Deregulation Policy Package.2) The January 26, 1996 Deregulation Policy.

50
eliminate red tape barriers, the Government
improved regulations and procedures in export
and import, quality control of exports, as well as
eliminated unnecessary levies. Then, in
February 1996, the Government formed a team
to evaluate government and state enterprise
projects with substantial import content.3) Among
others, the team is responsible to study the
possibilities of rescheduling such projects.
Current Account
As mentioned earlier, the current account
deficit rose steeply in 1995/96. The sluggish
non-oil/gas export growth on the one hand and
the persistently high non-oil/gas import growth
on the other hand were the underlying factors
affecting the sharp increase in the current
account deficit. Non-oil/gas imports showed
rapid growth rates, particularly in the first
semester of the reporting year, at 33.5%.
Nonetheless, the non-oil/gas import growth
rate has begun to decrease in the second
semester, particularly since November 1995.
This was partly due to a series of policies
introduced by the Government in the monetary,
fiscal, and real sector. Following this develop
meet, non-oil/gas trade balance which was in
deficit in the first semester returned to surplus
in the second semester, thereby avoiding a
larger current account deficit.
The current account deficit in 1995/96
almost doubled, from $3.5 billion to $6.9 billion,
and its ratio to the GDP rose from 2.0% to 3.3%.
The increase in the current account deficit was
because of a decline in the surplus of trade
balance and an increase in the deficit of
services balance. Trade balance surplus
declined $1.8 billion to $6.2 billion while the
services balance deficit increased $1.6 billion
to $13.1 billion (Chart 4.2).
Trade Account
Exports
In fiscal year 1995/96, total exports (oil/gas
and non-oil/gas) rose from $42.1 billion to $46.3
billion, an increase of 10.0%, much lower
compared with growth of 15.3% in the previous
year. The slowing down of export growth besides
owing to slower non-oil/gas export growth was
also influenced by declining value of oil/gas
exports (Chart 4.3). The value of oil/gas exports,
which rose 11.8% in the previous year, dropped
2.9% in the reporting year, from $10.4 billion to
$10.1 billion (Table 4.2). This is owing to lower
oil export volume as a result of rising domestic
consumption, in line with the development of3) Presidential Decree No. 19 of 1996, dated February 27,
1996.
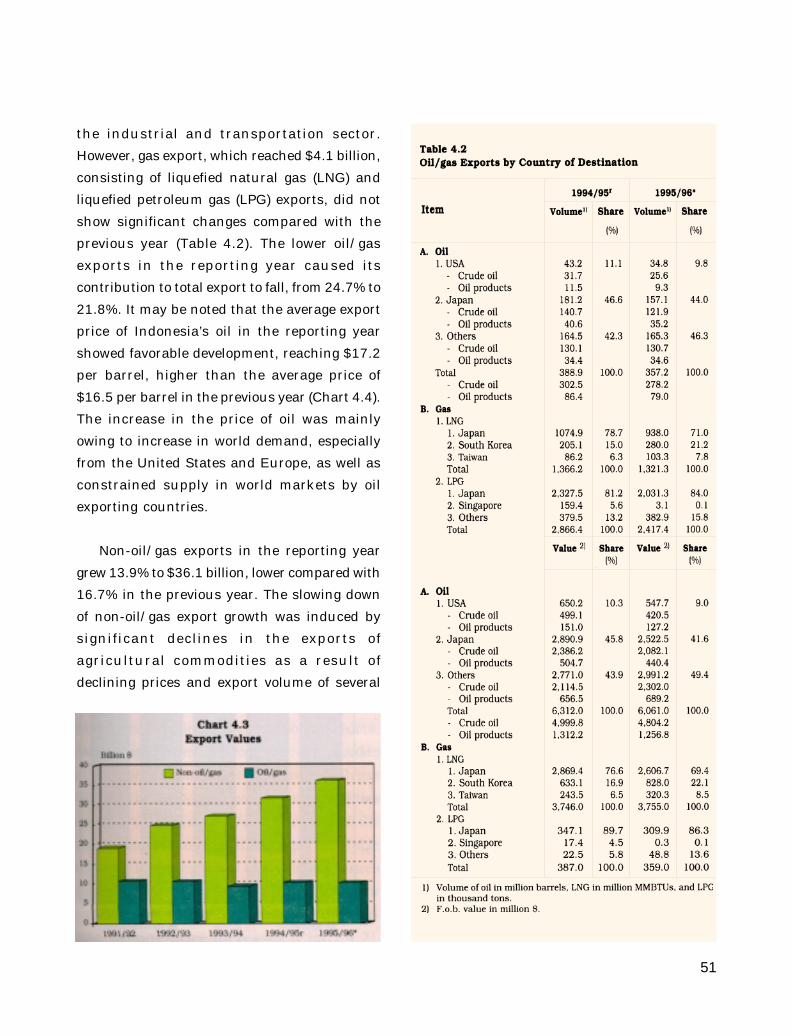
51
the industrial and transportation sector.
However, gas export, which reached $4.1 billion,
consisting of liquefied natural gas (LNG) and
liquefied petroleum gas (LPG) exports, did not
show significant changes compared with the
previous year (Table 4.2). The lower oil/gas
exports in the reporting year caused its
contribution to total export to fall, from 24.7% to
21.8%. It may be noted that the average export
price of Indonesia’s oil in the reporting year
showed favorable development, reaching $17.2
per barrel, higher than the average price of
$16.5 per barrel in the previous year (Chart 4.4).
The increase in the price of oil was mainly
owing to increase in world demand, especially
from the United States and Europe, as well as
constrained supply in world markets by oil
exporting countries.
Non-oil/gas exports in the reporting year
grew 13.9% to $36.1 billion, lower compared with
16.7% in the previous year. The slowing down
of non-oil/gas export growth was induced by
significant declines in the exports of
agricultural commodities as a result of
declining prices and export volume of several
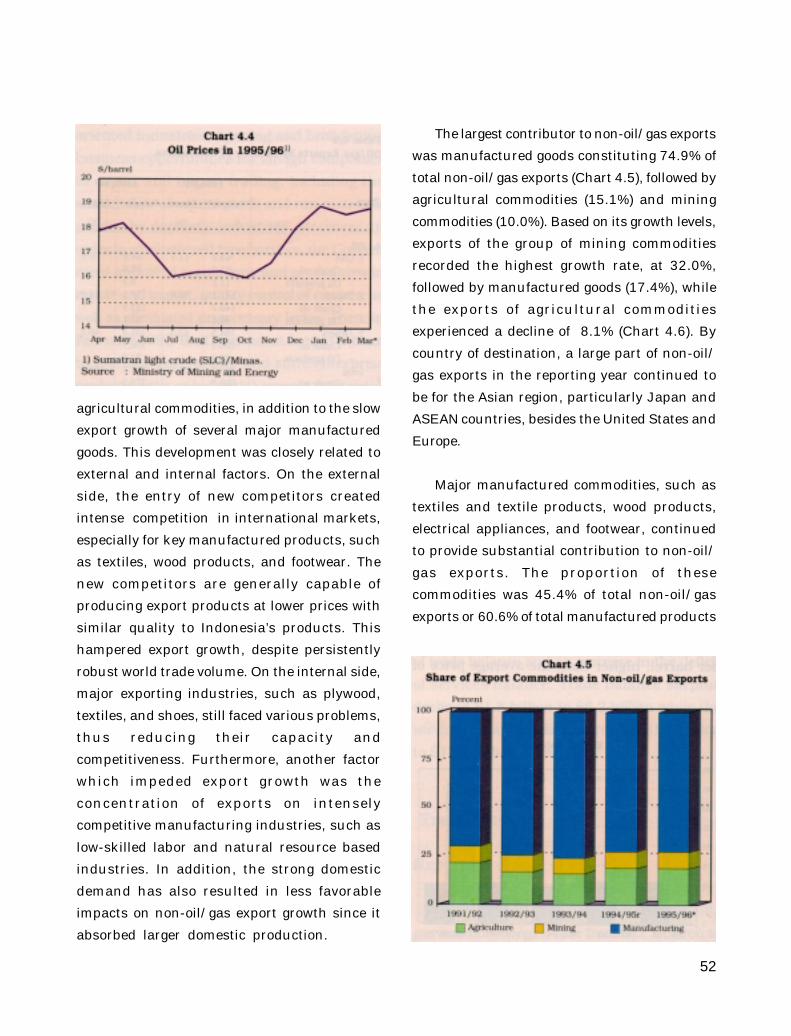
52
agricultural commodities, in addition to the slow
export growth of several major manufactured
goods. This development was closely related to
external and internal factors. On the external
side, the entry of new competitors created
intense competition in international markets,
especially for key manufactured products, such
as textiles, wood products, and footwear. The
new competitors are generally capable of
producing export products at lower prices with
similar quality to Indonesia’s products. This
hampered export growth, despite persistently
robust world trade volume. On the internal side,
major exporting industries, such as plywood,
textiles, and shoes, still faced various problems,
thus reducing their capacity and
competitiveness. Furthermore, another factor
which impeded export growth was the
concentration of exports on intensely
competitive manufacturing industries, such as
low-skilled labor and natural resource based
industries. In addition, the strong domestic
demand has also resulted in less favorable
impacts on non-oil/gas export growth since it
absorbed larger domestic production.
The largest contributor to non-oil/gas exports
was manufactured goods constituting 74.9% of
total non-oil/gas exports (Chart 4.5), followed by
agricultural commodities (15.1%) and mining
commodities (10.0%). Based on its growth levels,
exports of the group of mining commodities
recorded the highest growth rate, at 32.0%,
followed by manufactured goods (17.4%), while
the exports of agricultural commodities
experienced a decline of 8.1% (Chart 4.6). By
country of destination, a large part of non-oil/
gas exports in the reporting year continued to
be for the Asian region, particularly Japan and
ASEAN countries, besides the United States and
Europe.
Major manufactured commodities, such as
textiles and textile products, wood products,
electrical appliances, and footwear, continued
to provide substantial contribution to non-oil/
gas exports. The proportion of these
commodities was 45.4% of total non-oil/gas
exports or 60.6% of total manufactured products
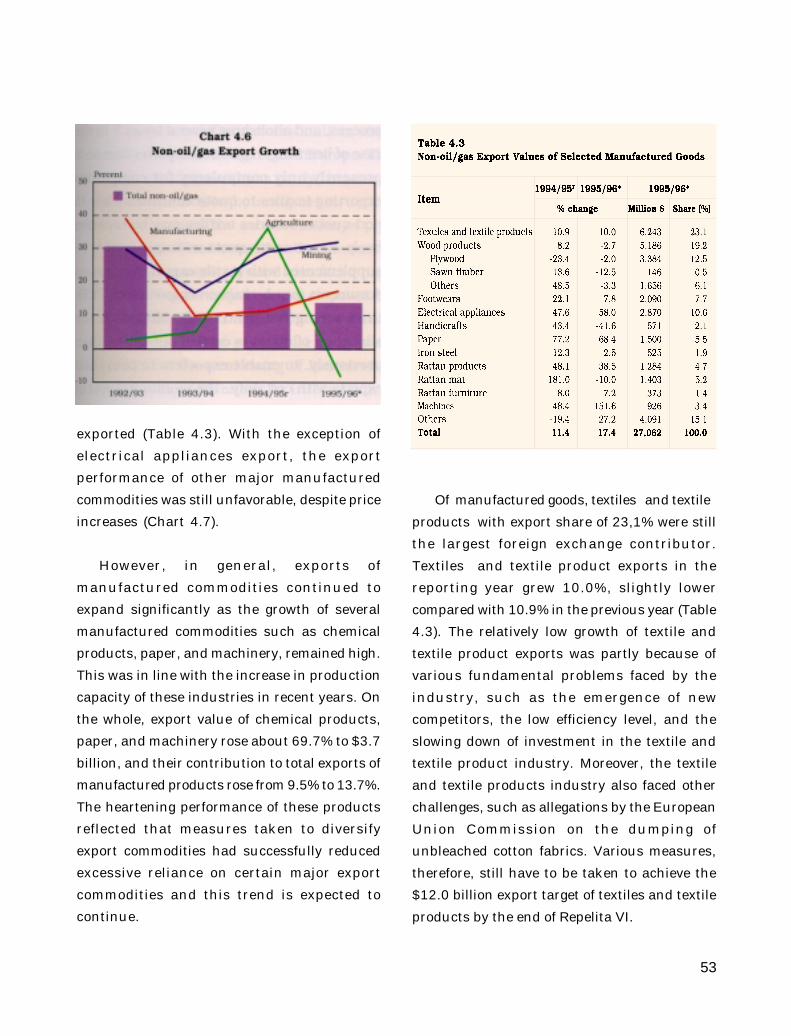
53
exported (Table 4.3). With the exception of
electrical appliances export, the export
performance of other major manufactured
commodities was still unfavorable, despite price
increases (Chart 4.7).
However, in general, exports of
manufactured commodities continued to
expand significantly as the growth of several
manufactured commodities such as chemical
products, paper, and machinery, remained high.
This was in line with the increase in production
capacity of these industries in recent years. On
the whole, export value of chemical products,
paper, and machinery rose about 69.7% to $3.7
billion, and their contribution to total exports of
manufactured products rose from 9.5% to 13.7%.
The heartening performance of these products
reflected that measures taken to diversify
export commodities had successfully reduced
excessive reliance on certain major export
commodities and this trend is expected to
continue.
Of manufactured goods, textiles and textile
products with export share of 23,1% were still
the largest foreign exchange contributor.
Textiles and textile product exports in the
reporting year grew 10.0%, slightly lower
compared with 10.9% in the previous year (Table
4.3). The relatively low growth of textile and
textile product exports was partly because of
various fundamental problems faced by the
industry, such as the emergence of new
competitors, the low efficiency level, and the
slowing down of investment in the textile and
textile product industry. Moreover, the textile
and textile products industry also faced other
challenges, such as allegations by the European
Union Commission on the dumping of
unbleached cotton fabrics. Various measures,
therefore, still have to be taken to achieve the
$12.0 billion export target of textiles and textile
products by the end of Repelita VI.
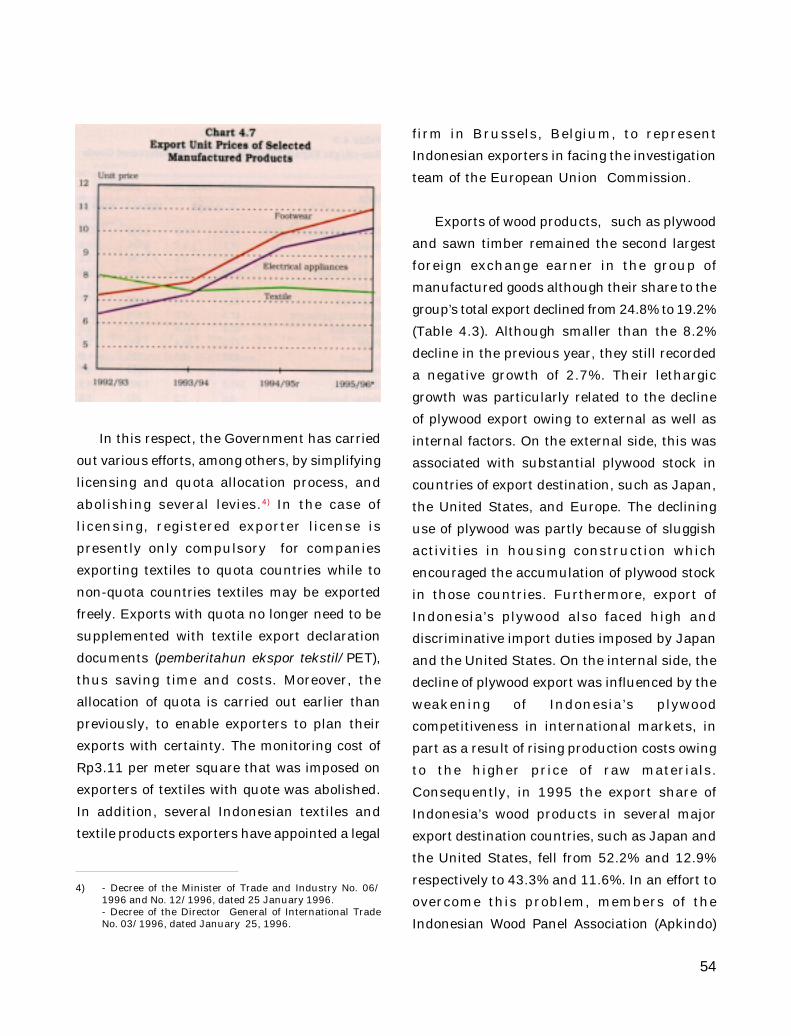
54
In this respect, the Government has carried
out various efforts, among others, by simplifying
licensing and quota allocation process, and
abolishing several levies.4) In the case of
licensing, registered exporter license is
presently only compulsory for companies
exporting textiles to quota countries while to
non-quota countries textiles may be exported
freely. Exports with quota no longer need to be
supplemented with textile export declaration
documents (pemberitahun ekspor tekstil/PET),
thus saving time and costs. Moreover, the
allocation of quota is carried out earlier than
previously, to enable exporters to plan their
exports with certainty. The monitoring cost of
Rp3.11 per meter square that was imposed on
exporters of textiles with quote was abolished.
In addition, several Indonesian textiles and
textile products exporters have appointed a legal
firm in Brussels, Belgium, to represent
Indonesian exporters in facing the investigation
team of the European Union Commission.
Exports of wood products, such as plywood
and sawn timber remained the second largest
foreign exchange earner in the group of
manufactured goods although their share to the
group’s total export declined from 24.8% to 19.2%
(Table 4.3). Although smaller than the 8.2%
decline in the previous year, they still recorded
a negative growth of 2.7%. Their lethargic
growth was particularly related to the decline
of plywood export owing to external as well as
internal factors. On the external side, this was
associated with substantial plywood stock in
countries of export destination, such as Japan,
the United States, and Europe. The declining
use of plywood was partly because of sluggish
activities in housing construction which
encouraged the accumulation of plywood stock
in those countries. Furthermore, export of
Indonesia’s plywood also faced high and
discriminative import duties imposed by Japan
and the United States. On the internal side, the
decline of plywood export was influenced by the
weakening of Indonesia’s plywood
competitiveness in international markets, in
part as a result of rising production costs owing
to the higher price of raw materials.
Consequently, in 1995 the export share of
Indonesia’s wood products in several major
export destination countries, such as Japan and
the United States, fell from 52.2% and 12.9%
respectively to 43.3% and 11.6%. In an effort to
overcome this problem, members of the
Indonesian Wood Panel Association (Apkindo)
4) - Decree of the Minister of Trade and Industry No. 06/1996 and No. 12/1996, dated 25 January 1996.- Decree of the Director General of International TradeNo. 03/1996, dated January 25, 1996.
55
cooperated with related government agencies
extended efforts to improve their efficiency and
productivity. To this end, they continue to
diversify their products toward downstream
products, which have higher value added and a
larger prospective market - for instance, by
shifting to medium density fiberboard (MDF)
products.
In the group of manufactured commodities,
electrical appliances are playing increasingly
important role as foreign exchange contributor;
rising from the fourth largest to the third. Export
of electrical appliances grew 58.0% to $2.9 billion
and their share to total export of manufactured
goods rose from 7.9% in the previous year to
10.6% (Table 4.3). This substantial growth was
closely related to relocation of electrical product
industry, particularly companies with well
known brands, to Indonesia. In addition, the
rising price also encouraged their export growth.
The increase in the export of electrical
appliances was largely from export of consumer
goods, such as color televisions and video
cassette recorders, and the rest are products
for business purposes and electrical
components. Most of them were shipped to
countries in Asia Pacific and the European
Union.
The export of footwear continued to provide
significant contribution to the export of
manufactured products although its growth in
the reporting year dropped, from 22.1% in the
previous year to 7.8%. As a result, its share to
total export of manufactured products also
decline, from 8.4% to 7.7%, and its position as
a major foreign exchange contributor slipped
from the third place to the fourth (Table 4.3).
The deteriorating growth of this export
commodity was primarily because of
increasingly intense competition in
international markets following the emergence
of several new competitors, such as China,
Vietnam, and Bangladesh. Moreover, export of
shoes from Indonesia also faced dumping
allegations from the European Union
Commission, namely for certain categories of
shoes.
The export of mining commodities recorded
the highest growth rate in the reporting year
at 32.0%, compared with 29.2% in the previous
year (Table 4.4). This growth was stimulated by
the relatively high increase in the exports of
tin, aluminum, copper, and coal, in
conjunction with the increase in world demand.
For tin and coal exports in particular, the rising
demand was stimulated by the shifting of
consumers from substitute products to these
commodities which resulted in improved export
price (Chart 4.8). Many industries returned to
the choice of tin as a raw material for their
products because tin is not only recyclable but
its price is also competitive with its substitutes.
Meanwhile, the rise of coal export was primarily
owing to increase in world demand which is
reverting to coal to replace depleting oil reserves
as an alternative source of energy in the
industrial sector as well as the electric power
generating industries.
The export value of agricultural commodities,
which recorded the highest growth rate in the
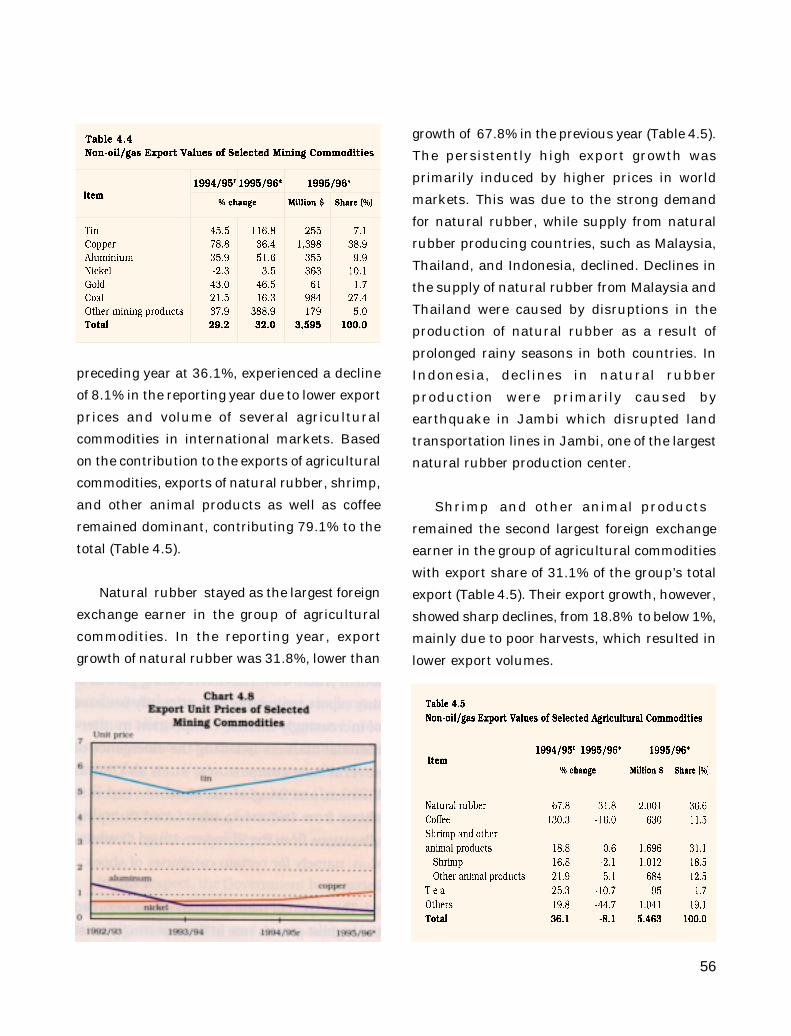
56
preceding year at 36.1%, experienced a decline
of 8.1% in the reporting year due to lower export
prices and volume of several agricultural
commodities in international markets. Based
on the contribution to the exports of agricultural
commodities, exports of natural rubber, shrimp,
and other animal products as well as coffee
remained dominant, contributing 79.1% to the
total (Table 4.5).
Natural rubber stayed as the largest foreign
exchange earner in the group of agricultural
commodities. In the reporting year, export
growth of natural rubber was 31.8%, lower than
growth of 67.8% in the previous year (Table 4.5).
The persistently high export growth was
primarily induced by higher prices in world
markets. This was due to the strong demand
for natural rubber, while supply from natural
rubber producing countries, such as Malaysia,
Thailand, and Indonesia, declined. Declines in
the supply of natural rubber from Malaysia and
Thailand were caused by disruptions in the
production of natural rubber as a result of
prolonged rainy seasons in both countries. In
Indonesia, declines in natural rubber
production were primarily caused by
earthquake in Jambi which disrupted land
transportation lines in Jambi, one of the largest
natural rubber production center.
Shrimp and other animal products
remained the second largest foreign exchange
earner in the group of agricultural commodities
with export share of 31.1% of the group’s total
export (Table 4.5). Their export growth, however,
showed sharp declines, from 18.8% to below 1%,
mainly due to poor harvests, which resulted in
lower export volumes.
57
Coffee export, which rose substantially in the
previous year, fell steeply by 16.0% in the
reporting year (Table 4.5). Its export deteriorated
since its price in international markets declined
as a result of over supply of coffee in international
markets (Chart 4.9). Concurrently, the quality of
coffee export declined because farmers in several
major coffee producing countries harvested
coffee before its season, partly due to prolonged
drought. In addition, the failure of the Association
of Coffee Producing Countries to resolve
international market conditions in its meeting
in Bali was also responsible for the decline in
the price of coffee. Based on countries of
destination, a large part of Indonesia’s coffee was
still exported to Japan, Algeria, the United States,
and Europe (Chart 4.10).
Imports
In fiscal year 1995/96, total imports
(non-oil/gas and oil/gas) rose from $34.1 billion
to $40.1 billion or 17.6%, slightly higher
compared with 17.2% in the previous year (Table
4.6). The increase in total imports was due to
the persistently high non-oil/gas import growth
especially in the first semester of the reporting
year. Non-oil/gas imports during 1995/96 grew
19.8% to $36.5 billion, slightly lower compared
with 20.4% in the previous year. The
persistently high non-oil/gas import growth is
closely related to rising private investment and
consumption. Oil/gas imports, comprising
imports by oil companies, remained at about
$3.6 billion.
A large part of non-oil/gas imports
comprised imports of raw/auxiliary materials
58
as well as capital goods with proportion of 71.8%
and 21.8% respectively (Table 4.7). The high
proportion reflected that the increase in non-
oil/gas imports was stimulated by rising
production and investment activities.
Imports of raw materials and auxiliary goods
rose 19.4 % in the reporting year, slightly higher
compared with 18.8% in the preceding year. The
growth of raw materials/auxiliary goods was
closely related to the robust domestic demand.
A large part of imports of raw materials/
auxiliary goods comprised semi-finished goods
for industries, such as chemical products, steel,
and iron, as well as plastic products. Other major
imports of raw materials/auxiliary goods were
spare parts for capital goods and transportation
vehicles (Table 4.8).
Imports of capital goods grew 14.4% in the
reporting year, much higher compared with
3.5% in the previous year, primarily due to the
higher implementation of new projects, in line
with continuously rising PMA and PMDN
approvals in the last few year. A large part of
capital goods imports comprised machinery,
generators, and electrical products, contributing
83.5% to total imports of capital goods.
Based on growth, imports of passenger cars,
containers, and equipment recorded substantial
growth (Table 4.9).
Although imports of consumer goods showed
the highest growth rate, at 50.6%, its
contribution to total non-oil/gas imports was
still low at 6,4%. The high consumer goods
import growth was reflected in the rising
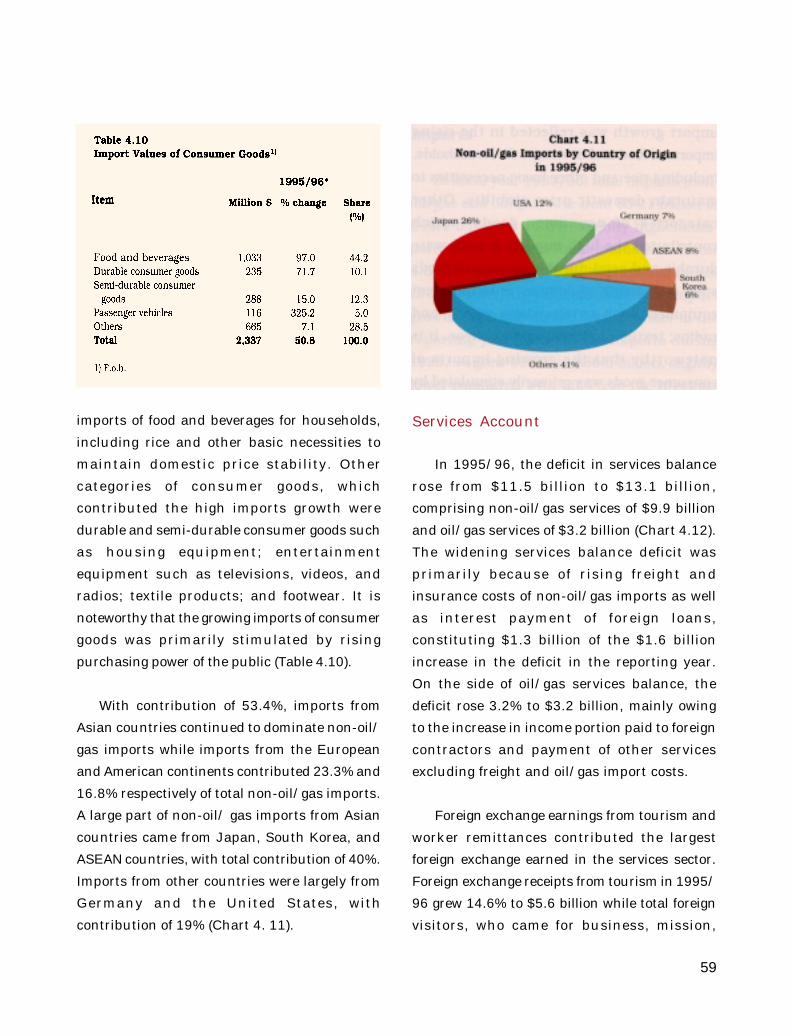
59
imports of food and beverages for households,
including rice and other basic necessities to
maintain domestic price stability. Other
categories of consumer goods, which
contributed the high imports growth were
durable and semi-durable consumer goods such
as housing equipment; entertainment
equipment such as televisions, videos, and
radios; textile products; and footwear. It is
noteworthy that the growing imports of consumer
goods was primarily stimulated by rising
purchasing power of the public (Table 4.10).
With contribution of 53.4%, imports from
Asian countries continued to dominate non-oil/
gas imports while imports from the European
and American continents contributed 23.3% and
16.8% respectively of total non-oil/gas imports.
A large part of non-oil/ gas imports from Asian
countries came from Japan, South Korea, and
ASEAN countries, with total contribution of 40%.
Imports from other countries were largely from
Germany and the United States, with
contribution of 19% (Chart 4. 11).
Services Account
In 1995/96, the deficit in services balance
rose from $11.5 billion to $13.1 billion,
comprising non-oil/gas services of $9.9 billion
and oil/gas services of $3.2 billion (Chart 4.12).
The widening services balance deficit was
primarily because of rising freight and
insurance costs of non-oil/gas imports as well
as interest payment of foreign loans,
constituting $1.3 billion of the $1.6 billion
increase in the deficit in the reporting year.
On the side of oil/gas services balance, the
deficit rose 3.2% to $3.2 billion, mainly owing
to the increase in income portion paid to foreign
contractors and payment of other services
excluding freight and oil/gas import costs.
Foreign exchange earnings from tourism and
worker remittances contributed the largest
foreign exchange earned in the services sector.
Foreign exchange receipts from tourism in 1995/
96 grew 14.6% to $5.6 billion while total foreign
visitors, who came for business, mission,
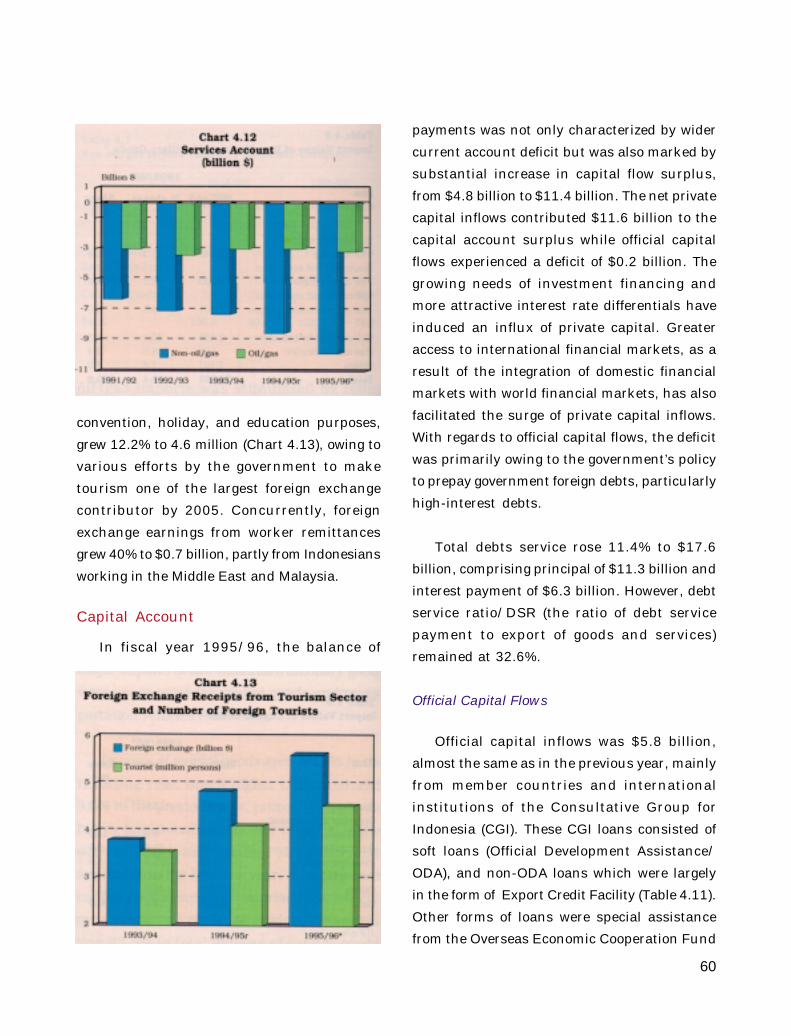
60
convention, holiday, and education purposes,
grew 12.2% to 4.6 million (Chart 4.13), owing to
various efforts by the government to make
tourism one of the largest foreign exchange
contributor by 2005. Concurrently, foreign
exchange earnings from worker remittances
grew 40% to $0.7 billion, partly from Indonesians
working in the Middle East and Malaysia.
Capital Account
In fiscal year 1995/96, the balance of
payments was not only characterized by wider
current account deficit but was also marked by
substantial increase in capital flow surplus,
from $4.8 billion to $11.4 billion. The net private
capital inflows contributed $11.6 billion to the
capital account surplus while official capital
flows experienced a deficit of $0.2 billion. The
growing needs of investment financing and
more attractive interest rate differentials have
induced an influx of private capital. Greater
access to international financial markets, as a
result of the integration of domestic financial
markets with world financial markets, has also
facilitated the surge of private capital inflows.
With regards to official capital flows, the deficit
was primarily owing to the government’s policy
to prepay government foreign debts, particularly
high-interest debts.
Total debts service rose 11.4% to $17.6
billion, comprising principal of $11.3 billion and
interest payment of $6.3 billion. However, debt
service ratio/DSR (the ratio of debt service
payment to export of goods and services)
remained at 32.6%.
Official Capital Flows
Official capital inflows was $5.8 billion,
almost the same as in the previous year, mainly
from member countries and international
institutions of the Consultative Group for
Indonesia (CGI). These CGI loans consisted of
soft loans (Official Development Assistance/
ODA), and non-ODA loans which were largely
in the form of Export Credit Facility (Table 4.11).
Other forms of loans were special assistance
from the Overseas Economic Cooperation Fund
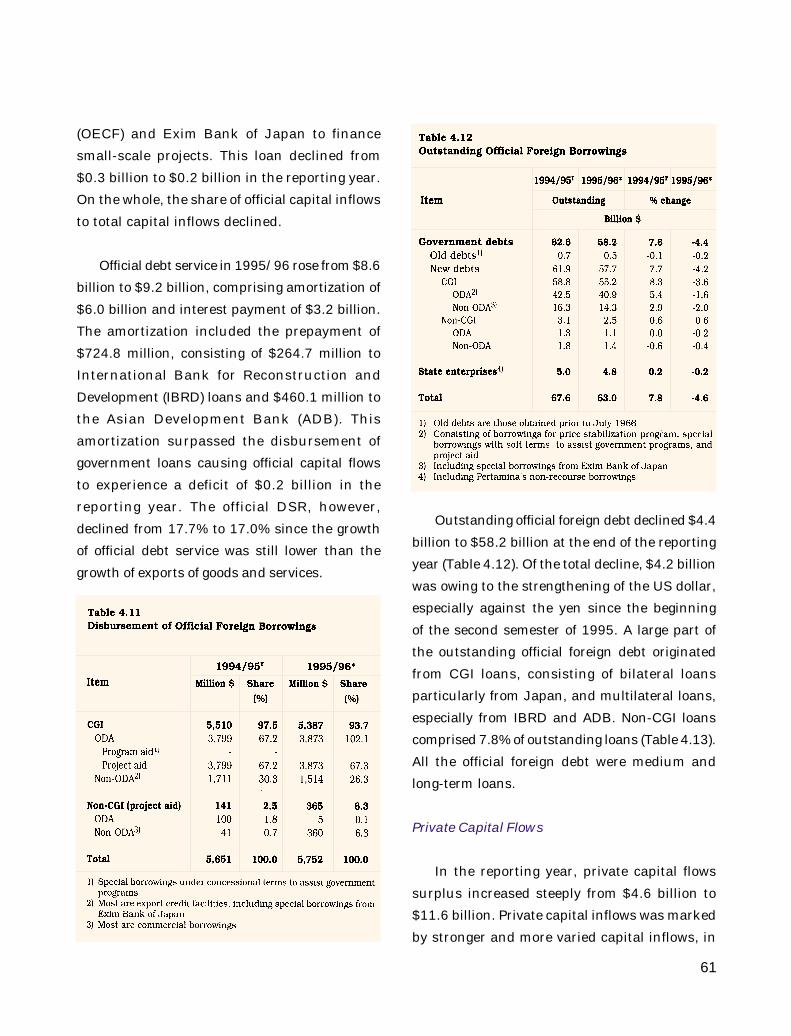
61
(OECF) and Exim Bank of Japan to finance
small-scale projects. This loan declined from
$0.3 billion to $0.2 billion in the reporting year.
On the whole, the share of official capital inflows
to total capital inflows declined.
Official debt service in 1995/96 rose from $8.6
billion to $9.2 billion, comprising amortization of
$6.0 billion and interest payment of $3.2 billion.
The amortization included the prepayment of
$724.8 million, consisting of $264.7 million to
International Bank for Reconstruction and
Development (IBRD) loans and $460.1 million to
the Asian Development Bank (ADB). This
amortization surpassed the disbursement of
government loans causing official capital flows
to experience a deficit of $0.2 billion in the
reporting year. The official DSR, however,
declined from 17.7% to 17.0% since the growth
of official debt service was still lower than the
growth of exports of goods and services.
Outstanding official foreign debt declined $4.4
billion to $58.2 billion at the end of the reporting
year (Table 4.12). Of the total decline, $4.2 billion
was owing to the strengthening of the US dollar,
especially against the yen since the beginning
of the second semester of 1995. A large part of
the outstanding official foreign debt originated
from CGI loans, consisting of bilateral loans
particularly from Japan, and multilateral loans,
especially from IBRD and ADB. Non-CGI loans
comprised 7.8% of outstanding loans (Table 4.13).
All the official foreign debt were medium and
long-term loans.
Private Capital Flows
In the reporting year, private capital flows
surplus increased steeply from $4.6 billion to
$11.6 billion. Private capital inflows was marked
by stronger and more varied capital inflows, in
62
conjunction with the growing and more diverse
needs of investment financing. Capital inflows
through PMA companies continued to record
large increases, from $4.0 billion to $7.1 billion,
in line with rising implementation of foreign
direct investment in recent years. As a result,
foreign loans, acquired by banks, state
enterprises and other private companies, rose
from $4.8 billion to $6.2 billion, comprising
primarily of medium and long-term loans. Other
forms of private capital inflows were portfolio
investments, through the sale of stocks and
bonds of Indonesian companies at the Jakarta
Stock Exchange (JSX) and abroad. Capital
inflows through the JSX rose from $0.8 billion
to $ 1.7 billion while capital inflows from abroad
declined from $3.0 billion to $2.5 billion. Of this
amount, $761 million was from the sales of PT
Telkom and PT Tambang Timah stocks abroad.
Private capital outflows comprised primarily
amortization of foreign debts, which rose from
$4.7 billion to $5.3 billion in the reporting year,
in line with the expansion of private loans in
recent years. Likewise, interest payment of
private debts also increased, from $2.5 billion to
$3.1 billion. Consequently, DSR of the private
sector rose from 14.9% to 15.6%.
International Reserves and ExchangeRates
Bank Indonesia’s international reserves at
the end of 1995/96 stood at $16.0 billion, an
increase of $2.7 billion from the balance at the
end of the previous year. This amount was
equivalent to 4.7 months of non-oil/gas imports.
To reduce the negative effects of the volatile
major world currencies, Bank Indonesia
consistently adjusted the composition of its
international reserves to the requirement of debt
servicing and imports.
As in previous years, the Government
maintained a standby loan at about $2 billion
to face unfavorable developments and to
maintain the stability of the balance of
payments. Nominal rupiah depreciation against
the US dollar was 5.35% during 1995/96, higher
than 3.38% in the previous year. Meanwhile,
against the Deutsche mark, rupiah depreciated
slightly, by 0.58%. However, rupiah appreciated
13.27% against yen as a result of the weakening
of yen against the US dollar, particularly since
the beginning of the second quarter of 1995/
96. In addition, the rupiah exchange rate in real
terms vis-a-vis the basket of currencies of
Indonesia’s major trading partners, appreciated
by around 10.24% in the reporting year.
63
Banks
General
The banking sector progressed
significantly in 1995/96 as reflected in the
rapid expansion of business activit ies
compared with the preceding year. This was
associated with the expanding domestic
economy and firmer banking consolidation,
accompanied by the improved quality of
earning assets. Rapid business development,
especially in the form of credit expansion, has
improved banking performance. The relatively
high credit growth on aggregate as well as in
selected sectors, however, may expose banks
to greater risks and spur economic
overheating. Furthermore, banks were also
confronted with rapid innovations of high-risk
financial products and intense competition as
a result of financial globalization. Following
these developments, the Government has
carried out efforts to ensure that these
problems will not negatively affect the
national banking system as well as the
macroeconomy.
To encourage banks to manage their risks,
Bank Indonesia has extended efforts to establish
a self-regulatory system as well as to ensure
that banking activities are based on prudential
principles and are consistent with
macroeconomic policies. In 1995/96, Bank
Indonesia continued efforts to prevent the
recurrence of problem banks and to
systematically as well as intensively speed up
the resolution of problem banks in the light of
current regulations. Moreover, to prepare for
globalization, individual banks are encouraged
to become more sound, larger, and more
competitive. To this end, in the reporting year
Bank Indonesia issued a number of regulations
concerning aspects of institutional as well as
banking activities (Appendix D). Moreover, to
gain synergy in banking and financial company
supervision, the Ministry of Finance and Bank
Indonesia carried out steps to improve the
supervision of financial companies (with the
exception of venture capitals), particularly
regarding the disbursements of foreign loans,
extension of bank loans, and issuance of
promissory notes.
Institutional
On the institutional aspect, Bank Indonesia
in 1995/96 has carried out efforts to enhance
the quality of the national banking system.
These efforts were aimed at increasing capacity
of banks to face intense competition due to
financial globalization as well as increase in
funding alternatives offered by non-bank
financial institutions. To that end, Bank
Indonesia has imposed more stringent criteria
for the establishment of new banks, raised the
capital requirement of foreign exchange banks,
and persuaded banks to merge and/or
consolidate.
5. BANKS, CAPITAL MARKETS,AND OTHER FINANCIAL INSTITUTIONS
64
The strict selection process was designed
to ensure better bank quality from inception.
In part, this was carried out by enforcing the
regulation which determined the criteria of
offences or breach of conduct by individuals
which may prohibit them from becoming
shareholder and/or bank manager. In the
reporting year, the number of new commercial
banks established was 5, compared with 1 in
the previous year (Table 5.1). However, because
of a merger, the number of commercial banks
at the end of 1995/96 remained at 240 banks.
Meanwhile, the number of commercial bank
offices continued to rise, to 508 offices compared
with 348 offices in the previous year (Table 5.2).
In line with efforts to increase the quality of
banks, the terms and conditions to change
status to foreign exchange banks were
tightened since September 1995. The amount
of paid-in capital stipulated under the new
regulation was raised to Rp 150 billion while
the capital adequacy ratio (CAR) was set at 10%.1)
To encourage banks to merge or consolidate,
however, the regulation also established that a
1) - Decree of the Board of Managing Directors of BankIndonesia No. 28/64/KEP/DIR, dated September 7, 1995.- Circular Letter of Bank Indonesia No. 28/4/UPPB, datedSeptember 7, 1995.
bank which has yet to meet capital requirement
terms are allowed to appeal for a foreign
exchange status provided it has merged or
consolidated with two other commercial banks.
Moreover, existing foreign exchange banks,
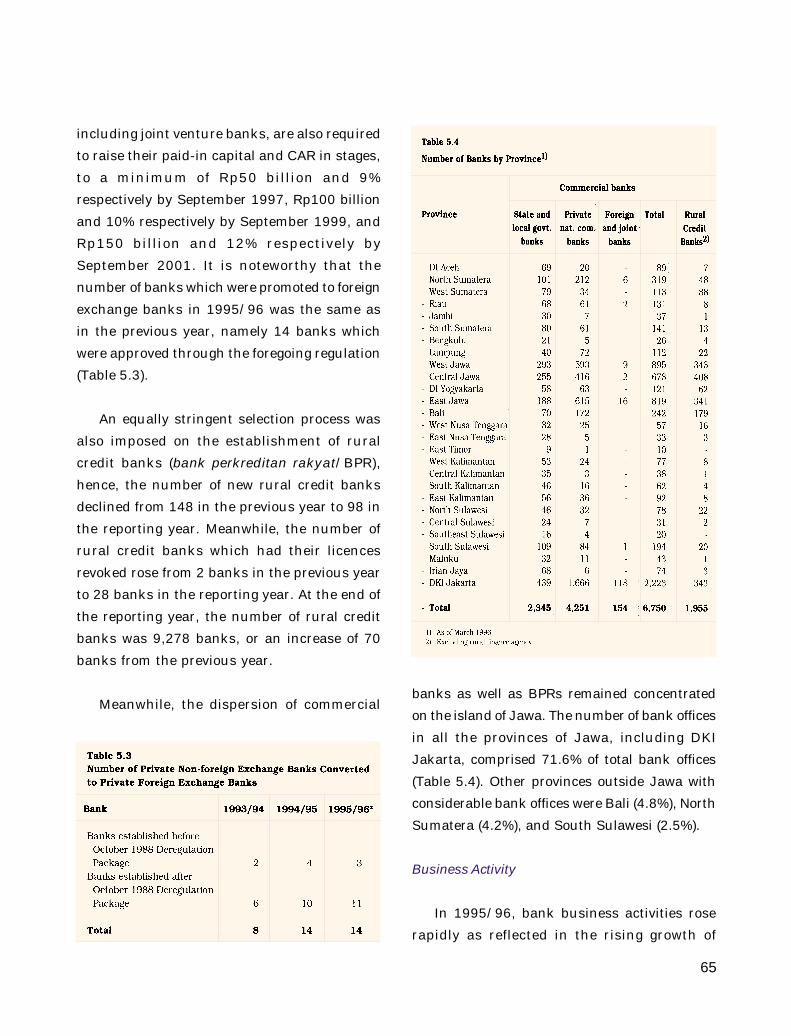
65
including joint venture banks, are also required
to raise their paid-in capital and CAR in stages,
to a minimum of Rp50 billion and 9%
respectively by September 1997, Rp100 billion
and 10% respectively by September 1999, and
Rp150 billion and 12% respectively by
September 2001. It is noteworthy that the
number of banks which were promoted to foreign
exchange banks in 1995/96 was the same as
in the previous year, namely 14 banks which
were approved through the foregoing regulation
(Table 5.3).
An equally stringent selection process was
also imposed on the establishment of rural
credit banks (bank perkreditan rakyat/BPR),
hence, the number of new rural credit banks
declined from 148 in the previous year to 98 in
the reporting year. Meanwhile, the number of
rural credit banks which had their licences
revoked rose from 2 banks in the previous year
to 28 banks in the reporting year. At the end of
the reporting year, the number of rural credit
banks was 9,278 banks, or an increase of 70
banks from the previous year.
Meanwhile, the dispersion of commercialbanks as well as BPRs remained concentrated
on the island of Jawa. The number of bank offices
in all the provinces of Jawa, including DKI
Jakarta, comprised 71.6% of total bank offices
(Table 5.4). Other provinces outside Jawa with
considerable bank offices were Bali (4.8%), North
Sumatera (4.2%), and South Sulawesi (2.5%).
Business Activity
In 1995/96, bank business activities rose
rapidly as reflected in the rising growth of
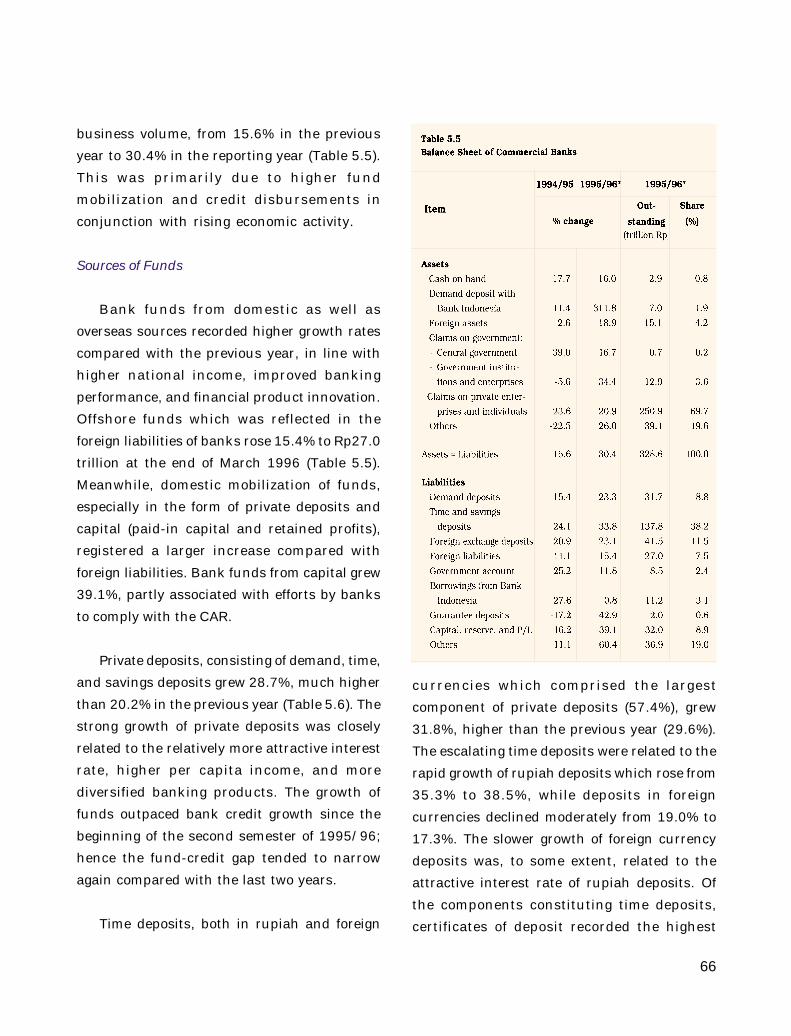
66
business volume, from 15.6% in the previous
year to 30.4% in the reporting year (Table 5.5).
This was primarily due to higher fund
mobilization and credit disbursements in
conjunction with rising economic activity.
Sources of Funds
Bank funds from domestic as well as
overseas sources recorded higher growth rates
compared with the previous year, in line with
higher national income, improved banking
performance, and financial product innovation.
Offshore funds which was reflected in the
foreign liabilities of banks rose 15.4% to Rp27.0
trillion at the end of March 1996 (Table 5.5).
Meanwhile, domestic mobilization of funds,
especially in the form of private deposits and
capital (paid-in capital and retained profits),
registered a larger increase compared with
foreign liabilities. Bank funds from capital grew
39.1%, partly associated with efforts by banks
to comply with the CAR.
Private deposits, consisting of demand, time,
and savings deposits grew 28.7%, much higher
than 20.2% in the previous year (Table 5.6). The
strong growth of private deposits was closely
related to the relatively more attractive interest
rate, higher per capita income, and more
diversified banking products. The growth of
funds outpaced bank credit growth since the
beginning of the second semester of 1995/96;
hence the fund-credit gap tended to narrow
again compared with the last two years.
Time deposits, both in rupiah and foreign
currencies which comprised the largest
component of private deposits (57.4%), grew
31.8%, higher than the previous year (29.6%).
The escalating time deposits were related to the
rapid growth of rupiah deposits which rose from
35.3% to 38.5%, while deposits in foreign
currencies declined moderately from 19.0% to
17.3%. The slower growth of foreign currency
deposits was, to some extent, related to the
attractive interest rate of rupiah deposits. Of
the components constituting time deposits,
certificates of deposit recorded the highest
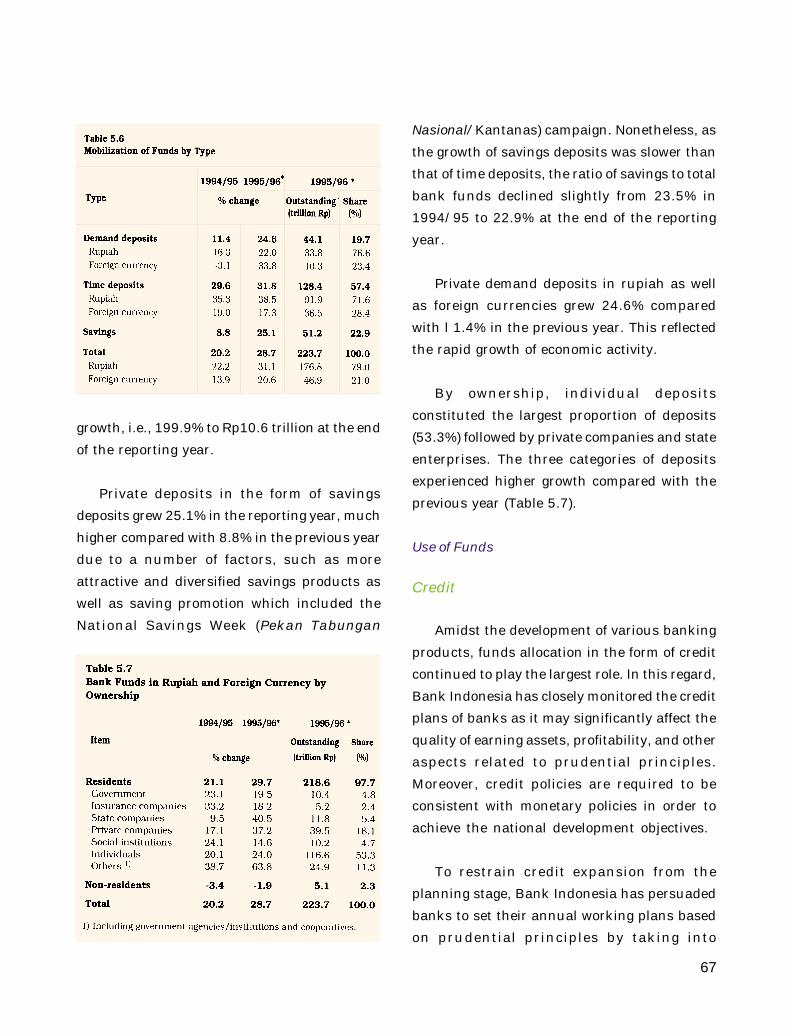
67
growth, i.e., 199.9% to Rp10.6 trillion at the end
of the reporting year.
Private deposits in the form of savings
deposits grew 25.1% in the reporting year, much
higher compared with 8.8% in the previous year
due to a number of factors, such as more
attractive and diversified savings products as
well as saving promotion which included the
National Savings Week (Pekan Tabungan
Nasional/Kantanas) campaign. Nonetheless, as
the growth of savings deposits was slower than
that of time deposits, the ratio of savings to total
bank funds declined slightly from 23.5% in
1994/95 to 22.9% at the end of the reporting
year.
Private demand deposits in rupiah as well
as foreign currencies grew 24.6% compared
with l 1.4% in the previous year. This reflected
the rapid growth of economic activity.
By ownership, individual deposits
constituted the largest proportion of deposits
(53.3%) followed by private companies and state
enterprises. The three categories of deposits
experienced higher growth compared with the
previous year (Table 5.7).
Use of Funds
Credit
Amidst the development of various banking
products, funds allocation in the form of credit
continued to play the largest role. In this regard,
Bank Indonesia has closely monitored the credit
plans of banks as it may significantly affect the
quality of earning assets, profitability, and other
aspects related to prudential principles.
Moreover, credit policies are required to be
consistent with monetary policies in order to
achieve the national development objectives.
To restrain credit expansion from the
planning stage, Bank Indonesia has persuaded
banks to set their annual working plans based
on prudential principles by taking into
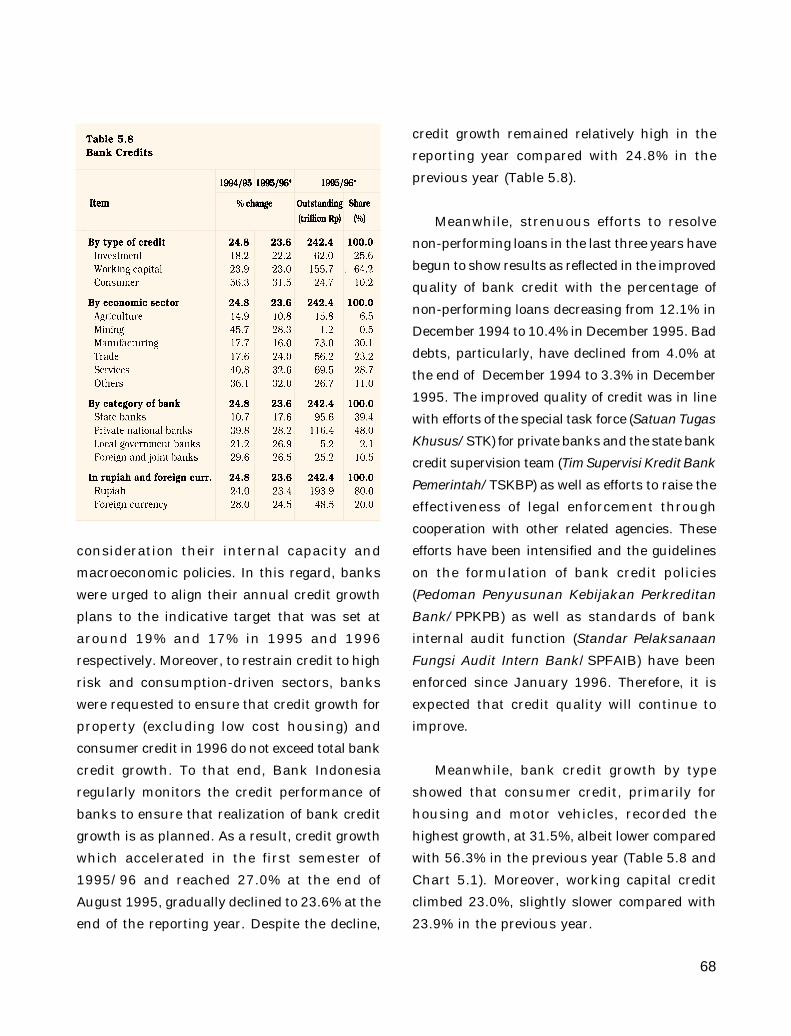
68
consideration their internal capacity and
macroeconomic policies. In this regard, banks
were urged to align their annual credit growth
plans to the indicative target that was set at
around 19% and 17% in 1995 and 1996
respectively. Moreover, to restrain credit to high
risk and consumption-driven sectors, banks
were requested to ensure that credit growth for
property (excluding low cost housing) and
consumer credit in 1996 do not exceed total bank
credit growth. To that end, Bank Indonesia
regularly monitors the credit performance of
banks to ensure that realization of bank credit
growth is as planned. As a result, credit growth
which accelerated in the first semester of
1995/96 and reached 27.0% at the end of
August 1995, gradually declined to 23.6% at the
end of the reporting year. Despite the decline,
credit growth remained relatively high in the
reporting year compared with 24.8% in the
previous year (Table 5.8).
Meanwhile, strenuous efforts to resolve
non-performing loans in the last three years have
begun to show results as reflected in the improved
quality of bank credit with the percentage of
non-performing loans decreasing from 12.1% in
December 1994 to 10.4% in December 1995. Bad
debts, particularly, have declined from 4.0% at
the end of December 1994 to 3.3% in December
1995. The improved quality of credit was in line
with efforts of the special task force (Satuan TugasKhusus/STK) for private banks and the state bank
credit supervision team (Tim Supervisi Kredit BankPemerintah/TSKBP) as well as efforts to raise the
effectiveness of legal enforcement through
cooperation with other related agencies. These
efforts have been intensified and the guidelines
on the formulation of bank credit policies
(Pedoman Penyusunan Kebijakan PerkreditanBank/PPKPB) as well as standards of bank
internal audit function (Standar PelaksanaanFungsi Audit Intern Bank/SPFAIB) have been
enforced since January 1996. Therefore, it is
expected that credit quality will continue to
improve.
Meanwhile, bank credit growth by type
showed that consumer credit, primarily for
housing and motor vehicles, recorded the
highest growth, at 31.5%, albeit lower compared
with 56.3% in the previous year (Table 5.8 and
Chart 5.1). Moreover, working capital credit
climbed 23.0%, slightly slower compared with
23.9% in the previous year.
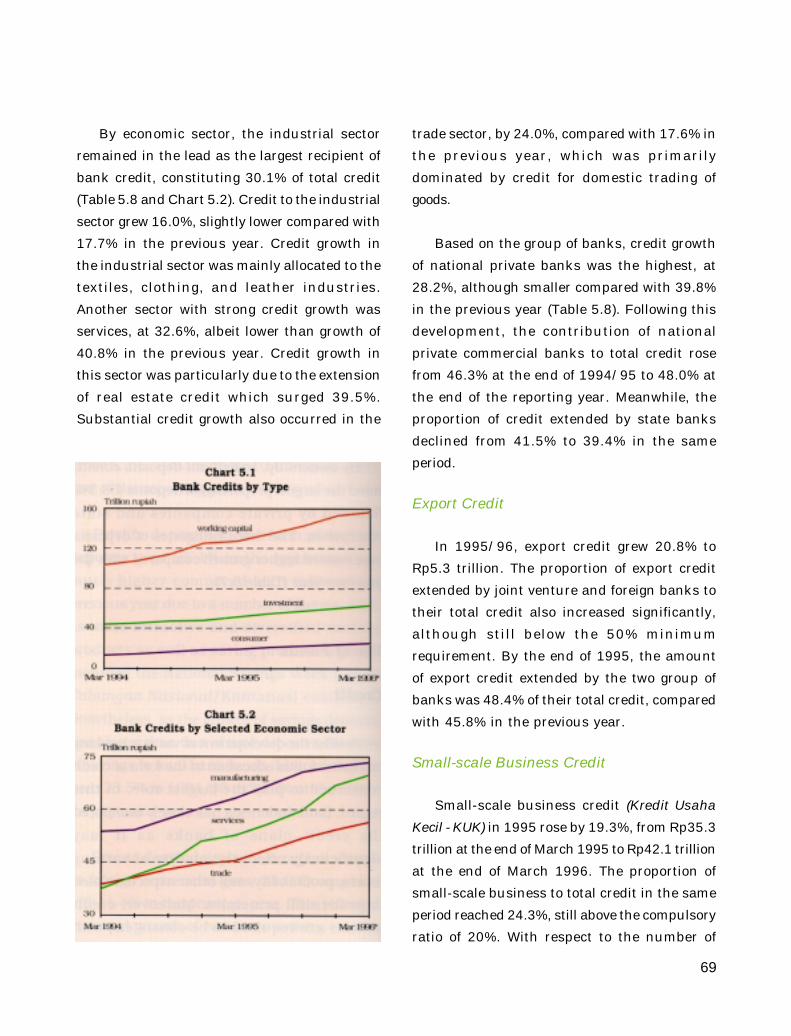
69
By economic sector, the industrial sector
remained in the lead as the largest recipient of
bank credit, constituting 30.1% of total credit
(Table 5.8 and Chart 5.2). Credit to the industrial
sector grew 16.0%, slightly lower compared with
17.7% in the previous year. Credit growth in
the industrial sector was mainly allocated to the
textiles, clothing, and leather industries.
Another sector with strong credit growth was
services, at 32.6%, albeit lower than growth of
40.8% in the previous year. Credit growth in
this sector was particularly due to the extension
of real estate credit which surged 39.5%.
Substantial credit growth also occurred in the
trade sector, by 24.0%, compared with 17.6% in
the previous year, which was primarily
dominated by credit for domestic trading of
goods.
Based on the group of banks, credit growth
of national private banks was the highest, at
28.2%, although smaller compared with 39.8%
in the previous year (Table 5.8). Following this
development, the contribution of national
private commercial banks to total credit rose
from 46.3% at the end of 1994/95 to 48.0% at
the end of the reporting year. Meanwhile, the
proportion of credit extended by state banks
declined from 41.5% to 39.4% in the same
period.
Export Credit
In 1995/96, export credit grew 20.8% to
Rp5.3 trillion. The proportion of export credit
extended by joint venture and foreign banks to
their total credit also increased significantly,
although still below the 50% minimum
requirement. By the end of 1995, the amount
of export credit extended by the two group of
banks was 48.4% of their total credit, compared
with 45.8% in the previous year.
Small-scale Business Credit
Small-scale business credit (Kredit UsahaKecil - KUK) in 1995 rose by 19.3%, from Rp35.3
trillion at the end of March 1995 to Rp42.1 trillion
at the end of March 1996. The proportion of
small-scale business to total credit in the same
period reached 24.3%, still above the compulsory
ratio of 20%. With respect to the number of
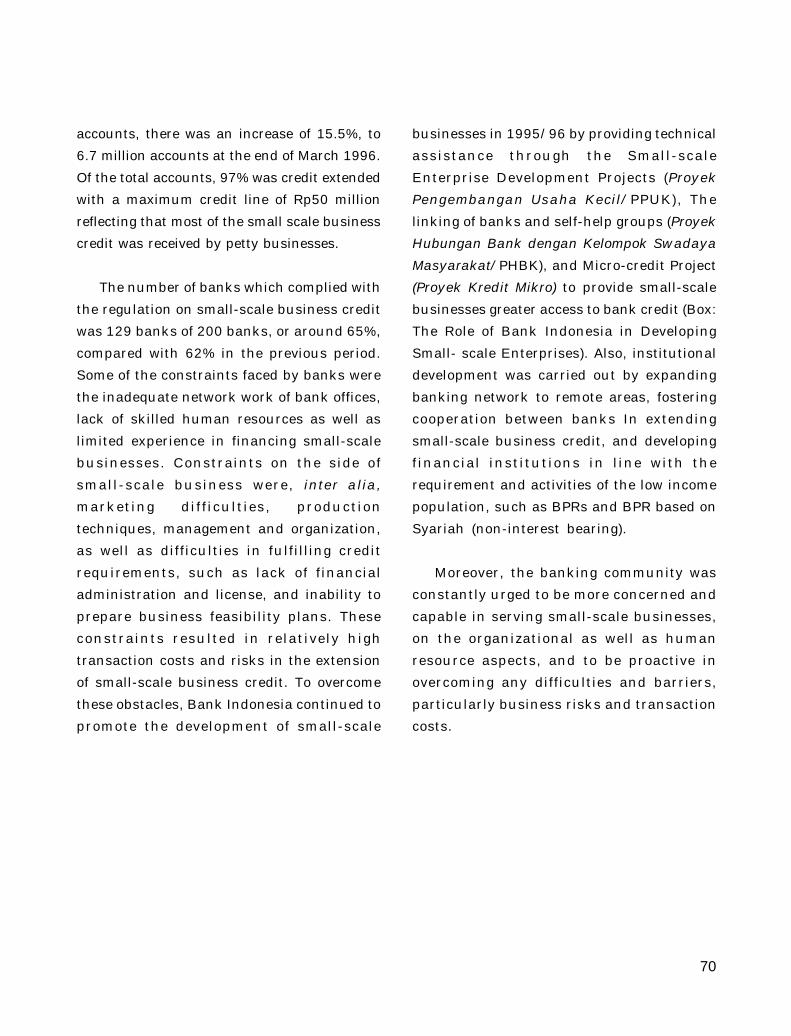
70
accounts, there was an increase of 15.5%, to
6.7 million accounts at the end of March 1996.
Of the total accounts, 97% was credit extended
with a maximum credit line of Rp50 million
reflecting that most of the small scale business
credit was received by petty businesses.
The number of banks which complied with
the regulation on small-scale business credit
was 129 banks of 200 banks, or around 65%,
compared with 62% in the previous period.
Some of the constraints faced by banks were
the inadequate network work of bank offices,
lack of skilled human resources as well as
limited experience in financing small-scale
businesses. Constraints on the side of
small-scale business were, inter alia,marketing dif f iculties, production
techniques, management and organization,
as well as difficulties in fulfilling credit
requirements, such as lack of financial
administration and license, and inability to
prepare business feasibility plans. These
constraints resulted in relatively high
transaction costs and risks in the extension
of small-scale business credit. To overcome
these obstacles, Bank Indonesia continued to
promote the development of small-scale
businesses in 1995/96 by providing technical
assistance through the Small-scale
Enterprise Development Projects (ProyekPengembangan Usaha Kecil/PPUK), The
linking of banks and self-help groups (ProyekHubungan Bank dengan Kelompok SwadayaMasyarakat/PHBK), and Micro-credit Project
(Proyek Kredit Mikro) to provide small-scale
businesses greater access to bank credit (Box:
The Role of Bank Indonesia in Developing
Small- scale Enterprises). Also, institutional
development was carried out by expanding
banking network to remote areas, fostering
cooperation between banks In extending
small-scale business credit, and developing
financial institutions in l ine with the
requirement and activities of the low income
population, such as BPRs and BPR based on
Syariah (non-interest bearing).
Moreover, the banking community was
constantly urged to be more concerned and
capable in serving small-scale businesses,
on the organizational as well as human
resource aspects, and to be proactive in
overcoming any difficulties and barriers,
particularly business risks and transaction
costs.
71
Since 1978, Bank Indonesia has provided
technical assistance through the Small-scale
Enterprise Development Project (ProyekPengembangan Usaha Kecil/PPUK) in several
areas. This project is aimed at providing
small-scale enterprises greater access to
banking services. PPUK serves both banks
and local enterprise development units (UnitPengembangan Usaha Kecil/UPUK), such as
cooperatives and self-help promotion
institutions (Lembaga PengembanganSwadaya Masyarakat/LPSM). Some of the
activities of PPUK are identifying small-scale
investment opportunities with potential to
obtain bank credit and providing training and
consultation for bank staff/bank credit
officers and UPUK’s staff/managers. Projects
initiated are conducted through a runway case
approach which is partnership between
large/medium scale business and
small-scale businesses (Proyek KemitraanUsaha Kecil Terpadu/PKUKT). This approach
initiates projects from the preparatory stage
-- consisting of identifying investment
opportunity, preparing project proposal, and
linking small-scale businesses to banks or
large/medium scale businesses -- to the
recommendation for project implementation.
The project focuses on the development of the
nucleus-plasma partnership scheme, group
financing of small-scale businesses, and
financing agro-industry/manufacturing
industry.
The PPUK has carried out a Baseline
Economic Survey (BLS) by province, aimed at
gathering information on both economic
subsectors as well as potential commodities
which may be promoted through small-scale
business development scheme. Presently,
BLS has covered all of the 27 provinces. In
addition, to further focus the development of
several potential commodities/subsectors,
partly from BLS data, PPUK has conducted
researches and presented the results in
preliminary feasibility studies (LaporanPeluang Investasi/LPI). Until the end of 1995,
the project has produced 354 LPIs.
PPUK’s activities on training and
consultation have generated, among others,
bankable proposal (Laporan PermohonanKredit/LPK), which is credit recommendation
prepared by UPUK, and bankable proposal
appraisal (Laporan Penilaian PermohonanKredit/LP2K) prepared by bank officers. Until
March 1996, 1,032 LPKs and 795 LP2Ks were
compiled. Meanwhile, 8,060 UPUK staff and
2,320 bank staff/officers responsible for
extending credit have been trained under this
program. As several large banks have
established training centers for their own
personnel, the growth of participants joining
this program have declined in the last three
years. It is noted that from January 1995 to
March 1996, based on the joint agreement
between the Governor of Bank Indonesia and
THE ROLE OF BANK INDONESIAIN DEVELOPING SMALL-SCALE ENTERPRISES
72
the Minister of Cooperatives and Small-scale
Enterpreneur Development, there were 817
field consultancy workers (petugas konsultasilapangan/PKL) and 299 coordinators/
supervisors of PKL joining this training and
consultation program.
Until the end of 1995, 4,022 projects were
identified by PPUK as eligible for small-scale
enterprise credit (KUK), of which 1,629
projects had been implemented with total
credit of Rp894.7 billion, involving 232,600
small-scale entrepreneurs, including
cooperatives. Most of these projects were
implemented through the nucleus-plasma
partnership scheme. From April 1, 1994 to
December 31, 1995, PPUK provided technical
assistance to 358 nucleus-plasma
partnership projects via PKUKT approach. Of
these, 133 projects were implemented with
total credit amounting to Rp263.9 billion and
involving 30,549 plasma. To assist banks in
broadening and improving the efficiency of
their services to small-scale businesses,
Bank Indonesia further intensified the
activities of the Banking Communication
Forum for Small-scale Enterprise
Development (Forum Komunikasi Perbankanuntuk Pengembangan Usaha Kecil/FKP-PUK).
FKP-PUK functions as a cooperation and
communication forum for banks in developing
small-scale businesses and as a medium for
promoting coordination between banks and
other institutions or agents involved in the
development of small-scale businesses. It is
expected that FKP-PUK will encourage and
facilitate banks in supporting small-scale
business development.
Most of the small-scale entrepreneurs are
micro-entrepreneurs including farmers,
majority of whom live in rural areas. In order
to encourage banks to extend credit to
microbusinesses, Bank Indonesia provides
technical assistance through the Linking
flank and Self-help Group Project (Proyek
Hubungan Bank dengan KSM/PHBK). The
pilot project of PHBK was launched in 1989 by
utilizing funds from the Government or from
external sources. Technical assistance was
provided to groups, represented by self-help
groups (Kelompok Swadaya Masyarakat/KSM),
and guided either by LPSM or banks. Prior to
the training, LPSM and bank staff had to
undergo training of trainers (ToT) and
training of facilitators (ToF) programs.1)
During the reporting year, 1,761 participants
joined ToT, 7.3% higher than in the preceding
year, and these participants have then trained
19,107 KSM managers, an increase of
180.4%. Meanwhile, ToF which was just
started in early 1995 has provided training to
243 bank staff. In the reporting year, LPSMs
joining PHBK rose relatively high to 170 or
increased by 63.5%. At the same time, 4,740
KSMs (increase of 110.5%) were served by
banks with total credit amounting to Rp33.2
billion (increase of 71.1%), which was
1) ToT is the basic training on organization and management for LPSM officers which will be later extendedto KSM managers. ToF is the training for bank staff ongroup establishment up to bank service mechanism tothe group.
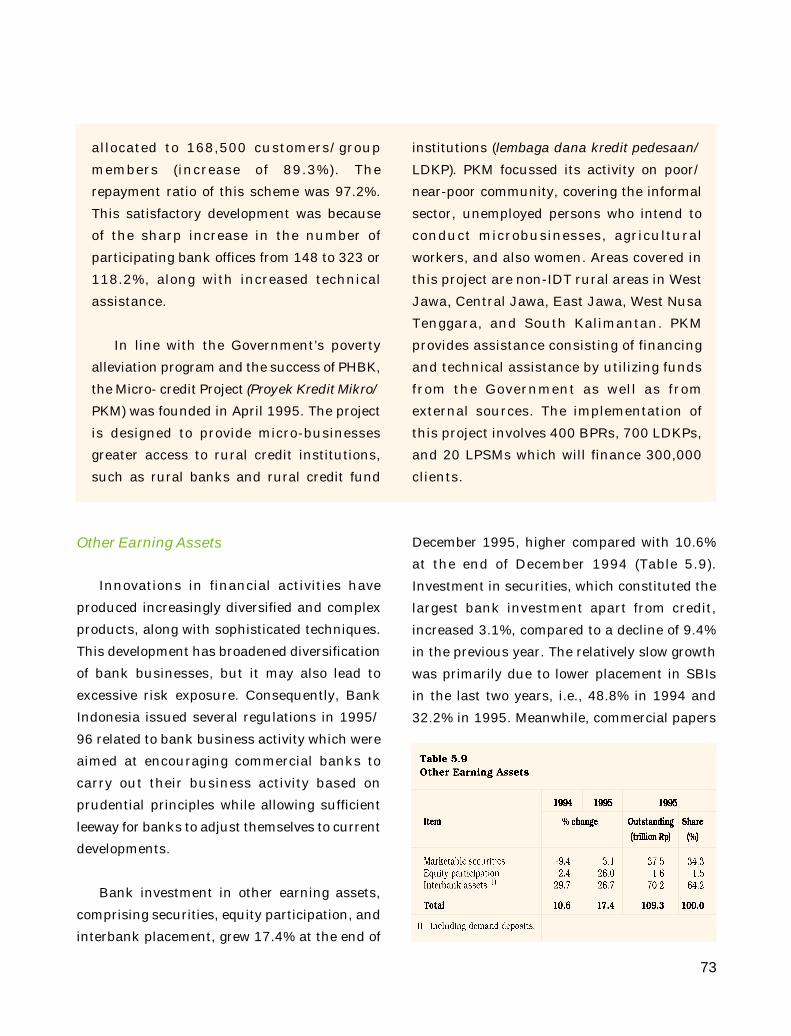
73
allocated to 168,500 customers/group
members (increase of 89.3%). The
repayment ratio of this scheme was 97.2%.
This satisfactory development was because
of the sharp increase in the number of
participating bank offices from 148 to 323 or
118.2%, along with increased technical
assistance.
In line with the Government’s poverty
alleviation program and the success of PHBK,
the Micro- credit Project (Proyek Kredit Mikro/PKM) was founded in April 1995. The project
is designed to provide micro-businesses
greater access to rural credit institutions,
such as rural banks and rural credit fund
institutions (lembaga dana kredit pedesaan/LDKP). PKM focussed its activity on poor/
near-poor community, covering the informal
sector, unemployed persons who intend to
conduct microbusinesses, agricultural
workers, and also women. Areas covered in
this project are non-IDT rural areas in West
Jawa, Central Jawa, East Jawa, West Nusa
Tenggara, and South Kalimantan. PKM
provides assistance consisting of financing
and technical assistance by utilizing funds
from the Government as well as from
external sources. The implementation of
this project involves 400 BPRs, 700 LDKPs,
and 20 LPSMs which will finance 300,000
clients.
Other Earning Assets
Innovations in financial activities have
produced increasingly diversified and complex
products, along with sophisticated techniques.
This development has broadened diversification
of bank businesses, but it may also lead to
excessive risk exposure. Consequently, Bank
Indonesia issued several regulations in 1995/
96 related to bank business activity which were
aimed at encouraging commercial banks to
carry out their business activity based on
prudential principles while allowing sufficient
leeway for banks to adjust themselves to current
developments.
Bank investment in other earning assets,
comprising securities, equity participation, and
interbank placement, grew 17.4% at the end of
December 1995, higher compared with 10.6%
at the end of December 1994 (Table 5.9).
Investment in securities, which constituted the
largest bank investment apart from credit,
increased 3.1%, compared to a decline of 9.4%
in the previous year. The relatively slow growth
was primarily due to lower placement in SBIs
in the last two years, i.e., 48.8% in 1994 and
32.2% in 1995. Meanwhile, commercial papers
74
(CPs) grew rapidly in the reporting year. To
reduce bank risks on CP transactions, Bank
Indonesia issued regulations covering the
terms and conditions regarding the issuance
and trading of securities through commercial
banks in Indonesia (Box: Provisions on
Commercial Paper Trading). Furthermore, Bank
Indonesia also passed regulations on securities
collectibility, which were partly meant to adjust
the criteria of collectibility with regulations on
the terms of issuance and trading of commercial
papers.2) Outstanding CPs in rupiah and foreign
currencies at the end of March 1996 was Rp1.3
trillion and $1.4 billion, respectively.
2) Circular Letter of Bank Indonesia No. 28/11/UPPB, datedFebruary 26, 1996.
In view of the buoyant issuance of
commercial papers (CPs) and extensive
involvement of the banking system in the
issuance as well as trading of CPs and in order
to lower the risks borne by banks, Bank
Indonesia introduced rules concerning the
issuance and trading of CPs through
commercial banks in Indonesia. The
provisions are stipulated in the Decree of the
Board of Managing Directors of Bank
Indonesia No. 28/52/KEP/DIR and Circular
Letter of Bank Indonesia No. 28/49/UPG,
dated August 11, 1995 respectively. The
regulations standardize the guidelines for the
market and provide protection for investors.
In general, the issuance and trading of CPs
can be conducted without involving commercial
banks, except when banks are required to act
as paying agents. Therefore, CPs could be
issued and traded through securities
companies as the arranger, issuing agent, and
dealer. Nevertheless, with the assignment of
commercial bank as a paying agent, the CPs
issued and traded must fulfill the regulations.
The main provisions regarding the
issuance and trading of CPs through
commercial bank in Indonesia are as follows.
1. Some of the requirements regarding the
issuance and trading of CPs through
commercial banks in Indonesia are:
a. Maximum term of 270 days
b. Issued by non-bank Indonesian legal
entities
c. Must obtain investment grade rating by
a domestic security rating agency
licensed by the Capital Market
Supervisory Agency (currently, PT
Pefindo)
2. Banks acting as the arranger, issuing
agent, paying agent, dealer, or investor of
CPs must belong to the sound category of
banking soundness and capitalization over
the last 12 months.
3. The purchase of CPs by a bank for its own
position should be treated as purchases of
securities, not as amortization of existing
credits to CPs’ issuers, either directly or
indirectly.
PROVISIONS ON COMMERCIAL PAPER TRADING
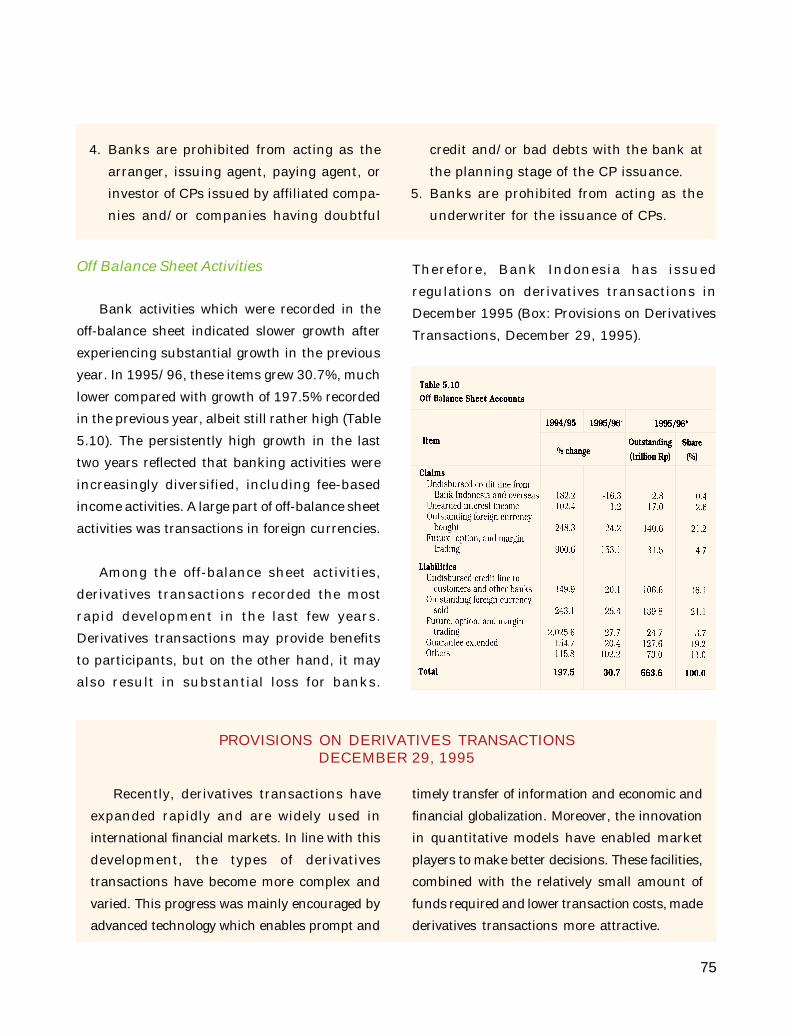
75
4. Banks are prohibited from acting as the
arranger, issuing agent, paying agent, or
investor of CPs issued by affiliated compa-
nies and/or companies having doubtful
credit and/or bad debts with the bank at
the planning stage of the CP issuance.
5. Banks are prohibited from acting as the
underwriter for the issuance of CPs.
Recently, derivatives transactions have
expanded rapidly and are widely used in
international financial markets. In line with this
development, the types of derivatives
transactions have become more complex and
varied. This progress was mainly encouraged by
advanced technology which enables prompt and
timely transfer of information and economic and
financial globalization. Moreover, the innovation
in quantitative models have enabled market
players to make better decisions. These facilities,
combined with the relatively small amount of
funds required and lower transaction costs, made
derivatives transactions more attractive.
PROVISIONS ON DERIVATIVES TRANSACTIONSDECEMBER 29, 1995
Off Balance Sheet Activities
Bank activities which were recorded in the
off-balance sheet indicated slower growth after
experiencing substantial growth in the previous
year. In 1995/96, these items grew 30.7%, much
lower compared with growth of 197.5% recorded
in the previous year, albeit still rather high (Table
5.10). The persistently high growth in the last
two years reflected that banking activities were
increasingly diversified, including fee-based
income activities. A large part of off-balance sheet
activities was transactions in foreign currencies.
Among the off-balance sheet activities,
derivatives transactions recorded the most
rapid development in the last few years.
Derivatives transactions may provide benefits
to participants, but on the other hand, it may
also result in substantial loss for banks.
Therefore, Bank Indonesia has issued
regulations on derivatives transactions in
December 1995 (Box: Provisions on Derivatives
Transactions, December 29, 1995).
76
In general, derivatives transactions are
defined as contracts or agreements on pay-
ments of which value is derived from under-
lying instruments, such as interest rates,
exchange rates, commodities, stocks, and
indices, with or without fund movements.
Derivatives products are numerous but in
general they can be classified as forward, fu-
ture, swap, and option. These various prod-
ucts are created in anticipation of the move-
ment of underlying instruments in the fu-
ture. Derivatives transactions are used,
among others, for hedging assets and liabili-
ties, particularly against exchange rate and
interest rate risks, and profit motivated
speculation as well as funding. On the other
hand, banks conducting these transactions
may be exposed to excessive risks, as suf-
fered by several domestic and foreign finan-
cial institutions. The loss is mainly caused
by weaknesses in internal management, in-
sufficient supervision, and authority abuse.
More diverse derivatives transactions and
more complex products could, in turn, lead to
higher risks for banks .
Following these developments, Bank In-
donesia introduced provisions on derivatives
transactions through the Decree of the Board
of Managing Directors of Bank Indonesia on
December 29, 1995. The provisions are de-
signed to provide banks with minimum guide-
lines to limit the risks that may be incurred
from derivatives transactions and to ensure
that banks apply prudent principles and sound
banking practices.
The key points of the provisions on deriva-
tives transactions are as follows.
1. In principle, banks may conduct only de-
rivatives transactions dealing with foreign
exchange and interest rates. Transactions
relating to stocks are also allowed, but only
on a case-by-case basis with the approval
of Bank Indonesia.
2. The bank’s managing directors must be re-
sponsible for conducting sound derivatives
transactions and for actual and potential
loss, while the board of commissioners of
banks is responsible for supervising deriva-
tives transactions.
3. Derivatives transactions must be based on
sound banking practices and in compliance
with prudential principles. Furthermore,
banks must have written guidelines on
derivatives transactions.
4. The cutting loss for derivatives transac-
tions conducted for the bank’s own posi-
tion must not exceed 10% of its capital. For
derivatives transactions conducted for the
position of the bank’s customers without
fund movement, the transactions must
meet a margin deposit of at least 10% of
the transaction ceiling, unless the mar-
gin deposit has been specifically set. If the
margin deposit has reached 50% of the
original balance, the customer must bear
the difference.
5. In recording derivatives transactions, banks
must comply with the Special Standard for
Indonesian Banking Accounting (StandarKhusus Akuntansi Perbankan Indonesia/
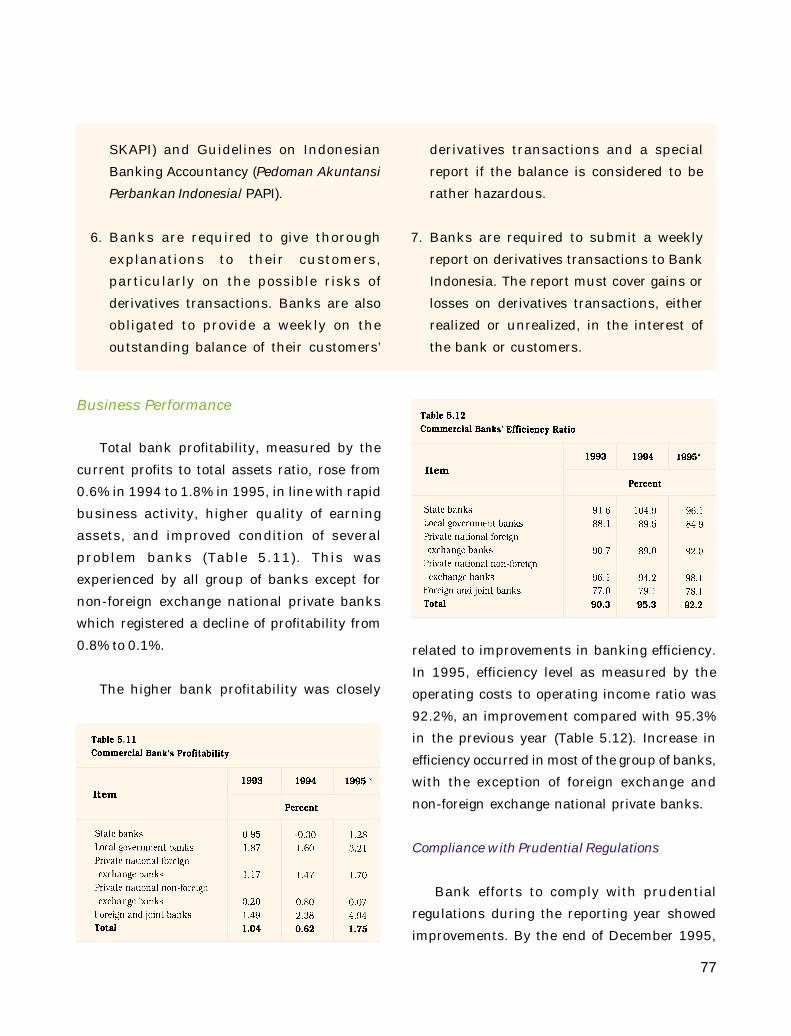
77
SKAPI) and Guidelines on Indonesian
Banking Accountancy (Pedoman AkuntansiPerbankan Indonesia/PAPI).
6. Banks are required to give thorough
explanations to their customers,
particularly on the possible risks of
derivatives transactions. Banks are also
obligated to provide a weekly on the
outstanding balance of their customers’
derivatives transactions and a special
report if the balance is considered to be
rather hazardous.
7. Banks are required to submit a weekly
report on derivatives transactions to Bank
Indonesia. The report must cover gains or
losses on derivatives transactions, either
realized or unrealized, in the interest of
the bank or customers.
Business Performance
Total bank profitability, measured by the
current profits to total assets ratio, rose from
0.6% in 1994 to 1.8% in 1995, in line with rapid
business activity, higher quality of earning
assets, and improved condition of several
problem banks (Table 5.11). This was
experienced by all group of banks except for
non-foreign exchange national private banks
which registered a decline of profitability from
0.8% to 0.1%.
The higher bank profitability was closely
related to improvements in banking efficiency.
In 1995, efficiency level as measured by the
operating costs to operating income ratio was
92.2%, an improvement compared with 95.3%
in the previous year (Table 5.12). Increase in
efficiency occurred in most of the group of banks,
with the exception of foreign exchange and
non-foreign exchange national private banks.
Compliance with Prudential Regulations
Bank efforts to comply with prudential
regulations during the reporting year showed
improvements. By the end of December 1995,
78
average CAR was 11.9%, higher than the 8.0%
ratio stipulated in the May 1993 policy package.
The relatively high CAR indicated that
commercial banks possess substantial
capability to expand their/activities and to cover
potential losses. However, compared with CAR
of 12.5% at the end of December 1994, it has
declined slightly because bank assets grew
faster than capital. It is noteworthy that at the
end of 1995, only 8.8% commercial banks were
unable to meet the CAR requirement, an
improvement compared with 9.2% in the
previous year.
In December 1995, the average loan to
deposit ratio (LDR) of banks was 81.1%,
compared with 81.2% in the previous year. This
LDR, which was below 110%, indicated that in
general, bank liquidity remained sound.
Declining LDR was experienced by most banks,
with the exception of joint venture banks and
foreign banks which recorded relatively small
increase.
In the meantime, the percentage of banks
which did not comply with the legal lending limit
(LLL) regulation declined from 19.2% at the end
of 1994 to 13.8% at the end of 1995 due to
intensive by bank efforts, especially in lowering
credit commitment limit, increasing loan
collection, and sharing risk. Furthermore, Bank
Indonesia also carried out various measures in
the reporting year to encourage banks to comply
with the LLL regulation. Banks violating the LLL
were required to prepare specific action plans
to resolve their credit violation, followed by a
time schedule for its resolution. Moreover,
violation of the legal lending limit is one of the
factors considered in evaluating Bank Annual
Work Plan (RKAT) for 1996.
At the end of 1995, the percentage of banks
which did not comply with the net open position
(NOP) requirement dropped to 7.1%, compared
with 17.0% at the end of 1994. Most of the group
of banks showed improved compliance with the
NOP requirement.
Resolution of Problem Banks
During 1995/96, Bank Indonesia continued
its efforts to resolve problem banks pursuant to
article 37 of Act No.7, 1992 in the frame work of
maintaining a sound banking system, including
preventing systemic risks which may
undermine public as well as international
confidence toward Indonesian banks. Efforts to
enhance soundness are conducted on a
case-by-case basis, suited to the condition and
characteristics of each bank. The problem banks
were required to prepare an action plan, to be
used as guidelines for banks as well as for Bank
Indonesia in implementing and evaluating the
rescue plans.
In order to enhance the effectiveness of
efforts to rescue problem banks, Bank
Indonesia issued regulations in the reporting
year on the temporary takeover of banks by
Bank Indonesia.3) This regulation enabled Bank
3) - Decree of the Board of Managing Directors of BankIndonesia No. 28/76/KEP/DIR, dated October 3, 1995.- Circular Letter of Bank Indonesia No. 28/61/UPPB, datedOctober 24, 1995.
79
Indonesia to carry out intensive evaluation on
the various problems and divergences. In
general, rescue efforts may be carried through
restructurization of capital, management
substitution or takeover, management
assistance, providing possibility of merger, and/
or entry of new investors. In 1995, problems
faced by 17 commercial banks and 10 BPRs were
resolved. Major crises were averted and the
banks gradually recovered to the state of sound
and fairly sound.
Capital Market
Similar to the rapid progress experienced by
the banking sector, in 1995/96 the capital
market showed a bullish trend, as reflected in
the growing composite stock price index, the
number of listed companies, market
capitalization, and share trading. In the
meantime, the Government continued efforts
to improve the performance and disclosure of
capital market activities.
To foster a more conducive climate for the
national capital market as well as strengthen
the legal foundation for the development of
capital markets in the future, the Government
passed a new act on the capital market in
November 1995 (Box: Act No. 8 of 1995 on Capital
Market). Following this act, the Government
encouraged the establishment of mutual funds
to raise the domestic investor base.
Furthermore, in order to facilitate bourse
liquidity and as an initial step to ease
limitations on foreign ownership, mutual fund
companies may now be 100% foreign owned and
each investor may own only a maximum limit
of 1% of mutual funds.4) Foreign ownership of
the shares of securities companies was raised
to a maximum 85% of paid-in capital.5)
To protect investors, the Capital Market
Supervisory Agency (Badan Pengawas PasarModal/Bapepam) issued a regulation stipulating
that public companies should avoid speculative
derivatives transactions as they may result in
material risks and contradict business
objectives as stated in their establishment
acts.6) Meanwhile, to create openness in the
buying of shares in capital markets, Bapepam
enforced the requirement to offer tender on the
purchase of shares by certain parties through
the stock exchange which exceeded 20%.7)
Bapepam also required bond issuing companies
to provide adequate disclosure regarding
utilization of funds raised from the public.8)
Previously, this regulation was only effective for
companies issuing shares.
4) Decree of the Minister of Finance No. 646/KMK.010/1995, dated December 30, 1995.
5) Decree of the Minister of Finance No. 647/KMK.010/1995, dated December 30, 1995.
6) Circular Letter of the Head of the Capital MarketSupervisory Agency No. Kep 1560/PM/1995.
7) Decree of the Head of the Capital Market SupervisoryAgency No. Kep 85/PM/1996, dated January 24, 1996.
8) - Decree of the Head of the Capital Market SupervisoryAgency No. Kep 81/PM/1996, dated January 17, 1996.
80
Act No. 8 concerning the capital market
was passed on November 10, 1995 and was
enacted on January 1, 1996. It is aimed at
supporting capital markets in facing future
challenges. This act provides market
participants with legal certainties in
conducting activities in the capital markets.
It also protects investors especially against
harmful practices.
Under the act, Bapepam has the authority
and responsibilities to regulate and supervise
capital market participants. In addition, the act
regulates the conduct of supporting institutions
and professionals participating in the capital
market; issuers and public companies;
reporting and information disclosure; fraud
market manipulation and insider trading;
procedures of examination and investigation
in the capital market; and administrative and
legal sanctions and violations.
With respect to activities in the capital
markets, the act regulates, among others, the
requirements and procedures of licensing;
approval and registration of institutions and
professionals of capital markets covering
bourse, clearing and underwriting
institutions, and deposit and settlement
institutions, mutual fund, securities
companies and their representatives,
investment advisors and the securities
administration bureau, representatives of
underwriters, representatives of securities
brokers, representatives of investment
managers, custodian banks, trustees and
supporting professionals of the capital market
(accountants, legal advisors, valuators, and
notaries).
To implement the act, which consists of
18 chapters and 116 articles, the Government
has issued two government regulations, three
decrees of the Minister of Finance, each
dated December 30, 1995 as follows.
- Government Regulation No. 45 of 1995
concerning the conduct of capital market
activities.
- Government Regulation No. 46 of 1995
concerning the procedures of examination
in capital markets.
- Decree of the Minister of Finance No. 645/
KMK.010/1995 to annul the Decree of the
Minister of Finance No. 1548/KMK.013/
1990 on the capital market which was
amended by the Decree of the Minister of
Finance No. 284/KMK.010/1995.
- Decree of the Minister of Finance No. 646/
KMK.010/1995 on share ownership or unit
share of mutual funds by foreign investors.
Decree of the Minister of Finance No. 647/
KMK.010/1995 on limitation of foreign
ownership of securities companies.
ACT NO. 8 OF 1995ON THE CAPITAL MARKETS
81
In addition, Bapepam also issued
regulations.
Some major points included in those
regulations are as follows.
a. Commercial banks may act as custodians
and trustees with the approval from
Bapepam.
b. Issuers may make public offerings only after
they have submitted to Bapepam the
statement of registration for public offering
or selling of stocks and after the registration
statement has been effective. This provision
is not valid for the issuances of debt
instruments with maturity not exceeding
one year, the issuance of certificates of
deposit, the issuance of insurance policies,
the offering of securities which are issued
and guaranteed by the Government of
Indonesia, or offering of other securities
which are specified by Bapepam.
c. Insiders of the prospective or existing pub-
lic companies who may have insider infor-
mation are prohibited from buying or sell-
ing securities of those companies. They are
also prohibited from buying or selling secu-
rities of other companies which carry out
transactions with the particular companies.
d. Since securities companies play an important
role in capital markets, securities companies
which act as underwriters, brokers, and
investment managers are prohibited from
being managed directly or indirectly by
individuals who have committed offences
and/or have been punished for violations
in the financial sector, especially in the
capital market, or by individuals lacking
high moral values. Furthermore, securities
companies are also obligated to have a
certain amount of paid-in capital and net
working capital in order to enhance the
performance of the capital market.
In the reporting year, the capital market
showed buoyant activity, in line with improved
bourse infrastructure, especially the use of
computers to raise transparency and efficiency
of trading as well as to increase the
comprehensiveness and accuracy of trade
information services. Bourse automation began
in May 1995 with the commencement of the
Jakarta Automated Trading System (JATS). To
enhance the effectiveness of bourse information
for market participants, share indices were
reclassified into 10 sectors (agriculture, mining,
property, utilities and infrastructure, finance,
trade and services, base industries,
miscellaneous industries, consumer goods
industries, and manufacturing) with base index
of 100 points since January 1996. The new stock
indices complemented the existing composite
stock indices. Furthermore, as a result of
cooperation between Bank Indonesia and the
Indonesian Parallel Bourse in April 1995, data
from the Parallel Information Bond System (PIBS)
was integrated into the money market
information center (Pusat Informasi Pasar Uang/PIPU) network. Following this integration,
commercial banks and money market brokers
in particular, may obtain information on bond
trading in secondary markets.
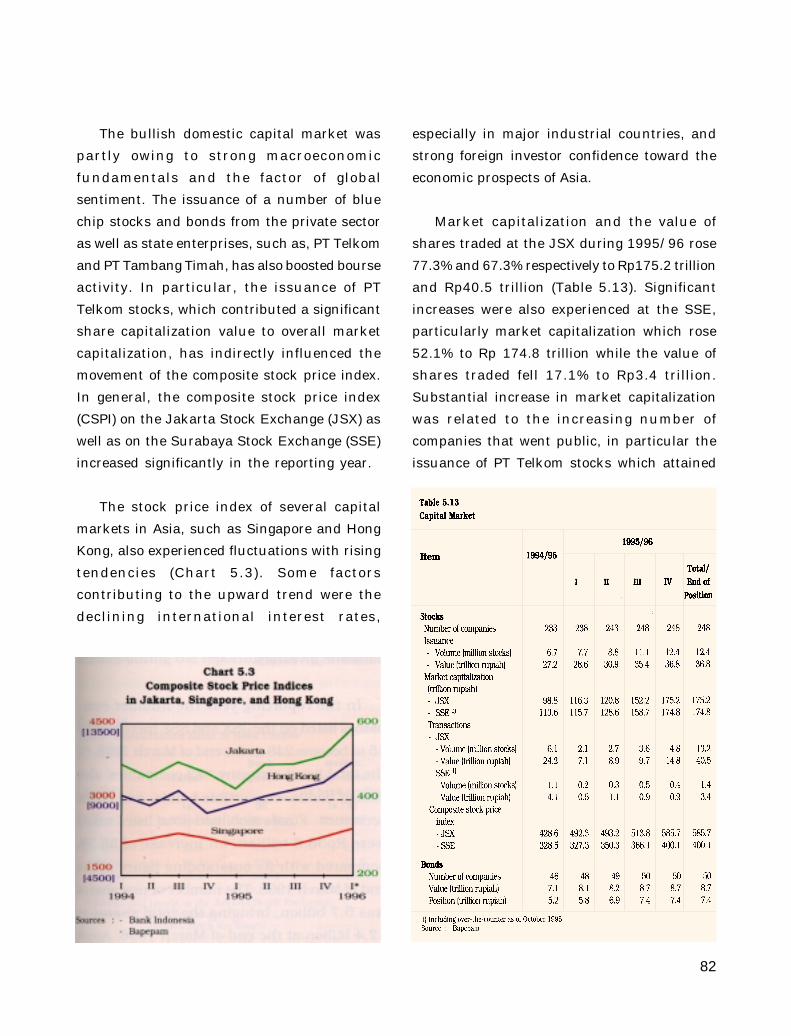
82
The bullish domestic capital market was
partly owing to strong macroeconomic
fundamentals and the factor of global
sentiment. The issuance of a number of blue
chip stocks and bonds from the private sector
as well as state enterprises, such as, PT Telkom
and PT Tambang Timah, has also boosted bourse
activity. In particular, the issuance of PT
Telkom stocks, which contributed a significant
share capitalization value to overall market
capitalization, has indirectly influenced the
movement of the composite stock price index.
In general, the composite stock price index
(CSPI) on the Jakarta Stock Exchange (JSX) as
well as on the Surabaya Stock Exchange (SSE)
increased significantly in the reporting year.
The stock price index of several capital
markets in Asia, such as Singapore and Hong
Kong, also experienced fluctuations with rising
tendencies (Chart 5.3). Some factors
contributing to the upward trend were the
declining international interest rates,
especially in major industrial countries, and
strong foreign investor confidence toward the
economic prospects of Asia.
Market capitalization and the value of
shares traded at the JSX during 1995/96 rose
77.3% and 67.3% respectively to Rp175.2 trillion
and Rp40.5 trillion (Table 5.13). Significant
increases were also experienced at the SSE,
particularly market capitalization which rose
52.1% to Rp 174.8 trillion while the value of
shares traded fell 17.1% to Rp3.4 trillion.
Substantial increase in market capitalization
was related to the increasing number of
companies that went public, in particular the
issuance of PT Telkom stocks which attained
83
19.4% of total JSX market capitalization at the
end of March 1996.
Other positive bourse developments was the
rise of the JSX as well as SSE composite stock
price indices in general. The JSX composite
stock price index rose from 428.6 points to 585.7
points, while on the SSE, it climbed from 328.5
points to 400.1 points. This favorable develop-
ment was closely related to the strengthening
of the price of a number of blue chip stocks in
the capital market, including PT Telkom and
several cigarette and finance industries.
The domestic capital market was also
influenced by financial globalization. In part,
this phenomenon was reflected in the
fluctuation of the composite stock price index
at the end of August 1995. Bourse activity
weakened, among others, as a result of the
strengthening of the USD/yen exchange rate
and the weakening of regional bourses. This
resulted in selling pressures on foreign
investors and stimulated them to shift their
portfolios from capital markets to foreign
exchange markets.
In December 1995, especially in the second
week, there was a release of shares by foreign
investors due to weak trading activity as well
as to expectations that foreign investment
managers will reduce their activities toward the
end of the year. This development resulted in a
price correction which caused the composite
stock price indices to plunge to below the
psychological limit of 500 points. This correction
was further aggravated by investors’ negative
reactions toward Bank Indonesia’s decision to
raise the reserve requirement to 3%. The
market was concerned that the higher reserve
requirement will result in higher interest rates
and reduced credit expansion which will later
decrease the profit level. This has caused the
shares of banks to experience correction with
resultant impacts on the shares of other
sectors.
At the end of the first and second week of
January 1996, share trading and the CSPI
increased. This favorable development was
partly because of the Government’s
commitment to consistently implement prudent
monetary policies which received enthusiastic
responses from market participants, especially
foreign investors who immediately purchased
big shares in large amounts, followed by
domestic investors.
In the reporting year the number companies
listed on the JSX and SSE increased by 15 to
become 248 at the end of March 1996. Of the
total listed company, 23 companies also issued
bonds, convertible bonds, and credit securities.
Funds mobilized (total listed value) were Rp36.8
trillion, an increase of 35.3% compared with its
outstanding figure at the end of March 1995.
The number of new shares was 5.7 billion,
bringing the total shares to 12.4 billion at the
end of March 1996. Apart from the registration
of new shares, the growth in shares was also
from an increase of rights issues.
In the reporting year, the number of bond
issuing companies rose from 46 to 50 with total
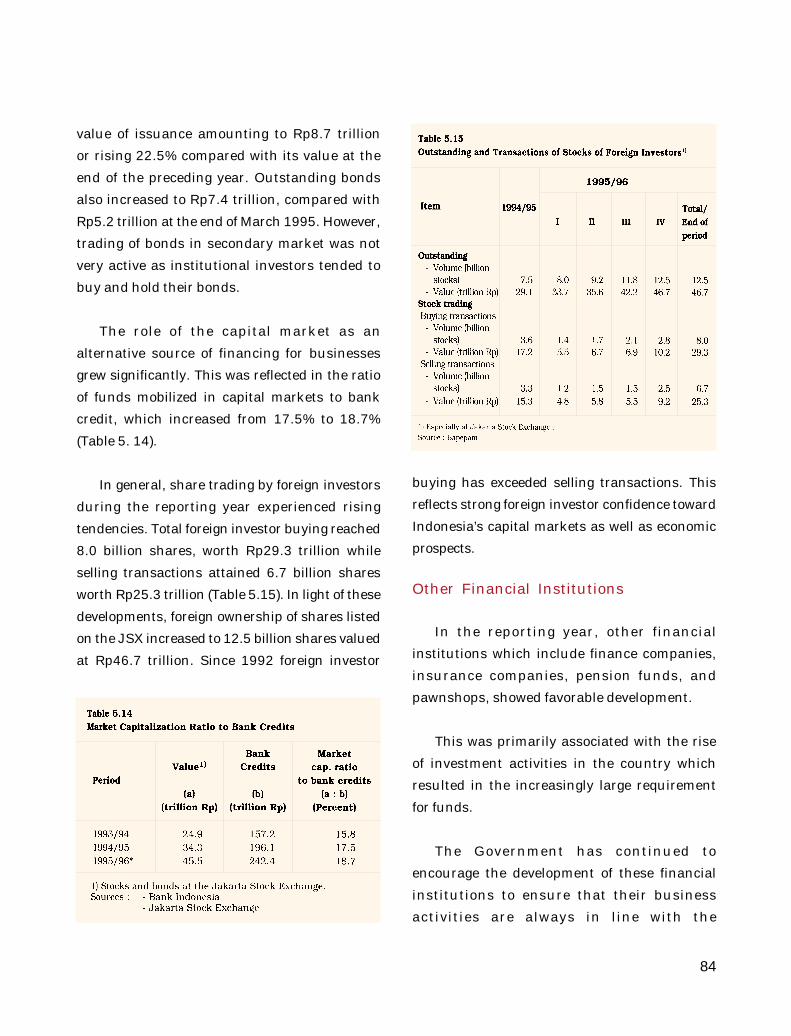
84
value of issuance amounting to Rp8.7 trillion
or rising 22.5% compared with its value at the
end of the preceding year. Outstanding bonds
also increased to Rp7.4 trillion, compared with
Rp5.2 trillion at the end of March 1995. However,
trading of bonds in secondary market was not
very active as institutional investors tended to
buy and hold their bonds.
The role of the capital market as an
alternative source of financing for businesses
grew significantly. This was reflected in the ratio
of funds mobilized in capital markets to bank
credit, which increased from 17.5% to 18.7%
(Table 5. 14).
In general, share trading by foreign investors
during the reporting year experienced rising
tendencies. Total foreign investor buying reached
8.0 billion shares, worth Rp29.3 trillion while
selling transactions attained 6.7 billion shares
worth Rp25.3 trillion (Table 5.15). In light of these
developments, foreign ownership of shares listed
on the JSX increased to 12.5 billion shares valued
at Rp46.7 trillion. Since 1992 foreign investor
buying has exceeded selling transactions. This
reflects strong foreign investor confidence toward
Indonesia’s capital markets as well as economic
prospects.
Other Financial Institutions
In the reporting year, other financial
institutions which include finance companies,
insurance companies, pension funds, and
pawnshops, showed favorable development.
This was primarily associated with the rise
of investment activities in the country which
resulted in the increasingly large requirement
for funds.
The Government has continued to
encourage the development of these financial
institutions to ensure that their business
activities are always in line with the
85
achievement of macroeconomic objectives. This
effort was carried out, among others, by
improving regulations on the administration
and supervision of these institutions.
Finance Companies
Strong demand for funds to finance robust
economic activity has significantly promoted
the role of finance companies whose core
business is to supply funds and/or capital goods.
In line with this progress, the number of
finance companies and their business volume
have increased rapidly. To enhance the
supervision of finance companies, in December
1995, the Government passed regulations on
the supervision of finance companies, covering
borrowings, equity investment, and reporting.9)
Supervision will be carried out by the Ministry
of Finance in cooperation with Bank
Indonesia.10) Moreover, considering that the
number of finance companies presently is
adequate for the requirements of the national
economy, issuance of licenses for new finance
companies has ceased with effect from
December 1995.11)
Based on the new regulation, finance
companies are allowed to borrow up to a
maximum of 15 times its networth, of which
borrowing from overseas is limited to 5 times of
its networth after deducted by its equity
participation. With respect to subordinated
borrowings, each borrowing with minimum
maturity of 5 years will be considered as
networth up to a maximum limit of 50% of
paid-in capital.
Finance companies are permitted to carry
out equity participation only in finance
companies. Maximum equity participation in
any single company may not exceed 25% of the
paid-in capital of the finance company, and total
equity participation is limited to 40% of its
networth. In this respect, finance companies
which have carried out equity participation in
non-financial companies and/or have carried
out equity participation exceeding the
maximum limit set, were required to adjust
their equity investment to the new regulation
within a prescribed time frame.
The new regulation also stipulated that with
the exception of venture capital companies, all
finance companies will be supervised by the
Ministry of Finance with the assistance of Bank
Indonesia. The scope of the supervision
encompasses withdrawal of offshore borrowings,
channelling of bank credit, issuance of
promissory notes, quality of earning assets, and
the accuracy as well as the completeness of
report. With regards to supervision activities,
finance companies are required to submit
monthly financial statement, semi-annual
business report, and annual audited financial
statements. With this reporting system,
information on the compliance of finance
companies toward regulations, their impact on
9) Decree of the Minister of Finance No. 606/KMK.017/1995,dated December 19, 1995.
10) Joint Decree of the Minister of Finance and the Governorof Bank Indonesia No. 607/KMK.017/1995 and No. 28/9/KEP/BI, dated December 19, 1995.
11) Decree of the Minister of Finance No.609/KMK.017/1995,dated December 21, 1995.
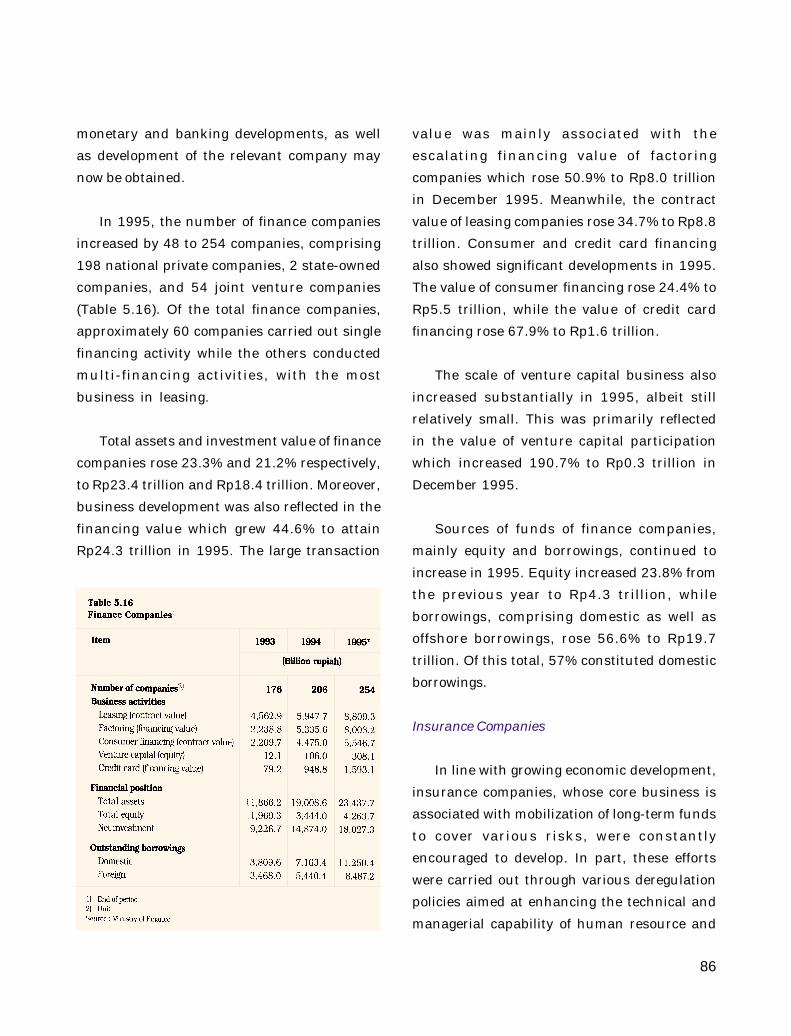
86
monetary and banking developments, as well
as development of the relevant company may
now be obtained.
In 1995, the number of finance companies
increased by 48 to 254 companies, comprising
198 national private companies, 2 state-owned
companies, and 54 joint venture companies
(Table 5.16). Of the total finance companies,
approximately 60 companies carried out single
financing activity while the others conducted
multi-financing activities, with the most
business in leasing.
Total assets and investment value of finance
companies rose 23.3% and 21.2% respectively,
to Rp23.4 trillion and Rp18.4 trillion. Moreover,
business development was also reflected in the
financing value which grew 44.6% to attain
Rp24.3 trillion in 1995. The large transaction
value was mainly associated with the
escalating financing value of factoring
companies which rose 50.9% to Rp8.0 trillion
in December 1995. Meanwhile, the contract
value of leasing companies rose 34.7% to Rp8.8
trillion. Consumer and credit card financing
also showed significant developments in 1995.
The value of consumer financing rose 24.4% to
Rp5.5 trillion, while the value of credit card
financing rose 67.9% to Rp1.6 trillion.
The scale of venture capital business also
increased substantially in 1995, albeit still
relatively small. This was primarily reflected
in the value of venture capital participation
which increased 190.7% to Rp0.3 trillion in
December 1995.
Sources of funds of finance companies,
mainly equity and borrowings, continued to
increase in 1995. Equity increased 23.8% from
the previous year to Rp4.3 trillion, while
borrowings, comprising domestic as well as
offshore borrowings, rose 56.6% to Rp19.7
trillion. Of this total, 57% constituted domestic
borrowings.
Insurance Companies
In line with growing economic development,
insurance companies, whose core business is
associated with mobilization of long-term funds
to cover various risks, were constantly
encouraged to develop. In part, these efforts
were carried out through various deregulation
policies aimed at enhancing the technical and
managerial capability of human resource and
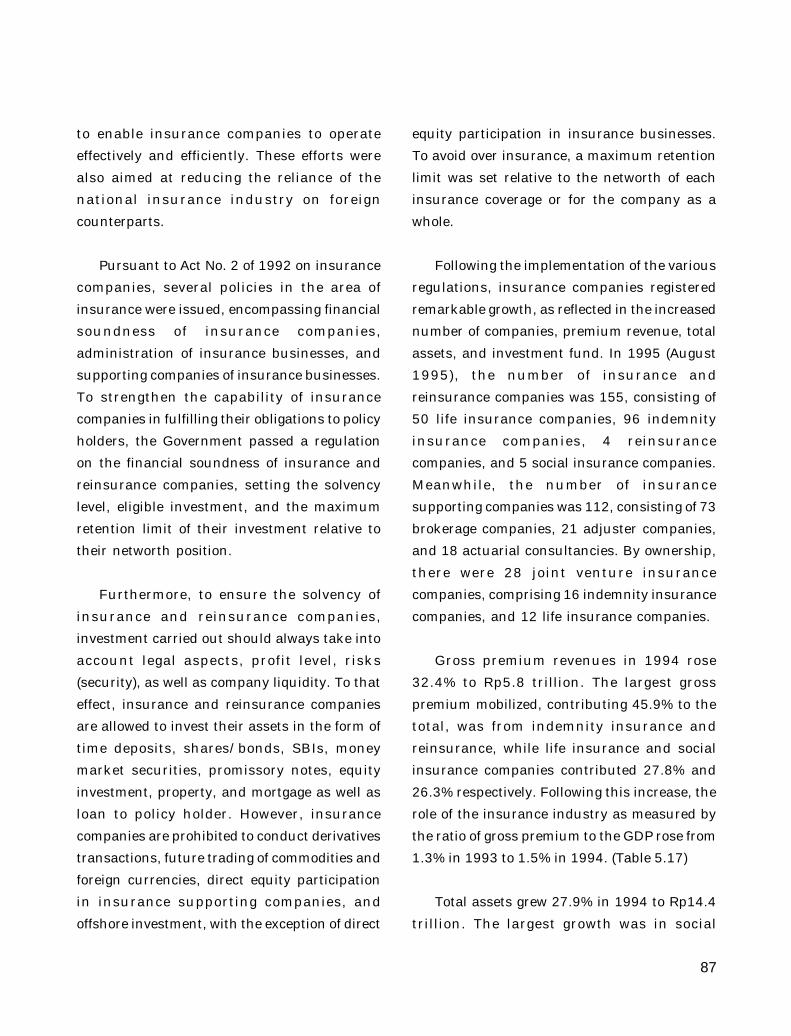
87
to enable insurance companies to operate
effectively and efficiently. These efforts were
also aimed at reducing the reliance of the
national insurance industry on foreign
counterparts.
Pursuant to Act No. 2 of 1992 on insurance
companies, several policies in the area of
insurance were issued, encompassing financial
soundness of insurance companies,
administration of insurance businesses, and
supporting companies of insurance businesses.
To strengthen the capability of insurance
companies in fulfilling their obligations to policy
holders, the Government passed a regulation
on the financial soundness of insurance and
reinsurance companies, setting the solvency
level, eligible investment, and the maximum
retention limit of their investment relative to
their networth position.
Furthermore, to ensure the solvency of
insurance and reinsurance companies,
investment carried out should always take into
account legal aspects, profit level, risks
(security), as well as company liquidity. To that
effect, insurance and reinsurance companies
are allowed to invest their assets in the form of
time deposits, shares/bonds, SBIs, money
market securities, promissory notes, equity
investment, property, and mortgage as well as
loan to policy holder. However, insurance
companies are prohibited to conduct derivatives
transactions, future trading of commodities and
foreign currencies, direct equity participation
in insurance supporting companies, and
offshore investment, with the exception of direct
equity participation in insurance businesses.
To avoid over insurance, a maximum retention
limit was set relative to the networth of each
insurance coverage or for the company as a
whole.
Following the implementation of the various
regulations, insurance companies registered
remarkable growth, as reflected in the increased
number of companies, premium revenue, total
assets, and investment fund. In 1995 (August
1995), the number of insurance and
reinsurance companies was 155, consisting of
50 life insurance companies, 96 indemnity
insurance companies, 4 reinsurance
companies, and 5 social insurance companies.
Meanwhile, the number of insurance
supporting companies was 112, consisting of 73
brokerage companies, 21 adjuster companies,
and 18 actuarial consultancies. By ownership,
there were 28 joint venture insurance
companies, comprising 16 indemnity insurance
companies, and 12 life insurance companies.
Gross premium revenues in 1994 rose
32.4% to Rp5.8 trillion. The largest gross
premium mobilized, contributing 45.9% to the
total, was from indemnity insurance and
reinsurance, while life insurance and social
insurance companies contributed 27.8% and
26.3% respectively. Following this increase, the
role of the insurance industry as measured by
the ratio of gross premium to the GDP rose from
1.3% in 1993 to 1.5% in 1994. (Table 5.17)
Total assets grew 27.9% in 1994 to Rp14.4
trillion. The largest growth was in social
88
insurance companies, i.e., 45.1%, followed by
27.9% from life insurance companies, and
27.0% from indemnity insurance companies
and reinsurance companies. Likewise, funds
invested by insurance companies in 1994 rose
21.3% to Rp10.7 trillion or constituting 74.3%
of total assets owned by insurance companies.
Most of the funds was invested in time deposits,
amounting to Rp6.3 trillion (59.0%), while the
balance was in stocks and bonds of Rp1.6 trillion
(15%), and in SBIs, land and building, equity
investment, as well as other investment
amounting to Rp2.8 trillion (26%).
Notwithstanding its promising development,
the capital of national insurance companies is
relatively limited. As a consequence, many
national insurance companies carried out
reinsurance abroad. This is reflected in the
growing deficit of net insurance transactions
in the balance of payments, from Rp398.7 billion
in 1993 to Rp457.0 billion in 1994.
Pension Funds
In line with the increasingly important role
of pension funds in mobilizing long term funds,
the government continued to encourage their
development. This effort was also carried out
in view that pension funds are beneficial to
their members, promote work motivation and
enthusiasm, which will in turn increase
national productivity. In part, this is conducted
by improving the administration programs of
pension funds through a series of regulations
as a follow-up to Act No. 11 of 1992 on pension
funds. Subsequently, it was determined that
pension funds may only be invested in the form
of SBPUs issued by legal entities that do not
constitute the founder the partners of the
relevant pension fund companies, and by legal
entities which are not affiliated to the founder
or partners of the pension fund companies.
Furthermore, pension funds may invest in
unlimited amount of shares and bonds in capital
markets in Indonesia.
Until the end of 1994, there were 521
companies that had submitted applications for
establishing pension funds according to the new
act, consisting of 104 state-owned pension funds
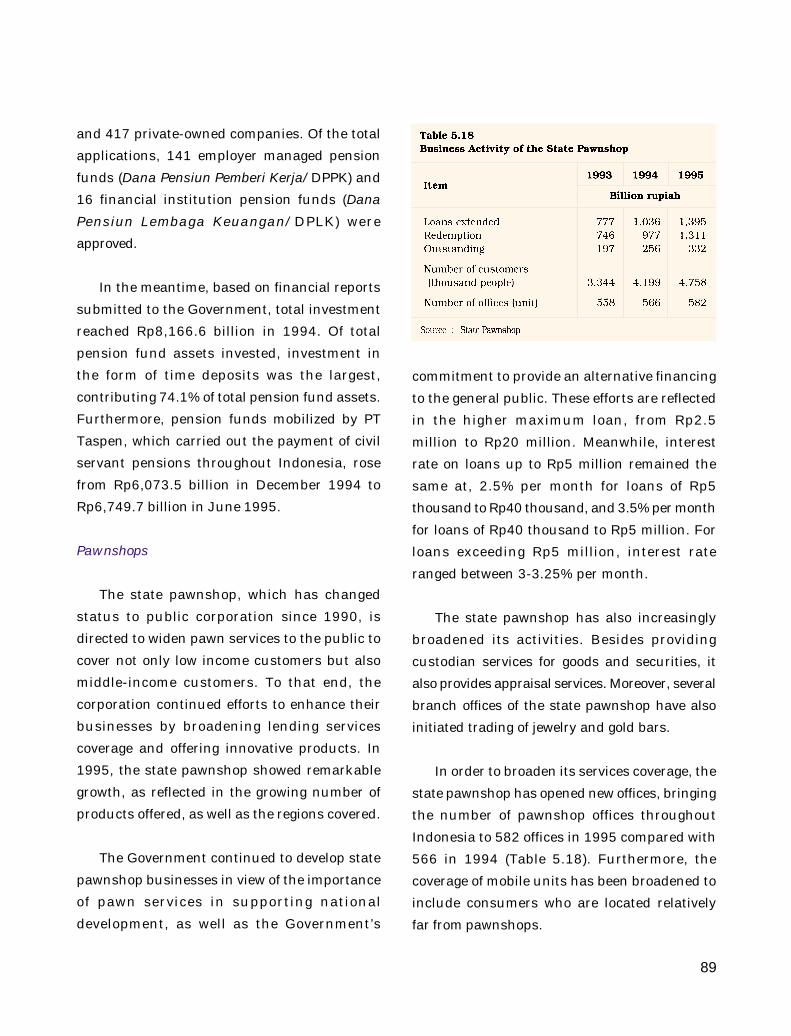
89
and 417 private-owned companies. Of the total
applications, 141 employer managed pension
funds (Dana Pensiun Pemberi Kerja/DPPK) and
16 financial institution pension funds (DanaPensiun Lembaga Keuangan/DPLK) were
approved.
In the meantime, based on financial reports
submitted to the Government, total investment
reached Rp8,166.6 billion in 1994. Of total
pension fund assets invested, investment in
the form of time deposits was the largest,
contributing 74.1% of total pension fund assets.
Furthermore, pension funds mobilized by PT
Taspen, which carried out the payment of civil
servant pensions throughout Indonesia, rose
from Rp6,073.5 billion in December 1994 to
Rp6,749.7 billion in June 1995.
Pawnshops
The state pawnshop, which has changed
status to public corporation since 1990, is
directed to widen pawn services to the public to
cover not only low income customers but also
middle-income customers. To that end, the
corporation continued efforts to enhance their
businesses by broadening lending services
coverage and offering innovative products. In
1995, the state pawnshop showed remarkable
growth, as reflected in the growing number of
products offered, as well as the regions covered.
The Government continued to develop state
pawnshop businesses in view of the importance
of pawn services in supporting national
development, as well as the Government’s
commitment to provide an alternative financing
to the general public. These efforts are reflected
in the higher maximum loan, from Rp2.5
million to Rp20 million. Meanwhile, interest
rate on loans up to Rp5 million remained the
same at, 2.5% per month for loans of Rp5
thousand to Rp40 thousand, and 3.5% per month
for loans of Rp40 thousand to Rp5 million. For
loans exceeding Rp5 million, interest rate
ranged between 3-3.25% per month.
The state pawnshop has also increasingly
broadened its activities. Besides providing
custodian services for goods and securities, it
also provides appraisal services. Moreover, several
branch offices of the state pawnshop have also
initiated trading of jewelry and gold bars.
In order to broaden its services coverage, the
state pawnshop has opened new offices, bringing
the number of pawnshop offices throughout
Indonesia to 582 offices in 1995 compared with
566 in 1994 (Table 5.18). Furthermore, the
coverage of mobile units has been broadened to
include consumers who are located relatively
far from pawnshops.
90
In line with the growing public’s demand for
funds, loans extended rose 34.6% to Rp1.4 trillion
in 1995. This loan was extended to 4.8 million
customers, not only for consumption purposes,
but also for working capital requirements.
In the framework of developing pawn
businesses, the government has set the target
of developing the state pawnshop for the next
five years. The target covers, among others, an
average annual 20% growth in loans extended,
the availability of new branch offices in districts
or sub-districts, particularly outside Jawa,
which are not likely to be serviced by other credit
institutions, increasing the number of
customers, and raising loan ceiling in stages.
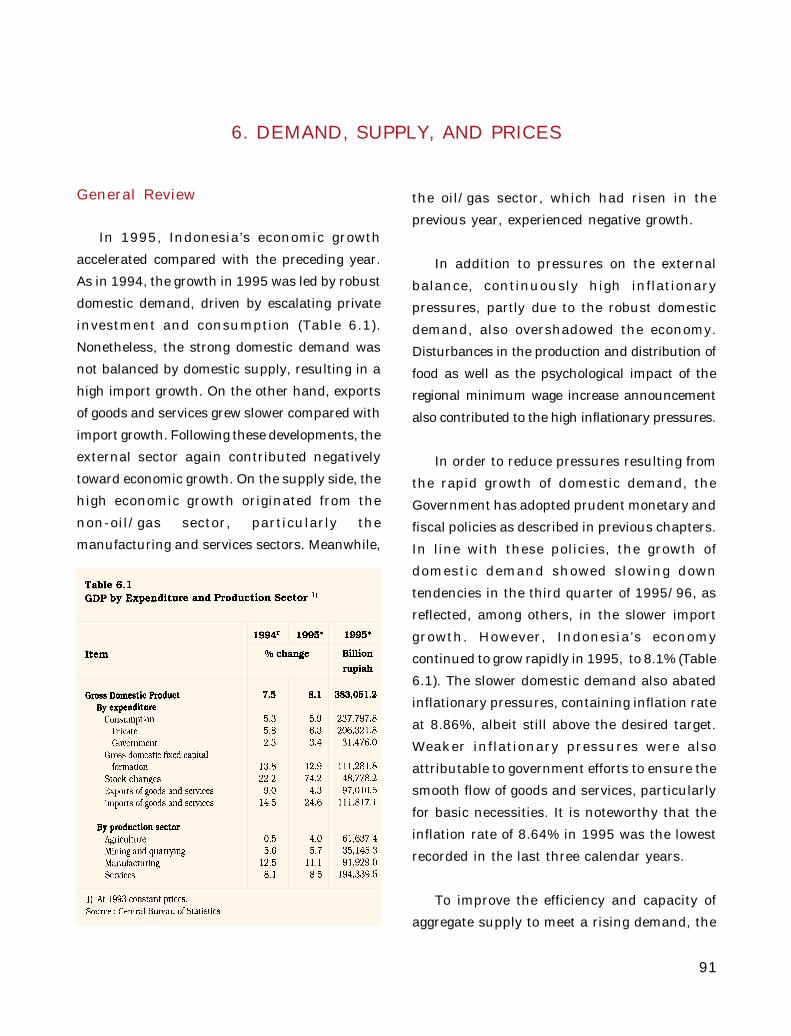
9 1
General Review
In 1995, Indonesia’s economic growth
accelerated compared with the preceding year.
As in 1994, the growth in 1995 was led by robust
domestic demand, driven by escalating private
investment and consumption (Table 6.1).
Nonetheless, the strong domestic demand was
not balanced by domestic supply, resulting in a
high import growth. On the other hand, exports
of goods and services grew slower compared with
import growth. Following these developments, the
external sector again contributed negatively
toward economic growth. On the supply side, the
high economic growth originated from the
non-oil/gas sector, particularly the
manufacturing and services sectors. Meanwhile,
the oil/gas sector, which had risen in the
previous year, experienced negative growth.
In addition to pressures on the external
balance, continuously high inflationary
pressures, partly due to the robust domestic
demand, also overshadowed the economy.
Disturbances in the production and distribution of
food as well as the psychological impact of the
regional minimum wage increase announcement
also contributed to the high inflationary pressures.
In order to reduce pressures resulting from
the rapid growth of domestic demand, the
Government has adopted prudent monetary and
fiscal policies as described in previous chapters.
In line with these policies, the growth of
domestic demand showed slowing down
tendencies in the third quarter of 1995/96, as
reflected, among others, in the slower import
growth. However, Indonesia’s economy
continued to grow rapidly in 1995, to 8.1% (Table
6.1). The slower domestic demand also abated
inflationary pressures, containing inflation rate
at 8.86%, albeit still above the desired target.
Weaker inflationary pressures were also
attributable to government efforts to ensure the
smooth flow of goods and services, particularly
for basic necessities. It is noteworthy that the
inflation rate of 8.64% in 1995 was the lowest
recorded in the last three calendar years.
To improve the efficiency and capacity of
aggregate supply to meet a rising demand, the
6. DEMAND, SUPPLY, AND PRICES
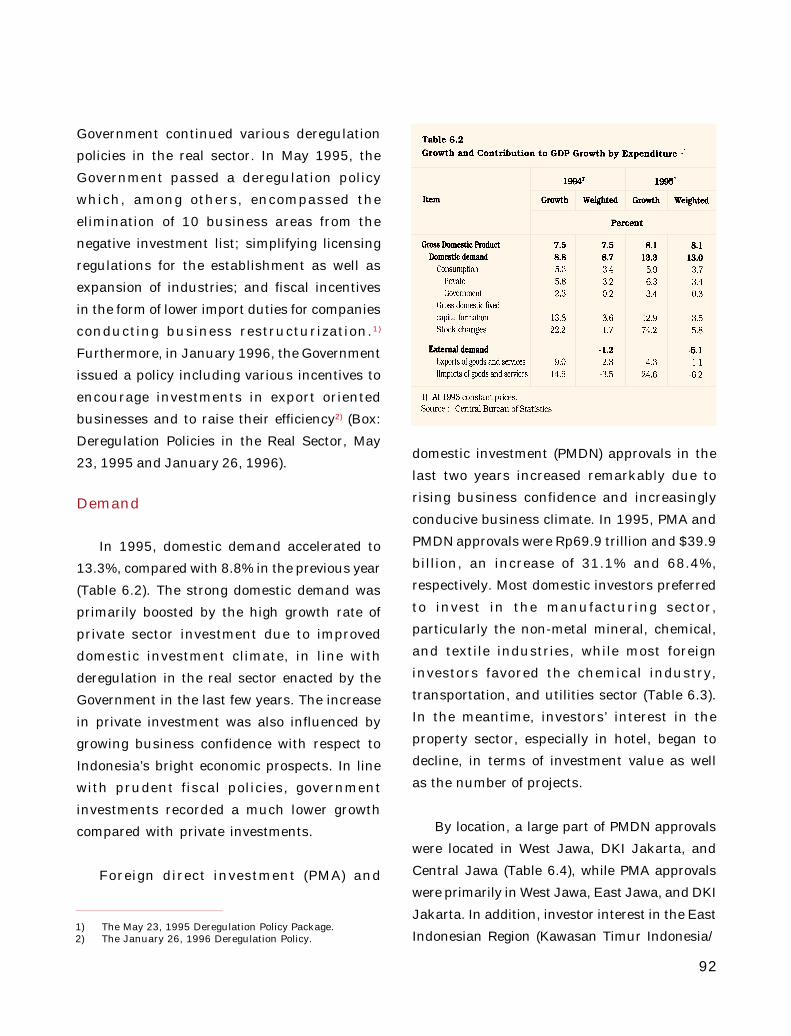
9 2
Government continued various deregulation
policies in the real sector. In May 1995, the
Government passed a deregulation policy
which, among others, encompassed the
elimination of 10 business areas from the
negative investment list; simplifying licensing
regulations for the establishment as well as
expansion of industries; and fiscal incentives
in the form of lower import duties for companies
conducting business restructurization.1)
Furthermore, in January 1996, the Government
issued a policy including various incentives to
encourage investments in export oriented
businesses and to raise their efficiency2) (Box:
Deregulation Policies in the Real Sector, May
23, 1995 and January 26, 1996).
Demand
In 1995, domestic demand accelerated to
13.3%, compared with 8.8% in the previous year
(Table 6.2). The strong domestic demand was
primarily boosted by the high growth rate of
private sector investment due to improved
domestic investment climate, in line with
deregulation in the real sector enacted by the
Government in the last few years. The increase
in private investment was also influenced by
growing business confidence with respect to
Indonesia’s bright economic prospects. In line
with prudent fiscal policies, government
investments recorded a much lower growth
compared with private investments.
Foreign direct investment (PMA) and
domestic investment (PMDN) approvals in the
last two years increased remarkably due to
rising business confidence and increasingly
conducive business climate. In 1995, PMA and
PMDN approvals were Rp69.9 trillion and $39.9
billion, an increase of 31.1% and 68.4%,
respectively. Most domestic investors preferred
to invest in the manufacturing sector,
particularly the non-metal mineral, chemical,
and textile industries, while most foreign
investors favored the chemical industry,
transportation, and utilities sector (Table 6.3).
In the meantime, investors’ interest in the
property sector, especially in hotel, began to
decline, in terms of investment value as well
as the number of projects.
By location, a large part of PMDN approvals
were located in West Jawa, DKI Jakarta, and
Central Jawa (Table 6.4), while PMA approvals
were primarily in West Jawa, East Jawa, and DKI
Jakarta. In addition, investor interest in the East
Indonesian Region (Kawasan Timur Indonesia/1) The May 23, 1995 Deregulation Policy Package.2) The January 26, 1996 Deregulation Policy.
9 3
KTI) was somewhat satisfactory, as witnessed in
the substantial increase in the value of
investment approvals, particularly PMA, in
several areas of the region, such as Maluku, East
Timor, and Irian Jaya. This indicated the positive
response of investors toward government efforts
to improve infrastructure and develop the KTI.
The sharp increase in PMA as mentioned in
the preceding section indicated the success of
Indonesia in attracting foreign capital. However,
Indonesia faced increasingly intense competition
from other countries, particularly in Asia, such
as China, Vietnam, India, and Thailand. In part,
this was contained in the results of a survey
conducted by the Exim Bank of Japan in
November 1995, regarding the most attractive
country of destination for Japanese investors in
the manufacturing industry (Table 6.5).
Besides being stimulated by the high growth
rate of private investment activities, the strong
domestic demand was also attributable to the
high growth rate of public consumption at 6.3%,
higher than growth of 5.8% in the previous year
(Table 6.2). Rising private consumption was
primarily influenced by the increasingly higher
public income as well as lower income tax rates.
Income per capita grew significantly as a result
of high economic growth, particularly in the last
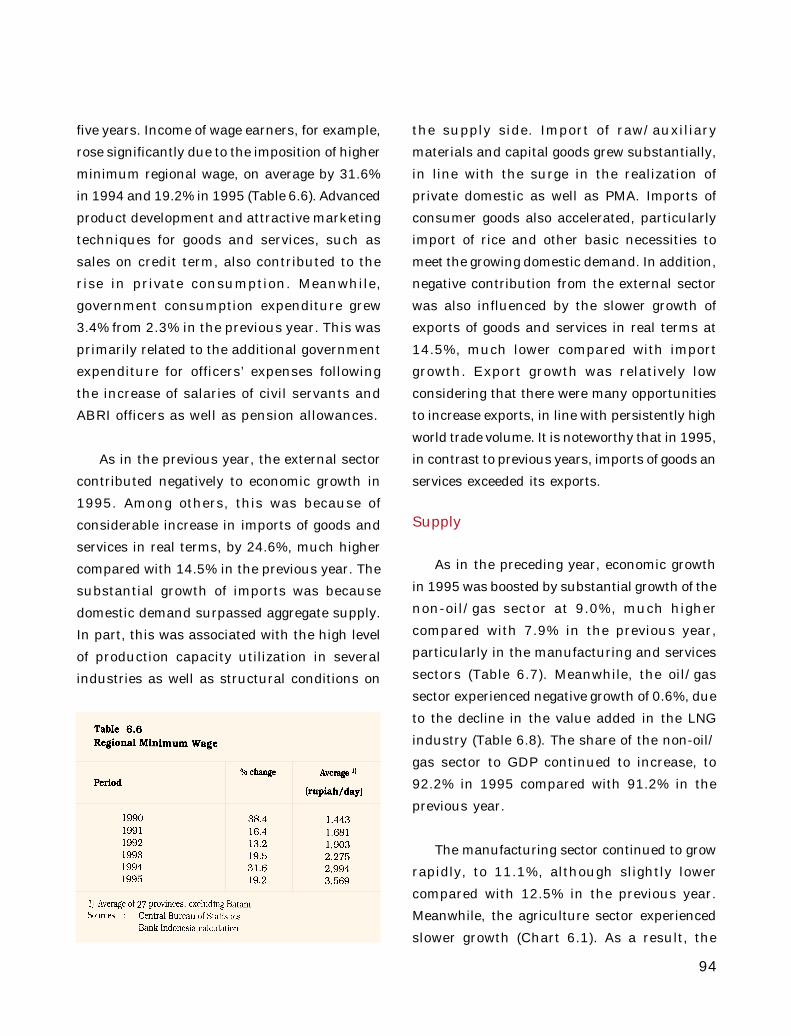
9 4
five years. Income of wage earners, for example,
rose significantly due to the imposition of higher
minimum regional wage, on average by 31.6%
in 1994 and 19.2% in 1995 (Table 6.6). Advanced
product development and attractive marketing
techniques for goods and services, such as
sales on credit term, also contributed to the
rise in private consumption. Meanwhile,
government consumption expenditure grew
3.4% from 2.3% in the previous year. This was
primarily related to the additional government
expenditure for officers’ expenses following
the increase of salaries of civil servants and
ABRI officers as well as pension allowances.
As in the previous year, the external sector
contributed negatively to economic growth in
1995. Among others, this was because of
considerable increase in imports of goods and
services in real terms, by 24.6%, much higher
compared with 14.5% in the previous year. The
substantial growth of imports was because
domestic demand surpassed aggregate supply.
In part, this was associated with the high level
of production capacity utilization in several
industries as well as structural conditions on
the supply side. Import of raw/auxiliary
materials and capital goods grew substantially,
in line with the surge in the realization of
private domestic as well as PMA. Imports of
consumer goods also accelerated, particularly
import of rice and other basic necessities to
meet the growing domestic demand. In addition,
negative contribution from the external sector
was also influenced by the slower growth of
exports of goods and services in real terms at
14.5%, much lower compared with import
growth. Export growth was relatively low
considering that there were many opportunities
to increase exports, in line with persistently high
world trade volume. It is noteworthy that in 1995,
in contrast to previous years, imports of goods an
services exceeded its exports.
Supply
As in the preceding year, economic growth
in 1995 was boosted by substantial growth of the
non-oil/gas sector at 9.0%, much higher
compared with 7.9% in the previous year,
particularly in the manufacturing and services
sectors (Table 6.7). Meanwhile, the oil/gas
sector experienced negative growth of 0.6%, due
to the decline in the value added in the LNG
industry (Table 6.8). The share of the non-oil/
gas sector to GDP continued to increase, to
92.2% in 1995 compared with 91.2% in the
previous year.
The manufacturing sector continued to grow
rapidly, to 11.1%, although slightly lower
compared with 12.5% in the previous year.
Meanwhile, the agriculture sector experienced
slower growth (Chart 6.1). As a result, the
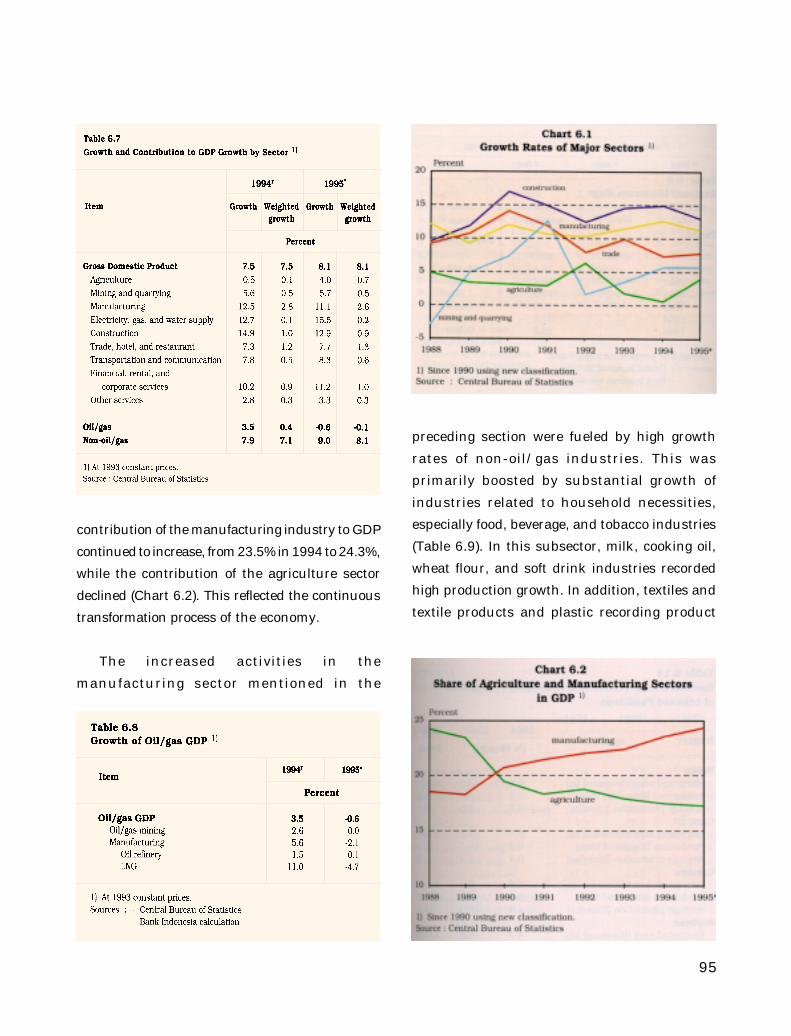
9 5
contribution of the manufacturing industry to GDP
continued to increase, from 23.5% in 1994 to 24.3%,
while the contribution of the agriculture sector
declined (Chart 6.2). This reflected the continuous
transformation process of the economy.
The increased activities in the
manufacturing sector mentioned in the
preceding section were fueled by high growth
rates of non-oil/gas industries. This was
primarily boosted by substantial growth of
industries related to household necessities,
especially food, beverage, and tobacco industries
(Table 6.9). In this subsector, milk, cooking oil,
wheat flour, and soft drink industries recorded
high production growth. In addition, textiles and
textile products and plastic recording product
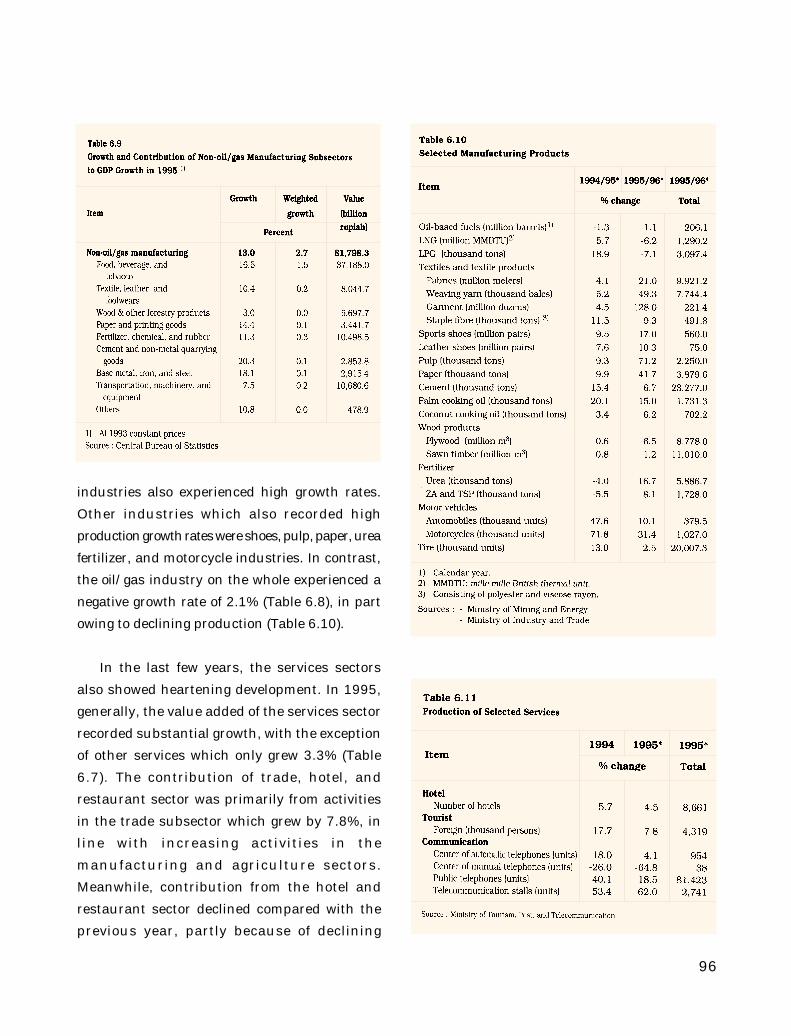
9 6
industries also experienced high growth rates.
Other industries which also recorded high
production growth rates were shoes, pulp, paper, urea
fertilizer, and motorcycle industries. In contrast,
the oil/gas industry on the whole experienced a
negative growth rate of 2.1% (Table 6.8), in part
owing to declining production (Table 6.10).
In the last few years, the services sectors
also showed heartening development. In 1995,
generally, the value added of the services sector
recorded substantial growth, with the exception
of other services which only grew 3.3% (Table
6.7). The contribution of trade, hotel, and
restaurant sector was primarily from activities
in the trade subsector which grew by 7.8%, in
line with increasing activities in the
manufacturing and agriculture sectors.
Meanwhile, contribution from the hotel and
restaurant sector declined compared with the
previous year, partly because of declining
9 7
growth in the number of foreign tourists (Table
6.11). Moreover, the financial, rental, and
corporate services sector also contributed
substantially, especially from increasing
activities in the banking subsector. In line with
property developments, the construction sector
also contributed significantly, albeit less than
in the preceding year.
In 1995, the value added in the agriculture
sector experienced significant growth, at 4.0%
compared with 0.5% in the previous year. This
was primarily related to the improved
performance of the foodcrop subsector which
grew 4.5% in 1995 compared with -2.1% in the
previous period. This was in line with rising
production of rice, at 3.9%. Other production
such as vegetables, fruits, and secondary estate
crops remained strong (Tables 6.12 and 6.13).
Meanwhile, the forestry sector remained
relatively stagnant due to weak export demand
and supply problems.
Value added in the mining and quarrying
sector grew 5.7%, relatively the same as in the
previous year. Growth in this sector was
primarily stimulated by growth of the non-oil/
gas mining subsector which accelerated to
20.1%. This was related to increased production
of several types of minerals, such as tin, copper,
gold, silver, and coal (Table 6.14). In contrast,
the oil/gas mining subsector was stagnant, in
line with the poor oil and gas production.
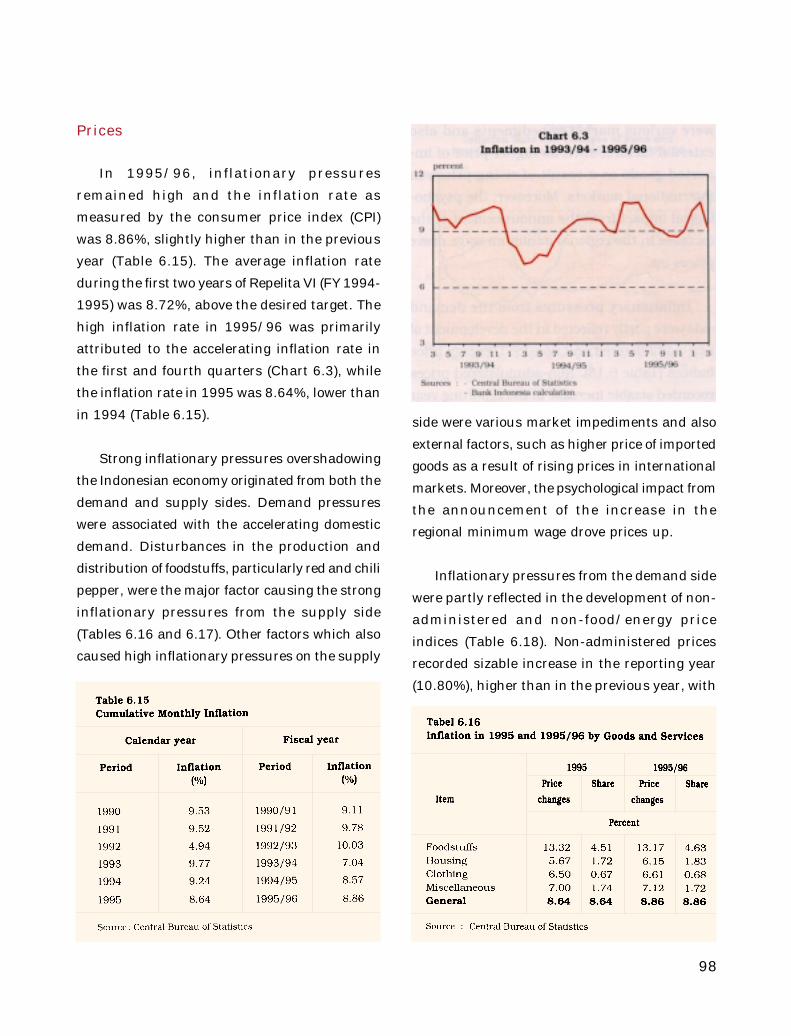
9 8
Prices
In 1995/96, inflationary pressures
remained high and the inflation rate as
measured by the consumer price index (CPI)
was 8.86%, slightly higher than in the previous
year (Table 6.15). The average inflation rate
during the first two years of Repelita VI (FY 1994-
1995) was 8.72%, above the desired target. The
high inflation rate in 1995/96 was primarily
attributed to the accelerating inflation rate in
the first and fourth quarters (Chart 6.3), while
the inflation rate in 1995 was 8.64%, lower than
in 1994 (Table 6.15).
Strong inflationary pressures overshadowing
the Indonesian economy originated from both the
demand and supply sides. Demand pressures
were associated with the accelerating domestic
demand. Disturbances in the production and
distribution of foodstuffs, particularly red and chili
pepper, were the major factor causing the strong
inflationary pressures from the supply side
(Tables 6.16 and 6.17). Other factors which also
caused high inflationary pressures on the supply
side were various market impediments and also
external factors, such as higher price of imported
goods as a result of rising prices in international
markets. Moreover, the psychological impact from
the announcement of the increase in the
regional minimum wage drove prices up.
Inflationary pressures from the demand side
were partly reflected in the development of non-
administered and non-food/energy price
indices (Table 6.18). Non-administered prices
recorded sizable increase in the reporting year
(10.80%), higher than in the previous year, with
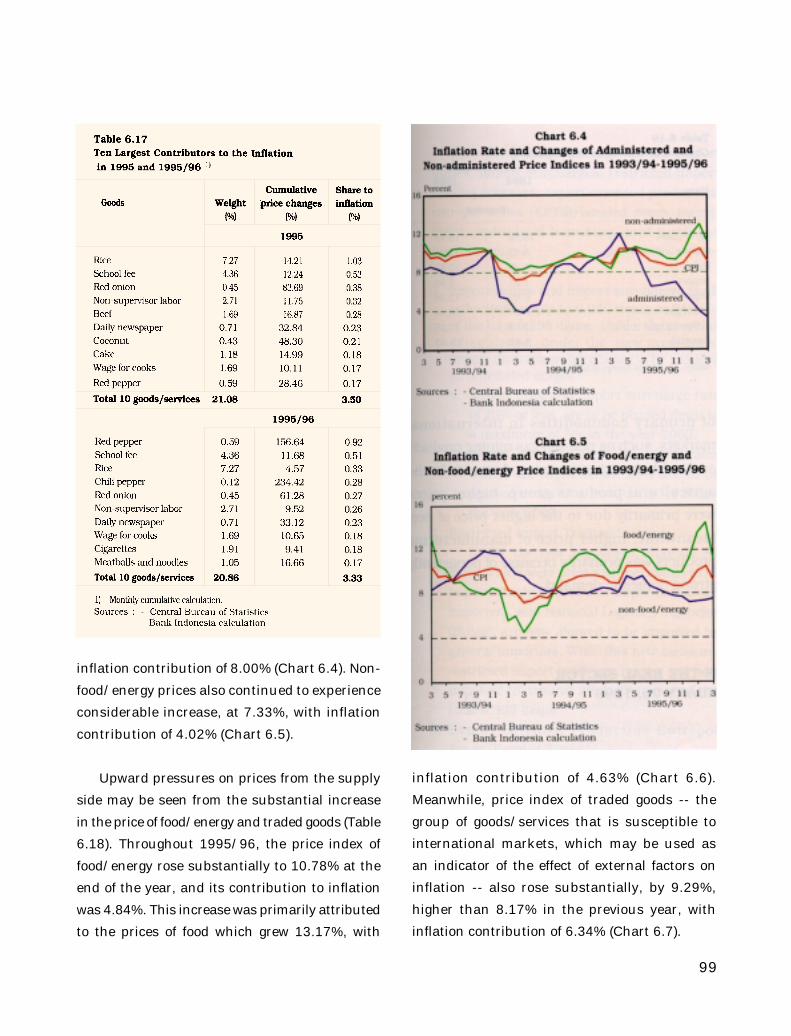
9 9
inflation contribution of 8.00% (Chart 6.4). Non-
food/energy prices also continued to experience
considerable increase, at 7.33%, with inflation
contribution of 4.02% (Chart 6.5).
Upward pressures on prices from the supply
side may be seen from the substantial increase
in the price of food/energy and traded goods (Table
6.18). Throughout 1995/96, the price index of
food/energy rose substantially to 10.78% at the
end of the year, and its contribution to inflation
was 4.84%. This increase was primarily attributed
to the prices of food which grew 13.17%, with
inflation contribution of 4.63% (Chart 6.6).
Meanwhile, price index of traded goods -- the
group of goods/services that is susceptible to
international markets, which may be used as
an indicator of the effect of external factors on
inflation -- also rose substantially, by 9.29%,
higher than 8.17% in the previous year, with
inflation contribution of 6.34% (Chart 6.7).
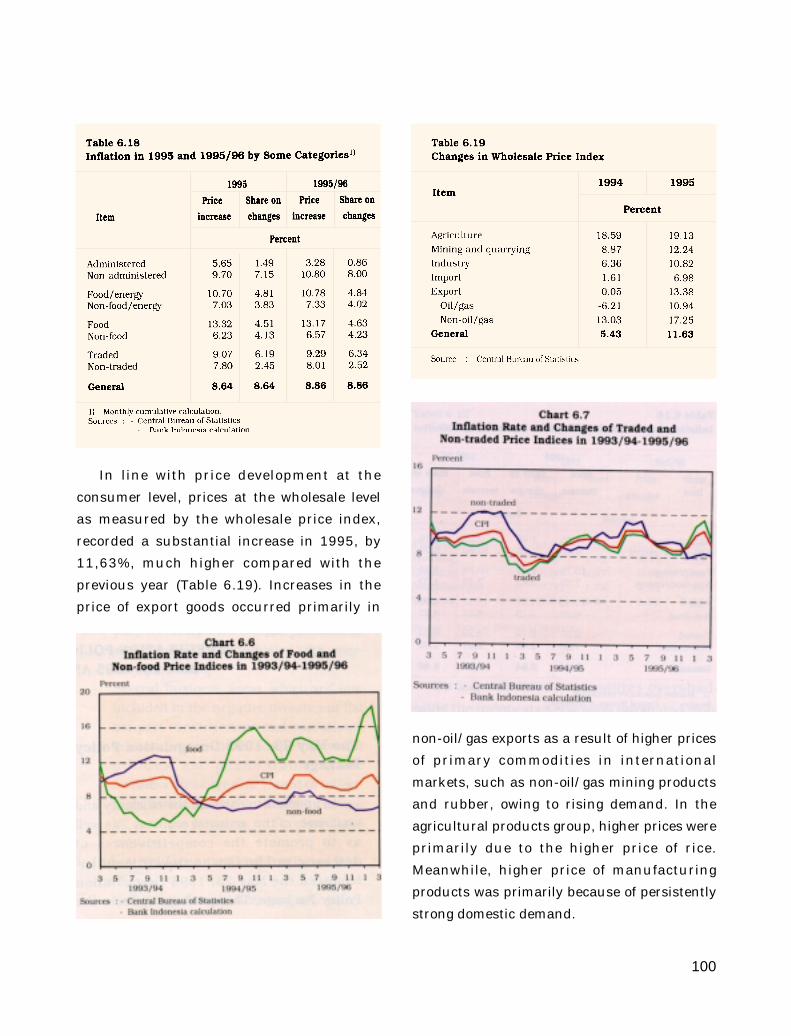
100
In line with price development at the
consumer level, prices at the wholesale level
as measured by the wholesale price index,
recorded a substantial increase in 1995, by
11,63%, much higher compared with the
previous year (Table 6.19). Increases in the
price of export goods occurred primarily in
non-oil/gas exports as a result of higher prices
of primary commodities in international
markets, such as non-oil/gas mining products
and rubber, owing to rising demand. In the
agricultural products group, higher prices were
primarily due to the higher price of rice.
Meanwhile, higher price of manufacturing
products was primarily because of persistently
strong domestic demand.
101
The May 23, 1995 Deregulation PolicyPackage
In an effort to enhance the efficiency and
resilience of the national economy, as well
as to promote the competitiveness of domestic
products, the Government introduced the May
23, 1995 Deregulation Policy Package. This
package reflects the Government’s
determination to eliminate unnecessary cost
by lowering import duty rates and encouraging
Indonesian exporters to be more competitive
in world trade. The deregulation is also a
follow up to Indonesia’s commitment toward
the implementation of free trade, in
accordance with AFTA, the Uruguay round in
the framework of GATT/WTO, and APEC.
The deregulation package covers import
duties, import surcharges, restricted import
trading schemes, export oriented production
entrepot zones (EPTE)/bonded zones,
investment, industrial licensing, and
business restructuring.
1. Import duties and import surcharges tariff
reductions apply to 6,030 items or 64.16%
of the total 9,398 items. Unlike the
previous deregulation, under the new
provisions, import duties/surcharges are
to be reduced in scheduled stages.
a. Import duty and import surcharge rate
of 20% or less are to be phased down to
a maximum of 5% in the year 2000.
b. Import duty and import surcharge rates
which are higher than 20% are to be
phased down to a maximum of 5% in the
year 2003.
2. Restricted Import Trading Schemes
Under the new regulation, there are
81 items which were previously permitted
to be imported only by producer importers,
listed importers, and National Logistics
Agencies (Bulog), are now allowed to be
imported by general importers. With this
new measure, restricted import trading
schemes are now imposed to around 2%
(189 items) of the total 9,398 items.
3. Export Oriented Production Entrepot Zones/
Bonded Zones
This measure is designed to promote
investment in EPTE/bonded zones, as well
as to save foreign exchange required for
the procurement of raw materials/import
components. The package stipulates the
increase in the total value of goods,
produced by EPTE or manufacturing
companies in bonded zones (PPDKB), which
are allowed to be brought into other custom
areas in Indonesia. Under the new
measure, the value of goods becomes 25%
of exports and/or shipment of goods to other
EPTE/PPDKB. Under the old measure, the
calculation was based on 25% of exports
only.
DEREGULATION POLICIES IN THE REAL SECTORMAY 23, 1995 AND JANUARY 26, 1996
102
4. Investment
- The Government renewed the negative
investment list, while continuing to
protect small-scale businesses.
- Under the deregulation, 10 business
areas were eliminated from the
negative investment list, namely the
cooking oil, automotive , finished/
semi-finished rattan, machine-made
cigarette, and patented drug industries.
This will provide wider opportunities to
the business sector, increase supply for
domestic as well as export markets,
enhance value added creation and
transfer of technology.
- To implement a more environmental
conscious development, five additional
business areas are entirely closed to
new investment. These are the
manufacturing of finished/semi-
finished mangrove, pulp industry with
sulfide processing, and chlorine alkali
industry with mercury processing.
- Several business areas which are now
included in the negative investment list
are port constructions and operations,
telecommunications, shipping, water
utilities, and public trains. These
business areas are now closed to
investment with capital that is wholly
owned by foreign citizens or foreign legal
entities.
5. Industrial Licensing and Business
Restructuring
- New provisions on licensing are
introduced to relax licensing regulation
for industrial operations and expansions.
According to the new regulation, industries
located in industrial areas, including
bonded zones, with environmentally
conscious production processes may
directly obtain Industrial Business
License (Izin Usaha Industri) without
necessarily securing initial approval.
- The term Permanent License is
replaced with Industrial Business
License. Registration certificates
(Tanda Daftar Usaha) are given to
small-scale industries and are treated
as Industrial Business License.
Meanwhile, to obtain Industrial
Business Expansion License, a company
is only required to submit its plan.
- Incentives in the form of import duty/
surcharge reductions are given to
companies, excluding the automotive
amounting to at least 30% of the value
of their original investment in
machinery and equipment included in
the first Permanent License/License
for Industrial Business.
The January 26,1996 DeregulationPolicy
In 1996, the Government issued
deregulation measures in stages, with the
aim of providing the business sector an
earlier opportunity to benefit from the
implementation of this deregulation. The
first deregulation phase was launched on
January 26, 1996, covering industries, trade,
and finance.
103
The main objectives of the January 26,
1996 Deregulation Policy are as follows.
- To enhance the effectiveness of the
previous policy
- To create a more attractive business
climate for export promotion
- To enhance export efficiency and
competitiveness
- To lower import duties of capital goods and
raw materials which are directly related
to exports
- To eliminate levies which could disrupt
export activities
1. Industry and Trade
The key points of deregulation in
industry and trade are as follows.
a. Encouraging export oriented industries
To encourage the development of export
oriented industries, the Government
adopted the following measures.
- Allowing shipment of goods and
machinery or factory equipment to/
from EPTE/bonded zones or interEPTE/
bonded zones. Previously, this facility
was only applicable to shipment of goods
from EPTE/bonded zones to industrial
areas in other customs areas in
Indonesia.
- Providing import duty/surcharge
exemption for automotive industries,
owned either by PMA/PMDN or
nonPMA/PMDN companies for
restructuring purposes by importing
machinery and equipment (excluding
raw materials). Previously, this facility
was given only to non-automotive
industries.
- Allowing companies acquiring facilities
from the Agency for Export Facilities
Service and Financial Data Processing
(Bapeksta Keuangan) to sell their
products to EPTE/bonded zones as
indirect exports. Previously, this facility
was given only to companies which
carried out direct exports.
- Reviewing the provisions on export
restrictions for some commodities
which were previously subjected to
export tax and providing import duty
exemption on import of capital goods and
raw materials for industries which are
directly related to export.
b. Reducing export and import barriers
To reduce red tape and levies on export
and import, the Government adopted,
among others, the following measures.
- Reviewing various general provisions
on export and import which are no longer
appropriate to the current situation and
which disrupt export activities.
- Reviewing provisions on quality control
of export products, such as
standardization, certification, and
accreditation.
c. Opening and expanding business
opportunities for PMAs to carry out export
and import activities
- Allowing companies which are wholly
owned by foreign investors to conduct
business on export trading. Previously,
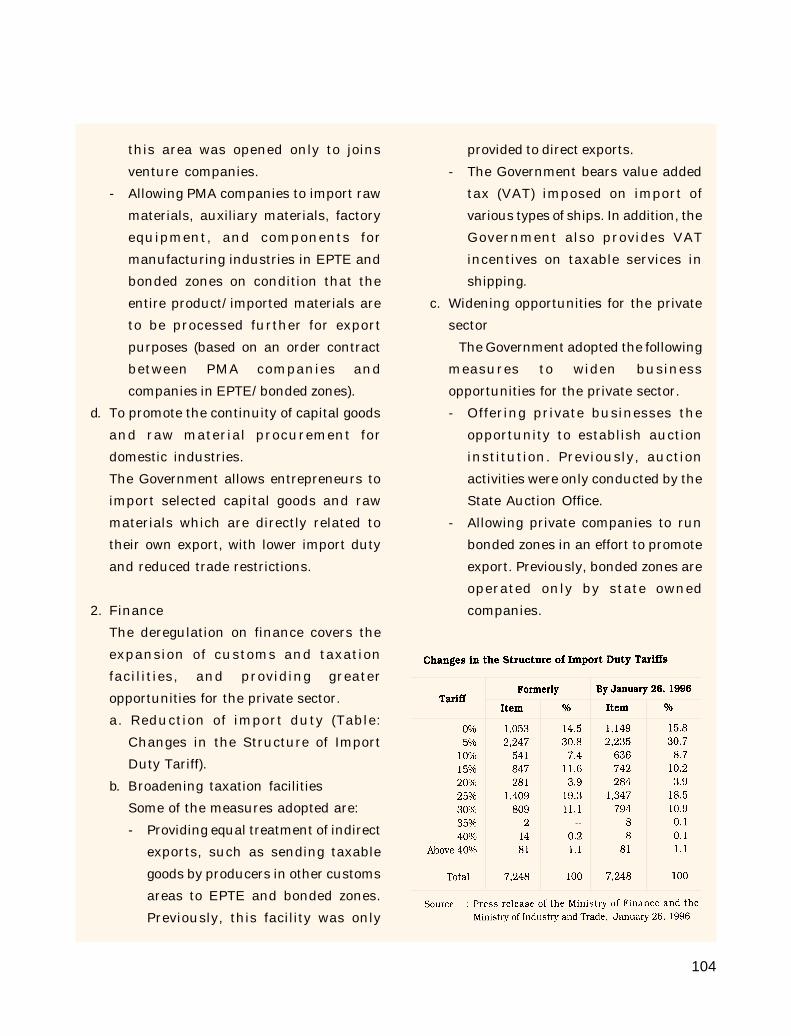
104
this area was opened only to joins
venture companies.
- Allowing PMA companies to import raw
materials, auxiliary materials, factory
equipment, and components for
manufacturing industries in EPTE and
bonded zones on condition that the
entire product/imported materials are
to be processed further for export
purposes (based on an order contract
between PMA companies and
companies in EPTE/bonded zones).
d. To promote the continuity of capital goods
and raw material procurement for
domestic industries.
The Government allows entrepreneurs to
import selected capital goods and raw
materials which are directly related to
their own export, with lower import duty
and reduced trade restrictions.
2. Finance
The deregulation on finance covers the
expansion of customs and taxation
facilities, and providing greater
opportunities for the private sector.
a. Reduction of import duty (Table:
Changes in the Structure of Import
Duty Tariff).
b. Broadening taxation facilities
Some of the measures adopted are:
- Providing equal treatment of indirect
exports, such as sending taxable
goods by producers in other customs
areas to EPTE and bonded zones.
Previously, this facility was only
provided to direct exports.
- The Government bears value added
tax (VAT) imposed on import of
various types of ships. In addition, the
Government also provides VAT
incentives on taxable services in
shipping.
c. Widening opportunities for the private
sector
The Government adopted the following
measures to widen business
opportunities for the private sector.
- Offering private businesses the
opportunity to establish auction
institution. Previously, auction
activities were only conducted by the
State Auction Office.
- Allowing private companies to run
bonded zones in an effort to promote
export. Previously, bonded zones are
operated only by state owned
companies.
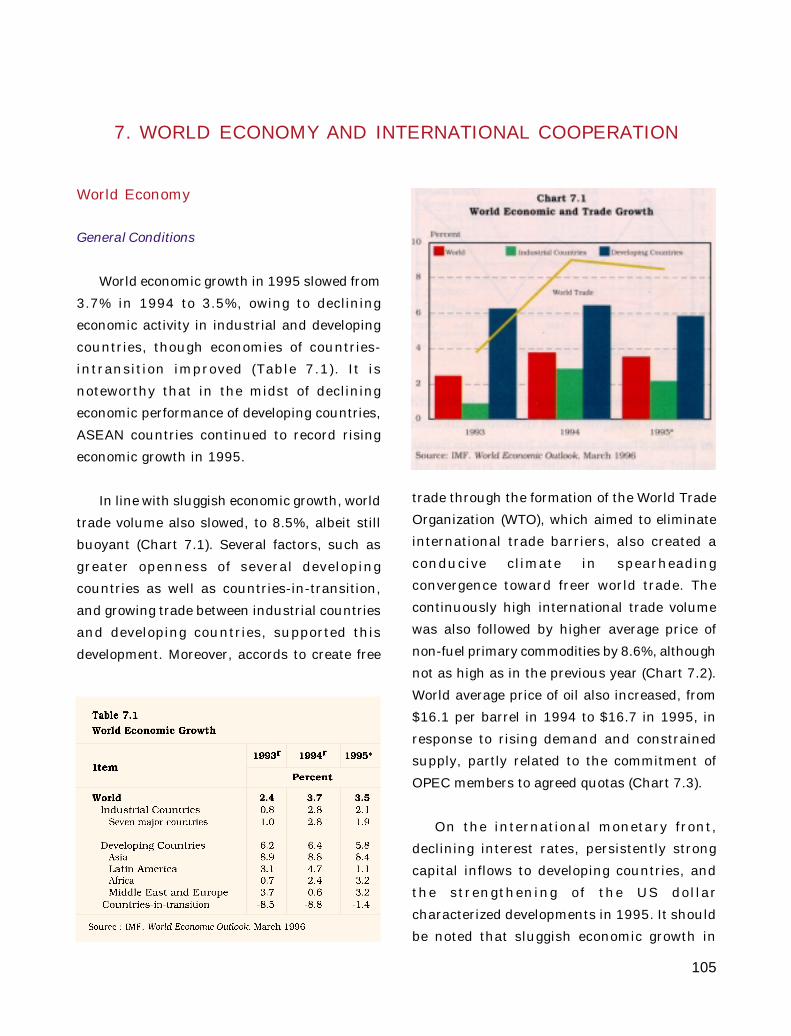
105
World Economy
General Conditions
World economic growth in 1995 slowed from
3.7% in 1994 to 3.5%, owing to declining
economic activity in industrial and developing
countries, though economies of countries-
intransition improved (Table 7.1). It is
noteworthy that in the midst of declining
economic performance of developing countries,
ASEAN countries continued to record rising
economic growth in 1995.
In line with sluggish economic growth, world
trade volume also slowed, to 8.5%, albeit still
buoyant (Chart 7.1). Several factors, such as
greater openness of several developing
countries as well as countries-in-transition,
and growing trade between industrial countries
and developing countries, supported this
development. Moreover, accords to create free
trade through the formation of the World Trade
Organization (WTO), which aimed to eliminate
international trade barriers, also created a
conducive climate in spearheading
convergence toward freer world trade. The
continuously high international trade volume
was also followed by higher average price of
non-fuel primary commodities by 8.6%, although
not as high as in the previous year (Chart 7.2).
World average price of oil also increased, from
$16.1 per barrel in 1994 to $16.7 in 1995, in
response to rising demand and constrained
supply, partly related to the commitment of
OPEC members to agreed quotas (Chart 7.3).
On the international monetary front,
declining interest rates, persistently strong
capital inflows to developing countries, and
the strengthening of the US dollar
characterized developments in 1995. It should
be noted that sluggish economic growth in
7. WORLD ECONOMY AND INTERNATIONAL COOPERATION
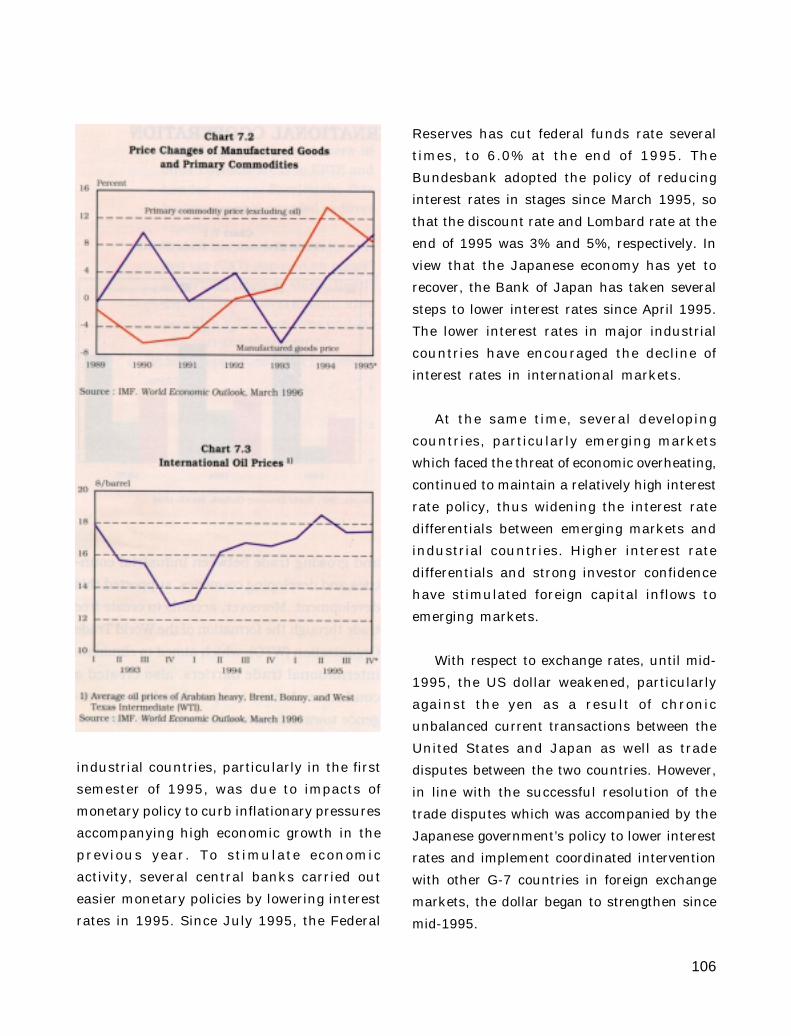
106
industrial countries, particularly in the first
semester of 1995, was due to impacts of
monetary policy to curb inflationary pressures
accompanying high economic growth in the
previous year. To stimulate economic
activity, several central banks carried out
easier monetary policies by lowering interest
rates in 1995. Since July 1995, the Federal
Reserves has cut federal funds rate several
times, to 6.0% at the end of 1995. The
Bundesbank adopted the policy of reducing
interest rates in stages since March 1995, so
that the discount rate and Lombard rate at the
end of 1995 was 3% and 5%, respectively. In
view that the Japanese economy has yet to
recover, the Bank of Japan has taken several
steps to lower interest rates since April 1995.
The lower interest rates in major industrial
countries have encouraged the decline of
interest rates in international markets.
At the same time, several developing
countries, particularly emerging markets
which faced the threat of economic overheating,
continued to maintain a relatively high interest
rate policy, thus widening the interest rate
differentials between emerging markets and
industrial countries. Higher interest rate
differentials and strong investor confidence
have stimulated foreign capital inflows to
emerging markets.
With respect to exchange rates, until mid-
1995, the US dollar weakened, particularly
against the yen as a result of chronic
unbalanced current transactions between the
United States and Japan as well as trade
disputes between the two countries. However,
in line with the successful resolution of the
trade disputes which was accompanied by the
Japanese government’s policy to lower interest
rates and implement coordinated intervention
with other G-7 countries in foreign exchange
markets, the dollar began to strengthen since
mid-1995.
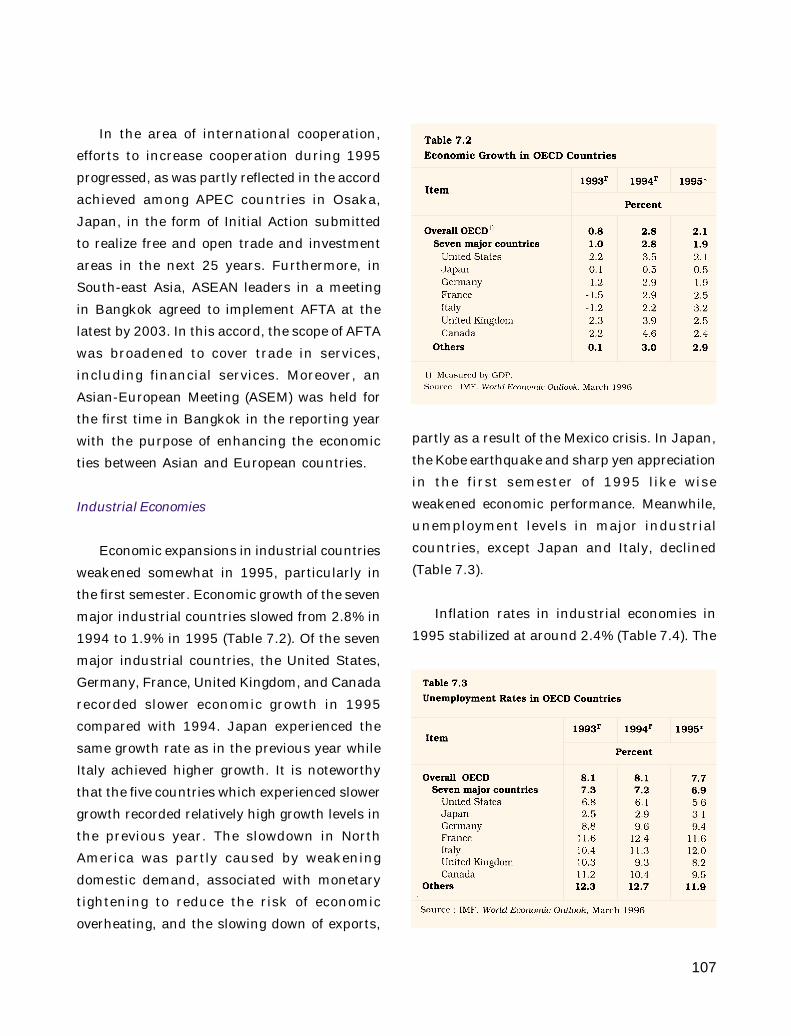
107
In the area of international cooperation,
efforts to increase cooperation during 1995
progressed, as was partly reflected in the accord
achieved among APEC countries in Osaka,
Japan, in the form of Initial Action submitted
to realize free and open trade and investment
areas in the next 25 years. Furthermore, in
South-east Asia, ASEAN leaders in a meeting
in Bangkok agreed to implement AFTA at the
latest by 2003. In this accord, the scope of AFTA
was broadened to cover trade in services,
including financial services. Moreover, an
Asian-European Meeting (ASEM) was held for
the first time in Bangkok in the reporting year
with the purpose of enhancing the economic
ties between Asian and European countries.
Industrial Economies
Economic expansions in industrial countries
weakened somewhat in 1995, particularly in
the first semester. Economic growth of the seven
major industrial countries slowed from 2.8% in
1994 to 1.9% in 1995 (Table 7.2). Of the seven
major industrial countries, the United States,
Germany, France, United Kingdom, and Canada
recorded slower economic growth in 1995
compared with 1994. Japan experienced the
same growth rate as in the previous year while
Italy achieved higher growth. It is noteworthy
that the five countries which experienced slower
growth recorded relatively high growth levels in
the previous year. The slowdown in North
America was partly caused by weakening
domestic demand, associated with monetary
tightening to reduce the risk of economic
overheating, and the slowing down of exports,
partly as a result of the Mexico crisis. In Japan,
the Kobe earthquake and sharp yen appreciation
in the first semester of 1995 like wise
weakened economic performance. Meanwhile,
unemployment levels in major industrial
countries, except Japan and Italy, declined
(Table 7.3).
Inflation rates in industrial economies in
1995 stabilized at around 2.4% (Table 7.4). The
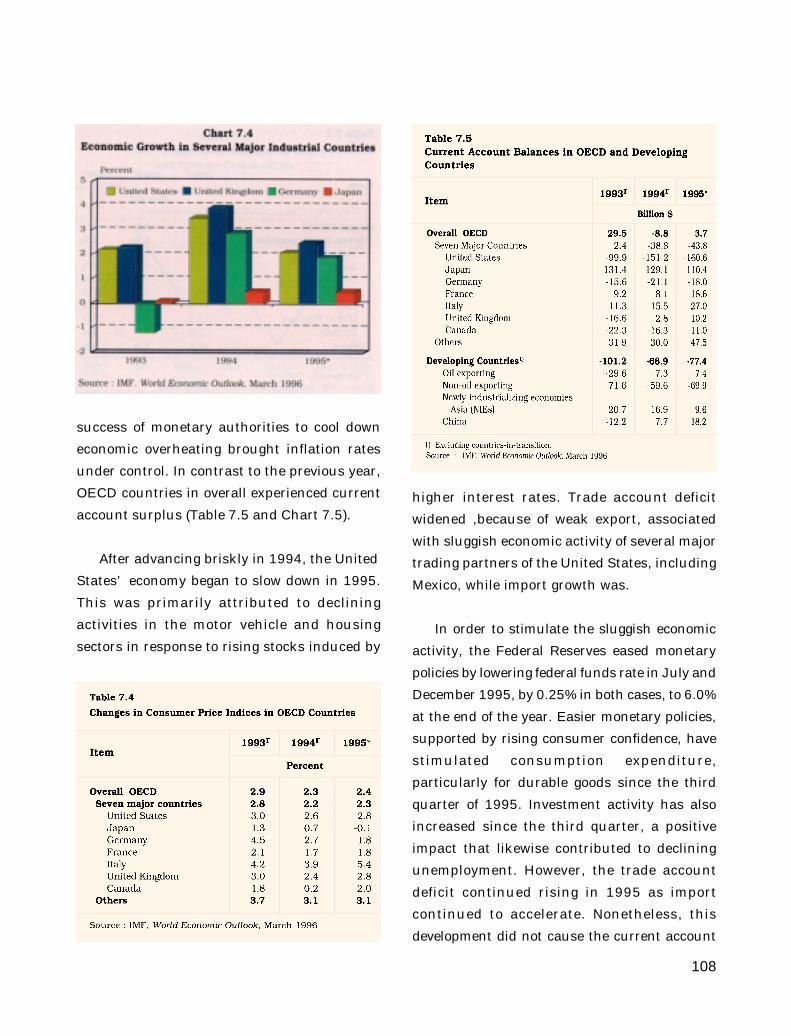
108
success of monetary authorities to cool down
economic overheating brought inflation rates
under control. In contrast to the previous year,
OECD countries in overall experienced current
account surplus (Table 7.5 and Chart 7.5).
After advancing briskly in 1994, the United
States’ economy began to slow down in 1995.
This was primarily attributed to declining
activities in the motor vehicle and housing
sectors in response to rising stocks induced by
higher interest rates. Trade account deficit
widened ,because of weak export, associated
with sluggish economic activity of several major
trading partners of the United States, including
Mexico, while import growth was.
In order to stimulate the sluggish economic
activity, the Federal Reserves eased monetary
policies by lowering federal funds rate in July and
December 1995, by 0.25% in both cases, to 6.0%
at the end of the year. Easier monetary policies,
supported by rising consumer confidence, have
stimulated consumption expenditure,
particularly for durable goods since the third
quarter of 1995. Investment activity has also
increased since the third quarter, a positive
impact that likewise contributed to declining
unemployment. However, the trade account
deficit continued rising in 1995 as import
continued to accelerate. Nonetheless, this
development did not cause the current account
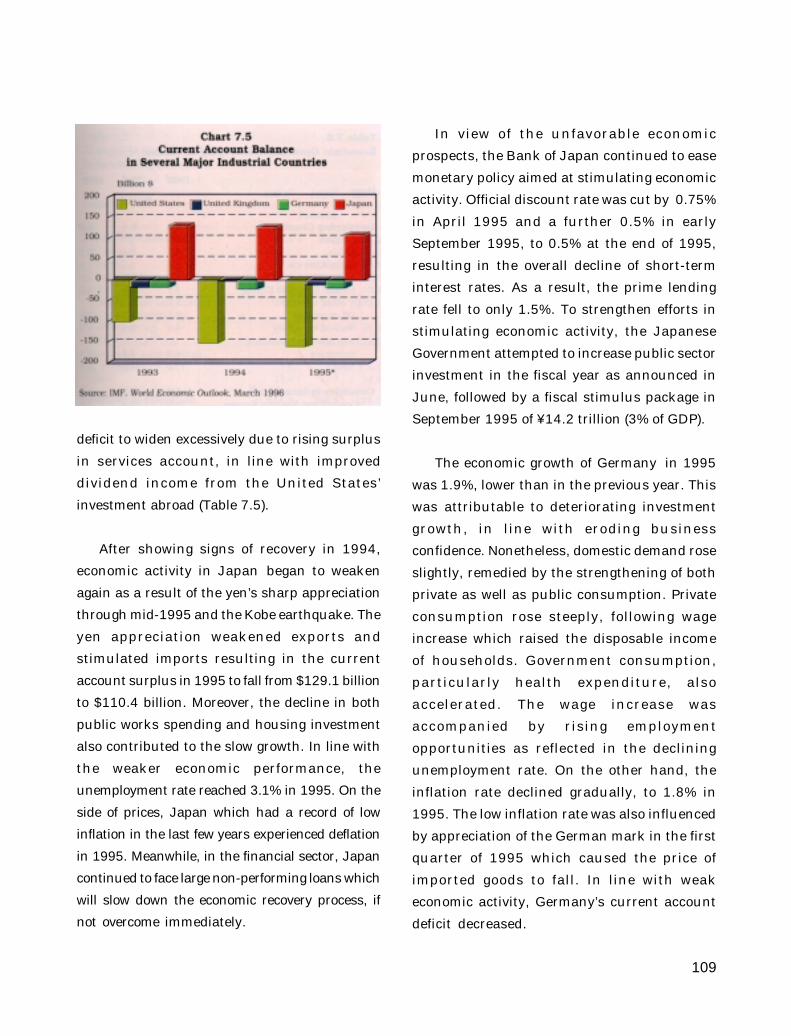
109
deficit to widen excessively due to rising surplus
in services account, in line with improved
dividend income from the United States’
investment abroad (Table 7.5).
After showing signs of recovery in 1994,
economic activity in Japan began to weaken
again as a result of the yen’s sharp appreciation
through mid-1995 and the Kobe earthquake. The
yen appreciation weakened exports and
stimulated imports resulting in the current
account surplus in 1995 to fall from $129.1 billion
to $110.4 billion. Moreover, the decline in both
public works spending and housing investment
also contributed to the slow growth. In line with
the weaker economic performance, the
unemployment rate reached 3.1% in 1995. On the
side of prices, Japan which had a record of low
inflation in the last few years experienced deflation
in 1995. Meanwhile, in the financial sector, Japan
continued to face large non-performing loans which
will slow down the economic recovery process, if
not overcome immediately.
In view of the unfavorable economic
prospects, the Bank of Japan continued to ease
monetary policy aimed at stimulating economic
activity. Official discount rate was cut by 0.75%
in April 1995 and a further 0.5% in early
September 1995, to 0.5% at the end of 1995,
resulting in the overall decline of short-term
interest rates. As a result, the prime lending
rate fell to only 1.5%. To strengthen efforts in
stimulating economic activity, the Japanese
Government attempted to increase public sector
investment in the fiscal year as announced in
June, followed by a fiscal stimulus package in
September 1995 of ¥14.2 trillion (3% of GDP).
The economic growth of Germany in 1995
was 1.9%, lower than in the previous year. This
was attributable to deteriorating investment
growth, in line with eroding business
confidence. Nonetheless, domestic demand rose
slightly, remedied by the strengthening of both
private as well as public consumption. Private
consumption rose steeply, following wage
increase which raised the disposable income
of households. Government consumption,
particularly health expenditure, also
accelerated. The wage increase was
accompanied by rising employment
opportunities as reflected in the declining
unemployment rate. On the other hand, the
inflation rate declined gradually, to 1.8% in
1995. The low inflation rate was also influenced
by appreciation of the German mark in the first
quarter of 1995 which caused the price of
imported goods to fall. In line with weak
economic activity, Germany’s current account
deficit decreased.
110
Developing Economies
Economic performance of developing
countries was relatively stable in 1995 (Table
7.6). Despite experiencing temporary capital
flight in early 1995, in the aftermath of the
Mexican financial crisis, most developing
countries were able to successfully overcome
it. Capital inflows in 1995 were still substantial
and economic growth was sustained at relatively
high levels. The African region as well as the
Middle East and European region recorded
higher growth rate, while growth in the Asian
and Latin American regions slowed. At the same
time, the economic condition of countries-
in-transition improved moderately.
The strong economic performance of
developing countries was associated with
sustained market confidence in response to the
consistency of stabilization and economic
reforms carried out in the last few years. The
success of these efforts have provided greater
room for developing countries in the world
economic arena, besides raising their access
to international financial sources to further
stimulate investment and growth.
Inflation rate of developing countries fell from
48.0% in 1994 to 19.9% in 1995 (Table 7.7). The
declining inflation rate occurred throughout the
region; nonetheless, the most spectacular was
the success of Latin American countries in
containing skyrocketing inflation. Meanwhile,
current account deficit of developing countries
was $77.4 billion in 1995, higher than the
previous year’s $66.9 billion (Table 7.5).
Asian economies continued to record the
highest growth rate, at 8.4% in 1995. Economic
performance of China, newly industrializing
economies (NIEs), and ASEAN countries
contributed the most to the high growth rate.
Persistently high growth has increased the risk
of economic overheating and its symptoms were
beginning to be felt in several countries since
1994. To prevent economic overheating, several
countries have implemented prudent
macroeconomic policies and carried out
structural reforms. In part, these efforts have
caused the inflation rate to decline to 10.9% in
1995 compared with 13.5% in the preceding
year.
In 1995, China, which is an important
developing economy in Asia, recorded economic
growth of 10.2%, a significant growth rate
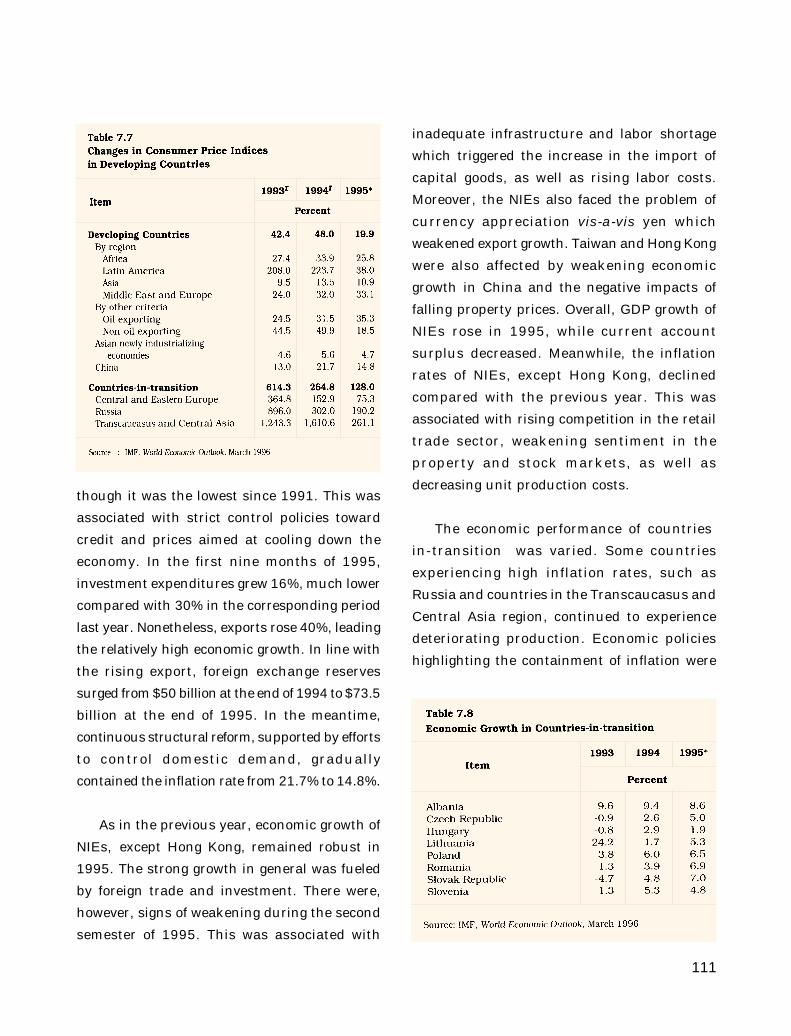
111
though it was the lowest since 1991. This was
associated with strict control policies toward
credit and prices aimed at cooling down the
economy. In the first nine months of 1995,
investment expenditures grew 16%, much lower
compared with 30% in the corresponding period
last year. Nonetheless, exports rose 40%, leading
the relatively high economic growth. In line with
the rising export, foreign exchange reserves
surged from $50 billion at the end of 1994 to $73.5
billion at the end of 1995. In the meantime,
continuous structural reform, supported by efforts
to control domestic demand, gradually
contained the inflation rate from 21.7% to 14.8%.
As in the previous year, economic growth of
NIEs, except Hong Kong, remained robust in
1995. The strong growth in general was fueled
by foreign trade and investment. There were,
however, signs of weakening during the second
semester of 1995. This was associated with
inadequate infrastructure and labor shortage
which triggered the increase in the import of
capital goods, as well as rising labor costs.
Moreover, the NIEs also faced the problem of
currency appreciation vis-a-vis yen which
weakened export growth. Taiwan and Hong Kong
were also affected by weakening economic
growth in China and the negative impacts of
falling property prices. Overall, GDP growth of
NIEs rose in 1995, while current account
surplus decreased. Meanwhile, the inflation
rates of NIEs, except Hong Kong, declined
compared with the previous year. This was
associated with rising competition in the retail
trade sector, weakening sentiment in the
property and stock markets, as well as
decreasing unit production costs.
The economic performance of countries
in-transition was varied. Some countries
experiencing high inflation rates, such as
Russia and countries in the Transcaucasus and
Central Asia region, continued to experience
deteriorating production. Economic policies
highlighting the containment of inflation were
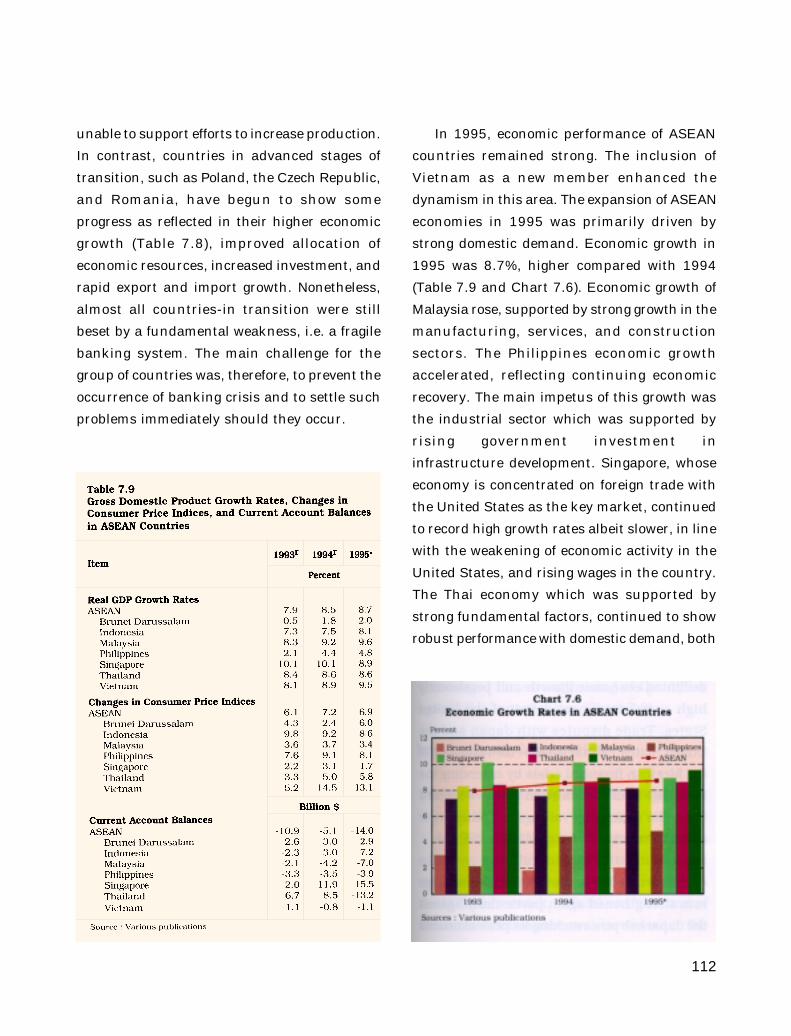
112
unable to support efforts to increase production.
In contrast, countries in advanced stages of
transition, such as Poland, the Czech Republic,
and Romania, have begun to show some
progress as reflected in their higher economic
growth (Table 7.8), improved allocation of
economic resources, increased investment, and
rapid export and import growth. Nonetheless,
almost all countries-in transition were still
beset by a fundamental weakness, i.e. a fragile
banking system. The main challenge for the
group of countries was, therefore, to prevent the
occurrence of banking crisis and to settle such
problems immediately should they occur.
In 1995, economic performance of ASEAN
countries remained strong. The inclusion of
Vietnam as a new member enhanced the
dynamism in this area. The expansion of ASEAN
economies in 1995 was primarily driven by
strong domestic demand. Economic growth in
1995 was 8.7%, higher compared with 1994
(Table 7.9 and Chart 7.6). Economic growth of
Malaysia rose, supported by strong growth in the
manufacturing, services, and construction
sectors. The Philippines economic growth
accelerated, reflecting continuing economic
recovery. The main impetus of this growth was
the industrial sector which was supported by
rising government investment in
infrastructure development. Singapore, whose
economy is concentrated on foreign trade with
the United States as the key market, continued
to record high growth rates albeit slower, in line
with the weakening of economic activity in the
United States, and rising wages in the country.
The Thai economy which was supported by
strong fundamental factors, continued to show
robust performance with domestic demand, both
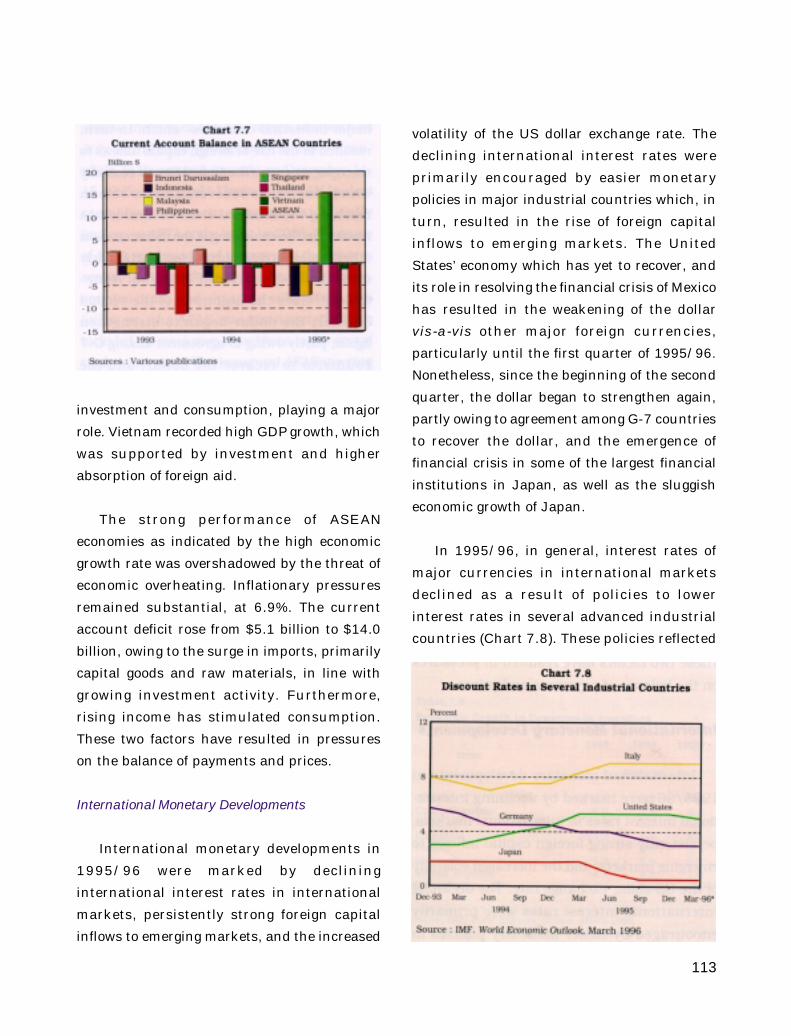
113
investment and consumption, playing a major
role. Vietnam recorded high GDP growth, which
was supported by investment and higher
absorption of foreign aid.
The strong performance of ASEAN
economies as indicated by the high economic
growth rate was overshadowed by the threat of
economic overheating. Inflationary pressures
remained substantial, at 6.9%. The current
account deficit rose from $5.1 billion to $14.0
billion, owing to the surge in imports, primarily
capital goods and raw materials, in line with
growing investment activity. Furthermore,
rising income has stimulated consumption.
These two factors have resulted in pressures
on the balance of payments and prices.
International Monetary Developments
International monetary developments in
1995/96 were marked by declining
international interest rates in international
markets, persistently strong foreign capital
inflows to emerging markets, and the increased
volatility of the US dollar exchange rate. The
declining international interest rates were
primarily encouraged by easier monetary
policies in major industrial countries which, in
turn, resulted in the rise of foreign capital
inflows to emerging markets. The United
States’ economy which has yet to recover, and
its role in resolving the financial crisis of Mexico
has resulted in the weakening of the dollar
vis-a-vis other major foreign currencies,
particularly until the first quarter of 1995/96.
Nonetheless, since the beginning of the second
quarter, the dollar began to strengthen again,
partly owing to agreement among G-7 countries
to recover the dollar, and the emergence of
financial crisis in some of the largest financial
institutions in Japan, as well as the sluggish
economic growth of Japan.
In 1995/96, in general, interest rates of
major currencies in international markets
declined as a result of policies to lower
interest rates in several advanced industrial
countries (Chart 7.8). These policies reflected
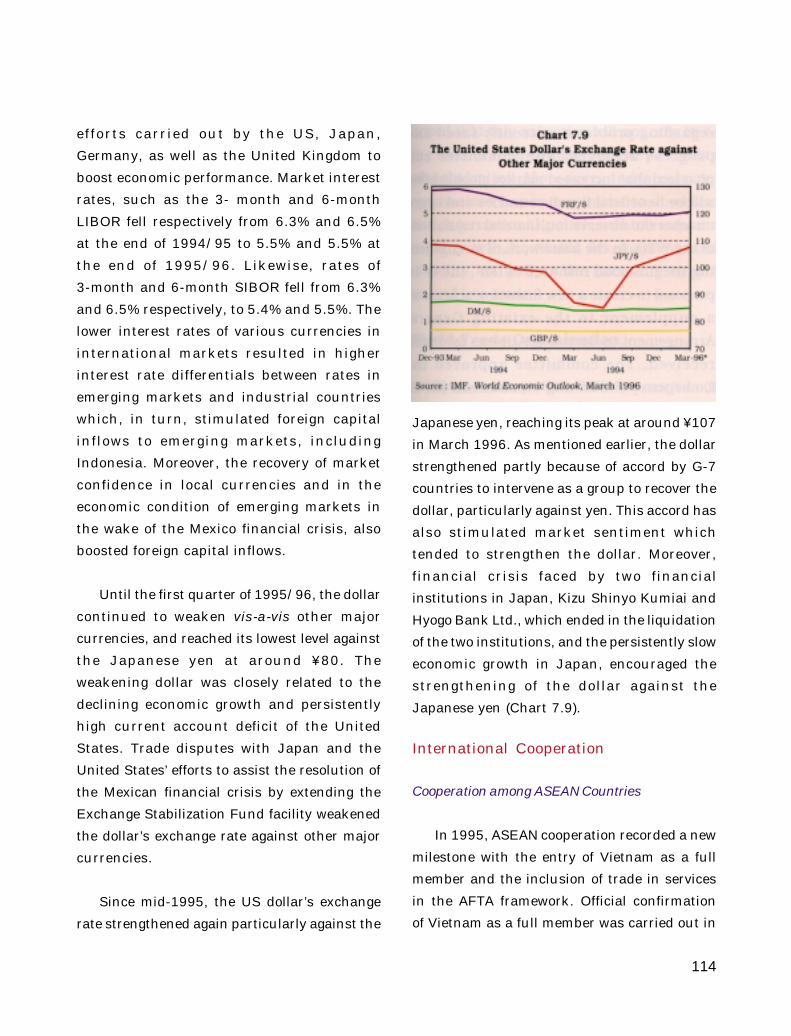
114
efforts carried out by the US, Japan,
Germany, as well as the United Kingdom to
boost economic performance. Market interest
rates, such as the 3- month and 6-month
LIBOR fell respectively from 6.3% and 6.5%
at the end of 1994/95 to 5.5% and 5.5% at
the end of 1995/96. Likewise, rates of
3-month and 6-month SIBOR fell from 6.3%
and 6.5% respectively, to 5.4% and 5.5%. The
lower interest rates of various currencies in
international markets resulted in higher
interest rate differentials between rates in
emerging markets and industrial countries
which, in turn, stimulated foreign capital
inflows to emerging markets, including
Indonesia. Moreover, the recovery of market
confidence in local currencies and in the
economic condition of emerging markets in
the wake of the Mexico financial crisis, also
boosted foreign capital inflows.
Until the first quarter of 1995/96, the dollar
continued to weaken vis-a-vis other major
currencies, and reached its lowest level against
the Japanese yen at around ¥80. The
weakening dollar was closely related to the
declining economic growth and persistently
high current account deficit of the United
States. Trade disputes with Japan and the
United States’ efforts to assist the resolution of
the Mexican financial crisis by extending the
Exchange Stabilization Fund facility weakened
the dollar’s exchange rate against other major
currencies.
Since mid-1995, the US dollar’s exchange
rate strengthened again particularly against the
Japanese yen, reaching its peak at around ¥107
in March 1996. As mentioned earlier, the dollar
strengthened partly because of accord by G-7
countries to intervene as a group to recover the
dollar, particularly against yen. This accord has
also stimulated market sentiment which
tended to strengthen the dollar. Moreover,
financial crisis faced by two financial
institutions in Japan, Kizu Shinyo Kumiai and
Hyogo Bank Ltd., which ended in the liquidation
of the two institutions, and the persistently slow
economic growth in Japan, encouraged the
strengthening of the dollar against the
Japanese yen (Chart 7.9).
International Cooperation
Cooperation among ASEAN Countries
In 1995, ASEAN cooperation recorded a new
milestone with the entry of Vietnam as a full
member and the inclusion of trade in services
in the AFTA framework. Official confirmation
of Vietnam as a full member was carried out in

115
the annual meeting of ASEAN Foreign Ministers
on July 28, 1995 in Brunei Darussalam.
Meanwhile, in its summit meeting on December
1415, 1995 in Bangkok, Thailand, ASEAN leaders
reemphasized their commitment to fully
implement AFTA at the latest by 2003. The scope
of AFTA was broadened to cover also the services
sector, including finance and banking, airline,
construction, and shipping subsector. As a follow
up, the AFAS was constructed which included
the resolution of problems in the area of trade
in services. The inaugural AFAS meeting
which was held in Bandung in January 1996
produced, among others, a working procedure
of the coordinating committee, sectoral
coverage, and negotiation time frame as well
as the support of the ASEAN Secretariat.
Asia-Pacific Economic Cooperation
In the third APEC Economic Leaders
Meeting on November 11, 1995 in Osaka, Japan,
the Osaka declaration was constructed which
included trade and investment liberalization
principles in the next 25 years. Moreover, each
country submitted Initial Action as a concrete
step to speed up trade and investment
liberalization in the area. The initial action
submitted by Indonesia was based on the May
1995 deregulation policy package which
included reduction of import duties in stages.
This development is simultaneously an
opportunity and a challenge for Indonesia in
moving toward the globalization of trade and
investment. To that effect, businesses must
increase efforts to take advantage of greater
opportunities.
Bilateral Cooperation
As a follow-up to the cooperation with central
banks in Asia, Bank Indonesia has held
meetings with several central banks in Asia to
raise more definite cooperation. As a result of
these meetings, Bank Indonesia concluded
repurchase agreements in fiscal year 1995/96
with the monetary authorities of Malaysia,
Singapore, Hong Kong, Thailand, the
Philippines, and Australia. Under these
agreements, monetary authorities of a signing
country may obtain liquidity assistance from
other monetary authorities to overcome attacks
in foreign exchange markets. This cooperation
also includes commitment to carry out
information exchanges and increase
cooperation in monetary and exchange rate
management in each of the country.
International Institutions
International Monetary Fund and World Bank
The Board of Governors of the International
Monetary Fund (IMF) and the World Bank held
the 50th Annual Meeting on October 10-12, 1995
in Washington, D.C., United States.
Concurrently, IMF Interim Committee Meeting
and the World Bank Development Committee
Meeting were also held.
At the 45th IMF Interim Committee Meeting
on October 8, 1995, developments in member
countries were discussed, particularly regarding
problems currently faced and progress achieved.
The committee emphasized that increased
116
market globalization will be beneficial for all
countries and urged members to observe
multilateral regulations of the WTO. In the
framework of strengthening the financial
resource of IMF, the G-10 proposal to create a
new financing scheme as a supplement to the
existing General Arrangement to Borrow (GAB)
was favorably received. The committee approved
the Emergency Financing Mechanism (EFM)
which will enable IMF to provide immediate aid
in the event of a serious financial crisis; the
terms for the use of the Currency Stabilization
Funds (CSF) to support exchange rate policies
in abating inflation; and the broadening of the
scope of IMF’s involvement in post-conflict
situations which will enable IMF to prepare
emergency aid.
At the World Bank Development
Committee Meeting on 9 October 1995,
several resolutions were reached, including
support for poverty alleviation through
cooperation with governments, supply of
credit and basic infrastructure for the
economically deprived group; efforts to further
strengthen the role of the International
Development Association (IDA); and the
reduction of the burden of heavily indebted
countries to sustainable levels using
available multilateral assistance.
In all the meetings, Indonesia stressed
the necessity of serious efforts to reduce the
debt burdens of low-income countries. It is
hoped that this reduction will not only be in
the form of rescheduling but the possibility
of debt rel ief . Moreover, Indonesia
reemphasized her commitment to domestic
and international policies which support
rapid growth, equitable development, and
stability, as well as the necessity to aim
toward free trade.
World Trade Organization
Since January 1995, WTO has carried out
its function as an organizer and supervisor of
multilateral trade. Nonetheless, the existence
of the WTO is sti l l challenged by the
reluctance pressures of protectionism in
several countries. Moreover, it continued to
face unilateral actions, such as anti-dumping
and regional trade accord which may lead to
trade diversions.
At the last meeting on financial services
held on July 28, 1995 in Geneva, Switzerland,
an interim agreement on financial services was
resolved, to be effective until December 31,
1997. The key issue in this agreement was that
each participating country will implement its
maximum commitment until December 31,
1997. After 1997, each of the participating
country is free to decide if it will maintain the
interim agreement, withdraw, or maintain and
broaden the agreement. It may be noted that
this interim agreement only includes
industrial countries other than the United
States, and several developing countries
including Indonesia.
117
Asian Development Bank
From May 3-5, 1995, the Asian Development
Bank (ADB) held the 28th Annual Meeting of
the Board of Governors in Auckland, New
Zealand. At this meeting, various issues were
discussed, including economic development,
poverty, the environment, increased loans, and
replenishment of the Asian Development Fund
(ADF). Of these issues, two constituted the major
agenda, i.e. replenishment of the ADF, and
extension of broader discussion on various
problems in Asia. In this discussion, delegates
hoped that the ADB will play a more active role
as a catalyst of investment in Asia.
Nonetheless, the issue on the replenishment
of ADF was not resolved. The United States and
donor countries from Europe were unwilling to
add funds to the ADF. They proposed that more
affluent countries in Asia, such as the NIEs,
play a larger role. Moreover, the donors also
proposed the mobilization of private funds to
meet the need for infrastructure development.
Islamic Development Bank
At the 20th Annual Meeting of the Board of
Governors of the Islamic Development Bank
(IDB) in Jakarta, from November 29-30, 1995,
several resolutions were concluded, including
acceptance of the Republic of Mozambique as
the 49th member, the Republic of Kazakstan
as the 50th member as well as election of a new
IDB President for the next 5 years. Furthermore,
the schedule for the Chairman and Deputy
Chairman of the Board of Governors for the
1995-96 period was also resolved. Apart from the
meeting, Indonesia and IDB have signed several
loan agreements to finance electricity projects,
hospitals, and Islamic schools. Until 1995, Indonesia
has received $169.2 million in loans from the IDB.
Consultative Group for Indonesia
The fourth meeting of the Consultative
Group for Indonesia (CGI) was held in Paris, from
July 18-19, 1995. The aim of the meeting was
to determine the amount of aid needed, and was
preceded by discussions on several issues,
particularly on the economic development of
Indonesia and progress of projects financed. On
the whole, delegates were satisfied with the
progress achieved by Indonesia. However, they
also pointed out several matters which may
impede continuation of development, such as
the income gap, inefficiency, high cost economy,
and domination of several companies leading
toward monopolies and cartels. They also hoped
that institutions which are the instruments of
foreign debt management, such as the PKLN
team, will continue to be maintained.
At the CGI meeting it was resolved to increase
aid to $5,360 million, compared with $5,203
million in the previous reporting year. Of this
amount, $2,565 million was from bilateral loans.
Japan committed $2,140 million, while the World
Bank and ADB committed $1,200 million each.
In contrast to the previous year, whereby project
aid was mostly absorbed by large infrastructure
projects such as electricity generation and
telecommunications, the latest project aid was
focused on human resource development,
agriculture and poverty alleviation.

APPENDICES
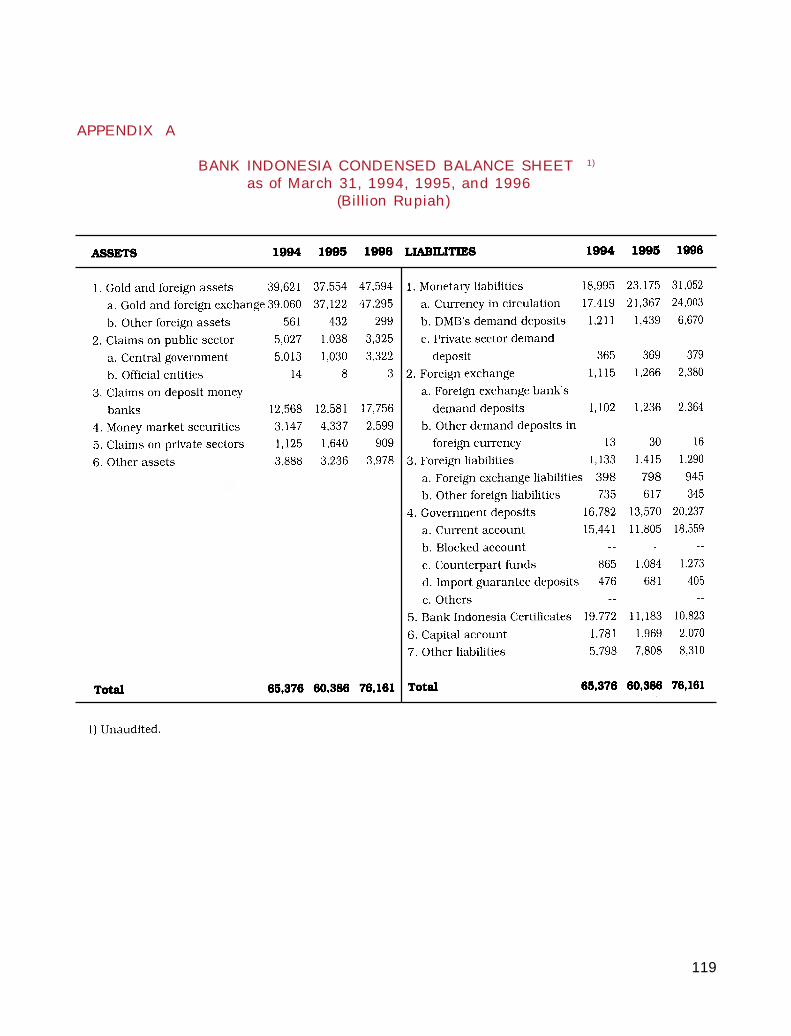
119
APPENDIX A
BANK INDONESIA CONDENSED BALANCE SHEET 1)
as of March 31, 1994, 1995, and 1996(Billion Rupiah)
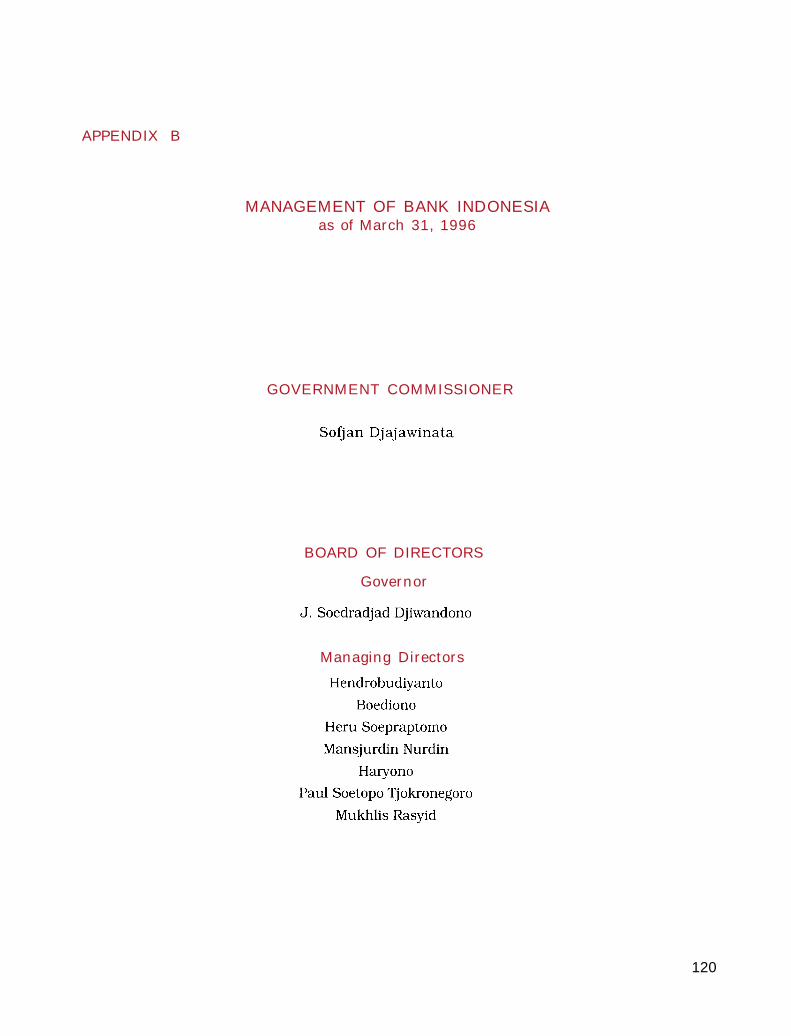
120
APPENDIX B
MANAGEMENT OF BANK INDONESIAas of March 31, 1996
GOVERNMENT COMMISSIONER
BOARD OF DIRECTORS
Governor
Managing Directors
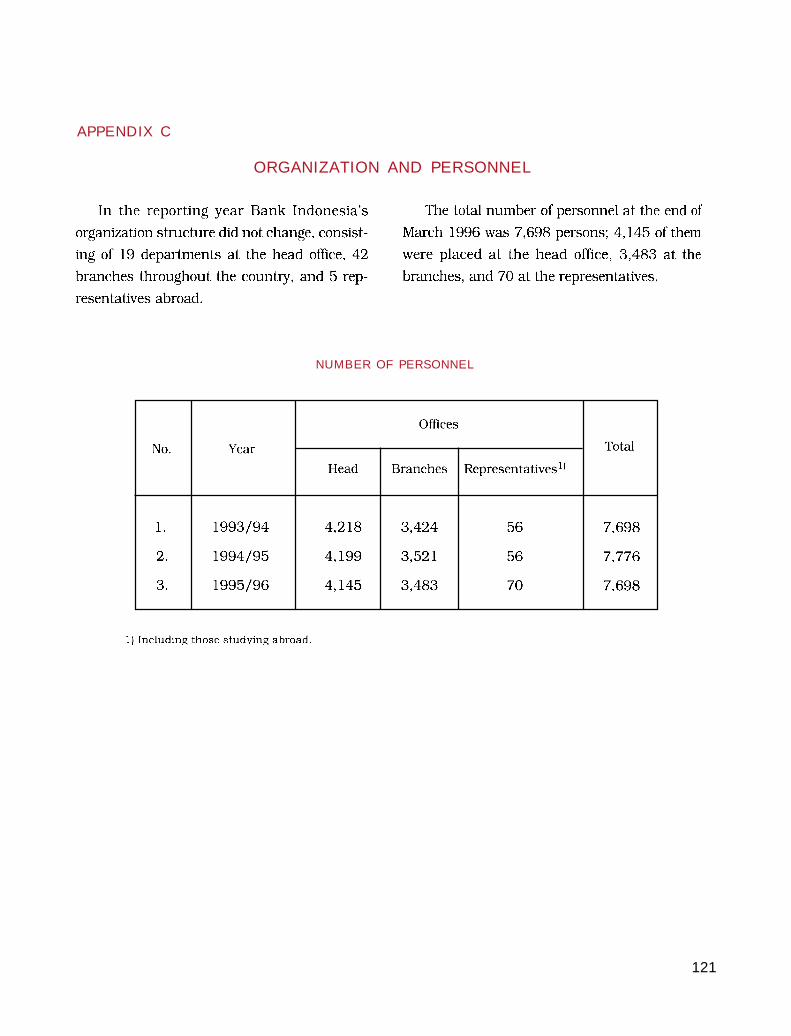
121
APPENDIX C
ORGANIZATION AND PERSONNEL
NUMBER OF PERSONNEL
122
DEPARTMENT DIRECTORS
REPRESENTATIVES
123
BRANCH MANAGERS
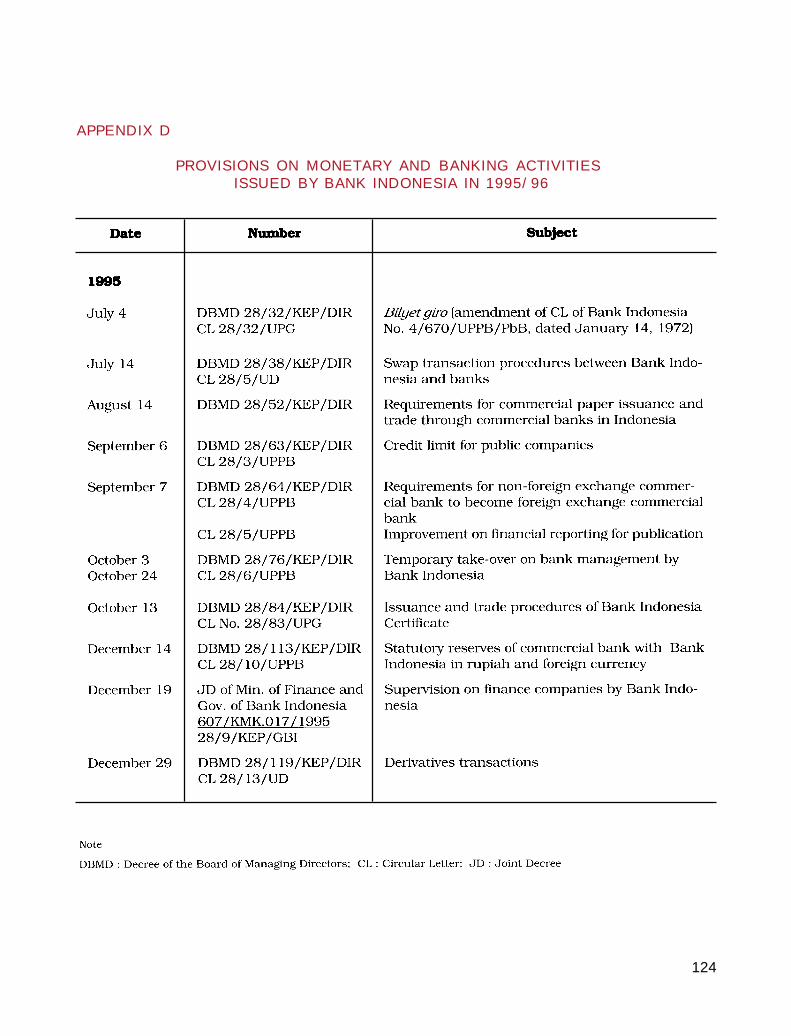
124
APPENDIX D
PROVISIONS ON MONETARY AND BANKING ACTIVITIESISSUED BY BANK INDONESIA IN 1995/96
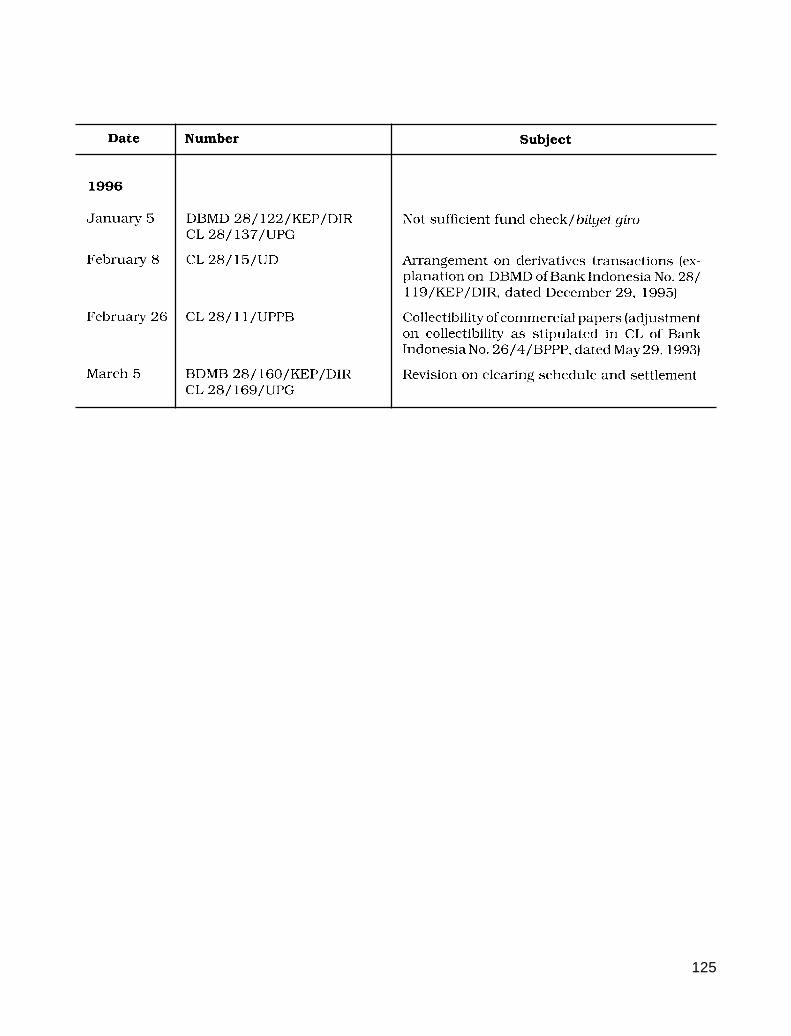
125
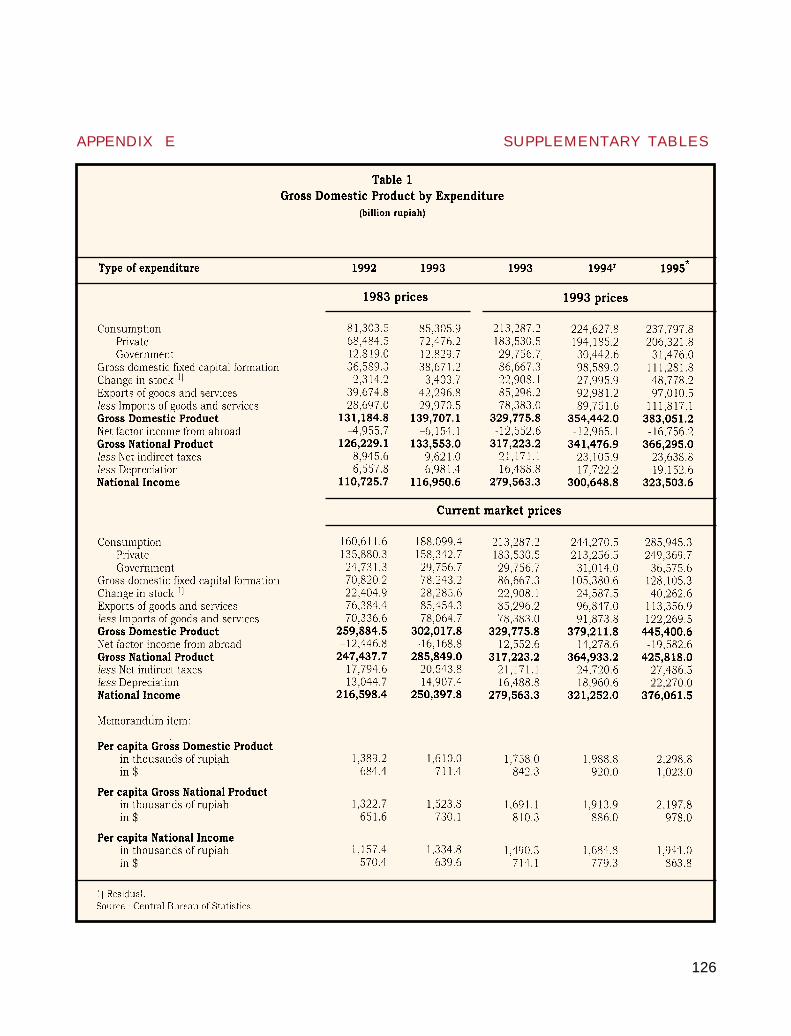
126
APPENDIX E SUPPLEMENTARY TABLES
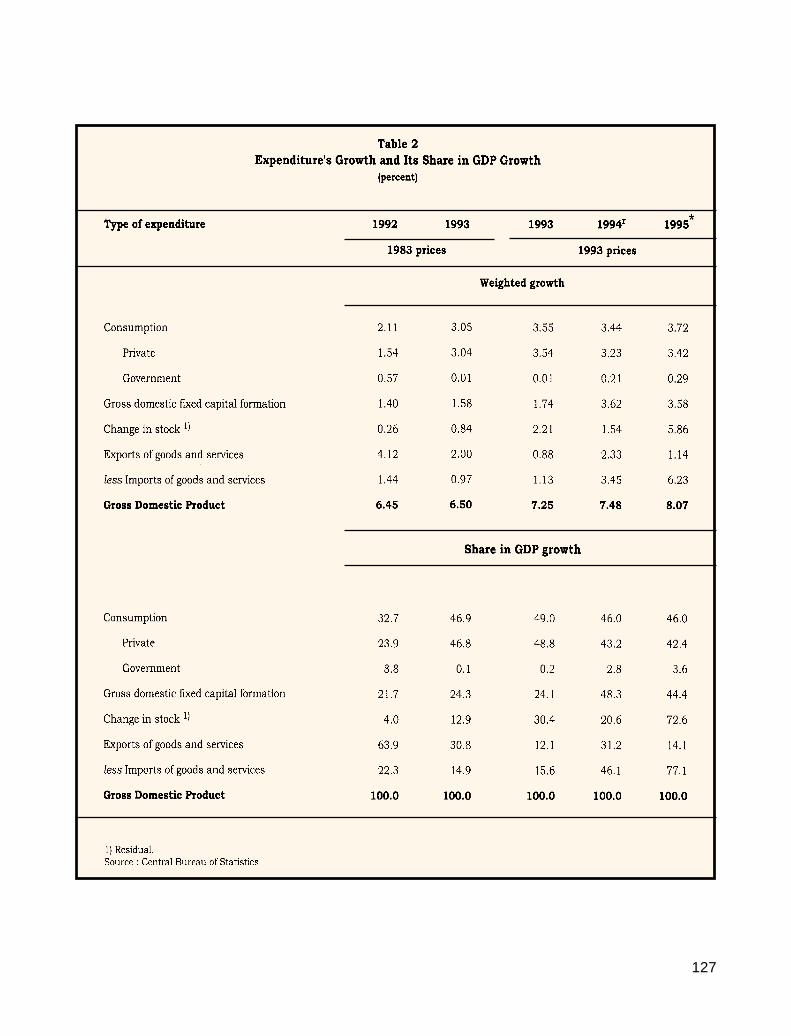
127
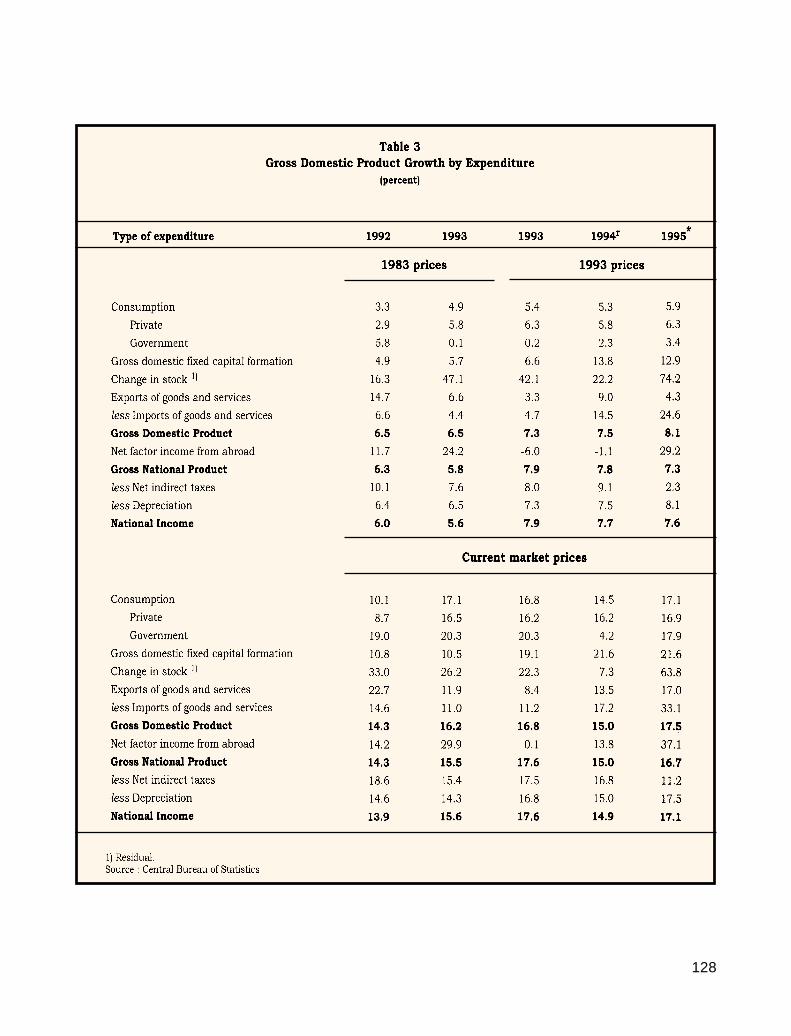
128
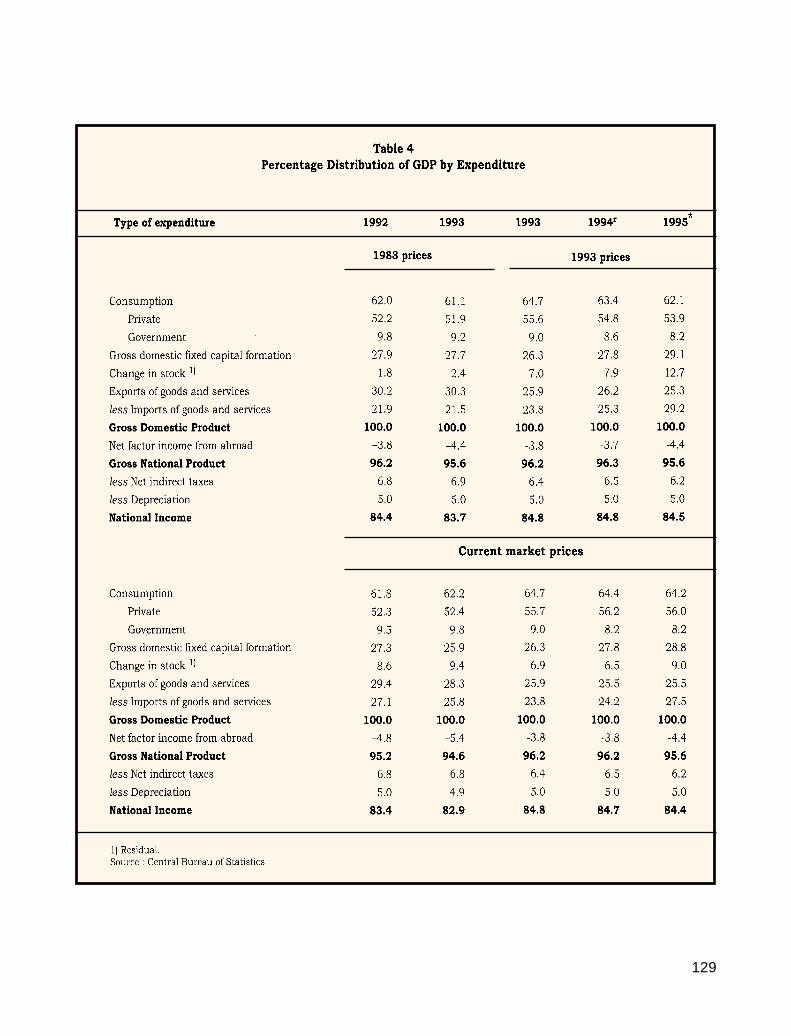
129
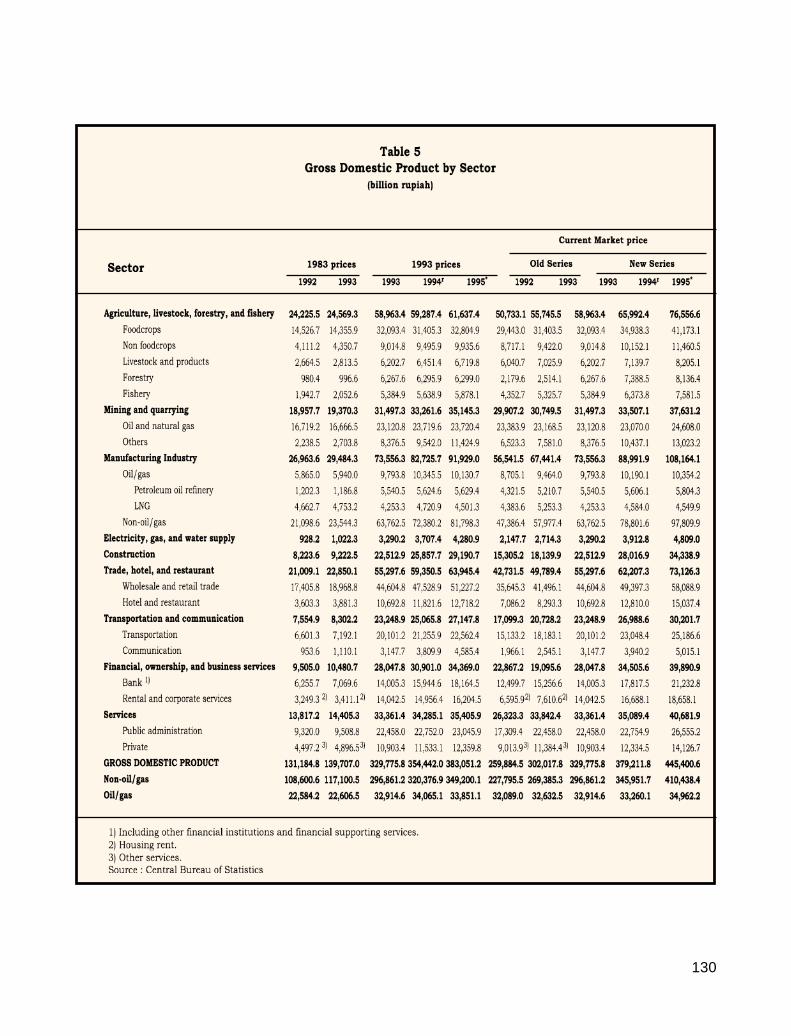
130
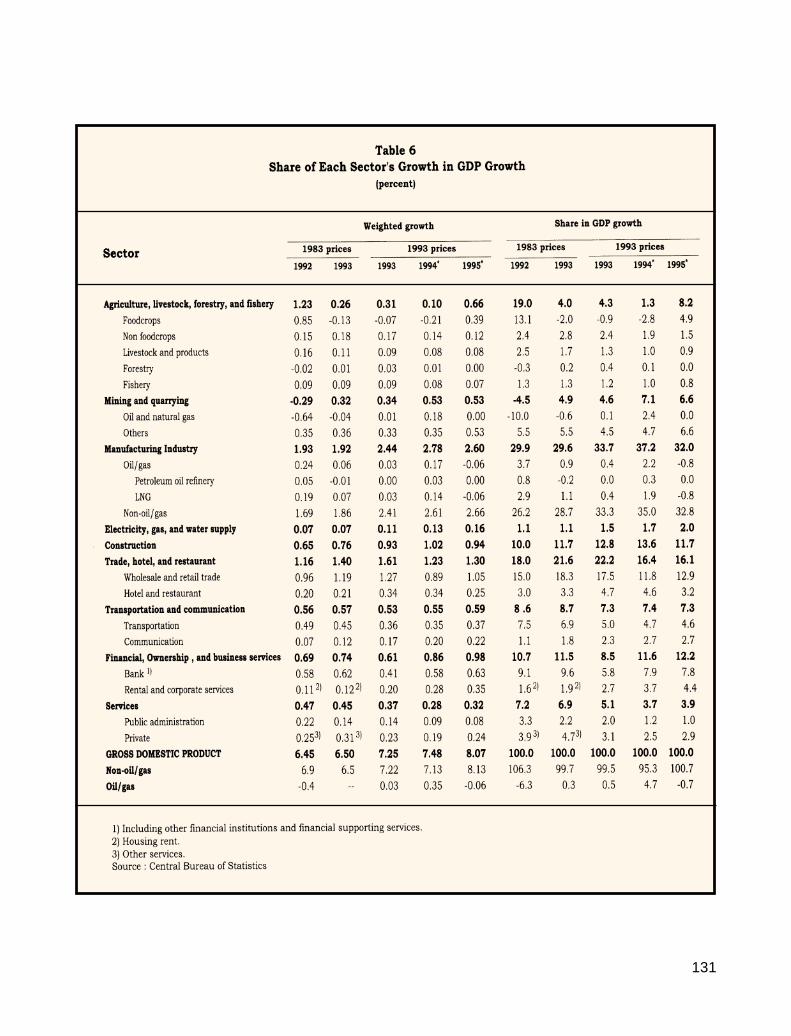
131
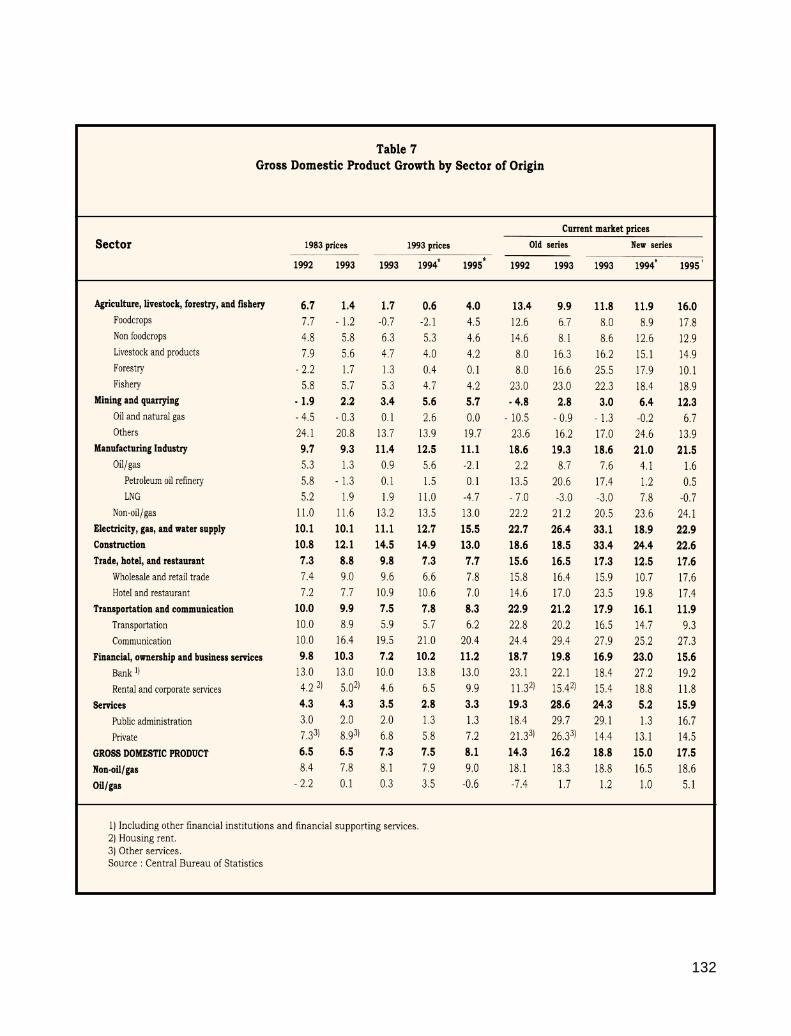
132
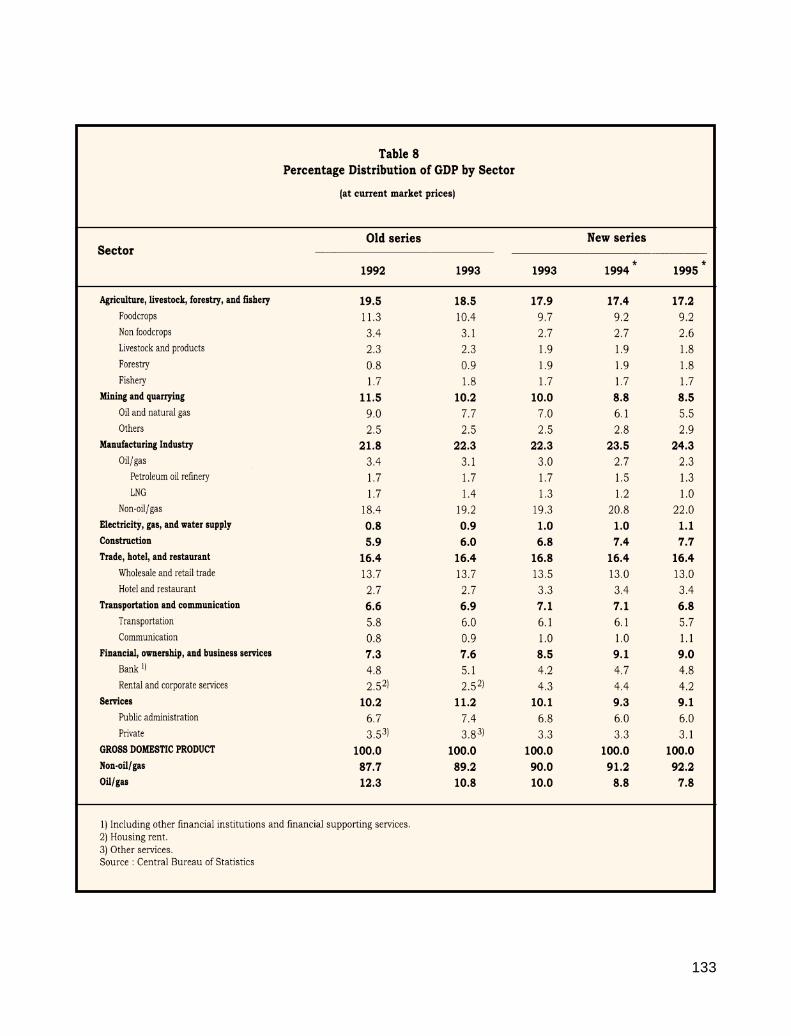
133
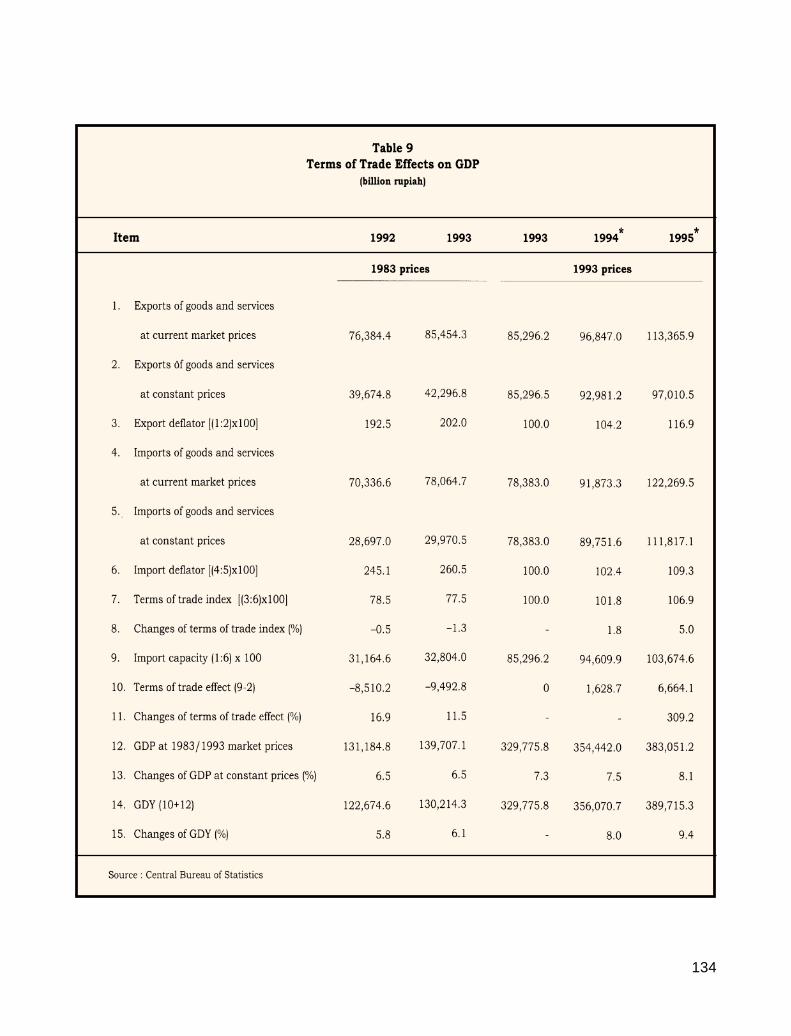
134
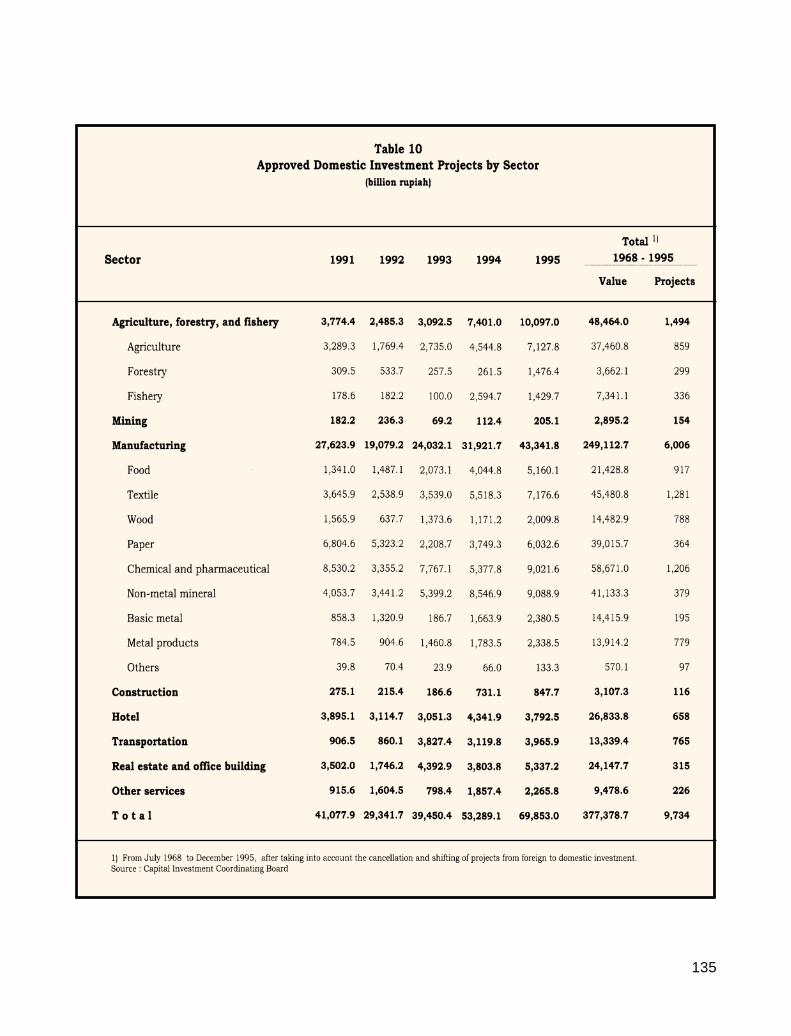
135
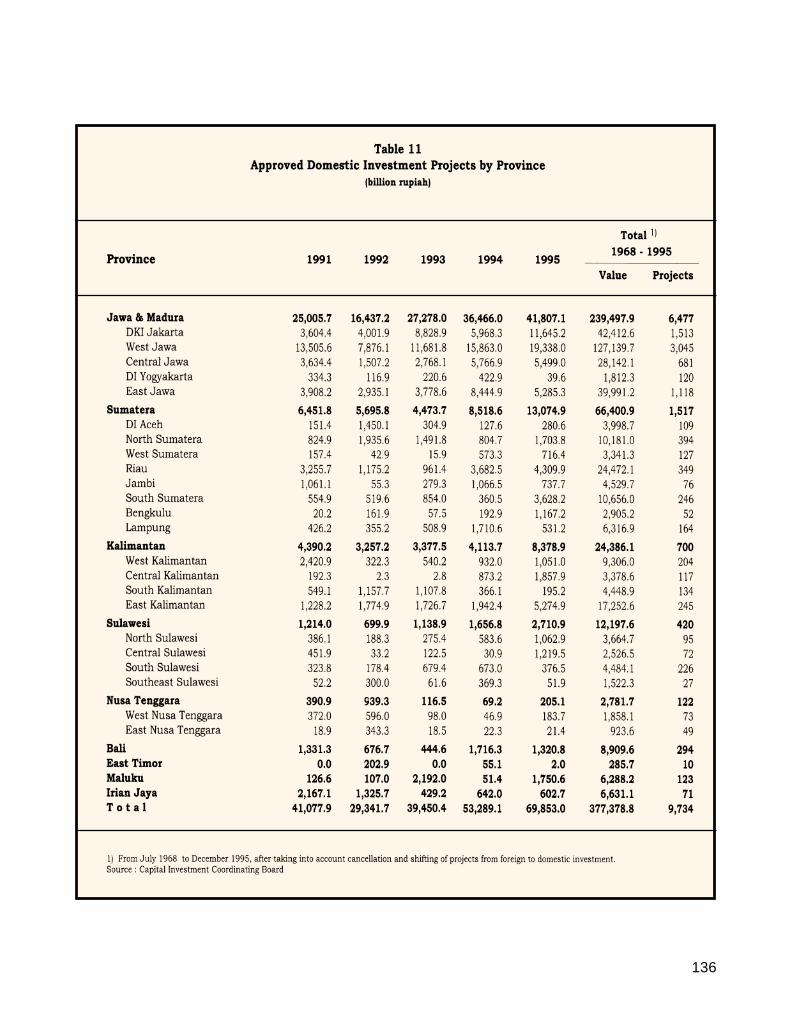
136
137
138
139
140
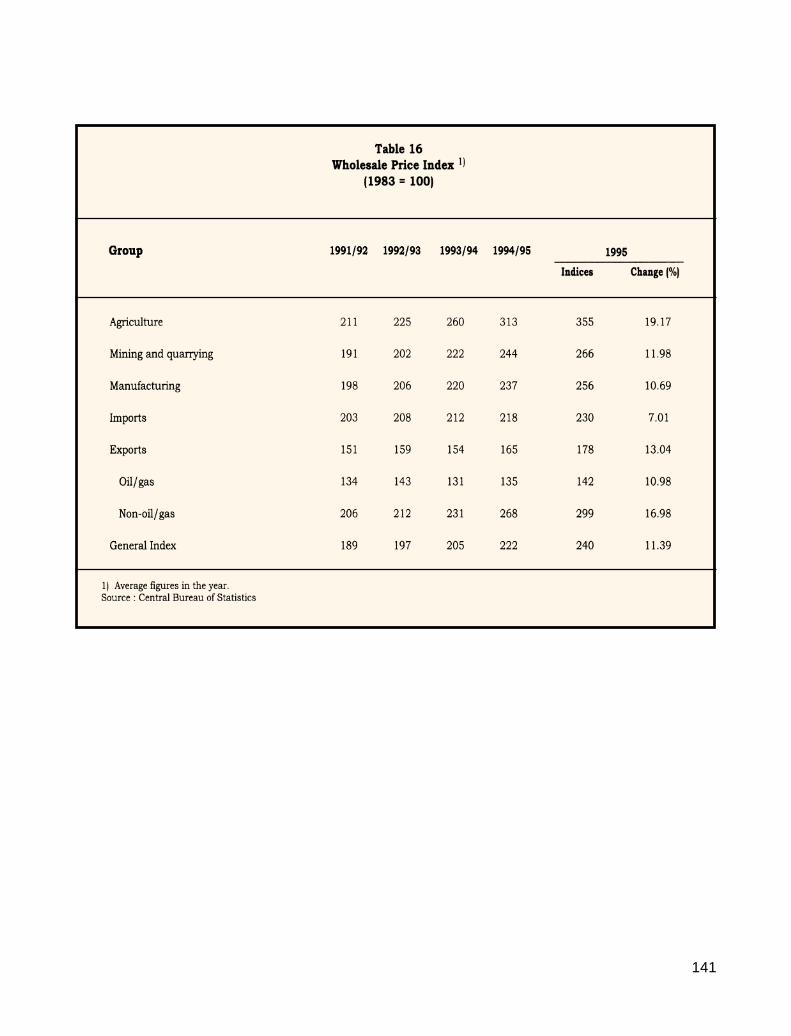
141
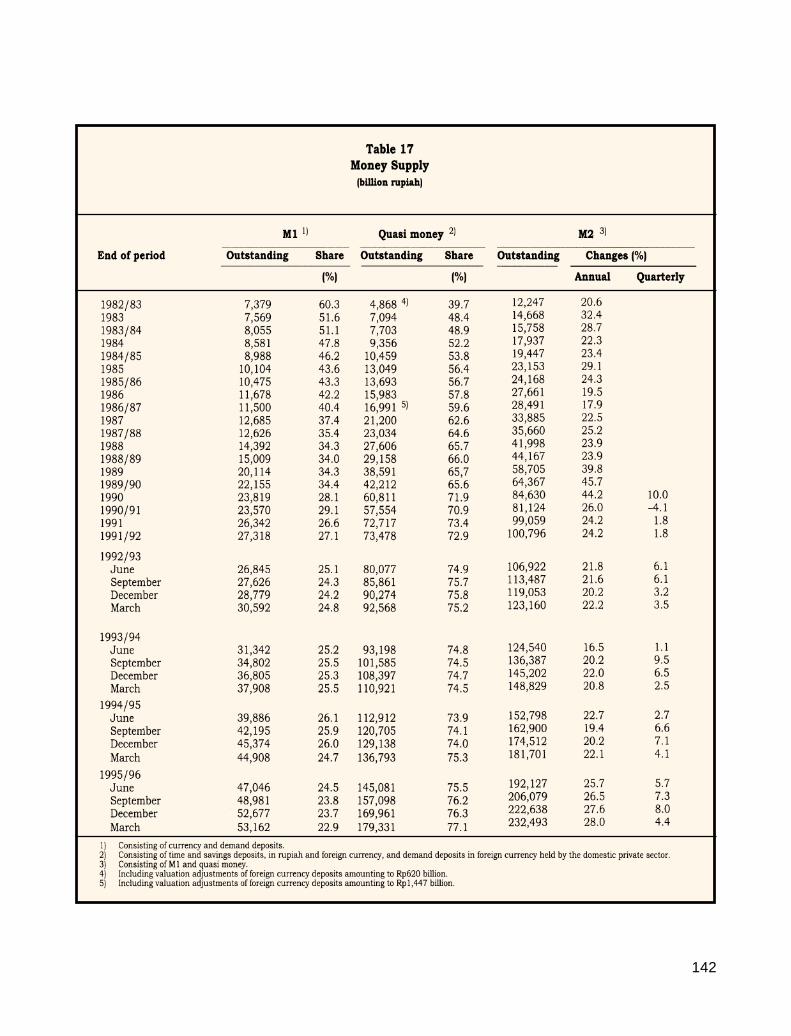
142

143
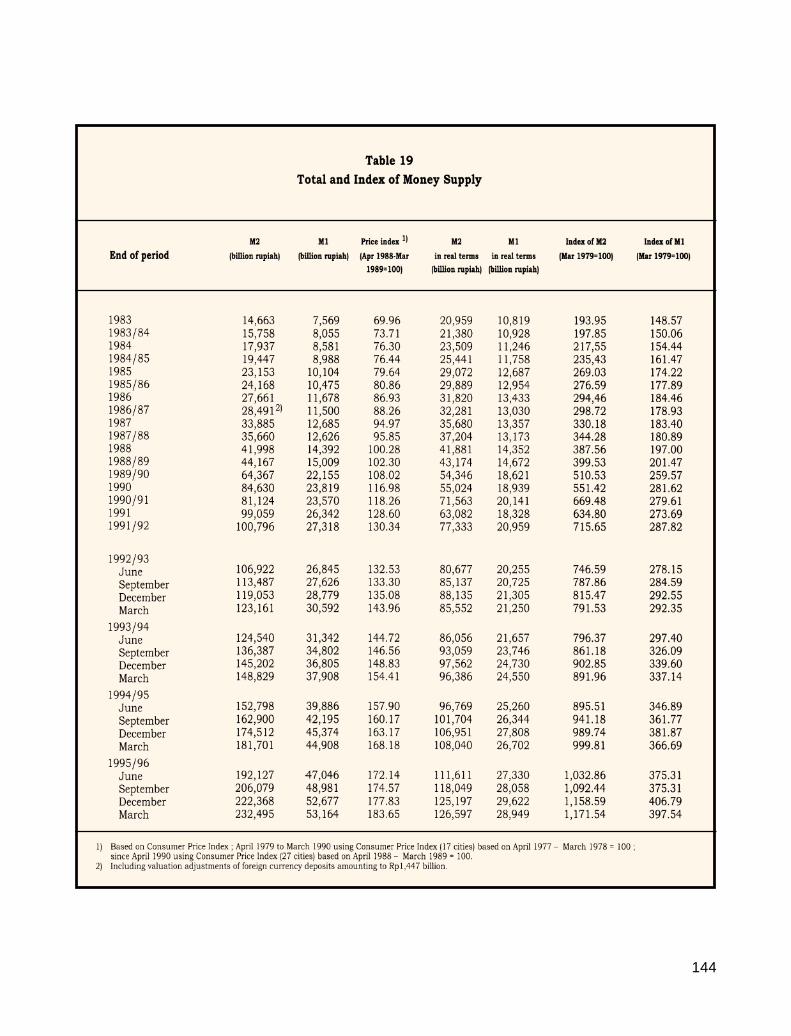
144
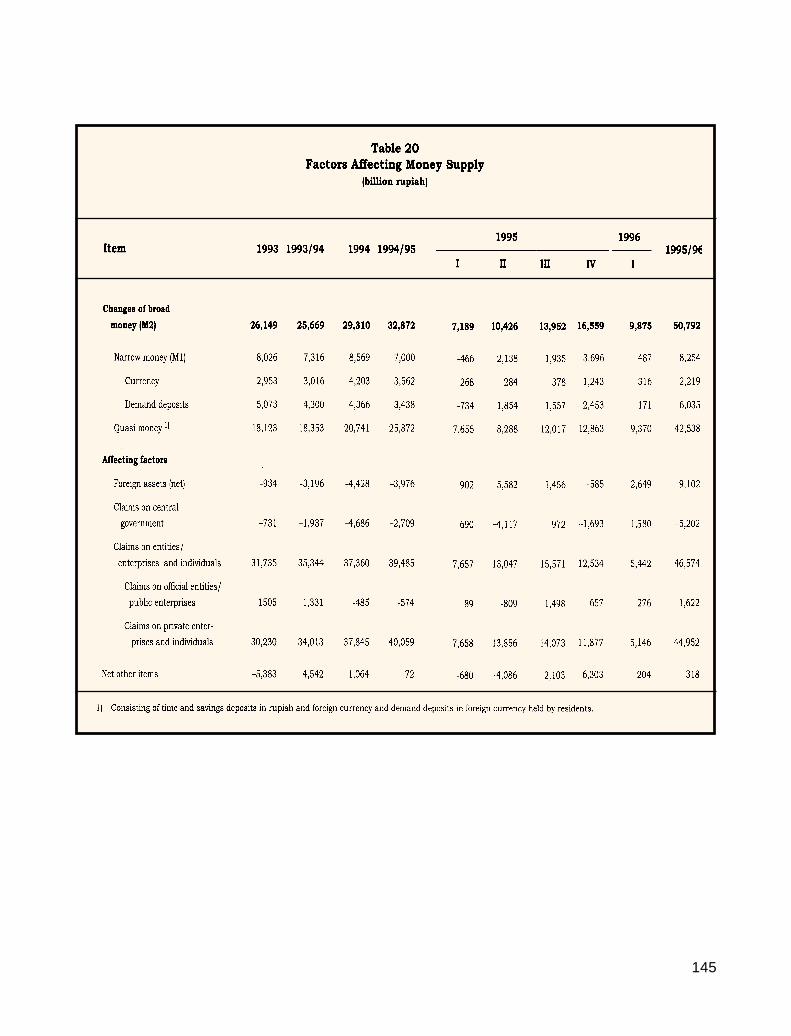
145
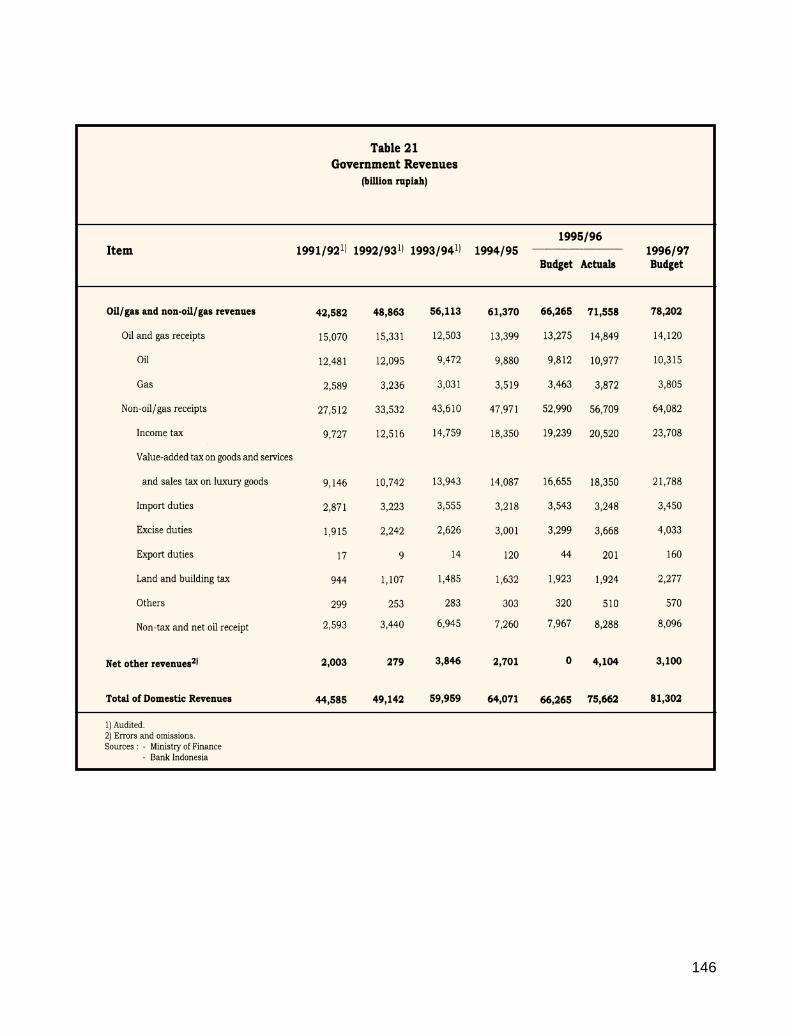
146
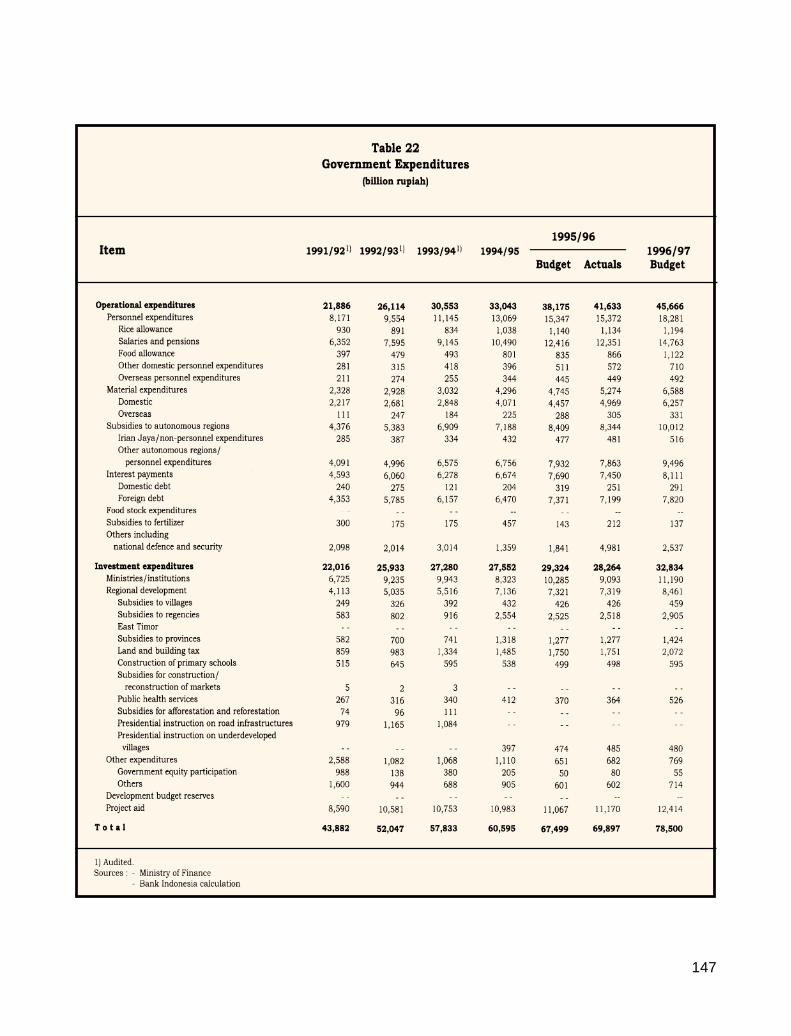
147
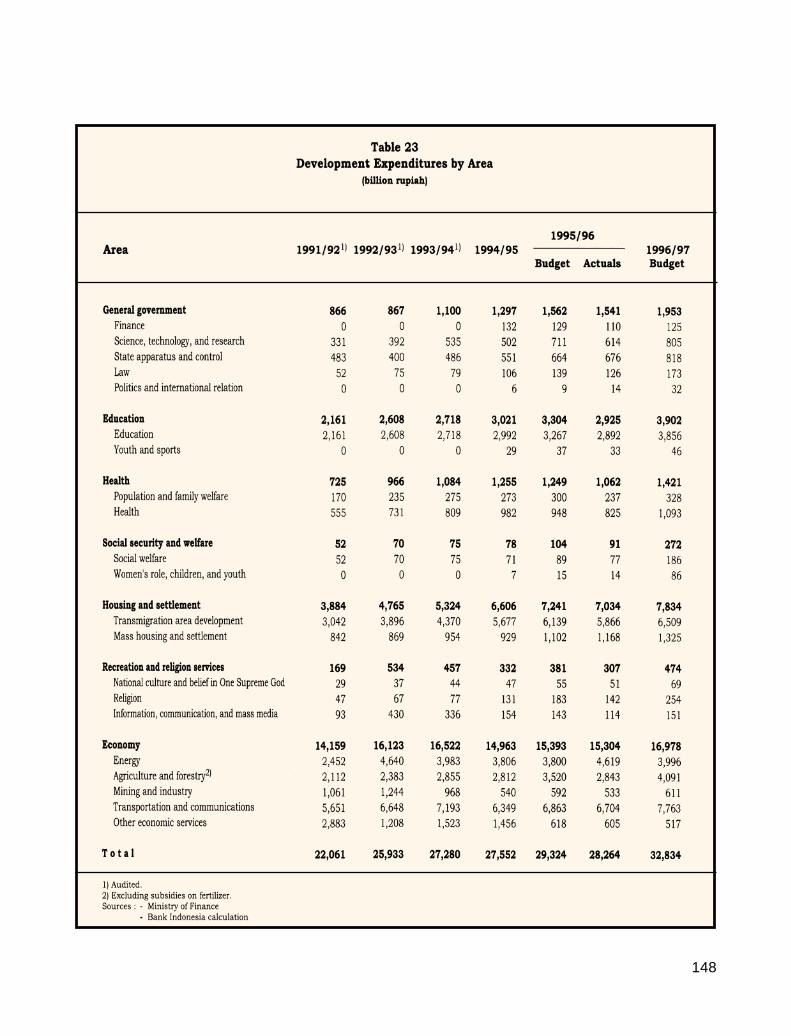
148
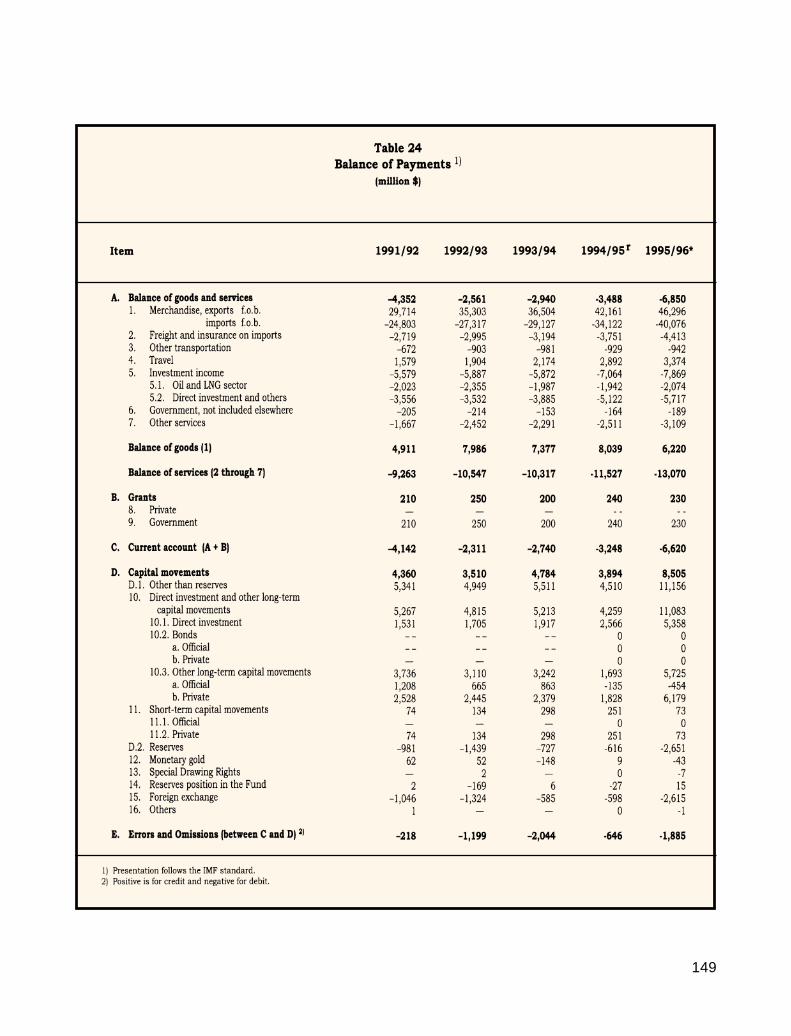
149
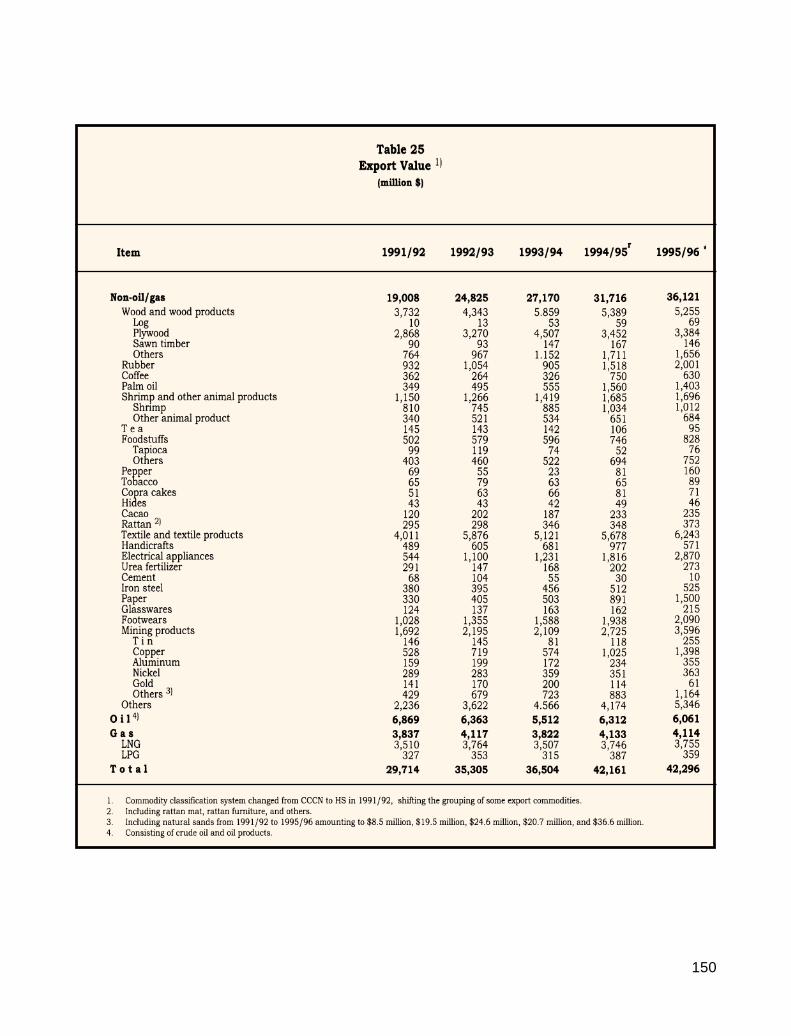
150
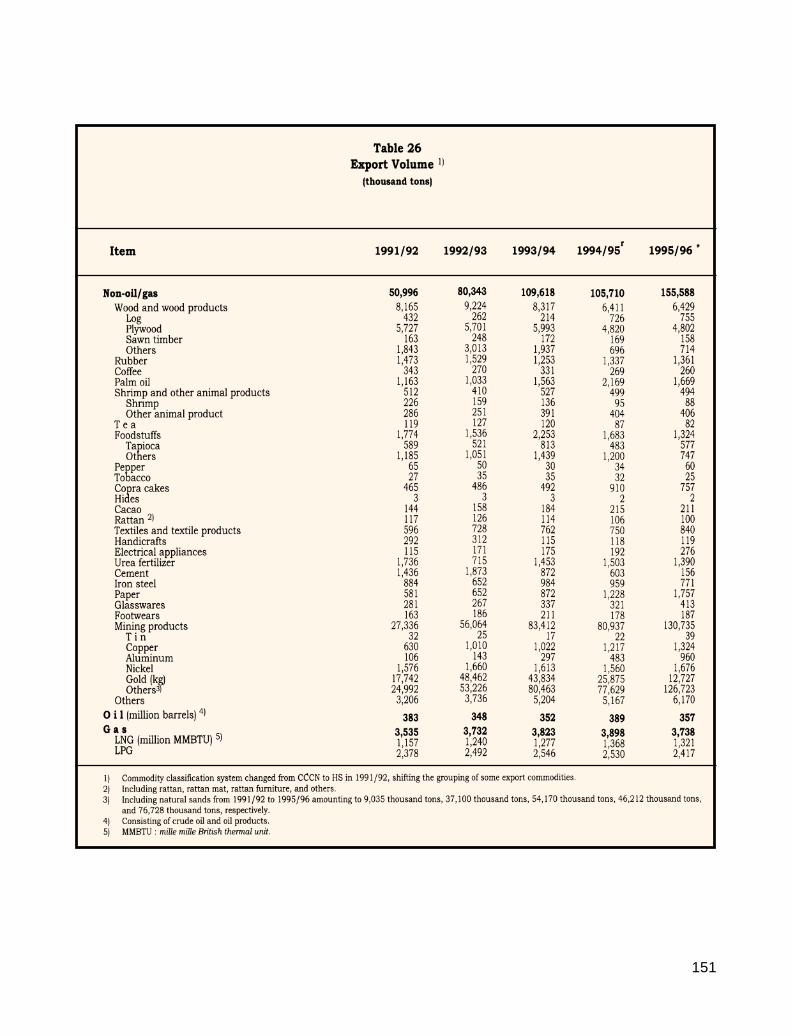
151
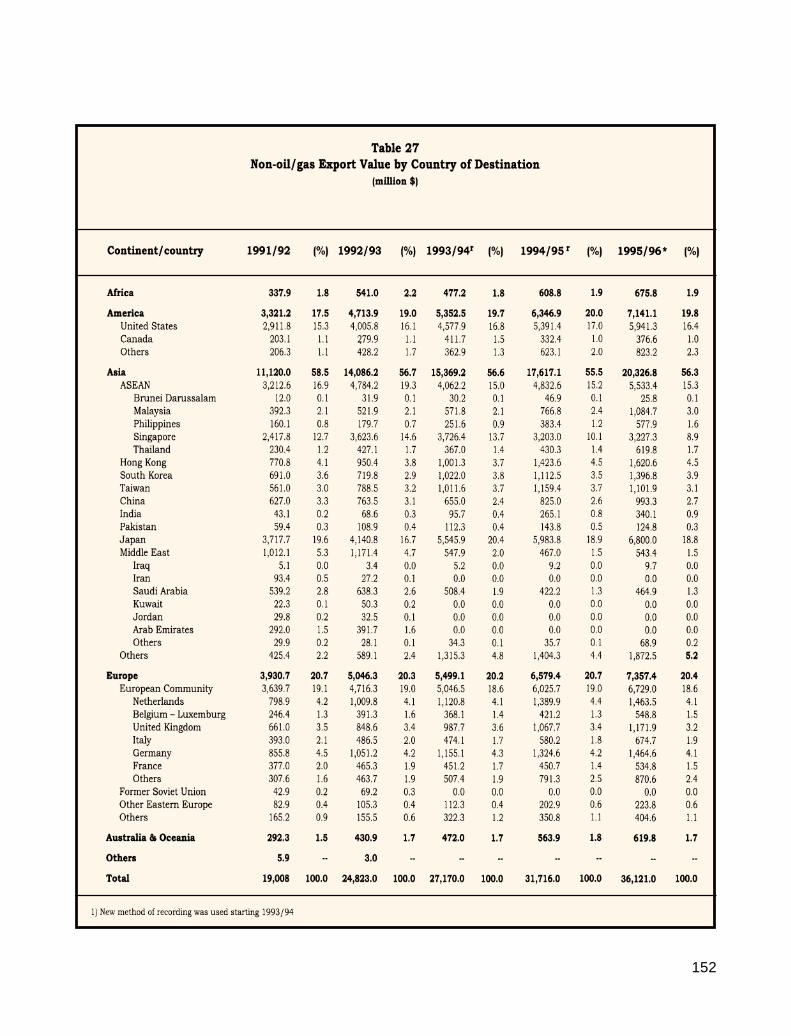
152
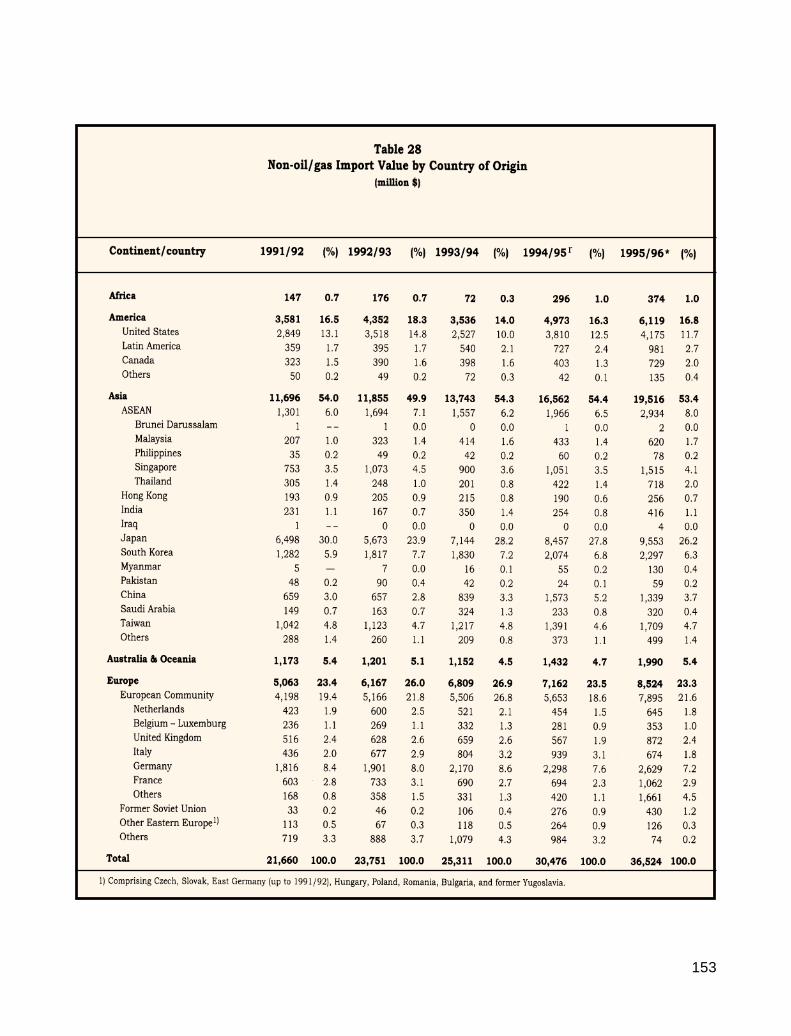
153
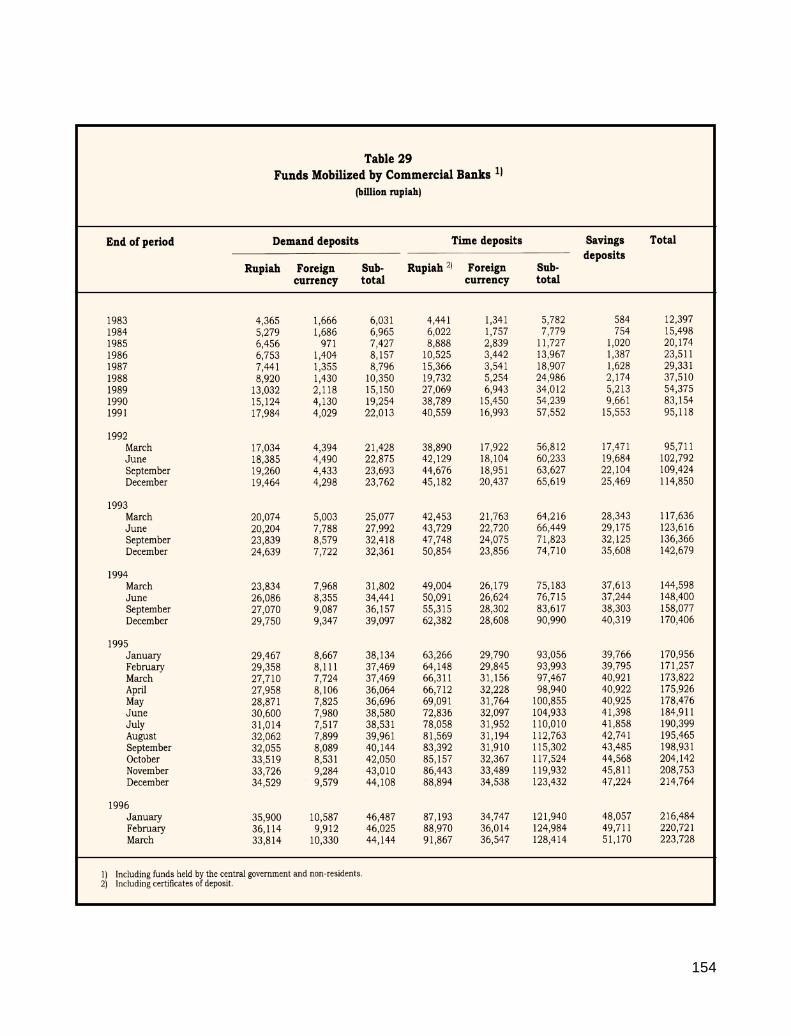
154
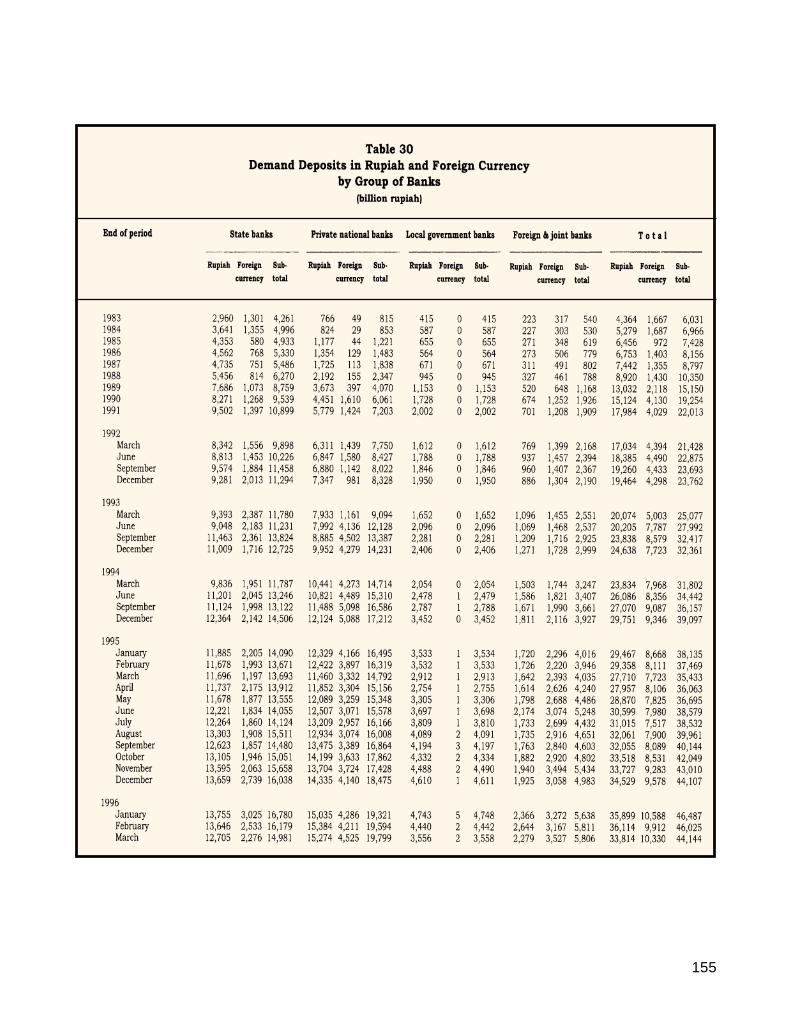
155
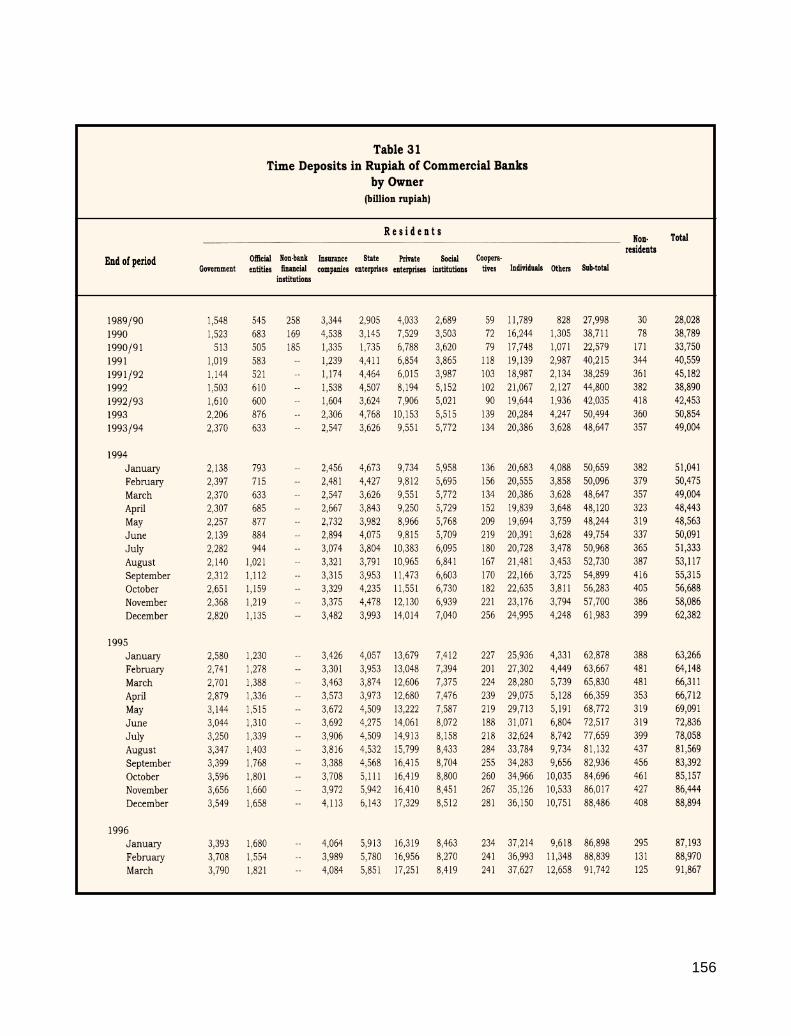
156
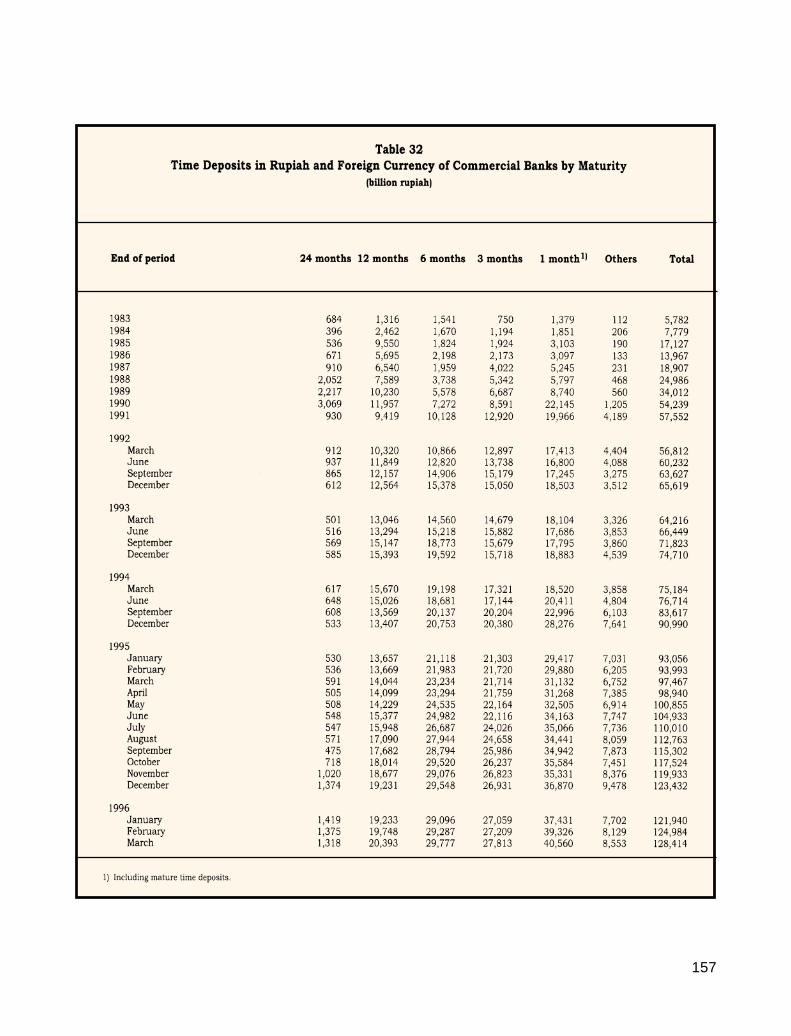
157
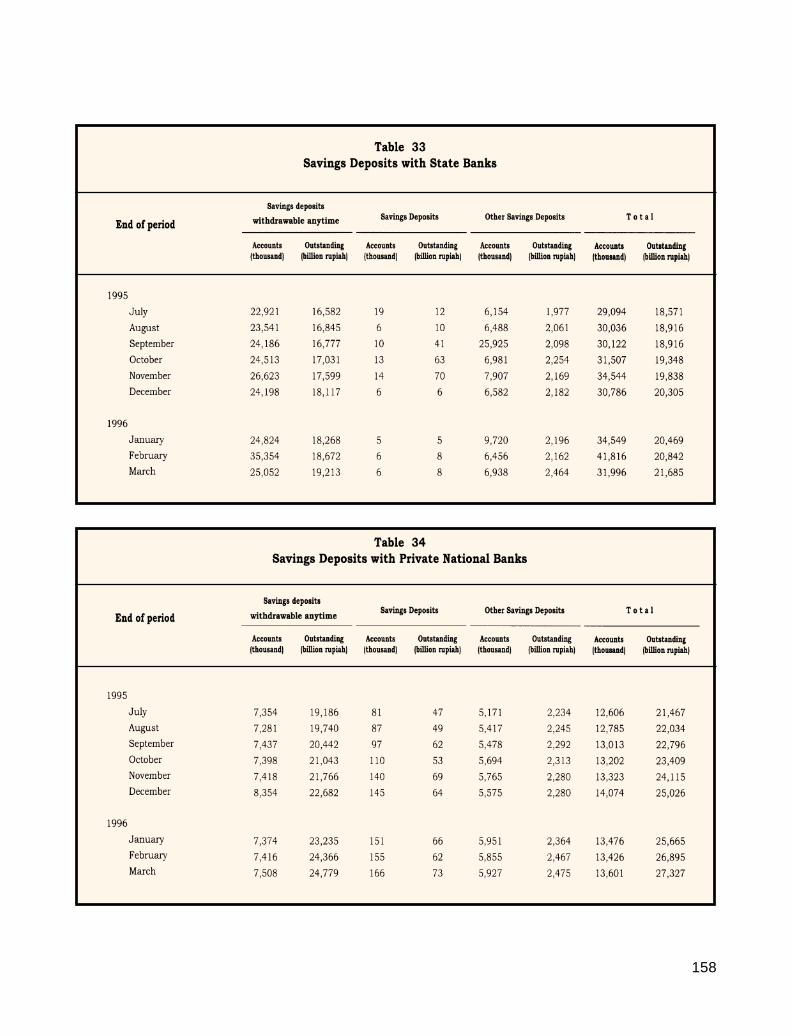
158
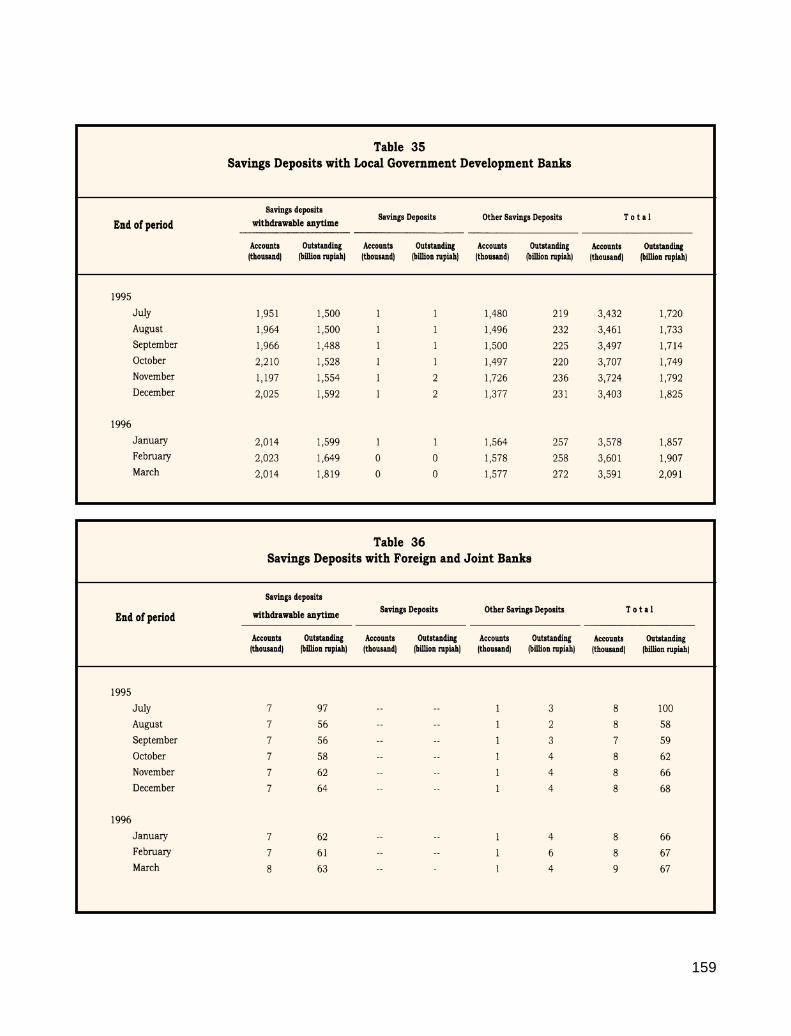
159
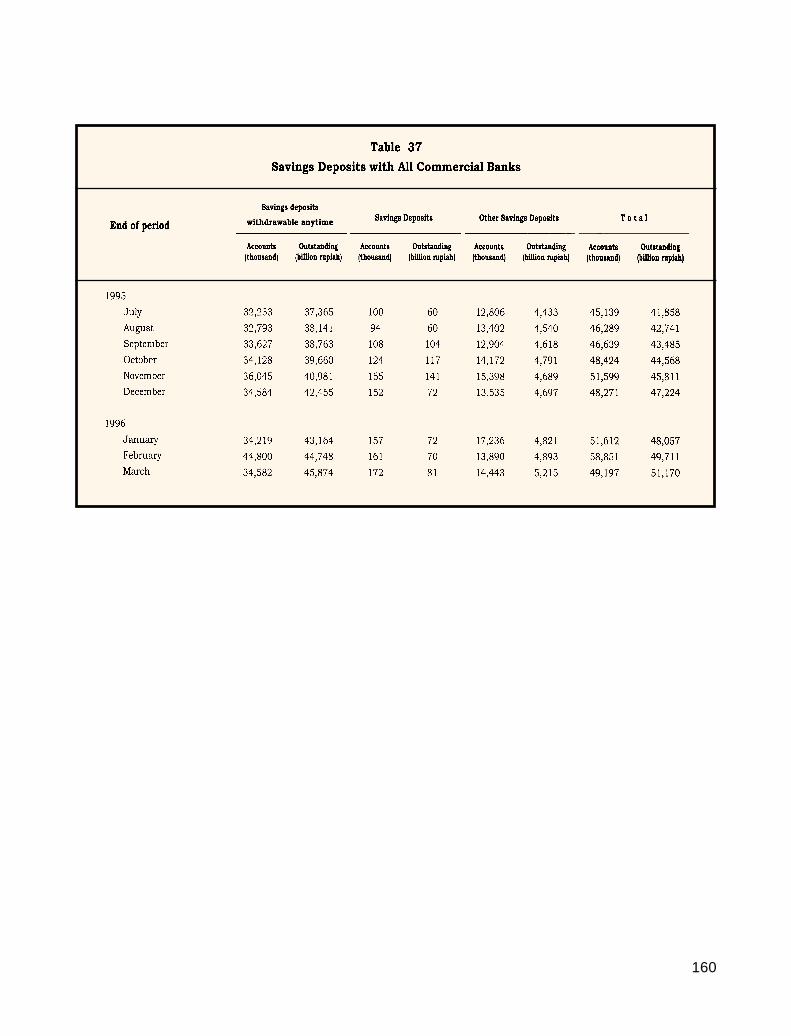
160
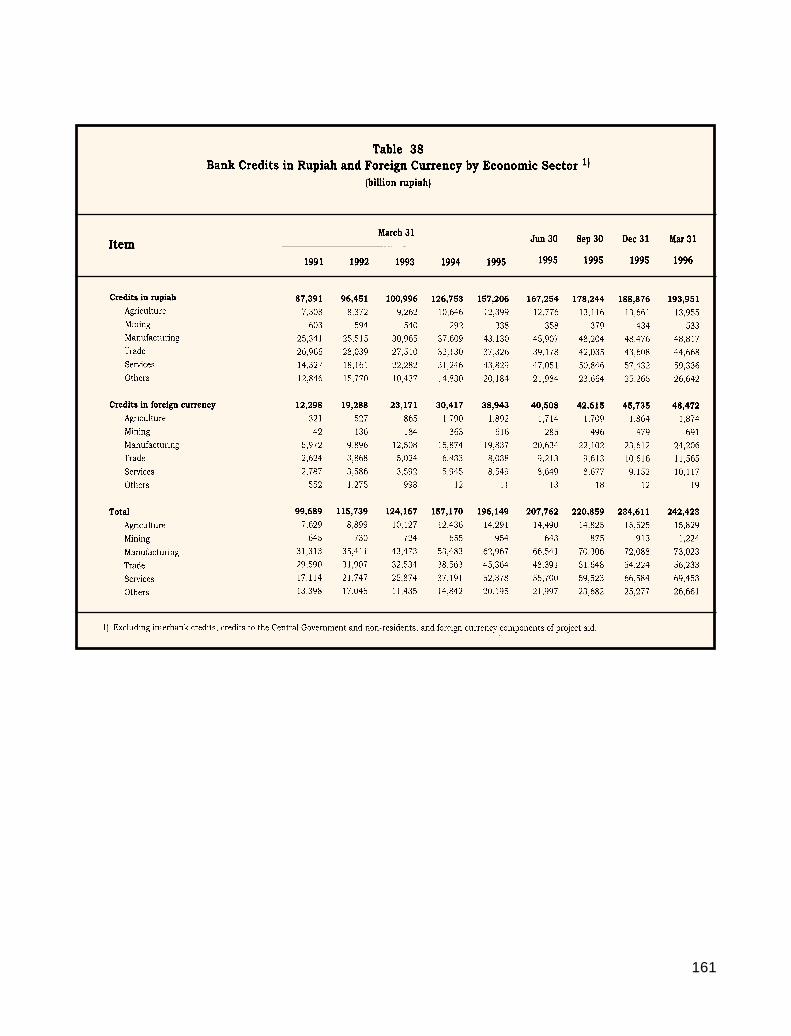
161
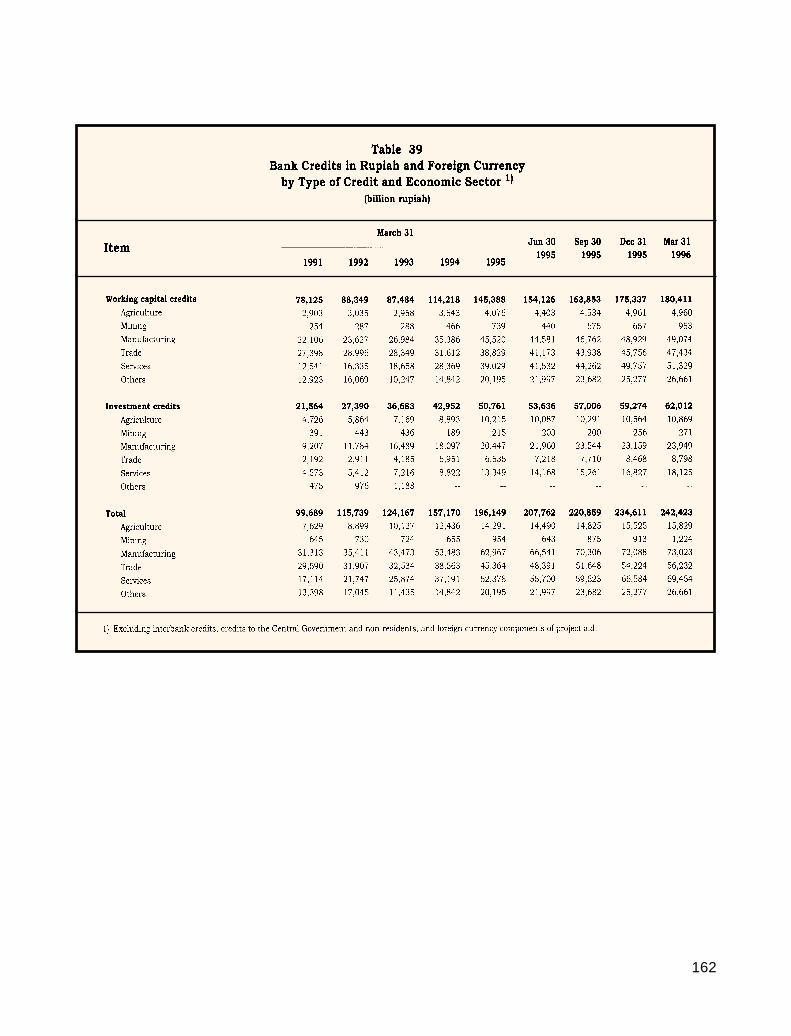
162
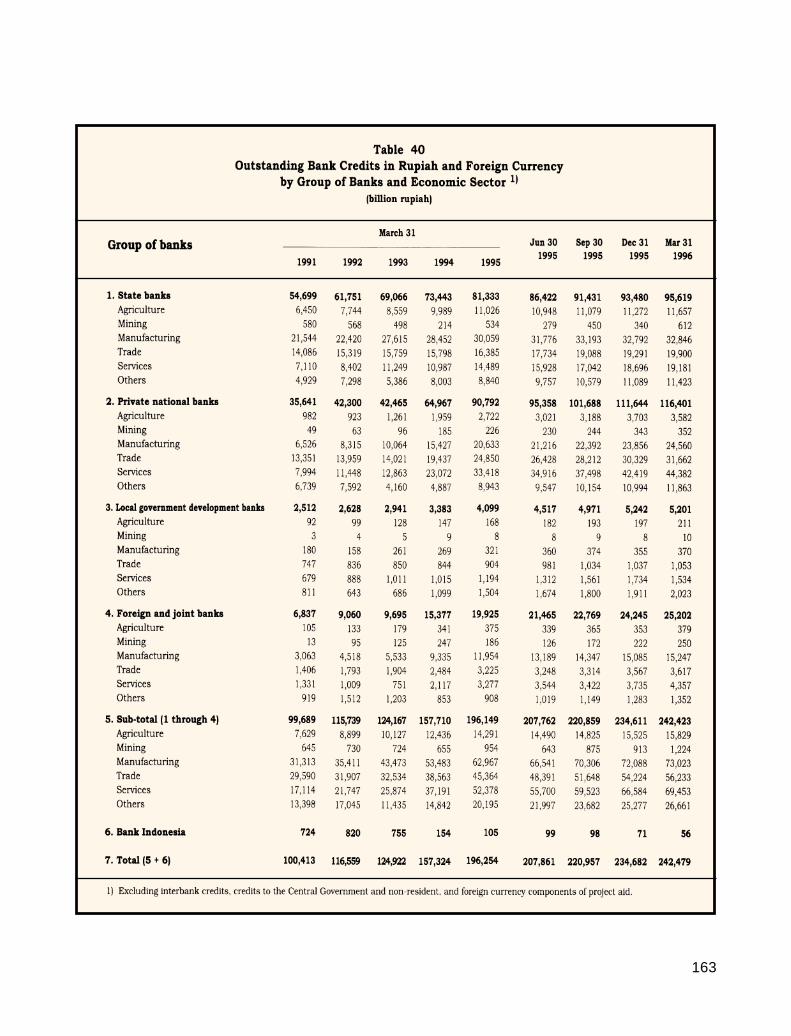
163
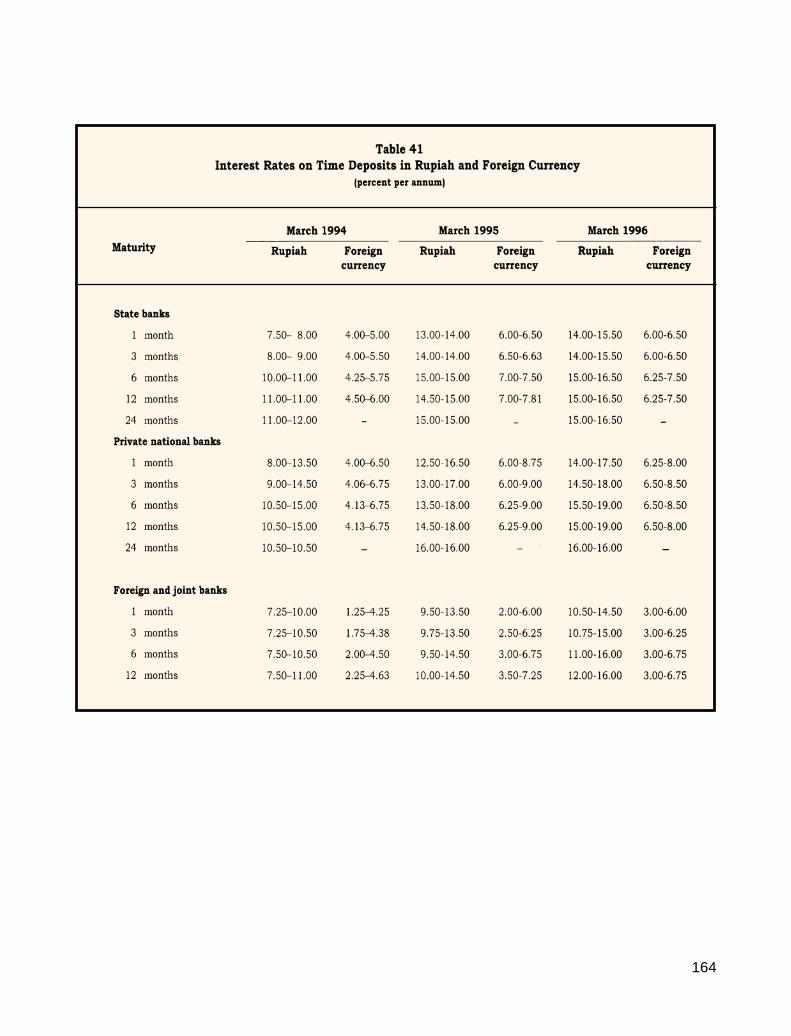
164
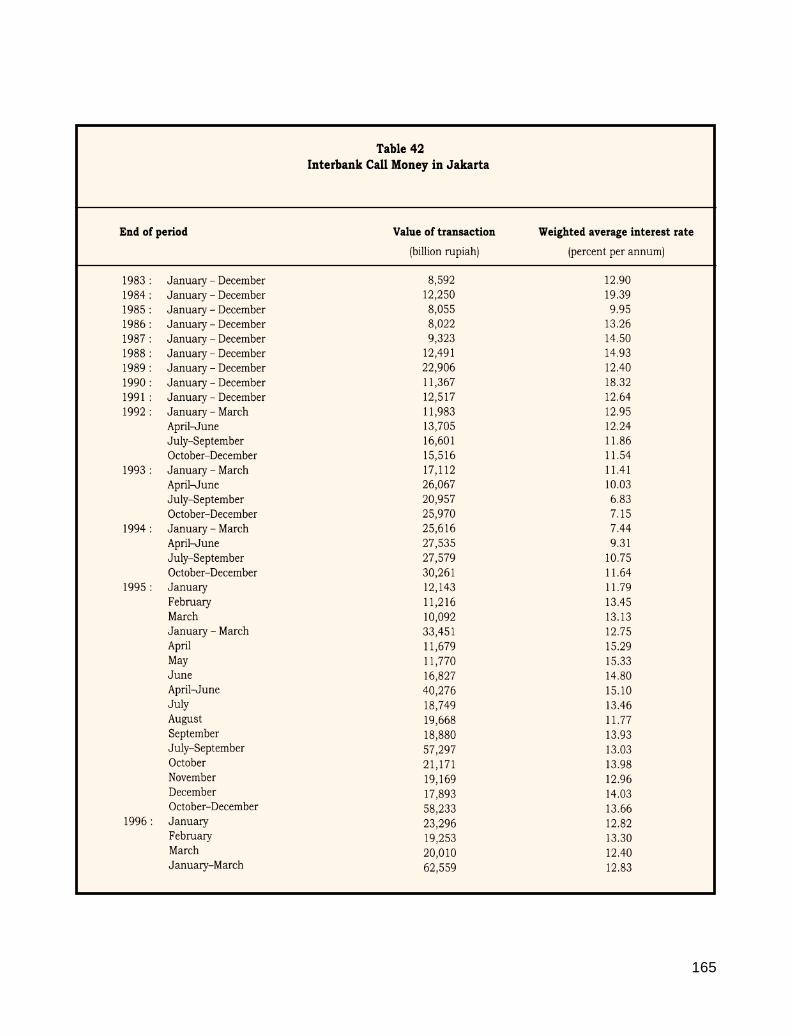
165
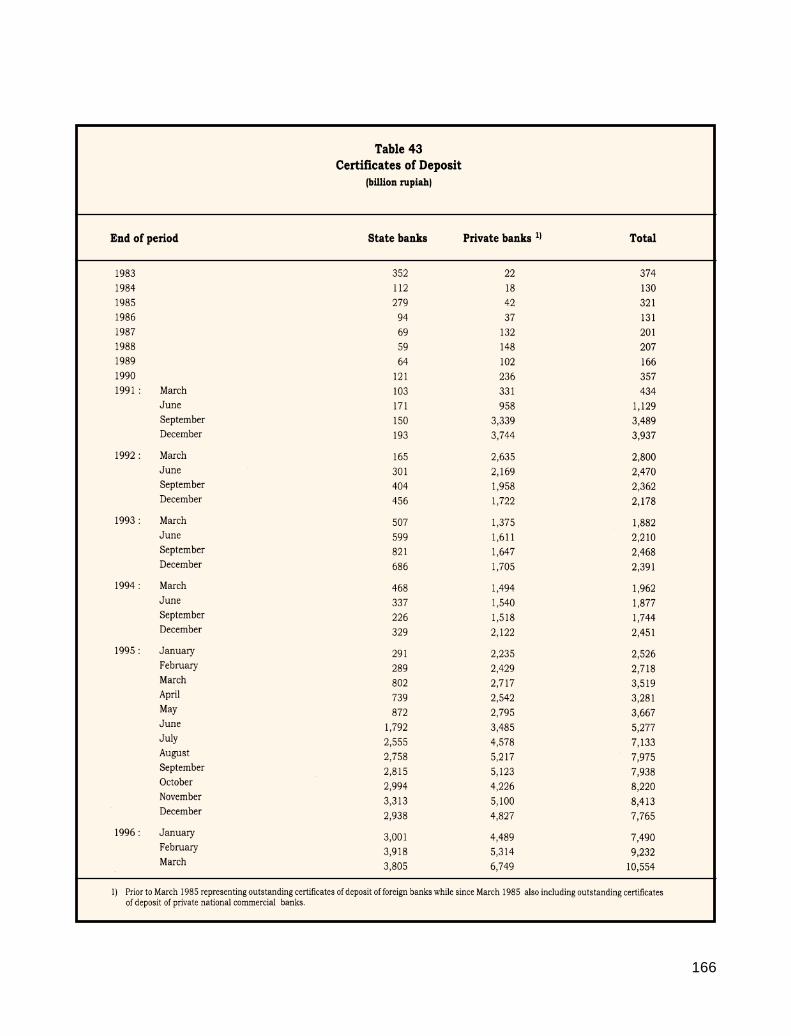
166
167
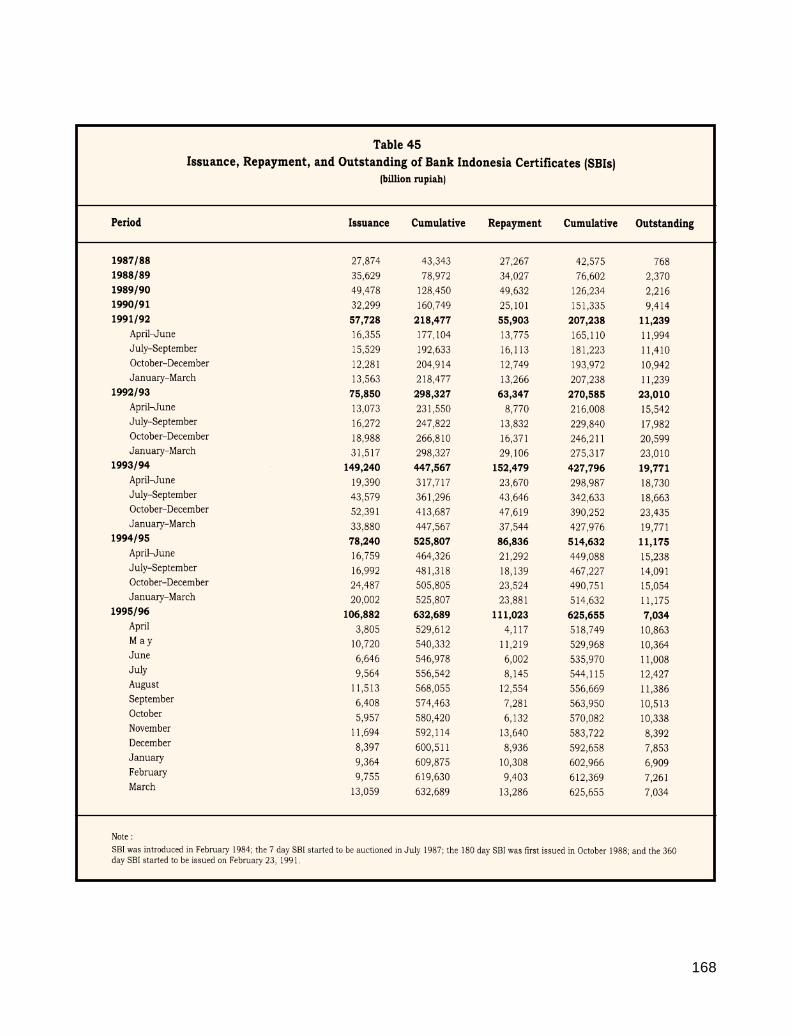
168
169
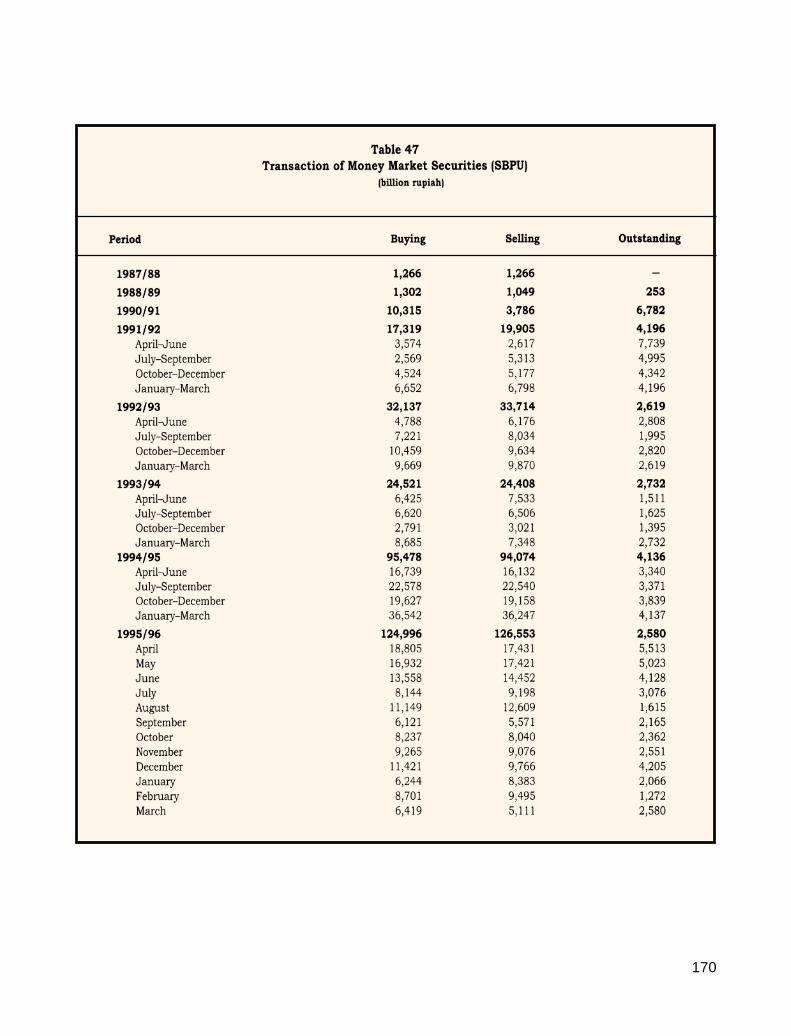
170
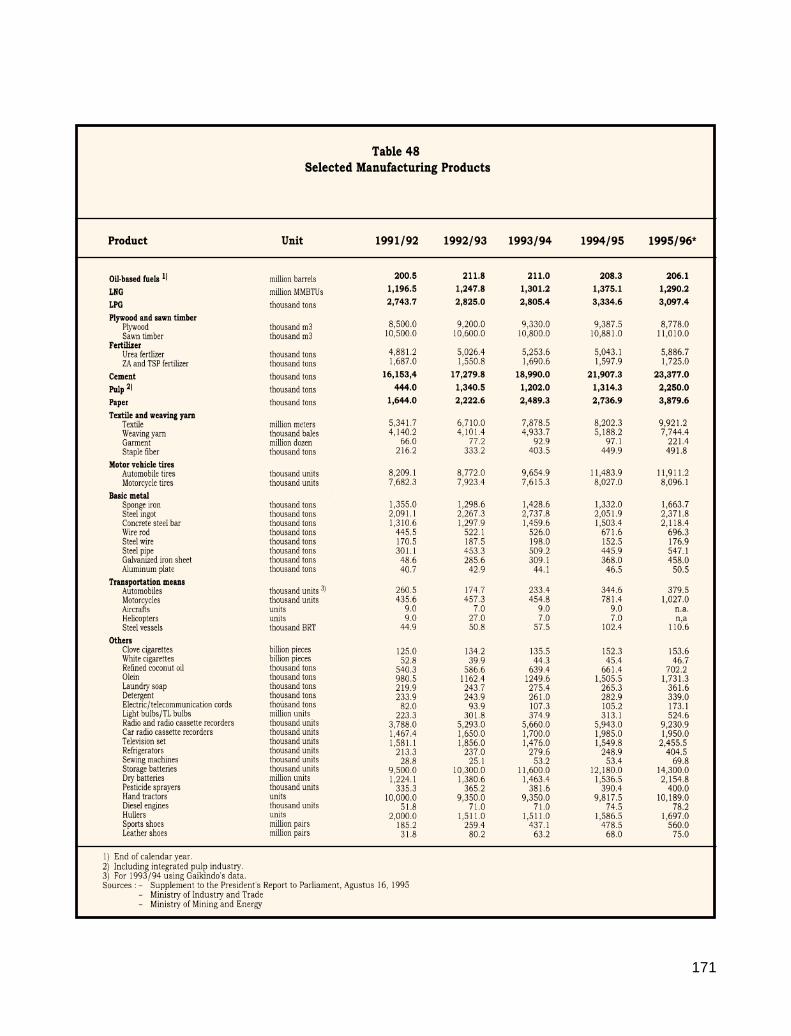
171
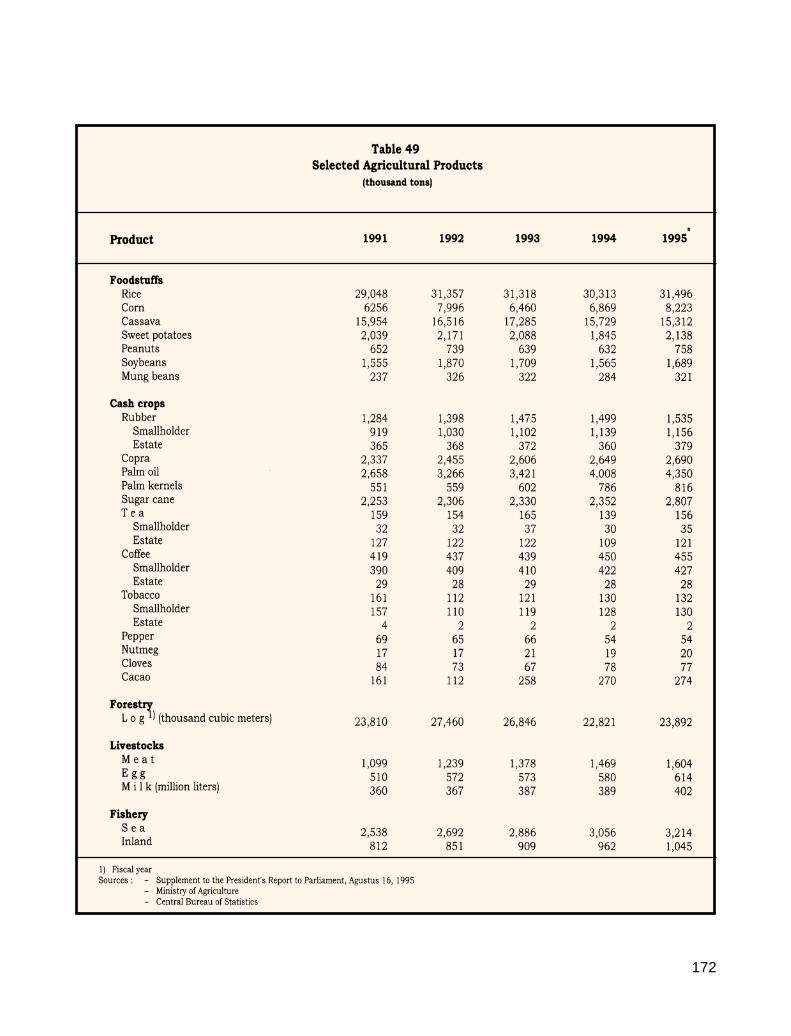
172
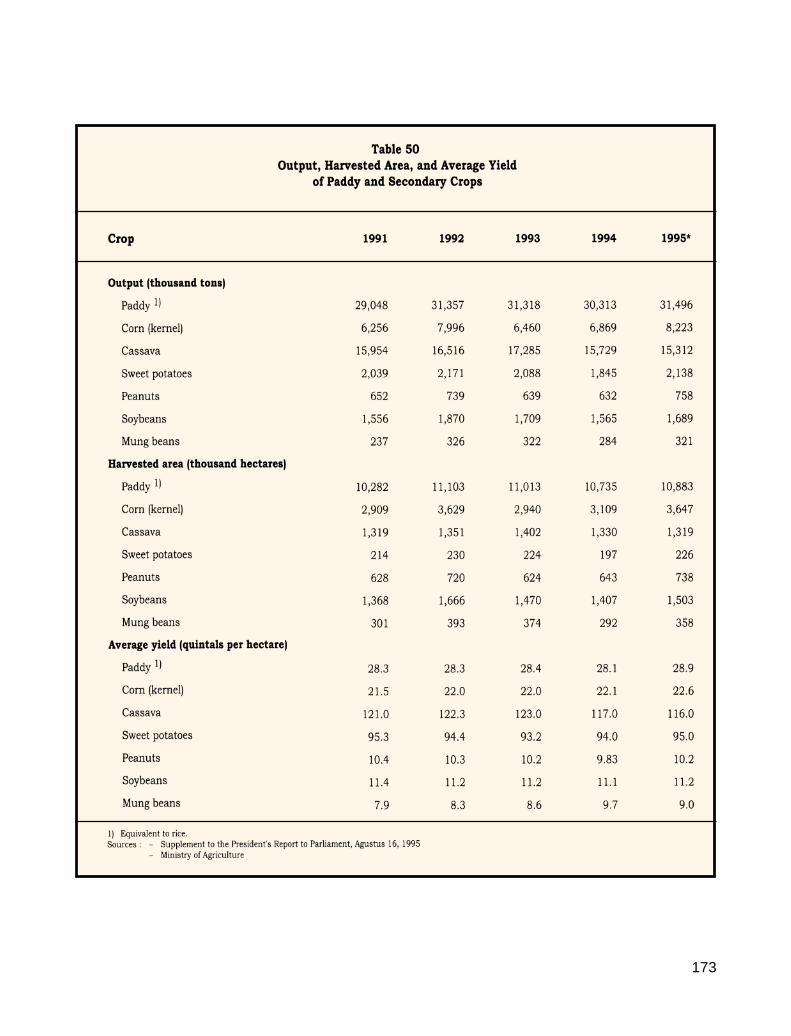
173
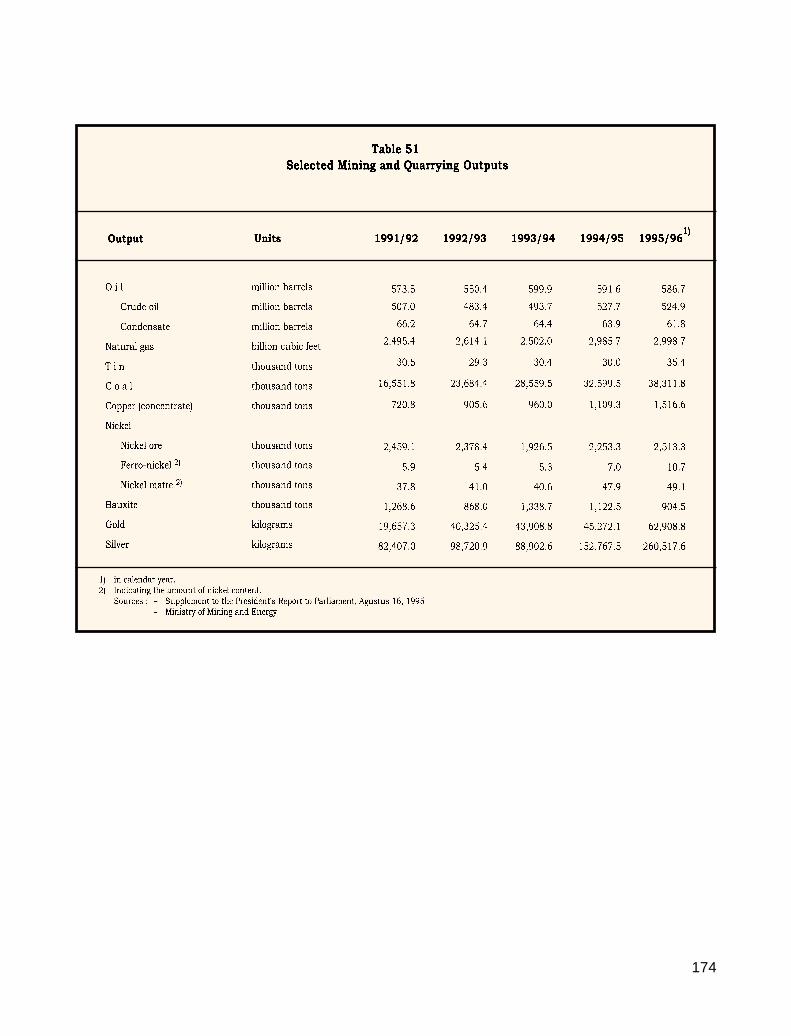
174
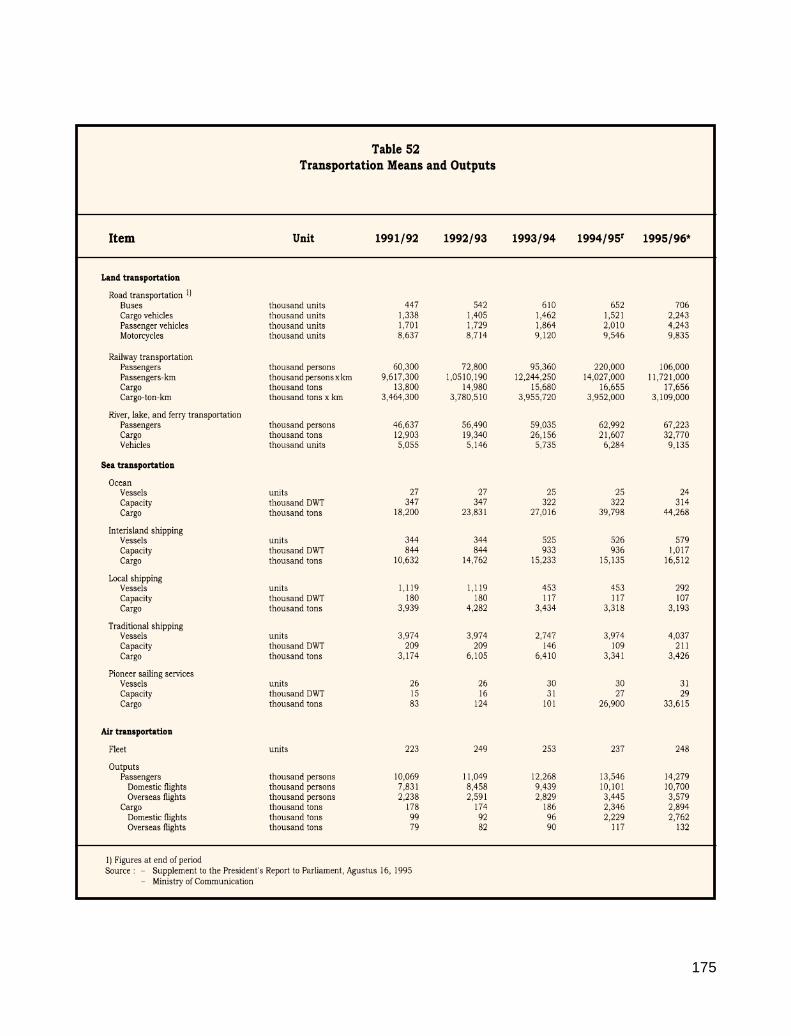
175
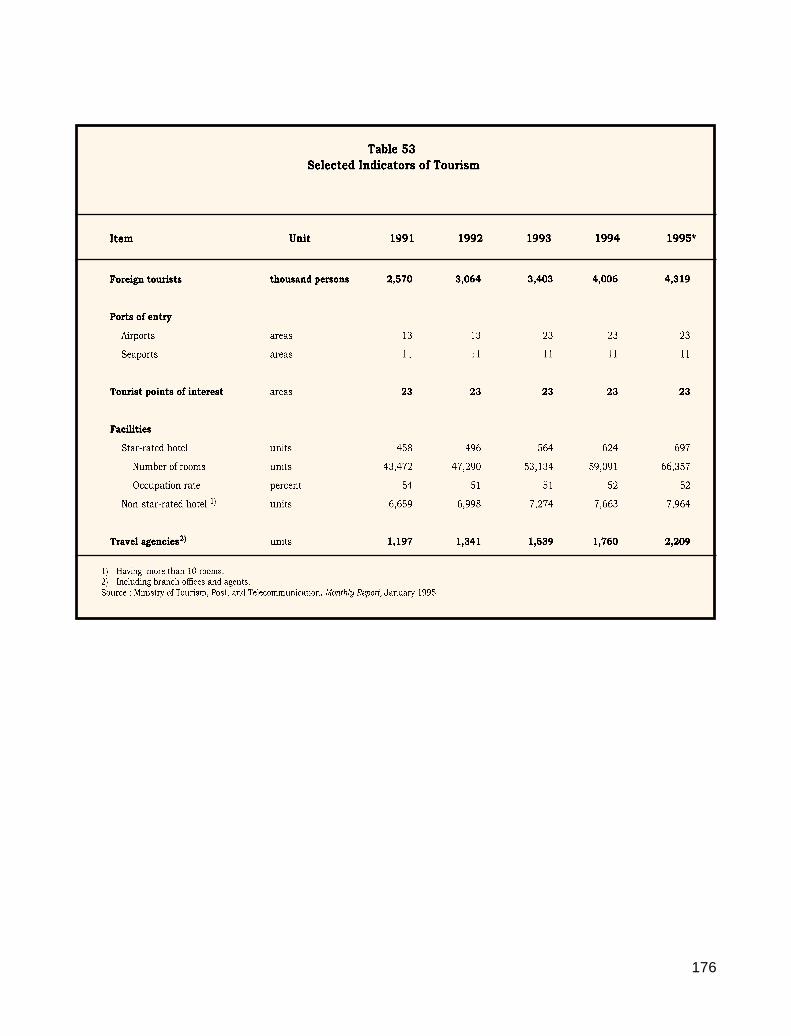
176
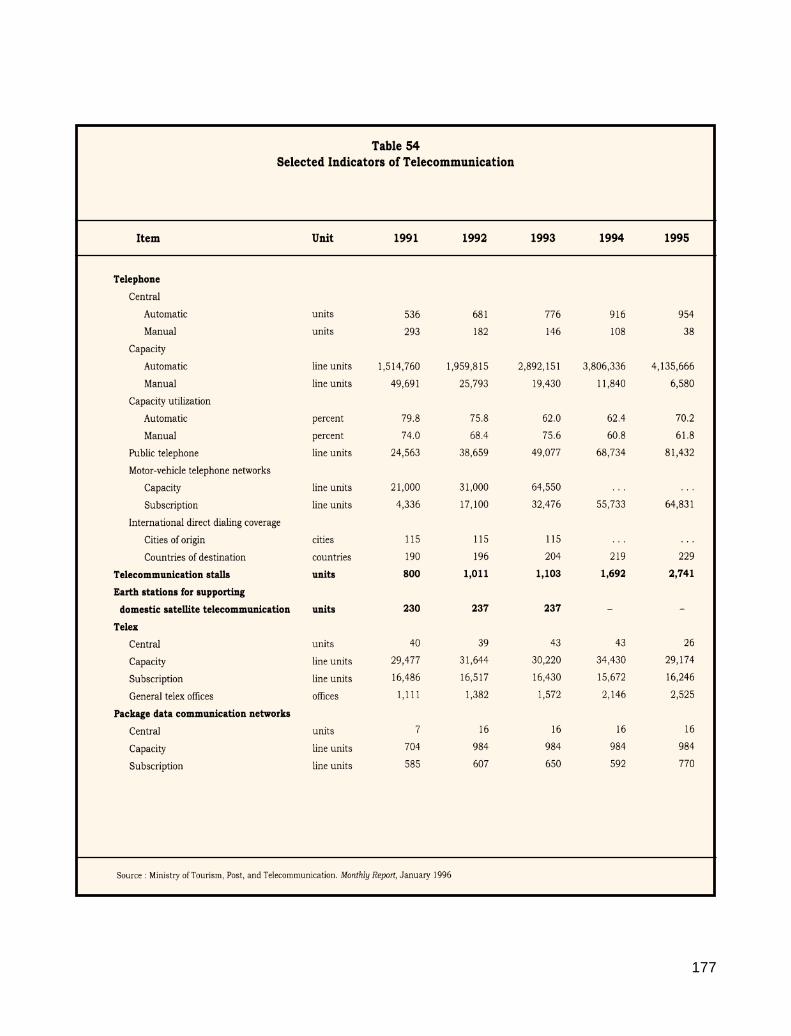
177
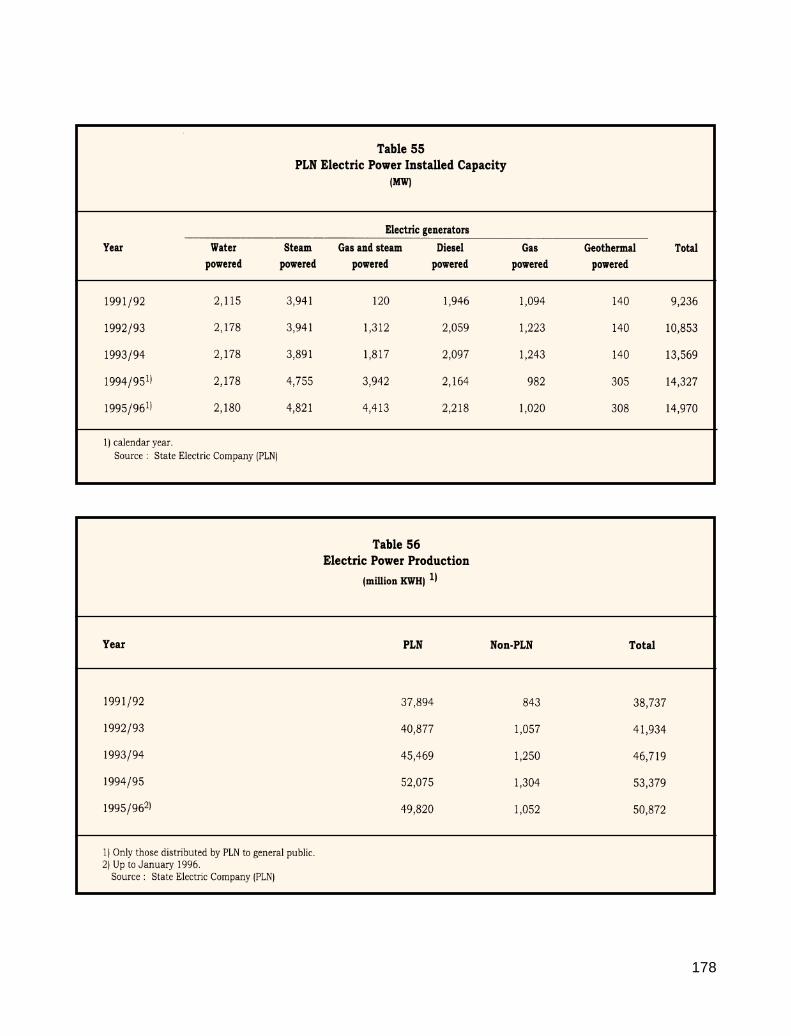
178
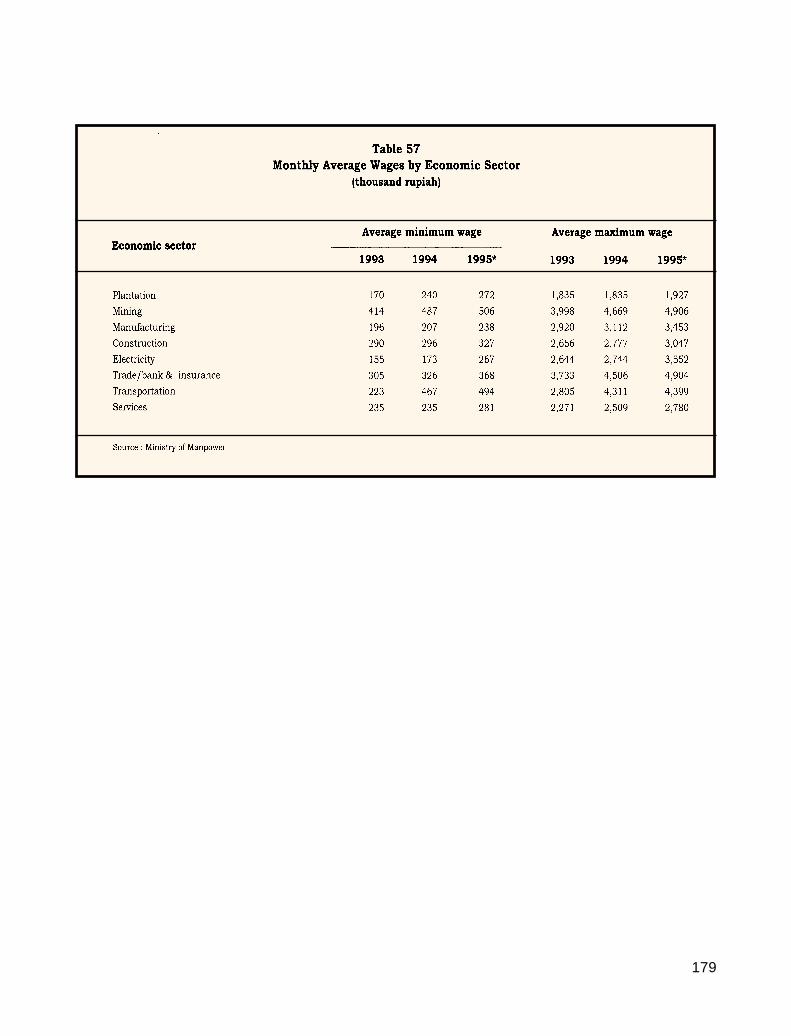
179