band shape analysis of fourier transform infrared spectra
TRANSCRIPT
Band Shape Analysis of Fourier Transform Infrared Spectra
P. C. G I L L E T T E , J . B . L A N D O , a n d J . L. KOENIG Department of Macromolecular Science, Case Western Reserve University, Cleveland, Ohio 44106
The application of a finite difference Levenberg-Marquardt non- linear least-squares procedure for the resoluton of overlapping peaks in Fourier transform-infrared spectra is described. Start- ing estimates of peak parameters utilized in the refinement are obtained from a numerically approximated second derivative spectrum which has been smoothed. Quantitative information reflecting the constituent peaks and the "goodness of fit" is displayed graphically in a procedure requiring much less than I min to both initiate and obtain results in a form that is readily interpreted. Index Headings: Computer, applications; Infrared; Techniques, spectroscopic.
INTRODUCTION
A wide range of procedures have been proposed to assist in extracting information from Fourier transform- infrared (FT-IR) spectra. Spectral stripping, the ratio method, 1 least-squares curve fitting of pure components to mixtures, 2 and factor analysis ~ are but a few of the computer-based techniques available to the spectrosco- pist. All of the forementioned procedures are based upon the use of several spectra to obtain results. Very often one is confronted with the problem of obtaining quanti- tative information from peaks which are extensively overlapped and cannot be separated by other procedures. The solution to this problem has been studied exten- sively4, 5 and has generally taken the form of approxi- mating the observed spectrum as the sum of a series of overlapping peaks of some specific functional form. An excellent review of curve fitting procedures and their limitations may be found in Ref. 4.
I. T H E O R Y AND DISCUSSION
A number of preliminary considerations are common to all curve-resolving algorithms: selection of functional form to approximate peaks, determination of the number of overlapping peaks constituting the spectral region of interest, and base line removal/approximation. Essen- tially all procedures involve an iterative least-squares optimization of the parameters describing the constituent peaks. This aspect of band shape analysis requires that the program be supplied starting estimates of the param- eters to be refined.
The two symmetric functions which have been previ- ously used in peak resolving are the Cauchy-Lorentzian and Gaussian forms:
Im,~hwhh 2 I(~) = [(r _ pro, x)2 + hwhh2] (Lorentzian) (1)
Received 14 December 1981; revision received 19 February 1982.
Volume 36, Number 4, 1982
I(r) = Imaxexp(-ln(16) (2)
• [(p - pm,x)/hwhh] 2} (Gaussian)
where Im,x = intensity at maximum, rmax = position of /max, and hwhh ffi half-width at half-height. In addition, some authors have fitted linear combinations of these functions or included additional modifications to account for asymmetric bands. Unfortunately, there exists no theoretical justification for infrared bands of polymers to fit any specific functional form, although there is some evidence that the bands present in condensed phase spectra are primarily Cauchy-Lorentzian. 5 Even if the band shapes were known, this function would have to be convolved with some function to account for the apodi- zation of the interferogram, or possibly modified to com- pensate for any special optical phenomenon present (e.g., Christianson effect). The ultimate measure of the agree- ment between the observed and calculated spectra can, perhaps, best be illustrated in a "difference" plot. In this way one can readily observe if there exist isolated regions in which the fit is poor. Some caution should be exercised, however, since excellent fits can be obtained which, in reality, are totally wrong. This is particularily true for cases in which two bands of approximately equal inten- sity and half-width at half-height are extensively over- lapped. Both Cauchy-Lorentzian and Gaussian functions require three parameters to characterize each peak (in- tensity of maximum, position of maximum, and half- width at half-height of the peak). The Cauchy-Lorentzian function has been found to closely approximate the band profiles in many polymers, and has the advantage that it can be evaluated faster than a Gaussian which requires exponentiation.
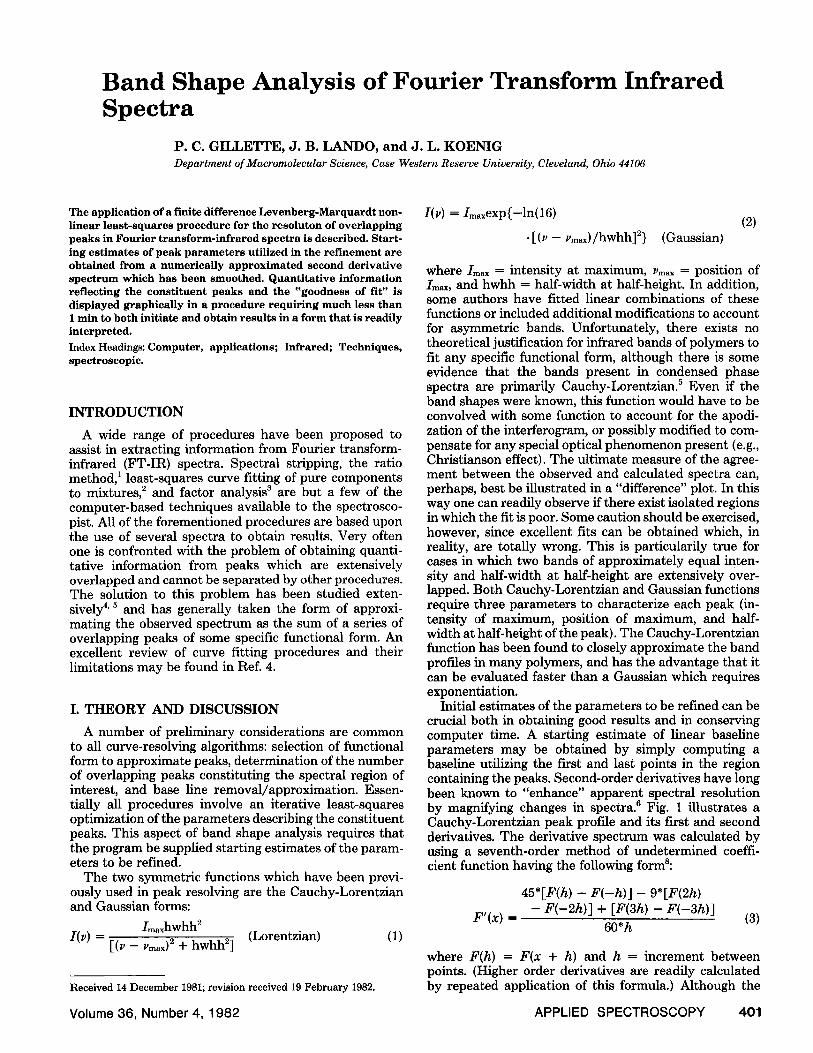
Initial estimates of the parameters to be refined can be crucial both in obtaining good results and in conserving computer time. A starting estimate of linear baseline parameters may be obtained by simply computing a baseline utilizing the first and last points in the region containing the peaks. Second-order derivatives have long been known to "enhance" apparent spectral resolution by magnifying changes in spectra. 6 Fig. 1 illustrates a Cauchy-Lorentzian peak profile and its first and second derivatives. The derivative spectrum was calculated by using a seventh-order method of undetermined coeffi- cient function having the following formS:
4 5 * [ F ( h ) - F ( - h ) ] - 9*[F(2h) - F ( - 2 h ) ] + [F(3h) - F ( - 3 h ) ] F'(x) ffi (3)
60*h
where F(h) = F ( x + h) and h = increment between points. (Higher order derivatives are readily calculated by repeated application of this formula.) Although the
APPLIED SPECTROSCOPY 401
Fro. 1. Spectrum of first and second derivatives of a Lorentzian peak.
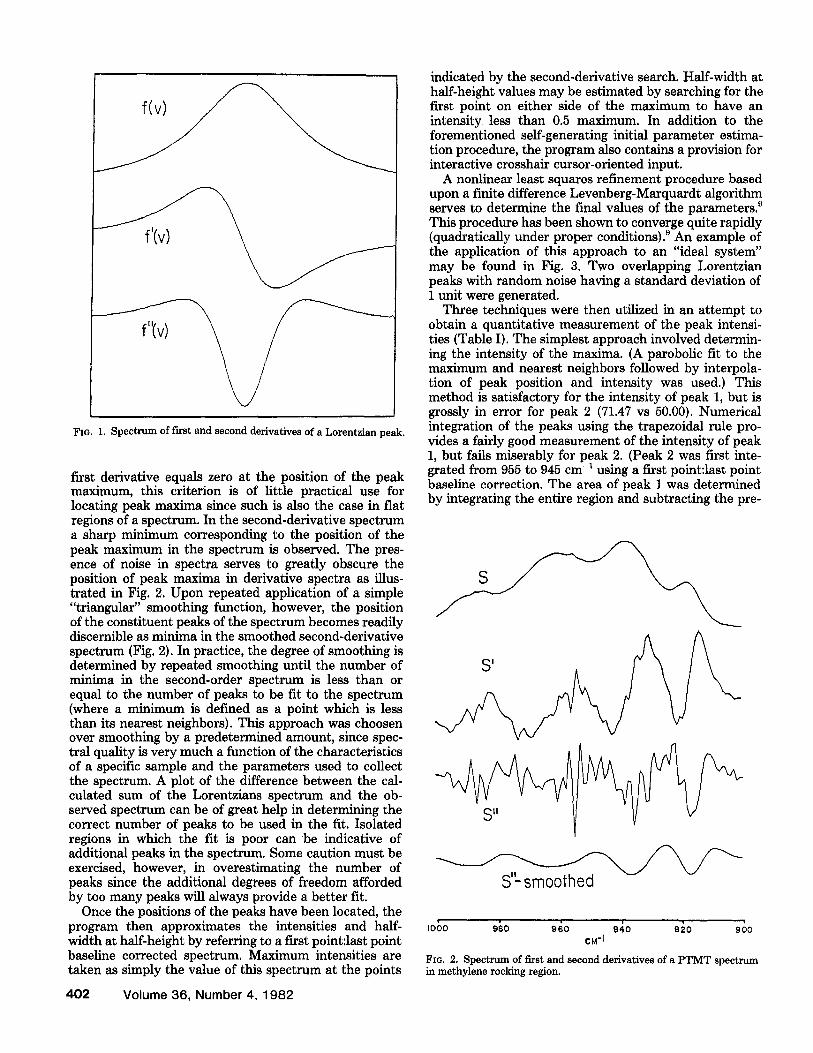
first derivative equals zero at the position of the peak maximum, this criterion is of little practical use for locating peak maxima since such is also the case in flat regions of a spectrum. In the second-derivative spectrum a sharp minimum corresponding to the position of the peak maximum in the spectrum is observed. The pres- ence of noise in spectra serves to greatly obscure the position of peak maxima in derivative spectra as illus- trated in Fig. 2. Upon repeated application of a simple "triangular" smoothing function, however, the position of the constituent peaks of the spectrum becomes readily discernible as minima in the smoothed second-derivative spectrum {Fig. 2). In practice, the degree of smoothing is determined by repeated smoothing until the number of minima in the second-order spectrum is less than or equal to the number of peaks to be fit to the spectrum (where a minimum is defined as a point which is less than its nearest neighbors). This approach was choosen over smoothing by a predetermined amount, since spec- tral quality is very much a function of the characteristics of a specific sample and the parameters used to collect the spectrum. A plot of the difference between the cal- culated sum of the Lorentzians spectrum and the ob- served spectrum can be of great help in determining the correct number of peaks to be used in the fit. Isolated regions in which the fit is poor can b e indicative of additional peaks in the spectrum. Some caution must be exercised, however, in overestimating the number of peaks since the additional degrees of freedom afforded by too many peaks will always provide a better fit.
Once the positions of the peaks have been located, the program then approximates the intensities and half- width at half-height by referring to a first point:last point baseline corrected spectrum. Maximum intensities are taken as simply the value of this spectrum at the points
402 Volume 36, Number 4, 1982
indicated by the second-derivative search. Half-width at half-height values may be estimated by searching for the first point on either side of the maximum to have an intensity less than 0.5 maximum. In addition to the forementioned self-generating initial parameter estima- tion procedure, the program also contains a provision for interactive crosshair cursor-oriented input.
A nonlinear least squares refinement procedure based upon a finite difference Levenberg-Marquardt algorithm serves to determine the final values of the parameters. 9 This procedure has been shown to converge quite rapidly (quadratically under proper conditions). ~ An example of the application of this approach to an "ideal system" may be found in Fig. 3. Two overlapping Lorentzian peaks with random noise having a standard deviation of 1 unit were generated.
Three techniques were then utilized in an attempt to obtain a quantitative measurement of the peak intensi- ties (Table I). The simplest approach involved determin- ing the intensity of the maxima. (A parobolic fit to the maximum and nearest neighbors followed by interpola- tion of peak position and intensity was used.) This method is satisfactory for the intensity of peak 1, but is grossly in error for peak 2 (71.47 vs 50.00). Numerical integration of the peaks using the trapezoidal rule pro- vides a fairly good measurement of the intensity of peak 1, but fails miserably for peak 2. (Peak 2 was first inte- grated from 955 to 945 cm -1 using a first point:last point baseline correction. The area of peak 1 was determined by integrating the entire region and subtracting the pre-
s'L smoothed
io~o 9~o 9~o 94o Q~o 960 CM-I
FIa. 2. Spectrum of first and second derivatives of a PTMT spectrum in methylene rocking region.
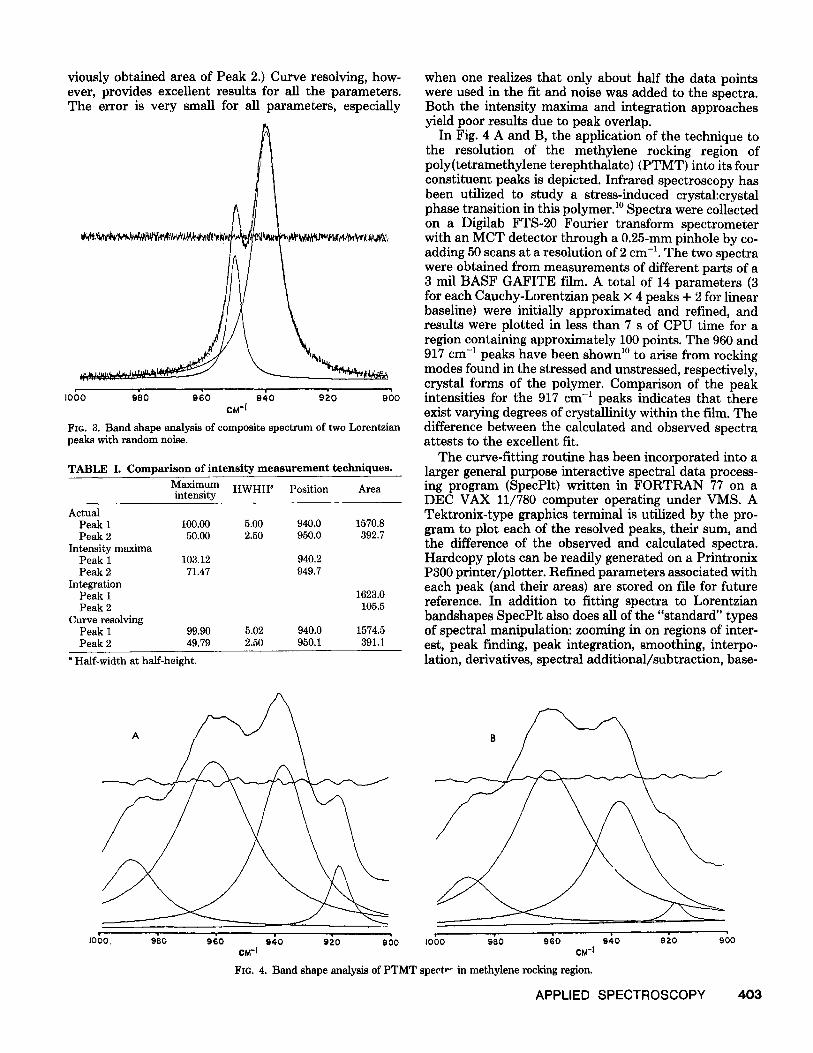
viously obtained area of Peak 2.) Curve resolving, how- ever, provides excellent results for all the parameters. The error is very small for all parameters, especially
I000 980 960 940 920 900 CM-[
FIG. 3. Band shape analysis of composite spectrum of two Lorentzian peaks with random noise.
TABLE I. Comparison of intensity measurement techniques.
Maximum HWHH a Position Area intensity
Actual Peak 1 100.00 5.00 940.0 1570.8 Peak 2 50.00 2.50 950.0 392.7
Intensity maxima Peak 1 103.12 940.2 Peak 2 71.47 949.7
Integration Peak 1 1623.0 Peak 2 105.5
Curve resolving Peak 1 99.90 5.02 940.0 1574.5 Peak 2 49.79 2.50 950.1 391.1
a Half-width at half-height.
when one realizes that only about half the data points were used in the fit and noise was added to the spectra. Both the intensity maxima and integration approaches yield poor results due to peak overlap.
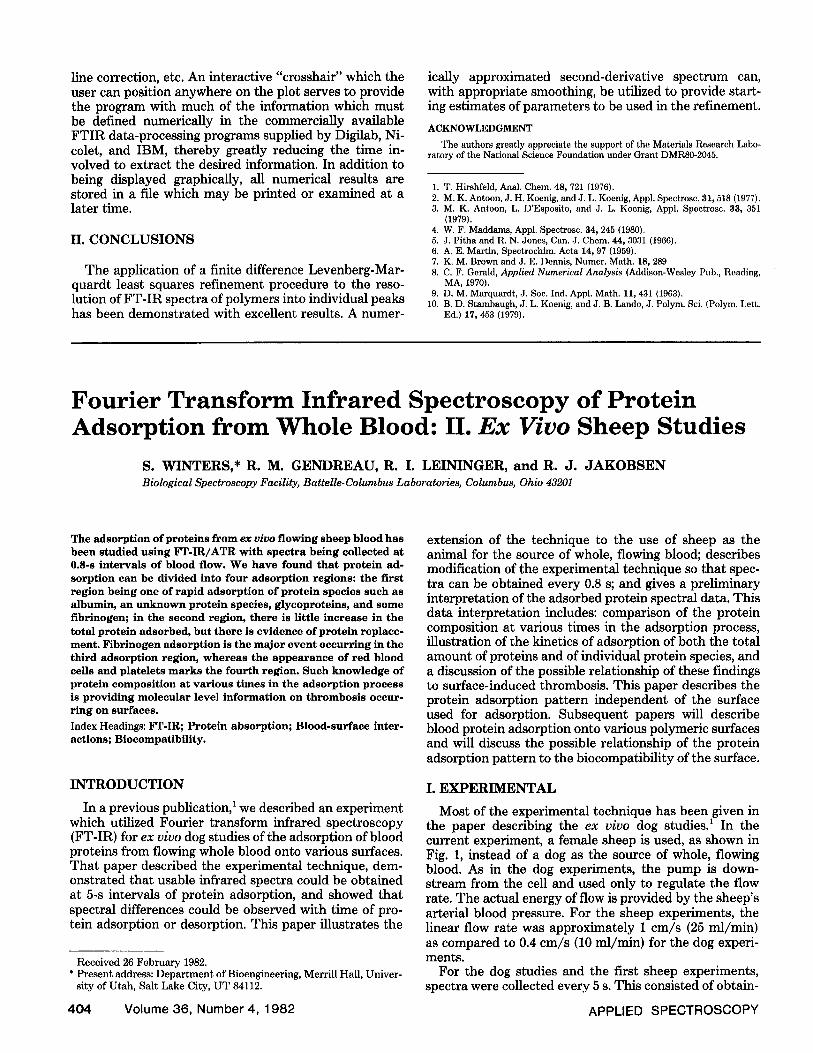
In Fig. 4 A and B, the application of the technique to the resolution of the methylene rocking region of poly(tetramethylene terephthalate) (PTMT) into its four constituent peaks is depicted. Infrared spectroscopy has been utilized to study a stress-induced crystal:crystal phase transition in this polymer. 1° Spectra were collected on a Digilab FTS-20 Fourier transform spectrometer with an MCT detector through a 0.25-mm pinhole by co- adding 50 scans at a resolution of 2 cm -1. The two spectra were obtained from measurements of different parts of a 3 mfl BASF GAFITE film. A total of 14 parameters (3 for each Cauchy-Lorentzian peak × 4 peaks + 2 for linear baseline) were initially approximated and refined, and results were plotted in less than 7 s of CPU time for a region containing approximately 100 points. The 960 and 917 cm -~ peaks have been shown ~° to arise from rocking modes found in the stressed and unstressed, respectively, crystal forms of the polymer. Comparison of the peak intensities for the 917 cm -~ peaks indicates that there exist varying degrees of crystallinity within the film. The difference between the calculated and observed spectra attests to the excellent fit.
The curve-fitting routine has been incorporated into a larger general purpose interactive spectral data process- ing program (SpecPlt) written in FORTRAN 77 on a DEC VAX 11/780 computer operating under VMS. A Tektronix-type graphics terminal is utilized by the pro- gram to plot each of the resolved peaks, their sum, and the difference of the observed and calculated spectra. Hardcopy plots can be readily generated on a Printronix P300 printer/plotter. Refined parameters associated with each peak (and their areas) are stored on file for future reference. In addition to fitting spectra to Lorentzian bandshapes SpecPlt also does all of the "standard" types of spectral manipulation: zooming in on regions of inter- est, peak finding, peak integration, smoothing, interpo- lation, derivatives, spectral additional/subtraction, base-
logo. 9~o 9~o 9~o 9~o 960 CM-I
=050 '9~o 9~o 9~o 9~o 95o CM-I
FIG. 4. Band shape analysis of PTMT spectrr in methylene rocking region.
APPLIED SPECTROSCOPY 403
line correction, etc. An interactive "crosshair" which the user can position anywhere on the plot serves to provide the program with much of the information which must be defined numerically in the commercially available FTIR data-processing programs supplied by Digilab, Ni- colet, and IBM, thereby greatly reducing the time in- volved to extract the desired information. In addition to being displayed graphically, all numerical results are stored in a file which may be printed or examined at a later time.
II. CONCLUSIONS
The application of a finite difference Levenberg-Mar- quardt least squares refinement procedure to the reso- lution of FT-IR spectra of polymers into individual peaks has been demonstrated with excellent results. A numer-
ically approximated second-derivative spectrum can, with appropriate smoothing, be utilized to provide start- ing estimates of parameters to be used in the refinement.
ACKNOWLEDGMENT
The authors greatly appreciate the support of the Materials Research Labo- ratory of the National Science Foundation under Grant DMR89-2045.
1. T. Hirshfeld, Anal. Chem. 48, 721 (1976). 2. M. K. Antoon, J. H. Koenig, and J. L. Koenig, Appl. Spectrosc. 31, 518 (1977). 3. M. K. Antoon, L. D'Esposito, and J. L. Koenig, Appl. Spectrosc. 33, 351
(1979). 4. W. F. Maddams, Appl. Spectrosc. 34, 245 (1980). 5. J. Pitha and R. N. Jones, Can. J. Chem. 44, 3031 (1966). 6. A. E. Martin, Spectrochim. Acta 14, 97 (1959). 7. K. M. Brown and J. E. Dennis, Numer. Math. 18, 289 8. C. F. Gerald, Applied Numerical Analysis (Addison-Wesley Pub., Reading,
MA, 1970). 9. D. M. Marquardt, J. Soc. Ind. Appl. Math. 11, 431 (1963).
10. B. D. Stambaugh, J. L. Koenig, and J. B. Lando, J. Polym. Sci. (Polym. Lett. Ed.) 17, 453 (1979).
Fourier Transform Infrared Spectroscopy of Protein Adsorption from Whole Blood: II. Ex Vivo Sheep Studies
S. WINTERS,* R. M. GENDREAU, R. I. LEININGER, and R. J. JAKOBSEN Biological Spectroscopy Facility, Battelle-Columbus Laboratories, Columbus, Ohio 43201
The adsorption of proteins f r o m ex vivo f lowing sheep blood has been studied using F T - I R / A T R w i t h s p e c t r a b e i n g collected at 0.8-s i n t e r v a l s o f b l o o d f low. W e have found that protein ad- sorption can be divided into four adsorption regions: the first r e g i o n being one of rapid a d s o r p t i o n o f protein species such as albumin, an unknown protein species, glycoproteins, and s o m e f i b r i n o g e n ; in the second region, there is little increase in the total protein adsorbed, but there is evidence of protein replace- ment. F i b r i n o g e n adsorption is the major event occurring in the third adsorption region, whereas the appearance of red blood cells and platelets marks the f o u r t h r e g i o n . S u c h k n o w l e d g e o f protein composition at various times in the adsorption process is providing molecular level information on thrombosis occur- ring o n surfaces. Index Headings: F T - I R ; Protein absorption; Blood-surface i n t e r - a c t i o n s ; Biocompatibility.
INTRODUCTION
In a previous publication, 1 we described an experiment which utilized Fourier transform infrared spectroscopy (FT-IR) for ex v ivo dog studies of the adsorption of blood proteins from flowing whole blood onto various surfaces. That paper described the experimental technique, dem- onstrated that usable infrared spectra could be obtained at 5-s intervals of protein adsorption, and showed that spectral differences could be observed with time of pro- tein adsorption or desorption. This paper illustrates the
Received 26 February 1982. * Presen t address: D e p a r t m e n t of Bioengineering, Merrill Hall, Univer-
sity of Utah , Salt Lake City, U T 84112.
404 Volume 36, Number 4, 1982
extension of the technique to the use of sheep as the animal for the source of whole, flowing blood; describes modification of the experimental technique so that spec- tra can be obtained every 0.8 s; and gives a preliminary interpretation of the adsorbed protein spectral data. This data interpretation includes: comparison of the protein composition at various times in the adsorption process, illustration of the kinetics of adsorption of both the total amount of proteins and of individual protein species, and a discussion of the possible relationship of these findings to surface-induced thrombosis. This paper describes the protein adsorption pattern independent of the surface used for adsorption. Subsequent papers will describe blood protein adsorption onto various polymeric surfaces and will discuss the possible relationship of the protein adsorption pattern to the biocompatibility of the surface.
I. EXPERIMENTAL
Most of the experimental technique has been given in the paper describing the e x v ivo dog studies) In the current experiment, a female sheep is used, as shown in Fig. 1, instead of a dog as the source of whole, flowing blood. As in the dog experiments, the pump is down- stream from the cell and used only to regulate the flow rate. The actual energy of flow is provided by the sheep's arterial blood pressure. For the sheep experiments, the linear flow rate was approximately 1 cm/s (25 ml/min) as compared to 0.4 cm/s (10 ml/min) for the dog experi- ments.
For the dog studies and the first sheep experiments, spectra were collected every 5 s. This consisted of obtain-
APPLIED SPECTROSCOPY