banca espanola informe oliver wyman
DESCRIPTION
Banca espanola Informe oliver wymanTRANSCRIPT
BANK OF SPAIN STRESS
TESTING EXERCISE
June 21, 2012

Oliver Wyman
MAD-DZZ64111-005
REPORT QUALIFICATIONS, ASSUMPTIONS & LIMITING CONDITIONS
This report sets forth the information required by the written terms of Oliver Wyman’s engagement by the Bank of Spain, as agreed in the written contract dated May 21st, 2012 between Oliver Wyman S.L. (together with its affiliates, “Oliver Wyman”) and the Bank of Spain with respect to this engagement (the “Agreement”) and is prepared in the form expressly required thereby. This report is intended to be read and used as a whole and not in parts. Separation or alteration of any section or page from the main body of this report is expressly forbidden and invalidates this report.
This report is not intended for general circulation or publication, nor is it to be used, reproduced, quoted from or distributed for any purpose, except as expressly permitted by the terms of the Agreement and, in all cases, subject to the reliance limitations and the other terms and conditions set forth herein and in the Agreement.
Information furnished by others, upon which all or portions of this report are based, has not been verified. No representation or warranty is given as to the accuracy of such information. Specifically, information that has been provided by or on behalf of the Bank of Spain has not been validated, verified or confirmed, nor has Oliver Wyman sought to validate, verify or confirm such information. Oliver Wyman makes no representation or warranty as to the accuracy of such information, and Oliver Wyman expressly disclaims all responsibility, and shall have no liability for, the accuracy of such information.
The findings contained in this report may contain predictions based on data provided to Oliver Wyman and/or historical trends. Any such predictions are subject to inherent risks and uncertainties. In particular, actual results could be impacted by future events which cannot be predicted or controlled, including, without limitation, changes in macroeconomic conditions such as GDP, unemployment rate, housing prices, exchange rates, interest rates, etc. Oliver Wyman expressly disclaims all responsibility, and shall have no liability, for actual results or future events.
The opinions expressed in this report are valid only for the purpose stated herein and in the Agreement, and are solely as of the date of this report. No obligation is assumed, and Oliver Wyman shall have no liability, to revise this report to reflect changes, events or conditions, which occur subsequent to the date hereof.
The scope of the report has, at the request of the Bank of Spain, been limited exclusively to the areas indicated in section “1.3 - Scope, purpose and limitations of the exercise” and excludes all others.
All decisions in connection with the implementation or use of advice or recommendations (if any) contained in this report are not the responsibility of Oliver Wyman. This report does not represent investment advice (thus it should not be construed as an invitation or inducement to any person to engage in investment activity) nor does it provide any opinion regarding the fairness of any transaction to any and all parties.

Oliver Wyman
MAD-DZZ64111-005
This report has been prepared for the Bank of Spain. There are no third party beneficiaries with respect to this report, and Oliver Wyman expressly disclaims any liability whatsoever (whether in contract, tort or otherwise) to any third party, including, without limitation, any security holder, investor, regulator, institution or any entity that is the subject of the report. The fact that this report may ultimately be disclosed to any such third party does not constitute any permission, waiver or consent from Oliver Wyman for such third party to rely on the report or base any claims whatsoever upon it (whether in contract, tort or otherwise) against Oliver Wyman. To the extent Oliver Wyman permits disclosure to any such third party, or such disclosure is permitted by the Agreement, Oliver Wyman expressly disclaims any liability whatsoever vis-à-vis such third party, by the mere fact that such third party has been given access to the report. In particular, Oliver Wyman shall not have any liability vis-à-vis such third party in respect of the contents of this report or any actions taken or decisions made as a consequence of the results, advice or recommendations set forth herein.
This report shall be governed by Spanish law and, without limitation to the foregoing, the extent to which Oliver Wyman shall be subject to liability (if any) in respect of this report shall be governed exclusively by Spanish law, and by the express terms and conditions of the Agreement.
© Oliver Wyman
Bank of Spain Stress Testing Exercise Contents
Oliver Wyman
MAD-DZZ64111-005
Contents
Executive Summary i
1. Context and objectives 1
1.1. Introduction 1
1.2. Description of the exercise 1
1.3. Scope, purpose and limitations of the exercise 3
1.4. Structure of the document 5
2. Spain Financial Services current situation 6
2.1. Characterisation of the portfolios and key latent risks 6
2.2. Recognised losses 9
3. Macroeconomic scenarios 11
4. Methodology 15
4.1. Credit loss forecasting 15
4.2. Non-performing loans 22
4.3. Foreclosed assets 23
4.4. Loss absorption capacity 24
5. Results of the stress testing exercise 27
5.1. Loss absorption capacity 27
5.2. Forecasted expected losses 28
5.3. Estimated capital needs 35

Bank of Spain Stress Testing Exercise List of Figures
Oliver Wyman
MAD-DZZ64111-005
List of Figures
Figure 1: Loss forecasting and capital absorption framework overview 2 Figure 2: Domestic Financial Institutions in-scope 3 Figure 3: Main information used in the analysis 4 Figure 4: Key building blocks of the Stress Testing framework 5 Figure 5: Asset-class breakdown of in-scope assets 6 Figure 6: Loss recognition in Spain (2007–2011) 9 Figure 7: Loss recognition in Spain following RD 2 & 18/2012 10 Figure 8: Macroeconomic scenarios provided by Steering Committee 11 Figure 9: Historical Spanish economic performance (1981–2011) vs. Steering Committee scenarios 12 Figure 10: Credit quality indicators of historical Spanish macroeconomic indicators (1981–2011) vs. Steering Committee scenarios 13 Figure 11: Steering Committee 2012 scenario vs. international peers’ stress tests’ 2012 adverse case 13 Figure 12: Credit quality indicators – Steering Committee scenarios vs. international stress test 2012 adverse scenarios 14 Figure 13: Credit loss forecasting framework 15 Figure 14: Macroeconomic credit quality model: Retail Mortgages 19 Figure 15: Macroeconomic credit quality model: Real Estate Developments 19 Figure 16: Macroeconomic credit quality model: Corporates 20 Figure 17: Illustrative recovery curves 22 Figure 18: Key foreclosed asset modelling framework components 23 Figure 19: Implied Real Estate price declines (price evolution + haircut) 24 Figure 20: Loss absorption capacity for adverse scenario 27 Figure 21: Expected loss forecast 2012–2014 – Aggregate level 28 Figure 22: Estimated expected losses 2012–2014 – Drill-down by asset class 29 Figure 23: Estimated expected losses 2012–2014 – Real Estate Developers 30 Figure 24: Cumulative defaults 2008-2014 (as % of the initial portfolio) 31 Figure 25: Estimated expected losses 2012–2014 – Retail Mortgages 31 Figure 26: Cumulative defaults 2008-2014 (as % of the initial portfolio) 32 Figure 27: Estimated expected losses 2012–2014 – Corporates 33 Figure 28: Estimated losses loss forecast 2012–2014 – Foreclosed assets 34 Figure 29: Implied RE price decline: price + haircut in Adverse Scenario 34 Figure 30: Capital deficit under adverse scenario 35 Figure 31: Capital deficit under base scenario 36
Bank of Spain Stress Testing Exercise Executive Summary
Oliver Wyman i
MAD-DZZ64111-005
Executive Summary
This report describes Oliver Wyman’s conclusions on the top-down stress testing process - Banking Sector Stability Program (BSSP) - of the Banco de España and the Ministerio de Economía y Competitividad. The objective of this work is to assess the robustness of the Spanish banking system and its ability to withstand a severely adverse stress scenario of deteriorating macroeconomic and market conditions.
Top-down approaches consider the different historical performance and asset mix for each institution at aggregate levels, applying conservative but similar estimates of loss behaviour across banks when more detailed bank-specific loss drivers are not available. In this way the top-down estimates provide insight into the overall capital need of the system but are less well suited for bank-by-bank decisions on viability and the amount of possible capital needs.
The scope of the work included the domestic lending book and excluded other assets, such as foreign assets, fixed income and equity portfolios or sovereign lending. A first top-down estimate was conducted by the IMF and the Banco de España on individual bank entities plus medium and small public banks treated as group bank entities comprising 83% of total banking assets, using bank financial information (balance sheets and income statements) as of year-end 2011. Top-down estimates of losses and profits were projected through a two-year stress scenario and compared against a post-stress capital threshold of 7% Core Tier 1. The result, released on June 8, 2012, was a total projected capital buffer requirement of € 37 BN.
Whereas sharing the same philosophy, our assessment differs from the first in three important ways:
• We provide our own experience and benchmarks to generate forward-looking projections
• The stress horizon has been lengthened to three years, with the adverse scenario being slightly worse than the one applied by FSAAP
• Banks were evaluated against a post-stress Core Tier 1 ratio of 6%, consistent with stress tests conducted in other jurisdictions
We developed asset-class specific models that project future losses based on underlying macro-economic drivers such as GDP contraction, house price index, unemployment and an additional thirteen drivers. We subjected each of these asset classes to various stress scenarios formulated by the Steering Committee. The severe stress scenario was more marked than similar exercises in most other jurisdictions: the downturn persists for 3 years (compared to 2 in other exercises) and most critical variables were stressed at more than two times the historical standard deviation (compared to a more typical range of 1-2 in other exercises). For example, cumulative GDP contraction in the severe stress scenario was 6.5% compared to 1.8%1 in other jurisdictions. We also subjected the asset classes to a 1 Other jurisdictions compared refer to the EBA Stress Testing exercise as of June 2011 considering Germany,
Ireland, Greece, France, Italy, Portugal and the United Kingdom

Bank of Spain Stress Testing Exercise Executive Summary
Oliver Wyman ii
MAD-DZZ64111-005
baseline scenario with a more benign macro-economic contraction for reference purposes.
We subjected fourteen banking groups2 (accounting for approximately 90% of bank assets) to the different stresses using 2011 year-end bank financial information.
Since 2007, this group of banks has already recognized ~ € 150bn of credit losses that are fully accounted for in the 2011 year-end financials. The 2011 YE starting point of the fourteen banks under examination – in aggregate is:
• Total “in scope” domestic lending book of ~ € 1.5 TN (compared to total assets of € 2.3 TN including other balance sheet items not in scope)
• Pre-provision earnings of € 20 BN from Spanish operations plus € 7 BN post-provision, post-tax earnings from international activities
• Provision stock of € 98 BN for the Spanish operations
• Total core tier 1 capital base of € 165 BN (CT1 of 9.4% as per EBA definition)
For the 3 year period (2012-2014) – our analysis concludes that:
• Cumulative credit losses for the in-scope domestic back book of lending assets are ~ € 250 - 270 BN for the adverse (stress) scenario (this compares with cumulative credit losses amounting to ~ € 170 - 190 BN under the more benign macro-economic scenario, referred to as the baseline).
• Under the severe stress scenario, cumulative 2012-2014 losses are:
Adverse Scenario 2012 – 2014
Segment/ Asset type
2011 Balance
(€ BN)
Losses from NPL stock
(€ BN)
Losses from Perf. Loans
(€ BN)
Cumul. loss (% of 11
Balance3)
Aggregated PD (% of 11
Balance4)
Aggregated LGD (% of 11
Balance)
RE Developers 220 26 - 27 74 - 77 44% - 46% 88% - 91% 50% - 51%
Retail Mortgages 600 6 - 8 15 - 17 3% - 4% 15% - 17% 22% - 24%
Large Corporate 260 6 - 7 24 - 26 12% - 13% 24% - 26% 48% - 50%
SMEs 230 11 - 12 25 - 27 15% - 17% 35% - 36% 44% - 46%
Public Works 45 2 - 3 6 - 7 21% - 23% 47% - 49% 44% - 46%
Other Retail 75 3 - 4 8 - 10 16% - 18% 22% - 24% 71% - 75%
Total Credit
Portfolio 1,430 55 - 60 150 - 160 14% - 16% 32% - 35% 43% - 46%
Foreclosed assets 75 42 – 48 - 55% - 65% - -
2 Fourteen banking groups representing twenty-one individual entities as of December 2011
3 Expected losses from performing and non-performing loans measured as % over December 2011 balances.
Does not include expected losses from the new credit portfolio assumed to amount to ~ €3 – 4 BN
4 Aggregated PD reflecting current NPL portfolio (PD = 100%) plus forecasted new defaulting loans from
performing portfolio

Bank of Spain Stress Testing Exercise Executive Summary
Oliver Wyman iii
MAD-DZZ64111-005
• Against these losses there is an estimated total loss absorption capacity over the same 3 year period of € 230 - 250 BN, - which includes a reduction in the loan book over the period of 10 - 15%.The breakdown is as follows:
─ Existing provisions of € 98 BN
─ Pre-provision earnings of € 60 - 70 BN
─ Benefit of asset protection schemes for some institutions of € 6 - 7 BN
─ Capital buffer of € 65 - 73 BN (difference between 6% CT1 and current capitalization levels)
The above implies a post-stress Core Tier 1 system-wide capital buffer requirement of up to ~ € 51 - 62 BN for the likely evolution of the in-scope domestic lending assets. Because projected losses and loss absorption capacity are quite unevenly distributed across banks, the difference between losses and resources will naturally not be equal to capital needs.
In the absence of a more detailed bottom-up exercise, with its due diligence and more detailed bank-portfolio level analysis, it is not possible at this stage to provide bank-level results. Indeed because such information and data are not yet fully available, the top-down estimates were conducted with a view to making conservative assumptions on important parameters along the way. The subsequent bottom-up process is intended to provide certainty at the individual bank level.
Bank of Spain stress testing exercise
Oliver Wyman 1
MAD-DZZ64111-005
1. Context and objectives
1.1. Introduction
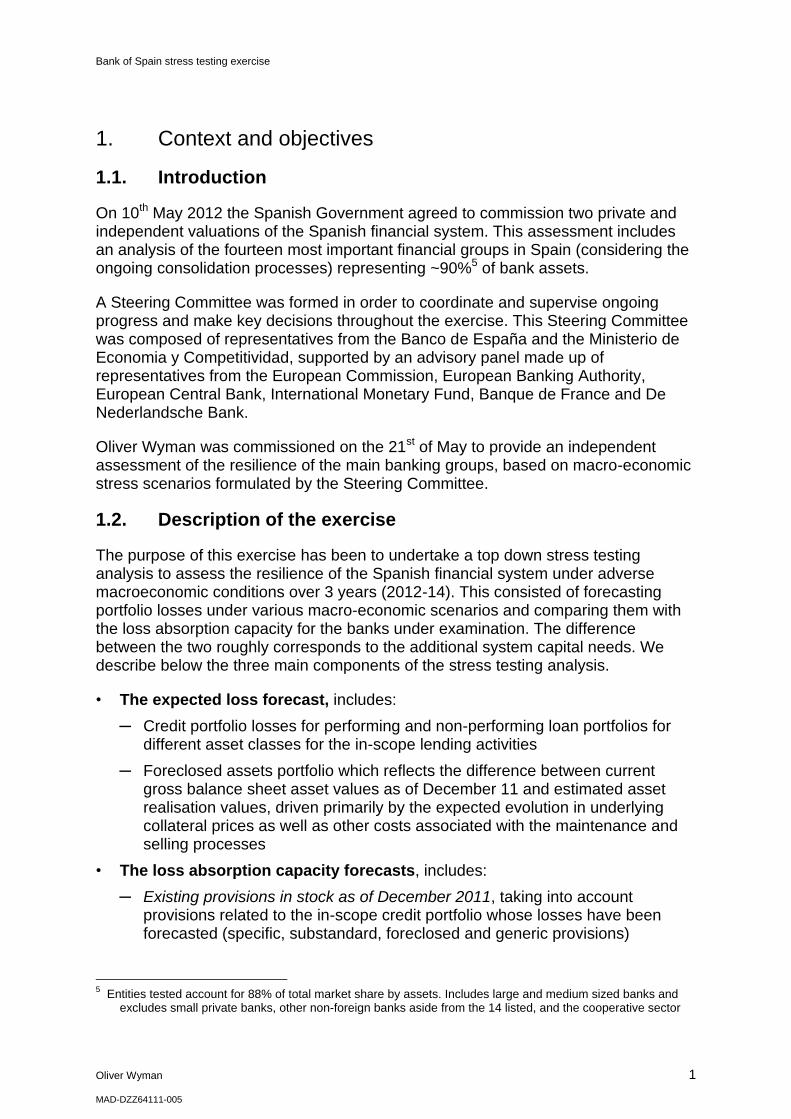
On 10th May 2012 the Spanish Government agreed to commission two private and independent valuations of the Spanish financial system. This assessment includes an analysis of the fourteen most important financial groups in Spain (considering the ongoing consolidation processes) representing ~90%5 of bank assets.
A Steering Committee was formed in order to coordinate and supervise ongoing progress and make key decisions throughout the exercise. This Steering Committee was composed of representatives from the Banco de España and the Ministerio de Economia y Competitividad, supported by an advisory panel made up of representatives from the European Commission, European Banking Authority, European Central Bank, International Monetary Fund, Banque de France and De Nederlandsche Bank.
Oliver Wyman was commissioned on the 21st of May to provide an independent assessment of the resilience of the main banking groups, based on macro-economic stress scenarios formulated by the Steering Committee.
1.2. Description of the exercise
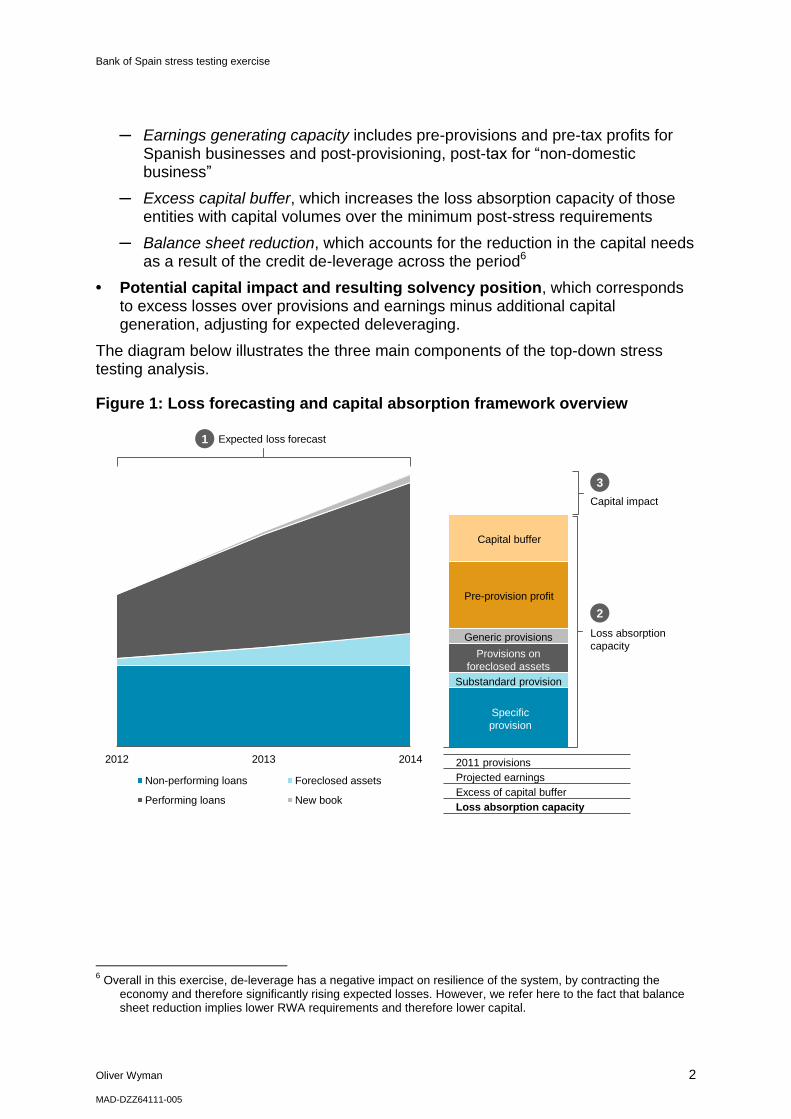
The purpose of this exercise has been to undertake a top down stress testing analysis to assess the resilience of the Spanish financial system under adverse macroeconomic conditions over 3 years (2012-14). This consisted of forecasting portfolio losses under various macro-economic scenarios and comparing them with the loss absorption capacity for the banks under examination. The difference between the two roughly corresponds to the additional system capital needs. We describe below the three main components of the stress testing analysis.
• The expected loss forecast, includes:
─ Credit portfolio losses for performing and non-performing loan portfolios for different asset classes for the in-scope lending activities
─ Foreclosed assets portfolio which reflects the difference between current gross balance sheet asset values as of December 11 and estimated asset realisation values, driven primarily by the expected evolution in underlying collateral prices as well as other costs associated with the maintenance and selling processes
• The loss absorption capacity forecasts, includes:
─ Existing provisions in stock as of December 2011, taking into account provisions related to the in-scope credit portfolio whose losses have been forecasted (specific, substandard, foreclosed and generic provisions)
5 Entities tested account for 88% of total market share by assets. Includes large and medium sized banks and
excludes small private banks, other non-foreign banks aside from the 14 listed, and the cooperative sector
Bank of Spain stress testing exercise
Oliver Wyman 2
MAD-DZZ64111-005
─ Earnings generating capacity includes pre-provisions and pre-tax profits for Spanish businesses and post-provisioning, post-tax for “non-domestic business”
─ Excess capital buffer, which increases the loss absorption capacity of those entities with capital volumes over the minimum post-stress requirements
─ Balance sheet reduction, which accounts for the reduction in the capital needs as a result of the credit de-leverage across the period6
• Potential capital impact and resulting solvency position, which corresponds to excess losses over provisions and earnings minus additional capital generation, adjusting for expected deleveraging.
The diagram below illustrates the three main components of the top-down stress testing analysis.
Figure 1: Loss forecasting and capital absorption framework overview
6 Overall in this exercise, de-leverage has a negative impact on resilience of the system, by contracting the
economy and therefore significantly rising expected losses. However, we refer here to the fact that balance sheet reduction implies lower RWA requirements and therefore lower capital.
2012 2013 2014
Non-performing loans Foreclosed assets
Performing loans New book
2011 provisions
Projected earnings
Excess of capital buffer
Loss absorption capacity
Expected loss forecast
Capital impact
Loss absorption
capacity
Specific
provision
Substandard provision
Provisions on
foreclosed assets
Generic provisions
Pre-provision profit
Capital buffer
1
2
3

Bank of Spain stress testing exercise
Oliver Wyman 3
MAD-DZZ64111-005
1.3. Scope, purpose and limitations of the exercise
The exercise was conducted between the 21st of May and the 21st of June 2012, and focused on stressing the domestic private credit portfolio, applying bank-level information provided by the BdE within that period.
The scope of the work was as follows:
• Risk coverage – the exercise evaluates credit risk in the performing, non performing and foreclosed assets, but excludes any other specific risks such as liquidity risk, ALM, market and counterparty credit risk, etc.
• Portfolio coverage – The portfolios analysed comprise credits to the domestic private sector (e.g. real estate developers, corporates, retail loans), excluding other exposures also subject to credit risk (e.g. bonds or sovereign exposures)
• Entity coverage – The scope of this stress testing exercise covers fourteen domestic financial institutions accounting for ~ 90% of total market share
Figure 2: Domestic Financial Institutions in-scope7
Financial Group Market share (% of Spanish assets)
1 Santander (incl. Banesto) 19%
2 BBVA (incl. UNNIM) 15%
3 Caixabank (incl. Banca Cívica) 12%
4 BFA-Bankia 12%
5 Banc Sabadell (incl. CAM) 6%
6 Popular (incl. Pastor) 6%
7 Ibercaja - Caja 3 – Liberbank 4.2%
8 Unicaja – CEISS 2.7%
9 Kutxabank 2.6%
10 Catalunyabanc 2.5%
11 NCG Banco 2.5%
12 BMN 2.4%
13 Bankinter 2.1%
14 Banco de Valencia 1.0%
7 Source: IMF
Bank of Spain stress testing exercise
Oliver Wyman 4
MAD-DZZ64111-005
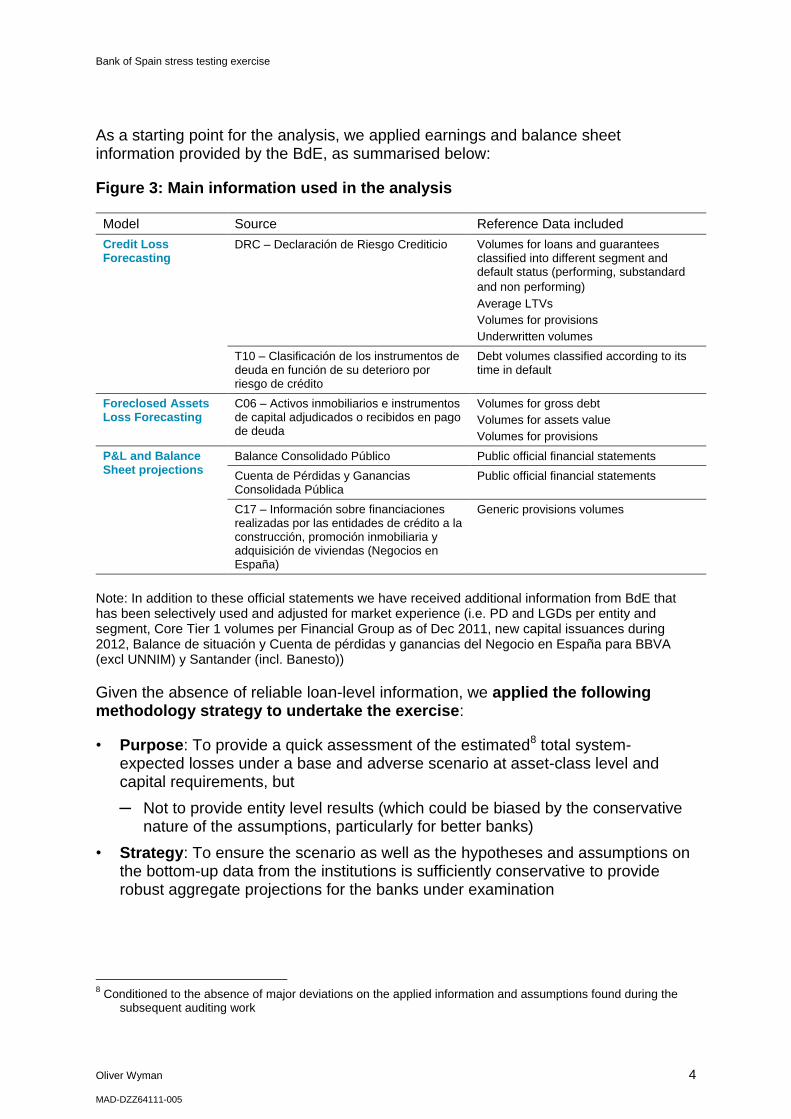
As a starting point for the analysis, we applied earnings and balance sheet information provided by the BdE, as summarised below:
Figure 3: Main information used in the analysis
Model Source Reference Data included
Credit Loss Forecasting
DRC – Declaración de Riesgo Crediticio Volumes for loans and guarantees classified into different segment and default status (performing, substandard
and non performing)
Average LTVs
Volumes for provisions
Underwritten volumes
T10 – Clasificación de los instrumentos de deuda en función de su deterioro por riesgo de crédito
Debt volumes classified according to its time in default
Foreclosed Assets Loss Forecasting
C06 – Activos inmobiliarios e instrumentos de capital adjudicados o recibidos en pago de deuda
Volumes for gross debt
Volumes for assets value
Volumes for provisions
P&L and Balance Sheet projections
Balance Consolidado Público Public official financial statements
Cuenta de Pérdidas y Ganancias Consolidada Pública
Public official financial statements
C17 – Información sobre financiaciones realizadas por las entidades de crédito a la construcción, promoción inmobiliaria y adquisición de viviendas (Negocios en España)
Generic provisions volumes
Note: In addition to these official statements we have received additional information from BdE that has been selectively used and adjusted for market experience (i.e. PD and LGDs per entity and segment, Core Tier 1 volumes per Financial Group as of Dec 2011, new capital issuances during 2012, Balance de situación y Cuenta de pérdidas y ganancias del Negocio en España para BBVA (excl UNNIM) y Santander (incl. Banesto))
Given the absence of reliable loan-level information, we applied the following methodology strategy to undertake the exercise:
• Purpose: To provide a quick assessment of the estimated8 total system- expected losses under a base and adverse scenario at asset-class level and capital requirements, but
─ Not to provide entity level results (which could be biased by the conservative nature of the assumptions, particularly for better banks)
• Strategy: To ensure the scenario as well as the hypotheses and assumptions on the bottom-up data from the institutions is sufficiently conservative to provide robust aggregate projections for the banks under examination
8 Conditioned to the absence of major deviations on the applied information and assumptions found during the
subsequent auditing work

Bank of Spain stress testing exercise
Oliver Wyman 5
MAD-DZZ64111-005
1.4. Structure of the document
The remainder of this document is structured around the four main methodological building blocks as summarised below:
Figure 4: Key building blocks of the Stress Testing framework
• Section 2 provides an overview of the characteristics and current status of the Spanish entities’ balance sheets and the prospects for each of the portfolios subjected to a loss forecast. It also provides a perspective on the losses already incurred and recognised by the banks.
• Section 3 describes the scenarios provided by the Steering Committee to run the stress testing exercise, providing a perspective on those scenarios relative to similar exercises elsewhere
• Section 4 provides an overview of the methodology and assumptions used in this exercise. The stress testing methodology applied consists of Oliver Wyman proprietary statistical models and estimations. All the models have been adapted to the available data content and granularity
• Section 5 provides an overview of the results, showing aggregated and asset class cumulative losses as well as the estimated capital needs for the system
Spanish Financial Services current
status
Macroeconomicscenario considerations
Modelling assumptions and hypotheses
Stress Testing Exercise results
Aggregate results
Drill-down by asset class
Total capital needsBoS data &
Oliver Wyman analysis
Defined by Steering Committee
Oliver Wyman methodology
Section 2 Section 3
Section 4
Section 5
Bank of Spain stress testing exercise
Oliver Wyman 6
MAD-DZZ64111-005
2. Spain Financial Services current situation
2.1. Characterisation of the portfolios and key latent risks
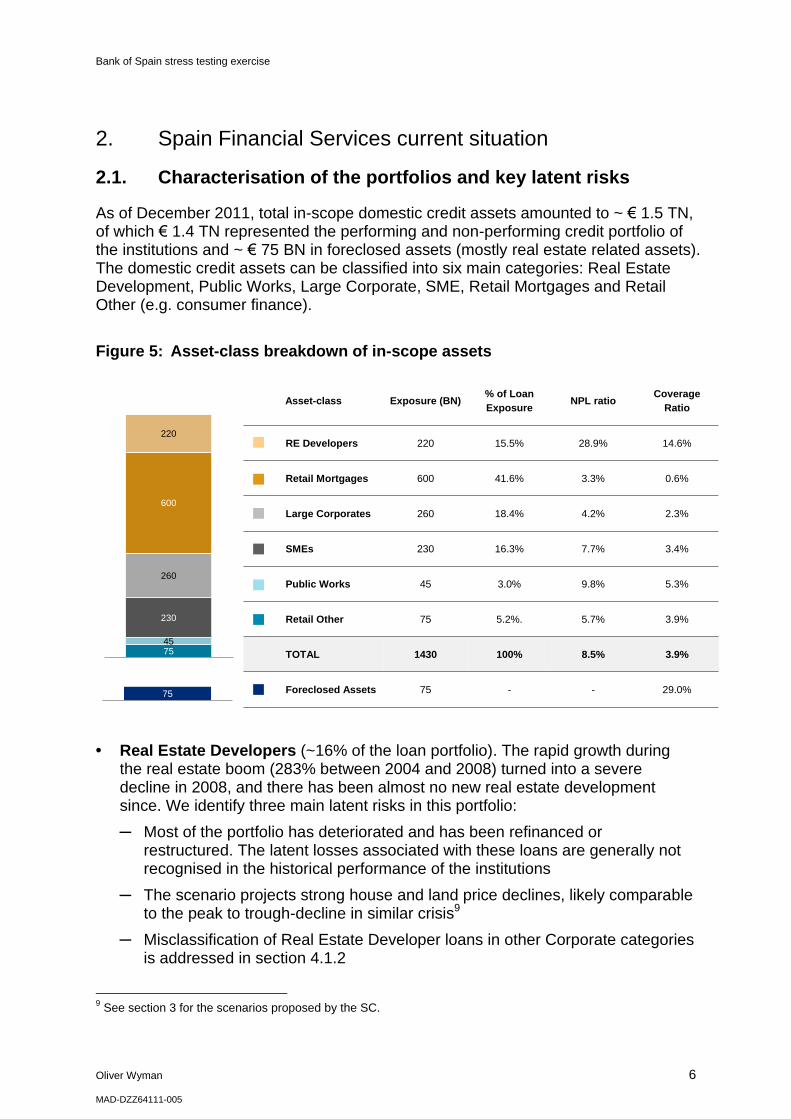
As of December 2011, total in-scope domestic credit assets amounted to ~ € 1.5 TN, of which € 1.4 TN represented the performing and non-performing credit portfolio of the institutions and ~ € 75 BN in foreclosed assets (mostly real estate related assets). The domestic credit assets can be classified into six main categories: Real Estate Development, Public Works, Large Corporate, SME, Retail Mortgages and Retail Other (e.g. consumer finance).
• Real Estate Developers (~16% of the loan portfolio). The rapid growth during the real estate boom (283% between 2004 and 2008) turned into a severe decline in 2008, and there has been almost no new real estate development since. We identify three main latent risks in this portfolio:
─ Most of the portfolio has deteriorated and has been refinanced or restructured. The latent losses associated with these loans are generally not recognised in the historical performance of the institutions
─ The scenario projects strong house and land price declines, likely comparable to the peak to trough-decline in similar crisis9
─ Misclassification of Real Estate Developer loans in other Corporate categories is addressed in section 4.1.2
9 See section 3 for the scenarios proposed by the SC.
Figure 5: Asset-class breakdown of in-scope assets
7545
230
260
600
220
Asset-class Exposure (BN)% of Loan
ExposureNPL ratio
Coverage
Ratio
RE Developers 220 15.5% 28.9% 14.6%
Retail Mortgages 600 41.6% 3.3% 0.6%
Large Corporates 260 18.4% 4.2% 2.3%
SMEs 230 16.3% 7.7% 3.4%
Public Works 45 3.0% 9.8% 5.3%
Retail Other 75 5.2%. 5.7% 3.9%
TOTAL 1430 100% 8.5% 3.9%
Foreclosed Assets 75 - - 29.0%75
Bank of Spain stress testing exercise
Oliver Wyman 7
MAD-DZZ64111-005
Those potential losses will be partially mitigated by the low LTVs (68%, compared to 80-100% across Europe and US).
• Retail Mortgages (~42%). This segment is expected to experience an increase in losses driven by a combination of:
─ High and sustained unemployment levels, together with overall economic deterioration, which will severely increase the default rate
─ House price deterioration, that will both increase the default rate and dampen recoveries, through direct impact on collateral values
There are some mitigants related to the specifics of the Spanish portfolios and regulation:
─ Portfolio LTVs are low (62% on average) particularly when compared to countries with similar banking problems (where LTVs in the 70-100% range are common)
─ Most of the portfolio relates to 1st residence (~ 88%) which provides further incentive to avoid missed payments. Only 7% relates to second residence and 5% to other purposes (e.g. buy-to-let).
─ Personal guarantee, where borrowers (and third parties guarantors) are liable for the full value of the mortgage loan including all penalties and fees over and above the real estate collateral. This provides an additional incentive for Spanish borrowers not to default as full recourse is uncommon in peer countries
─ Current low interest rates have kept mortgage payments down, assisting the vast majority of borrowers who have floating rate mortgages
• Large Corporates (~18%); characterised by a more robust performance during recent years’ adverse economic situation (~4.2% NPL ratio). Similar to the other sectors, an increase in losses is expected, driven by three main considerations
─ Already observed significant balance sheet deterioration following 4 years of crisis
─ There have been some experiences of misclassification of loans assigned to the Corporate segment, which actually correspond to Real Estate Developers, as a result of the tightening standards associated to real estate
─ The portion of unsecured balance within this segment is particularly high (i.e. 80% unsecured exposure)
• Corporate SME (~16%), currently showing a deterioration in performance (~7.7% NPL). This portfolio has similar challenges to the Large Corporate portfolio, however losses are mitigated through high collateralisation of the portfolio (i.e. 49%).
• Public works/construction amounts ~3% of loan portfolio. This segment has traditionally seen low defaults since the government is the main borrower. However, the risk of this segment has been increasing (9.8% NPL), and it is also expected to increase further because of:

Bank of Spain stress testing exercise
Oliver Wyman 8
MAD-DZZ64111-005
─ High interdependence with the real estate sector, since a significant proportion of the companies within that sector also simultaneously hold Real Estate Developers and Public Works businesses
─ Ongoing government cost-cutting programmers, particularly focusing on public works
• Other retail (~5% of the loan portfolio) constitutes a relatively small segment in the Spanish lending market, which is characterised by low collateralisation and high default rates, reaching ~5.7% in 2011. After growing by around 20% in the period 2005-2008, consumer finance has plummeted by 30% since and the segment is not expected to grow in the near future, due to a relative standstill of household consumption and tighter credit standards.
The short-term nature of this type of credits reinforces the mitigation impact of tightening of credit policies.
• Foreclosed assets. The current stock of foreclosed assets is around ~ € 75 BN, and has risen significantly in recent years, driven largely by the increase in default rates in the Real Estate Developers and Retail Mortgage segments. Latent risk due to forecasted price deterioration of both housing and land, together with expected haircuts on sale over appraisal values driven mainly by market illiquidity (even more so for land and RE under development), imply significant further losses for these portfolios.

Bank of Spain stress testing exercise
Oliver Wyman 9
MAD-DZZ64111-005
2.2. Recognised losses
Given the deterioration in the asset book, Spanish balance sheets have already suffered a significant level of distress. The chart below shows the overall cumulated recognised losses. They sum to ~ € 150 BN, equating to 10.3% of the 2007 portfolio for the in-scope entities, fully recognised in the FY 2011 financials.
Figure 6: Loss recognition in Spain (2007–2011)
Recognised losses can be classified as:
• P&L impairments across 2008-2011 (~ € 54 BN due to credit portfolio deterioration and ~ € 13 BN for foreclosed assets) with a marked increase in 2009
• Generic provisions (~ € 17 BN) – that were charged to P&L accounts prior to 2008, given the countercyclical provisioning system specific to Spain. These were released from the ~ € 24 BN stock of provisions in 2007 to a current ~ € 6 BN stock in 2012
• Finally, equity impairments have grown around 73% from 2010 to 2011 to a stock of ~ € 33 BN, mostly associated with saving banks’ mergers
Over and above these losses, the Spanish government issued two Royal Decrees requiring extra provisions of ~ € 70 BN.
• RD 2/2012 launched in February, with a particular focus on recognised distressed and foreclosed assets, which included:
─ Increment provisions on real estate lending, particularly (but not exclusively) non performing and foreclosed assets
Source: Oliver Wyman analysis, European Central Bank, Bank of Spain
1. Percentage of 2007 Loans to Other Resident Sectors for the selected entities (i.e. within the perimeter of this stress testing exercise)
Impact in
€ BN1:€33BN€17BN€33BN €150BN€67BN
4.6%
1.2%
2.2%
2.2%
Provisions
Other
write-offs
Equity
impairments
10.3%
Provisions
Dec-2007
Recognised
Loss ‘07-11
Impairments
through P&L
Generic
Provisions
Equity
Impairments

Bank of Spain stress testing exercise
Oliver Wyman 10
MAD-DZZ64111-005
─ Adjust asset valuations in order to have a more updated and realistic asset value registered in the entities financial statements
─ Create a stronger capital buffer so that new losses from outstanding real estate exposures can be potentially absorbed
• RD 18/2012 launched in May, asked the banks for additional provisions in order to increase the performing real estate loans coverage. This also included offering a FROB injection (through common equity or CoCos) for those banks with a capital shortfall after achieving the new requirements.
Figure 7: Loss recognition in Spain following RD 2 & 18/201210
10
Total loss recognition may include slight double counting in the event that some institutions may have anticipated provision charges before Dec 2011
€218 BN
Recognised loss '07-11 Estimated RDL 2·18/12 Total loss recognition after RD2·8/12
€150 BN Provisions RDL 2/12
Capital RDL 2/12
Provisions RDL 18/12
€58 BN
Provisions
Other
write-offs
Equity
impairment
Bank of Spain stress testing exercise
Oliver Wyman 11
MAD-DZZ64111-005
3. Macroeconomic scenarios
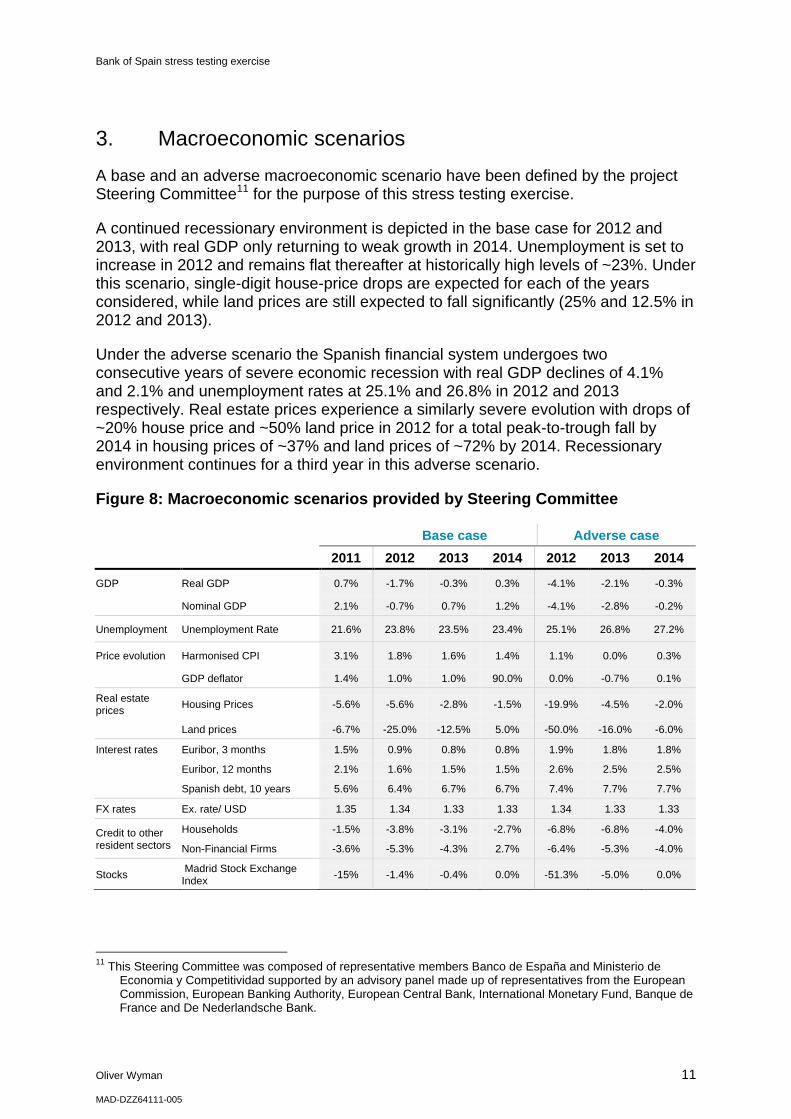
A base and an adverse macroeconomic scenario have been defined by the project Steering Committee11 for the purpose of this stress testing exercise.
A continued recessionary environment is depicted in the base case for 2012 and 2013, with real GDP only returning to weak growth in 2014. Unemployment is set to increase in 2012 and remains flat thereafter at historically high levels of ~23%. Under this scenario, single-digit house-price drops are expected for each of the years considered, while land prices are still expected to fall significantly (25% and 12.5% in 2012 and 2013).
Under the adverse scenario the Spanish financial system undergoes two consecutive years of severe economic recession with real GDP declines of 4.1% and 2.1% and unemployment rates at 25.1% and 26.8% in 2012 and 2013 respectively. Real estate prices experience a similarly severe evolution with drops of ~20% house price and ~50% land price in 2012 for a total peak-to-trough fall by 2014 in housing prices of ~37% and land prices of ~72% by 2014. Recessionary environment continues for a third year in this adverse scenario.
Figure 8: Macroeconomic scenarios provided by Steering Committee
Base case Adverse case
2011 2012 2013 2014 2012 2013 2014
GDP Real GDP 0.7% -1.7% -0.3% 0.3% -4.1% -2.1% -0.3%
Nominal GDP 2.1% -0.7% 0.7% 1.2% -4.1% -2.8% -0.2%
Unemployment Unemployment Rate 21.6% 23.8% 23.5% 23.4% 25.1% 26.8% 27.2%
Price evolution Harmonised CPI 3.1% 1.8% 1.6% 1.4% 1.1% 0.0% 0.3%
GDP deflator 1.4% 1.0% 1.0% 90.0% 0.0% -0.7% 0.1%
Real estate prices
Housing Prices -5.6% -5.6% -2.8% -1.5% -19.9% -4.5% -2.0%
Land prices -6.7% -25.0% -12.5% 5.0% -50.0% -16.0% -6.0%
Interest rates Euribor, 3 months 1.5% 0.9% 0.8% 0.8% 1.9% 1.8% 1.8%
Euribor, 12 months 2.1% 1.6% 1.5% 1.5% 2.6% 2.5% 2.5%
Spanish debt, 10 years 5.6% 6.4% 6.7% 6.7% 7.4% 7.7% 7.7%
FX rates Ex. rate/ USD 1.35 1.34 1.33 1.33 1.34 1.33 1.33
Credit to other resident sectors
Households -1.5% -3.8% -3.1% -2.7% -6.8% -6.8% -4.0%
Non-Financial Firms -3.6% -5.3% -4.3% 2.7% -6.4% -5.3% -4.0%
Stocks Madrid Stock Exchange Index
-15% -1.4% -0.4% 0.0% -51.3% -5.0% 0.0%
11
This Steering Committee was composed of representative members Banco de España and Ministerio de Economia y Competitividad supported by an advisory panel made up of representatives from the European Commission, European Banking Authority, European Central Bank, International Monetary Fund, Banque de France and De Nederlandsche Bank.

Bank of Spain stress testing exercise
Oliver Wyman 12
MAD-DZZ64111-005
The adverse scenario appears reasonably conservative on two counts:
• Relative to 30 year Spanish history The analysis below compares key macro variables in the adverse and base scenarios with historical averages of same parameters (1981-2011). Assuming a normal distribution for the variables used, the table includes a measure of ‘distance from the mean’ in the form of number of Standard Deviations away from each variable’s long-term average.
Figure 9: Historical Spanish economic performance (1981–2011) vs. Steering Committee scenarios
Historical 2012 2013 2014
Average Stan. Dev σ
Base Adverse Base Adverse Base Adverse
Real GDP growth 2.6% 2.0% -1.7% -4.1% -0.3% -2.1% 0.3% -0.3%
(# SDs) (2.1σ) (3.3σ) (1.4σ) (2.3σ) (1.1σ) (1.4σ)
Unemployment 16.8% 4.6% 23.8% 25.0% 23.5% 26.8% 23.4% 27.2%
(# SDs) (1.5σ) (1.8σ) (1.4σ) (2.2σ) (1.4σ) (2.2σ)
Short term IR 8.3% 5.7% 0.9% 1.9% 0.8% 1.8% 0.8% 1.8%
(# SDs) (1.3σ) (1.1σ) (1.3σ) (1.1σ) (1.3σ) (1.1σ)
House price change 7.4% 6.2% -5.6% -19.9% -2.8% -4.5% -1.5% -2.0%
(# SDs) (2.1σ) (4.4σ) (1.6σ) (1.9σ) (1.4σ) (1.5σ)
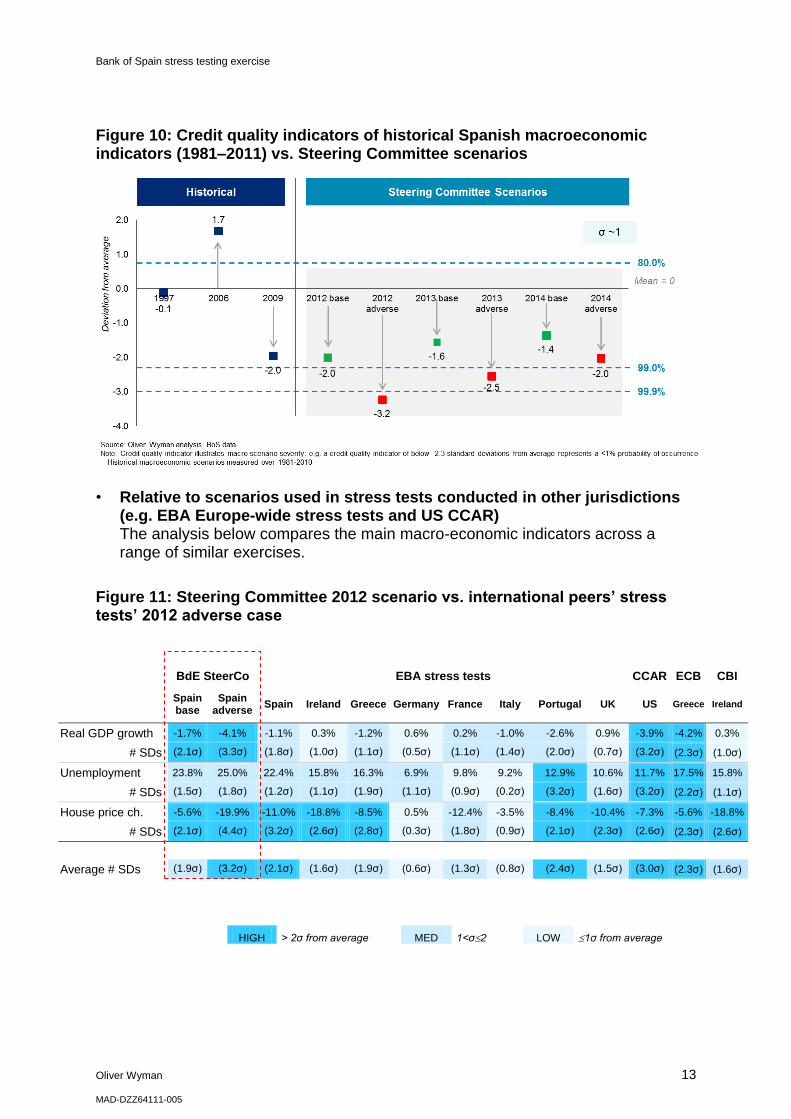
In order to reduce a multi-dimensional scenario into one factor that includes all macroeconomic variables, we created a ‘credit quality indicator’ that combines the risk factors according to their relative weight/influence on credit losses across segments12 in Spain. This indicator enables an easy comparison of scenarios used with a historical series of parameters. In the adverse scenario, the indicator is more than 2 SDs away from its historical average (97.7% confidence level).
12
Macroeconomic factor projections inputted into the macroeconomic models used to predict credit quality, as explained in section 4.1.2
HIGH > 2σ from average MED 1<σ2 LOW 1σ from average
Bank of Spain stress testing exercise
Oliver Wyman 13
MAD-DZZ64111-005
Figure 10: Credit quality indicators of historical Spanish macroeconomic indicators (1981–2011) vs. Steering Committee scenarios
• Relative to scenarios used in stress tests conducted in other jurisdictions (e.g. EBA Europe-wide stress tests and US CCAR) The analysis below compares the main macro-economic indicators across a range of similar exercises.
Figure 11: Steering Committee 2012 scenario vs. international peers’ stress tests’ 2012 adverse case
BdE SteerCo EBA stress tests CCAR ECB CBI
Spain base
Spain adverse
Spain Ireland Greece Germany France Italy Portugal UK US Greece Ireland
Real GDP growth -1.7% -4.1% -1.1% 0.3% -1.2% 0.6% 0.2% -1.0% -2.6% 0.9% -3.9% -4.2% 0.3%
# SDs (2.1σ) (3.3σ) (1.8σ) (1.0σ) (1.1σ) (0.5σ) (1.1σ) (1.4σ) (2.0σ) (0.7σ) (3.2σ) (2.3σ) (1.0σ)
Unemployment 23.8% 25.0% 22.4% 15.8% 16.3% 6.9% 9.8% 9.2% 12.9% 10.6% 11.7% 17.5% 15.8%
# SDs (1.5σ) (1.8σ) (1.2σ) (1.1σ) (1.9σ) (1.1σ) (0.9σ) (0.2σ) (3.2σ) (1.6σ) (3.2σ) (2.2σ) (1.1σ)
House price ch. -5.6% -19.9% -11.0% -18.8% -8.5% 0.5% -12.4% -3.5% -8.4% -10.4% -7.3% -5.6% -18.8%
# SDs (2.1σ) (4.4σ) (3.2σ) (2.6σ) (2.8σ) (0.3σ) (1.8σ) (0.9σ) (2.1σ) (2.3σ) (2.6σ) (2.3σ) (2.6σ)
Average # SDs (1.9σ) (3.2σ) (2.1σ) (1.6σ) (1.9σ) (0.6σ) (1.3σ) (0.8σ) (2.4σ) (1.5σ) (3.0σ) (2.3σ) (1.6σ)
HIGH > 2σ from average MED 1<σ2 LOW 1σ from average

Bank of Spain Stress Testing Exercise
Oliver Wyman 14
MAD-DZZ64111-005
Similar conclusions are reached when scenarios are compared through the synthetic indicator across different jurisdictions, as summarized below:
Figure 12: Credit quality indicators – Steering Committee scenarios vs. international stress test 2012 adverse scenarios
In addition, the adverse scenario includes a third year of recessionary conditions, unlike the most common 2-year period in other stress tests.
Bank of Spain Stress Testing Exercise
Oliver Wyman 15
MAD-DZZ64111-005
4. Methodology
4.1. Credit loss forecasting
4.1.1. Introduction
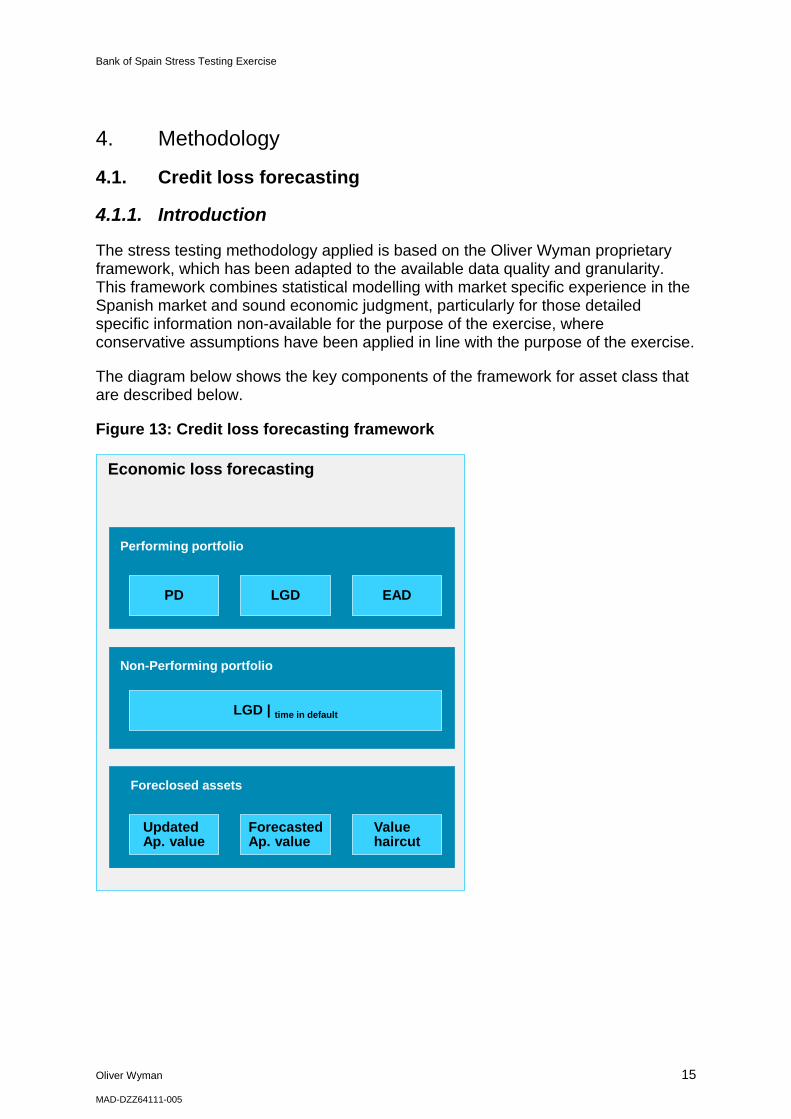
The stress testing methodology applied is based on the Oliver Wyman proprietary framework, which has been adapted to the available data quality and granularity. This framework combines statistical modelling with market specific experience in the Spanish market and sound economic judgment, particularly for those detailed specific information non-available for the purpose of the exercise, where conservative assumptions have been applied in line with the purpose of the exercise.
The diagram below shows the key components of the framework for asset class that are described below.
Figure 13: Credit loss forecasting framework
Economic loss forecasting
Performing portfolio
PD LGD EAD
Non-Performing portfolio
Foreclosed assets
Updated Ap. value
Forecasted Ap. value
Value haircut
LGD | time in default

Bank of Spain Stress Testing Exercise
Oliver Wyman 16
MAD-DZZ64111-005
In the performing loan book, the credit loss forecasts are split into three structural components:
1. Default Rates / Probabilities of Default (PDs) –composed of:
─ Differentiated anchor PDs for each relevant portfolio, where the modelling reflects actual past performance differentiated at portfolio and entity level
─ Specific treatment of other key risk drivers, where historical information might not be representative (e.g. refinanced loans)
─ Macroeconomic forecast overlays anchored to the above resulting input PDs for each portfolio
2. Loss Given Default (LGD), which is anchored to 2011 downturn LGDs, and then stressed in line with the macroeconomic scenario, with particular regard for the evolution of house and land prices, where LGDs have been aligned with implied collateral values applying the foreclosed asset methodology
3. Exposure at Default (EAD) - forecasts consider asset-level amortisation profiles, prepayment as well as natural credit renewals and new originations. In addition we apply expected utilisation of committed lines under stress
It is important to note, that in line with the conservative purpose of the exercise, the full economic loss of any performing loan or sub-portfolio is assumed to be charged upfront at the moment of default, regardless of future cash flow evolution or applied accounting rules.
In the non-performing loan book, credit loss forecasts leverage as a starting point performing loan LGDs which are then overlaid with typically observed recovery curves at the asset class level, adequately taking into account the fact that loans with more time on the balance sheet have naturally a lower expected recovery amount.
Finally, foreclosed assets’ expected losses are estimated through the structural modelling of the difference between their gross asset value as of December 11 and estimated asset realisation values, primarily driven by the expected evolution in real estate prices defined in the scenario, plus conservative valuation haircuts over appraisal values, plus maintenance costs.

Bank of Spain Stress Testing Exercise
Oliver Wyman 17
MAD-DZZ64111-005
4.1.2. Probabilities of Default (PD)
Projected probabilities of default represent the expected default rate for each portfolio.
• The past Default Rate performance for each portfolio and entity is the starting point for future PD projections. This differentiation accounted for most material Top-Down risk drivers available taking into account differences by entity, asset-class (e.g. RED/Large Corporate/SME, etc.), type of guarantee (e.g. secured, unsecured, first residence, land, etc.) and loan status (e.g. performing, substandard, etc.)
• In addition, a specific treatment has been defined for those key risk drivers where historical information may not be representative. This includes:
a. Restructured/refinanced loans As stated previously, loan restructuring and refinancing agreements have been a practice used to a different extent by financial institutions in the Spanish market since the onset of the crisis, particularly applied to the most deteriorated component of real estate portfolios. This practice has effectively disguised some de-facto default exposures as performing. Given that the detailed information on refinancing can only be obtained by undertaking an analysis on-site at entity level, and in line with the purpose of the exercise of providing a top-down estimate for the system, conservative assumptions have been applied in order to account for the quantity and quality of these loans.
In particular, the materiality of loan restructurings and re-financings are especially relevant for 2012, and within the Real Estate Developer portfolio are estimated to be up to 50% of the performing portfolio (significantly above the registered refinancing practice in the banking books). A stressed higher PD ranging from 52% to 95% (rescaling the default experience of each institution and portfolio) has been assigned to these sub-portfolios.
In the case of the other portfolios, this situation is deemed to have a smaller impact, affecting up to 15% of the portfolio (again applying conservative assumptions) for which default rates increase by between 100%-150%.
b. Substandard loans Loans classified as substandard intrinsically imply a higher risk profile than others – despite not being in default situation (e.g. supervisory designation, bank’s subjective decision based on economic indicators such as compromised business performance, etc.)

Bank of Spain Stress Testing Exercise
Oliver Wyman 18
MAD-DZZ64111-005
Based on the materiality of these facilities provided in the input data, a conservative assumption on the credit quality of these loans is made by setting their credit quality equal to the quality of restructured loans described above.
c. Corporate loan reclassifications Anecdotal evidence suggests that significant portions of Real Estate Developer loans have been misclassified as regular Corporate loans. In order to reinforce the conservative nature of the overall exercise, a reclassification of regular Corporate loans (Large Corporate, SMEs and Public Works) into the Real Estate Developer segment has been conducted, thereby accounting for potential loan misclassifications of regular Real Estate Developer loans into the Corporate segment. Up to 20% of these portfolios are assumed to be misclassified based on these criteria. These loans are directly assumed to exhibit a performance in line with the Real Estate Development loans.
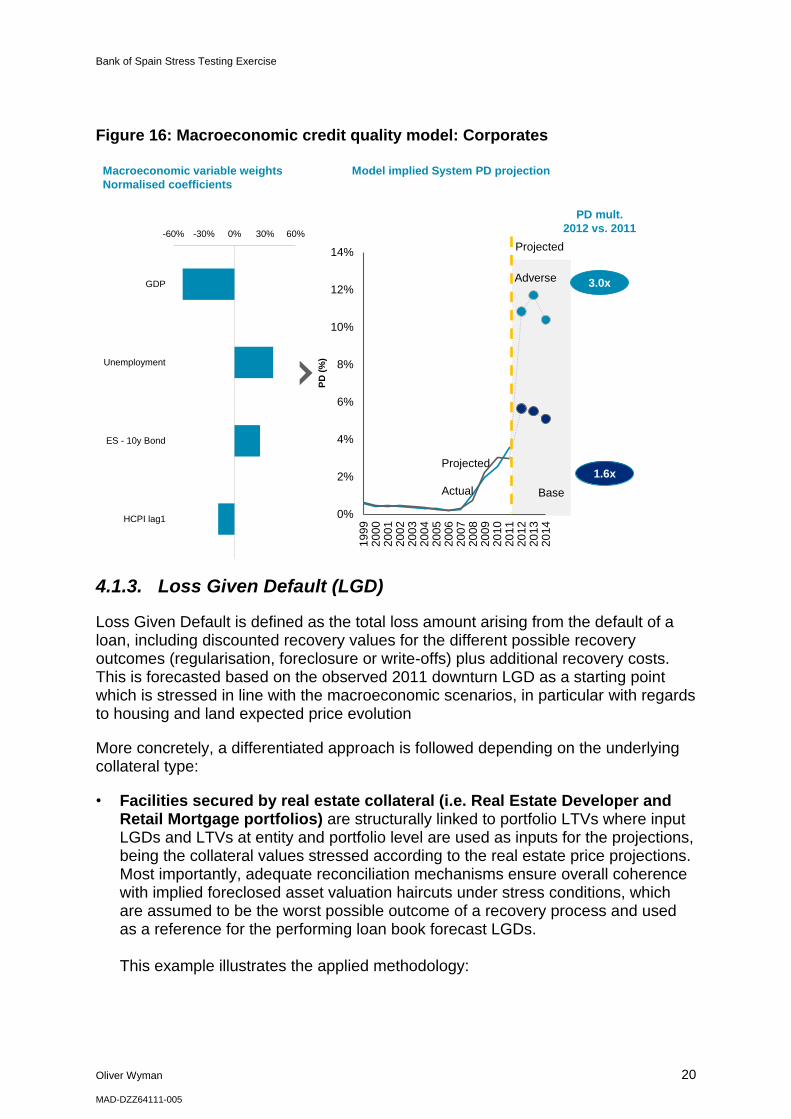
• Finally, a macroeconomic overlay is applied over the input segment PDs based on the two previous steps, so that the projected losses can reflect the impact of the defined macroeconomic base/adverse scenarios within the 2012-14 period. For the development of the macroeconomic models the predictive power of different individual factors and combined models has been explored, the final model selection being made based both on the statistical properties (i.e. t-statistic of model coefficients, R-squared, autocorrelation tests, etc.) and its economic significance and reasonableness. In total five different models have been estimated – in line with historical available information: Real Estate, Mortgages, Corporates (embedding for Large Corporates and SMEs), Public Work and Other Retail. The chart below illustrates the models and its impact on default rates in the different scenarios for Real Estate Developers, Retail Mortgages and Corporates, without considering the adjustments for non-historical default rates.

Bank of Spain Stress Testing Exercise
Oliver Wyman 19
MAD-DZZ64111-005
Figure 14: Macroeconomic credit quality model: Retail Mortgages
Figure 15: Macroeconomic credit quality model: Real Estate Developments
0%
1%
2%
3%
4%
5%
6%
7%
8%
9%
1999
2000
2001
2002
2003
2004
2005
2006
2007
2008
2009
2010
2011
2012
2013
2014
Actual
-60% -30% 0% 30% 60%
GDP
Unemployment
Euribor 12m
Housing Price
PD
(%
)
Projected
PD mult.
2012 vs. 2011
Projected
Adverse
Base
1.5x
4.4x
Macroeconomic variable weights
Normalised coefficients
Model implied System PD projection
Projected
PD mult.
2012 vs. 2011
Projected
Adverse
Base
1.8x
3.8x
Macroeconomic variable weights
Normalised coefficients
-80% -40% 0% 40% 80%
GDP
Unemployment
Euribor 3m
Land Price
PD
(%
)
0%
10%
20%
30%
40%
50%
60%
19
99
20
00
20
01
20
02
20
03
20
04
20
05
20
06
20
07
20
08
20
09
20
10
20
11
20
12
20
13
20
14
Actual
Model implied System PD projection
Bank of Spain Stress Testing Exercise
Oliver Wyman 20
MAD-DZZ64111-005
Figure 16: Macroeconomic credit quality model: Corporates
4.1.3. Loss Given Default (LGD)
Loss Given Default is defined as the total loss amount arising from the default of a loan, including discounted recovery values for the different possible recovery outcomes (regularisation, foreclosure or write-offs) plus additional recovery costs. This is forecasted based on the observed 2011 downturn LGD as a starting point which is stressed in line with the macroeconomic scenarios, in particular with regards to housing and land expected price evolution
More concretely, a differentiated approach is followed depending on the underlying collateral type:
• Facilities secured by real estate collateral (i.e. Real Estate Developer and Retail Mortgage portfolios) are structurally linked to portfolio LTVs where input LGDs and LTVs at entity and portfolio level are used as inputs for the projections, being the collateral values stressed according to the real estate price projections. Most importantly, adequate reconciliation mechanisms ensure overall coherence with implied foreclosed asset valuation haircuts under stress conditions, which are assumed to be the worst possible outcome of a recovery process and used as a reference for the performing loan book forecast LGDs. This example illustrates the applied methodology:
Projected
PD mult.
2012 vs. 2011
Projected
Adverse
Base
1.6x
3.0x
Macroeconomic variable weights
Normalised coefficients
Model implied System PD projection
PD
(%
)
-60% -30% 0% 30% 60%
GDP
Unemployment
ES - 10y Bond
HCPI lag1 0%
2%
4%
6%
8%
10%
12%
14%
19
99
20
00
20
01
20
02
20
03
20
04
20
05
20
06
20
07
20
08
20
09
20
10
20
11
20
12
20
13
20
14
Actual
Bank of Spain Stress Testing Exercise
Oliver Wyman 21
MAD-DZZ64111-005
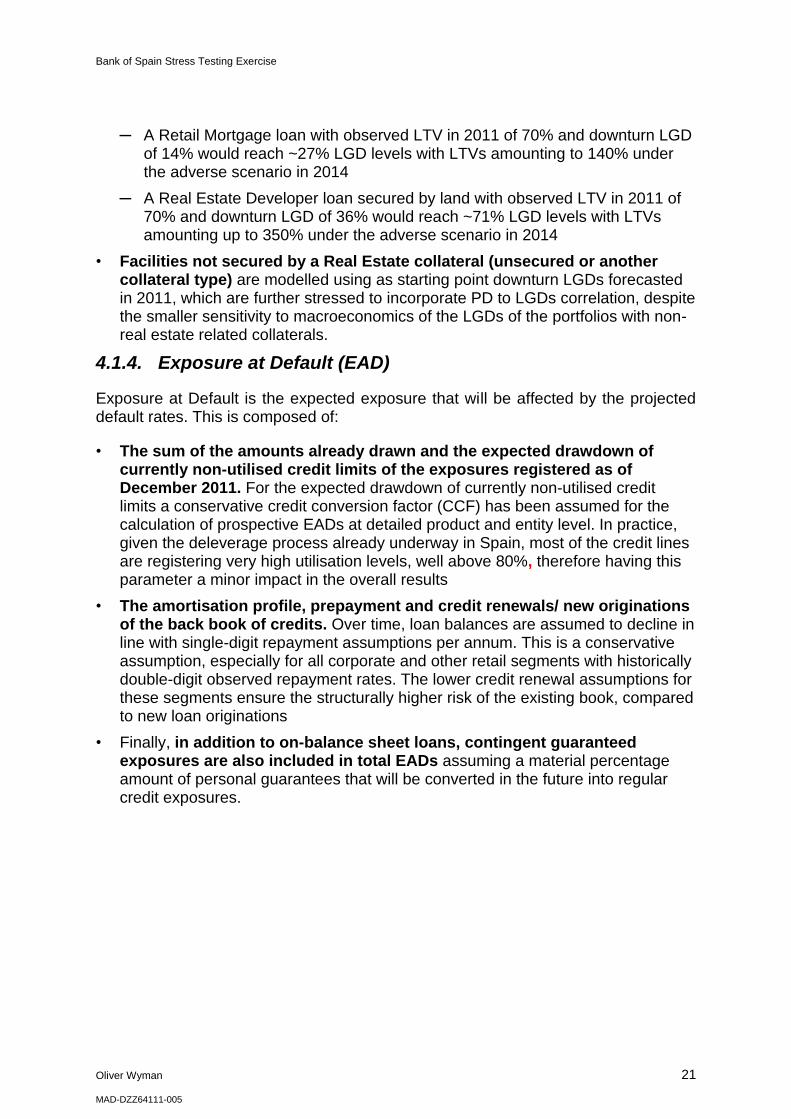
─ A Retail Mortgage loan with observed LTV in 2011 of 70% and downturn LGD of 14% would reach ~27% LGD levels with LTVs amounting to 140% under the adverse scenario in 2014
─ A Real Estate Developer loan secured by land with observed LTV in 2011 of 70% and downturn LGD of 36% would reach ~71% LGD levels with LTVs amounting up to 350% under the adverse scenario in 2014
• Facilities not secured by a Real Estate collateral (unsecured or another collateral type) are modelled using as starting point downturn LGDs forecasted in 2011, which are further stressed to incorporate PD to LGDs correlation, despite the smaller sensitivity to macroeconomics of the LGDs of the portfolios with non-real estate related collaterals.
4.1.4. Exposure at Default (EAD)
Exposure at Default is the expected exposure that will be affected by the projected default rates. This is composed of:
• The sum of the amounts already drawn and the expected drawdown of currently non-utilised credit limits of the exposures registered as of December 2011. For the expected drawdown of currently non-utilised credit limits a conservative credit conversion factor (CCF) has been assumed for the calculation of prospective EADs at detailed product and entity level. In practice, given the deleverage process already underway in Spain, most of the credit lines are registering very high utilisation levels, well above 80%, therefore having this parameter a minor impact in the overall results
• The amortisation profile, prepayment and credit renewals/ new originations of the back book of credits. Over time, loan balances are assumed to decline in line with single-digit repayment assumptions per annum. This is a conservative assumption, especially for all corporate and other retail segments with historically double-digit observed repayment rates. The lower credit renewal assumptions for these segments ensure the structurally higher risk of the existing book, compared to new loan originations
• Finally, in addition to on-balance sheet loans, contingent guaranteed exposures are also included in total EADs assuming a material percentage amount of personal guarantees that will be converted in the future into regular credit exposures.

Bank of Spain Stress Testing Exercise
Oliver Wyman 22
MAD-DZZ64111-005
4.2. Non-performing loans
Non-performing loan credit loss forecasts leverage performing loan LGDs as a starting point, which are then overlaid with typically observed recovery curves at asset class level. In particular, in non-collateralised exposures, the highest part of the recoveries takes places during the first quarters after default, therefore decreasing its expected value (and therefore increasing the LGDs) for loans that have been for a longer time period in default.
The methodology followed leverages benchmark recovery curves for the Spanish market by collateral type, whilst marginal returns diminish with movements away from the default date.
Figure 17: Illustrative recovery curves
0%
10%
20%
30%
40%
50%
60%
70%
80%
90%
100%
<6m 6-12m 12-18m 18-24m 24-30m 30-36m > 36m
Cu
mu
lati
ve R
eco
very
[%
]
Time Horizon
Mortgages Corporates
Bank of Spain Stress Testing Exercise
Oliver Wyman 23
MAD-DZZ64111-005
4.3. Foreclosed assets
Losses on foreclosed assets have been estimated as the difference between gross asset values at time of foreclosure and estimated realisation values at time of sale based on expected real estate price index evolution and applicable valuation haircuts.
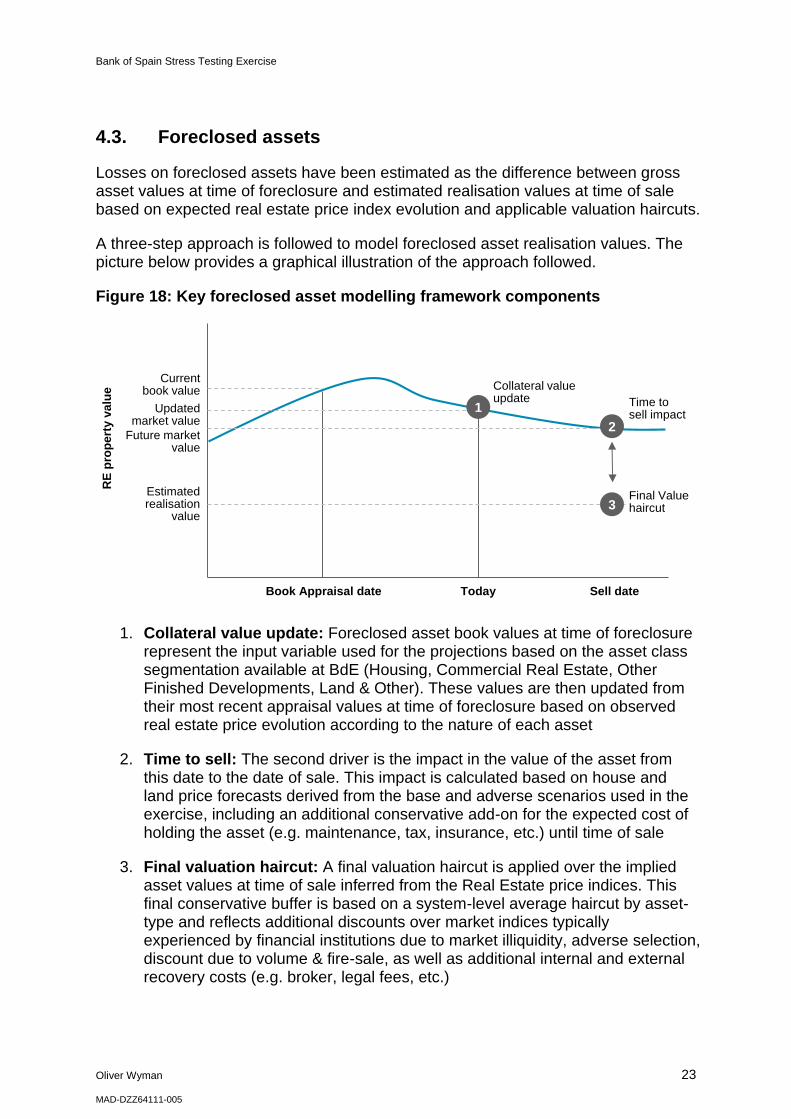
A three-step approach is followed to model foreclosed asset realisation values. The picture below provides a graphical illustration of the approach followed.
Figure 18: Key foreclosed asset modelling framework components
1. Collateral value update: Foreclosed asset book values at time of foreclosure
represent the input variable used for the projections based on the asset class segmentation available at BdE (Housing, Commercial Real Estate, Other Finished Developments, Land & Other). These values are then updated from their most recent appraisal values at time of foreclosure based on observed real estate price evolution according to the nature of each asset
2. Time to sell: The second driver is the impact in the value of the asset from this date to the date of sale. This impact is calculated based on house and land price forecasts derived from the base and adverse scenarios used in the exercise, including an additional conservative add-on for the expected cost of holding the asset (e.g. maintenance, tax, insurance, etc.) until time of sale
3. Final valuation haircut: A final valuation haircut is applied over the implied asset values at time of sale inferred from the Real Estate price indices. This final conservative buffer is based on a system-level average haircut by asset-type and reflects additional discounts over market indices typically experienced by financial institutions due to market illiquidity, adverse selection, discount due to volume & fire-sale, as well as additional internal and external recovery costs (e.g. broker, legal fees, etc.)
RE
pro
pe
rty v
alu
e
Updated market value
Current book value
Estimated realisation
value
Future market value
TodayBook Appraisal date Sell date
Collateral value update Time to
sell impact
Final Value haircut
1
2
3
Bank of Spain Stress Testing Exercise
Oliver Wyman 24
MAD-DZZ64111-005
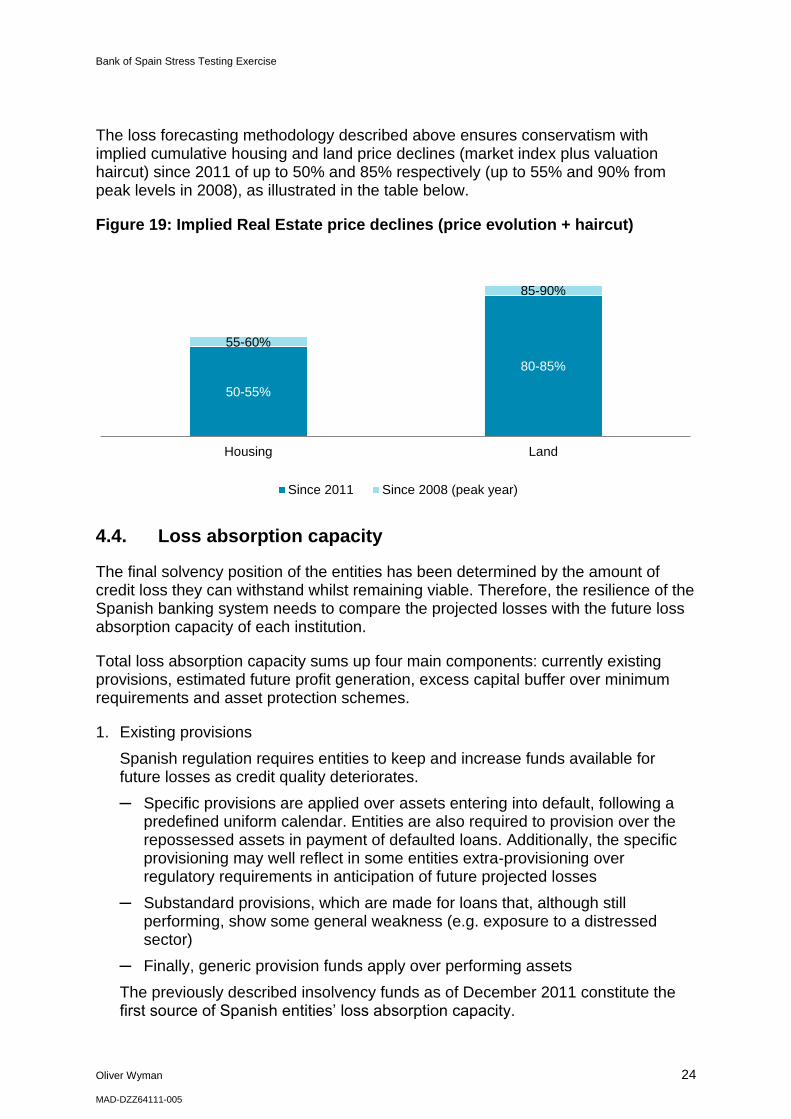
The loss forecasting methodology described above ensures conservatism with implied cumulative housing and land price declines (market index plus valuation haircut) since 2011 of up to 50% and 85% respectively (up to 55% and 90% from peak levels in 2008), as illustrated in the table below.
Figure 19: Implied Real Estate price declines (price evolution + haircut)
4.4. Loss absorption capacity
The final solvency position of the entities has been determined by the amount of credit loss they can withstand whilst remaining viable. Therefore, the resilience of the Spanish banking system needs to compare the projected losses with the future loss absorption capacity of each institution.
Total loss absorption capacity sums up four main components: currently existing provisions, estimated future profit generation, excess capital buffer over minimum requirements and asset protection schemes.
1. Existing provisions
Spanish regulation requires entities to keep and increase funds available for future losses as credit quality deteriorates.
─ Specific provisions are applied over assets entering into default, following a predefined uniform calendar. Entities are also required to provision over the repossessed assets in payment of defaulted loans. Additionally, the specific provisioning may well reflect in some entities extra-provisioning over regulatory requirements in anticipation of future projected losses
─ Substandard provisions, which are made for loans that, although still performing, show some general weakness (e.g. exposure to a distressed sector)
─ Finally, generic provision funds apply over performing assets
The previously described insolvency funds as of December 2011 constitute the first source of Spanish entities’ loss absorption capacity.
50-55%
80-85%
55-60%
85-90%
Housing Land
Since 2011 Since 2008 (peak year)
Bank of Spain Stress Testing Exercise
Oliver Wyman 25
MAD-DZZ64111-005
Future provisions plans have not been taken into account (i.e. including last provisioning decrees), as they are not yet reflected in banks’ balance sheets
2. Asset protection schemes:
In order to foster the restructuring process and incentivise takeovers between banks and saving banks, the government has provided certain banks with Asset Protection Schemes for future losses on the real estate book of the acquired entities13. The loss mitigation impact of those mechanisms under the different scenarios has been measured, taking into account the specifics of each entity’ APS agreements, being therefore total system capital needs reduced by this mitigation impact.
3. New profit generation capacity
Resilience to the adverse scenario has been markedly different across individual banks, due to their varying business models and loan book quality. Therefore, our analysis has emphasised the need to differentiate the characteristics underpinning banks’ financial strength, as far as specific entity level data provided by the BdE allowed for it.
Future pre-provisioning profit generation considers three main different components: net interest margin, net fees and operating expenses.
─ Projected Net Interest Margin is essentially driven by two components:
− Projected decrease in balance-sheet size associated to de-leverage, has a negative impact on NIM
─ Similarly projected fees consider both the evolution of the percentage of net fees over balance-sheet size, which are assumed to be stable - despite the fact that they are typically countercyclical - and the impact of the decreasing balance sheet size, which has a dominant negative impact on this P&L component
─ Finally, costs have been decomposed into a fix and a variable component. While the variable component can be adjusted to reflect balance sheet and NIM reductions, fix costs (the predominantly components of the overall costs) are maintained, therefore deteriorating the Cost-to-Income ratio and overall profitability
Future international post-provisioning earnings for banks with relevant and sustainable operations outside Spain were also considered applying a conservative top-down haircut of 30%
4. Capital buffer
The capital buffer is the excess available capital above the requirements set for the purpose of the exercise. As defined by the Steering Committee, post-shock capital needs are calculated taking a minimum Core Tier 1 ratio (as defined by the EBA) of 9% and 6%, under the base and the adverse scenarios respectively.
13
Existing APS available for (Sabadell + CAM, BBVA + Unnim, Liberbank + Ibercaja + Caja 3)

Bank of Spain Stress Testing Exercise
Oliver Wyman 26
MAD-DZZ64111-005
− Percentage profitability over balance sheet size. This is mostly driven by the capacity of each bank to re-price its assets to accommodate any potential change in the liabilities’ costs (or re-pricing them).
− On the asset side, we have considered the different re-pricing capacities by asset type, these being these higher in corporate portfolios and smaller in mortgages, beyond the natural update of the reference indices – Euribor - given the long term maturity of these portfolios. Additionally, only performing credit volumes are considered to be interest bearing.
− On the liability side, funding costs are assumed to raise or increase consistently with the proposed scenarios, always assuming a proportion of non-interest bearing accounts is maintained, and therefore
This excess above the capital hurdle in 2014 can largely be explained by two reasons:
─ Initial core capital: Only realised actions to date (June ’12) - and not future viability plans announced by the institutions (such as potential assets disposals or bond conversions) - have been considered
─ Credit de-leverage: this has the effect of reducing total RWAs and subsequently, capital requirements. This RWA reduction reflects the specific asset mix of each entity
Bank of Spain Stress Testing Exercise
Oliver Wyman 27
MAD-DZZ64111-005
5. Results of the stress testing exercise
5.1. Loss absorption capacity
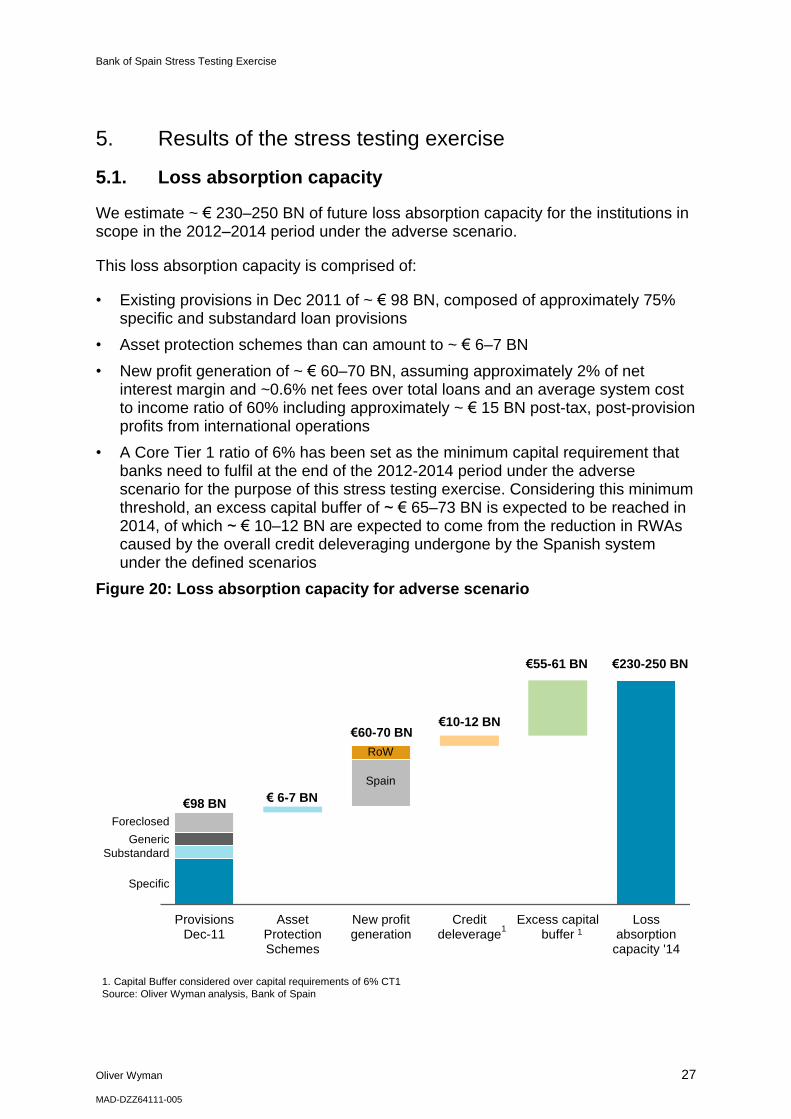
We estimate ~ € 230–250 BN of future loss absorption capacity for the institutions in scope in the 2012–2014 period under the adverse scenario.
This loss absorption capacity is comprised of:
• Existing provisions in Dec 2011 of ~ € 98 BN, composed of approximately 75% specific and substandard loan provisions
• Asset protection schemes than can amount to ~ € 6–7 BN
• New profit generation of ~ € 60–70 BN, assuming approximately 2% of net interest margin and ~0.6% net fees over total loans and an average system cost to income ratio of 60% including approximately ~ € 15 BN post-tax, post-provision profits from international operations
• A Core Tier 1 ratio of 6% has been set as the minimum capital requirement that banks need to fulfil at the end of the 2012-2014 period under the adverse scenario for the purpose of this stress testing exercise. Considering this minimum threshold, an excess capital buffer of ~ € 65–73 BN is expected to be reached in 2014, of which ~ € 10–12 BN are expected to come from the reduction in RWAs caused by the overall credit deleveraging undergone by the Spanish system under the defined scenarios
Figure 20: Loss absorption capacity for adverse scenario
1. Capital Buffer considered over capital requirements of 6% CT1
Source: Oliver Wyman analysis, Bank of Spain
ProvisionsDec-11
AssetProtectionSchemes
New profitgeneration
Creditdeleverage
Excess capitalbuffer
Lossabsorption
capacity '14
Specific
Substandard
Generic
Foreclosed
RoW
Spain
€98 BN€ 6-7 BN
€60-70 BN€10-12 BN
€55-61 BN €230-250 BN
1 1
Bank of Spain Stress Testing Exercise
Oliver Wyman 28
MAD-DZZ64111-005
5.2. Forecasted expected losses
5.2.1. Aggregate results
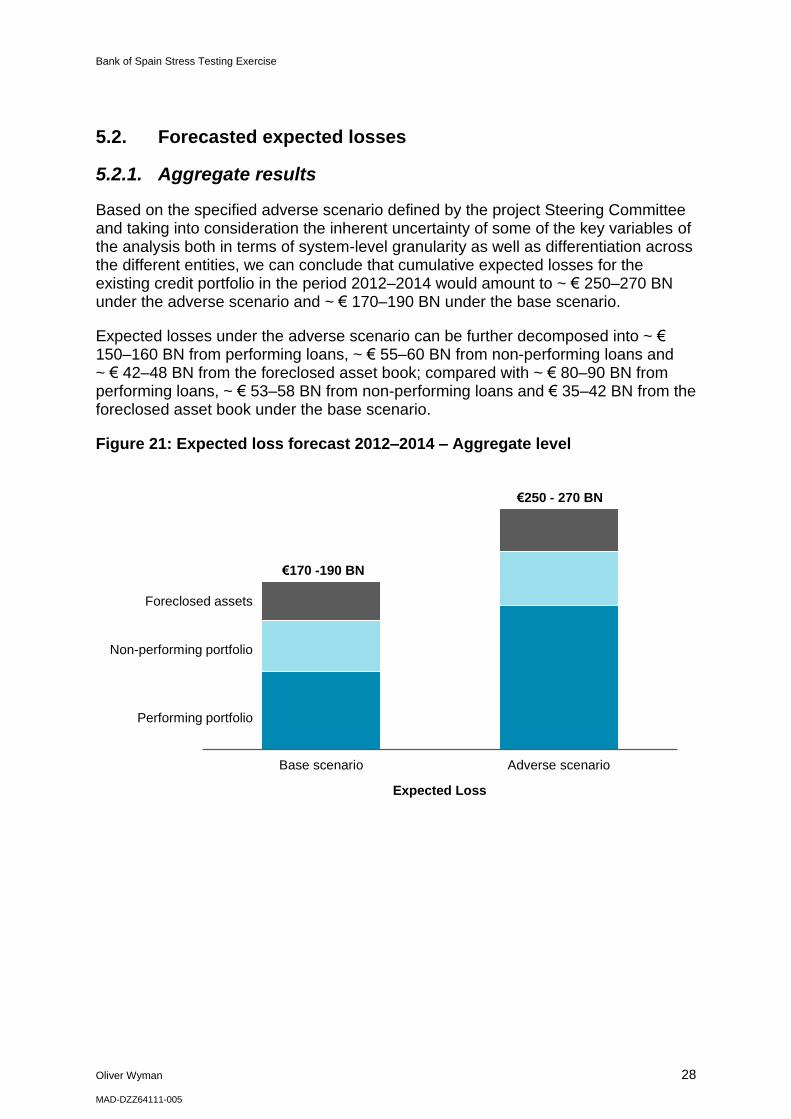
Based on the specified adverse scenario defined by the project Steering Committee and taking into consideration the inherent uncertainty of some of the key variables of the analysis both in terms of system-level granularity as well as differentiation across the different entities, we can conclude that cumulative expected losses for the existing credit portfolio in the period 2012–2014 would amount to ~ € 250–270 BN under the adverse scenario and ~ € 170–190 BN under the base scenario.
Expected losses under the adverse scenario can be further decomposed into ~ € 150–160 BN from performing loans, ~ € 55–60 BN from non-performing loans and ~ € 42–48 BN from the foreclosed asset book; compared with ~ € 80–90 BN from performing loans, ~ € 53–58 BN from non-performing loans and € 35–42 BN from the foreclosed asset book under the base scenario.
Figure 21: Expected loss forecast 2012–2014 – Aggregate level
Base scenario Adverse scenario
Performing portfolio
Non-performing portfolio
Foreclosed assets
Expected Loss
€170 -190 BN
€250 - 270 BN

Bank of Spain Stress Testing Exercise
Oliver Wyman 29
MAD-DZZ64111-005
At individual asset class level, Real Estate Developers is the segment with the highest absolute (~ € 100–110 BN) and relative expected losses (42–48% of total 2011 exposures), followed by the Corporate segment (Large Corporates, SMEs and Public Works) with ~ € 75–85 BN expected losses. Retail Mortgages, despite being the largest asset class in terms of exposure, accounts for a relatively lower share of expected losses: ~ € 22–25 BN or 3.8–4.3% as a percentage of 2011 loan exposures.
Figure 22: Estimated expected losses 2012–2014 – Drill-down by asset class
Expected Loss 2012-14 (€ BN)
Expected Loss 2012-14 (as % of 2011 Balance)
Segment/ Asset type 2011
Balance Base
Scenario Adverse
Scenario Base
Scenario Adverse
Scenario
RE Developers 16% 65 – 70 100 – 110 28% - 32% 42% - 48%
Retail Mortgages 42% 11 – 15 22 – 25 2.0% - 2.4% 3.8% - 4.3%
Large Corporates14
18% 18 – 24 30 – 35 7% - 9% 12% - 15%
SMEs10
16% 22 – 30 35 – 40 10% - 12% 15% - 18%
Public Works 3% 4 – 6 8 – 10 12% - 14% 21% - 23%
Other Retail 5% 6 – 10 10 – 15 10% - 12% 15% - 20%
Total Credit Portfolio15
100% 135 – 150 210 - 220 9% - 11% 15% - 17%
Foreclosed assets16
35 – 42 42 – 48 45% - 55% 55% - 65%
14
Misclassified Real Estate Developer loans under the Large Corporate and SME segment are included within this category
15 Expected losses from performing and non-performing loans measured as percentage of Dec 2011 balance
16 Expected losses from foreclosure assets measures as percentage of book value at foreclosure

Bank of Spain Stress Testing Exercise
Oliver Wyman 30
MAD-DZZ64111-005
5.2.2. Drill down by asset class
5.2.2.1. Real Estate Developers
Accumulated expected losses from Real Estate Developers have been estimated to rise up to 48% of 2011 loan balances under the adverse scenario, with PDs experiencing a severe increase (up to x4) in 2012 compared to 2011.
Figure 23: Estimated expected losses 2012–2014 – Real Estate Developers
Expected Loss 2012-14 (€ BN)
Expected Loss 2012-14 (as % of 2011 Balance)
Segment/ Asset type 2011
Balance Base
Scenario Adverse
Scenario Base
Scenario Adverse
Scenario
Finalised 38% 12 – 15 22 – 25 16% - 17% 25% - 27%
In progress 12% 6 – 9 10 – 12 25% - 28% 38% - 42%
Urban land 23% 18 – 20 18 – 30 35% - 38% 55% - 57%
Other assets 5% 1 – 2 2 – 5 13% - 15% 19% - 21%
Other land 4% 9 -11 15 – 20 90% - 95% 100%
No RE collateral 16% 15 – 17 20 – 25 43% - 47% 57% 61%
RE Developers 100% 65 – 70 100 – 110 28% - 32% 42% - 48%
Projected losses for this segment are mainly driven by the severe PD increase caused by the negative macro-economic scenario defined for the 2012–14 period, as well as the conservative assumptions on restructuring/refinancing (~50% of normal loans with a 75% PD in 2012) and substandard loans (~30% of total loans) leading to cumulative PDs of up to 90% by the end of 2014 in the adverse scenario.
Bank of Spain Stress Testing Exercise
Oliver Wyman 31
MAD-DZZ64111-005
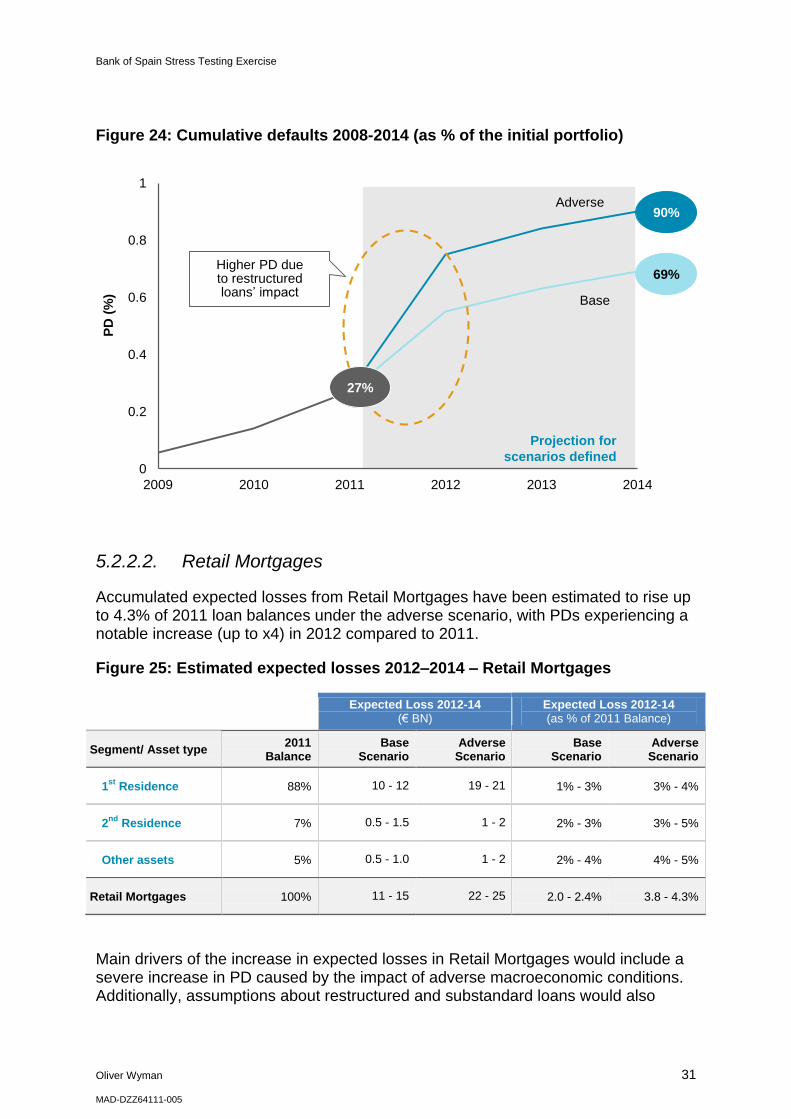
Figure 24: Cumulative defaults 2008-2014 (as % of the initial portfolio)
5.2.2.2. Retail Mortgages
Accumulated expected losses from Retail Mortgages have been estimated to rise up to 4.3% of 2011 loan balances under the adverse scenario, with PDs experiencing a notable increase (up to x4) in 2012 compared to 2011.
Figure 25: Estimated expected losses 2012–2014 – Retail Mortgages
Expected Loss 2012-14 (€ BN)
Expected Loss 2012-14 (as % of 2011 Balance)
Segment/ Asset type 2011
Balance Base
Scenario Adverse
Scenario Base
Scenario Adverse
Scenario
1st
Residence 88% 10 - 12 19 - 21 1% - 3% 3% - 4%
2nd
Residence 7% 0.5 - 1.5 1 - 2 2% - 3% 3% - 5%
Other assets 5% 0.5 - 1.0 1 - 2 2% - 4% 4% - 5%
Retail Mortgages 100% 11 - 15 22 - 25 2.0 - 2.4% 3.8 - 4.3%
Main drivers of the increase in expected losses in Retail Mortgages would include a severe increase in PD caused by the impact of adverse macroeconomic conditions. Additionally, assumptions about restructured and substandard loans would also
0
0.2
0.4
0.6
0.8
1
2009 2010 2011 2012 2013 2014
PD
(%
)
90%
69%
27%
Base
Adverse
Higher PD due to restructured loans’ impact
Projection for
scenarios defined

Bank of Spain Stress Testing Exercise
Oliver Wyman 32
MAD-DZZ64111-005
contribute to this abrupt rise in 2012 PD, which in some cases doubles 2011 PD for the ~10% of the normal portfolio.
Figure 26: Cumulative defaults 2008-2014 (as % of the initial portfolio)
In addition to the increase in PDs, Retail Mortgage LGDs have also been severely affected by stressed LGDs which increase from 12% historical downturn to 20%+, despite average LTV of ~60%. This level of credit losses is consistent with expected drops in real estate prices and haircuts applied.
5.2.2.3. Corporates
Losses are expected to amount to ~ € 75 – 85 BN in the corporate loan portfolio under the adverse scenario primarily because of a sharp increase in corporate segment PDs. Macroeconomic conditions under the defined adverse scenario, as well as assumptions on substandard loans make default rates double in the first year of the period.
0%
10%
20%
30%
2009 2010 2011 2012 2013 2014
PD
(%
)
22%
16%
Projection for
scenarios defined
Base
Adverse
5%
Higher PD due to substandard
loans’ impact

Bank of Spain Stress Testing Exercise
Oliver Wyman 33
MAD-DZZ64111-005
Figure 27: Estimated expected losses 2012–2014 – Corporates
Expected Loss 2012-14 (€ BN)
Expected Loss 2012-14 (as % of 2011 Balance)
Segment/ Asset type 2011
Balance Base
Scenario Adverse
Scenario Base
Scenario Adverse
Scenario
Large Corporates 50% 18 – 24 30 – 35 7% - 9% 12% - 15%
SMEs 42% 22 – 30 35 – 40 10% - 12% 15% - 18%
Public Works 8% 4 – 6 8 – 10 12% - 14% 21% - 23%
Total Corporate 100% 48 – 55 75 - 85 9% - 12% 15% - 17%
Another factor that would contribute to the increase in losses in the corporate sector is the conservative assumption used regarding potential misclassification of RED loans for up to 20% of the corporate portfolio. Consequently, segment PDs have been increased to account for this factor.
Corporate LGD would suffer a moderate increase due to being less sensitive to the cycle than other segments’ and high collateralisation levels of credits (35% of exposure is collateralised; and the number increases up to 50% for SMEs).
5.2.2.4. New credit book losses
On top of estimated credit losses from the existing credit back-book, we have also taken into account potential losses of the newly originated book. New credit origination is assumed to be low, in line with the overall credit deleveraging scenarios defined by the Steering Committee and the low repayment assumptions assumed for the credit back book.
New loan originations are assumed to have a better credit quality than historical loans, driving relatively low expected credit losses at ~ € 3 - 4 BN, which need to be considered when calculating final capital needs.
5.2.2.5. Foreclosed Assets
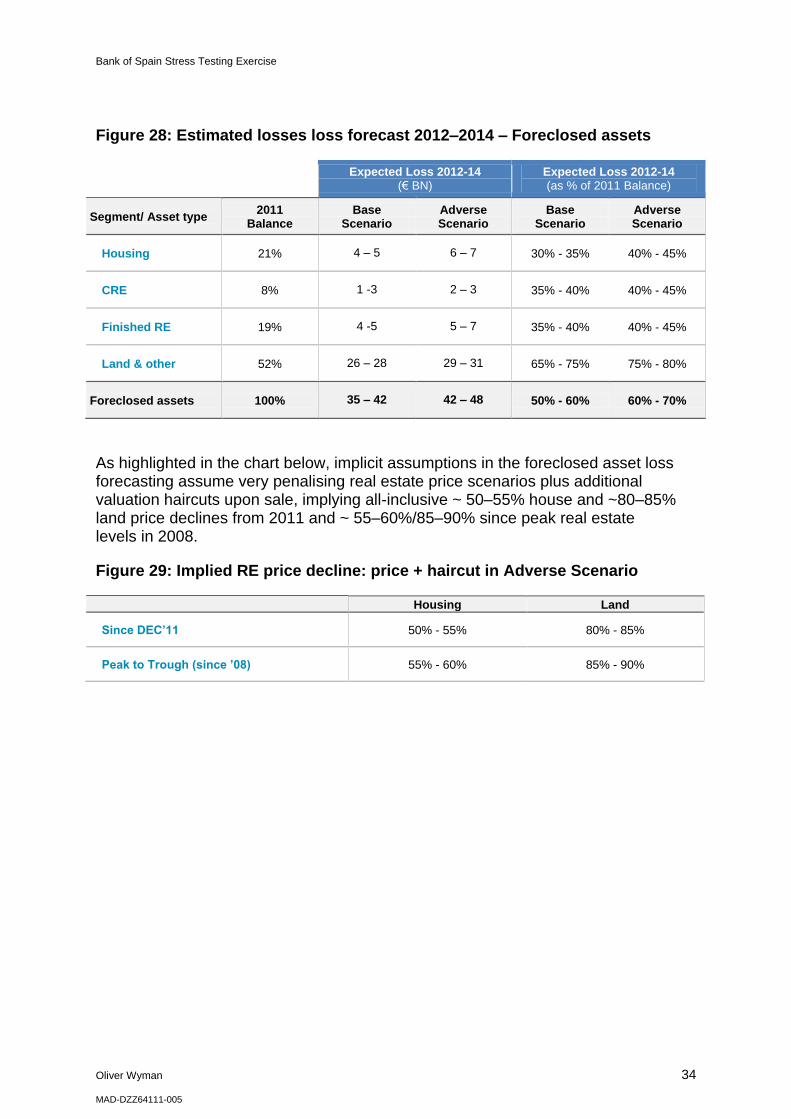
Cumulative 2012–2014 expected losses from the foreclosed asset book are estimated to amount to € 42–48 BN (60–70% of gross asset value at foreclosure) in the adverse scenario compared to € 35–42 BN (50–60%) under the base scenario.
The biggest source of expected losses both in relative and in absolute terms is assumed to be land with up to € 29–31 BN (75–80% of gross asset value at time of foreclosure), followed by Housing and other Finished developments.
Bank of Spain Stress Testing Exercise
Oliver Wyman 34
MAD-DZZ64111-005
Figure 28: Estimated losses loss forecast 2012–2014 – Foreclosed assets
Expected Loss 2012-14 (€ BN)
Expected Loss 2012-14 (as % of 2011 Balance)
Segment/ Asset type 2011
Balance Base
Scenario Adverse Scenario
Base Scenario
Adverse Scenario
Housing 21% 4 – 5 6 – 7 30% - 35% 40% - 45%
CRE 8% 1 -3 2 – 3 35% - 40% 40% - 45%
Finished RE 19% 4 -5 5 – 7 35% - 40% 40% - 45%
Land & other 52% 26 – 28 29 – 31 65% - 75% 75% - 80%
Foreclosed assets 100% 35 – 42 42 – 48 50% - 60% 60% - 70%
As highlighted in the chart below, implicit assumptions in the foreclosed asset loss forecasting assume very penalising real estate price scenarios plus additional valuation haircuts upon sale, implying all-inclusive ~ 50–55% house and ~80–85% land price declines from 2011 and ~ 55–60%/85–90% since peak real estate levels in 2008.
Figure 29: Implied RE price decline: price + haircut in Adverse Scenario
Housing Land
Since DEC’11 50% - 55% 80% - 85%
Peak to Trough (since ’08) 55% - 60% 85% - 90%

Bank of Spain Stress Testing Exercise
Oliver Wyman 35
MAD-DZZ64111-005
5.3. Estimated capital needs
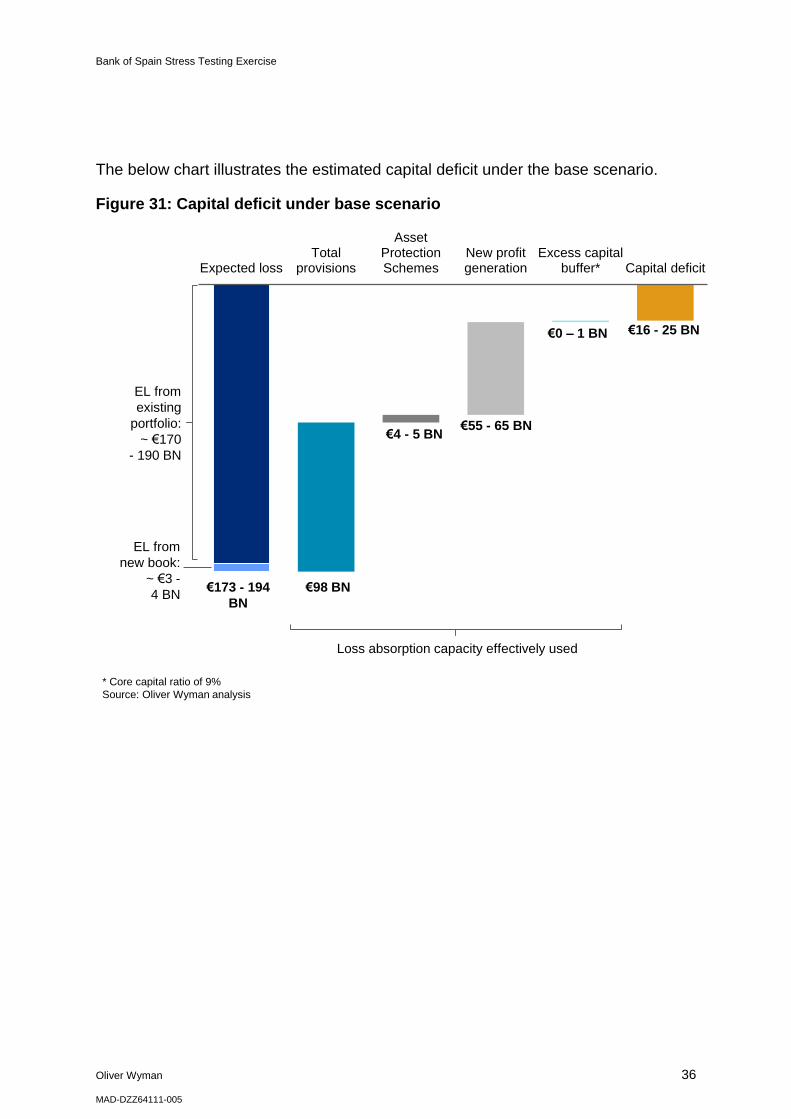
Overall results suggest estimated capital needs of approximately ~ € 51 - 62 BN and ~ € 16 - 25 BN in the adverse and base scenario respectively.
This capital shortfall has been calculated as a result of comparing entities’ expected losses against their own loss absorption capacity. Figures are presented below for both adverse and base scenarios, considering a capital hurdle of 6% post shock and 9% Core Tier 1 ratio respectively (which explains the difference on the available capital buffer between both scenarios).
Capital deficits under both scenarios, despite industry level total absorption capacity roughly in line with expected losses (detailed in section 5.1), are due to the removal of compensating effects across distinct groups of entities. This is because losses cannot be ‘socialised’ across individual entities, and therefore, excess absorption capacity of strongest individual entities do not offset deficits17 of weaker ones.
Figure 30: Capital deficit under adverse scenario
17
Entities that have already announced or are currently on a merging process are considered as a group, and therefore share loss absorption capacities
Expected lossTotal
provisions
AssetProtectionSchemes
New profitgeneration
Excess capitalbuffer* Capital deficit
€253 - 274 BN
€6 - 7 BN
€98 BN
€64 - 68 BN
€33 - 39 BN
€51 - 62 BN
Loss absorption capacity effectively used
* Core capital ratio of 6%
Source: Oliver Wyman analysis
EL from
existing
portfolio:
~ €250
- 270 BN
EL from
new book:
~ €3 - 4 BN
Bank of Spain Stress Testing Exercise
Oliver Wyman 36
MAD-DZZ64111-005
The below chart illustrates the estimated capital deficit under the base scenario.
Figure 31: Capital deficit under base scenario
Expected lossTotal
provisions
AssetProtectionSchemes
New profitgeneration
Excess capitalbuffer* Capital deficit
Loss absorption capacity effectively used
* Core capital ratio of 9%
Source: Oliver Wyman analysis
€173 - 194
BN
€4 - 5 BN
€98 BN
€55 - 65 BN
€0 – 1 BN €16 - 25 BN
EL from
existing
portfolio:
~ €170
- 190 BN
EL from
new book:
~ €3 -
4 BN

Bank of Spain Stress Testing Exercise
Oliver Wyman 37
MAD-DZZ64111-005
Abbreviations used in this report
ALM Asset Liability Management
BdE Banco de España
CAGR Compounded Annual Growth Rate
CCAR Comprehensive Capital Analysis and Review (Federal Reserve US Stress Test)
CRE Commercial Real Estate
CT Core Tier
DtD Distance to Default
EAD Exposure at Default
EBA European Banking Authority
EL Expected Loss
GDP Gross Domestic Product
LGD Loss Given Default
LTV Loan to Value
NIM Net Interest Margin
NPL Non-Performing Loan
PD Probability of Default
RE Real Estate
RED Real Estate Developers
RWA Risk Weighted Assets
SME Small and Medium Enterprises
YE Year End

Bank of Spain stress testing exercise
Oliver Wyman 38
MAD-DZZ64111-005
REPORT QUALIFICATIONS, ASSUMPTIONS & LIMITING CONDITIONS
This report sets forth the information required by the written terms of Oliver Wyman’s engagement by the Bank of Spain, as agreed in the written contract dated May 21st, 2012 between Oliver Wyman S.L. (together with its affiliates, “Oliver Wyman”) and the Bank of Spain with respect to this engagement (the “Agreement”) and is prepared in the form expressly required thereby. This report is intended to be read and used as a whole and not in parts. Separation or alteration of any section or page from the main body of this report is expressly forbidden and invalidates this report.
This report is not intended for general circulation or publication, nor is it to be used, reproduced, quoted from or distributed for any purpose, except as expressly permitted by the terms of the Agreement and, in all cases, subject to the reliance limitations and the other terms and conditions set forth herein and in the Agreement.
Information furnished by others, upon which all or portions of this report are based, has not been verified. No representation or warranty is given as to the accuracy of such information. Specifically, information that has been provided by or on behalf of the Bank of Spain has not been validated, verified or confirmed, nor has Oliver Wyman sought to validate, verify or confirm such information. Oliver Wyman makes no representation or warranty as to the accuracy of such information, and Oliver Wyman expressly disclaims all responsibility, and shall have no liability for, the accuracy of such information.
The findings contained in this report may contain predictions based on data provided to Oliver Wyman and/or historical trends. Any such predictions are subject to inherent risks and uncertainties. In particular, actual results could be impacted by future events which cannot be predicted or controlled, including, without limitation, changes in macroeconomic conditions such as GDP, unemployment rate, housing prices, exchange rates, interest rates, etc. Oliver Wyman expressly disclaims all responsibility, and shall have no liability, for actual results or future events.
The opinions expressed in this report are valid only for the purpose stated herein and in the Agreement, and are solely as of the date of this report. No obligation is assumed, and Oliver Wyman shall have no liability, to revise this report to reflect changes, events or conditions, which occur subsequent to the date hereof.
The scope of the report has, at the request of the Bank of Spain, been limited exclusively to the areas indicated in section “1.3 – Perimeter of the exercise” and excludes all others.
All decisions in connection with the implementation or use of advice or recommendations (if any) contained in this report are not the responsibility of Oliver Wyman. This report does not represent investment advice (thus it should not be construed as an invitation or inducement to any person to engage in investment activity) nor does it provide any opinion regarding the fairness of any transaction to any and all parties.

Bank of Spain stress testing exercise
Oliver Wyman 39
MAD-DZZ64111-005
This report has been prepared for the Bank of Spain. There are no third party beneficiaries with respect to this report, and Oliver Wyman expressly disclaims any liability whatsoever (whether in contract, tort or otherwise) to any third party, including, without limitation, any security holder, investor, regulator, institution or any entity that is the subject of the report. The fact that this report may ultimately be disclosed to any such third party does not constitute any permission, waiver or consent from Oliver Wyman for such third party to rely on the report or base any claims whatsoever upon it (whether in contract, tort or otherwise) against Oliver Wyman. To the extent Oliver Wyman permits disclosure to any such third party, or such disclosure is permitted by the Agreement, Oliver Wyman expressly disclaims any liability whatsoever vis-à-vis such third party, by the mere fact that such third party has been given access to the report. In particular, Oliver Wyman shall not have any liability vis-à-vis such third party in respect of the contents of this report or any actions taken or decisions made as a consequence of the results, advice or recommendations set forth herein.
This report shall be governed by Spanish law and, without limitation to the foregoing, the extent to which Oliver Wyman shall be subject to liability (if any) in respect of this report shall be governed exclusively by Spanish law, and by the express terms and conditions of the Agreement.
© Oliver Wyman

Oliver Wyman
Paseo de la Castellana, 13-2 piso
28046 Madrid
Tel: 34 91 432 8400 Fax: 34 91 432 8401
www.oliverwyman.com