background radiation and shielding - -- jinst · background radiation and shielding 3.1...
TRANSCRIPT
2008 JINST 3 S08003
Chapter 3
Background radiation and shielding
3.1 Introduction
In contrast to previous and existing colliders, the dominant primary source of background radiationat the LHC, when operating at design luminosity, arises from collisions at the interaction point.The rates expected from beam-halo particles and beam-gas interactions are negligible in compar-ison. In the inner detector, charged hadrons from inelastic proton-proton interactions dominatethe radiation backgrounds at small radii, while the effects of other backgrounds, such as neutrons,become more important further out (see [34] for detailed studies of the various radiation sources,radiation levels, neutron fluences and activation levels expected in ATLAS throughout the lifetimeof the experiment).
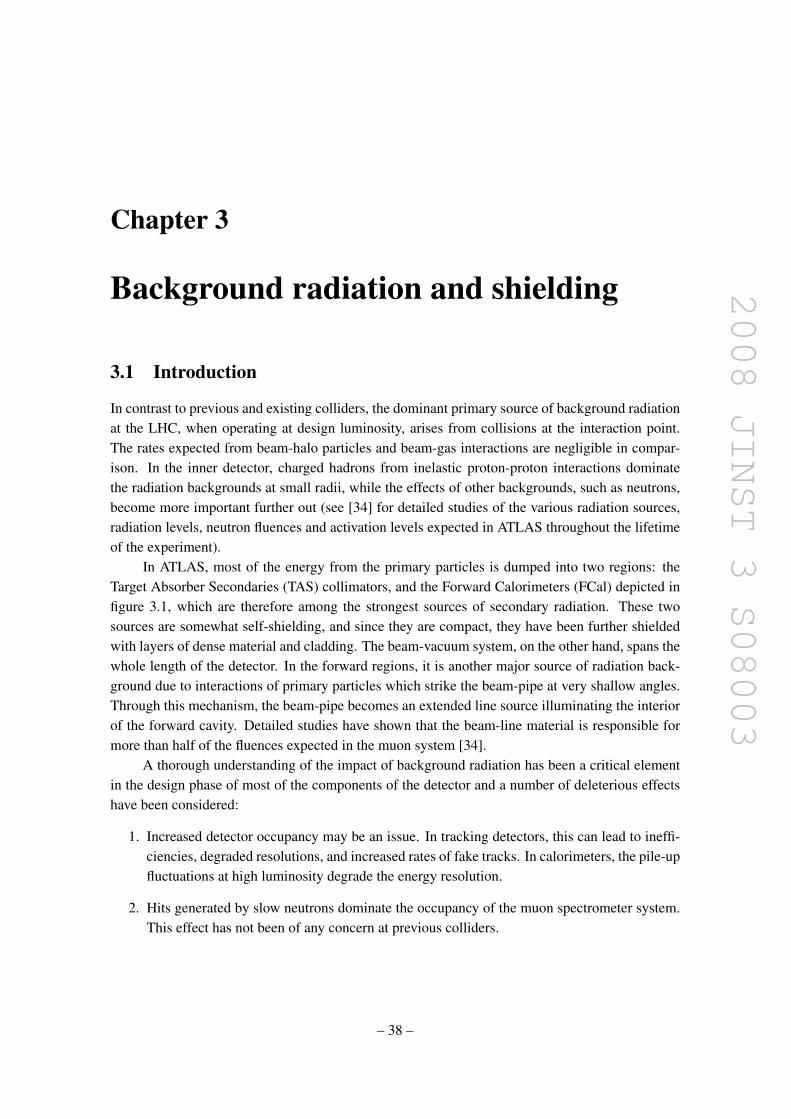
In ATLAS, most of the energy from the primary particles is dumped into two regions: theTarget Absorber Secondaries (TAS) collimators, and the Forward Calorimeters (FCal) depicted infigure 3.1, which are therefore among the strongest sources of secondary radiation. These twosources are somewhat self-shielding, and since they are compact, they have been further shieldedwith layers of dense material and cladding. The beam-vacuum system, on the other hand, spans thewhole length of the detector. In the forward regions, it is another major source of radiation back-ground due to interactions of primary particles which strike the beam-pipe at very shallow angles.Through this mechanism, the beam-pipe becomes an extended line source illuminating the interiorof the forward cavity. Detailed studies have shown that the beam-line material is responsible formore than half of the fluences expected in the muon system [34].
A thorough understanding of the impact of background radiation has been a critical elementin the design phase of most of the components of the detector and a number of deleterious effectshave been considered:
1. Increased detector occupancy may be an issue. In tracking detectors, this can lead to ineffi-ciencies, degraded resolutions, and increased rates of fake tracks. In calorimeters, the pile-upfluctuations at high luminosity degrade the energy resolution.
2. Hits generated by slow neutrons dominate the occupancy of the muon spectrometer system.This effect has not been of any concern at previous colliders.
– 38 –
2008 JINST 3 S08003
3. Spurious trigger rates will increase if the background radiation consists of penetrating tracks.Also, increased occupancies can increase the rates of random triggers.
4. Radiation may damage silicon detectors and readout electronics.
5. Interactions leading to anomalous deposits of local radiation can change the logical statusof electronic signals (single-event upset) or permanently destroy components (single-eventdamage).
6. Wire detectors can experience “ageing” (reduced gain and therefore efficiency) due to poly-merised deposits on the wires caused by radiation interacting with certain components of thedetector gas.
7. The large fluences expected at the LHC design luminosity may lead to a significant radiationhazard from the prompt component of the radiation, when the accelerator is operating.
8. Nuclear interactions in dense materials will lead to the creation of residual radio-nuclides.The resulting dose rates from radio-activation of certain materials will lead to radiologicalhazards, which impact access and maintenance scenarios.
The largest impact from background radiation is of course to be expected close to the beam-pipe, in particular in the region of the inner detector and the forward calorimeters. Given the lackof available space and the large contribution from primaries, only a limited amount of moderatorshielding could be installed to minimise the impact of background radiation, as described in sec-tion 3.2.
Very large reductions in the expected background rates in the muon spectrometer have beenachieved by designing a large amount of shielding around the TAS. A total shielding weightof 2825 tonnes (1887 tonnes of metal, 920 tonnes of concrete, and 18 tonnes of plastic) has thusbeen added to the detector. Since different types of radiation are best stopped with different typesof shielding materials, a multi-layered shielding approach has been used. The inner layer’s purposeis to stop high-energy hadrons and their secondaries. This layer is made of materials such as iron orcopper, which provide a large number of interaction lengths. In the case of iron, studies have shownthat a minimum carbon content of a few percent is advantageous since it efficiently moderates theneutron energies down to lower values. A second layer, consisting of boron-doped polyethylene,is used to moderate the neutron radiation escaping from the first layer and the low-energy neutronsare then captured by the dopant. Photon radiation is created in the neutron-capture process andthese photons are stopped in the third shielding layer which consists of steel or lead. Lead is moreeffective in stopping photons, but induces more neutron radiation than steel. Figure 3.1 shows thelocations of the different shielding components in ATLAS.
3.2 Description of the shielding
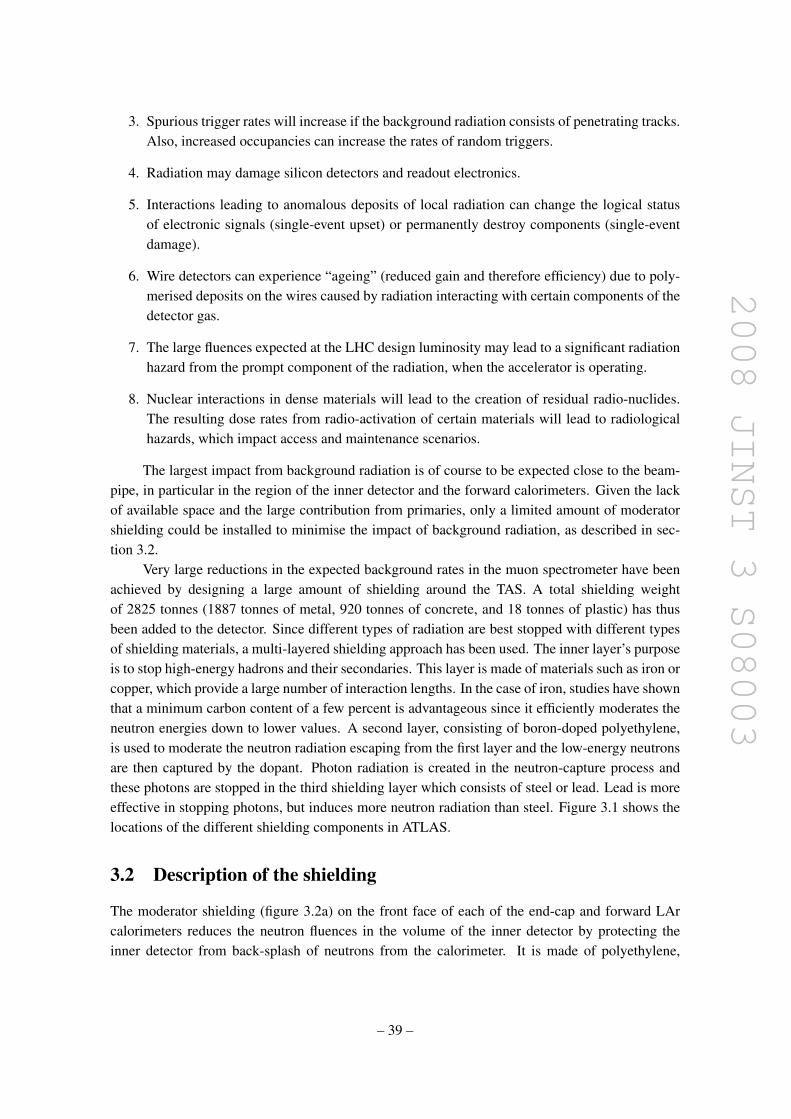
The moderator shielding (figure 3.2a) on the front face of each of the end-cap and forward LArcalorimeters reduces the neutron fluences in the volume of the inner detector by protecting theinner detector from back-splash of neutrons from the calorimeter. It is made of polyethylene,
– 39 –
2008 JINST 3 S08003
Innerdetector
TAS
End-cap toroid
FCal
End-c
ap m
uon
inn
er st
atio
n
End
-cap
muo
n
m
iddl
e sta
tion
End-c
ap m
uon
out
er st
atio
n
Tile cal.
Tile cal.
LAr barrel
calorimeter LAr end-cap
calorimeter
Moderator shielding
Disk shielding
Toroid shielding
Forward shieldingCylindrical Octagonal
Nose shieldingMonobloc Washers
Calorimeter shielding
Figure 3.1: Schematic view of major ATLAS detector systems and of the main shielding compo-nents (see text).
doped with 5% boron in the form of B4C. Reactor tests have demonstrated that this choice for thedopant results in a plastic which is more radiation-hard than if other boron dopants had been used.This is important since the shielding in front of the forward calorimeters is exposed to a very largeionising dose over the lifetime of the ATLAS experiment.
There are three brass shielding elements inside each of the end-cap calorimeter cryostats,located directly behind the calorimeters (figure 3.2b). The largest one is attached to the rear end-plate of the cryostats and has a diameter of 387 cm. Closer to the beam-line are two other shieldingplugs. One of these is a cylindrically-shaped extension of the forward calorimeters. The main pur-pose of these shielding elements is to protect the end-cap inner muon stations from the backgroundradiation.
The next protection element is the shielding disk (figure 3.2c), which serves in fact a threefoldpurpose: it supports the muon chambers in the first end-cap muon station, it shields these chambersfrom background radiation emerging from the calorimeters, and it provides a well-defined path forthe magnetic field flux return from the solenoid magnet. The bulk of this shielding disk consists ofa vertical steel disk with a diameter of 872 cm. This disk supports end-cap muon trigger chambers(see section 6.8). At the centre of the disk and surrounding the beam-pipe is a stainless steeltube containing a set of cylindrical shielding pieces made of leaded red brass (85% Cu, 5% Pb,5% Sn, 5% Zn). This tube also supports Cathode Strip Chambers (CSC) and Monitored DriftTubes (MDT). Brass shielding has been added to the disk in order to protect the CSC chambers.There is a polyethylene layer on the outside of this brass shielding, which is doped with B2O3, tomoderate the neutrons, while photons created in the neutron absorption process are stopped in athird layer made of lead.
– 40 –
2008 JINST 3 S08003
Disk
Plug
Tube
Moderator shieldinga)
EMEC HEC 1 HEC 2
FCal 3 FCal 1 FCal 2
Moderator
Plug 2
Plug 3
LAr calorimeter shielding plugs
shielding
Plug 1
b)
Back wallPolyethylenedoped with lithium
Front wallPolyethylenedoped with boron
ModeratorPolyethylenedoped with boron
Plug Cast iron
Back ringPolyethylenedoped with boron
Front ringPolyethylenedoped with boron
Toroid inner bore tube Stainless steel
Toroid shieldingd)
Forward shielding
Cylindrical core sections
5 cm polyethylene
3 cm steel plates
Ductile cast iron
Support frameStainless steel
Cylindrical core sections
3 cm steel plates
Octagonal sections
8 cm polyethylene
Ductile cast iron
e)
Concrete
Washers
Monobloc
TAS cradle
TAS collimator
Support tube
Nose shieldingf)
Plug
Hub
cone Tube
disk
LeadPolyethylene
Disk shielding
Muon
detectors
c)
Figure 3.2: Details of the shielding components as described in the text: a) moderator, b) LArcalorimeter plugs, c) disk, d) toroid, e) forward, and f) nose shielding.
The next protection element is the end-cap toroid shielding (figure 3.2d), which consists oftwo parts, one located outside the toroid and enclosing the beam-pipe and one inside the cryostat:
• the first one is a cylindrical structure made of ductile cast iron, which surrounds the beam-pipe on the inside of the two end-cap toroid cryostats. The front piece has a large hole in thecentre, into which the stainless steel tube of the shielding disk fits. On the outside of the castiron is a polyethylene layer doped with B2O3 (5%). The photons created in the polyethylenelayer are stopped by the stainless-steel bore tube, which supports the shielding in the end-captoroid;
– 41 –
2008 JINST 3 S08003
• the second part of the toroid shielding consists of various polyethylene structures, whichare located in the vacuum of the end-cap toroid cryostats. The polyethylene is doped withB4C, which causes fewer out-gassing problems than other dopants. Photons created whenthe neutrons are absorbed by the boron are stopped by the aluminium of the cryostat itself.
The purpose of the two forward shielding assemblies (figure 3.2e) is to protect the middleand outer end-cap muon stations from background particles created in secondary interactions inthe beam-pipe, the calorimeters and the TAS collimators. These shielding elements, which areremovable and will be stored in the surface building during maintenance of ATLAS, consist oftwo parts: a cylindrical core and a set of octagonal pieces in the rear. All pieces are made of castductile iron, surrounded by a layer of polyethylene doped with boron in the form of H3BO3 andfollowed by a 3 cm thick steel layer. The core pieces are enclosed in a 5 cm thick polyethylenelayer, while an 8 cm thick layer surrounds the octagonal pieces. These polyethylene layers aremade of 10,000 bricks of three different shapes.
The final shielding element, or nose shielding as depicted in figure 3.2f, supports the TAScollimator and protects ATLAS from the radiation created in this collimator, which is designedto prevent the first LHC quadrupole from quenching due to the energy deposited by the particlesemerging from the interactions in ATLAS. The nose shielding is permanently installed in ATLASand, unlike the forward shielding assemblies, cannot be removed during shutdowns. The maincomponent of this shielding is the cylindrical 117 tonne heavy “monobloc”, which has an outerdiameter of 295 cm. It is made of cast iron and supported by a tube, which is anchored in a460 tonne concrete structure. The 200 tonne heavy “washers”, which are located around the supporttube, increase the radial thickness of the iron shielding by 112 cm in a region where the monoblocis thin.
3.3 Calculation of particle fluences and absorbed doses
A vast and systematic effort has been made in the design phase to optimise the shielding in ATLASby using different simulation programs [34] for simulating hundreds of different geometrical op-tions. These studies have required significant computing resources, since the secondary particlesin the hadronic showers had to be followed down to very low energies. Different event generatorsand transport codes have been used in an attempt to assess the systematic uncertainties in the cal-culations. When optimising the shielding configuration and materials in the limited space availablein ATLAS, it was very often necessary to make trade-offs between different background types,e.g. neutrons versus photons. It has therefore been quite important to also understand the detectorresponse to different types of background radiation, typically particles in the MeV range, in orderto converge to the optimal solution [35, 36].
The expected particle fluences (integrated over energy) agree to typically better than 20%, aswas shown by comparing two of the most commonly used minimum-bias event generators, PHO-JET1.12 [37–39] and PYTHIA6.2 [40]. Larger differences of up to 50% were observed for pions,kaons, and muons with energies above several GeV. However, these particles provide only a smallcontribution to the total fluence. The program most used for the shielding optimisation in ATLAShas been the GCALOR package [41], which contains the CALOR code [42] with an interface to
– 42 –
2008 JINST 3 S08003
GEANT3 [43]. FLUKA2001 [44] is another transport code, which is widely used for studies ofhadronic and electromagnetic cascades induced by high-energy particles, and which has been ex-tensively used in simulations of background radiation in ATLAS. In order to investigate transport-code differences, GCALOR was compared not only to FLUKA but also to MARS14(2002) [45].Comparisons for simplified geometries as well as for the most detailed descriptions of the detectorhave been carried out.
The results of these studies are extensively reported in [34]: the overall conclusion is that thepredictions of FLUKA, MARS and GCALOR are in good agreement for energy-integrated neutron,charged hadron, photon and e+e− fluences. For most regions in the inner detector, the differencebetween the FLUKA and GCALOR values is below 40%. In the pixel vertexing layer differencesas large as 80% are however observed for charged hadrons. An excellent agreement, typicallyto within 20%, between the respective photon and neutron fluences in the muon spectrometer isobserved when comparing the FLUKA and the GCALOR results. The charged hadron and leptonfluences in the muon spectrometer show much larger discrepancies, but the differences are alwayswithin a factor of 2.5. An overall safety factor of five has been used in the design of the ATLASmuon spectrometer.
The absorbed dose is the mean energy deposited per unit mass, taking into account all energy-loss mechanisms (but corrected for rest-mass effects). The dominant energy-loss mechanism isusually ionisation, but non-ionising energy loss is also important for understanding detector andelectronic damage effects. The ionising dose is defined in the following as the integrated dE/dxenergy loss in the detector material from charged particles, excluding ionisation energy loss fromnuclear recoils. It is given in units of Gy/y, where one year corresponds to 8× 10¹⁵ inelastic proton-proton collisions (assuming an inelastic cross-section of 80 mb, a luminosity of 1034 cm−2 s−1 anda data-taking period of 107 s). Comparisons of the calculated ionising dose in the inner detectorbetween FLUKA and GCALOR show differences of up to a factor of two.
3.3.1 The inner-detector and calorimeter regions
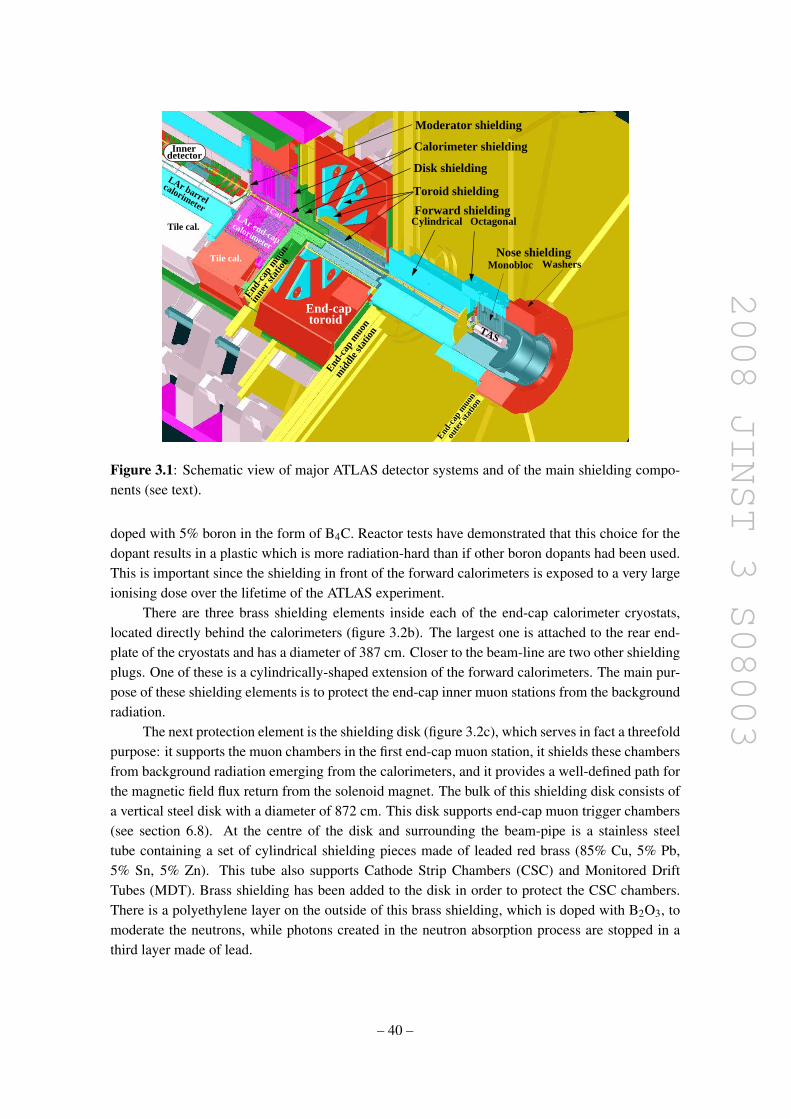
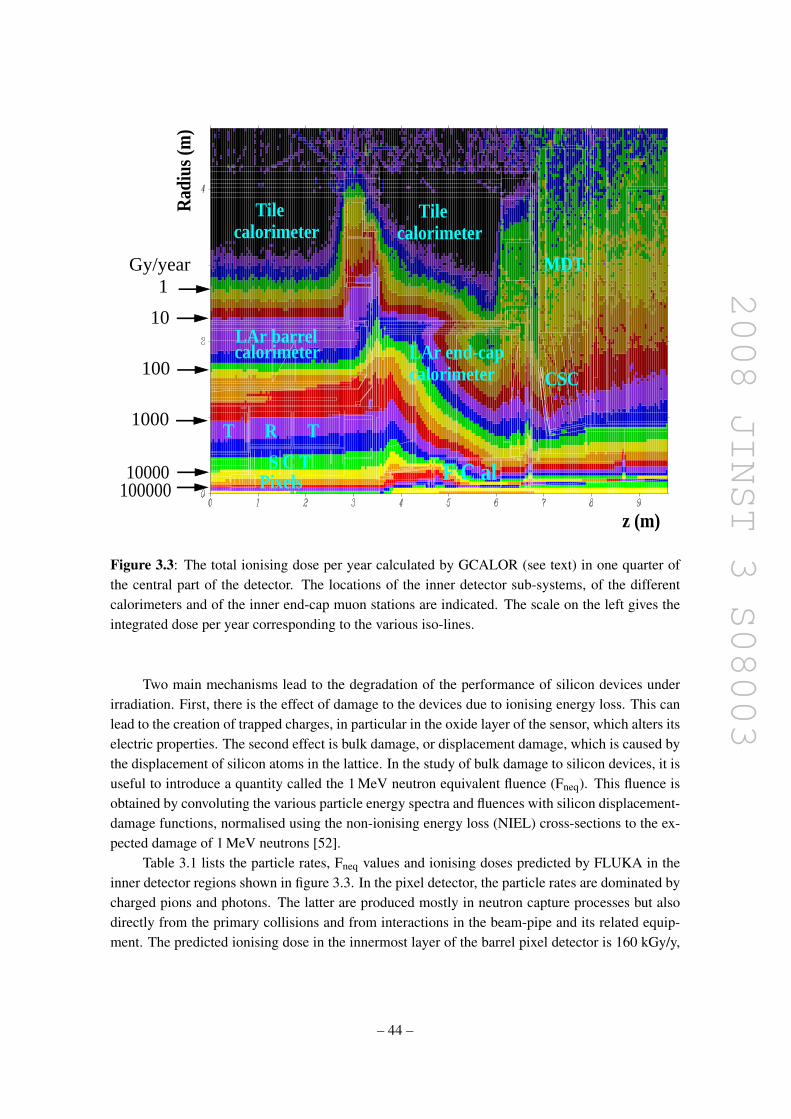
Figure 3.3 shows a GCALOR calculation of the ionising dose in the region closest to the interactionpoint. The forward calorimeters will be exposed to up to 160 kGy/y, whereas the correspondingnumber for the end-cap electromagnetic calorimeters is 30 kGy/y. This will lead to very largeintegrated doses over the full lifetime of the experiment and is one of the main reasons why only theLAr technology with its intrinsically high resistance to radiation is used in the end-cap and forwardregions. The main concern in the design phase has been for the electrode materials, primarilypolymers such as polyimide, which had to be chosen with care and thoroughly tested for radiationhardness [46, 47].
The tile calorimeter, with its scintillator samplings read out by wavelength-shifting fibres, isprotected by the LAr electromagnetic calorimeter and is exposed to less than 30 Gy/y, i.e. 5,000times less than the forward calorimeters. The scintillators and fibres were nevertheless also thor-oughly studied under irradiation [48–51] in order to determine their degradation during the lifetimeof ATLAS.
In the inner detector, a very large effort had to be devoted over many years to the understand-ing of the impact of irradiation on silicon sensors, on front-end electronics circuits and on ageingphenomena in the ionising gas used for the straw tubes.
– 43 –
2008 JINST 3 S08003
Gy/year
10
1
100
1000
10000 100000
Rad
ius (
m)
z (m)
T R T
S C T Pixels F C al
LAr barrelcalorimeter
Tilecalorimeter
Tilecalorimeter
LAr end-capcalorimeter CSC
MDT
Figure 3.3: The total ionising dose per year calculated by GCALOR (see text) in one quarter ofthe central part of the detector. The locations of the inner detector sub-systems, of the differentcalorimeters and of the inner end-cap muon stations are indicated. The scale on the left gives theintegrated dose per year corresponding to the various iso-lines.
Two main mechanisms lead to the degradation of the performance of silicon devices underirradiation. First, there is the effect of damage to the devices due to ionising energy loss. This canlead to the creation of trapped charges, in particular in the oxide layer of the sensor, which alters itselectric properties. The second effect is bulk damage, or displacement damage, which is caused bythe displacement of silicon atoms in the lattice. In the study of bulk damage to silicon devices, it isuseful to introduce a quantity called the 1 MeV neutron equivalent fluence (Fneq). This fluence isobtained by convoluting the various particle energy spectra and fluences with silicon displacement-damage functions, normalised using the non-ionising energy loss (NIEL) cross-sections to the ex-pected damage of 1 MeV neutrons [52].
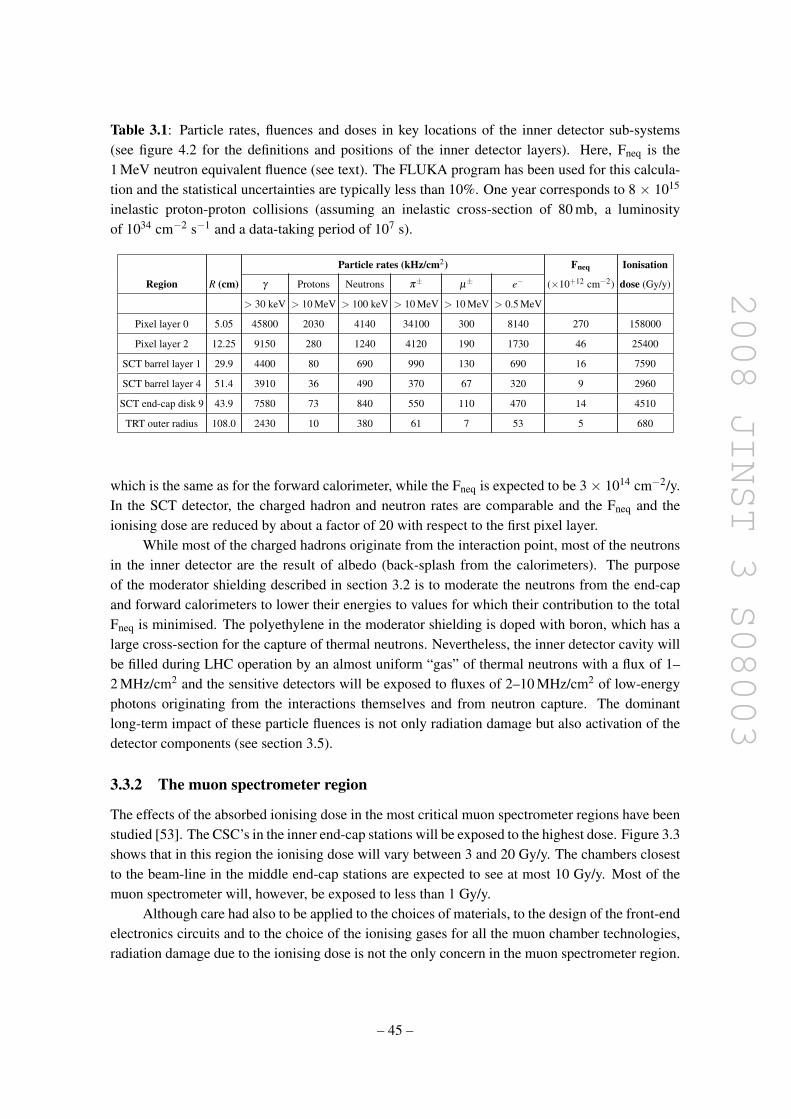
Table 3.1 lists the particle rates, Fneq values and ionising doses predicted by FLUKA in theinner detector regions shown in figure 3.3. In the pixel detector, the particle rates are dominated bycharged pions and photons. The latter are produced mostly in neutron capture processes but alsodirectly from the primary collisions and from interactions in the beam-pipe and its related equip-ment. The predicted ionising dose in the innermost layer of the barrel pixel detector is 160 kGy/y,
– 44 –
2008 JINST 3 S08003
Table 3.1: Particle rates, fluences and doses in key locations of the inner detector sub-systems(see figure 4.2 for the definitions and positions of the inner detector layers). Here, Fneq is the1 MeV neutron equivalent fluence (see text). The FLUKA program has been used for this calcula-tion and the statistical uncertainties are typically less than 10%. One year corresponds to 8 × 10¹⁵
inelastic proton-proton collisions (assuming an inelastic cross-section of 80 mb, a luminosityof 1034 cm−2 s−1 and a data-taking period of 107 s).
Particle rates (kHz/cm2) Fneq Ionisation
Region R (cm) γ Protons Neutrons π± µ± e− (×10+12 cm−2) dose (Gy/y)
> 30 keV > 10 MeV > 100 keV > 10 MeV > 10 MeV > 0.5 MeV
Pixel layer 0 5.05 45800 2030 4140 34100 300 8140 270 158000
Pixel layer 2 12.25 9150 280 1240 4120 190 1730 46 25400
SCT barrel layer 1 29.9 4400 80 690 990 130 690 16 7590
SCT barrel layer 4 51.4 3910 36 490 370 67 320 9 2960
SCT end-cap disk 9 43.9 7580 73 840 550 110 470 14 4510
TRT outer radius 108.0 2430 10 380 61 7 53 5 680
which is the same as for the forward calorimeter, while the Fneq is expected to be 3 × 1014 cm−2/y.In the SCT detector, the charged hadron and neutron rates are comparable and the Fneq and theionising dose are reduced by about a factor of 20 with respect to the first pixel layer.
While most of the charged hadrons originate from the interaction point, most of the neutronsin the inner detector are the result of albedo (back-splash from the calorimeters). The purposeof the moderator shielding described in section 3.2 is to moderate the neutrons from the end-capand forward calorimeters to lower their energies to values for which their contribution to the totalFneq is minimised. The polyethylene in the moderator shielding is doped with boron, which has alarge cross-section for the capture of thermal neutrons. Nevertheless, the inner detector cavity willbe filled during LHC operation by an almost uniform “gas” of thermal neutrons with a flux of 1–2 MHz/cm2 and the sensitive detectors will be exposed to fluxes of 2–10 MHz/cm2 of low-energyphotons originating from the interactions themselves and from neutron capture. The dominantlong-term impact of these particle fluences is not only radiation damage but also activation of thedetector components (see section 3.5).
3.3.2 The muon spectrometer region
The effects of the absorbed ionising dose in the most critical muon spectrometer regions have beenstudied [53]. The CSC’s in the inner end-cap stations will be exposed to the highest dose. Figure 3.3shows that in this region the ionising dose will vary between 3 and 20 Gy/y. The chambers closestto the beam-line in the middle end-cap stations are expected to see at most 10 Gy/y. Most of themuon spectrometer will, however, be exposed to less than 1 Gy/y.
Although care had also to be applied to the choices of materials, to the design of the front-endelectronics circuits and to the choice of the ionising gases for all the muon chamber technologies,radiation damage due to the ionising dose is not the only concern in the muon spectrometer region.
– 45 –
2008 JINST 3 S08003
QUADTASFCal
Inner det.
}}}
}}}
Barrel middlemuons
Barrel outermuons
Barrel innermuons
End-cap middle
End-cap outer
muons muons
End-cap inner muons
End-cap toroid
Disk Toroid shield.
Forwardshielding
Noseshield.
n: 2.7J: 1.0P: 1.5p: 1.1
n: 3.1J: 1.1P: 2.4p: 2.3
n: 3.5J: 1.2P: 4.5p: 2.2
n: 2.6J: 1.0P: 0.4p: 0.9
n: 2.8J: 1.1P: 0.5p: 1.6
n: 3.8J: 1.4P: 0.8p: 3.2
n: 2.7J: 1.1P: 0.3p: 0.4
n: 3.4J: 1.3P: 0.4p: 1.0
n: 4.0J: 1.5P: 0.4p: 1.6
n: 79J: 25
P: 21p: 64
n: 34J: 11
P: 20p: 23
n: 17J: 5.4
P: 6.7p: 12
n: 7.7J: 2.4
P: 3.4p: 8.3
n: 3.1��J: 11
�P: 8.7 p: 11
n: 3.4J: 1.7P: 0.9p: 4.9
n: 4.0J: 4.4P: 3.0p: 10
n: 1.7J: 0.8P: 0.5p: 0.9
n: 2.0J: 1.2P: 1.2p: 1.4
n: 2.7J: 1.5P: 3.0p: 0.9
{
{
{
{{
{{
{
{
{
LAr cal.LAr cal.
Tile cal. Tile cal.
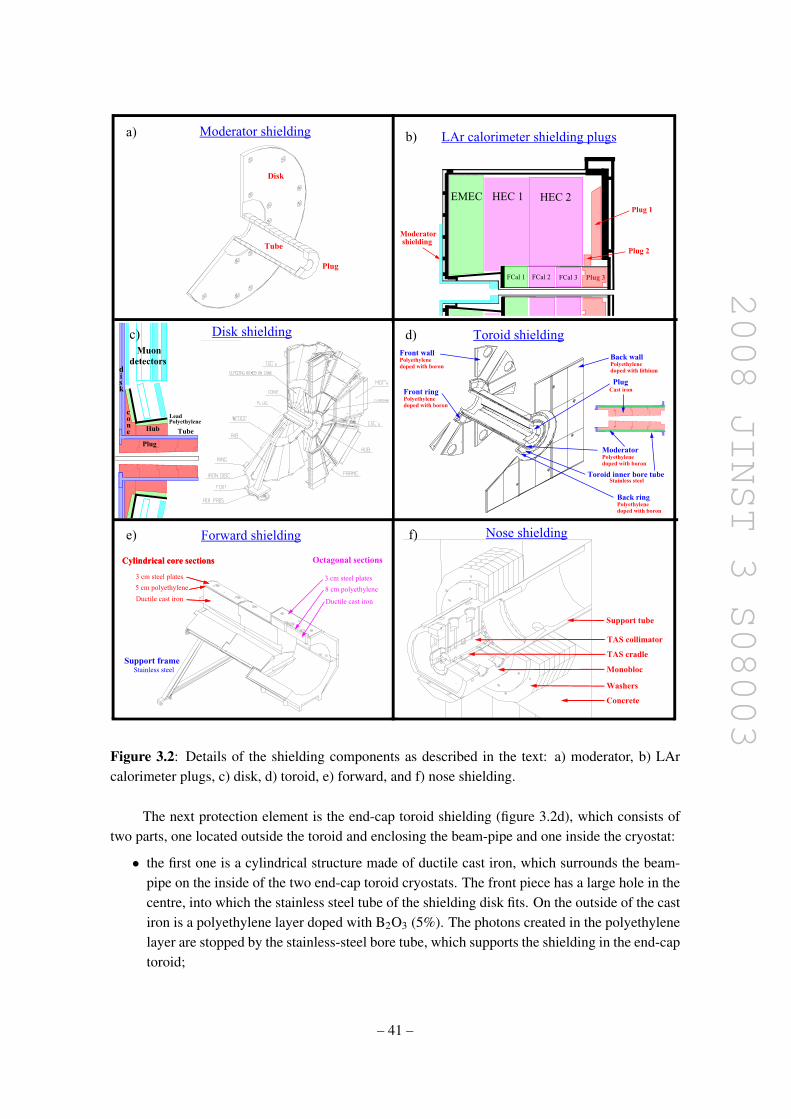
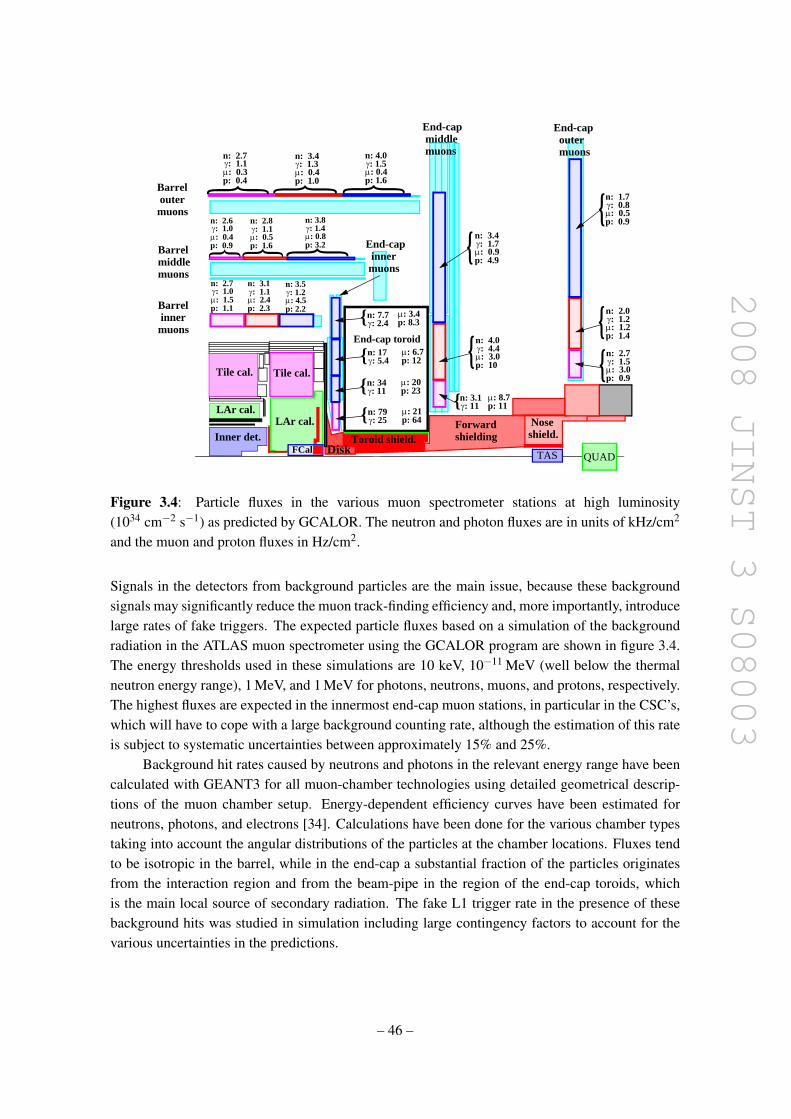
Figure 3.4: Particle fluxes in the various muon spectrometer stations at high luminosity(1034 cm−2 s−1) as predicted by GCALOR. The neutron and photon fluxes are in units of kHz/cm2
and the muon and proton fluxes in Hz/cm2.
Signals in the detectors from background particles are the main issue, because these backgroundsignals may significantly reduce the muon track-finding efficiency and, more importantly, introducelarge rates of fake triggers. The expected particle fluxes based on a simulation of the backgroundradiation in the ATLAS muon spectrometer using the GCALOR program are shown in figure 3.4.The energy thresholds used in these simulations are 10 keV, 10−11 MeV (well below the thermalneutron energy range), 1 MeV, and 1 MeV for photons, neutrons, muons, and protons, respectively.The highest fluxes are expected in the innermost end-cap muon stations, in particular in the CSC’s,which will have to cope with a large background counting rate, although the estimation of this rateis subject to systematic uncertainties between approximately 15% and 25%.
Background hit rates caused by neutrons and photons in the relevant energy range have beencalculated with GEANT3 for all muon-chamber technologies using detailed geometrical descrip-tions of the muon chamber setup. Energy-dependent efficiency curves have been estimated forneutrons, photons, and electrons [34]. Calculations have been done for the various chamber typestaking into account the angular distributions of the particles at the chamber locations. Fluxes tendto be isotropic in the barrel, while in the end-cap a substantial fraction of the particles originatesfrom the interaction region and from the beam-pipe in the region of the end-cap toroids, whichis the main local source of secondary radiation. The fake L1 trigger rate in the presence of thesebackground hits was studied in simulation including large contingency factors to account for thevarious uncertainties in the predictions.
– 46 –
2008 JINST 3 S08003
8 9 13
8 10 12
MDT: 6
MDT: 9
MDT: 12
MDT: 13TGC: 17
MDT: 68TGC: 66
MDT: 32TGC: 32
MDT: 23
MDT: 40
CSC: 347
TASFCal Disk
MDT: 103TGC: 100
End-cap middle
End-cap outer
Noseshield.
Forwardshielding
muons muons
Barrel middlemuons
Barrel outermuons
Barrel innermuons
RPC:
RPC:
Toroid shield.QUAD
End-cap toroid
7 9 10MDT:
6 8 11MDT:
8 10 11MDT:
End-cap inner muons
{
{
{Tile cal. Tile cal.
LAr cal.LAr cal.
Inner det.
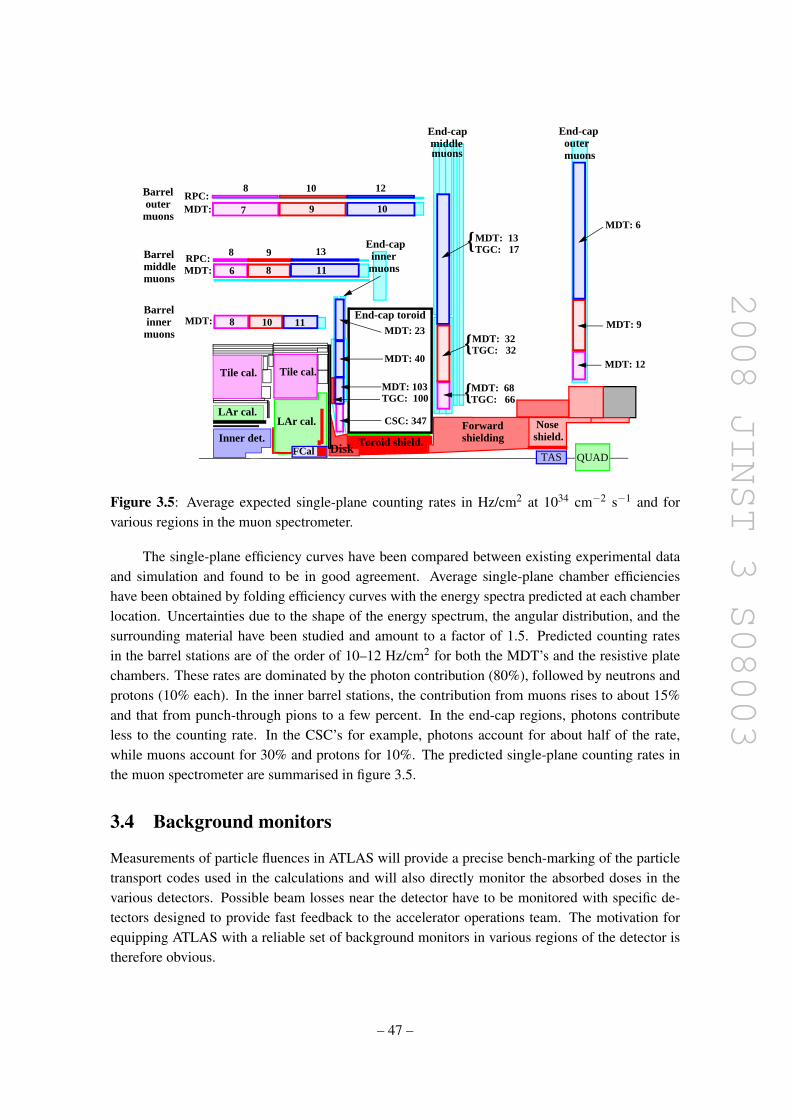
Figure 3.5: Average expected single-plane counting rates in Hz/cm2 at 1034 cm−2 s−1 and forvarious regions in the muon spectrometer.
The single-plane efficiency curves have been compared between existing experimental dataand simulation and found to be in good agreement. Average single-plane chamber efficiencieshave been obtained by folding efficiency curves with the energy spectra predicted at each chamberlocation. Uncertainties due to the shape of the energy spectrum, the angular distribution, and thesurrounding material have been studied and amount to a factor of 1.5. Predicted counting ratesin the barrel stations are of the order of 10–12 Hz/cm2 for both the MDT’s and the resistive platechambers. These rates are dominated by the photon contribution (80%), followed by neutrons andprotons (10% each). In the inner barrel stations, the contribution from muons rises to about 15%and that from punch-through pions to a few percent. In the end-cap regions, photons contributeless to the counting rate. In the CSC’s for example, photons account for about half of the rate,while muons account for 30% and protons for 10%. The predicted single-plane counting rates inthe muon spectrometer are summarised in figure 3.5.
3.4 Background monitors
Measurements of particle fluences in ATLAS will provide a precise bench-marking of the particletransport codes used in the calculations and will also directly monitor the absorbed doses in thevarious detectors. Possible beam losses near the detector have to be monitored with specific de-tectors designed to provide fast feedback to the accelerator operations team. The motivation forequipping ATLAS with a reliable set of background monitors in various regions of the detector istherefore obvious.
– 47 –
2008 JINST 3 S08003
3.4.1 Monitors in the inner detector
The inner detector region of ATLAS contains a set of small detectors, which are sensitive to dose,to the 1 MeV neutron equivalent fluence (Fneq) and to thermal neutrons. These detectors consist of:
1. Field-effect transistors (RADFET’s), which measure the total ionising dose;
2. PIN-diodes, which measure Fneq;
3. Radiation-hardened transistors, which measure thermal neutron fluences.
These detectors will measure the integrated doses and fluences in the inner detector and will alsoto some extent provide bench-marking estimates of the different contributions (charged particles,neutrons and photons).
One of the worst-case scenarios during LHC operation arises if several proton bunches hitthe collimators in front of the detectors. While the accumulated radiation dose from such unlikelyaccidents corresponds to that acquired during a few days of normal operation, and as such providesno major contribution to the integrated dose, the enormous instantaneous rate might cause detectordamage. The ATLAS Beam Conditions Monitor (BCM) [54] system consists of a set of detectorsdesigned to detect such incidents and trigger an abort in time to prevent serious damage to thedetector (see also section 9.10). These incidents need to be distinguished from the stray protonsand beam-gas backgrounds which frequently initiate charged particle showers, which originate wellupstream (or downstream) from the ATLAS interaction point. Due to their very fast response timeand intrinsically very high resistance to radiation, the BCM detectors will be used throughout thelifetime of the experiment to distinguish these stray beam particles from those originating fromproton-proton interactions.
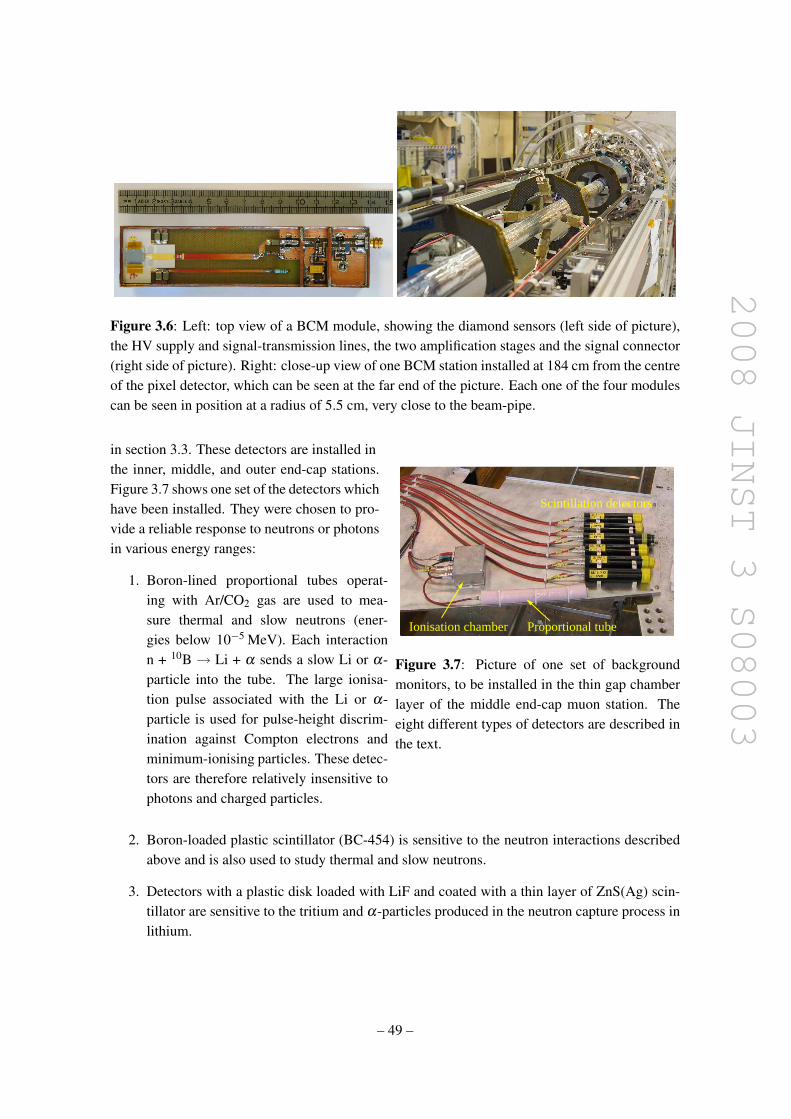
The BCM system, designed to tolerate doses of up to 500 kGy and in excess of 1015 chargedparticles per cm2 over the lifetime of the experiment, consists of two stations, each with fourmodules. Each module, as depicted in figure 3.6 (left), includes two radiation-hard diamond sen-sors [55, 56] read out in parallel by radiation-tolerant electronics with a 1 ns rise-time [57]. Fig-ure 3.6 (right) shows a close-up view of one station installed around the beryllium beam-pipe. Thestations are located symmetrically around the interaction point at z = ±184 cm and R = 5.5 cm,which corresponds to a |η | = 4.2. The difference in time-of-flight between the two stations, ∆t,distinguishes particles from normal collisions (∆ t = 0, 25, 50 ns, etc.) from those arising fromstray protons (∆ t = 12.5, 37.5 ns, etc.). The in-time and out-of-time multi-module coincidencesare determined by an FPGA-based back-end, which digitises the signals, monitors the detector per-formance and generates beam-abort signals if warranted. Preliminary analysis of data on one of themodules in a high-energy pion test-beam shows a signal-to-noise ratio of 11 ± 2 in an operationalgeometry, where minimum ionising particles are incident on the BCM sensors at a 45◦ angle. Afull description of the design, construction and test-beam characterisation of the BCM system canbe found in [54].
3.4.2 Monitors in the muon spectrometer
Several sets of detectors have been installed in the end-cap muon stations to monitor the backgroundfluences and thus to constrain further the particle transport codes used in the calculations described
– 48 –
2008 JINST 3 S08003
Figure 3.6: Left: top view of a BCM module, showing the diamond sensors (left side of picture),the HV supply and signal-transmission lines, the two amplification stages and the signal connector(right side of picture). Right: close-up view of one BCM station installed at 184 cm from the centreof the pixel detector, which can be seen at the far end of the picture. Each one of the four modulescan be seen in position at a radius of 5.5 cm, very close to the beam-pipe.
in section 3.3. These detectors are installed inthe inner, middle, and outer end-cap stations.
Scintillation detectors
Ionisation chamber Proportional tube
Figure 3.7: Picture of one set of backgroundmonitors, to be installed in the thin gap chamberlayer of the middle end-cap muon station. Theeight different types of detectors are described inthe text.
Figure 3.7 shows one set of the detectors whichhave been installed. They were chosen to pro-vide a reliable response to neutrons or photonsin various energy ranges:
1. Boron-lined proportional tubes operat-ing with Ar/CO2 gas are used to mea-sure thermal and slow neutrons (ener-gies below 10−5 MeV). Each interactionn + 10B → Li + α sends a slow Li or α-particle into the tube. The large ionisa-tion pulse associated with the Li or α-particle is used for pulse-height discrim-ination against Compton electrons andminimum-ionising particles. These detec-tors are therefore relatively insensitive tophotons and charged particles.
2. Boron-loaded plastic scintillator (BC-454) is sensitive to the neutron interactions describedabove and is also used to study thermal and slow neutrons.
3. Detectors with a plastic disk loaded with LiF and coated with a thin layer of ZnS(Ag) scin-tillator are sensitive to the tritium and α-particles produced in the neutron capture process inlithium.
– 49 –
2008 JINST 3 S08003
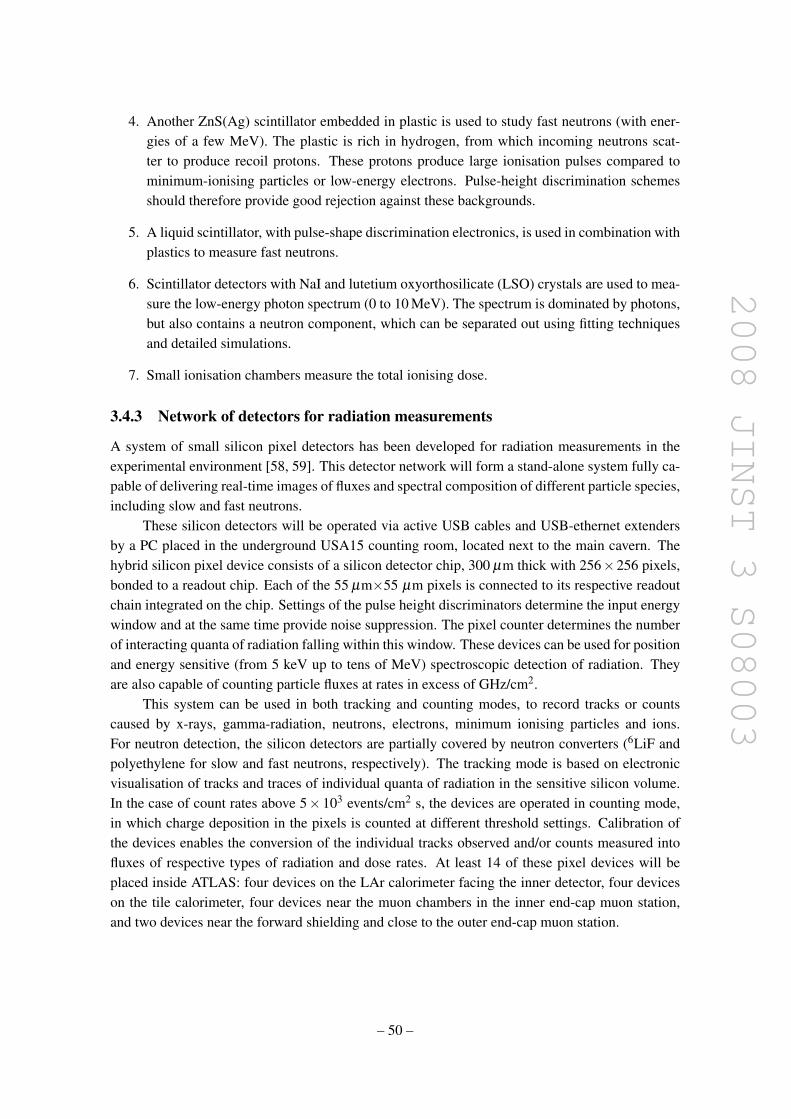
4. Another ZnS(Ag) scintillator embedded in plastic is used to study fast neutrons (with ener-gies of a few MeV). The plastic is rich in hydrogen, from which incoming neutrons scat-ter to produce recoil protons. These protons produce large ionisation pulses compared tominimum-ionising particles or low-energy electrons. Pulse-height discrimination schemesshould therefore provide good rejection against these backgrounds.
5. A liquid scintillator, with pulse-shape discrimination electronics, is used in combination withplastics to measure fast neutrons.
6. Scintillator detectors with NaI and lutetium oxyorthosilicate (LSO) crystals are used to mea-sure the low-energy photon spectrum (0 to 10 MeV). The spectrum is dominated by photons,but also contains a neutron component, which can be separated out using fitting techniquesand detailed simulations.
7. Small ionisation chambers measure the total ionising dose.
3.4.3 Network of detectors for radiation measurements
A system of small silicon pixel detectors has been developed for radiation measurements in theexperimental environment [58, 59]. This detector network will form a stand-alone system fully ca-pable of delivering real-time images of fluxes and spectral composition of different particle species,including slow and fast neutrons.
These silicon detectors will be operated via active USB cables and USB-ethernet extendersby a PC placed in the underground USA15 counting room, located next to the main cavern. Thehybrid silicon pixel device consists of a silicon detector chip, 300 µm thick with 256×256 pixels,bonded to a readout chip. Each of the 55 µm×55 µm pixels is connected to its respective readoutchain integrated on the chip. Settings of the pulse height discriminators determine the input energywindow and at the same time provide noise suppression. The pixel counter determines the numberof interacting quanta of radiation falling within this window. These devices can be used for positionand energy sensitive (from 5 keV up to tens of MeV) spectroscopic detection of radiation. Theyare also capable of counting particle fluxes at rates in excess of GHz/cm2.
This system can be used in both tracking and counting modes, to record tracks or countscaused by x-rays, gamma-radiation, neutrons, electrons, minimum ionising particles and ions.For neutron detection, the silicon detectors are partially covered by neutron converters (6LiF andpolyethylene for slow and fast neutrons, respectively). The tracking mode is based on electronicvisualisation of tracks and traces of individual quanta of radiation in the sensitive silicon volume.In the case of count rates above 5× 10³ events/cm2 s, the devices are operated in counting mode,in which charge deposition in the pixels is counted at different threshold settings. Calibration ofthe devices enables the conversion of the individual tracks observed and/or counts measured intofluxes of respective types of radiation and dose rates. At least 14 of these pixel devices will beplaced inside ATLAS: four devices on the LAr calorimeter facing the inner detector, four deviceson the tile calorimeter, four devices near the muon chambers in the inner end-cap muon station,and two devices near the forward shielding and close to the outer end-cap muon station.
– 50 –
2008 JINST 3 S08003
3.5 Activation
Induced radioactivity will be a major problem at the LHC, and ATLAS is the experiment with thehighest levels of induced radiation. This is due to the small radius of the ATLAS beam-pipe, thesmall bore of the forward calorimeters, and to the shielding elements close to the beam-pipe. Acomprehensive study has been made of the expected activation in different regions and for differentdata-taking and cooling-off scenarios. The methods and assumptions used in the calculation of theinduced activity are given in [34]. The main conclusion of these studies is that the beam-pipe willbe the major source of induced radioactivity in ATLAS.
Three different access scenarios are foreseen for ATLAS during shutdowns, as described inmore detail in section 9.7. They are described below and two of the scenarios are depicted infigures 3.8 and 3.9.
(a) In the very short access scenario, all detector components remain in place and the magneticfields remain on. These accesses are typically on the order of a few hours long.
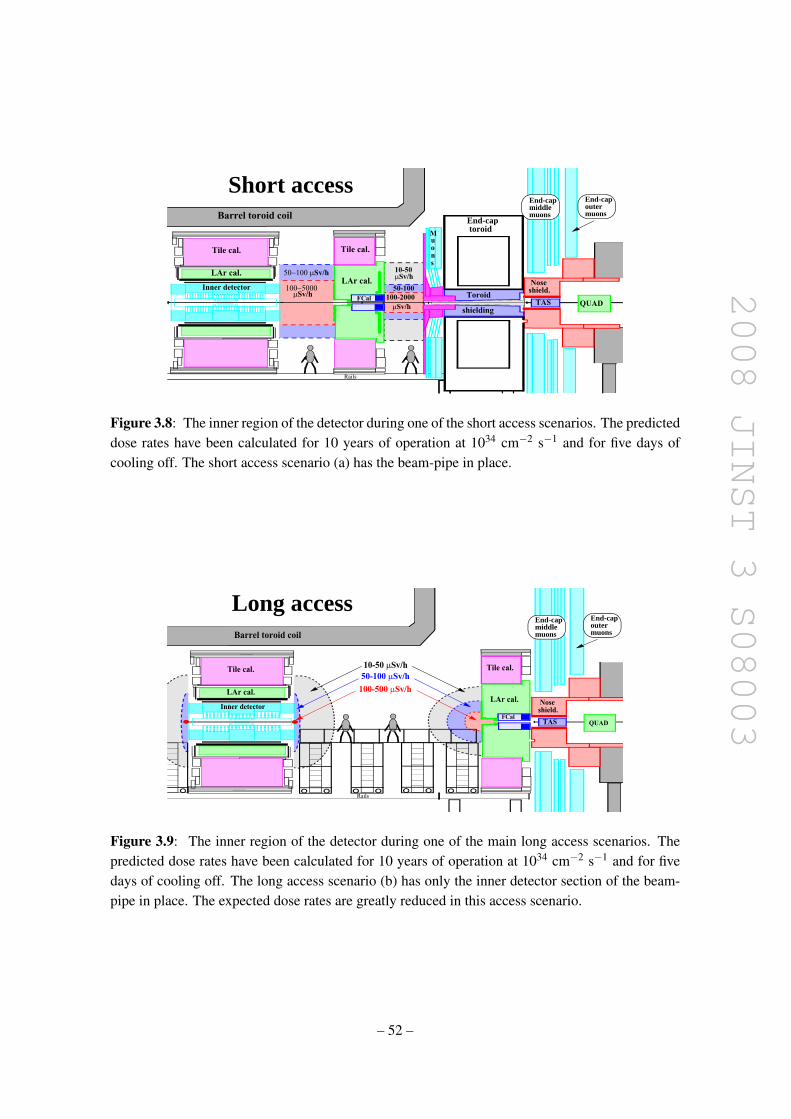
(b) In the short access scenario, the beam-pipe remains in place, but then acts as a linear sourceof photon radiation as can be seen in figure 3.8. Because of the high level of radiation, thearea around the beam-pipe, out to a radius of about 1 m, has to be fenced off after high-luminosity running. This will ensure that people working in ATLAS during short accesswill not be exposed to dose rates larger than 0.1 mSv/h (maintenance work in ATLAS will bedesigned to limit the yearly dose to 6 mSv per person). The only detector which is truly insidethe barrier is the inner detector. During a short access, maintenance of the inner detector willtherefore be severely limited.
(c) In the long access scenario, all the beam-pipe sections except the one inside the inner detectorvolume are removed as well as the small muon wheel (or inner end-cap muon stations)and the end-cap toroids. Two hot spots can clearly be seen in the final configuration, asshown in figure 3.9. One is the end-piece of the inner detector beam-pipe, which is madeof aluminium, whereas the rest of the inner detector beam-pipe is made of beryllium. Theexpected dose rate can reach 0.2 mSv/h at this location. The other hot spot is in front ofthe forward calorimeters, where the dose rate is predicted to reach very high values of upto 0.5 mSv/h. These relatively small-size regions will therefore be temporarily shielded withlead blocks during maintenance of the inner detector.
While the beam-pipe section inside the inner detector is mostly made of beryllium, the restof the beam-pipe is made of stainless steel and has to be removed in the case of the long accessscenario, since it will become very radioactive with a contact dose rate of 3–5 mSv/h. This could incertain cases inflict several mSv of integrated dose to personnel performing the intervention. Oneway of reducing the dose to personnel would be to make the beam-pipe out of aluminium instead ofstainless steel. This is expected to give a factor 10–50 reduction of the dose levels. If the beam-pipematerial were instead to be changed to beryllium over the whole length of the detector, the doserate would decrease by a factor of 100–1000 and would no longer be a problem. This is, however,very costly and will only be discussed further in the context of the LHC upgrade programme.
– 51 –
2008 JINST 3 S08003
QUADTAS
ToroidMuons
100-2000
50-100
10-50PSv/h
Rails
PSv/h
���������PSv/hxxxxxxxxxxxxxxxxxxxxxxxxxxxxxxxxxxxxxxxxxxxxxxxx
xxxxxxxxxxxxxxxxxxxxxxxxxxxxxxxxxxxxxxxxxxxxxxxxxxxxxxxxxxxxxxxxxxxxxxxxxxxxxxxxxxxxxxxxxxxxxxxxxxxxxxxxxxxxxxxxxxxxxxxxxxxxxxxxxxxxxxxxxxxxxxxxxxxxxxxxxxxxxxxxxxxxxxxxxxxxxxxxxxxxxxxxxxxxxxxxxxxxxxxxxxxxxxxxxxxxxxxxxxxxxxxxxxxxxxxxxxxxxxxxxxxxxxxxxxxxxxxxxxxxxxxxxxxxxxxxxxxxxxxxxxxxxxxxxxxxxxxxxxxxxxxxxxxxxxxxxxxxxxxxxxxxxxxxxxxxxxxxxxxxxxxxxxxxxxxxxxxxxxxxxxxxxxxxxxxxxxxxxxxxxxxxxxxxxxxxxxxxxxxxxxxxxxxxxxxxxxxxxxxxxxxxxxxxxxxxxxxxxxxxxxxxxxxxxxxxxxxxxxxxxxxxxxxxxxxxxxxxxxxx
xxxxxxxxxxxxxxxxxxxxxxxxxxxxxxxxxxxxxxxxxxxxxxxxxxxxxxxxxxxxxxxxxxxxxxxxxxxxxxxxxxxxxxxxxxxxxxxxxxxxxxxxxxxxxxxxxxxxxxxxxxxxxxxxxxxxxxxxxxxxxxxxxxxxxxxxxxxxxxxxxxxxxxxxxxxxxxxxxxxxxxxxxxxxxxxxxxxxxxxxxxxxxxxxxxxxxxxxxxxxxxxxxxxxxxxxxxxxxxxxxxxxxxxxxxxxxxxxxxxxxxxxxxxxxxxxxxxxxxxxxxxxxxxxxxxxxxxxxxxxxxxxxxxxxxxxxxxxxxxxxxxxxxxxxxxxxxxxxxxxxxxxxxxxxxxxxxxxxxxxxxxxxxxxxxxxxxxxxxxxxxxxxxxxxxxxxxxxxxxxxxxxxxxxxxxxxxxxxxxxxxxxxxxxxxxxxxxxxxxxxxxxxxxxxxxxxxxxxxxxxxxxxxxxxxxxxxxxxxxxxxxxxxxxxxxxxxxxxxxxxxxxxxxxxxxxxxxxxxxxxxxxxxxxxxxxxxxxxxxxxxxxxxxxxxxxxxxxxxxxxxxxxxxxxxxxxxxxxxxxxxxxxxxxxxxxxxxxxxxxxxxxxxxxxxxxxxxxxxxxxxxxxxxxxxxxxxxxxxxxxxxxxxxxxxxxxxxxxxxxxxxxxxxxxxxxxxxxxxxxxxxxxxxxxxxxxxxxxxxxxxxxxxxxxxxxxxxxxxxxxxxxxxxxxxxxxxxxxxxxxxxxxxxxxxxxxxxxxxxxxxxxxxxxxxxxxxxxxxxxxxxxxxxxxxxxxxxxxxxxxxxxxxxxxxxxxxxxxxxxxxxxxxxxxxxxxxxxxxxxxxxxxxxxxxxxxxxxxxxxxxxxxxxxxxxxxxxxxxxxxx
xxxxxxxxxxxxxxxxxxxxxxxxxxxxxxxxxxxxxxxxxxxxxxxxxxxxxxxxxxxxxxxxxxxxxxxxxxxxxxxxxxxxxxxxxxxxxxxxxxxxxxxxxxxxxxxxxxxxxxxxxxxxxxxxxxxxxxxxxxxxxxxxxxxxxxxxxxxxxxxxxxxxxxxxxxxxxxxxxxxxxxxxxxxxxxxxxxxxxxxxxxxxxxxxxxxxxxxxxxxxxxxxxxxxxxxxxxxxxxxxxxxxxxxxxxxxxxxxxxxxxxxxxxxxxxxxxxxxxxxxxxxxxxxxxxxxxxxxxxxxxxxxxxxxxxxxxxxxxxxxxxxxxxxxxxxxxxxxxxxxxxxxxxxxxxxxxxxxxxxxxxxxxxxxxxxxxxxxxxxxxxxxxxxxxxxxxxxxxxxxxxxxxxxxxxxxxxxxxxxxxxxxxxxxxxxxxxxxxxxxxxxxxxxxxxxxxxxxxxxxxxxxxxxxxxxxxxxxxxxxxxxxxxxxxxxxxxxxxxxxxxxxxxxxxxxxxxxxxxxxxxxxxxxxxxxxxxxxxxxxxxxxxxxxxxxxxxxxxxxxxxxxxxxxxxxxxxxxxxxxxxxxxxxxxxxxxxxxxxxxxxxxxxxxxxxxxxxxxxxxxxxxxxxxxxxxxxxxxxxxxxxxxxxxxxxxxxxxxxxxxxxxxxxxxxxxxxxxxxxxxxxxxxxxxxxxxxxxxxxxxxxxxxxxxxxxxxxxxxxxxxxxxxxxxxxxxxxxxxxxxxxxxxxxxxxxxxxxxxxxxxxxxxxxxxxxxxxxxxxxxxxxxxxxxxxxxxxxxxxxxxxxxxxxxxxxxxxxxxxxxxxxxxxxxxxxx
xxxxxxxxxxxxxxxxxxxxxxxxxxxxxxxxxxxxxxxxxxxxxxxxxxxxxxxxxxxxxxxxxxxxxxxxxxxxxxxxxxxxxxxxxxxxxxxxxxxxxxxxxxxxxxxxxxxxxxxxxxxxxxxxxxxxxxxxxxxxxxxxxxxxxxxxxxxxxxxxxxxxxxxxxxxxxxxxxxxxxxxxxxxxxxxxxxxxxxxxxxxxxxxxxxxxxxxxxxxxxxxxxxxxxxxxxxxxxxxxxxxxxxxxxxxxxxxxxxxxxxxxxxxxxxxxxxxxxxxxxxxxxxxxxxxxxxxxxxxxxxxxxxxxxxxxxxxxxxxxxxxxxxxxxxxxxxxxxxxxxxxxxxxxxxxxxxxxxxxxxxxxxxxxxxxxxxxxxxxxxxxxxxxxxxxxxxxxxxxxxxxxxxxxxxxxxxxxxxxxxxxxxxxxxxxxxxxxxxxxxxxxxxxxxxxxxxxxxxxxxxxxxxxxxxxxxxxxxxxxxxxxxxxxxxxxxxxxxxxxxxxxxxxxxxxxxxxxxxxxxxxxxxxxxxxxxxxxxxxxxxxxxxxxxxxxxxxxxxxxxxxx
xxxxxxxxxxxxxxxxxxxxxxxxxxxxxxxxxxxxxxxxxxxxxxxxxxxxxxxxxxxxxxxxxxxxxxxxxxxxxxxxxxxxxxxxxxxxxxxxxxxxxxxxxxxxxxxxxxxxxxxxxxxxxxxxxxxxxxxxxxxxxxxxxxxxxxxxxxxxxxxxxxxxxxxxxxxxxxxxxxxxxxxxxxxxxxxxxxxxxxxxxxxxxxxxxxxxxxxxxxxxxxxxxxxxxxxxxxxxxxxxxxxxxxxxxxxxxxxxxxxxxxxxxxxxxxxxxxxxxxxxxxxxxxxxxxxxxxxxxxxxxxxxxxxxxxxxxxxxxxxxxxxxxxxxxxxxxxxxxxxxxxxxxxxxxxxxxxxxxxxxxxxxxxxxxxxxxxxxxxxxxxxxxxxxxxxxxxxxxxxxxxxxxxxxxxxxxxxxxxxxxxxxxxxxxxxxxxxxxxxxxxxxxxxxxxxxxxxxxxxxxxxxxxxxxxxxxxxxxxxxxxxxxxxxxxxxxxxxxxxxxxxxxxxxxxxxxxxxxxxxxxxxxxxxxxxxxxxxxxxxxxxxxxxxxxxxxxxxxxxxxxxxxxxxxxxxxxxxxxxxxxxxxxxxxxxxxxxxxxxxxxxxxxxxxxxxxxxxxxxxxxxxxxxxxxxxxxxxxxxxxxxxxxxxxxxxxxxxxxxxxxxxxxxxxxxxxxxxxxxxxxxxxxxxxxxxxxxxxxxxxxxxxxxxxxxxxxxxxxxxxxxxxxxxxxxxxxxxxxxxxxxxxxxxxxxxxxxxxxxxxxxxxxxxxxxxxxxxxxxxxxxxxxxxxxxxxxxxxxxxxxxxxxxxxxxxxxxxxxxxxxxxxxxxxxxxx
xxxxxxxxxxxxxxxxxxxxxxxxxxxxxxxxxxxxxxxxxxxxxxxxxxxxxxxxxxxxxxxxxxxxxxxxxxxxxxxxxxxxxxxxxxxxxxxxxxxxxxxxxxxxxxxxxxxxxxxxxxxxxxxxxxxxxxxxxxxxxxxxxxxxxxxxxxxxxxxxxxxxxxxxxxxxxxxxxxxxxxxxxxxxxxxxxxxxxxxxxxxxxxxxxxxxxxxxxxxxxxxxxxxxxxxxxxxxxxxxxxxxxxxxxxxxxxxxxxxxxxxxxxxxxxxxxxxxxxxxxxxxxxxxxxxxxxxxxxxxxxxxxxxxxxxxxxxxxxxxxxxxxxxxxxxxxxxxxxxxxxxxxxxxxxxxxxxxxxxxxxxxxxxxxxxxxxxxxxxxxxxxxxxxxxxxxxxxxxxxxxxxxxxxxxxxxxxxxxxxxxxxxxxxxxxxxxxxxxxxxxxxxxxxxxxxxxxxxxxxxxxxxxxxxxxxxxxxxxxxxxxxxxxxxxxxxxxxxxxxxxxxxxxxxxxxxxxxxxxxxxxxxxxxxxxxxxxxxxxxxxxxxxxxxxxxxxxxxxxxxxxxxxxxxxxxxxxxxxxxxxxxxxxxxxxxxxxxxxxxxxxxxxxxxxxxxxxxxxxxxxxxxxxxxxxxxxxxxxxxxxxxxxxxxxxxxxxxxxxxxxxxxxxxxxxxxxxxxxxxxxxxxxxxxxxxxxxxxxxxxxxxxxxxxxxxxxxxxxxxxxxxxxxxxxxxxxxxxxxxxxxxxxxxxxxxxxxxxxxxxxxxxxxxxxxxxxxxxxxxxxxxxxxxxxxxxxxxxxxxxxxxxxxxxxxxxxxxxxxxxxxxxxxxxxxxxxxxxxxxxxxxxxxxxxxxxxxxxxxxxxxxxxxxxxxxxxxxxxxxxxxxxxxxxxxxxxxxxxxx
Inner detector
shielding
Noseshield.
OuterMuons
MiddleMuons
Standard access
Barrel toroid coil
Tile cal. Tile cal.
LAr cal.LAr cal.
End-cap
End-cap End-cap
�������PSv/h
ToroidFCal
Short accessmiddlemuons
End-capoutermuons
End-cap
End-cap toroid
Figure 3.8: The inner region of the detector during one of the short access scenarios. The predicteddose rates have been calculated for 10 years of operation at 1034 cm−2 s−1 and for five days ofcooling off. The short access scenario (a) has the beam-pipe in place.
FCalQUADTAS
Outer
Rails
xxxxxxxxxxxxxxxxxxxxxxxxxxxxxxxxxxxxxxxxxxxxxxxxxxxxxxxxxxxxxxxxxxxxxxxxxxxxxxxxxxxxxxxxxxxxxxxxxxxxxxxxxxxxxxxxxxxxxxxxxxxxxxxxxxxxxxxxxxxxxxxxxxxxxxxxxxxxxxxxxxxxxxxxxxxxxxxxxxxxxxxxxxxxxxxxxxxxxxxxxxxxxxxxxxxxxxxxxxxxxxxxxxxxxxxxxxxxxxxxxxxxxxxxxxxxxxxxxxxxxxxxxxxxxxxxxxxxxxxxxxxxxxxxxxxxxxxxxxxxxxxxxxxxxxxxxxxxxxxxxxxxxxxxxxxxxxxxxxxxxxxxxxxxxxxxxxxxxxxxxxxxxxxxxxxxxxxxxxxxxxxxxxxxxxxxxxxxxxxxxxxxxxxxxxxxxxxxxxxxxxxxxxxxxxxxxxxxxxxxxxxxxxxxxxxxxxxxxxxxxxxxxxxxxxxxxxxxxxxxxxxxxxxxxxxxxxxxxxxxxxxxxxxxxxxxxxxxxxxxxxxxxxxx
xxxxxxxxxxxxxxxxxxxxxxxxxxxxxxxxxxxxxxxxxxxxxxxxxxxxxxxxxxxxxxxxxxxxxxxxxxxxxxxxxxxxxxxxxxxxxxxxxxxxxxxxxxxxxxxxxxxxxxxxxxxxxxxxxxxxxxxxxxxxxxxxxxxxxxxxxxxxxxxxxxxxxxxxxxxxxxxxxxxxxxxxxxxxxxxxxxxxxxxxxxxxxxxxxxxxxxxxxxxxxxxxxxxxxxxxxxxxxxxxxxxxxxxxxxxxxxxxxxxxxxxxxxxxxxxxxxxxxxxxxxxxxxxxxxxxxxxxxxxxxxxxxxxxxxxxxxxxxxxxxxxxxxxxxxxxxxxxxxxxxxxxxxxxxxxxxxxxxxxxxxxxxxxxxxxxxxxxxxxxxxxxxxxxxxxxxxxxxxxxxxxxxxxxxxxxxxxxxxxxxxxxxxxxxxxxxxxxxxxxxxxxxxxxxxxxxxxxxxxxxxxxxxxxxxxxxxxxxxxxxxxxxxxxxxxxxxxxxxxxxxxxxxxxxxxxxxxxxxxxxxxxxxxxxxxxxxxxxxxxxxxxxxxxxxxxxxxxxxxxxxxxxxxxxxxxxxxxxxxxxxxxxxxxxxxxxxxxxxxxxxxxxxxxxxxxxxxxxxxxxxxxxxxxxxxxxxxxxxxxxxxxxxxxxxxxxxxxxxxxxxxxxxxxxxxxxxxxxxxxxxxxxxxxxxxxxxxxxxxxxxxxxxxxxxxxxxxxxxxxxxxxxxxxxxxxxxxxxxxxxxxxxxxxxxxxxxxxxxxxxxxxxxxxxxxxxxxxxxxxxxxxxxxxxxxxxxxxxxxxxxxxxxxxxxxxxxxxxxxxxxxxxxxxxxxxxxxxxxxxxxxxxxxxxxxxxxxxxxxxxxxxxxxxxxxxxxxxxxxxxx
xxxxxxxxxxxxxxxxxxxxxxxxxxxxxxxxxxxxxxxxxxxxxxxxxxxxxxxxxxxxxxxxxxxxxxxxxxxxxxxxxxxxxxxxxxxxxxxxxxxxxxxxxxxxxxxxxxxxxxxxxxxxxxxxxxxxxxxxxxxxxxxxxxxxxxxxxxxxxxxxxxxxxxxxxxxxxxxxxxxxxxxxxxxxxxxxxxxxxxxxxxxxxxxxxxxxxxxxxxxxxxxxxxxxxxxxxxxxxxxxxxxxxxxxxxxxxxxxxxxxxxxxxxxxxxxxxxxxxxxxxxxxxxxxxxxxxxxxxxxxxxxxxxxxxxxxxxxxxxxxxxxxxxxxxxxxxxxxxxxxxxxxxxxxxxxxxxxxxxxxxxxxxxxxxxxxxxxxxxxxxxxxxxxxxxxxxxxxxxxxxxxxxxxxxxxxxxxxxxxxxxxxxxxxxxxxxxxxxxxxxxxxxxxxxxxxxxxxxxxxxxxxxxxxxxxxxxxxxxxxxxxxxxxxxxxxxxxxxxxxxxxxxxxxxxxxxxxxxxxxxxxxxxxxxxxxxxxxxxxxxxxxxxxxxxxxxxxxxxxxxxxxxxxxxxxxxxxxxxxxxxxxxxxxxxxxxxxxxxxxxxxxxxxxxxxxxxxxxxxxxxxxxxxxxxxxxxxxxxxxxxxxxxxxxxxxxxxxxxxxxxxxxxxxxxxxxxxxxxxxxxxxxxxxxxxxxxxxxxxxxxxxxxxxxxxxxxxxxxxxxxxxxxxxxxxxxxxxxxxxxxxxxxxxxxxxxxxxxxxxxxxxxxxxxxxxxxxxxxxxxxxxxxxxxxxxxxxxxxxxxxxxxxxxxxxxxxxxxxxxxxxxxxxxxxxxx
xxxxxxxxxxxxxxxxxxxxxxxxxxxxxxxxxxxxxxxxxxxxxxxxxxxxxxxxxxxxxxxxxxxxxxxxxxxxxxxxxxxxxxxxxxxxxxxxxxxxxxxxxxxxxxxxxxxxxxxxxxxxxxxxxxxxxxxxxxxxxxxxxxxxxxxxxxxxxxxxxxxxxxxxxxxxxxxxxxxxxxxxxxxxxxxxxxxxxxxxxxxxxxxxxxxxxxxxxxxxxxxxxxxxxxxxxxxxxxxxxxxxxxxxxxxxxxxxxxxxxxxxxxxxxxxxxxxxxxxxxxxxxxxxxxxxxxxxxxxxxxxxxxxxxxxxxxxxxxxxxxxxxxxxxxxxxxxxxxxxxxxxxxxxxxxxxxxxxxxxxxxxxxxxxxxxxxxxxxxxxxxxxxxxxxxxxxxxxxxxxxxxxxxxxxxxxxxxxxxxxxxxxxxxxxxxxxxxxxxxxxxxxxxxxxxxxxxxxxxxxxxxxxxxxxxxxxxxxxxxxxxxxxxxxxxxxxxxxxxxxxxxxxxxxxxxxxxxxxxxxxxxxxxxxxxxxxxxxxxxxxxxxxxxxxxxxxxxxxxxxxxx
xxxxxxxxxxxxxxxxxxxxxxxxxxxxxxxxxxxxxxxxxxxxxxxxxxxxxxxxxxxxxxxxxxxxxxxxxxxxxxxxxxxxxxxxxxxxxxxxxxxxxxxxxxxxxxxxxxxxxxxxxxxxxxxxxxxxxxxxxxxxxxxxxxxxxxxxxxxxxxxxxxxxxxxxxxxxxxxxxxxxxxxxxxxxxxxxxxxxxxxxxxxxxxxxxxxxxxxxxxxxxxxxxxxxxxxxxxxxxxxxxxxxxxxxxxxxxxxxxxxxxxxxxxxxxxxxxxxxxxxxxxxxxxxxxxxxxxxxxxxxxxxxxxxxxxxxxxxxxxxxxxxxxxxxxxxxxxxxxxxxxxxxxxxxxxxxxxxxxxxxxxxxxxxxxxxxxxxxxxxxxxxxxxxxxxxxxxxxxxxxxxxxxxxxxxxxxxxxxxxxxxxxxxxxxxxxxxxxxxxxxxxxxxxxxxxxxxxxxxxxxxxxxxxxxxxxxxxxxxxxxxxxxxxxxxxxxxxxxxxxxxxxxxxxxxxxxxxxxxxxxxxxxxxxxxxxxxxxxxxxxxxxxxxxxxxxxxxxxxxxxxxxxxxxxxxxxxxxxxxxxxxxxxxxxxxxxxxxxxxxxxxxxxxxxxxxxxxxxxxxxxxxxxxxxxxxxxxxxxxxxxxxxxxxxxxxxxxxxxxxxxxxxxxxxxxxxxxxxxxxxxxxxxxxxxxxxxxxxxxxxxxxxxxxxxxxxxxxxxxxxxxxxxxxxxxxxxxxxxxxxxxxxxxxxxxxxxxxxxxxxxxxxxxxxxxxxxxxxxxxxxxxxxxxxxxxxxxxxxxxxxxxxxxxxxxxxxxxxxxxxxxxxxxxxxxxx
xxxxxxxxxxxxxxxxxxxxxxxxxxxxxxxxxxxxxxxxxxxxxxxxxxxxxxxxxxxxxxxxxxxxxxxxxxxxxxxxxxxxxxxxxxxxxxxxxxxxxxxxxxxxxxxxxxxxxxxxxxxxxxxxxxxxxxxxxxxxxxxxxxxxxxxxxxxxxxxxxxxxxxxxxxxxxxxxxxxxxxxxxxxxxxxxxxxxxxxxxxxxxxxxxxxxxxxxxxxxxxxxxxxxxxxxxxxxxxxxxxxxxxxxxxxxxxxxxxxxxxxxxxxxxxxxxxxxxxxxxxxxxxxxxxxxxxxxxxxxxxxxxxxxxxxxxxxxxxxxxxxxxxxxxxxxxxxxxxxxxxxxxxxxxxxxxxxxxxxxxxxxxxxxxxxxxxxxxxxxxxxxxxxxxxxxxxxxxxxxxxxxxxxxxxxxxxxxxxxxxxxxxxxxxxxxxxxxxxxxxxxxxxxxxxxxxxxxxxxxxxxxxxxxxxxxxxxxxxxxxxxxxxxxxxxxxxxxxxxxxxxxxxxxxxxxxxxxxxxxxxxxxxxxxxxxxxxxxxxxxxxxxxxxxxxxxxxxxxxxxxxxxxxxxxxxxxxxxxxxxxxxxxxxxxxxxxxxxxxxxxxxxxxxxxxxxxxxxxxxxxxxxxxxxxxxxxxxxxxxxxxxxxxxxxxxxxxxxxxxxxxxxxxxxxxxxxxxxxxxxxxxxxxxxxxxxxxxxxxxxxxxxxxxxxxxxxxxxxxxxxxxxxxxxxxxxxxxxxxxxxxxxxxxxxxxxxxxxxxxxxxxxxxxxxxxxxxxxxxxxxxxxxxxxxxxxxxxxxxxxxxxxxxxxxxxxxxxxxxxxxxxxxxxxxxxxxxxxxxxxxxxxxxxxxxxxxxxxxxxxxxxxxxxxxxxxxxxxxxxxxxxxxxxxxxxxxxxxxxx
100-500 PSv/h
10-50 PSv/h
50-100 PSv/h
Inner detectorNose
shield.
MuonsMiddleMuonsBarrel toroid coil
Inner detector access
Tile cal. Tile cal.
LAr cal. LAr cal.
End-capEnd-cap
Long accessEnd-capmiddlemuons
End-capoutermuons
Figure 3.9: The inner region of the detector during one of the main long access scenarios. Thepredicted dose rates have been calculated for 10 years of operation at 1034 cm−2 s−1 and for fivedays of cooling off. The long access scenario (b) has only the inner detector section of the beam-pipe in place. The expected dose rates are greatly reduced in this access scenario.
– 52 –