back to school? the worst places in the world rich countries must start backing up their warm words...
TRANSCRIPT

1
Back to School? The worst places in the world...
Pantone

2
Acknowledgements This is an independent report and does not necessarily reflect the views of all members or national coalitions.
The project team comprised the following:Shaharazad Abuel-Ealeh, Sam Barratt, John Coventry, Lucia Fry, George Harris, David Hollow, Scott Longhurst and Swati Narayan.
Many people inside and outside the GCE provided valuable assistance but special thanks are due to Monique Fouilhoux, Emily Laurie, Akanksha Marphatia, Elin Martinez, Purna Shrestha, Lindy van Vliet, Katy Webley and all the coalition partners who assisted in the research process.
© Global Campaign for Education 2010.Published by the Global Campaign for Education in 2010PO Box 521733, Saxonwold, 2132, South Africawww.campaignforeducation.org
All rights reserved. This publication is copyright, but may be reproduced by any method without fee for advocacy, campaigning, and teaching purposes, but not for resale. The copyright holder requests that all such use be registered with them for impact assessment purposes. For copying in any other circumstances, or for re-use in other publications, or for translation or adaptation, prior written permission must be obtained from the publisher, and a fee may be payable.
This Global Campaign for Education report is supported by ActionAid, Education International, Oxfam, Plan International, Save The Children and VSO.

1
Foreword Kailash Satyarthi, GCE President
We are living in challenging times. Around the world economic recession, natural disasters and conflict come together to paint a bleak picture in newspapers and on our television screens. It can be difficult to maintain a positive outlook on the future, to look past the urgent problems that we all face now towards a new horizon for the next generation of global citizens. Education is the key to giving us this vision. Children have a remarkable capacity for positivity and energy. They hold strong hopes and dreams that can, if nurtured and developed, play a huge role in forming both strong individuals and strong communities. Good quality free education can deliver almost immeasurable positive results for wider society, helping to shape citizens who are healthier, more productive, and active within their communities. Education will give us tomorrow’s doctors, nurses, teachers and leaders – but also healthy mothers, responsible fathers and engaged citizens. Still, five years away from the Millennium Development Goals deadline and despite countless warm words from leaders right across the world, the dream of Education for All remains just that. This report from the Global Campaign for Education shows how and why 69 million children around the world are still being let down by rich and poor governments alike.
During the recent World Cup in South Africa, 18 million people joined over 200 stars from the world of football and signed up to the Global Campaign for Education’s IGOAL campaign, backed by FIFA, to make universal education a legacy of Africa’s first World Cup Finals tournament. People have spoken, loudly and clearly. Now it’s time for leaders to answer their call. For governments on both sides of the equator there is no time to waste. Governments in rich countries must start backing up their warm words on education with real action. This means paying their fair share of money toward education and considering other innovative financing solutions to pay for all children to go to school. They must focus their efforts on what works. What matters are the tools that can deliver right at the sharp end of education: teachers, books and schools. In developing countries, governments and their Ministries of Finance must be absolutely clear that they recognise education as the cornerstone of development in their countries. They must make Education for All a constitutional right and assign 20% of their spending to education infrastructure and delivery.
In the ongoing effort to achieve Education for All it is vital that we have reliable information regarding what are the priority issues to be targeted in each country. This report makes a valuable contribution, enabling us to have a fresh look at each country and assess those that are performing well and those that are lagging behind in all the key areas.
The journey toward Education for All has been a long one. In a struggle, it is often easy to forget the change that has been achieved. Since the Global Campaign for Education was launched in 1999, 40 million more children have got into school. I thank the campaigners who lobbied their leaders to make this happen. Getting all children into school is an achievable goal. For another 69 million children the journey continues, but if leaders keep their promises we can reach our destination.

2
Back to school?The worst places in the world to be a school child in 2010
Executive Summary
Education is the foundation of all development and a vital catalyst for growth. The eight goals agreed at the UN Millennium Summit in 2000 reflected this, with two of them directly concerning education provision.
• Goal 2: Ensure that, by 2015, children everywhere, boys and girls alike, will be able to complete a full course of primary schooling.
• Goal 3: Eliminate gender disparity in primary and secondary education, preferably by 2005, and in all levels of education no later than 2015.
The final declaration of the 2000 Summit asserted this further, stating that ‘Education is development. It creates choices and opportunities for people, reduces the twin burdens of poverty and diseases, and gives a stronger voice in society.’ 2010 is a critical year during which it will become clear whether the global community is committed or complacent in its promises to reduce world poverty.
This report, backed by many of the world’s leading anti-poverty organisations, shines a spotlight on the worst places in the world to be a school child. The findings paint a stark picture of the lives of children from 60 of the poorest countries. It demonstrates loud and clear that the efforts to provide universal access to education are in crisis, and that the progress made in enrolling 40 million more children in school since 2000 is now under severe threat. There are still 69 million children out of school today. The UN report that if current trends continue, the slowdown in progress in enrolments will mean that in 2015 there will be more children out of school than there are today. In addition, too often the quality of education on offer is very poor, leading to early drop-out and illiteracy. Across the world there are 759 million adults who cannot read or write. In sub-Saharan Africa, 48% of children do not complete primary school and only one country in the region sends more than half its children to secondary school.
Education is proven to be the key to ensuring sustained and equitable economic growth, improved health and social development.
• Across the world, 171 million people could be lifted out of poverty if all children left school with basic reading skills.
• In sub-Saharan Africa, providing every mother with secondary education would save the lives of 1.8 million children every year.
Despite this potential for transformation, the education sector is in crisis, with developing countries under pressure to squeeze their budgets and aid budgets being cut. Indeed, recent international summits have shown little if any appetite to address the looming emergency.
It is clear that a dramatic upscaling of domestic and external aid efforts is needed in order to give the next generation better prospects than their parents, and lift themselves and their countries out of poverty. Our country case studies highlight the places where education challenges remain most severe, or where governments have most comprehensively failed to live up to their commitments. While the efforts of some have been remarkable, too many poor country governments still do not take the minimum actions required to open the school gates to all.
In addition, poor countries are on a worsening trajectory as severe and deepening pressure from the economic downturn caused by the crisis of the rich world’s banking system bites on their budgets. The global impact of the economic downturn is expected to be devastating in the education sector, where it is estimated that $4.6 billion per year will be lost to education budgets in sub-Saharan Africa due to the combination of effects of the crisis.
It is vital that governments of rich and poor countries now live up to the promises they have made. Effective aid to education can be a powerful tool. Sadly many significant donors are neglecting their obligations and using scarce aid funds to underwrite their own universities, prioritise geo-political self interest, and spend excessive amounts of money on consultants. Poor country governments also need to increase domestic spending on education to the recommended 20% of total budget. Many have made good efforts, although a significant minority including Pakistan, Chad and Congo still allocate less than 12% of their total budget to education.
The rich world stated ten years ago in the Dakar Declaration, that ‘no country with a serious plan for the achievement of Education For All should be thwarted in this ambition for lack of resources’. This report shows that most rich country governments have failed to keep their promises on helping poor countries achieve education goals, and that much more effort will be needed to fill the global financing gap for education. All of this points to the need for a global reinvigoration of efforts to set the world back on track for achieving Education For All by 2015.

Poor countries should:
1. Be vocal and passionate advocates of investment in education on the global stage.
2. Put a minimum of 20% of their budgets into education, half for primary schooling.
3. End fees and charges that prevent families sending children to school.
4. Help girls and marginalized groups into school, with special programmes such as school health and nutrition and stipends.
5. Train and recruit all the teachers needed to achieve EFA, and ensure quality teaching and learning that meets the diverse needs of students, alongside appropriate assessment of learning outcomes.
6. Be open to civil society participation and democratic control in education governance and budgeting, to strengthen accountability between citizens and the state.
Rich countries should:
1. Immediately prepare a step-up plan for reaching their fair share of the funding needed for EFA. Aid to basic education should double from $4 billion to $8 billion per year immediately, and increase incrementally to $16 billion per year by 2014.
2. Make aid available for the core running costs of education – teachers, books and schools – and end the practice of reporting imputed student costs and aid to overseas territories into total aid to education figures.
3. Back global plans and initiatives to ensure resources and results:
• AttheG20,agreeaglobalfinancialtransactiontaxofatleast$400billionperyear,with$100billionofthisfordevelopmentaid,includingeducation.
• BackareformedFastTrackInitiativeandensurethatitsreplenishmenttargetof$2billionfor2010ismetimmediately.
• Exploreotherinnovativeapproachestoraisinganddisbursingfundsforeducation.
4. Target aid to countries facing the greatest challenges, including those suffering war and conflict, and where girls are most severely disadvantaged.
5. Require the IMF and World Bank to pursue ‘pro-education’ policies:
• The World Bank should agree a matched funding formula for assisting FTI-endorsed countries, combining its resources with FTI grants under a single stream, in the form of grants rather than loans.
• TheIMFshouldrelaxmacro-economicconditionssuchaslowinflationanddeficittargetstoallowforcounter-cyclicalinvestmentineducation up to 2015.
Our recommendations
3

4
2010 is a critical year in which the world will decide if it is dedicated or complacent in its commitments to reduce world poverty. It is ten years since world leaders agreed eight goals to improve the lives of the world’s poorest people. These goals inspired campaigners and governments alike to redouble and target their efforts to change the fortunes of the most vulnerable members of society. As a result of government efforts, aid and debt cancellation since 2000, millions of people have accessed free education and health services, and improved their incomes and quality of life.
Despite this progress, seven out of the eight goals are likely to be missed. The goal that could have the greatest impact on economic growth, improved health and social welfare and development is ensuring universal access to good quality education. Yet this vital sector is in crisis, with developing countries under pressure to squeeze their budgets and aid being cut. Meanwhile the global leadership that benefits other issues is singularly lacking, with recent international summits showing little if any appetite to address this looming emergency.
Within this context, this report from the Global Campaign for Education, supported by six of the world’s leading anti-poverty organisations, shines a spotlight on the worst places in the world to be a school child. The ‘School Report’ table findings paint a stark picture of the lives of children from around 60 of the poorest countries 1 demonstrating that a dramatic upscaling of effort is needed in order to give the next generation better prospects than their parents and lift themselves and their countries out of poverty. A country like Chad, languishing close to the bottom of our table, has shocking indicators across the board: just 14% of its population go to school for five years, child labour and early marriage are rife, and two-thirds of adults cannot read or write. The country case studies highlight places where education challenges remain most severe, or where governments have most comprehensively failed to live up to their commitments. While the efforts of some have been remarkable, too many poor country governments still do not take the minimum actions required to open the school gates to all.
More worryingly, poor countries are on a worsening trajectory as severe and deepening pressure from the economic downturn caused by the crisis of the rich world’s banking system bites on their budgets. This is an impact that is reverberating across the vital areas of global education, health, nutrition, water and sanitation. Damaging setbacks are already occurring and are predicted to escalate in the coming years. 2
The global impact of the economic downturn is very apparent in the education sector, where it is estimated that $4.6 billion per year will be lost from education budgets in sub-Saharan Africa due to the combination of effects of the crisis. This represents a 13% reduction of the resources devoted to each primary school pupil. 6
1 Ranking all countries with per capita incomes of less than $30002 UNICEF 2010. Progress for Children: Achieving the MDGs with equity. http://www.devinfo.info/pfc/download/progress_for_children_No9.pdf3 IMF, 2009: World Economic Outlook4 GMR, 2010: Reaching the marginalised5 World Bank, 2008: Aggregate economic shocks, child schooling and child health
The impact of the crisis created by unregulated banking and reckless lending in rich countries has spread rapidly across the globe. In Europe and North America,governmentsabandonedneo-liberalorthodoxyinfavourofmassiveeconomicstimulusprogrammes,spendingoninfrastructureandpublicservices,as well as engaging in short-term ‘quantitative easing’ – controlled increase in the supply of money so as to reduce pressure on banks. Bound by IMF-advised macro-economic policies geared towards restricting money supply, governments in low-income countries have very limited opportunity to pursue the same course. As a result, economic growth looks set to falter, especially across sub-Saharan Africa, with serious consequences for education spending. 3
The2010EFAGlobalMonitoringReportanalysestheimplicationsforeducationspending,demonstratinghowtheincreasedinvestmentineducationin the region has been a direct benefit of economic growth in the early part of this decade. It forecasts that slower, and in some cases negative, growth could result in a cumulative loss of $30 billion to education in the region by 2013. For many of these countries, even high annual growth left the sector with substantial financing gaps. Specific country data is only slowly starting to emerge:
In September 2009, Kenya announced plans to delay financing of free education for 8.3 million primary school children and 1.4 million secondary school children, prompting school administrators to press for a temporary restoration of user fees. The government claimed costs associated with emergency feeding programmes forced the delay. 4
Constraints to public spending on education are not the only reason education suffers during a financial crisis. A recent World Bank study 5 of past experiencesinLatinAmericaandAfricarevealedthateconomicshockshaveadirectimpactonenrollmentinpoorcountriesduetoacombinationofincreased child labor and deteriorating quality of education, as teachers themselves are forced to take second jobs to support their families. The 2010 EFAGlobalMonitoringReportechoesthesefindings,highlightingunemployment,lossofremittancesandincreasesinhouseholdhungerasreasonswhyfamilieswithdrawchildrenfromschool.Girlsandwomen,andverypoorfamilies,areespeciallyvulnerabletotheseeffects.
The repercussions are clear: the economic crisis will undoubtedly set back the progress made in education since 2000. Currently it appears that the majority – though not all – of governments are attempting to protect or even increase education spending within the scant fiscal space that they have. The onus is therefore on the international community to step up to the plate, honour their promises and fulfill their responsibility to the poorest: those who did nothing to create the financial crisis but find themselves suffering the worst of its effects.
Weathering the storm? Education and the economic crisis
5
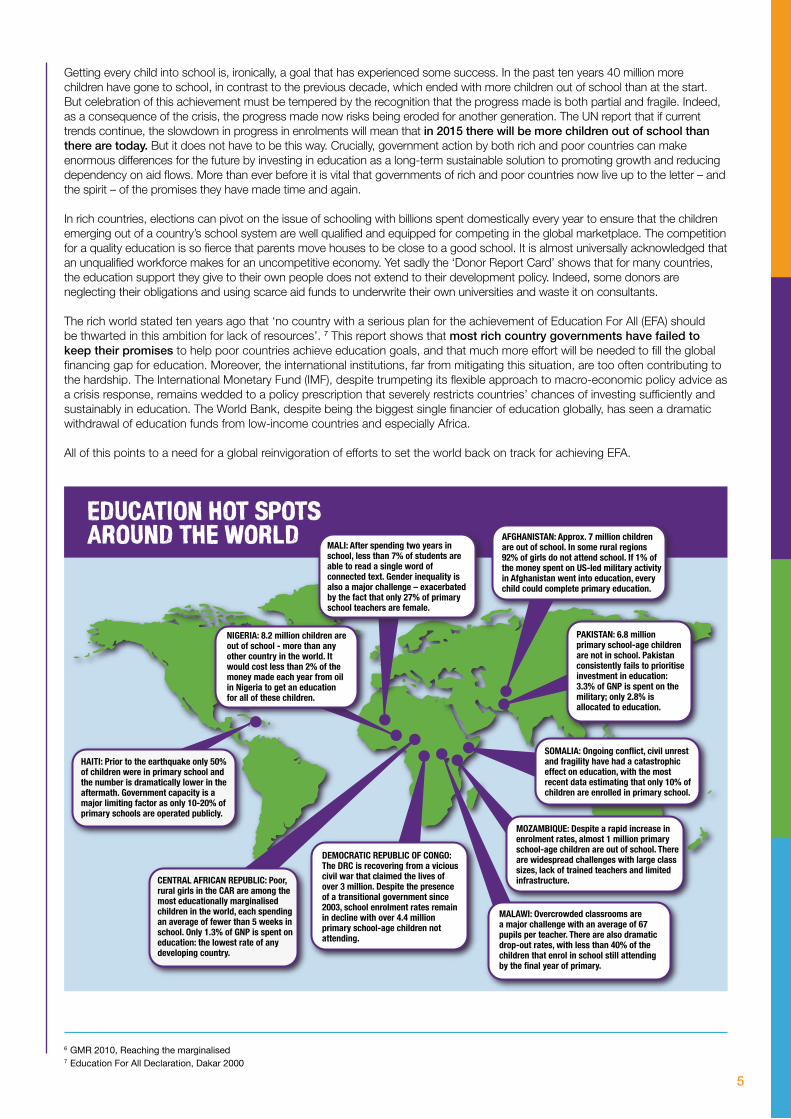
Getting every child into school is, ironically, a goal that has experienced some success. In the past ten years 40 million more children have gone to school, in contrast to the previous decade, which ended with more children out of school than at the start. But celebration of this achievement must be tempered by the recognition that the progress made is both partial and fragile. Indeed, as a consequence of the crisis, the progress made now risks being eroded for another generation. The UN report that if current trends continue, the slowdown in progress in enrolments will mean that in 2015 there will be more children out of school than there are today. But it does not have to be this way. Crucially, government action by both rich and poor countries can make enormous differences for the future by investing in education as a long-term sustainable solution to promoting growth and reducing dependency on aid flows. More than ever before it is vital that governments of rich and poor countries now live up to the letter – and the spirit – of the promises they have made time and again.
In rich countries, elections can pivot on the issue of schooling with billions spent domestically every year to ensure that the children emerging out of a country’s school system are well qualified and equipped for competing in the global marketplace. The competition for a quality education is so fierce that parents move houses to be close to a good school. It is almost universally acknowledged that an unqualified workforce makes for an uncompetitive economy. Yet sadly the ‘Donor Report Card’ shows that for many countries, the education support they give to their own people does not extend to their development policy. Indeed, some donors are neglecting their obligations and using scarce aid funds to underwrite their own universities and waste it on consultants.
The rich world stated ten years ago that ‘no country with a serious plan for the achievement of Education For All (EFA) should be thwarted in this ambition for lack of resources’. 7 This report shows that most rich country governments have failed to keep their promises to help poor countries achieve education goals, and that much more effort will be needed to fill the global financing gap for education. Moreover, the international institutions, far from mitigating this situation, are too often contributing to the hardship. The International Monetary Fund (IMF), despite trumpeting its flexible approach to macro-economic policy advice as a crisis response, remains wedded to a policy prescription that severely restricts countries’ chances of investing sufficiently and sustainably in education. The World Bank, despite being the biggest single financier of education globally, has seen a dramatic withdrawal of education funds from low-income countries and especially Africa.
All of this points to a need for a global reinvigoration of efforts to set the world back on track for achieving EFA.
6 GMR 2010, Reaching the marginalised7 Education For All Declaration, Dakar 2000
6
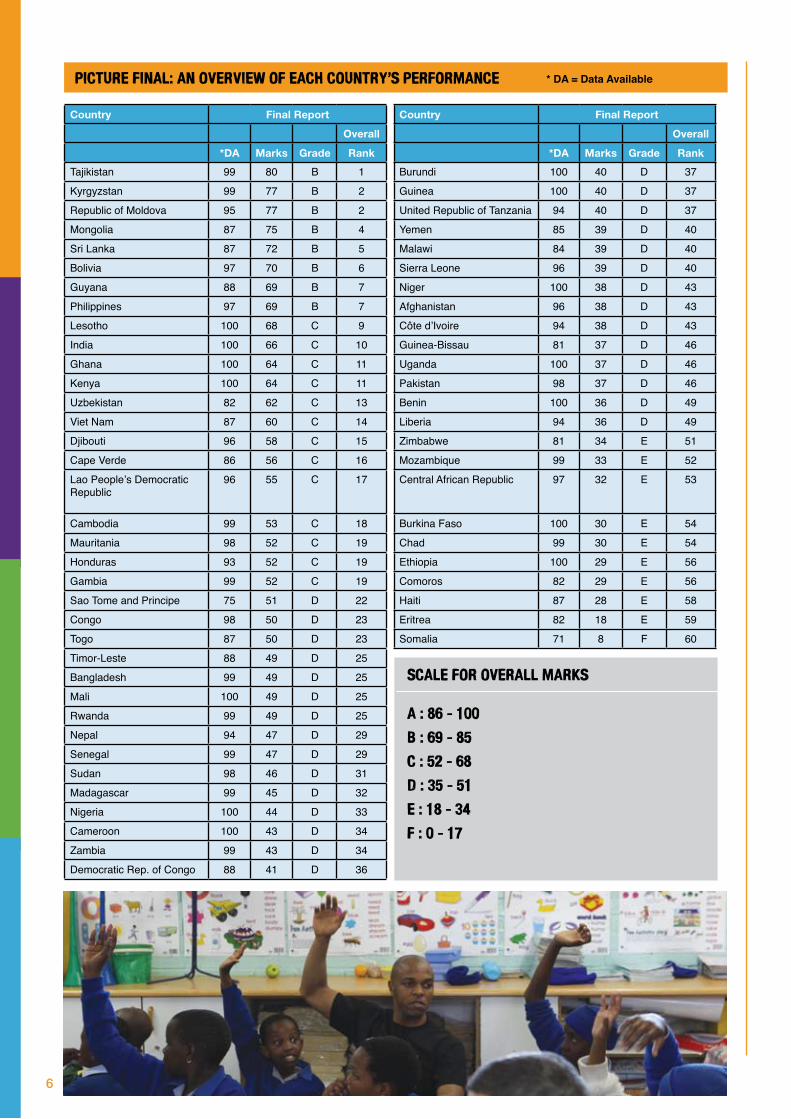
Picture Final: An overview of each country’s performance
Country Final Report
Overall
*DA Marks Grade Rank
Tajikistan 99 80 B 1
Kyrgyzstan 99 77 B 2
Republic of Moldova 95 77 B 2
Mongolia 87 75 B 4
Sri Lanka 87 72 B 5
Bolivia 97 70 B 6
Guyana 88 69 B 7
Philippines 97 69 B 7
Lesotho 100 68 C 9
India 100 66 C 10
Ghana 100 64 C 11
Kenya 100 64 C 11
Uzbekistan 82 62 C 13
Viet Nam 87 60 C 14
Djibouti 96 58 C 15
Cape Verde 86 56 C 16
Lao People’s Democratic Republic
96 55 C 17
Cambodia 99 53 C 18
Mauritania 98 52 C 19
Honduras 93 52 C 19
Gambia 99 52 C 19
Sao Tome and Principe 75 51 D 22
Congo 98 50 D 23
Togo 87 50 D 23
Timor-Leste 88 49 D 25
Bangladesh 99 49 D 25
Mali 100 49 D 25
Rwanda 99 49 D 25
Nepal 94 47 D 29
Senegal 99 47 D 29
Sudan 98 46 D 31
Madagascar 99 45 D 32
Nigeria 100 44 D 33
Cameroon 100 43 D 34
Zambia 99 43 D 34
Democratic Rep. of Congo 88 41 D 36
Scale for Overall Marks
A : 86 - 100 B : 69 - 85 C : 52 - 68 D : 35 - 51 E : 18 - 34 F : 0 - 17
Country Final Report
Overall
*DA Marks Grade Rank
Burundi 100 40 D 37
Guinea 100 40 D 37
United Republic of Tanzania 94 40 D 37
Yemen 85 39 D 40
Malawi 84 39 D 40
Sierra Leone 96 39 D 40
Niger 100 38 D 43
Afghanistan 96 38 D 43
Côte d’Ivoire 94 38 D 43
Guinea-Bissau 81 37 D 46
Uganda 100 37 D 46
Pakistan 98 37 D 46
Benin 100 36 D 49
Liberia 94 36 D 49
Zimbabwe 81 34 E 51
Mozambique 99 33 E 52
Central African Republic 97 32 E 53
Burkina Faso 100 30 E 54
Chad 99 30 E 54
Ethiopia 100 29 E 56
Comoros 82 29 E 56
Haiti 87 28 E 58
Eritrea 82 18 E 59
Somalia 71 8 F 60
* DA = Data Available

7
Education: a silent crisis, warranting global actionThis day and every day, 69 million children will wake up with no prospect of a stimulating and life-enhancing school day ahead, facing hunger, hard work, ill-health and poverty as a result. Each of these children will never know the inside of a classroom, will never read a textbook and will never know the care of a good teacher. They will never experience the benefits of being able to count, read, develop life skills, and will miss out on the job opportunities and improved health afforded by a good quality education.
The majority of these children are girls, whose lives are likely to be burdened by the twin blights of early marriage and domestic labour. In rural Burkina Faso, 61% of girls are married by the age of 18 and over 85% never get to see the inside of a secondary school.
This report further shows that those children fortunate enough to go to school too often find that their chance of having a quality education, leading to meaningful learning outcomes, is severely hampered. A nationwide survey showed that more than half of the grade V rural students in India were found to be unable to read a grade II language text. 8 Countries across Africa and Asia have resorted to meeting rising demand for education by employing contract and untrained teachers. In Togo only 15% of primary school teachers have the appropriate training, and Ghana, Liberia and Sierra Leone each have less than 50% trained. Frequently it is poor children who find themselves in oversized classes, taught by these teachers and unable to learn. In the Central African Republic there is an average of 90 children per teacher, and in Chad, Rwanda and Malawi an average of over 60 children per teacher.
Hungry children complete fewer years than children that are adequately nourished. due to reduced cognitive ability, prevalence of disease and other effects, yet almost one-third of the world’s children are suffering malnutrition. It is therefore no surprise that in sub-Saharan Africa, 48% of children do not complete primary school and are forced to begin their lives without the preparation of a basic education.
8 Pratham, 2009. Annual Status of Education Report, New Delhi
Nigeria has more children out of education than any other country in the world – 8.2 million. This is made all the more appalling by the fact that Nigeria is farfrompoor,byAfricanstandards.Onpaperatleastitisamongthecontinent’srichestcountries,theworld’ssixthlargestproducerofcrudeoil.
But decades of failure to invest in education have left the basic school system hardly functioning, especially in the country’s impoverished north. The women and girls at the free school in Kaduna come from villages where there are no state schools at all – despite the country’s commitment to universal basiceducation-orwherethefeeschargedbyunderfundedschoolsexcludeallbutthebetteroff.Unofficialchargesforbooksandsooncanamounttoabout 8,000 naira a term, about £50. “Many of their parents are so poor,” says Tattalli Organisation coordinator Rukayyat Adamu, “that they can’t even afford to buy their children pencils.”
In the largely Muslim north of Nigeria, education is key to empowering women. In parts of the region, attendance rates are below 50% at primary school and of those only one in every three pupils is female (nationwide, the proportion is five boys to four girls). Many of the girls at the Tattalli free school are 14 or 15 andhavefledhomeandcometoKadunabecausetheirmarriageshadalreadybeenfixed.Thewayout,theytellGCE,ofthelifeoftheirmothers,istobecomedoctors, teachers or nurses. It’s touching to see them, a month into the first taste of education of their lives, reciting “A is for apple, B is for boy, c is for cake.”
Nigeria: education on the brink
Whilst primary education remains in crisis, the picture becomes even grimmer when considering pre-primary and secondary education, both of which are almost always the privilege of the few. In sub-Saharan Africa, only one country sends more than half its children to secondary school – the tiny island nation of Cape Verde which has a total population of only 430,000. Girls from poor rural families face the biggest challenges, with a slim chance of completing a full cycle of schooling when compared to rich, urban boys. In Yemen, for example, boys in rich urban areas average ten years in education, whereas poor rural girls average just one year. Within poor households, if there are limited resources, then girls invariably will be the first to drop out of school.
In addition, adult illiteracy remains a major stain on the world’s efforts to end poverty: 759 million adults, the majority of them women, are unable to read and write. Across Africa, the problem is rife with 21 countries having between a third and a half of their populations illiterate. Chad, Somalia, Sierra Leone and Niger each have illiteracy rates of over 70% of the population, as shown in our ranking tables. Half of the illiterate adults in the world live in South Asia with the hot spots of Afghanistan, Pakistan, and Bangladesh. Illiterate adults and their families struggle without even the most basic of skills to navigate life, access healthcare for their families and enter the labour market.
* DA = Data Available

ItisimpossibletoconsidertheeducationperformanceofAfghanistanoutsideofthecontextoftheongoingconflict.Childrenhavejustaoneinfourchance of surviving until their fifth birthday – and if they do, the outlook in terms of education remains bleak.
Despite a 500% increase in enrolments in the last eight years, 9 seven million Afghan children are currently out of school, with 92% of girls in some rural areasunabletoaccesseducation.Girls’educationisahugechallenge,setagainstasocio-culturalandreligioustraditionthatplacesstrongrestrictionsofwomen.Lessthan20%ofyoungAfghanwomenareliterateandevenwherethereisprimaryeducationavailable,lessthan50%enrol.Currently,thereisone teacher to every 43 pupils.
Aid to Afghanistan is closely tied to the military intervention there. In 1999 the country received a total of $2 million of aid to basic education, amounting to$1perchildofprimaryschoolage.But2007thishadrisento$168millionamountingto$37perprimaryschoolagedchild.ThetotalcostofUS-ledmilitaryactivityinAfghanistanisexpectedtorisetoabove$500billion.If1%ofthismoneycouldbedivertedintoprovidingeducationtheneverychildcouldgotoschoolforsixyears,andcompleteprimaryeducation.
8
The educational picture in Haiti has historically been poor – the country was bottom of the league table for education provision in 2008. January 2010’s devastating earthquake, while increasing public attention and international aid to the Haiti, has set back schooling even further. It is hoped that international aid efforts look not only toward immediate relief but also to long term reconstruction of public services and preparedness for future natural disasters.
Priortotheearthquake,onlyaround50%ofHaiti’schildrenwenttoschool.Whereschoolingwasavailable,seriouschallengesexistedaroundthequality of education, with only 20% of schools being state run. Other provision was disparate, run by churches or community groups – meaning severe variation in quality of teaching. 20% of all Haitian schools were affected by the recent earthquake – and 80% of those were completely destroyed, leaving an estimated 2.5 million children without a school to go to. The Inter-agency Standing Committee Education Cluster has now enabled 80% of affected schools to reopen – but many of them are in temporary school shelters.
One of those affected is 10 year old Michou, from Port Au Prince. Michou’s school was destroyed in the earthquake, leaving her and her brother without and education – and her whole family with an uncertain future.
“Before the earthquake my father was a street vendor selling plastic bags, but he became ill and could no longer work. My mother used to sell drinking glasses, but they all got smashed in the earthquake.
When the earthquake happened, we all managed to get out of the house in time, but we lost everything. Everything happened so quickly. We are now living on the street like many others in our neighbourhood, under sheets strung between broken down buildings.
Ourneighbourssharericeandspaghettiwithus,becauseitisverydifficulttofindfoodandwhenwedoitisveryexpensive.Myparentshavenomoneyto buy anything. What I miss most is being able to go to school.”
Haiti: in the wake of the quake
Conflict, natural disasters and environmental pressures are strong contributing factors to the education crisis. The bottom half of the ranking table is littered with countries affected by these issues, including Chad, Mozambique and Burkina Faso. Where these issues are combined with weak domestic political will and/or donor neglect, children’s chances of realising their potential through education are scant indeed. Countries such as Somalia, Haiti, and Eritrea are all blighted by weak governance. Others, such as Afghanistan, while still facing many major hurdles, have managed to make some strides forward through a combination of increased domestic and aid investment, pulling itself up towards the middle of the table from a very low base in 2000.
Children of Afghanistan: in conFLict and out of school
The crisis in education should be a major cause of concern to global leaders and a priority for action in 2010. It has serious implications for the chances of achieving other development goals, building a strong stable global economy and a secure future free of conflict.
Why? Because there is unambiguous evidence that education beats poverty. It is for this reason that not one but two of the Millennium Development Goals, agreed at the UN Summit in 2000, relate to education:
Goal 2: Ensure that, by 2015, children everywhere, boys and girls alike, will be able to complete a full course of primary schooling.
Goal 3: Eliminate gender disparity in primary and secondary education, preferably by 2005, and in all levels of education no later than 2015.
The final declaration of the 2000 Summit asserted this further, stating that ‘Education is development. It creates choices and opportunities for people, reduces the twin burdens of poverty and diseases, and gives a stronger voice in society.’
9 Mojaddidi et al, 2006, Free Quality Education for Every Afghan Child, Oxfam Briefing Paper 93, Oxfam GB
9
Education Beats Poverty
A life without education is a life half-lived. When people cannot read or write, when they do not have the skills and abilities that a good quality education offers, they are condemned to a life of poverty, ill-health and social exclusion. This disadvantage gets handed down through generations. The children of illiterate parents are more vulnerable to a range of serious threats and problems that can scar their lives forever. And it is not only individuals who suffer - nations as a whole are affected: lack of quality education holds back economic growth and hampers democratic participation. Indeed the impacts are even felt beyond borders. Research shows that education deprivation contributes to conflict and population growth - and thus to environmental pressure and climate change - issues of pressing concern to the global community. 10
The other side of the story is that children who do go to school and learn are healthier, better-nourished, and live longer and more prosperous lives than those who are excluded. When children attend school they become aware of their own potential in the world, and are equipped with the life skills necessary to make informed choices and live well in society. Education also promotes tolerance and understanding between people – both individually and on a national level. Ultimately this leads to greater political participation, stability and transparency, strengthened democratic systems, and a reduction in corruption. Across the world, 171 million people could be lifted out of poverty if all children left school with basic reading skills.
Education is the key to women’s empowerment and better health for all
Time and again the global community has recognised the pivotal role of women in improving the lives of their families and villages. Both the EFA and Millennium Development Goals set ambitious targets for girls’ education, stating that gender parity should be achieved by 2005. This target, tragically, has been missed by a mile.
More than half the countries in the Arab world, in South and West Asia and in Africa have yet to achieve gender equity in education. The fact that women and girls are more likely to be deprived of education is a massive injustice, and is especially problematic for development efforts. When women are disempowered and uneducated, it afflicts not only their own existence, but also that of their offspring and wider society. 11 12 13 Lack of education for women is strongly associated with early marriage, larger family sizes and poor health and nutrition. 14 15 16 17 18 Conversely, when women and girls get an education, they not only lead healthier, wealthier lives, but are able to support their families to do the same. 19 20
Some key statistics: • A child whose mother cannot read or write is 50% more likely to die before the age of 5 and twice as likely to suffer from
malnutrition than a child whose mother completed primary school. 21 22 Educated mothers are 50% more likely to immunise their children. 23 24 25
Providing every mother in sub-Saharan Africa with secondary education would save the lives of 1.8 million children every year.
• A girl in Africa who receives an education is three times less likely to contract HIV/AIDS 26. If every girl and boy received a primary education, 7 million cases of HIV/AIDS could be prevented in a decade. 27
• Women with six or more years of education are more likely to seek prenatal care, assisted childbirth, and postnatal care, reducing the risk of maternal and child mortality and illness. 28
Education: A compelling case for development
10 Dupuy, 2008. Education for peace: building peace and transforming armed conflict through education systems. Save the Children Norway11 See: http://www.girleffect.org/12 Dollar and Gatti, 1999. Gender equality, income and growth: are good times good for women? World Bank policy research report on gender and development, Working Paper Series No.1 Washington DC13 PLAN 2008. Paying the price: the economic cost of failing to educate girls, PLAN: Children in Focus14 World Bank, 1993. World Development Report. Oxford University Press15 Colclough and Lewin, 1993. Educating all the children: strategies for primary schooling in the south16 Summers, 1994. Investing in all the people: educating women in developing countries. Seminar Paper 4517 UNICEF, 2005. Early marriage: a harmful traditional practice – a statistical exploration18 Schultz, 1997. Demand for children in low income countries. In Handbook of population and family economics19 Fortson, 2003. Women’s rights vital for developing world. Yale News Daily20 Watkins, 2001. Oxfam education report. Oxford: Oxfam21 Smith and Haddad, 1999. Explaining child malnutrition in developing countries: a cross country analysis. International Food Policy research Institute (IFPRI). Food consumption and nutrition division Discussion Paper 60.22 Bicego and Ahmad, 1996. Infant and child mortality, Demographic and Health Surveys Comparative Studies No.20.23 Bicego and Ahmad, 1996. Infant and child mortality, Demographic and Health Surveys Comparative Studies No.2024 Save The Children, 2005. State of the world’s mothers25 http://www.unicef.org/mdg/gender.html26 http://camfed.org/27 Global Campaign for Education28 Abu-Ghaida and Klasen, 2004. The costs of missing the Millennium Development Goal on gender equity, World Development, 32 (7), 1075-1107
109.
Education builds economic growth and stability
Perhaps most striking of all in the current global context is the compelling evidence that failing to achieve universal education holds back economic growth. As the world struggles to recover from the recent financial crisis, it has become more vital than ever to ensure that education is a top political priority, especially in developing countries 29 30 31.
Simply getting all children into school has a direct positive impact on economic growth. 32 33 34 Then once children are in school, ensuring that the education they receive is good quality multiplies the impact because it provides them with the skills, knowledge and abilities needed to thrive in the world. A recently completed study from 50 countries established that every extra year of schooling provided to the whole population can increase average annual GDP growth by 0.37%. Where the education is good quality, the improvement of cognitive skills increases the impact to 1%. 35 Another survey of 120 countries from between 1970-2000 provides compelling evidence that education consistently and significantly affects economic development and is a necessary precondition for long-term economic growth. 36 Put simply, the better the quality of education, the bigger the impact on growth. 37
Good quality education also provides people with the knowledge and skills that they need in order to pursue their livelihoods more effectively. Completing just four years of basic education makes a farmer an average of 8.7% more productive. 38 Having been to school also means that farmers can adapt more quickly to new techniques and technologies, including those needed to adapt to climate change. 39
Some key statistics:• The cost of failing to provide a good quality education for all children in poor countries could be as much as $70 billion a year,
due to lost economic growth. 40
• No country has ever achieved continuous and rapid economic growth without first having at least 40% of adults able to read and write. 41
• An adult who has completed primary education is likely to earn 50% more than an adult who has never been to school. 42
• A single year of primary school can increase the wages people earn later in life by 5-15% for boys and even more for girls. 43
29 Numerous studies document the link between schooling and economic growth. Useful summaries can be found in literature reviews from Krueger and Lindahl, 2001; Sianesi and Van Reenen, 2003; and Topel, 199930 GMR, 2009. Overcoming inequality: why governance matters31 World Bank, 2007. Science, Technology and Innovation32 GMR, 2006; Loening, 2002; Petrakis and Stamatakis, 2002; Poot, 2000; Sylwester, 2000; Temple, 200133 OECD, 2006. The economics of knowledge: Why education is key for Europe’s success Lisbon Council Policy Brief34 Harmon, Oosterbeek, and Walker, 2003. The returns to education: microeconomics. Journal of Economic Surveys, 17, 235 Hanushek et al. 2008. Education and economic growth: it’s not just going to school but learning that matters. Education Next, 8, 2, p.62-7036 IIASA 2008. Economic growth in developing countries: education proves key http://www.iiasa.ac.at/Admin/PUB/policy-briefs/pb03-web.pdf37 See: Barro, 2001; Bosworth and Collins, 2003; Cuaresma, 2008; Hanuskek and Kimko, 2000; Hanushek and Woessmann, 2007; Krueger and Lindahl, 2000; Patrinos and Kagia, 2007; Woessmann, 2002, 200338 Teach a child, transform a nation, 2004 http://www.un-ngls.org/orf/cso/TeachV1.pdf39 Teach a child, transform a nation, 2004 http://www.un-ngls.org/orf/cso/TeachV1.pdf 40 SGCE 2009: 1GOAL: Making Education For All A Reality,41 Teach a child, transform a nation, 2004 http://www.un-ngls.org/orf/cso/TeachV1.pdf42 Bartholomew, 2006. It all starts with education http://oneworldus.gather.com/viewArticle.action?articleId=28147497679335843 Psacharaopoulos and Patrinos, 2002, Returns to investment in education: a further update. Policy Research Working Paper 2881, Washington DC: World Bank

11
Where there’s a will there’s a way: Governments can act to ensure education goals are reachedEducation is an outstanding economic and social investment for long-term development, and a vital building block for weathering and recovering from crisis. Remarkably, there is strong consensus among experts regarding what works to get children into school and keep them there. Our School Report ranks governments on some of these measures– many of them relatively low cost – in order to deliver on the EFA goals.
There is widespread agreement that low-income countries with large education challenges need to spend at least 20% of budgets on education 44. Despite this, 28 countries in our analysis fall far short of allocating this amount. Countries such as Liberia and Chad are dramatically below target – contributing less than 10% of budgets. These countries and others are failing to deliver on the EFA targets because they persistently neglect to allocate sufficient funds to the education of their own citizens.
Other effective policy measures are eliminating the burden of school fees, investing in school meals and ensuring a supply of qualified, motivated teachers. All of these contribute not only to increasing access to education but also improving education quality, which is needed to keep children in school and ensure that they achieve meaningful learning outcomes during their time there. It is also therefore vital that governments pay greater attention to assessing the outcomes of education to better understand the impact of their reforms and investments. Our analysis shows that governments have not consistently used these key interventions, despite broad consensus on their impact. Many of the poorest countries in our analysis have resorted to meeting demand by employing unqualified teachers: Bangladesh, Honduras, Chad, Liberia and Mozambique all have less than 50% of their teachers fully trained. This remains the case despite increasing evidence that opting to use contract and unqualified teachers leads to a decline in education quality.
There is even poorer performance when it comes to ensuring that children who do attend school do not have to sit in the classroom with empty stomachs: our analysis revealed only two countries from within the poor world with appropriate coverage of school meal provision. Malnourishment and hunger lead to children getting less benefit from education, decreasing learning outcomes and increasing drop-out rates.
44 See Kagia, Bruns and Rakotomala (1999) for seminal analysis on this issue. Investment at this level is repeatedly recommended in international fora such as the EFA High-Level Group, FTI Partners’ meeting etc. 45 Gove A and Cvelich, P 2010 Early Reading – Igniting Education For All 46 Convention on the Rights of the Child, art 38; International Covenant on Economic, Social and Cultural Rights, art 13; Universal Declaration of Human Rights, art 26. 47 GCE 2010, Unpublished paper
The global inequality in learning outcomes has become a major concern to policy specialists in education, with numerous studies pointing to acute problems in this area across the developing world. Despite this, the issue of learning outcomes does not receive sufficient attention as a priority for policy-makers. Our research suggests that political interest in access to education is much greater than attention to the outcomes of education.
ArecentstudyfromtheEarlyGradeLearningCommunityofPractice 45 highlights the very poor results of reading assessments in a number of African and Asian countries. In Mali, over 80% of children assessed were found to be unable to read a single word even in their mother tongue, rising to over 90% for French – the language of instruction for most years of schooling. Inability to acquire reading skills means that the crucial building block in the educational process is lacking. This in turn leads to failure across the learning spectrum and contributes strongly to early drop-outs from school.
The study points to four factors contributing to the situation:
• Recruitment of untrained teachers, who are given little if any pedagogical support for teaching reading
• Insufficient instruction time spent on learning
• Lackoftextbooks
• Inappropriate languages of instruction in early years education
Workingwithcivilsocietygroups,theEGRAprojecthassucceededinraisingthisissueasamatterforpublicconcernandpoliticalactioninthecountriesconcerned. Their report calls for the EFA community to respond to this crisis of learning, and ensure that EFA truly does lead to learning for all.
Education For All = Learning for All?
Our report also benchmarks countries’ political commitment on the issue of fees in education. Despite almost universal acknowledgement that fees prevent children entering and staying in school, in sub-Saharan Africa families are giving an average of one-quarter of their incomes to education. 23 countries in our analysis still do not guarantee free primary Education For All, in direct contravention of UN human rights standards, which make free and compulsory primary education an immediate obligation for states. 46 Even in countries that do have a legal right to education, parents are regularly forced to pay informal fees or in some cases contribute to teacher pay. Recent research found that 40% of teachers in Cameroon are paid by families rather than the state. 47 As long as the basic right to a free education is denied, Education For All will not be worthy of its name.
12
Girls fare worst in the FIght for a decent life
Our final ranking is made up of indicators that assess girls’ chances of getting an education. It reveals how girls – especially those living in poor areas – are massively disadvantaged compared to boys. Girls’ enrolment in primary education has slowly inched towards parity: currently 53% of out-of-school children are girls compared with 60% in 2000. However, there remain several countries with significant gender gaps. One example of this is Pakistan, where 73% of boys enrol compared to only 57% of girls. 48 In addition, across most countries, once girls are in school they have a lower chance of completing primary education compared to boys. In Malawi, of those that enrol, 22.3% of boys complete primary compared to 13.8% of girls. 49 In Burundi the situation is similar, with 44.9% of boys that enrol completing primary compared to 27.3% of girls. 50 Following the completion of primary, girls are once again disadvantaged in the transition to secondary school. One example of this is Afghanistan, where just 15% of girls get to secondary school. The inequality is even starker in Chad, where just 7% of girls reach secondary school. Indeed, there is no country in Africa that sends more than 50% of its girls to secondary school.
The causes of this inequality are many, but early marriage and child labour are major contributing factors so both of these are included in our indicator table. These problems are acute again in Afghanistan and Chad, where 43% and 73% respectively of rural girls are married before the age of 18. A similar situation is seen across Pakistan and Bangladesh.
Ensuring gender equality in education was the only MDG that should have been achieved by 2005. This target has been missed by a mile and it is vital that international efforts are now channelled into ensuring that girls get the same opportunity as boys to receive access to a good quality education. The most important reason for this is that education is a human right, regardless of gender. However, there are many additional benefits both for the individual girls and their wider communities as demonstrated above.
Though the benefits of girls’ education are many, daunting obstacles prevent girls them from getting into the classroom, and then staying there throughout school. However, these barriers can be reduced through government action:
• Hire women teachers. The presence of a female teacher can help girls and parents feel more confident in sending their daughters to school. In addition to protecting girls from potential abuse, having female teachers provides girls with role models. 51 Increasing the number of female teachers has also been shown to increase enrolment. 52
• Prevent abuse. Sexual harassment and violence form major barriers to girls’ and young women’s access to education and their ability to benefit from it. They are powerful factors in influencing parents to keep girls out of school, for girls themselves avoiding school and for girls’ underperformance in the classroom. A recent campaign from Plan demonstrates the potential impact that raising awareness regarding violence in schools can have on enrolment levels. In Liberia, in the 100 schools where the campaign is running, average level of girls’ enrolment in 2008 was 47%, and after a year of the campaign this increased to 55%. 53
• Allow young mothers to come back to school. Girls who become pregnant are often prevented from going back to school after the birth of their child. There is need for policy change to re-admit girls, alongside challenging the stigma and associated bullying which also prevents girls from coming back to school. 54
• Build and equip more schools. In many rural regions, the most significant issue preventing girls from attending is simply one of distance between home and school. Many parents prevent girls from going to school because of fears for their safety. In Egypt in the 1980s constructing new schools in rural areas boosted girls’ enrolments by 60% and boys’ enrolments by 19%. 55
• While the report cards paint a bleak picture for many countries, there are some success stories. The box below highlights some countries that have made remarkable efforts to make progress on education since 2000, demonstrating what can be done with the right will and proper policy interventions.
48 49 50 GMR 201051 Herz and Sperling, 2004 p.67. What works in girls’ education – evidence and policies from the developing world. Council on foreign relations.52 Nilsson 2003. Education for All: Teacher Demand and Supply in Africa. Education International Working Paper No. 12. Brussels: Education International. 53 Additional information provided by Plan International54 Bernard 2002. Lessons and implications from girls’ education activities: a synthesis from evaluations’ Working Paper Series, UNICEF.55 Rugh, 2000. Starting now: strategies for helping girls complete primary.” SAGE Project. Washington, D.C.: Academy for Educational Development.
13
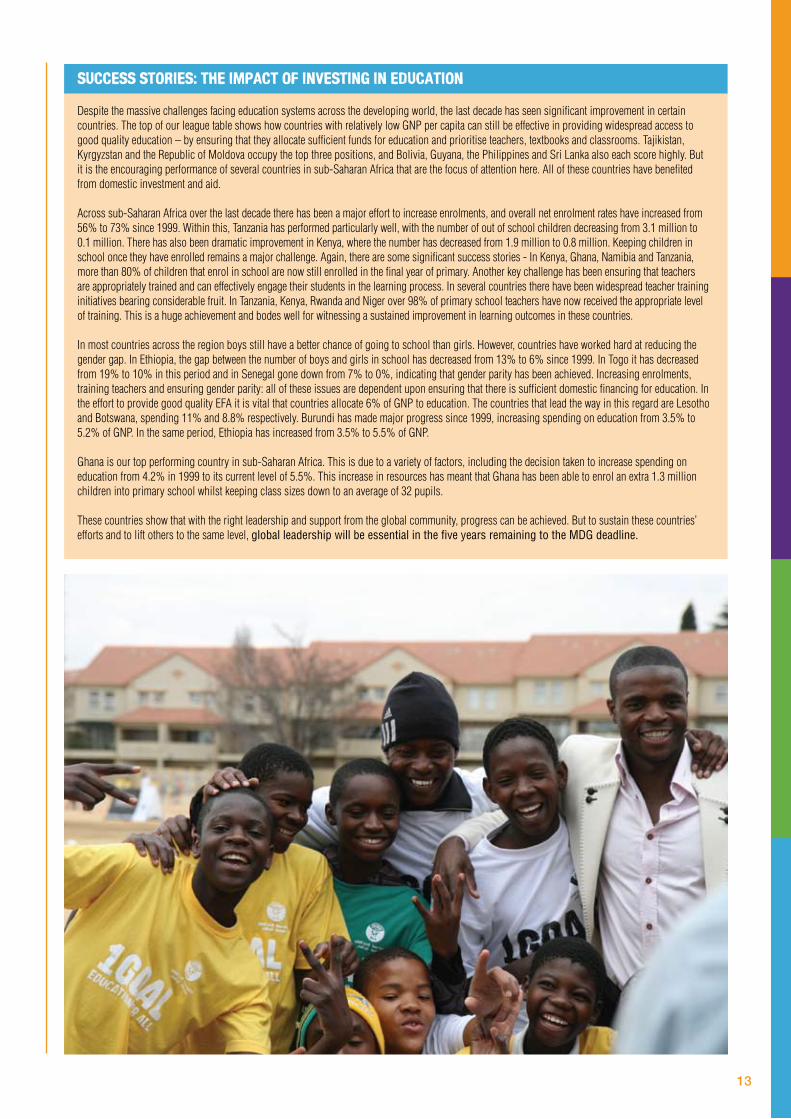
Despite the massive challenges facing education systems across the developing world, the last decade has seen significant improvement in certain countries.ThetopofourleaguetableshowshowcountrieswithrelativelylowGNPpercapitacanstillbeeffectiveinprovidingwidespreadaccesstogoodqualityeducation–byensuringthattheyallocatesufficientfundsforeducationandprioritiseteachers,textbooksandclassrooms.Tajikistan,KyrgyzstanandtheRepublicofMoldovaoccupythetopthreepositions,andBolivia,Guyana,thePhilippinesandSriLankaalsoeachscorehighly.Butit is the encouraging performance of several countries in sub-Saharan Africa that are the focus of attention here. All of these countries have benefited from domestic investment and aid.
Across sub-Saharan Africa over the last decade there has been a major effort to increase enrolments, and overall net enrolment rates have increased from 56% to 73% since 1999. Within this, Tanzania has performed particularly well, with the number of out of school children decreasing from 3.1 million to 0.1 million. There has also been dramatic improvement in Kenya, where the number has decreased from 1.9 million to 0.8 million. Keeping children in schooloncetheyhaveenrolledremainsamajorchallenge.Again,therearesomesignificantsuccessstories-InKenya,Ghana,NamibiaandTanzania,more than 80% of children that enrol in school are now still enrolled in the final year of primary. Another key challenge has been ensuring that teachers are appropriately trained and can effectively engage their students in the learning process. In several countries there have been widespread teacher training initiatives bearing considerable fruit. In Tanzania, Kenya, Rwanda and Niger over 98% of primary school teachers have now received the appropriate level of training. This is a huge achievement and bodes well for witnessing a sustained improvement in learning outcomes in these countries.
In most countries across the region boys still have a better chance of going to school than girls. However, countries have worked hard at reducing the gender gap. In Ethiopia, the gap between the number of boys and girls in school has decreased from 13% to 6% since 1999. In Togo it has decreased from 19% to 10% in this period and in Senegal gone down from 7% to 0%, indicating that gender parity has been achieved. Increasing enrolments, training teachers and ensuring gender parity: all of these issues are dependent upon ensuring that there is sufficient domestic financing for education. In theefforttoprovidegoodqualityEFAitisvitalthatcountriesallocate6%ofGNPtoeducation.ThecountriesthatleadthewayinthisregardareLesothoand Botswana, spending 11% and 8.8% respectively. Burundi has made major progress since 1999, increasing spending on education from 3.5% to 5.2%ofGNP.Inthesameperiod,Ethiopiahasincreasedfrom3.5%to5.5%ofGNP.
Ghanaisourtopperformingcountryinsub-SaharanAfrica.Thisisduetoavarietyoffactors,includingthedecisiontakentoincreasespendingoneducationfrom4.2%in1999toitscurrentlevelof5.5%.ThisincreaseinresourceshasmeantthatGhanahasbeenabletoenrolanextra1.3millionchildren into primary school whilst keeping class sizes down to an average of 32 pupils.
These countries show that with the right leadership and support from the global community, progress can be achieved. But to sustain these countries’ efforts and to lift others to the same level, global leadership will be essential in the five years remaining to the MDG deadline.
Success stories: the impact of investing in education

14
‘Failing fast’ on providing assistance for EFA: the Donor Report CardThe responsibility for achieving EFA rests primarily with national governments in poor countries. Indeed 80% of the funds that have contributed to the achievement of EFA have come from national resources. 56 However, there is a vital supporting role for the global community to play. In 2000 the global community made a unique promise that good plans on EFA would receive the funds they needed. Our analysis shows just how far the world is from sticking to this pledge.
Promises to keep: donors must meet past aid commitments
The amount of aid available for different sectors such as education depends largely on the political will in each rich country to mobilise funds for international development. In 1970 the UN agreed that rich countries should give 0.7% of Gross National Income (GNI) in Official Development Assistance (ODA). This commitment has been repeated frequently at international meetings throughout the last 40 years. However, just five countries are meeting this target and it is therefore no surprise that the UN estimates that the funding gap for achieving all eight Millennium Development Goals is between $40 and $60 billion per annum. 57
Playing fair means paying your share
In order to fulfil the pledge that poor countries should have enough funds to deliver their education plans, developed countries need to make the cash available to get every child a good quality education and ensure second chance learning for those who miss out. The Report Card ranks the efforts each donor country has made to provide their fair share of the $16 billion in external financing that is needed each year to secure EFA. The burden of filling this financing gap should be shared fairly between donor countries on the basis of their respective wealth. Currently this is far from being the case: Norway is in 1st place, donating 130% of their fair share, and at the other end it is the USA, which should be most embarrassed, donating only 16% of what is required of them. The miserly performance of the G8 nations plays a major part in holding back progress – some 87% of the gap is attributable to their failure to pay up.
A whole team effort works best
Since 2000, significant analysis has demonstrated that aid has most impact when it is co-ordinated behind government plans and priorities. Since it was established in 2002, the Fast Track Initiative (FTI) has established itself as the ideal instrument for improving donor co-ordination, but has failed to mobilise the intended level of funding. The primary reason for this has been donor reluctance to contribute to the initiative. Some 35 countries currently receive funds from FTI, which is currently in dire need of replenishment to reach a further 16 low-income countries as well as meeting the extended financing needs of countries that are currently part of the initiative. The FTI has a few strong supporters, with Ireland, Netherlands, Spain and the United Kingdom all giving well above their fair share of contributions. Disappointingly, many countries score very poorly on this indicator. Canada, New Zealand and the USA are at the bottom, with none of them having recently contributed anything to the FTI pooled funding.
Currently undergoing a rigorous and far-reaching reform effort to address issues identified through an independent evaluation, FTI could deliver enormous benefits to countries in future, if provided with enough backing by donors.
Levelling the playing FIeld: focusing aid on the neediest countries
Globally, far more aid for basic education goes to middle-income countries with less significant education challenges, and neglects low-income countries and especially fragile states. Our Report Card also focuses on the aid that each country gives to the poorest countries and to those where there is the starkest gender disparity in primary enrolment rates. This is important because lots of donors fail to allocate aid to the countries that are in most urgent need. Countries that perform badly here are those that allow their aid to be influenced by political, cultural, historical, and military factors. When it comes to giving aid to the poorest countries, Spain and Germany are particularly poor performers, with only 20% and 24% of their respective aid budgets going to the countries that are most in need.
We also rank the donors according to the proportion of their aid which goes to countries where girls fare worst compared to boys. Denmark is our strongest country, with 70% of their aid going to countries where girls are most excluded from education. That this indicator shows more F grades than on any other ‘subject’ is especially disappointing as it demonstrates how many donors still use aid to education as a tool to meet their own national objectives rather than provide assistance where it is most needed.
56 Education Fast Track, 2008: Annual Report57 World Bank, no date. http://www.worldbank.org/html/extdr/mdgassessment.pdf

15
In2008,totalGermanaidtoeducationwas$1.65billion–makingGermanythesecondbiggestnationaleducationdonorintheworld.However,asalways‘thedevilisinthedetail’.Initsaidreporting,theGermangovernmentincludesgovernmentspendingonuniversitysubsidiesthataredirectedtoforeignstudentscomingtostudyfromdevelopingcountries–thisiscalledimputedstudentcosts.HighereducationinGermanyisheavilysubsidisedfor all students so including this serves to enormously boost their aid figures. The funds do not go to students directly, but to the universities themselves. ThevastmajorityofthesubsidizedstudentsarefromtheeliteindevelopingcountrieswhohavetheinitialfinancialresourcestostudyinGermanyandafford the living costs.
Of the total $1.65 billion in German aid to education in 2008, $927 million went on imputed student costs, amounting to 56% of the total. Within sub-Saharan Africa, German aid to education was $224 million and 45% of this total was spent on imputed student costs.
Germanyisnottheonlydonorculprithere,asFrancealsousesthesameflawedsystemforreportinglevelsofaidtoeducation.Frenchreportedaidtoeducation was $1.7 billion in 2008, making them the biggest national education donor in the world. However, of this, $919 million went on imputed student costs, amounting to 54% of the total.
TheGlobalCampaignforEducationiscallingforthereformofaccountingprocessesforlevelsofaidtoeducation.Imputedstudentcostsshouldnotbeallowed to be reported as aid to education, as including them provides a distorted picture of how much money actually gets to the recipient countries. Imputed student costs do not contribute in any way to the accomplishment of the EFA goals – they do not provide teacher training, new classrooms or educational resources for those that need them most.
Smoke and mirrors in aid reporting
Quality counts – aid should fund the core running costs of education
While it is important that there is enough aid going to the right places, the quality of aid plays an important role. Put simply, the aid available could be made to work better if it was available to be spent on teachers, books and schools, rather than expensive consultancies or overpriced goods and services in the donating country. The Netherlands are the top donor in this regard, with Norway, United Kingdom, Switzerland and Ireland each also providing a good example for other donors follow. Greece is the worst donor here, but it is the performance of Germany that is particularly concerning: 81% of their aid to education is tied, only 1.1% is given as budget support, and 74% is in the form of technical assistance. This suggests that aid to education is being spent on highly paid consultants, often from the donor country, rather than directly assisting in providing EFA. Germany is not the only culprit: over 50% of aid to basic education from the USA, Belgium, Portugal and France is also spent on technical assistance.
French aid to basic education in sub-Saharan Africa is $131.9 million per year. There are 122 million children of primary school age in sub-Saharan Africa, so this figure equates to $1.08 of aid to basic education per year, per child of primary school age. When considering how this figure is split up, it becomes clear that French aid to basic education is not determined by where the most urgent need is, but by where the money will best serve their strategicpoliticalaspirations.ThisiswelldemonstratedthroughtheexampleofMayotte.
In 2009, Mayotte voted to become the fifth overseas department of France, meaning that it has the same status as its better-known neighbour, Reunion. Mayotte isoneofthefourislandsthatcomprisetheComorosarchipelagoandhasapopulationof231,000.TheislandisclaimedbyComorosandtheAfricanUnionagrees that the nature of French involvement is illegal. Despite this, the people of Mayotte are overwhelmingly in support of their status as a French department. The island economy benefits greatly from French financial assistance and ensures that it remains much wealthier than surrounding islands. 58
Of the $131.9 million of aid to basic education per year from France to sub-Saharan Africa, $68.6 million goes to Mayotte. This is 52% of the total. If this is calculated per child then every primary school aged child in Mayotte receives $1099 per year from France, whilst every other child in the region receives $0.53 per year. 59 This means that Mayotte receives more than 2000 times as much aid per child as the rest of sub-Saharan Africa.
This aid money does not contribute to efforts to provide an education for the 33 million children across the region who cannot go to school. It does not finance the building of schools and training of teachers. Instead, it bypasses the poorest and forms a political tool of the French government, providing money to a middle-income overseas department of strategic, geopolitical, national self-interest.
French aid to basic education – bypassing the poorest and serving national self interest
The stark failure of the rich world to fulfil their side of the EFA bargain means that there are numerous poor countries making valiant efforts to overcome huge education challenges whilst desperately short of the financial resources required to do so. 15 countries in Africa and Asia facing huge education deficits are already spending at or near the recommended 20% of budgets on education. Many of them have abolished fees and made additional efforts to bring children to school. Now squeezed by the economic crisis, they will be unable to make further progress and may see their gains roll back unless donors step up to the mark.
58 GDP per capita $4,90059 122 million children of primary school age in SSA, an estimated 62,400 children of primary school age in Mayotte.

16
The World Bank
The World Bank continues as a crucial source of financing for education, disbursing $3.4 billion in 2009. However, this aid is disbursed through a myriad of channels and distributed across regions and countries in a pattern that does not uphold the commitment to EFA or the focus on low-income countries. Almost $1.5 billion of the $3.4 billion was in the form of education lending held in larger multi-sector operations designed and managed outside the World Bank’s Education Sector Board, often without the expertise of World Bank education staff or Ministries of Education. In disbursements of International Development Association (IDA) funds – the most concessional lending the World Bank has made available over the past decade, $4.2 billion went to just three countries: India, Pakistan, and Bangladesh. The remaining $4.1 billion was distributed amongst the 76 other IDA-eligible countries. Overall levels of IDA funding for education in low-income countries have fallen by 40% over the past decade, contrary to the stated goal of focusing education financing efforts on the world’s poorest countries. In addition, this undermines the stated goal of “additionality” of FTI funding, as the IDA funds the FTI grants would be adding to have moved away from the education sector. 60
In addition, World Bank conditionality and procurement policies have contributed to the significant delays in disbursements by FTI. Even after a low-income country was approved for FTI funding and its education sector plan was agreed to, ‘the money would not be dispatched sometimes for up to 18 months afterwards as countries were forced to comply with complex procurement and conditionality requirements, spending precious time fulfilling paperwork requirements rather than investing in their education sectors. While the situation has improved markedly recently, the experience has led to an advocacy effort to promote greater independence of the FTI from the World Bank.
International Monetary Fund (IMF)
The IMF will be the first to state it is not doing anything to impact upon EFA as it is not a development organization and focuses its activities solely on assisting countries to achieve its definition of ‘macroeconomic stability’. 61 However, the macroeconomic conditionality the IMF imposes on countries to achieve this stability has detrimental effect on countries’ abilities to allocate the sufficient funds to education, and to plan and rely upon long-term financing to hire, train and retain the professional teaching forces that desperately need to be re-built after three decades of neo-liberal economic policies.
The following specific IMF indicators undermine EFA achievement:
Low single-digit inflation rates: the IMF views additional money allocated as wages to be a source of upward pressure on inflation, which they insist must be held at single-digit levels. Even additional aid flows have at times been viewed by the IMF as upward pressure on inflation rates.
No-to-low deficit spending targets: Fiscal policy tools, especially large infusions of money into the economy from government coffers or government borrowing, are seen by the IMF as disruptive to the smooth functioning of a ‘free market’.
The stimulus packages that many rich countries adopted when their economies contracted in the current financial crisis were denied to the vast majority of low income countries due to this orthodoxy imposed by the IMF. While short-term deficit spending was observed in some LICs, IMF programming documents forecast strong reductions in deficit spending and this has also been accompanied by pressure for countries to reduce their wage bills. In Jamaica, there is evidence that the IMF exerted pressure for the Government of Jamaica to violate terms of wage negotiations agreed with the Jamaica Teachers Union. 62
Alongside this, the IMF also promotes high interest rates and high levels of foreign reserves in Central Banks. This has been shown by the IMF’s own Internal Evaluation Office to disrupt the flow of aid intended for education, as funds are instead re-directed to Central Bank vaults by borrowing governments striving to comply with this condition of IMF lending. 63
60 http://www.results.org/uploads/files/EFA%20Report.pdf)61 Rowden, 2009. The Deadly Ideas of Neoliberalism: How the IMF has Undermined Public Health and the Fight Against AIDS, London: Zed Books62 http://www.jamaicaobserver.com/news/US-educator-backs-JTA-in-salary-row_788304363 http://www.imf.org/external/np/ieo/2007/ssa/eng/pdf/report.pdf
A new instrument that bears much promise for generating additional resources for public good generally and education specifically is the Financial Transaction Tax(FTT).Thisreferstoinstrumentsgeneratingrevenueforeachfinancialtransaction,althoughthemechanismdiffersfromcountrytocountry.IntheUK,the‘RobinHoodTax’hasgainedprominenceinrecentpresscoverage;intheUSA,legislationtoenactaCurrencyTransactionLevyhasbeenintroduced,and60statesfromvariousEuropean&G20countrieshaveagreedtopromoteanFTTattheupcomingUNMDGSummit.TheFTTisafinancialinnovationthataims to redress the disproportionate power the financial sector has in the global economy, by generating revenue through each transaction made. In this way, the FTT primarily affects those entities (large trading firms) that are carrying out the bulk of financial transactions and serves as a risk management tool, as banksthatwishtoavoidthetaxcansimplychoosenottocarryoutthetargetedtransactions.ArecentOp-EdpennedbyBernardKouchner(foreignministerofFrance), Katsuya Okada (foreign minister of Japan) and Charles Michel (development cooperation minister of Belgium) estimates that a levy of five cents for each$1,000exchangedcouldbringinmorethan$30billionperyeartocontributetowardsglobaldevelopmentfinance. 65
Financial Transaction Tax (FTT)
17
Countdown to 2015: Making EFA a realityOur report reveals just how far we are from the distant dream of a full and life-enhancing education for all people. While the benefits of education could not be more apparent, it still receives too little political priority on the national and global development agenda. In too many of the countries which need investment and attention to education the most, governments neglect their obligations and fail to take the steps needed to secure education for their people. In other places, governments have made remarkable efforts but have been left high and dry by the rich countries that have abandoned or sidelined their commitments.
Education must take centre-stage in the effort to drive sustainable and equitable recovery from the global financial and economic crises. A massive reinvigoration of effort at national level, together with investment, innovation and co-ordination in global initiatives is needed to ensure that the world does not falter on the road to ensuring that every person can benefit from the light and hope that education offers.
Recommendations Poor countries should:
1. Be vocal and passionate advocates of investment in education on the global stage.
2. Put a minimum of 20% of their budgets into education, half for primary schooling.
3. End all school related fees and charges that prevent families sending children to school.
4. Help girls and marginalized groups into school, with special programmes such as school health and nutrition and stipends.
5. Train and recruit all the teachers needed to achieve EFA, and ensure quality teaching and learning that meets the diverse needs of students, alongside appropriate assessment of learning outcomes.
6. Encourage civil society participation and democratic control in education governance and budgeting, to strengthen accountability between citizens and the state
Rich countries should:
1. Immediately prepare a step-up plan for reaching their fair share of the funding needed for EFA. Aid to basic education should double from $4 billion to $8 billion per year immediately, and increase incrementally to $16 billion per year by 2014.
2. Make aid available for the core running costs of education – teachers, books and schools – and end the deceptive practice of reporting imputed student costs and aid to overseas territories into the global total.
3. Back global plans and initiatives to ensure resources and results:
• At the G20, agree a global financial transaction tax of at least $400 billion per year, with $100 billion of this for development aid, including education.
• Back a reformed FTI and ensure that its replenishment target of $2 billion for 2010 is met immediately.
• Explore other innovative approaches to raising and disbursing funds for education.
4. Target aid to countries facing the greatest challenges, including those suffering war and conflict, and where girls are most severely disadvantaged.
5. Require the IMF and World Bank to pursue ‘pro-education’ policies:
• The World Bank should agree a matched funding formula for assisting FTI-endorsed countries, combining its resources with FTI grants under a single stream, in the form of grants rather than loans.
• The IMF should relax macro-economic conditions such as low inflation and deficit targets to allow for counter-cyclical investment in education up to 2015.
It is clear that the international community is far from living up to its own commitment to a ‘global compact’ on education. More aid, better allocated and spent, can make a real difference to countries struggling to extend opportunity to all. The international institutions must play their part, aligning policies to ensure they support, rather than undermine, investment in education. And innovation in education financing could have a strong role, especially if it generates large volumes of recurrent funds such as the Financial Transaction Tax.

18
APPENDIX: 1 School REportdata tables
19
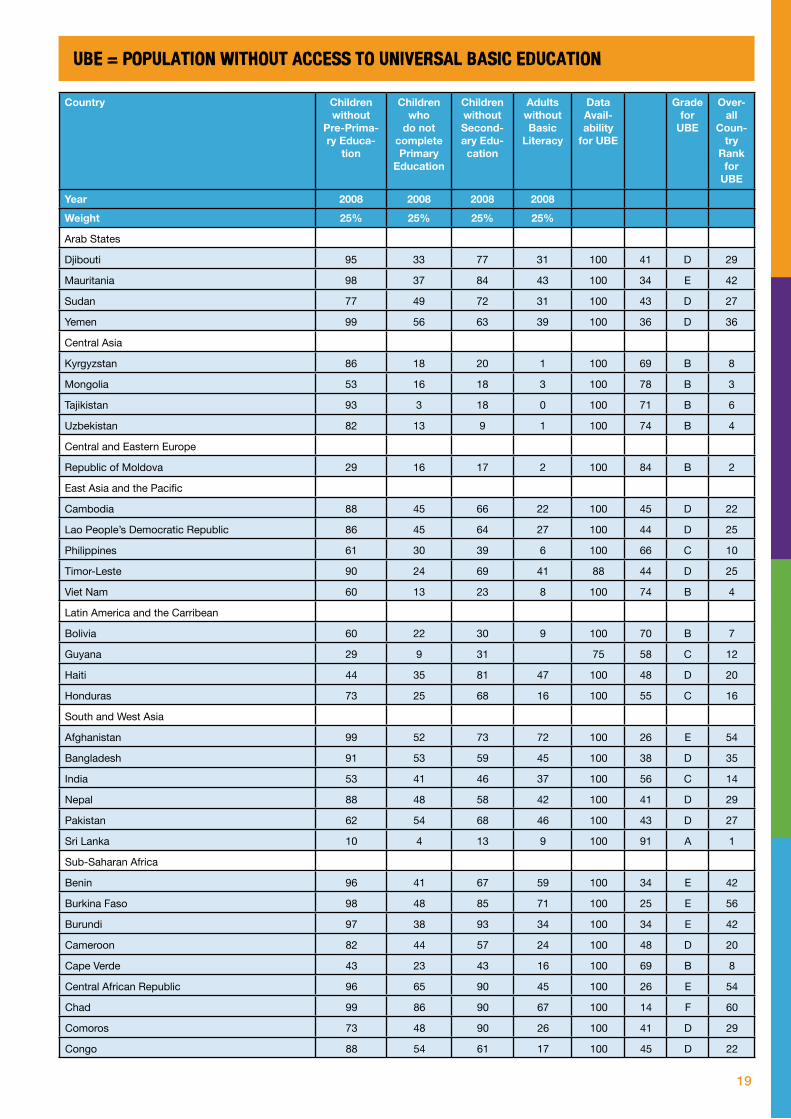
UBE = Population without access to Universal Basic Education
Country Children without
Pre-Prima-ry Educa-
tion
Children who
do not complete Primary
Education
Children without Second-ary Edu-cation
Adults without Basic
Literacy
Data Avail-ability
for UBE
Grade for
UBE
Over-all
Coun-try
Rank for
UBE
Year 2008 2008 2008 2008
Weight 25% 25% 25% 25%
Arab States
Djibouti 95 33 77 31 100 41 D 29
Mauritania 98 37 84 43 100 34 E 42
Sudan 77 49 72 31 100 43 D 27
Yemen 99 56 63 39 100 36 D 36
Central Asia
Kyrgyzstan 86 18 20 1 100 69 B 8
Mongolia 53 16 18 3 100 78 B 3
Tajikistan 93 3 18 0 100 71 B 6
Uzbekistan 82 13 9 1 100 74 B 4
Central and Eastern Europe
Republic of Moldova 29 16 17 2 100 84 B 2
East Asia and the Pacific
Cambodia 88 45 66 22 100 45 D 22
Lao People’s Democratic Republic 86 45 64 27 100 44 D 25
Philippines 61 30 39 6 100 66 C 10
Timor-Leste 90 24 69 41 88 44 D 25
Viet Nam 60 13 23 8 100 74 B 4
Latin America and the Carribean
Bolivia 60 22 30 9 100 70 B 7
Guyana 29 9 31 75 58 C 12
Haiti 44 35 81 47 100 48 D 20
Honduras 73 25 68 16 100 55 C 16
South and West Asia
Afghanistan 99 52 73 72 100 26 E 54
Bangladesh 91 53 59 45 100 38 D 35
India 53 41 46 37 100 56 C 14
Nepal 88 48 58 42 100 41 D 29
Pakistan 62 54 68 46 100 43 D 27
Sri Lanka 10 4 13 9 100 91 A 1
Sub-Saharan Africa
Benin 96 41 67 59 100 34 E 42
Burkina Faso 98 48 85 71 100 25 E 56
Burundi 97 38 93 34 100 34 E 42
Cameroon 82 44 57 24 100 48 D 20
Cape Verde 43 23 43 16 100 69 B 8
Central African Republic 96 65 90 45 100 26 E 54
Chad 99 86 90 67 100 14 F 60
Comoros 73 48 90 26 100 41 D 29
Congo 88 54 61 17 100 45 D 22

20
Country Children without
Pre-Prima-ry Educa-
tion
Children who
do not complete Primary
Education
Children without Second-ary Edu-cation
Adults without Basic
Literacy
Data Avail-ability
for UBE
Grade for
UBE
Over-all
Coun-try
Rank for
UBE
Year 2008 2008 2008 2008
Weight 25% 25% 25% 25%
Côte d’Ivoire 97 42 73 45 100 36 D 36
Democratic Rep. of the Congo 99 51 72 33 100 36 D 36
Eritrea 91 71 74 35 100 32 E 47
Ethiopia 97 63 88 64 100 22 E 57
Gambia 81 51 58 55 100 39 D 34
Ghana 51 54 53 34 100 52 C 17
Guinea 91 50 72 62 100 31 E 48
Guinea-Bissau 97 47 93 49 88 29 E 51
Kenya 74 32 51 14 100 57 C 13
Lesotho 78 55 75 11 100 45 D 22
Liberia 80 60 81 42 88 35 D 41
Madagascar 91 58 76 29 100 36 D 36
Malawi 61 75 27 75 34 E 42
Mali 96 37 71 74 100 30 E 50
Mozambique 99 52 94 46 100 27 E 52
Niger 98 59 91 71 100 20 E 58
Nigeria 88 54 74 40 100 36 D 36
Rwanda 97 70 95 30 100 27 E 52
Sao Tome and Principe 63 24 62 12 100 60 C 11
Senegal 93 48 75 58 100 31 E 48
Sierra Leone 96 31 75 60 88 34 E 42
Somalia 80 93 62 75 16 F 59
Togo 93 49 62 35 100 40 D 33
Uganda 90 43 78 25 100 41 D 29
United Republic of Tanzania 66 13 92 27 100 50 D 18
Zambia 98 14 57 29 100 50 D 18
Zimbabwe 61 44 62 9 100 56 C 14
Grading Scale
A : 86 - 100 1
B : 69 - 85 8
C : 52 - 68 8
D : 35 - 51 24
E : 18 - 34 17
F : 0 - 17 2
UBE = Population without access to Universal Basic Education (CONT.)

21
Country Legal Guarantees to Free Education
Public expenditure on education (percent of total government
expenditure)
Free School Meals
Data Avail-ability for PW
Marks for PW
Grade for PW
Overall Country Rank for PW
Year 2006 2007-8 2006 100 A-FWeight 33% 33% 33%Arab StatesDjibouti Yes 25 High 100 97 A 1Mauritania Yes 16 Medium 100 79 B 5Sudan Yes 8 Negligible 100 50 D 36Yemen Yes 16 Negligible 100 63 C 21Central AsiaKyrgyzstan Yes 26 Low 100 77 B 6Mongolia Yes N.A. High 67 63 C 21Tajikistan Yes 19 Medium 100 85 B 3Uzbekistan Yes N.A. Negligible 67 37 D 44Central and Eastern EuropeRepublic of Moldova Yes 21 Low 100 77 B 6East Asia and the PacificCambodia Yes 12 Low 100 64 C 19Lao People’s Democratic Republic
Yes 12 Low 100 64 C 19
Philippines Yes 15 Low 100 68 C 17Timor-Leste Yes 7 Low 100 56 C 32Viet Nam Yes 20 No 100 60 C 28Latin America and CarribeanBolivia Yes 18 Low 100 69 B 15Guyana Yes 12 Medium 100 76 B 9Haiti No 9 Negligible 100 18 E 56Honduras No 32 High 100 63 C 21South and West AsiaAfghanistan Yes 13 No 100 54 C 33Bangladesh Yes 14 No 100 57 C 30India Yes 11 High 100 81 B 4Nepal Yes 19 No 100 65 C 18Pakistan No 11 Low 100 29 E 52Sri Lanka Yes 17 Low 100 69 B 15Sub-Saharan AfricaBenin No 16 Negligible 100 30 E 50Burkina Faso No 22 Negligible 100 37 D 44Burundi No 22 Low 100 43 D 39Cameroon No 15 Negligible 100 28 E 53Cape Verde No 17 Medium 100 48 D 37Central African Republic Yes 12 Low 100 63 C 21Chad Yes 10 Low 100 60 C 28Comoros No N.A. No 67 0 F 60Congo Yes 8 Low 100 57 C 30
PW = Political Will for Education
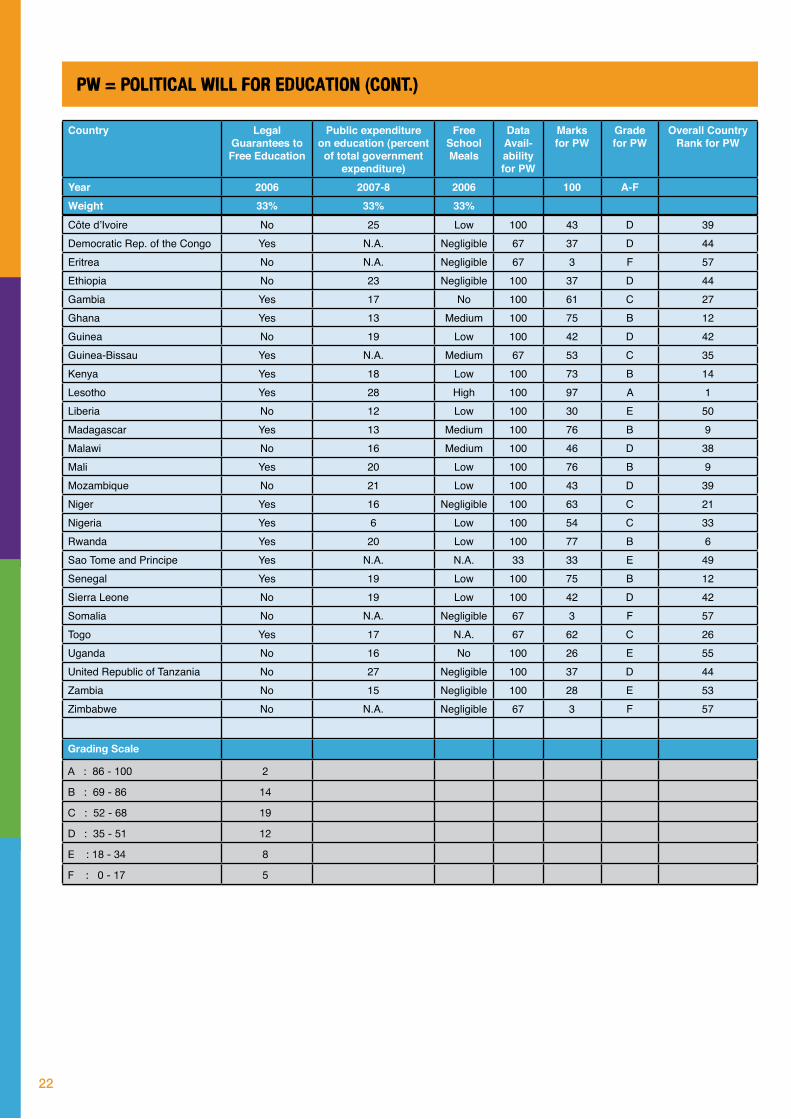
22
Côte d’Ivoire No 25 Low 100 43 D 39Democratic Rep. of the Congo Yes N.A. Negligible 67 37 D 44Eritrea No N.A. Negligible 67 3 F 57Ethiopia No 23 Negligible 100 37 D 44Gambia Yes 17 No 100 61 C 27Ghana Yes 13 Medium 100 75 B 12Guinea No 19 Low 100 42 D 42Guinea-Bissau Yes N.A. Medium 67 53 C 35Kenya Yes 18 Low 100 73 B 14Lesotho Yes 28 High 100 97 A 1Liberia No 12 Low 100 30 E 50Madagascar Yes 13 Medium 100 76 B 9Malawi No 16 Medium 100 46 D 38Mali Yes 20 Low 100 76 B 9Mozambique No 21 Low 100 43 D 39Niger Yes 16 Negligible 100 63 C 21Nigeria Yes 6 Low 100 54 C 33Rwanda Yes 20 Low 100 77 B 6Sao Tome and Principe Yes N.A. N.A. 33 33 E 49Senegal Yes 19 Low 100 75 B 12Sierra Leone No 19 Low 100 42 D 42Somalia No N.A. Negligible 67 3 F 57Togo Yes 17 N.A. 67 62 C 26Uganda No 16 No 100 26 E 55United Republic of Tanzania No 27 Negligible 100 37 D 44Zambia No 15 Negligible 100 28 E 53Zimbabwe No N.A. Negligible 67 3 F 57
Grading Scale
A : 86 - 100 2
B : 69 - 86 14
C : 52 - 68 19
D : 35 - 51 12
E : 18 - 34 8
F : 0 - 17 5
PW = Political Will for Education (CONT.)
Country Legal Guarantees to Free Education
Public expenditure on education (percent of total government
expenditure)
Free School Meals
Data Avail-ability for PW
Marks for PW
Grade for PW
Overall Country Rank for PW
Year 2006 2007-8 2006 100 A-FWeight 33% 33% 33%
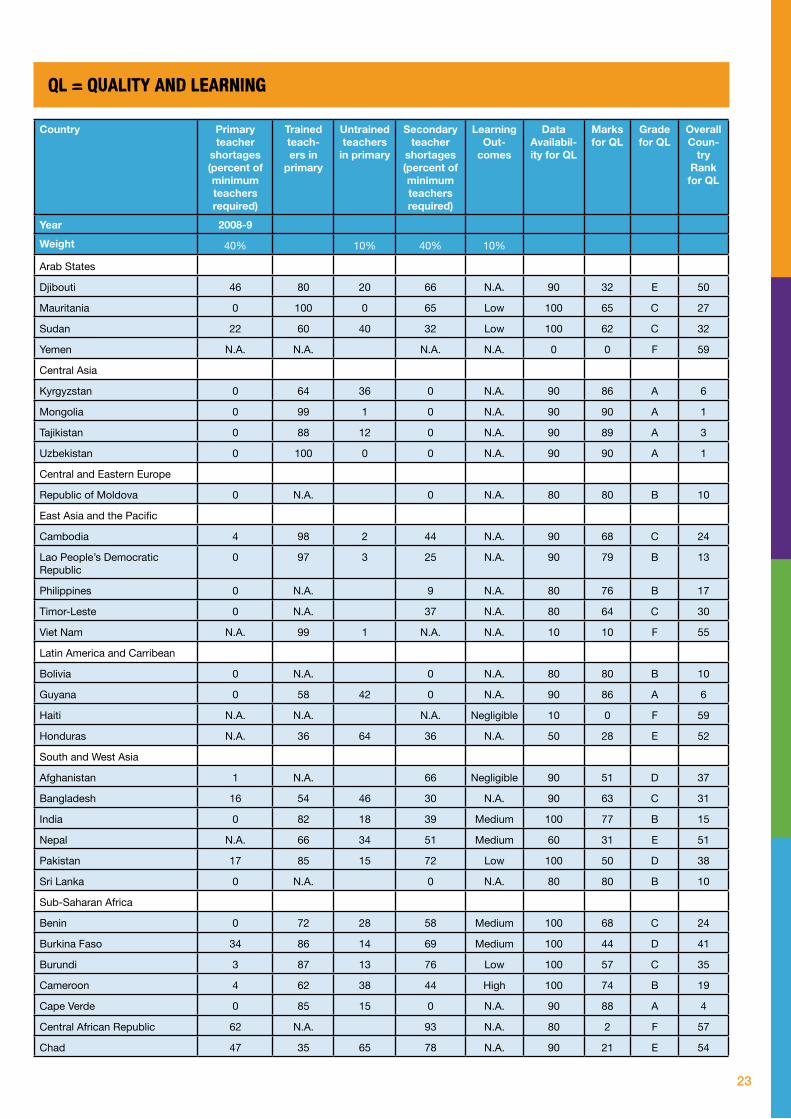
23
Country Primary teacher
shortages (percent of minimum teachers required)
Trained teach-ers in
primary
Untrained teachers
in primary
Secondary teacher
shortages (percent of minimum teachers required)
Learning Out-
comes
Data Availabil-ity for QL
Marks for QL
Grade for QL
Overall Coun-
try Rank for QL
Year 2008-9
Weight 40% 10% 40% 10%
Arab States
Djibouti 46 80 20 66 N.A. 90 32 E 50
Mauritania 0 100 0 65 Low 100 65 C 27
Sudan 22 60 40 32 Low 100 62 C 32
Yemen N.A. N.A. N.A. N.A. 0 0 F 59
Central Asia
Kyrgyzstan 0 64 36 0 N.A. 90 86 A 6
Mongolia 0 99 1 0 N.A. 90 90 A 1
Tajikistan 0 88 12 0 N.A. 90 89 A 3
Uzbekistan 0 100 0 0 N.A. 90 90 A 1
Central and Eastern Europe
Republic of Moldova 0 N.A. 0 N.A. 80 80 B 10
East Asia and the Pacific
Cambodia 4 98 2 44 N.A. 90 68 C 24
Lao People’s Democratic Republic
0 97 3 25 N.A. 90 79 B 13
Philippines 0 N.A. 9 N.A. 80 76 B 17
Timor-Leste 0 N.A. 37 N.A. 80 64 C 30
Viet Nam N.A. 99 1 N.A. N.A. 10 10 F 55
Latin America and Carribean
Bolivia 0 N.A. 0 N.A. 80 80 B 10
Guyana 0 58 42 0 N.A. 90 86 A 6
Haiti N.A. N.A. N.A. Negligible 10 0 F 59
Honduras N.A. 36 64 36 N.A. 50 28 E 52
South and West Asia
Afghanistan 1 N.A. 66 Negligible 90 51 D 37
Bangladesh 16 54 46 30 N.A. 90 63 C 31
India 0 82 18 39 Medium 100 77 B 15
Nepal N.A. 66 34 51 Medium 60 31 E 51
Pakistan 17 85 15 72 Low 100 50 D 38
Sri Lanka 0 N.A. 0 N.A. 80 80 B 10
Sub-Saharan Africa
Benin 0 72 28 58 Medium 100 68 C 24
Burkina Faso 34 86 14 69 Medium 100 44 D 41
Burundi 3 87 13 76 Low 100 57 C 35
Cameroon 4 62 38 44 High 100 74 B 19
Cape Verde 0 85 15 0 N.A. 90 88 A 4
Central African Republic 62 N.A. 93 N.A. 80 2 F 57
Chad 47 35 65 78 N.A. 90 21 E 54
QL = Quality and Learning

24
Comoros 0 57 43 0 N.A. 90 86 A 6
Congo 12 89 11 52 Medium 100 65 C 27
Côte d’Ivoire 29 100 0 N.A. Medium 60 38 D 47
Democratic Rep. of the Congo 7 93 7 19 Negligible 100 77 B 15
Eritrea 56 89 11 73 N.A. 90 24 E 53
Ethiopia 34 90 10 72 Low 100 40 D 46
Gambia 0 N.A. 19 Medium 90 78 B 14
Ghana 0 49 51 0 Low 100 88 A 4
Guinea 0 82 18 58 High 100 72 B 20
Guinea-Bissau 18 N.A. 65 N.A. 80 41 D 45
Kenya 27 98 2 23 Medium 100 70 B 21
Lesotho 0 71 29 6 Negligible 100 85 B 9
Liberia 27 40 60 2 N.A. 90 67 C 26
Madagascar 66 52 48 84 N.A. 90 9 F 56
Malawi 0 N.A. N.A. Low 50 43 D 43
Mali 19 50 50 42 Low 100 59 C 33
Mozambique 29 67 33 76 N.A. 90 37 D 49
Niger 32 98 2 83 Low 100 38 D 47
Nigeria 21 51 49 59 Low 100 50 D 38
Rwanda 11 94 6 63 N.A. 90 56 C 36
Sao Tome and Principe 0 48 52 20 N.A. 90 76 B 17
Senegal 8 N.A. 91 Medium 90 42 D 44
Sierra Leone 0 49 51 45 Low 100 69 B 22
Somalia 64 N.A. N.A. N.A. 40 1 F 58
Togo 0 15 85 55 N.A. 90 58 C 34
Uganda 4 89 11 48 Low 100 69 B 22
United Republic of Tanzania 16 100 0 N.A. Low 60 44 D 41
Zambia 21 N.A. 20 Medium 90 65 C 27
Zimbabwe 0 N.A. N.A. Medium 50 46 D 40
Grading Scale
A : 86 - 100 8
B : 69 - 85 15
C : 52 - 68 13
D : 35 - 51 13
E : 18 - 34 5
F : 0 - 17 6
QL = Quality and Learning (CONT.)
Country Primary teacher
shortages (percent of minimum teachers required)
Trained teach-ers in
primary
Untrained teachers
in primary
Secondary teacher
shortages (percent of minimum teachers required)
Learning Out-
comes
Data Availabil-ity for QL
Marks for QL
Grade for QL
Overall Coun-
try Rank for QL
Year 2008-9
Weight 40% 10% 40% 10%

25
Years in School Out of School Vulnerable Girls
Country 20 percent richest urban boys
20 per-cent poor-est
rural girls
Girls enroled in sec-ondary educa-
tion
Girls not in sec-ondary schools
Child labourers
(< 14 years)
Married in rural areas (< 18
years)
Marks for
mar-ried girls
Data Avail-ability for OE
Marks for EO
Over-all
Coun-try
Rank for EO
Year 2005-2008
2005-2009
2000-2008 2000-2008
Weight 15% 55% 15% 15%
Arab States
Djibouti N.A. N.A. 18 82 8 13 74 85 34 E 22
Mauritania N.A. N.A. 15 85 15 44 12 85 21 E 44
Sudan N.A. N.A. 22 78 12 40 20 85 27 E 34
Yemen 10 1 26 74 24 35 30 100 29 E 32
Central Asia
Kyrgyzstan 11 10 81 19 3 14 72 100 84 B 1
Mongolia 11 5 85 15 17 12 76 100 78 B 2
Tajikistan 11 9 77 23 13 11 78 100 78 B 2
Uzbekistan N.A. N.A. 90 10 N.A. 7 86 70 62 C 6
Central and Eastern Europe
Republic of Moldova N.A. N.A. 85 15 33 22 56 85 60 C 7
East and the Pacific
Cambodia 9 3 32 68 45 25 50 100 33 E 24
Lao People’s Democratic Republic
9 4 33 67 13 N.A. 85 38 D 19
Philippines 11 7 66 34 11 22 56 100 68 C 5
Timor-Leste N.A. N.A. 33 67 4 N.A. 70 32 E 27
Viet Nam 11 5 78 22 16 13 74 100 74 B 4
Latin America
Bolivia 12 6 70 30 22 37 26 100 60 C 7
Guyana N.A. N.A. 73 27 16 22 56 85 59 C 9
Haiti 9 3 21 79 19 33 34 100 33 E 24
Honduras 11 4 36 64 15 46 8 100 40 D 17
South and West Asia
Afghanistan N.A. N.A. 15 85 33 43 14 85 15 F 51
Bangladesh 8 4 43 57 8 69 0 100 45 D 12
India 11 3 49 51 12 56 0 100 45 D 12
Nepal 9 2 38 62 33 54 0 100 32 E 27
Pakistan 9 1 28 72 N.A. 24 52 85 26 E 37
Sri Lanka N.A. N.A. N.A. 7 12 76 30 24 E 38
Sub-Saharan Africa
Benin 9 1 27 73 45 47 6 100 20 E 46
Burkina Faso 7 0 13 87 48 61 0 100 10 F 58
Burundi 7 2 6 94 18 19 62 100 29 E 32
Cameroon 9 3 42 58 30 57 0 100 36 D 20
Cape Verde N.A. N.A. N.A. 3 N.A. 15 14 F 54
EO= Equal Opportunities for education

26
Central African Republic 2 0 8 92 49 64 0 100 6 F 59
Chad 8 1 7 93 51 73 0 100 6 F 59
Comoros N.A. N.A. 11 89 28 N.A. 70 13 F 55
Congo N.A. N.A. 40 60 25 40 20 85 33 E 24
Côte d’Ivoire 9 5 22 78 34 43 14 100 30 E 29
Democratic Rep. of the Congo
8 1 25 75 34 45 10 100 24 E 38
Eritrea N.A. N.A. 22 78 N.A. 60 0 70 12 F 56
Ethiopia 9 1 20 80 46 55 0 100 15 F 51
Gambia 9 2 41 59 29 45 10 100 35 D 21
Ghana 10 3 45 55 34 28 44 100 43 D 15
Guinea 7 0 21 79 24 75 0 100 21 E 44
Guinea-Bissau 7 1 7 93 37 32 36 100 16 F 50
Kenya 10 5 48 52 25 27 46 100 51 D 10
Lesotho 10 3 31 69 21 26 48 100 40 D 17
Liberia 7 2 18 82 21 49 2 100 24 E 38
Madagascar 10 2 24 76 28 42 16 100 27 E 34
Malawi 9 5 24 76 26 53 0 100 30 E 29
Mali 7 0 22 78 33 77 0 100 19 E 47
Mozambique 5 1 6 94 24 60 0 100 17 F 49
Niger 6 0 37 63 43 84 0 100 24 E 38
Nigeria 10 3 22 78 13 52 0 100 30 E 29
Rwanda 6 3 5 95 35 14 72 100 27 E 34
Sao Tome and Principe 11 6 40 60 7 37 26 100 49 D 11
Senegal 6 1 22 78 21 55 0 100 24 E 38
Sierra Leone 8 1 20 80 48 66 0 100 15 F 51
Somalia 7 0 17 83 54 52 0 100 11 F 57
Togo 9 2 32 68 30 36 28 100 34 E 22
Uganda 9 4 21 79 36 52 0 100 24 E 38
United Republic of Tanzania 8 4 8 92 34 49 2 100 19 E 47
Zambia 9 4 39 61 12 49 2 100 42 D 16
Zimbabwe 10 7 37 63 14 44 12 100 45 D 12
Grading Scale
A : 86 - 100 0
B : 69 - 85 4
C : 52 - 68 5
D : 35 - 51 12
E : 18 - 34 27
F : 0 - 17 12
EO= Equal Opportunities for education (Cont.)
Years in School Out of School Vulnerable Girls
Country 20 percent richest urban boys
20 per-cent poor-est
rural girls
Girls enroled in sec-ondary educa-
tion
Girls not in sec-ondary schools
Child labourers
(< 14 years)
Married in rural areas (< 18
years)
Marks for
mar-ried girls
Data Avail-ability for OE
Marks for EO
Over-all
Coun-try
Rank for EO
Year 2005-2008
2005-2009
2000-2008 2000-2008
Weight 15% 55% 15% 15%
26

27
OVERALL SCHOOL REPORT
Picture Final: An overview of each country’s performance
Country UBE PW QL EO Final Report
Weight 35% 35% 15% 15% Over-all
DA Marks Grade G Rank
DA Marks Grade G Rank
DA Marks Grade G Rank
DA Marks Grade G Rank
DA Marks Grade Rank
Arab States
Djibouti 100 41 D 29 100 97 A 1 90 32 E 50 85 34 E 22 96 58 C 15
Mauritania 100 34 E 42 100 79 B 5 100 65 C 27 85 21 E 44 98 52 C 19
Sudan 100 43 D 27 100 50 D 36 100 62 C 32 85 27 E 34 98 46 D 31
Yemen 100 36 D 36 100 63 C 21 0 0 F 59 100 29 E 32 85 39 D 40
Central Asia
Kyrgyzstan 100 69 B 8 100 77 B 6 90 86 A 6 100 84 B 1 99 77 B 2
Mongolia 100 78 B 3 67 63 C 21 90 90 A 1 100 78 B 2 87 75 B 4
Tajikistan 100 71 B 6 100 85 B 3 90 89 A 3 100 78 B 2 99 80 B 1
Uzbekistan 100 74 B 4 67 37 D 44 90 90 A 1 70 62 C 6 82 62 C 13
Central and Eastern Europe
Republic of Moldova 100 84 B 2 100 77 B 6 80 80 B 10 85 60 C 7 95 77 B 2
East Asia and the Pacific
Cambodia 100 45 D 22 100 64 C 19 90 68 C 24 100 33 E 24 99 53 C 18
Lao People’s Demo-cratic Republic
100 44 D 25 100 64 C 19 90 79 B 13 85 38 D 19 96 55 C 17
Philippines 100 66 C 10 100 68 C 17 80 76 B 17 100 68 C 5 97 69 B 7
Timor-Leste 88 44 D 25 100 56 C 32 80 64 C 30 70 32 E 27 88 49 D 25
Viet Nam 100 74 B 4 100 60 C 28 10 10 F 55 100 74 B 4 87 60 C 14
Latin America and the Carribean
Bolivia 100 70 B 7 100 69 B 15 80 80 B 10 100 60 C 7 97 70 B 6
Guyana 75 58 C 12 100 76 B 9 90 86 A 6 85 59 C 9 88 69 B 7
Haiti 100 48 D 20 100 18 E 56 10 0 F 59 100 33 E 24 87 28 E 58
Honduras 100 55 C 16 100 63 C 21 50 28 E 52 100 40 D 17 93 52 C 19
South And West Asia
Afghanistan 100 26 E 54 100 54 C 33 90 51 D 37 85 15 F 51 96 38 D 43
Bangladesh 100 38 D 35 100 57 C 30 90 63 C 31 100 45 D 12 99 49 D 25
India 100 56 C 14 100 81 B 4 100 77 B 15 100 45 D 12 100 66 C 10
Nepal 100 41 D 29 100 65 C 18 60 31 E 51 100 32 E 27 94 47 D 29
Pakistan 100 43 D 27 100 29 E 52 100 50 D 38 85 26 E 37 98 37 D 46
Sri Lanka 100 91 A 1 100 69 B 15 80 80 B 10 30 24 E 38 87 72 B 5
Sub-Saharan Africa
Benin 100 34 E 42 100 30 E 50 100 68 C 24 100 20 E 46 100 36 D 49
Burkina Faso 100 25 E 56 100 37 D 44 100 44 D 41 100 10 F 58 100 30 E 54
Burundi 100 34 E 42 100 43 D 39 100 57 C 35 100 29 E 32 100 40 D 37
Cameroon 100 48 D 20 100 28 E 53 100 74 B 19 100 36 D 20 100 43 D 34
Cape Verde 100 69 B 8 100 48 D 37 90 88 A 4 15 14 F 54 86 56 C 16
Central African Republic
100 26 E 54 100 63 C 21 80 2 F 57 100 6 F 59 97 32 E 53
Chad 100 14 F 60 100 60 C 28 90 21 E 54 100 6 F 59 99 30 E 54
Comoros 100 41 D 29 67 0 F 60 90 86 A 6 70 13 F 55 82 29 E 56
Congo 100 45 D 22 100 57 C 30 100 65 C 27 85 33 E 24 98 50 D 23
Côte d’Ivoire 100 36 D 36 100 43 D 39 60 38 D 47 100 30 E 29 94 38 D 43
Democratic Rep. of the Congo
100 36 D 36 67 37 D 44 100 77 B 15 100 24 E 38 88 41 D 36
Eritrea 100 32 E 47 67 3 F 57 90 24 E 53 70 12 F 56 82 18 E 59
Ethiopia 100 22 E 57 100 37 D 44 100 40 D 46 100 15 F 51 100 29 E 56
Gambia 100 39 D 34 100 61 C 27 90 78 B 14 100 35 D 21 99 52 C 19
Ghana 100 52 C 17 100 75 B 12 100 88 A 4 100 43 D 15 100 64 C 11
27
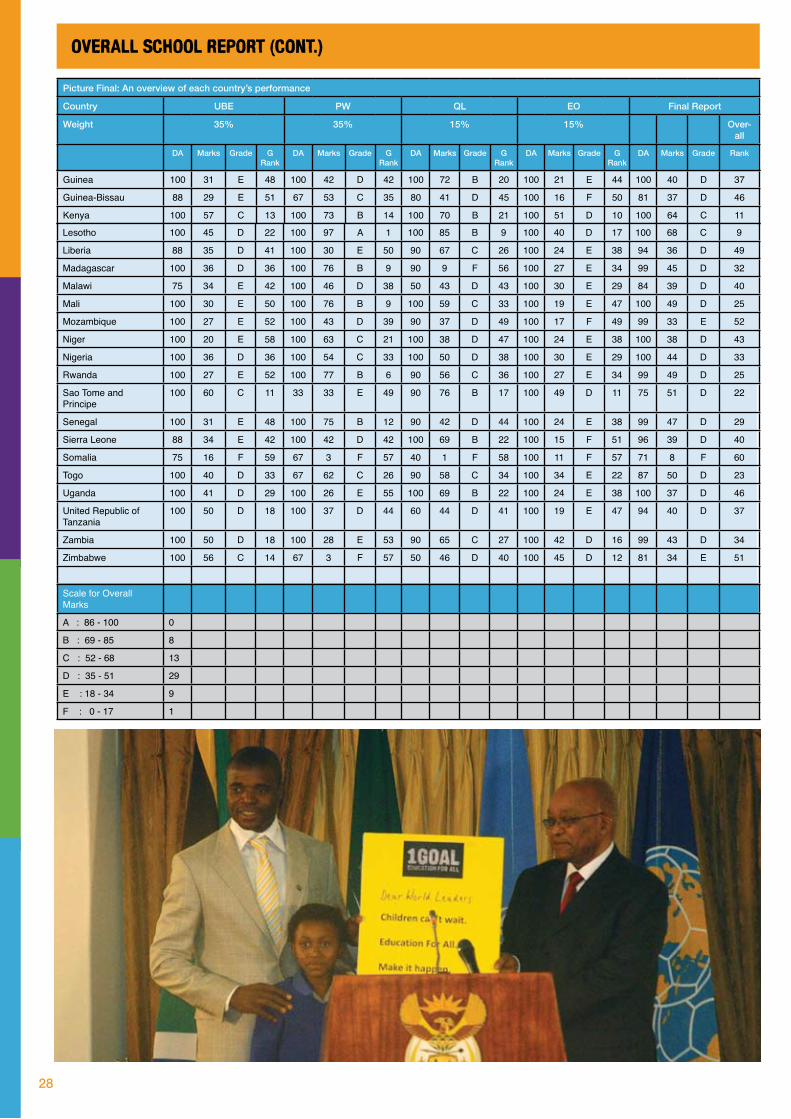
28
OVERALL SCHOOL REPORT (CONT.)
Guinea 100 31 E 48 100 42 D 42 100 72 B 20 100 21 E 44 100 40 D 37
Guinea-Bissau 88 29 E 51 67 53 C 35 80 41 D 45 100 16 F 50 81 37 D 46
Kenya 100 57 C 13 100 73 B 14 100 70 B 21 100 51 D 10 100 64 C 11
Picture Final: An overview of each country’s performance
Country UBE PW QL EO Final Report
Weight 35% 35% 15% 15% Over-all
DA Marks Grade G Rank
DA Marks Grade G Rank
DA Marks Grade G Rank
DA Marks Grade G Rank
DA Marks Grade Rank
Lesotho 100 45 D 22 100 97 A 1 100 85 B 9 100 40 D 17 100 68 C 9
Liberia 88 35 D 41 100 30 E 50 90 67 C 26 100 24 E 38 94 36 D 49
Madagascar 100 36 D 36 100 76 B 9 90 9 F 56 100 27 E 34 99 45 D 32
Malawi 75 34 E 42 100 46 D 38 50 43 D 43 100 30 E 29 84 39 D 40
Mali 100 30 E 50 100 76 B 9 100 59 C 33 100 19 E 47 100 49 D 25
Mozambique 100 27 E 52 100 43 D 39 90 37 D 49 100 17 F 49 99 33 E 52
Niger 100 20 E 58 100 63 C 21 100 38 D 47 100 24 E 38 100 38 D 43
Nigeria 100 36 D 36 100 54 C 33 100 50 D 38 100 30 E 29 100 44 D 33
Rwanda 100 27 E 52 100 77 B 6 90 56 C 36 100 27 E 34 99 49 D 25
Sao Tome and Principe
100 60 C 11 33 33 E 49 90 76 B 17 100 49 D 11 75 51 D 22
Senegal 100 31 E 48 100 75 B 12 90 42 D 44 100 24 E 38 99 47 D 29
Sierra Leone 88 34 E 42 100 42 D 42 100 69 B 22 100 15 F 51 96 39 D 40
Somalia 75 16 F 59 67 3 F 57 40 1 F 58 100 11 F 57 71 8 F 60
Togo 100 40 D 33 67 62 C 26 90 58 C 34 100 34 E 22 87 50 D 23
Uganda 100 41 D 29 100 26 E 55 100 69 B 22 100 24 E 38 100 37 D 46
United Republic of Tanzania
100 50 D 18 100 37 D 44 60 44 D 41 100 19 E 47 94 40 D 37
Zambia 100 50 D 18 100 28 E 53 90 65 C 27 100 42 D 16 99 43 D 34
Zimbabwe 100 56 C 14 67 3 F 57 50 46 D 40 100 45 D 12 81 34 E 51
Scale for Overall Marks
A : 86 - 100 0
B : 69 - 85 8
C : 52 - 68 13
D : 35 - 51 29
E : 18 - 34 9
F : 0 - 17 1
Donor Ranking Table

29
DONOR RANKING TABLE
Country Class position
Meeting the 0.7
target for ODA
Providing a fair share of aid
needed for basic education
Commit-ting
to multi-lateral co-or-
dinated efforts
Focusing aid on the poorest
countries and where girls are
out of school
Providing high-qual-ity aid for education
Marks out of 100
Final Grade A-F
Netherlands 1st 20 20 20 15 18 93 ANorway 2nd 20 20 14 13 18 85 ADenmark =3rd 20 10 15 20 16 81 BIreland =3rd 15 19 20 10 17 81 BSweden 5th 20 15 11 13 17 76 BUnited Kingdom 6th 15 14 16 8 18 71 BLuxembourg 7th 20 15 11 7 13 66 CFinland 8th 15 8 11 10 15 59 CCanada 9th 9 7 10 15 14 55 CSpain 10th 13 10 18 0 11 52 CSwitzerland 11th 13 4 4 12 17 50 CBelgium 12th 16 8 8 6 11 49 DNew Zealand 13th 8 16 3 5 14 46 DFrance 14th 13 9 7 2 13 44 DPortugal 15th 7 4 7 10 11 39 DUnited States 16th 6 3 2 10 12 33 DGermany 17th 10 6 8 2 6 32 DAustralia 18th 8 9 1 0 11 29 EJapan 19th 5 3 3 2 15 28 EItaly 20th 5 3 2 2 12 24 EAustria 21st 9 4 2 0 5 20 EGreece 22nd 5 2 1 0 4 12 F
APPENDIX: 2 the DONOR REport Card
29

30
GlossaryAdult literacy rate: Number of literate persons aged 15 and above, expressed as a percentage of the total population in that age group.
Basic Education: UNESCO defines basic education as the range of educational activities, comprising formal, non-formal and informal public and private, that aim to meet basic learning needs as outlined in the World Declaration on Education for All.
DAC: Development Assistance Committee: The DAC is an international forum with 24 member countries and multilateral organisations seeking to reduce poverty and achieve the MDGs, improving donor coordination and overall aid effectiveness.
EFA: Education for All: EFA denotes the international commitment to education first made in Jomtien, Thailand during the 1990 World Conference on Education for All. The Dakar Framework for Action Education for All: Meeting Our Collective Commitments, commits governments to achieving quality basic education for all by 2015.
FTI: Fast Track Initiative: FTI was created as the first ever global initiative on Education For All, to help low-income countries deliver a free, universal basic education by 2015. FTI aims to assist low-income countries to develop plans and access resources to implement sound education plans.
GDP per capita: Gross Domestic Product per capita: Refers to the total value of goods and services produced within the geographical boundaries of a country. It is calculated in per capita terms by dividing the total GDP by the number of people who live there.
GER: Gross enrolment ratio: Total enrolment in a specific level of education, regardless of age, expressed as a percentage of the population in the official age group corresponding to this level of education. The GER can exceed 100% due to early or late entry and/or grade repetition.
MDG: United Nations Millennium Development Goals: Based on the Millennium Declaration signed by 189 countries including 147 heads of state and government in September 2000. A partnership between developing and developed countries to create a national and global environment that is conducive to the elimination of poverty.
NER: Net enrolment ratio: Enrolment of the official age group for a given level of education, expressed as a percentage of the population in that age group.
OECD: Organisation for Economic Cooperation and Development: Is an international organisation helping governments tackle the economic, social and governance challenges of a globalised economy.
Pre-primary education: Programmes at the initial stage of organized instruction that are primarily designed to introduce very young children to a school-type environment and provide a bridge between the home and a school.
World Bank Atlas method: The Atlas conversion factor reduces the impact of exchange rate fluctuations in cross-country comparison of gross national income.
Sources and CalculationsIn 2007, the Global Campaign for Education (GCE) published the first global School Report with analysis of developing countries’. GCE now continues this with a School Report monitoring 60 of the poorest developing countries (GNP per capita of less than USD 3000). The report utilises the latest available data from the UNESCO Institute of Statistics database. Data has also been sourced from national government reports, academic researchers and international surveys. Each country has a grade for each indicator based on their percentage marks (ranging from A to F) and an overall score and grade. Full details of the sources and calculations used are available on the GCE website www.campaignforeducation.org.
Indicator 1: Universal Basic Education (UBE)
Do countries provide UBE for their entire population?
Data Analysis:Assessing what proportion of the population has never had access to formal education and those who have ‘dropped-out’ or been ‘pushed out’ due to its poor quality.
Sub-Indicator: Children without Pre-Primary Education• Populationwithoutaccesstopre-primaryeducation=(100-NERinPre-PrimaryEducation)
Sub-Indicator: Children who never Complete Primary Education• NERinprimaryeducationminustheproportionofchildrenwhohadearlierenteredprimaryschoolswhodonotsurviveto
grade5.=[100–(NERinPrimaryEducationxSurvivalRatetoGradeFive)x100]÷100
Sub-Indicator: Children without Secondary Education• Out-of-SecondarySchoolpopulationcalculatedas=(100-NERinSecondarySchool)
Sub-Indicator: Adults without Basic Literacy• Adultilliteracyissimplycalculatedas=(100-adultliteracyrate)
Total Marks for UBEECCE, primary, secondary and adult literacy have each been given an equal weight of 25%.
31
Indicator 2: Political Will (PW)
Do countries have adequate political will to finance education? Legal guarantees for free education, level of public expenditure on education, and provision of school meals.
Data Analysis:
Sub-Indicator: Legal Guarantees to Free Education• If(LegalGuaranteeis“Yes”=100,“No”=0,“N.A.”=0)
Sub-Indicator: Public expenditure on education • Lowincomecountriesandenrolmentinprimaryeducation.SeeGCEwebsiteforfulldetailsofcalculationsand
methodology.
Sub-Indicator: Free School Meals • Toevaluatethescaleofcoverageofschoolmealsbasedwehaveusedanon-proportionate5pointscale(High,Medium,
Low, Negligible, No, N.A).
Total Marks for PWFor total marks each sub-indicator has been given a weight of 33.33%.
Indicator 3: Quality and Learning (QL)
Is the government providing high quality inputs and paying sufficient attention to learning outcomes? Teacher shortages and availability of trained teachers.
Data Analysis:
Sub-Indicators: Shortage of teachers (see GCE website for full details)• Theformulausedtodeterminetherequiredteachersis=primaryschoolagepopulation÷40
Sub-Indicator: Untrained teachers in primary education• Thisindicatormeasuresthepercentageofteacherswhoareuntrainedbasedonthesimplecalculation=(100–
percentage of trained teachers)
Sub-Indicator: Learning Outcomes• Duetolackofinternationallycomparabledata,alearningoutcomessurveywasimplementedwithin-countryexperts.
From the answers given, countries were given a learning outcomes rating of Negligible, Low, Medium, or High, denoting the degree of prioritisation attached by key stakeholders to the issue of learning outcomes.
Total Marks for QLShortage of primary and secondary teachers has been given a weight of 40% each. Untrained teachers and learning outcomes have been given 10% each due to shortage of data.
Indicator 4: Equal Opportunities (EO)
Do countries support equal opportunities for education? Access to secondary education, inequality between rich urban boys and poor rural girls, proportion of vulnerable girls.
Sub-Indicator: Girls not in Secondary School• TheNERsexpressedaspercentagesrepresentmarksforthissub-indicator.Percentagedisplayedisinvertedi.e.girlsnot
insecondaryschool=(100-femaleNER)
Sub-Indicator: Years in School• Thegender-relateddevelopmentindex(GDI)measuresthisthroughawoman’schancefor:alongandhealthylife,
knowledge, and a decent standard of living. The GDI percentage scores represent the sub-indicator.
Sub-Indicator: Years in School • Measuringdifferenceinyearsofschoolingbetween20%richesturbanboysand20%poorestruralgirls.=[(RichUrban
Boys–PoorRuralGirls)x100]÷(RichUrbanBoys+PoorRuralGirls)
• Toensurethatthecountrieswiththehighestinequalityreceivethelowestmarks,theyarecalculatedas=(100-percentage inequality)
Sub-Indicator: Girls in Vulnerable Circumstances• Ifthepercentageofgirlsinchildlabourorchildmarriageisgreaterthan50thenthecountryreceives0.Iflessthan50%,
thenmarkshavebeenaccordedas:=[100–(%ofgirlsinchildlabour/marriagex2)]
Total Marks for EOGirls’ access to secondary education has been given a weight of 55%, and inequality in years in school, child labour and child marriage 15% each. Availability of data was a key factor in determining appropriate weighting.
Total Overall MarksFor total marks, UBE and PW are assigned 35% each, and OL and EO have 15% each due to data availability issues. Data availability for each indicator area is shown on data tables: ‘Red’ (0-49%), ‘Amber’ (50 – 74%) and ‘Green’ (75 -100%).
Grade for total scores: A: 86% – 100%, B: 69% - 85%, C: 52% - 68%, D: 35% - 51%, E: 18% - 34%, F: Less than or equal to 17%
32