azimuthal anisotropy beneath north central africa...
TRANSCRIPT
RESEARCH ARTICLE10.1002/2014GC005706
Azimuthal anisotropy beneath north central Africa from shearwave splitting analysesAwad A. Lemnifi1, Kelly H. Liu1, Stephen S. Gao1, Cory A. Reed1, Ahmed A. Elsheikh1, Youqiang Yu1,and Abdala A. Elmelade2
1Geology and Geophysics Program, Missouri University of Science and Technology, Rolla, Missouri, USA, 2Libyan Centerfor Remote Sensing and Space Science, Tripoli, Libya
Abstract This study represents the first multistation investigation of azimuthal anisotropy beneath theinterior of north central Africa, including Libya and adjacent regions, using shear wave splitting (SWS) analy-sis. Data used in the study include recently available broadband seismic data obtained from 15 stationsmanaged by the Libyan Center for Remote Sensing and Space Science, and those from five other stations atwhich data are publicly accessible. A total of 583 pairs of high-quality SWS measurements utilizing the PKS,SKKS, and SKS phases demonstrate primarily N-S fast orientations with an average splitting delay time ofapproximately 1.2 s. An absence of periodic azimuthal variation of the observed splitting parameters indi-cates the presence of simple anisotropy, and lack of correlation between surficial features and the splittingparameters suggests that the origin of the observed anisotropy is primarily asthenospheric. This conclusionis enhanced by nonperiodic azimuthal variation of the splitting parameters observed at one of the stationslocated near the boundary of areas with different anisotropic properties. We interpret the observed anisot-ropy to be the consequence of northward movement of the African plate relative to the asthenospheretoward the Hellenic and Calabrian subduction zones. Local variance in fast orientations may be attributableto flow deflection by the northern edge of the African continental root. The observations provide criticaland previously lacking constraints on mantle dynamic models in the vicinity of the convergent boundarybetween the African and Eurasian plates.
1. Introduction
Numerous geodynamic modeling and seismic anisotropy studies suggest that the rheologically differentlithosphere and asthenosphere interact through partial coupling [Becker and O’Connell, 2001; Marone andRomanowicz, 2007; Doglioni et al., 2011; Refayee et al., 2014; Yang et al., 2014]. The direction of the simpleshear in the boundary layer between the partially coupled lithosphere and asthenosphere is determined bythe relative velocities between the two layers. Mathematically, the resulting shear direction at the boundarylayer is determined by the vector sum of the two velocities [Conrad and Behn, 2010].
The interaction between the lithosphere and asthenosphere is routinely investigated using geodynamic mod-eling, with constraints from geophysical observations. Shear wave splitting (SWS) parameters (fast polarizationorientation / and splitting time dt) obtained using P-to-S converted phases at the core-mantle boundary(XKS including PKS, SKKS, and SKS) are arguably the most relevant and consequently most frequently usedseismic observations [Becker et al., 2006; Bird et al., 2008; Kreemer, 2009; Conrad and Behn, 2010; Forte et al.,2010; Faccenna et al., 2014]. Laboratory, field, and numerical experiments suggest that when anisotropic min-erals in the mantle (primarily olivine) are subjected to deformation, lattice preferred orientation (LPO) will bedeveloped through dislocation creep [Zhang and Karato, 1995]. When a shear wave travels through an aniso-tropic medium, it splits into two orthogonal waves, one traveling faster than the other [e.g., Silver, 1996; Sav-age, 1999]. Under anhydrous conditions with typical mantle temperature, the polarization orientation mostoften corresponds to the prevailing direction of simple shear [Karato et al., 2008].
The mantle flow field associated with the subducting African plate beneath the Mediterranean Sea andadjacent areas has recently been intensively investigated through geodynamic modeling [e.g., Faccennaand Becker, 2010; Schaefer et al., 2011; Faccenna et al., 2014], using available SWS measurements [Barruoland Hoffmann, 1999; Schmid et al., 2004; Miller et al., 2013] as constraints. Most of the SWS measurements
Key Points:� Splitting parameters were measured
for the first time in interior N. Africa� N-S fast orientations are inconsistent
with lithospheric origin� Anisotropy is due to partial
lithosphere-asthenosphere coupling
Correspondence to:S. S. Gao,[email protected]
Citation:Lemnifi, A. A., K. H. Liu, S. S. Gao, C. A.Reed, A. A. Elsheikh, Y. Yu, and A. A.Elmelade (2015), Azimuthal anisotropybeneath north central Africa fromshear wave splitting analyses,Geochem. Geophys. Geosyst., 16, 1105–1114, doi:10.1002/2014GC005706.
Received 29 DEC 2014
Accepted 20 MAR 2015
Accepted article online 27 MAR 2015
Published online 18 APR 2015
VC 2015. American Geophysical Union.
All Rights Reserved.
LEMNIFI ET AL. ANISOTROPY BENEATH NORTH CENTRAL AFRICA 1105
Geochemistry, Geophysics, Geosystems
PUBLICATIONS
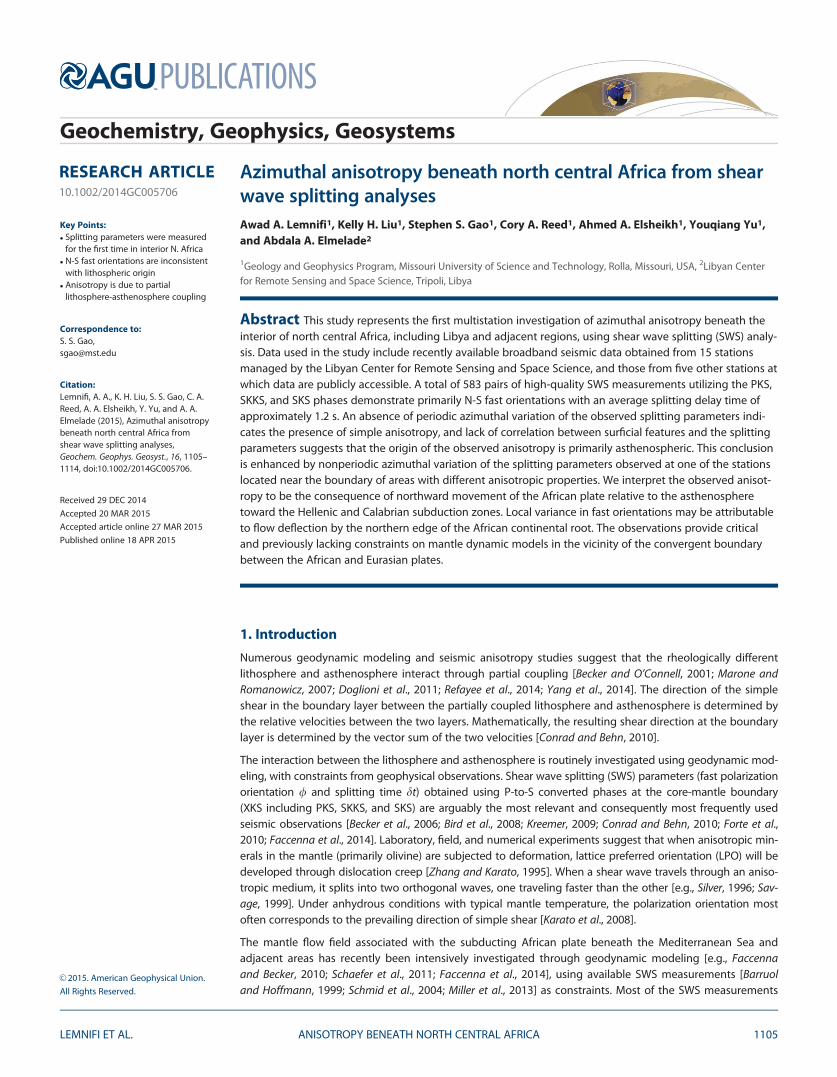
are on the Eurasian and Arabian plates. The limited number of measurements on the African plate arerestricted mostly to the coastal area of the Mediterranean Sea, and measurements in the interior of northcentral Africa are rare. Here we use newly obtained data from 15 seismic stations located throughout theinterior and northern coast of Libya as well as five public seismic stations in Libya and surrounding areas(Figure 1) to constrain the origin of anisotropy and thus characterize the nature of deformation and mantleflow beneath north central Africa.
1.1. Tectonic SettingThe African plate is largely composed of a number of terranes, among which the largest ones are the WestAfrican Craton (WAC) and the Saharan Metacraton (SMC). They were amalgamated by a span of orogenicevents collectively known as the Neoproterozoic Pan-African orogeny [Stoeser and Camp, 1985; Stern, 1994](Figure 1). As a consequence, northern Africa is underlain by lithosphere with variable thickness owing toextensive Pan-African orogenic suturing of blocks with a diverse set of tectonic environments [Stern, 1994].Beneath north central Africa, these tectonic entities are permeated by a variety of major basement faultsand corresponding fold belts primarily oriented N-S or NW-SE (Pan-African Orogenesis) and NE-SW (Carbon-iferous Hercynian compressional stresses) [Hassan and Kendall, 2014] (Figure 1).
The northern reaches of Africa are dominated by volcanic provinces (Figure 1), the most notable of which isthe Hoggar swell of Algeria [Li�egeois et al., 2003] located in the region between the boundaries of the SMCand WAC known as the Trans-Saharan Orogen (TSO). Hoggar volcanics, like other Cenozoic basaltic outpour-ings across northern Africa, are thought to be the result of shallow asthenospheric upwelling exploiting pre-existing lithospheric heterogeneities rather than deep-mantle origins [Montagner et al., 2007; Meert andLieberman, 2008]. Farther to the north, beyond the Mediterranean rifted margin, the Calabrian and Hellenicsubduction zones comprise the northern extent of the northern African subduction system [Faccenna et al.,2014] (Figure 1).
1.2. Previous Geophysical Studies Beneath North Central AfricaHigh-resolution investigations of crustal and mantle structure beneath north central Africa are relatively lim-ited as a consequence of sparse broadband seismic data coverage in the area. A global tomography study[Grand, 2002] suggested the existence of a spatially broad, high-velocity anomaly in the top 100 km locatedbeneath the SMC. Abdelsalam et al. [2011] interpreted those high-velocity anomalies from 0 to 100 km
Hellenic
CA
Red
Sea
0.5 1.0 1.5
Splitting time (s)
ArcMediterranean Sea
Figure 1. A digital elevation map of northern Africa showing station-averaged shear wave splitting measurements from this study (redbars), major basement faults (dashed black lines) [Guiraud and Bosworth, 1997], boundaries of major tectonic provinces (dashed magentalines), and Cenozoic volcanic centers (dark gray areas). SMC: Saharan Metacraton; TSO: Trans-Saharan Orogen; WAC: West African Craton;CA: Calabrian Arc. Also shown are splitting parameters from previous shear wave splitting studies (blue bars) [Diaz et al., 1998; Barruol andHoffmann, 1999; Barruol and Ismail, 2001; Schmid et al., 2004; Hansen et al., 2006; Buontempo et al., 2008; Diaz et al., 2010; Kaviani et al.,2011, 2013; Salah, 2012; Miller et al., 2013; Diaz and Gallart, 2014; Elsheikh et al., 2014]. The dark red arrows represent plate motion of Africarelative to Eurasia calculated using the NUVEL-1A model [DeMets et al., 1994], and the green arrows show APM vectors determined by theHS3-NUVEL1A model [Gripp and Gordon, 2002].
Geochemistry, Geophysics, Geosystems 10.1002/2014GC005706
LEMNIFI ET AL. ANISOTROPY BENEATH NORTH CENTRAL AFRICA 1106
depth as indicative of the reworkedlithosphere of the SMC, while lowvelocities from depths of 100–175 km reflect the asthenosphereand are due to delamination of thecratonic root.
Only a sparse collection of SWS stud-ies have been conducted in northcentral Africa [Barruol and Hoffmann,1999; Barruol and Ismail, 2001;Schmid et al., 2004]. Barruol and Hoff-mann [1999] measured XKS splittingparameters for station TAM on theHoggar swell in Algeria (Figure 1),and they reported a station-averaged / of 17362� and a dt of0.88 6 0.02 s. They also discovered avariation in fast direction with backazimuth, suggesting the presence ofcomplex anisotropic layeringbeneath the Hoggar swell. Theirmodel attributes the orientation ofthe upper layer of anisotropy to theN-S strike of regional shear zonesrelated to Pan-African orogenesis,while the lower layer is fixed at 40�
from the north, which is assumed tobe induced by basal tectonic dragassociated with the movement of
the African plate toward the NE in a fixed hotspot reference frame. These observations were further con-firmed with additional seismic data for station TAM by Barruol and Ismail [2001]. North African mantle ani-sotropy was studied by Schmid et al. [2004] by measuring SKS splitting parameters along the Mediterraneanmargins including two stations in northern Libya (Figure 1). They observed dominantly ENE-WSW fast orien-tations across the western Mediterranean, a nearly N-S fast orientation at the station in NW Libya, and a ENEorientation at the station in NE Libya (Figure 1). Anisotropic surface wave tomography results indicate domi-nantly N-S fast polarizations with slight NNE-SSW and NNW-SSE deviations for north central Africa[W€ustefeld et al., 2009]. These results are consistent with previous surface wave tomography-generatednorth-south fast orientations at depths of 200 km or greater attributed to asthenospheric flow [Montagneret al., 2007].
The Red Sea and adjacent terranes, namely the Arabian Shield and Dead Sea Transform, are shown toexhibit a first-order N-S polarization direction which is postulated to result from either coherent lithosphericstrike-slip deformation [Schmid et al., 2004] or by northward movement of the lithosphere relative to theasthenosphere [Elsheikh et al., 2014]. Coincident with the study of Schmid et al. [2004], southern Iberia andMorocco are characterized by primarily E-W fast directions, while N-S measurements are only observedwithin the immediate vicinity of Gibralter [Miller et al., 2013]. Miller et al. [2013] interpret these findings asthe combination of fossil anisotropy and modulation of mantle flow by the topography of the bottom ofthe lithosphere, as well as toroidal slab modulated flow.
2. Data and Methods
We utilize all three-component broadband data recorded by 15 stations available to us from the Libyan Centerfor Remote Sensing and Space Science recorded between early 2005 through 2007. We also include two per-manent broadband seismic stations located in Libya, two in eastern Tunisia, and one in Algeria which acquired
10 20
45
90
135
180
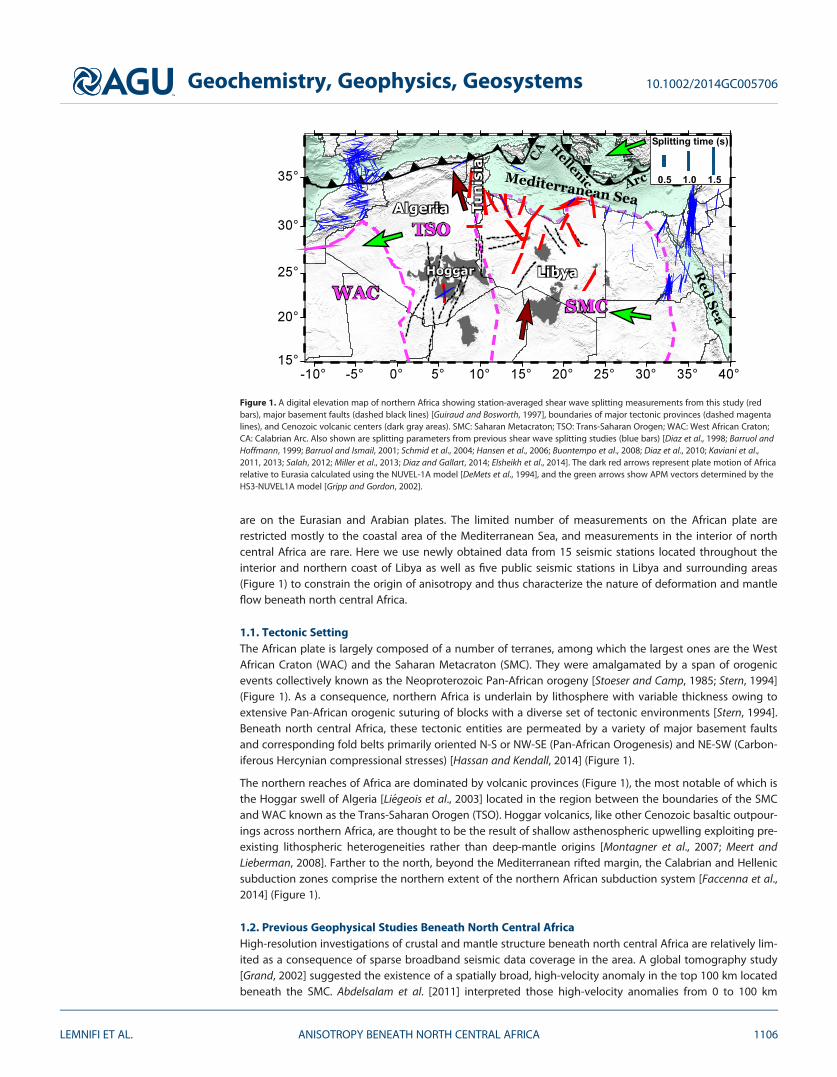
Figure 2. An azimuthal equidistant projection map of the Earth showing the distribu-tion of earthquakes used in this study (red circles). The center of the study area is des-ignated by a solid red triangle. The size of the circles corresponds directly to thenumber of high-quality SWS measurements obtained from each individual event.
Geochemistry, Geophysics, Geosystems 10.1002/2014GC005706
LEMNIFI ET AL. ANISOTROPY BENEATH NORTH CENTRAL AFRICA 1107
data from early 1990 to 2014 andwere archived at the IRIS (Incor-porated Institutions for Seismol-ogy) DMC (Data ManagementCenter). In this study, we usethree core-mantle boundary P-to-S converted phases (PKS, SKKS,and SKS, collectively known asXKS) in order to maximize thecoverage provided by the data.The useful epicentral ranges forthe PKS, SKKS, and SKS phasesare 120�–180� , 84�–180�, and95�–180�, respectively [Liu andGao, 2013]. Figure 2 shows thedistribution of earthquakes usedin this study and the quantity ofhigh-quality measurementsobtained from each event.
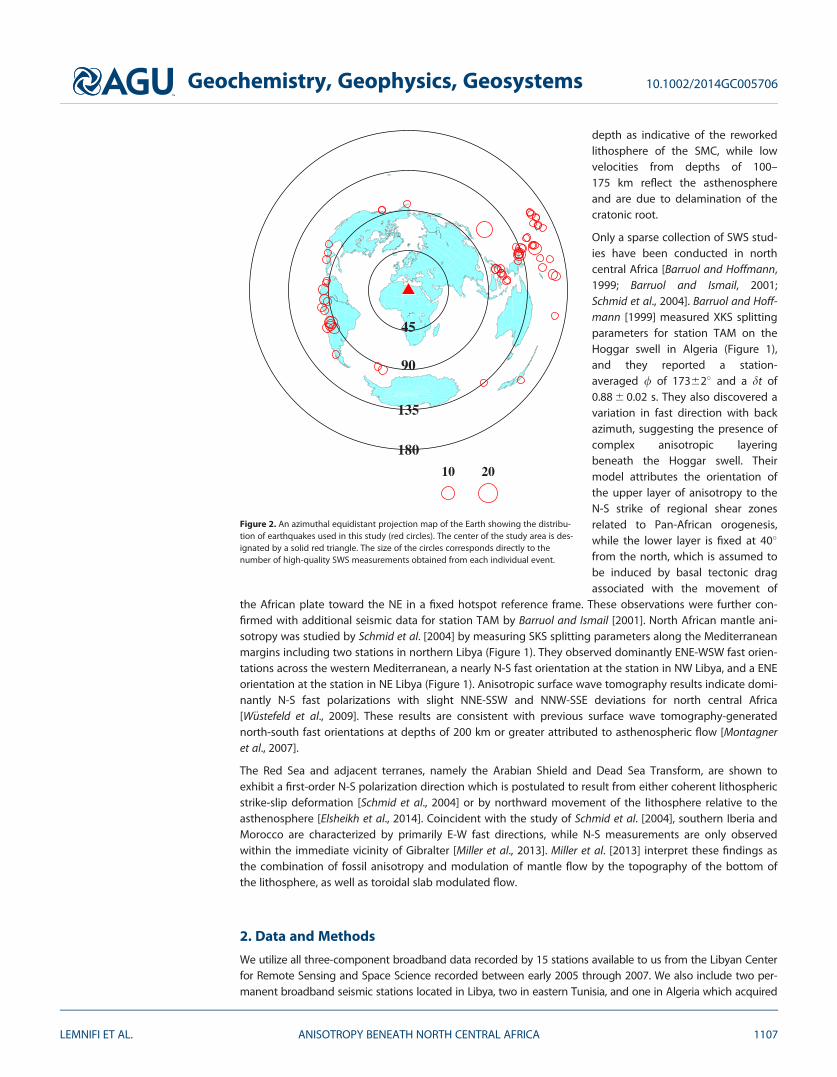
We apply the procedure devel-oped by Liu [2009] and Liu andGao [2013] based upon the mini-mization of transverse energymethod [Silver and Chan, 1991]to calculate the splitting parame-ters. The requested seismogramsare first band-pass filtered in thefrequency range of 0.04–0.5 Hzto reject those with low signal-to-noise ratios (S/N). Detailed infor-mation about the definition ofthe parameters used to computethe S/N can be found in Liu andGao [2013]. Each measurement ismanually checked and assigneda rank of A (excellent), B (good),
C (poor), or N (null). Rankings are assigned based on the S/N ratio of the original radial, original transverse, andcorrected transverse components as well as the linearity of postminimization particle motion patterns and qual-ity of the corrected transverse component (see Liu et al. [2008] for quantitative definitions of the rankings).Example measurements are shown in Figures 3 and 4. Finally, we explore the existence of complex anisotropyby examining the variation of the optimal pairs of splitting parameters with the back azimuth (BAZ).
3. Results
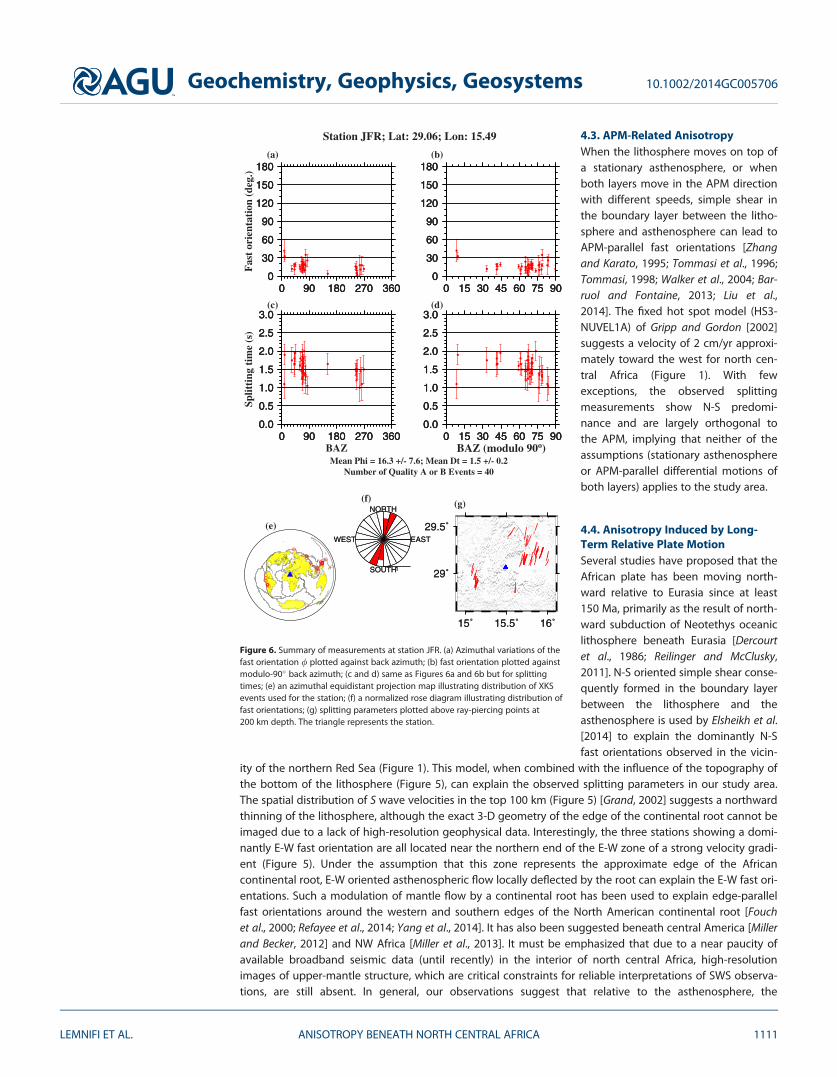
A total of 583 pairs of well-defined (quality A and B) parameters were obtained from 20 seismic stationsthroughout the study region, among which 369 are SKS, 144 are SKKS, and 70 are PKS measurements. Thestation-averaged splitting parameters, which are in general agreement with those obtained by previousstudies at the three stations in the study area (Figure 1), are given in Table 1. At all but one (KFR, see below)of the stations, no discernible variation in the splitting parameters with BAZ is observed (Figure 5), suggest-ing that a single layer of anisotropy with a horizontal axis of symmetry underlies the study area, as is exem-plified by the results at station JFR (Figure 6).
The fast orientations are dominantly N-S throughout most of the study area, though they change substan-tially to E-W at stations MRJ and MARJ in the northeastern coastal region and GHD in eastern Algeria (Figure
0.2
0.2
0.2
0.4
0.4
0.6
-90
-60
-30
0
30
60
90
0 1 2 3
φ= -82.0 +/- 16.0o δt= 1.15 +/-0.30s
Splitting time (s)
Fas
t di
rect
ion
(deg
ree)
1480 1480
1460 1480
Corrected T
Corrected R
Original T
Original R
(a) Station: GHD
Event= 2006-285-18:05
BAZ=238.529o Dist=97.819o
SKKS
Time from origin (s)
0.2
0.2 0.2
0.2
0.4
0.4
0.4 0.4
0.4
0.6
0.60.8
-90
-60
-30
0
30
60
90
0 1 2 3
φ= -39.0 +/- 2.0o δt= 1.95 +/-0.20s
Splitting time (s)
Fas
t di
rect
ion
(deg
ree)
1440 1440
1420 1440
Corrected T
Corrected R
Original T
Original R
BAZ= 249.885o, Dist= 99.710o
Event= 2005-321-19:26
(b) Station: KFR
SKS
Time from origin (s)
Figure 3. Examples of quality A measurements, showing the (top) original and correctedradial and transverse components, (middle) fast and slow components, and associated parti-cle motion patterns prior to and following forwarding the slow component by the optimalsplitting time, and (bottom) the corresponding error functions recorded by stations (left)GHD and (right) KFR.
Geochemistry, Geophysics, Geosystems 10.1002/2014GC005706
LEMNIFI ET AL. ANISOTROPY BENEATH NORTH CENTRAL AFRICA 1108
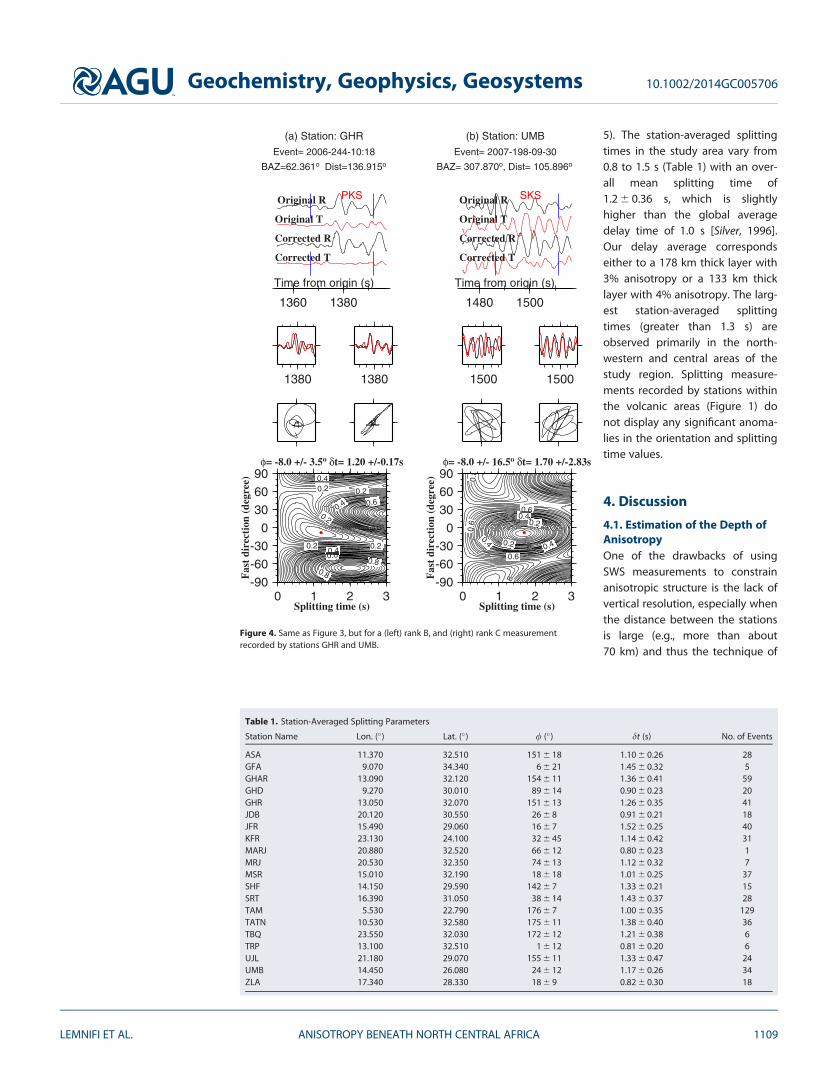
5). The station-averaged splittingtimes in the study area vary from0.8 to 1.5 s (Table 1) with an over-all mean splitting time of1.2 6 0.36 s, which is slightlyhigher than the global averagedelay time of 1.0 s [Silver, 1996].Our delay average correspondseither to a 178 km thick layer with3% anisotropy or a 133 km thicklayer with 4% anisotropy. The larg-est station-averaged splittingtimes (greater than 1.3 s) areobserved primarily in the north-western and central areas of thestudy region. Splitting measure-ments recorded by stations withinthe volcanic areas (Figure 1) donot display any significant anoma-lies in the orientation and splittingtime values.
4. Discussion
4.1. Estimation of the Depth ofAnisotropyOne of the drawbacks of usingSWS measurements to constrainanisotropic structure is the lack ofvertical resolution, especially whenthe distance between the stationsis large (e.g., more than about70 km) and thus the technique of
0.2 0.2
0.2
0.20.2
0.4
0.4
0.4
0.6
0.6
0.8
0.8
-90
-60
-30
0
30
60
90
0 1 2 3
φ= -8.0 +/- 3.5o δt= 1.20 +/-0.17s
Splitting time (s)
Fas
t di
rect
ion
(deg
ree)
1380 1380
1360 1380
Corrected T
Corrected R
Original T
Original R
(a) Station: GHR
Event= 2006-244-10:18
BAZ=62.361o Dist=136.915o
PKS
Time from origin (s)
0.2
0.2
0.4
0.4
0.4
0.6
0.6
0.60
8
0.8
-90
-60
-30
0
30
60
90
0 1 2 3
φ= -8.0 +/- 16.5o δt= 1.70 +/-2.83s
Splitting time (s)
Fas
t di
rect
ion
(deg
ree)
1500 1500
1480 1500
Corrected T
Corrected R
Original T
Original R
BAZ= 307.870o, Dist= 105.896o
Event= 2007-198-09-30
(b) Station: UMB
SKS
Time from origin (s)
Figure 4. Same as Figure 3, but for a (left) rank B, and (right) rank C measurementrecorded by stations GHR and UMB.
Table 1. Station-Averaged Splitting Parameters
Station Name Lon. (�) Lat. (�) / (�) dt (s) No. of Events
ASA 11.370 32.510 151 6 18 1.10 6 0.26 28GFA 9.070 34.340 6 6 21 1.45 6 0.32 5GHAR 13.090 32.120 154 6 11 1.36 6 0.41 59GHD 9.270 30.010 89 6 14 0.90 6 0.23 20GHR 13.050 32.070 151 6 13 1.26 6 0.35 41JDB 20.120 30.550 26 6 8 0.91 6 0.21 18JFR 15.490 29.060 16 6 7 1.52 6 0.25 40KFR 23.130 24.100 32 6 45 1.14 6 0.42 31MARJ 20.880 32.520 66 6 12 0.80 6 0.23 1MRJ 20.530 32.350 74 6 13 1.12 6 0.32 7MSR 15.010 32.190 18 6 18 1.01 6 0.25 37SHF 14.150 29.590 142 6 7 1.33 6 0.21 15SRT 16.390 31.050 38 6 14 1.43 6 0.37 28TAM 5.530 22.790 176 6 7 1.00 6 0.35 129TATN 10.530 32.580 175 6 11 1.38 6 0.40 36TBQ 23.550 32.030 172 6 12 1.21 6 0.38 6TRP 13.100 32.510 1 6 12 0.81 6 0.20 6UJL 21.180 29.070 155 6 11 1.33 6 0.47 24UMB 14.450 26.080 24 6 12 1.17 6 0.26 34ZLA 17.340 28.330 18 6 9 0.82 6 0.30 18
Geochemistry, Geophysics, Geosystems 10.1002/2014GC005706
LEMNIFI ET AL. ANISOTROPY BENEATH NORTH CENTRAL AFRICA 1109
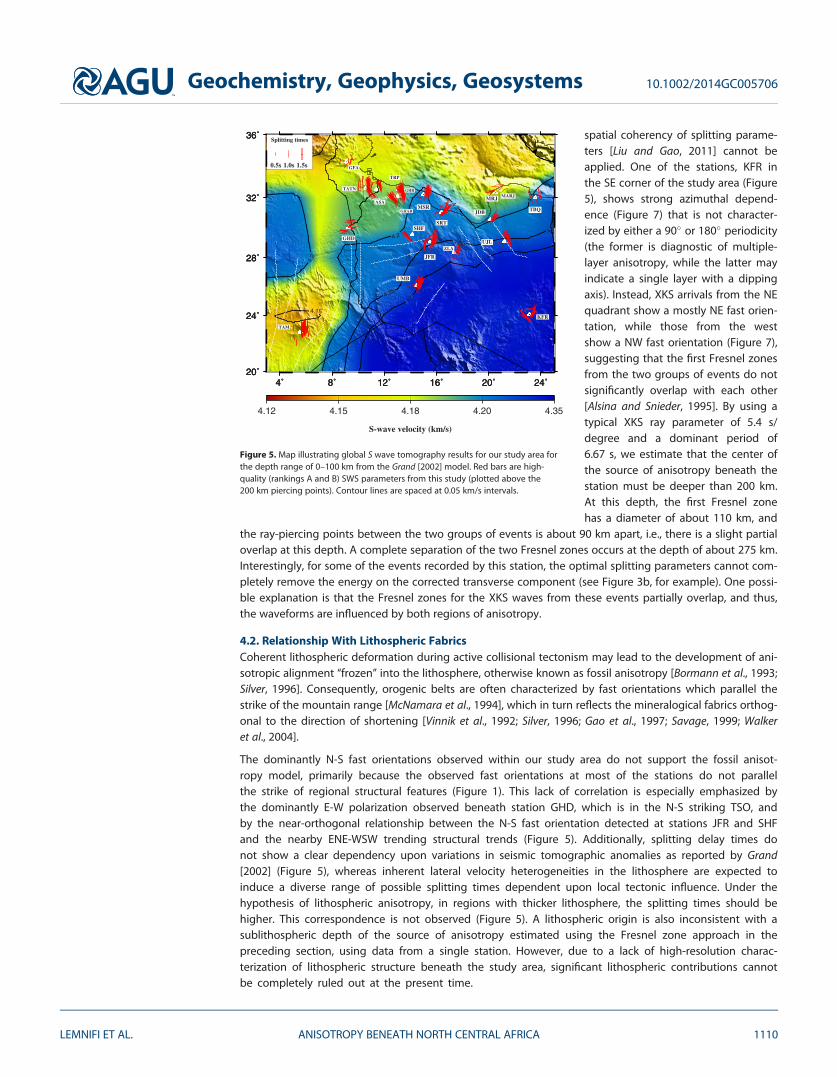
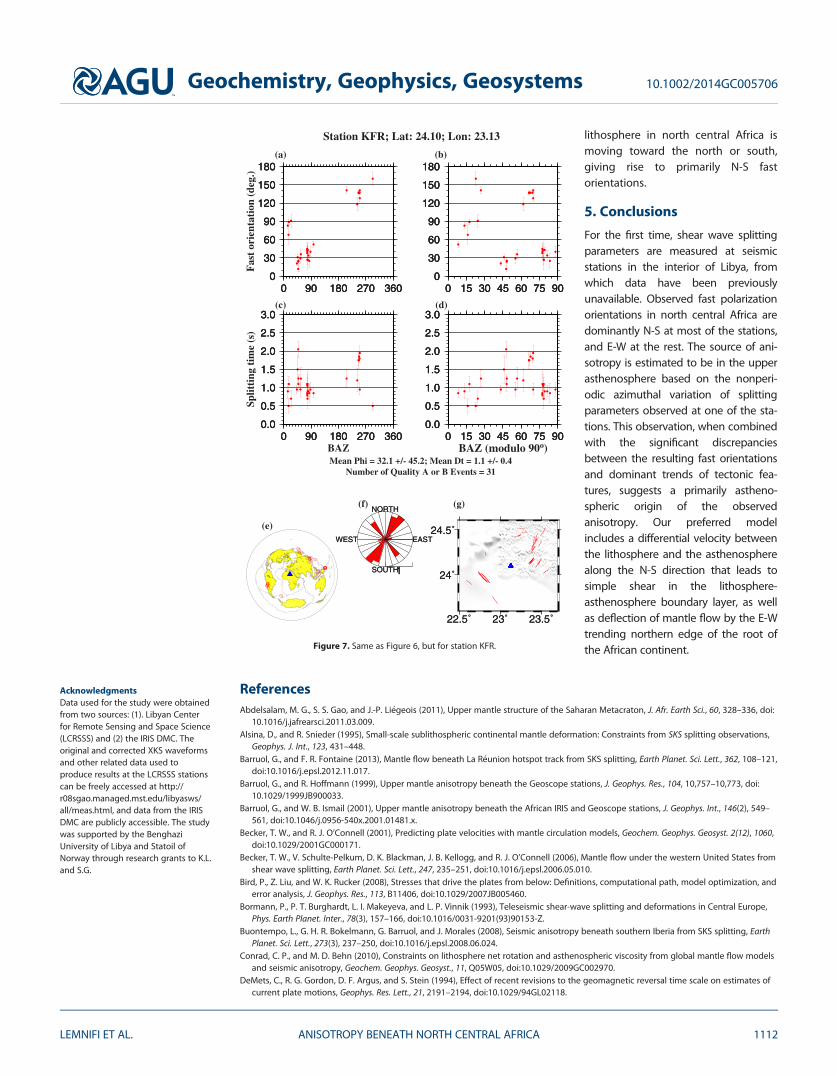
spatial coherency of splitting parame-ters [Liu and Gao, 2011] cannot beapplied. One of the stations, KFR inthe SE corner of the study area (Figure5), shows strong azimuthal depend-ence (Figure 7) that is not character-ized by either a 90� or 180� periodicity(the former is diagnostic of multiple-layer anisotropy, while the latter mayindicate a single layer with a dippingaxis). Instead, XKS arrivals from the NEquadrant show a mostly NE fast orien-tation, while those from the westshow a NW fast orientation (Figure 7),suggesting that the first Fresnel zonesfrom the two groups of events do notsignificantly overlap with each other[Alsina and Snieder, 1995]. By using atypical XKS ray parameter of 5.4 s/degree and a dominant period of6.67 s, we estimate that the center ofthe source of anisotropy beneath thestation must be deeper than 200 km.At this depth, the first Fresnel zonehas a diameter of about 110 km, and
the ray-piercing points between the two groups of events is about 90 km apart, i.e., there is a slight partialoverlap at this depth. A complete separation of the two Fresnel zones occurs at the depth of about 275 km.Interestingly, for some of the events recorded by this station, the optimal splitting parameters cannot com-pletely remove the energy on the corrected transverse component (see Figure 3b, for example). One possi-ble explanation is that the Fresnel zones for the XKS waves from these events partially overlap, and thus,the waveforms are influenced by both regions of anisotropy.
4.2. Relationship With Lithospheric FabricsCoherent lithospheric deformation during active collisional tectonism may lead to the development of ani-sotropic alignment ‘‘frozen’’ into the lithosphere, otherwise known as fossil anisotropy [Bormann et al., 1993;Silver, 1996]. Consequently, orogenic belts are often characterized by fast orientations which parallel thestrike of the mountain range [McNamara et al., 1994], which in turn reflects the mineralogical fabrics orthog-onal to the direction of shortening [Vinnik et al., 1992; Silver, 1996; Gao et al., 1997; Savage, 1999; Walkeret al., 2004].
The dominantly N-S fast orientations observed within our study area do not support the fossil anisot-ropy model, primarily because the observed fast orientations at most of the stations do not parallelthe strike of regional structural features (Figure 1). This lack of correlation is especially emphasized bythe dominantly E-W polarization observed beneath station GHD, which is in the N-S striking TSO, andby the near-orthogonal relationship between the N-S fast orientation detected at stations JFR and SHFand the nearby ENE-WSW trending structural trends (Figure 5). Additionally, splitting delay times donot show a clear dependency upon variations in seismic tomographic anomalies as reported by Grand[2002] (Figure 5), whereas inherent lateral velocity heterogeneities in the lithosphere are expected toinduce a diverse range of possible splitting times dependent upon local tectonic influence. Under thehypothesis of lithospheric anisotropy, in regions with thicker lithosphere, the splitting times should behigher. This correspondence is not observed (Figure 5). A lithospheric origin is also inconsistent with asublithospheric depth of the source of anisotropy estimated using the Fresnel zone approach in thepreceding section, using data from a single station. However, due to a lack of high-resolution charac-terization of lithospheric structure beneath the study area, significant lithospheric contributions cannotbe completely ruled out at the present time.
4˚ 8˚ 12˚ 16˚ 20˚ 24˚20˚
24˚
28˚
32˚
36˚
4.15
4.2
4.2
4.2
4.2
4.2
4.25
4.25
4.25
4.3
4.3
KFR
UMB
SHF
ZLAUJL
JFR
TBQ
SRT
MSR
GHD
JDB
MRJ MARJ
TATN
ASA
TRP
GHR
GHAR
TAM
GFA0.5s 1.0s 1.5s
4˚ 8˚ 12˚ 16˚ 20˚ 24˚20˚
24˚
28˚
32˚
36˚ Splitting times
S-wave velocity (km/s)
4˚ 8˚ 12˚ 16˚ 20˚ 24˚20˚
24˚
28˚
32˚
36˚
4.12 4.15 4.18 4.20 4.35
Figure 5. Map illustrating global S wave tomography results for our study area forthe depth range of 0–100 km from the Grand [2002] model. Red bars are high-quality (rankings A and B) SWS parameters from this study (plotted above the200 km piercing points). Contour lines are spaced at 0.05 km/s intervals.
Geochemistry, Geophysics, Geosystems 10.1002/2014GC005706
LEMNIFI ET AL. ANISOTROPY BENEATH NORTH CENTRAL AFRICA 1110
4.3. APM-Related AnisotropyWhen the lithosphere moves on top ofa stationary asthenosphere, or whenboth layers move in the APM directionwith different speeds, simple shear inthe boundary layer between the litho-sphere and asthenosphere can lead toAPM-parallel fast orientations [Zhangand Karato, 1995; Tommasi et al., 1996;Tommasi, 1998; Walker et al., 2004; Bar-ruol and Fontaine, 2013; Liu et al.,2014]. The fixed hot spot model (HS3-NUVEL1A) of Gripp and Gordon [2002]suggests a velocity of 2 cm/yr approxi-mately toward the west for north cen-tral Africa (Figure 1). With fewexceptions, the observed splittingmeasurements show N-S predomi-nance and are largely orthogonal tothe APM, implying that neither of theassumptions (stationary asthenosphereor APM-parallel differential motions ofboth layers) applies to the study area.
4.4. Anisotropy Induced by Long-Term Relative Plate MotionSeveral studies have proposed that theAfrican plate has been moving north-ward relative to Eurasia since at least150 Ma, primarily as the result of north-ward subduction of Neotethys oceaniclithosphere beneath Eurasia [Dercourtet al., 1986; Reilinger and McClusky,2011]. N-S oriented simple shear conse-quently formed in the boundary layerbetween the lithosphere and theasthenosphere is used by Elsheikh et al.[2014] to explain the dominantly N-Sfast orientations observed in the vicin-
ity of the northern Red Sea (Figure 1). This model, when combined with the influence of the topography ofthe bottom of the lithosphere (Figure 5), can explain the observed splitting parameters in our study area.The spatial distribution of S wave velocities in the top 100 km (Figure 5) [Grand, 2002] suggests a northwardthinning of the lithosphere, although the exact 3-D geometry of the edge of the continental root cannot beimaged due to a lack of high-resolution geophysical data. Interestingly, the three stations showing a domi-nantly E-W fast orientation are all located near the northern end of the E-W zone of a strong velocity gradi-ent (Figure 5). Under the assumption that this zone represents the approximate edge of the Africancontinental root, E-W oriented asthenospheric flow locally deflected by the root can explain the E-W fast ori-entations. Such a modulation of mantle flow by a continental root has been used to explain edge-parallelfast orientations around the western and southern edges of the North American continental root [Fouchet al., 2000; Refayee et al., 2014; Yang et al., 2014]. It has also been suggested beneath central America [Millerand Becker, 2012] and NW Africa [Miller et al., 2013]. It must be emphasized that due to a near paucity ofavailable broadband seismic data (until recently) in the interior of north central Africa, high-resolutionimages of upper-mantle structure, which are critical constraints for reliable interpretations of SWS observa-tions, are still absent. In general, our observations suggest that relative to the asthenosphere, the
0
30
60
90
120
150
180
0 90 180 270 3600
30
60
90
120
150
180
0 90 180 270 3600
30
60
90
120
150
180
0 90 180 270 360
Station JFR; Lat: 29.06; Lon: 15.49
Fas
t or
ient
atio
n (d
eg.)
(a)
0.0
0.5
1.0
1.5
2.0
2.5
3.0
0 90 180 270 3600.0
0.5
1.0
1.5
2.0
2.5
3.0
0 90 180 270 3600.0
0.5
1.0
1.5
2.0
2.5
3.0
0 90 180 270 360
Split
ting
tim
e (s
)
(c)
BAZMean Phi = 16.3 +/- 7.6; Mean Dt = 1.5 +/- 0.2
Number of Quality A or B Events = 40
0
30
60
90
120
150
180
0 15 30 45 60 75 900
30
60
90
120
150
180
0 15 30 45 60 75 900
30
60
90
120
150
180
0 15 30 45 60 75 90
(b)
0.0
0.5
1.0
1.5
2.0
2.5
3.0
0 15 30 45 60 75 900.0
0.5
1.0
1.5
2.0
2.5
3.0
0 15 30 45 60 75 900.0
0.5
1.0
1.5
2.0
2.5
3.0
0 15 30 45 60 75 90
(d)
BAZ (modulo 90o)
SOUTH1
EASTWEST
NORTH
SOUTH1
EASTWEST
NORTH
15˚ 15.5˚ 16˚
29˚
29.5˚
15˚ 15.5˚ 16˚
29˚
29.5˚(e)
(f) (g)
Figure 6. Summary of measurements at station JFR. (a) Azimuthal variations of thefast orientation / plotted against back azimuth; (b) fast orientation plotted againstmodulo-90� back azimuth; (c and d) same as Figures 6a and 6b but for splittingtimes; (e) an azimuthal equidistant projection map illustrating distribution of XKSevents used for the station; (f) a normalized rose diagram illustrating distribution offast orientations; (g) splitting parameters plotted above ray-piercing points at200 km depth. The triangle represents the station.
Geochemistry, Geophysics, Geosystems 10.1002/2014GC005706
LEMNIFI ET AL. ANISOTROPY BENEATH NORTH CENTRAL AFRICA 1111
lithosphere in north central Africa ismoving toward the north or south,giving rise to primarily N-S fastorientations.
5. Conclusions
For the first time, shear wave splittingparameters are measured at seismicstations in the interior of Libya, fromwhich data have been previouslyunavailable. Observed fast polarizationorientations in north central Africa aredominantly N-S at most of the stations,and E-W at the rest. The source of ani-sotropy is estimated to be in the upperasthenosphere based on the nonperi-odic azimuthal variation of splittingparameters observed at one of the sta-tions. This observation, when combinedwith the significant discrepanciesbetween the resulting fast orientationsand dominant trends of tectonic fea-tures, suggests a primarily astheno-spheric origin of the observedanisotropy. Our preferred modelincludes a differential velocity betweenthe lithosphere and the asthenospherealong the N-S direction that leads tosimple shear in the lithosphere-asthenosphere boundary layer, as wellas deflection of mantle flow by the E-Wtrending northern edge of the root ofthe African continent.
ReferencesAbdelsalam, M. G., S. S. Gao, and J.-P. Li�egeois (2011), Upper mantle structure of the Saharan Metacraton, J. Afr. Earth Sci., 60, 328–336, doi:
10.1016/j.jafrearsci.2011.03.009.Alsina, D., and R. Snieder (1995), Small-scale sublithospheric continental mantle deformation: Constraints from SKS splitting observations,
Geophys. J. Int., 123, 431–448.Barruol, G., and F. R. Fontaine (2013), Mantle flow beneath La R�eunion hotspot track from SKS splitting, Earth Planet. Sci. Lett., 362, 108–121,
doi:10.1016/j.epsl.2012.11.017.Barruol, G., and R. Hoffmann (1999), Upper mantle anisotropy beneath the Geoscope stations, J. Geophys. Res., 104, 10,757–10,773, doi:
10.1029/1999JB900033.Barruol, G., and W. B. Ismail (2001), Upper mantle anisotropy beneath the African IRIS and Geoscope stations, J. Geophys. Int., 146(2), 549–
561, doi:10.1046/j.0956-540x.2001.01481.x.Becker, T. W., and R. J. O’Connell (2001), Predicting plate velocities with mantle circulation models, Geochem. Geophys. Geosyst. 2(12), 1060,
doi:10.1029/2001GC000171.Becker, T. W., V. Schulte-Pelkum, D. K. Blackman, J. B. Kellogg, and R. J. O’Connell (2006), Mantle flow under the western United States from
shear wave splitting, Earth Planet. Sci. Lett., 247, 235–251, doi:10.1016/j.epsl.2006.05.010.Bird, P., Z. Liu, and W. K. Rucker (2008), Stresses that drive the plates from below: Definitions, computational path, model optimization, and
error analysis, J. Geophys. Res., 113, B11406, doi:10.1029/2007JB005460.Bormann, P., P. T. Burghardt, L. I. Makeyeva, and L. P. Vinnik (1993), Teleseismic shear-wave splitting and deformations in Central Europe,
Phys. Earth Planet. Inter., 78(3), 157–166, doi:10.1016/0031-9201(93)90153-Z.Buontempo, L., G. H. R. Bokelmann, G. Barruol, and J. Morales (2008), Seismic anisotropy beneath southern Iberia from SKS splitting, Earth
Planet. Sci. Lett., 273(3), 237–250, doi:10.1016/j.epsl.2008.06.024.Conrad, C. P., and M. D. Behn (2010), Constraints on lithosphere net rotation and asthenospheric viscosity from global mantle flow models
and seismic anisotropy, Geochem. Geophys. Geosyst., 11, Q05W05, doi:10.1029/2009GC002970.DeMets, C., R. G. Gordon, D. F. Argus, and S. Stein (1994), Effect of recent revisions to the geomagnetic reversal time scale on estimates of
current plate motions, Geophys. Res. Lett., 21, 2191–2194, doi:10.1029/94GL02118.
0
30
60
90
120
150
180
0 90 180 270 3600
30
60
90
120
150
180
0 90 180 270 3600
30
60
90
120
150
180
0 90 180 270 360
Station KFR; Lat: 24.10; Lon: 23.13
Fas
t or
ient
atio
n (d
eg.)
(a)
0.0
0.5
1.0
1.5
2.0
2.5
3.0
0 90 180 270 3600.0
0.5
1.0
1.5
2.0
2.5
3.0
0 90 180 270 3600.0
0.5
1.0
1.5
2.0
2.5
3.0
0 90 180 270 360
Split
ting
tim
e (s
)
(c)
BAZMean Phi = 32.1 +/- 45.2; Mean Dt = 1.1 +/- 0.4
Number of Quality A or B Events = 31
0
30
60
90
120
150
180
0 15 30 45 60 75 900
30
60
90
120
150
180
0 15 30 45 60 75 900
30
60
90
120
150
180
0 15 30 45 60 75 90
(b)
0.0
0.5
1.0
1.5
2.0
2.5
3.0
0 15 30 45 60 75 900.0
0.5
1.0
1.5
2.0
2.5
3.0
0 15 30 45 60 75 900.0
0.5
1.0
1.5
2.0
2.5
3.0
0 15 30 45 60 75 90
(d)
BAZ (modulo 90o)
SOUTH1
EASTWEST
NORTH
SOUTH1
EASTWEST
NORTH
22.5˚ 23˚ 23.5˚
24˚
24.5˚
22.5˚ 23˚ 23.5˚
24˚
24.5˚(e)
(f) (g)
Figure 7. Same as Figure 6, but for station KFR.
AcknowledgmentsData used for the study were obtainedfrom two sources: (1). Libyan Centerfor Remote Sensing and Space Science(LCRSSS) and (2) the IRIS DMC. Theoriginal and corrected XKS waveformsand other related data used toproduce results at the LCRSSS stationscan be freely accessed at http://r08sgao.managed.mst.edu/libyasws/all/meas.html, and data from the IRISDMC are publicly accessible. The studywas supported by the BenghaziUniversity of Libya and Statoil ofNorway through research grants to K.L.and S.G.
Geochemistry, Geophysics, Geosystems 10.1002/2014GC005706
LEMNIFI ET AL. ANISOTROPY BENEATH NORTH CENTRAL AFRICA 1112
Dercourt, J., et al. (1986), Geological evolution of the Tethys belt from the Atlantic to the Pamirs since the LIAS, Tectonophysics, 123, 241–315, doi:10.1016/0040-1951(86)90199-X.
Diaz, J., and J. Gallart (2014), Seismic anisotropy from the Variscan core of Iberia to the Western African Craton: New constrains on uppermantle flow at regional scales, Earth Planet. Sci. Lett., 394, 48–57, doi:10.1016/j.epsl.2014.03.005.
Diaz, J., J. Gallart, A. Hirn, and H. Paulssen (1998), Anisotropy beneath the Iberian Peninsula: The contribution of the ILIHA-NARS broad-band experiment, Pure Appl. Geophys., 151, 395–405.
Diaz, J., J. Gallart, A. Villaseor, F. Mancilla, A. Pazos, D. Crdoba, J. A. Pulgar, P. Ibarra, and M. Harnafi (2010), Mantle dynamics beneath theGibraltar Arc (western Mediterranean) from shear-wave splitting measurements on a dense seismic array, Geophys. Res. Lett., 37,L18304, doi:10.1029/2010GL044201.
Doglioni, C., A. Ismail-Zadeh, G. Panza, and F. Riguzzi (2011), Lithosphere-asthenosphere viscosity contrast and decoupling, Phys. EarthPlanet. Inter., 189, 1–8, doi:10.1016/j.pepi.2011.09.006.
Elsheikh, A. A., S. S. Gao, K. H. Liu, A. A. Mohamed, Y. Yu, and R. E. Fat-Helbary (2014), Seismic anisotropy and subduction-induced mantlefabrics beneath the Arabian and Nubian Plates adjacent to the Red Sea, Geophys. Res. Lett., 41, 2376–2381, doi:10.1002/2014GL059536.
Faccenna, C., and T. W. Becker (2010), Shaping mobile belts by small-scale convection, Nature, 465, 602–605, doi:10.1038/nature09064.Faccenna, C., et al. (2014), Mantle dynamics in the Mediterranean, Rev. Geophys., 52, 283–332, doi:10.1002/2013RG000444.Forte, A. M., S. Qu�er�e, R. Moucha, N. A. Simmons, S. P. Grand, J. X. Mitrovica, and D. B. Rowley (2010), Joint seismic-geodynamic-mineral
physical modelling of African geodynamics: A reconciliation of deep-mantle convection with surface geophysical constraints, EarthPlanet. Sci. Lett., 295, 329–341, doi:10.1016/j.epsl.2010.03.017.
Fouch, M. J., K. M. Fischer, E. M. Parmentier, M. E. Wysession, and T. J. Clarke (2000), Shear wave splitting, continental keels, and patterns ofmantle flow, Geophys. J. Res., 105, 6255–6275, doi:10.1029/1999JB900372.
Gao, S., P. M. Davis, H. Liu, P. D. Slack, A. W. Rigor, Y. A. Zorin, V. V. Mordvinova, V. M. Kozhevnikov, and N. A. Logatchev (1997), SKS splittingbeneath continental rift zones, J. Geophys. Res., 102, 22,781–22,797, doi:10.1029/97JB01858.
Grand, S. P. (2002), Mantle shear-wave tomography and the fate of subducted slabs, Philos. Trans. R. Soc. London A, 360, 2475–2491, doi:10.1098/rsta.2002.1077.
Gripp, A. E., and R. G. Gordon (2002), Young tracks of hotspots and current plate velocities, Geophys. J. Int., 150, 321–361, doi:10.1046/j.1365-246X.2002.01627.x.
Guiraud, R., and W. Bosworth (1997), Senonian basin inversion and rejuvenation of rifting in Africa and Arabia: Synthesis and implicationsto plate-scale tectonics, Tectonophysics, 282, 39–82, doi:10.1016/S0040–1951(97)00212-6.
Hassan, H. S., and C. G. Kendall (2014), Hydrocarbon provinces in Libya: A petroleum system study, in Petroleum Systems of the TethyanRegion, AAPG Mem., vol. 106, edited by L. Marlow, C. Kendall, and L. Yose, pp. 101–142, Tulsa, Oklahoma, USA.
Hansen, S. E., S. Schwartz, A. Al-Amri, and A. Rodgers (2006), Combined plate motion and density-driven flow in the asthenospherebeneath Saudi Arabia: Evidence from shear-wave splitting and seismic anisotropy, Geology., 34, 869–872, doi:10.1130/G22713.1.
Karato, S., H. Jung, I. Katayama, and P. Skemer (2008), Geodynamic significance of the seismic anisotropy of the upper mantle: New insightsfrom laboratory studies, Annu. Rev. Earth Planet. Sci., 36, 59–95, doi:10.1146/annurev.earth.36.031207.124120.
Kaviani, A., G. Rumpker, M. Weber, and G. Asch (2011), Short-scale variations of shear-wave splitting across the Dead Sea basin: Evidencefor the effects of sedimentary fill, Geophys. Res. Lett., 38, L04308, doi:10.1029/2010GL046464.
Kaviani, A., R. Hofstetter, G. R€umpker, and M. Weber (2013), Investigation of seismic anisotropy beneath the Dead Sea fault using densenetworks of broadband stations, J. Geophys. Res. Solid Earth, 118, 3476–3491, doi:10.1002/jgrb.50250.
Kreemer, C. (2009), Absolute plate motions constrained by shear wave splitting orientations with implications for hot spot motions andmantle flow, J. Geophys. Res., 114, B10405, doi:10.1029/2009JB006416.
Li�egeois, J. P., L. Latouche, M. Boughrara, J. Navez, and M. Guiraud (2003), The LATEA (Central Hoggar, Tuareg shield, Algeria): Behavior ofan old passive margin during the Pan-African orogeny, J. Afr. Earth Sci., 37, 161–190, doi:10.1016/j.jafrearsci.2003.05.004.
Liu, K. H. (2009), NA-SWS-1.1: A uniform database of teleseismic shear wave splitting measurements for North America, Geochem. Geophys.Geosyst., 10, Q05011, doi:10.1029/2009GC002440.
Liu, K. H., and S. S. Gao (2011), Estimation of the depth of anisotropy using spatial coherency of shear-wave splitting parameters, Bull. Seis-mol. Soc. Am., 101, 2153–2161, doi:10.1785/0120100258.
Liu, K. H., and S. S. Gao (2013), Making reliable shear-wave splitting measurements, Bull. Seismol. Soc. Am., 103(5), 2680–2693, doi:10.1785/0120120355.
Liu, K. H., S. S. Gao, Y. Gao, and J. Wu (2008), Shear-wave splitting and mantle flow associated with the deflected Pacific slab beneath north-east Asia, J. Geophys. Res., 113, B01305, doi:10.1029/2007JB005178.
Liu, K. H., A. Elsheikh, A. Lemnifi, U. Purevsuren, M. Ray, H. Refayee, B. Yang, Y. Yu and S. S. Gao (2014), A uniform database of teleseismicshear wave splitting measurements for the western and central United States, Geochem. Geophys. Geosyst., 15, 2075–2085, doi:10.1002/2014GC005267.
Marone, F., and B. Romanowicz (2007), The depth distribution of azimuthal anisotropy in the continental upper mantle, Nature, 447, 198–201, doi:10.1038/nature05742.
McNamara, D. E., T. J. Owens, P. G. Silver, and F. T. Wu (1994), Shear wave anisotropy beneath the Tibetan Plateau, J. Geophys. Res., 99,13,655–13,665, doi:10.1029/93JB03406.
Meert, J. G., and B. S. Lieberman (2008), The Neoproterozoic assembly of Gondwana and its relationship to the Ediacaran-Cambrian radia-tion, Gondwana Res., 14, 5–21, doi:10.1016/j.gr.2007.06.007.
Miller, M. S., and T. W. Becker (2012), Mantle flow deflected by interactions between subducted slabs and cratonic keels, Nature, 5, 726–730, doi:10.1038/ngeo1553.
Miller, M. S., A. A. Allam, T. W. Becker, J. F. Di Leo, and J. Wookey (2013), Constraints on the tectonic evolution of the westernmostMediterranean and northwestern Africa from shear wave splitting analysis, Earth Planet. Sci. Lett., 375, 234–243, doi:10.1016/j.epsl.2013.05.036.
Montagner, J.-P., B. Marty, E. Stutzmann, D. Sicilia, M. Cara, R. Pik, J.-J. L�eveque, G. Roult, E. Beucler, and E. Debayle (2007), Mantle upwel-lings and convective instabilities revealed by seismic tomography and helium isotope geochemistry beneath eastern Africa, Geophys.Res. Lett., 34, L21303, doi:10.10129/2007GL031098.
Refayee, H. A., B. B. Yang, K. H. Liu, and S. S. Gao (2014), Mantle flow and lithosphere-asthenosphere coupling beneath the southwesternedge of the North American craton: Constrains from shear-wave splitting measurements, Earth Planet. Sci. Lett., 402, 209–220, doi:10.1016/j.epsl.2013.01.031i.
Reilinger, R., and S. McClusky (2011), Nubia-Arabia-Eurasia plate motions and the dynamics of Mediterranean and Middle East tectonics,Geophys. J. Int., 186, 971–979, doi:10.1111/j.1365-246X.2011.05133.x.
Geochemistry, Geophysics, Geosystems 10.1002/2014GC005706
LEMNIFI ET AL. ANISOTROPY BENEATH NORTH CENTRAL AFRICA 1113
Salah, M. K. (2012), A seismological evidence for the northwestward movement of Africa with respect to Iberia from shear-wave splitting,Geosci. Frontiers, 3(5), 681–696, doi:10.1016/j.gsf.2012.01.005.
Savage, M. K. (1999), Seismic anisotropy and mantle deformation: What have we learned from shear wave splitting?, Rev. Geophys., 37, 65–106, doi:10.1029/98RG02075.
Schaefer, J. F., L. Boschi, T. W. Becker, and E. Kissling (2011), Radial anisotropy in the European mantle: Tomographic studies explored interms of mantle flow, Geophys. Res. Lett., 38, L23304, doi:10.1029/2011GL049687.
Schmid, C., S. Van Der Lee, and D. Giardini (2004), Delay times and shear wave splitting in the Mediterranean region, Geophys. J. Int., 159,275–290, doi:10.1111/j.1365-246X.2004.02381.x.
Silver, P. G. (1996), Seismic anisotropy beneath the continents: Probing the depths of geology, Annu. Rev. Earth Planet. Sci., 24, 385–432.Silver, P. G., and W. W. Chan (1991), Shear wave splitting and subcontinental mantle deformation, J. Geophys. Res., 96, 16,429–16,454, doi:
10.1029/91JB00899.Stern, R. J. (1994), Arc assembly and continental collision in the Neoproterozoic East African Orogen: Implications for the consolidation of
Gondwanaland, Annu. Rev. Earth Planet. Sci., 22, 319–351.Stoeser, D. B., and V. E. Camp (1985), Pan-African microplate accretion of the Arabian Shield, Geol. Soc. Am. Bull., 96, 817–826, doi:10.1130/
0016–7606(1985)96<817:PMAOTA>2.0.CO;2.Tommasi, A. (1998), Forward modeling of the development of seismic anisotropy in the upper mantle, Earth Planet. Sci. Lett., 160(1), 1–13,
doi:10.1016/S0012–821X(98)00081-8.Tommasi, A., A. Vauchez, and R. Russo (1996), Seismic anisotropy in ocean basins: Resistive drag of the sublithospheric mantle?, Geophys.
Res. Lett., 23, 2991–2994, doi:10.1029/96GL02891.Vinnik, L. P., L. I. Makeyeva, A. Milev, and A. Y. Usenko (1992), Global patterns of azimuthal anisotropy and deformations in the continental
mantle, Geophys. J. Int., 111, 433–447, doi:10.1111/j.1365-246X.1992.tb02102.Walker, K. T., A. A. Nyblade, S. L. Klemperer, G. H. Bokelmann, and T. J. Owens (2004), On the relationship between extension and anisot-
ropy: Constraints from shear wave splitting across the East African Plateau, Geophys. J. Res., 109, B08302, doi:10.1029/2003JB002866.W€ustefeld, A., G. H. R. Bokelmann, G. Barruol, and J. P. Montagner (2009), Identifying global seismic anisotropy patterns by correlating
shear-wave splitting and surface-wave data, Phys. Earth Planet. Inter., 176, 198–212, doi:10.1016/j.pepi.2009.05.006.Yang, B. B., S. S. Gao, K. H. Liu, A. A. Elsheikh, A. A. Lemnifi, H. A. Refayee, and Y. Yu (2014), Seismic anisotropy and mantle flow beneath the
northern Great Plains of North America, J. Geophys. Res., 119, 2138–2152, doi:10.1002/2013JB010719.Zhang, S., and S. I. Karato (1995), Lattice preferred orientation of olivine aggregates deformed in simple shear, Nature, 375(6534), 774–777,
doi:10.1038/375774a0.
Geochemistry, Geophysics, Geosystems 10.1002/2014GC005706
LEMNIFI ET AL. ANISOTROPY BENEATH NORTH CENTRAL AFRICA 1114