awe k2 midterms
TRANSCRIPT
IS480: MIDTERM PRESENTATION
TEAM AWE-K2
KAREN TAY CHEW HUIYING ESTHER YEE ANDREW LEONG OW WEIXIANG
AGENDA
STORYBOARD
X-FACTOR
TECHNICAL COMPLEXITY
PROJECT MANAGEMENT
USER TESTING
TEAM REFLECTION
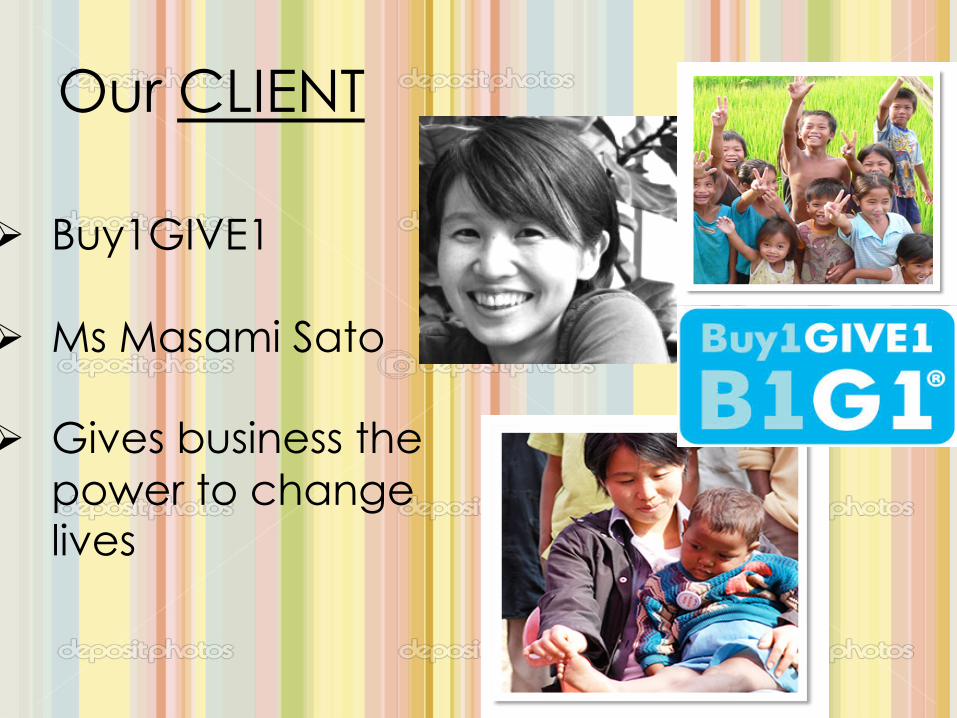
Our CLIENT Ø Buy1GIVE1 Ø Ms Masami Sato Ø Gives business the
power to change lives
PREVIOUSLY AT ACCEPTANCE Show link
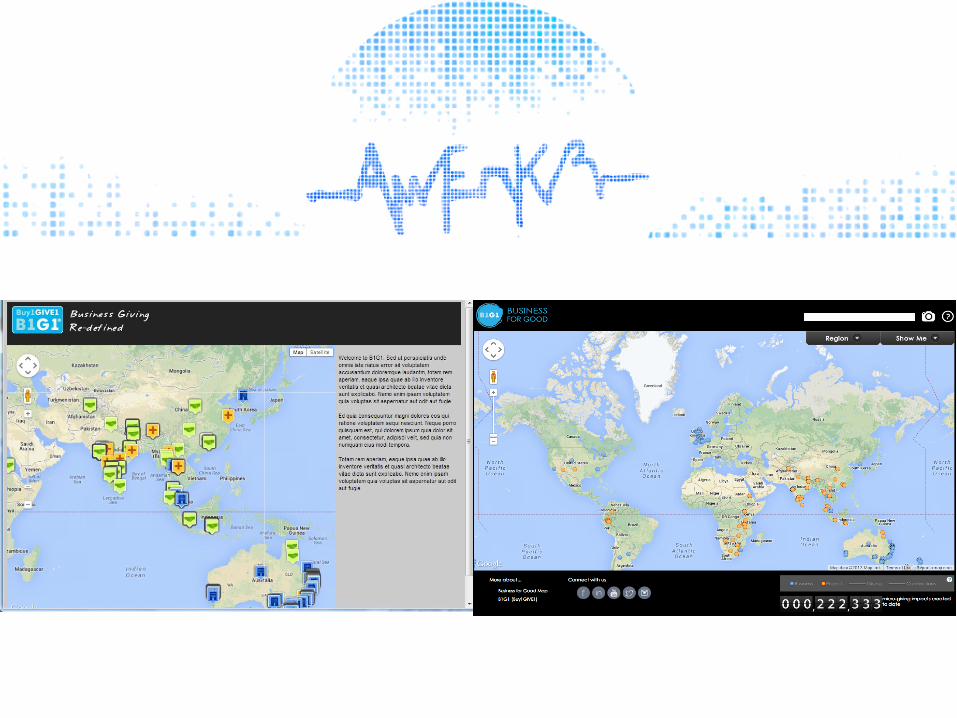
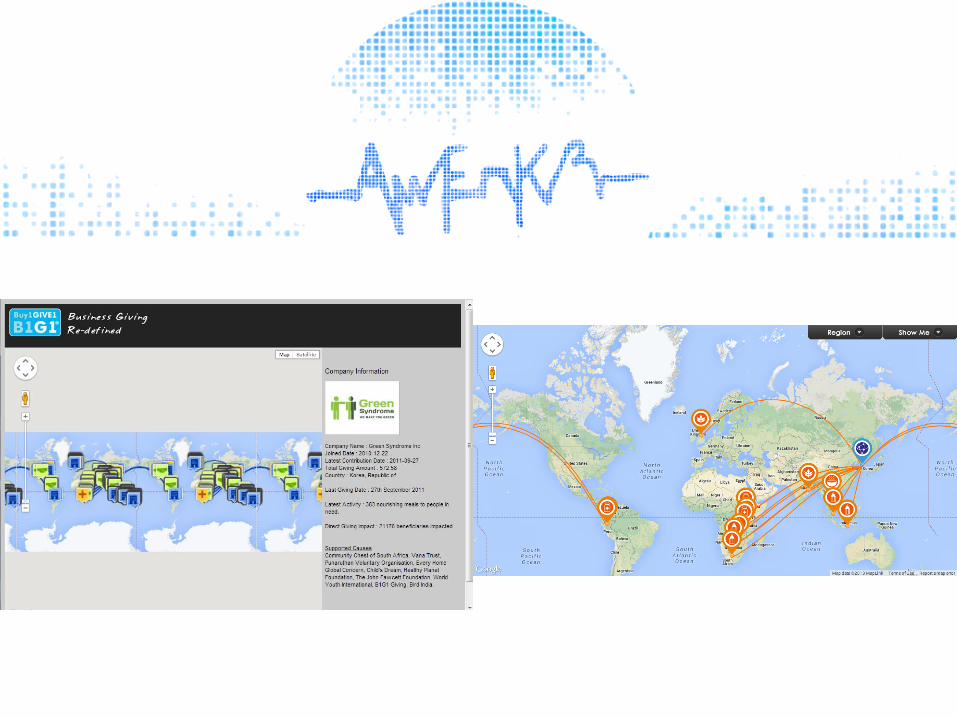
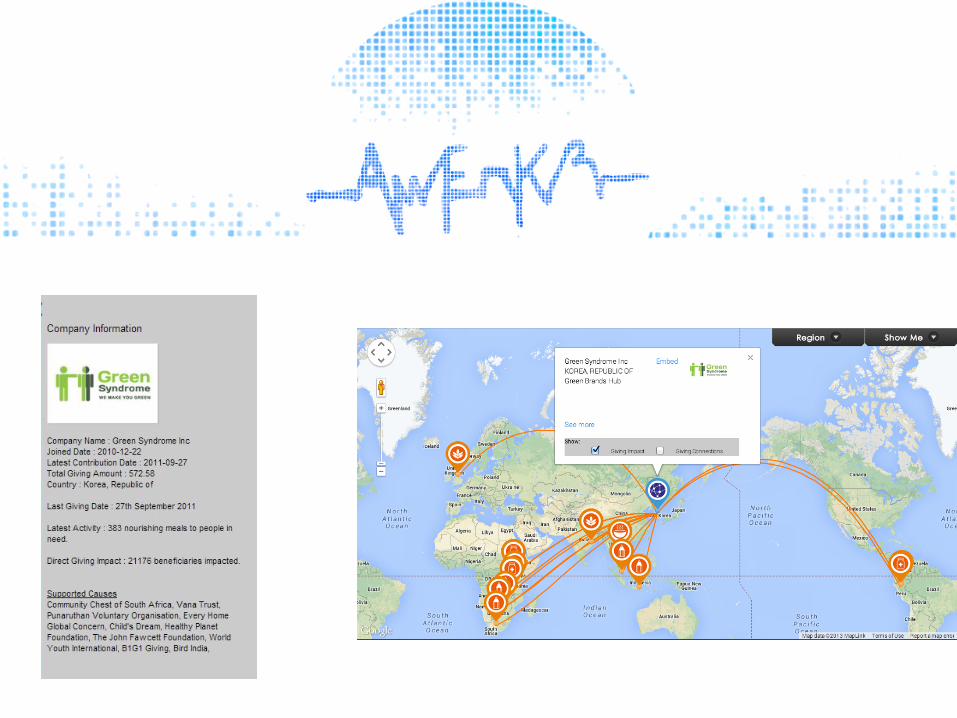
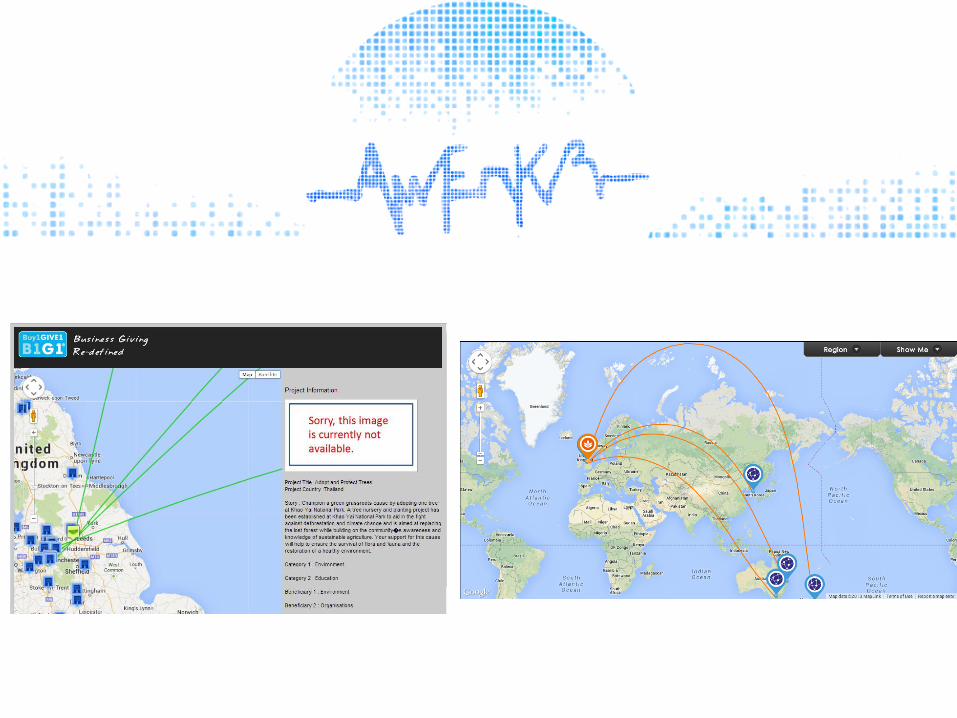
OTHER IMPLEMENTATIONS
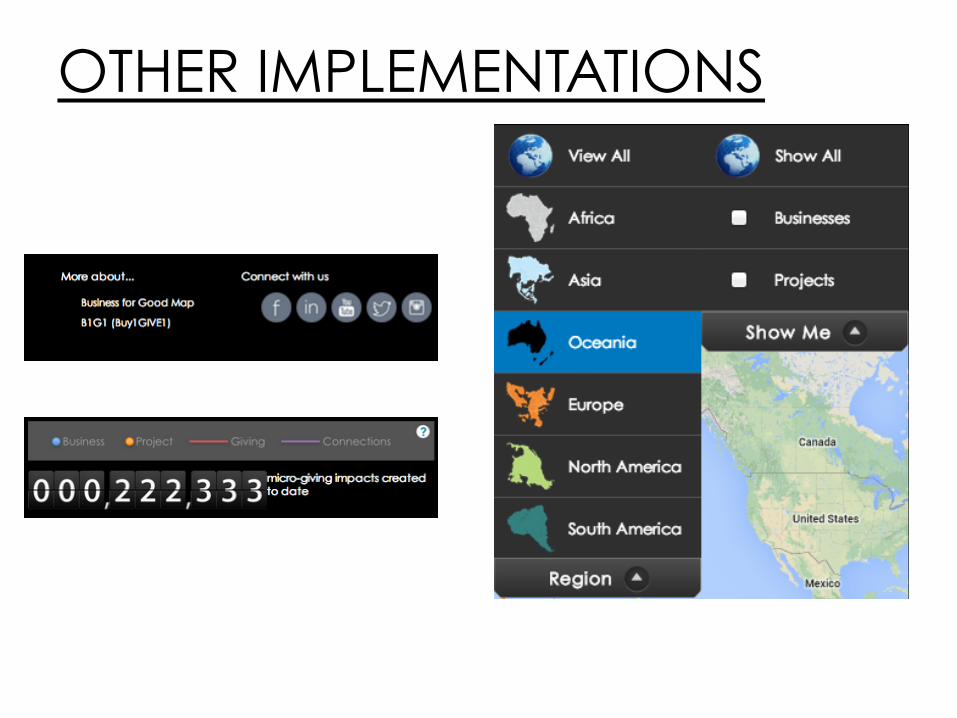
OTHER IMPLEMENTATIONS
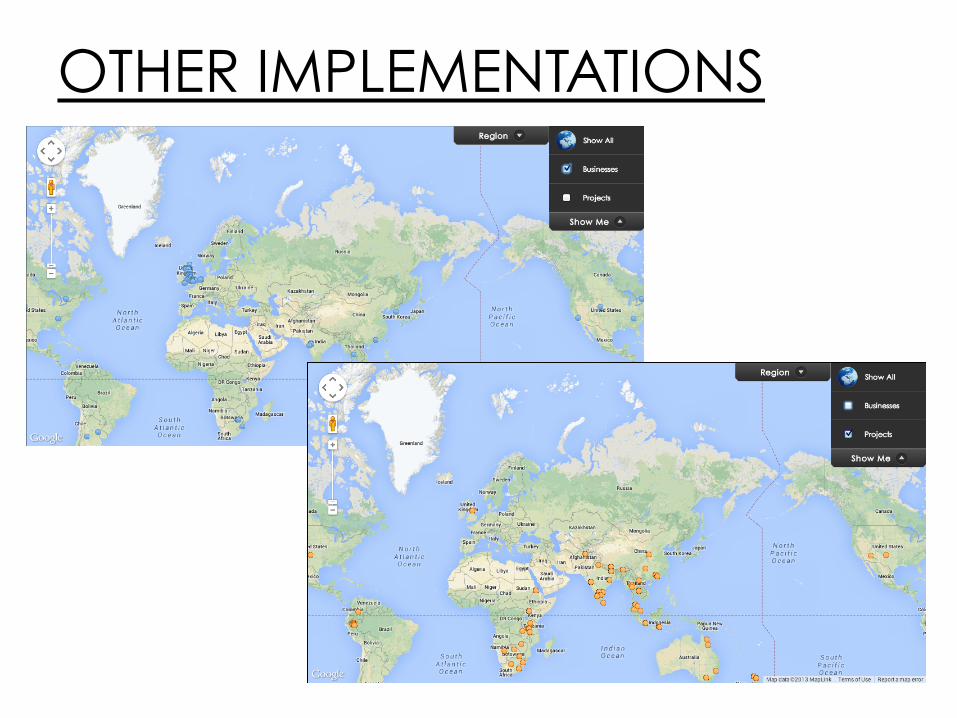
OTHER IMPLEMENTATIONS
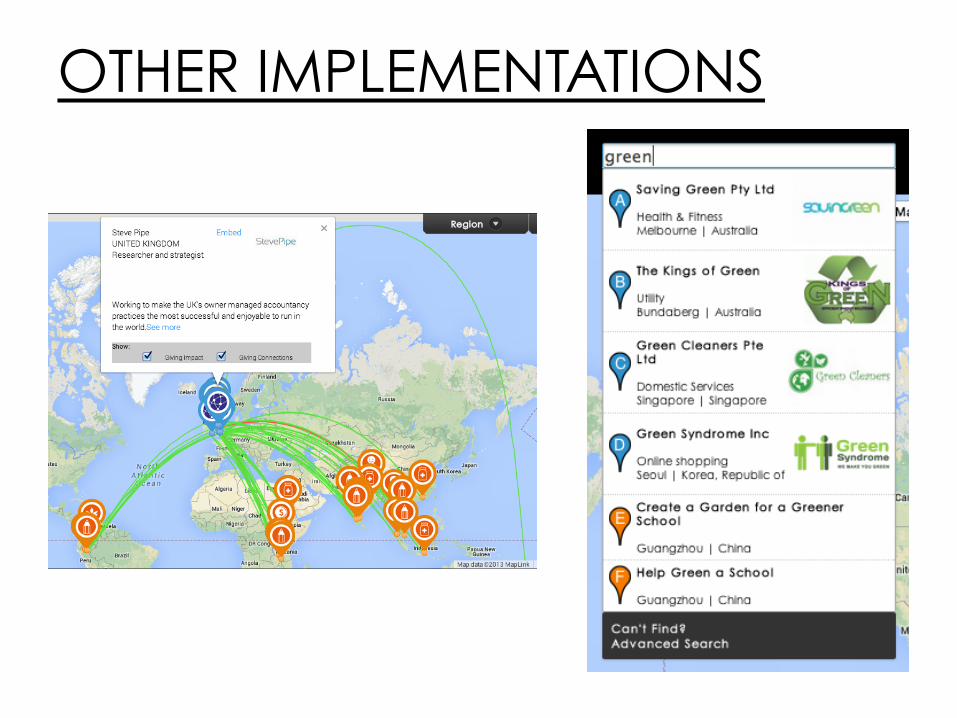
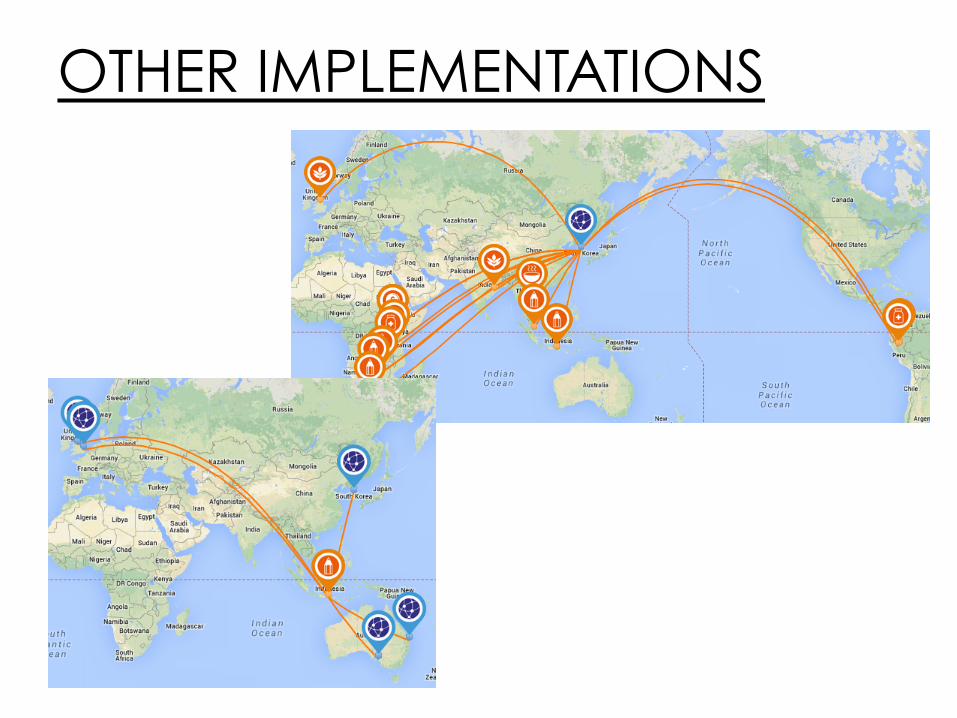
OTHER IMPLEMENTATIONS
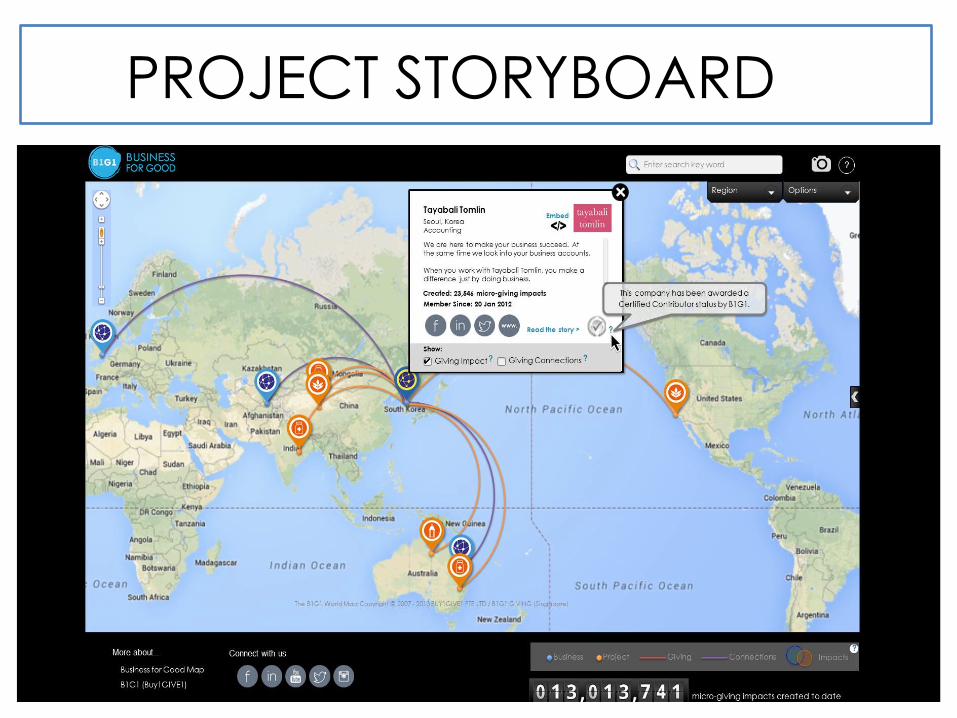
PROJECT STORYBOARD
User-‐centric Applica/on As Users, For Users.
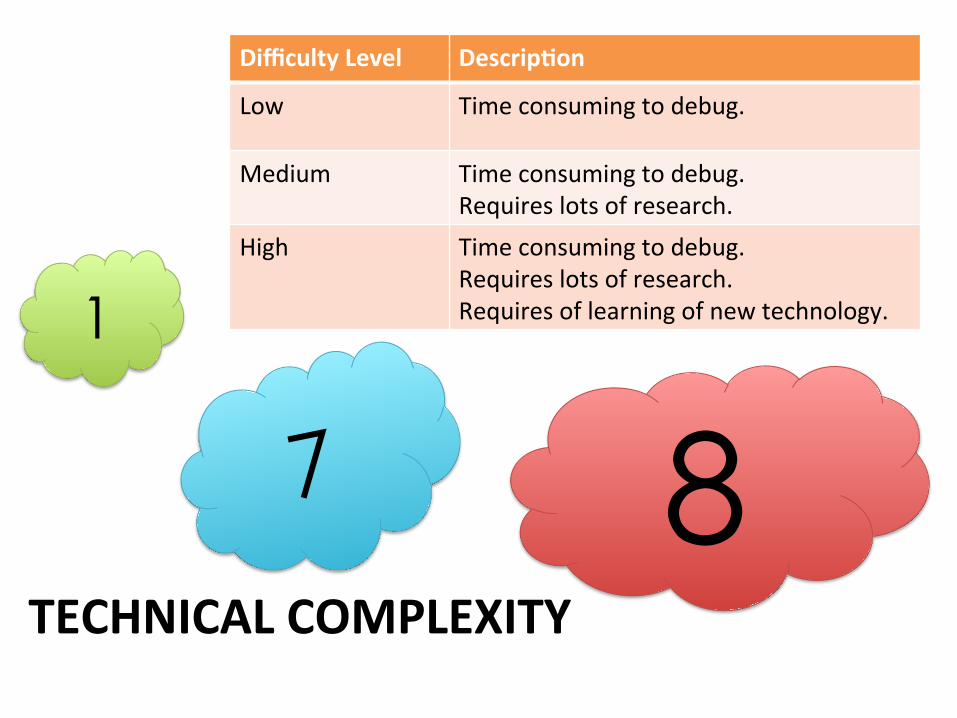
TECHNICAL COMPLEXITY
1
7 8
Difficulty Level Descrip<on
Low Time consuming to debug.
Medium Time consuming to debug. Requires lots of research.
High Time consuming to debug. Requires lots of research. Requires of learning of new technology.
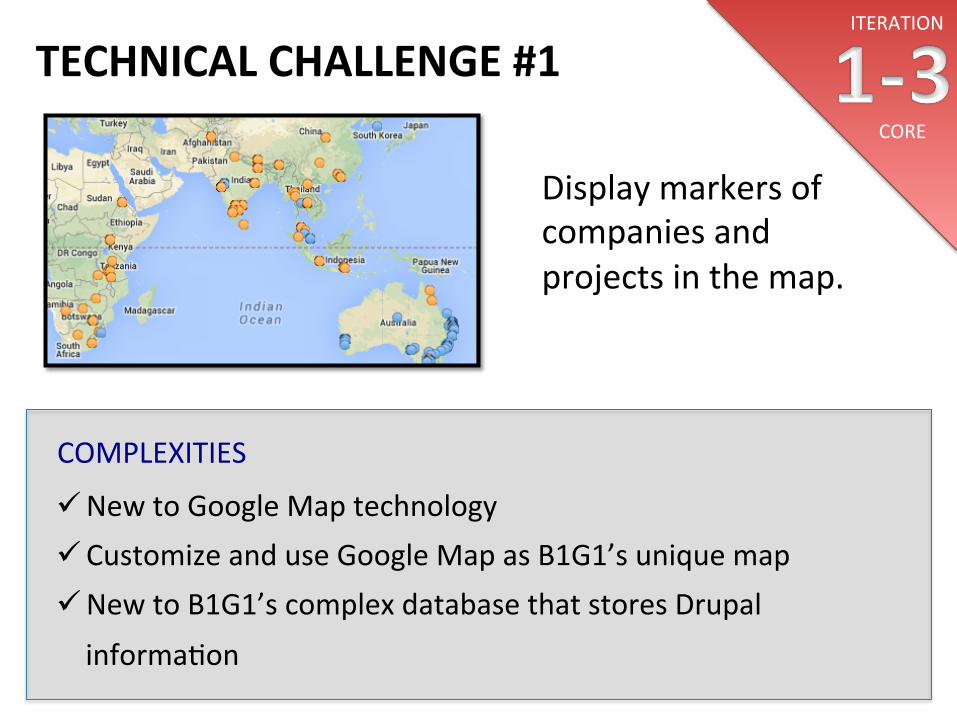
TECHNICAL CHALLENGE #1 ITERATION
Display markers of companies and projects in the map.
COMPLEXITIES
ü New to Google Map technology ü Customize and use Google Map as B1G1’s unique map ü New to B1G1’s complex database that stores Drupal
informa/on
CORE
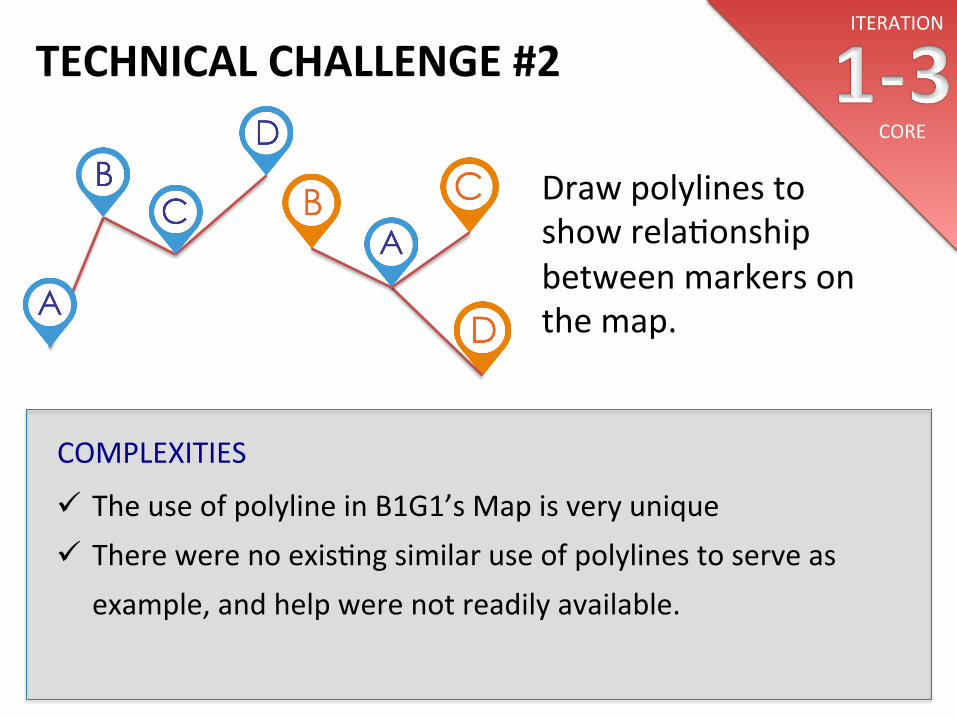
TECHNICAL CHALLENGE #2 ITERATION
Draw polylines to show rela/onship between markers on the map.
COMPLEXITIES
ü The use of polyline in B1G1’s Map is very unique ü There were no exis/ng similar use of polylines to serve as
example, and help were not readily available.
CORE
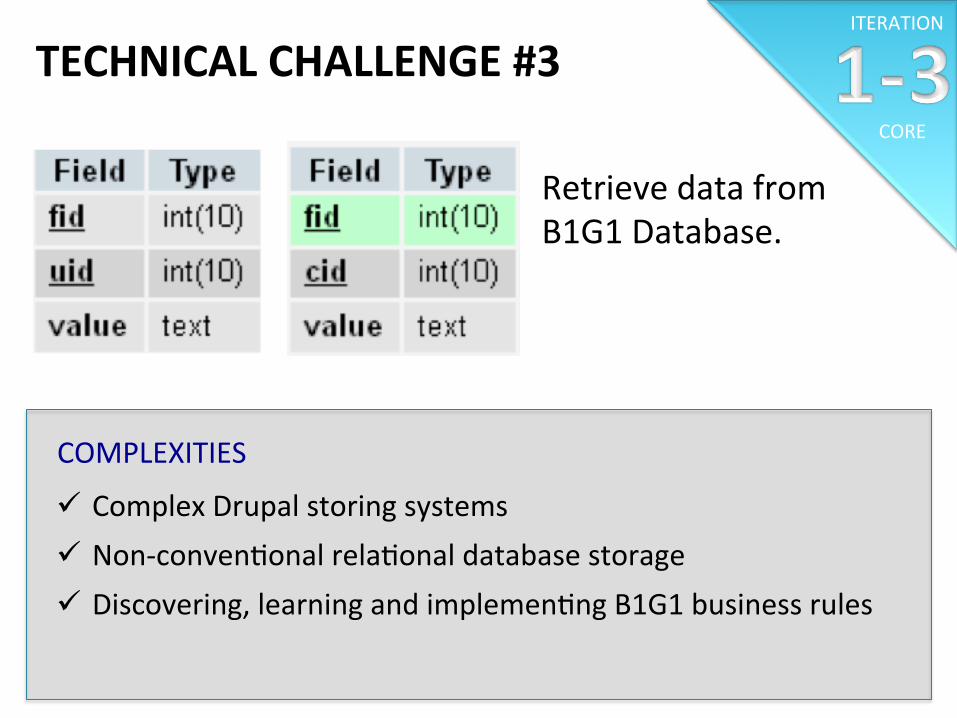
TECHNICAL CHALLENGE #3 ITERATION
Retrieve data from B1G1 Database.
COMPLEXITIES
ü Complex Drupal storing systems ü Non-‐conven/onal rela/onal database storage ü Discovering, learning and implemen/ng B1G1 business rules
CORE
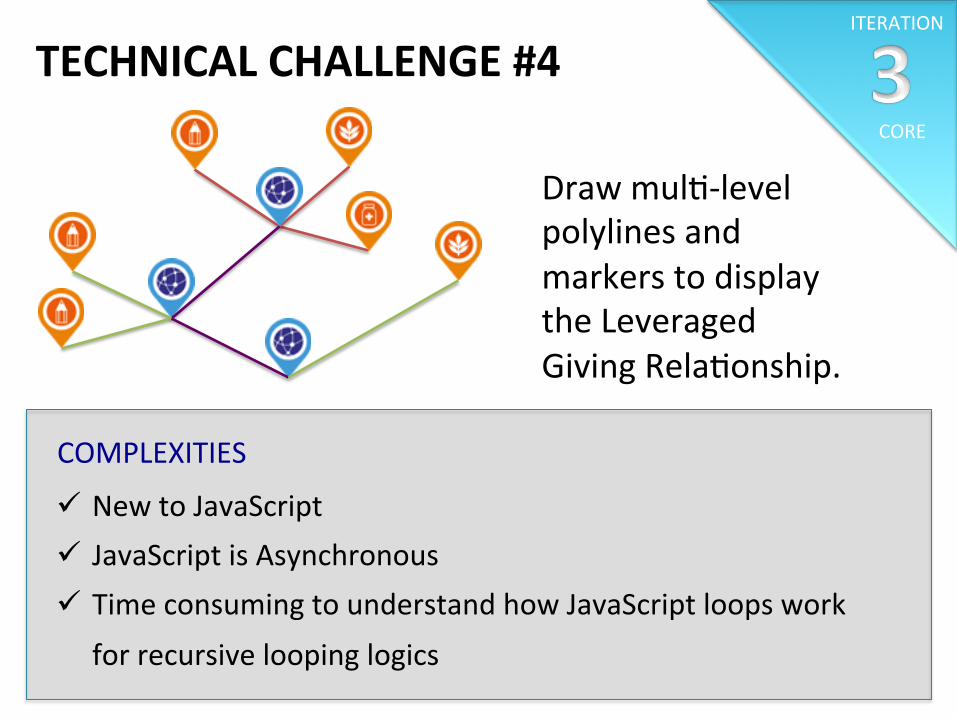
TECHNICAL CHALLENGE #4 ITERATION
Draw mul/-‐level polylines and markers to display the Leveraged Giving Rela/onship.
COMPLEXITIES
ü New to JavaScript ü JavaScript is Asynchronous ü Time consuming to understand how JavaScript loops work
for recursive looping logics
CORE
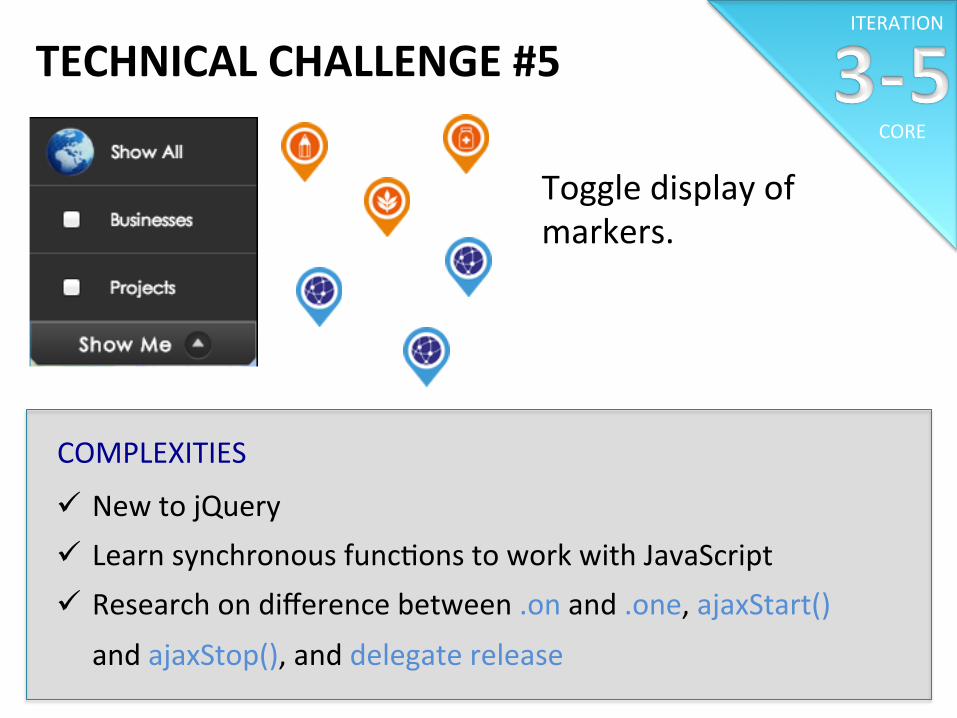
TECHNICAL CHALLENGE #5 ITERATION
Toggle display of markers.
COMPLEXITIES
ü New to jQuery ü Learn synchronous func/ons to work with JavaScript ü Research on difference between .on and .one, ajaxStart()
and ajaxStop(), and delegate release
CORE
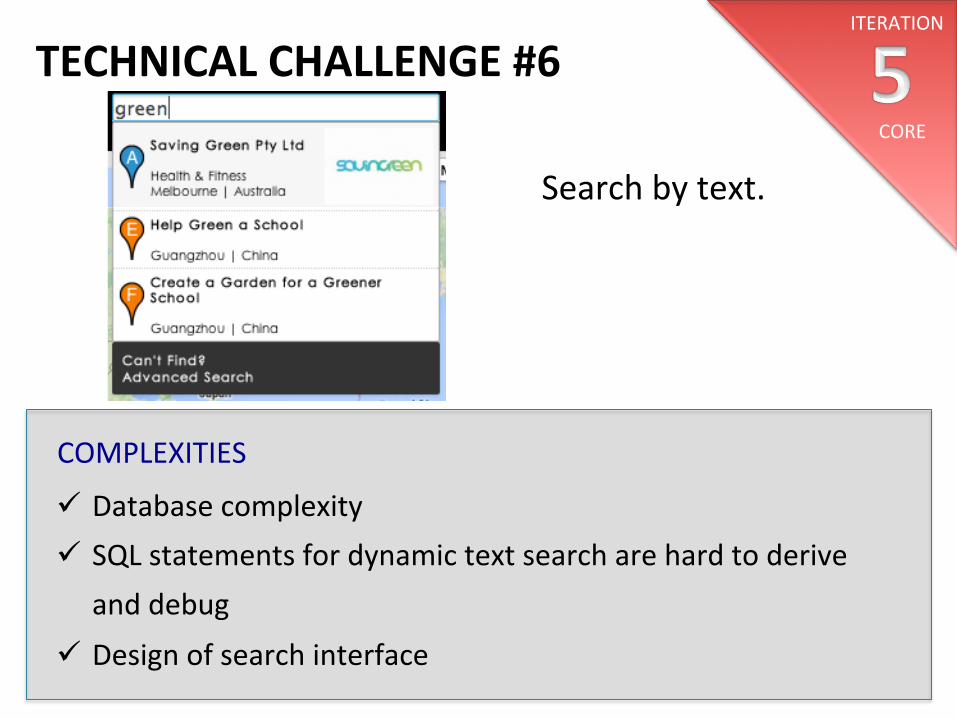
TECHNICAL CHALLENGE #6 ITERATION
Search by text.
COMPLEXITIES
ü Database complexity ü SQL statements for dynamic text search are hard to derive
and debug
ü Design of search interface
CORE
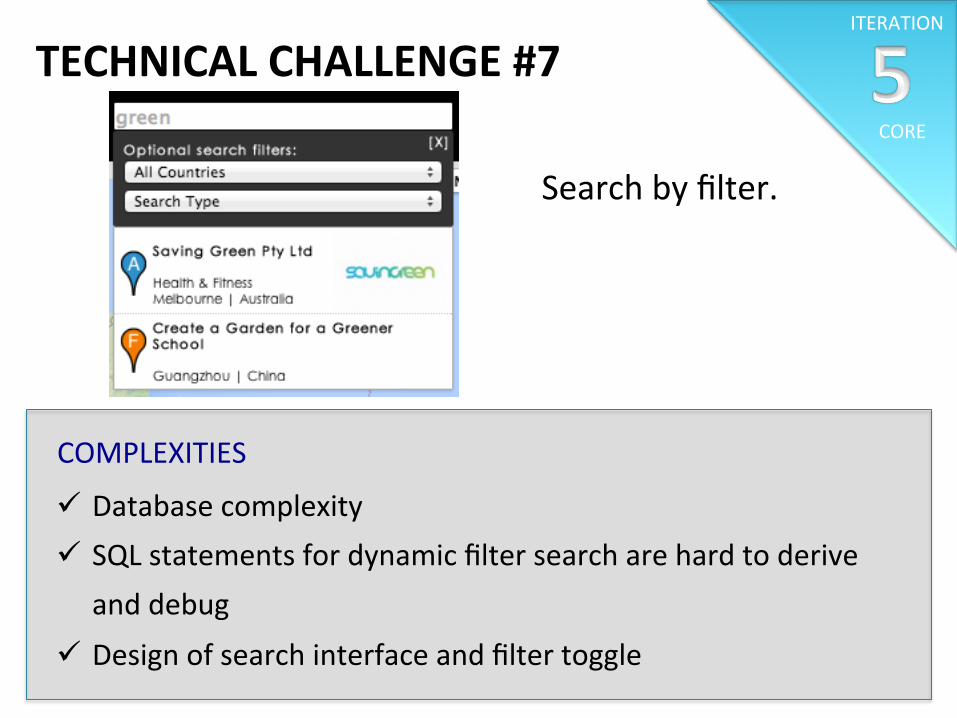
TECHNICAL CHALLENGE #7 ITERATION
Search by filter.
COMPLEXITIES
ü Database complexity ü SQL statements for dynamic filter search are hard to derive
and debug
ü Design of search interface and filter toggle
CORE
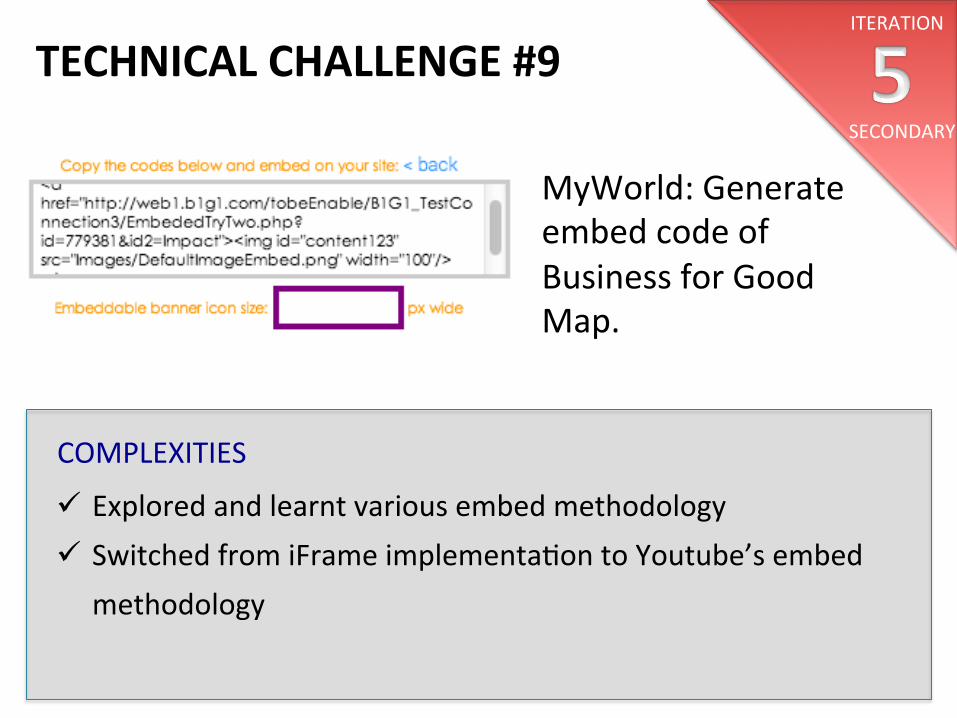
TECHNICAL CHALLENGE #9 ITERATION
MyWorld: Generate embed code of Business for Good Map.
COMPLEXITIES
ü Explored and learnt various embed methodology ü Switched from iFrame implementa/on to Youtube’s embed
methodology
SECONDARY
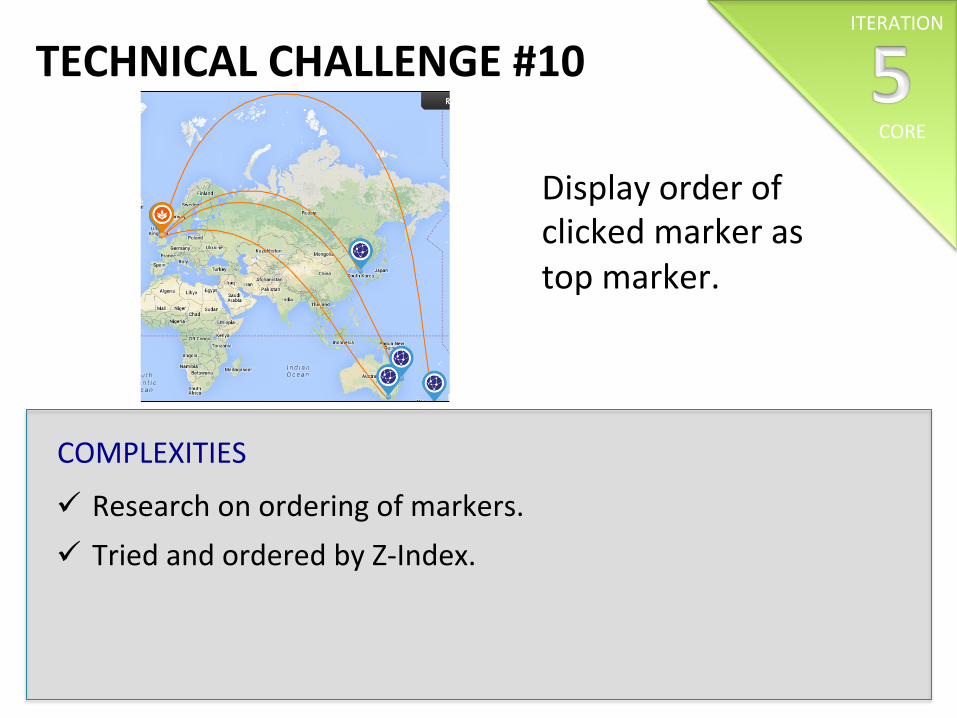
TECHNICAL CHALLENGE #10 ITERATION
Display order of clicked marker as top marker.
COMPLEXITIES
ü Research on ordering of markers. ü Tried and ordered by Z-‐Index.
CORE
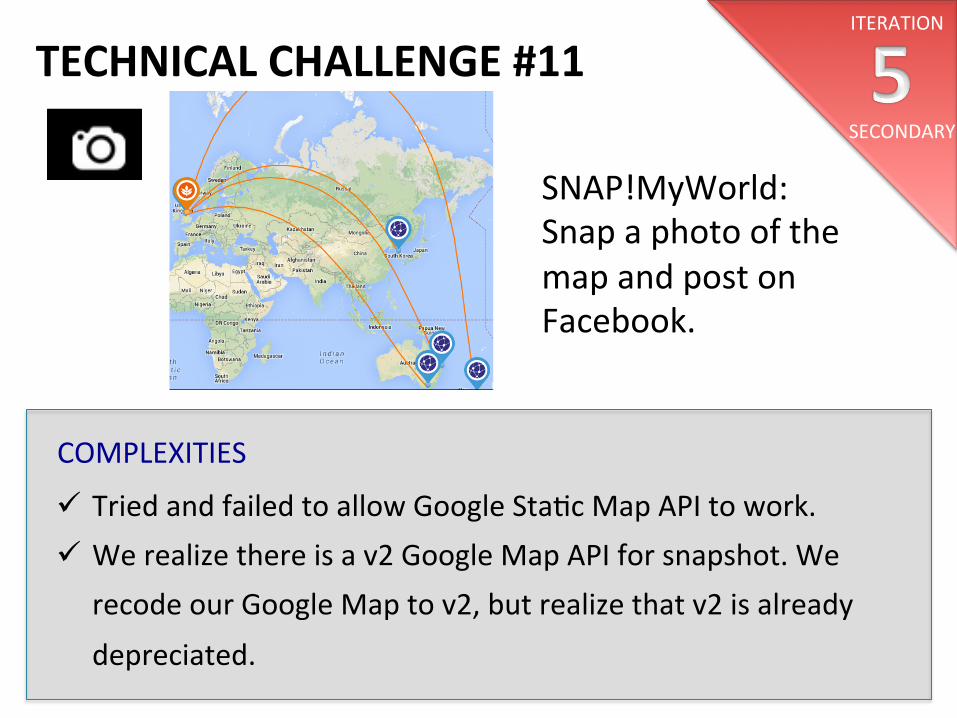
TECHNICAL CHALLENGE #11 ITERATION
SNAP!MyWorld: Snap a photo of the map and post on Facebook.
COMPLEXITIES
ü Tried and failed to allow Google Sta/c Map API to work. ü We realize there is a v2 Google Map API for snapshot. We
recode our Google Map to v2, but realize that v2 is already
depreciated.
SECONDARY
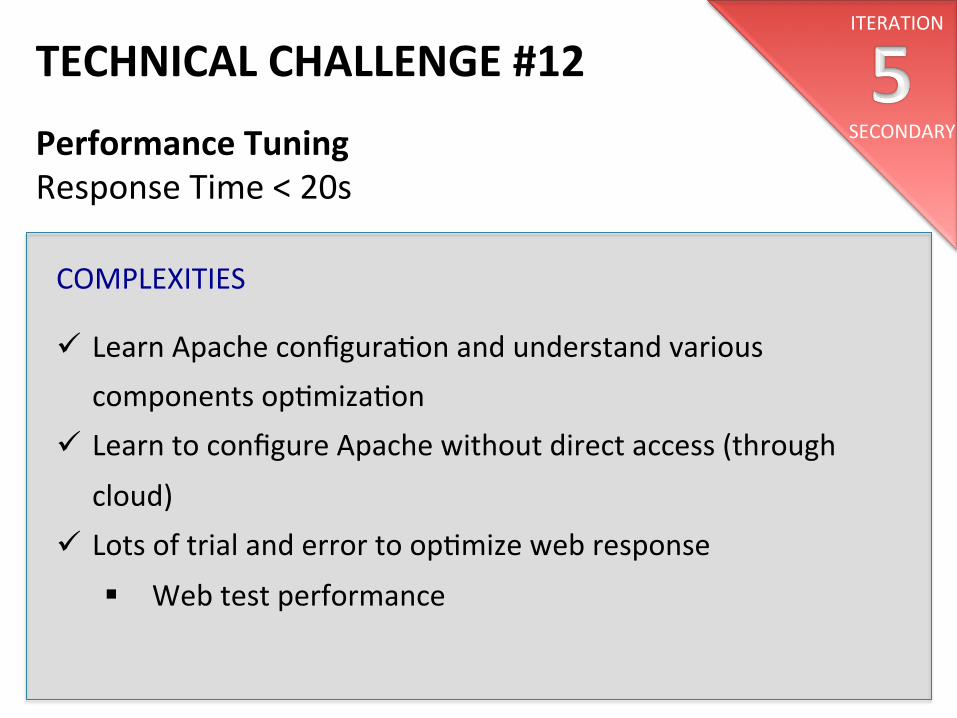
TECHNICAL CHALLENGE #12 ITERATION
Performance Tuning Response Time < 20s
COMPLEXITIES
ü Learn Apache configura/on and understand various components op/miza/on
ü Learn to configure Apache without direct access (through cloud)
ü Lots of trial and error to op/mize web response
§ Web test performance
SECONDARY
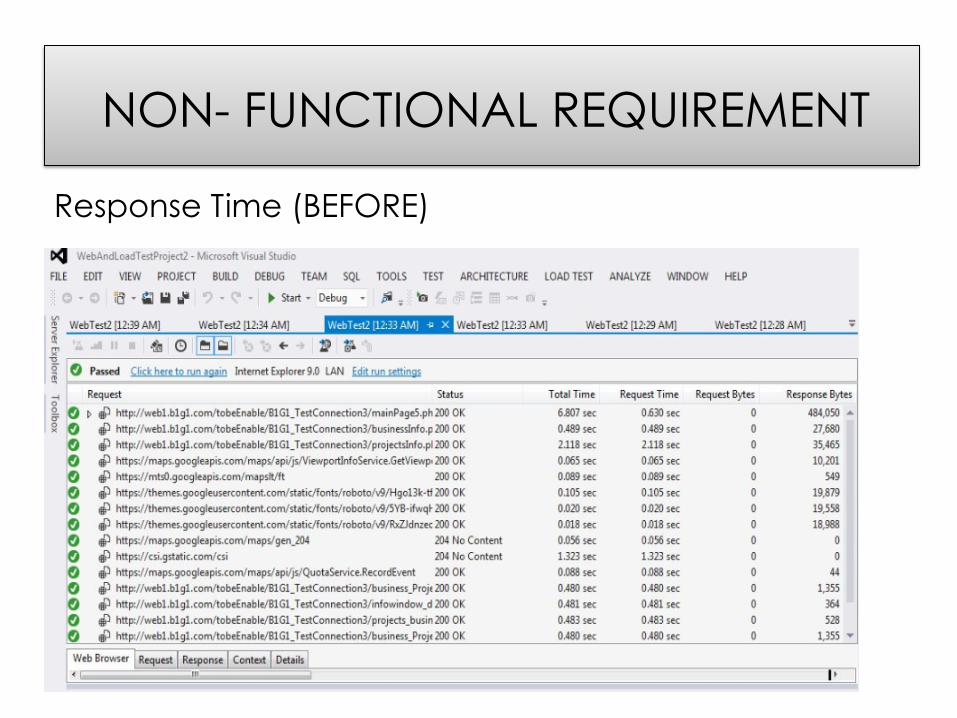
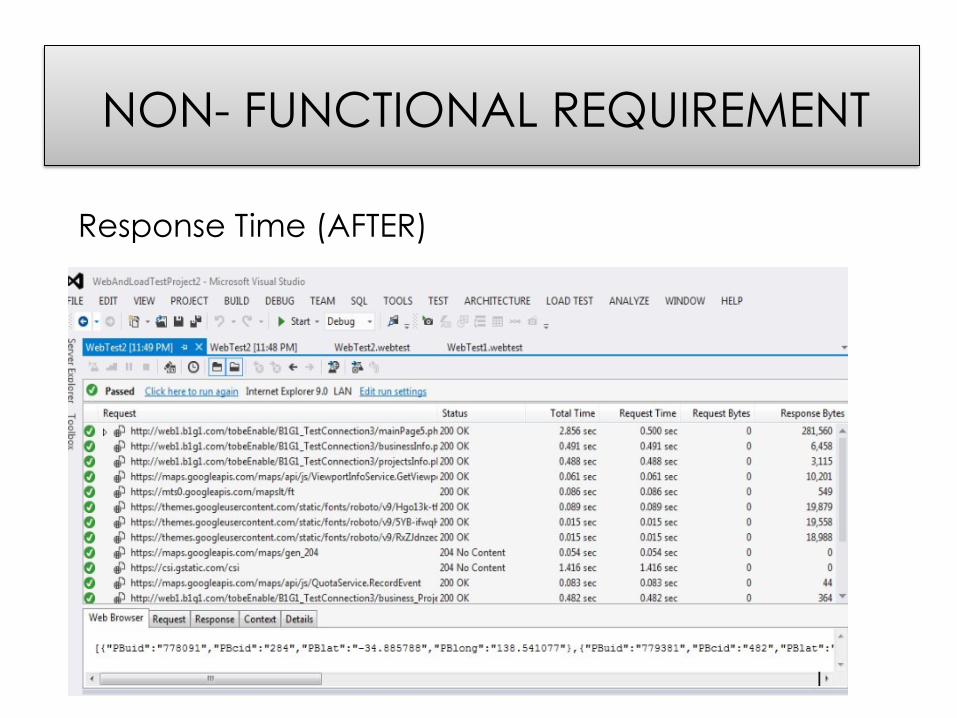
NON- FUNCTIONAL REQUIREMENT
Response Time (BEFORE)
NON- FUNCTIONAL REQUIREMENT
Response Time (AFTER)
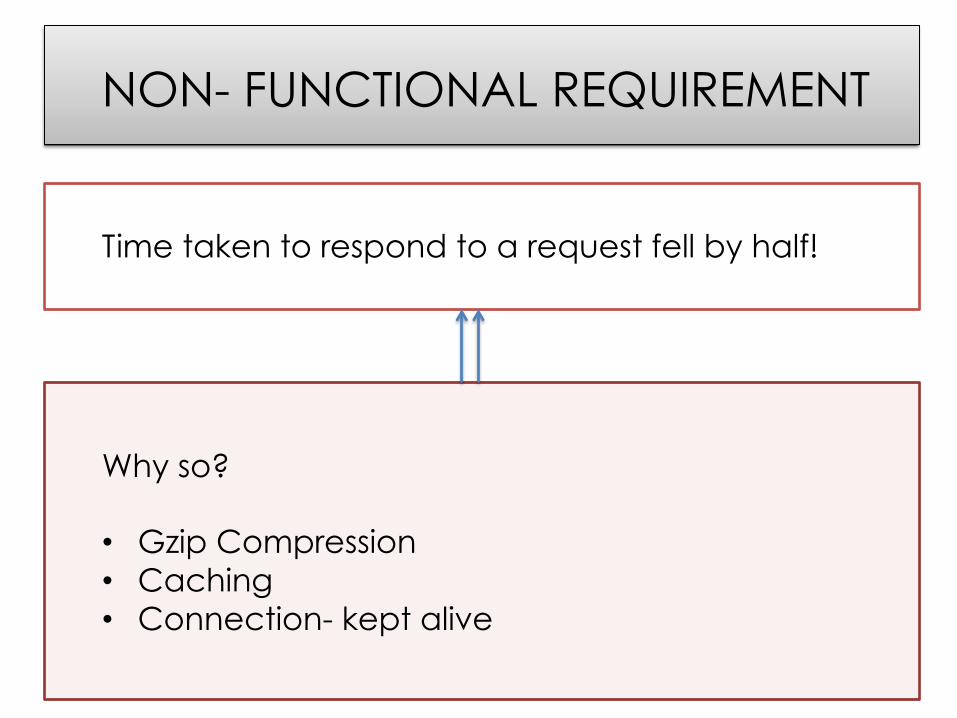
NON- FUNCTIONAL REQUIREMENT
Time taken to respond to a request fell by half!
Why so? • Gzip Compression • Caching • Connection- kept alive
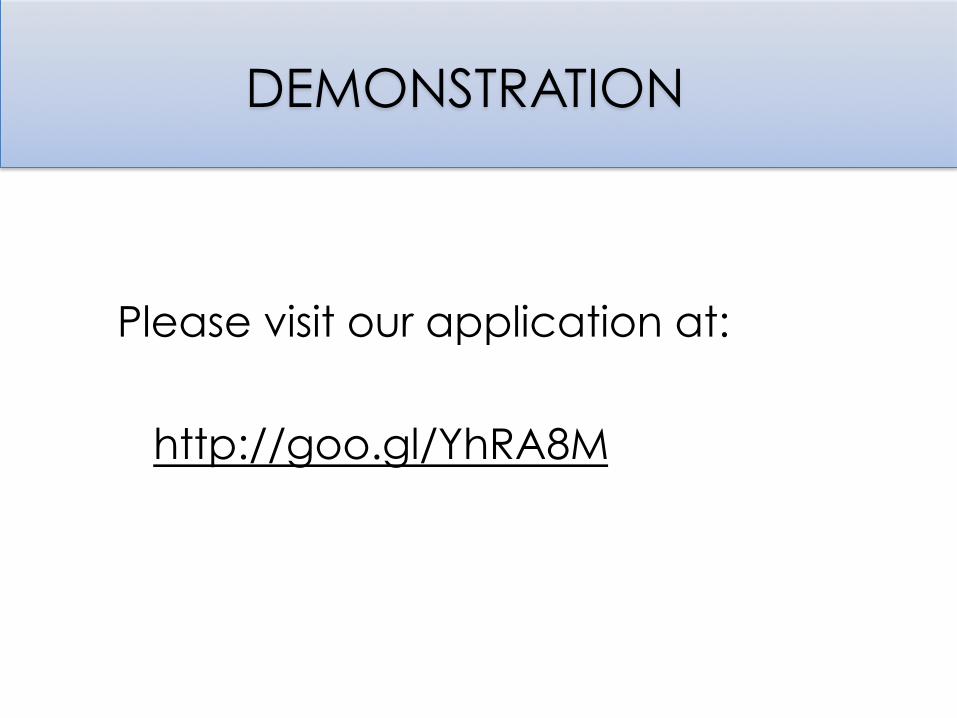
DEMONSTRATION
Please visit our application at:
http://goo.gl/YhRA8M
PROJECT MANAGEMENT
• Project Status • Project Highlights • Project Scope • Project Schedule • Metrics • Risks
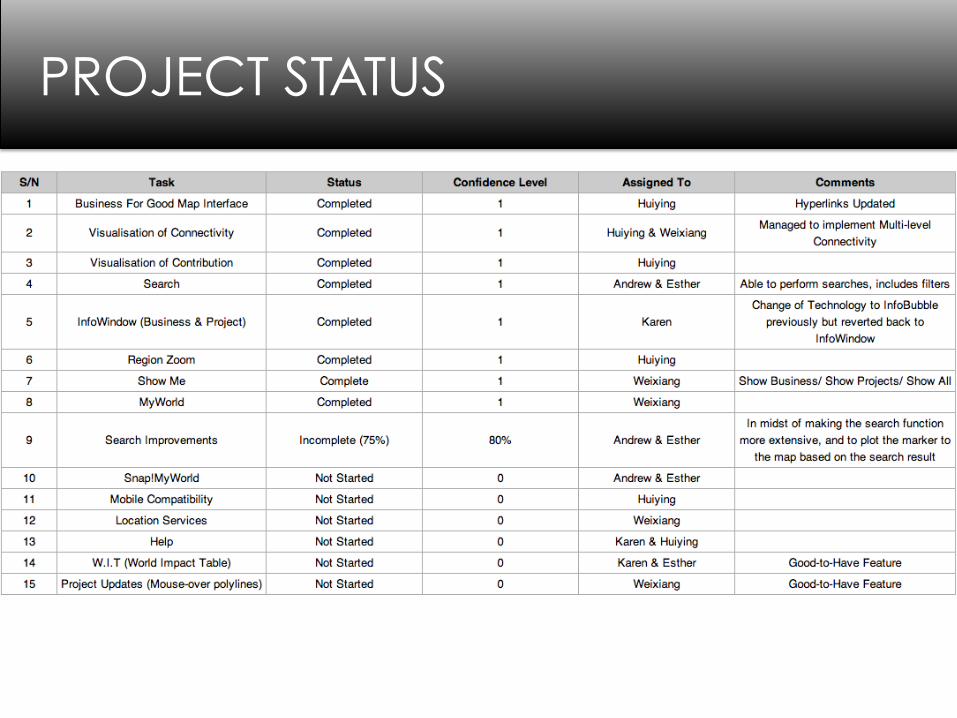
PROJECT STATUS
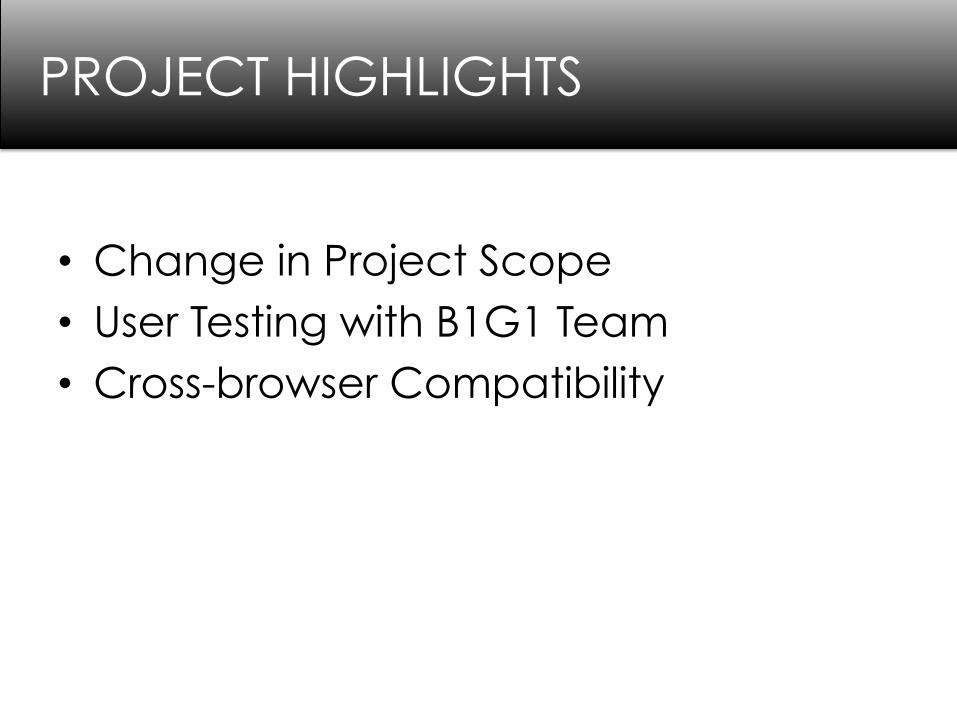
• Change in Project Scope • User Testing with B1G1 Team • Cross-browser Compatibility
PROJECT HIGHLIGHTS
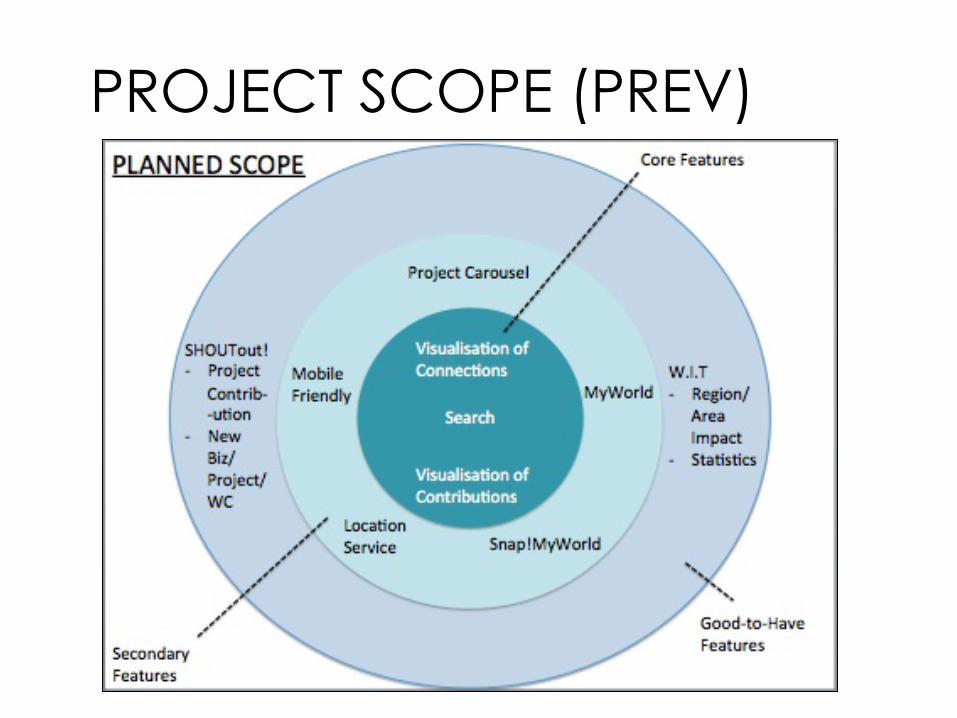
PROJECT SCOPE (PREV)
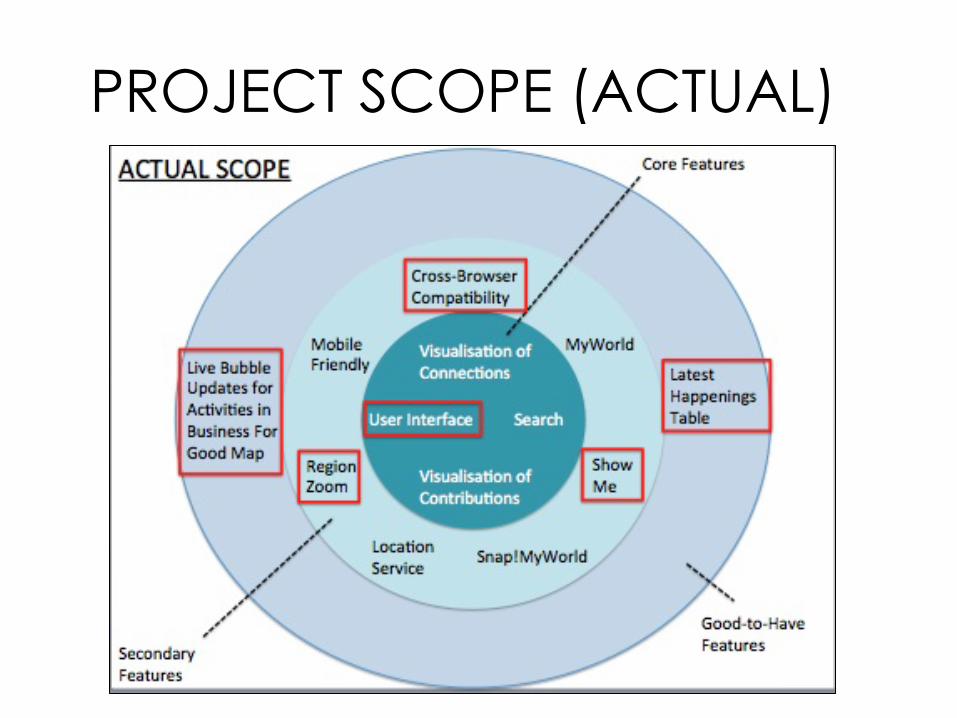
PROJECT SCOPE (ACTUAL)
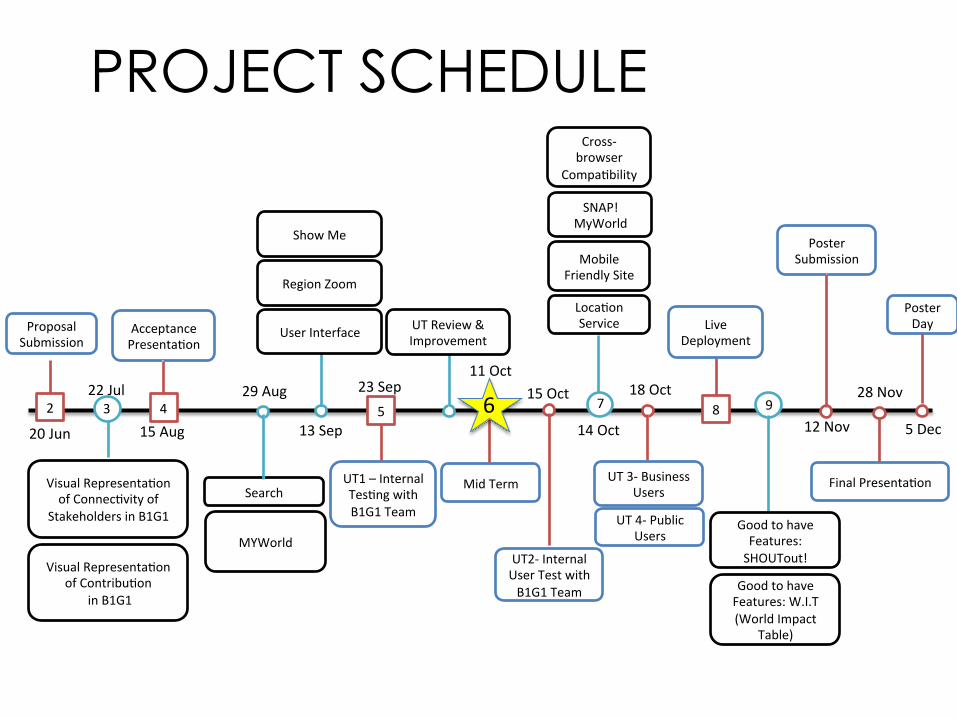
2 20 Jun
Proposal Submission
15 Aug
Acceptance Presenta/on
Poster Day
Poster Submission
Mid Term UT1 – Internal Tes/ng with B1G1 Team
Final Presenta/on Visual Representa/on of Connec/vity of
Stakeholders in B1G1
MYWorld
Visual Representa/on of Contribu/on
in B1G1
Search
Mobile Friendly Site
12 Nov
28 Nov
5 Dec
22 Jul 29 Aug 23 Sep 11 Oct
18 Oct
13 Sep 14 Oct
Loca/on Service Live
Deployment
Good to have Features: SHOUTout!
Good to have Features: W.I.T (World Impact
Table)
User Interface UT Review & Improvement
UT 3-‐ Business Users
SNAP!MyWorld
Cross-‐browser
Compa/bility
UT2-‐ Internal User Test with B1G1 Team
15 Oct
Region Zoom
Show Me
2 3 4 5 7 8 9 6
UT 4-‐ Public Users
PROJECT SCHEDULE
‘s TIMELINE
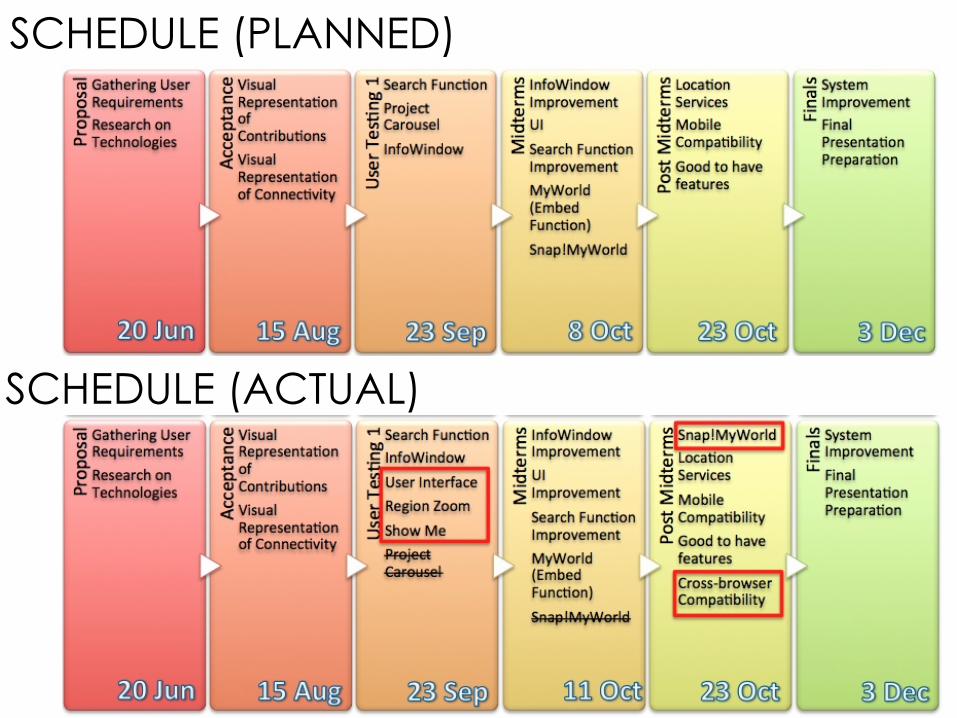
SCHEDULE (PLANNED)
SCHEDULE (ACTUAL)
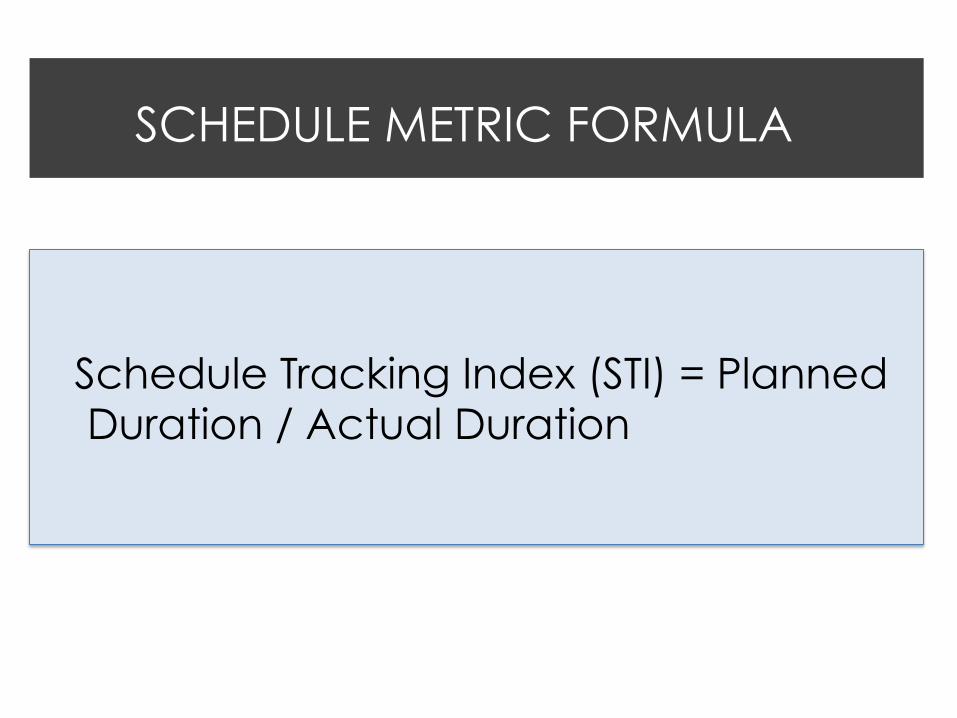
SCHEDULE METRIC FORMULA
Schedule Tracking Index (STI) = Planned Duration / Actual Duration
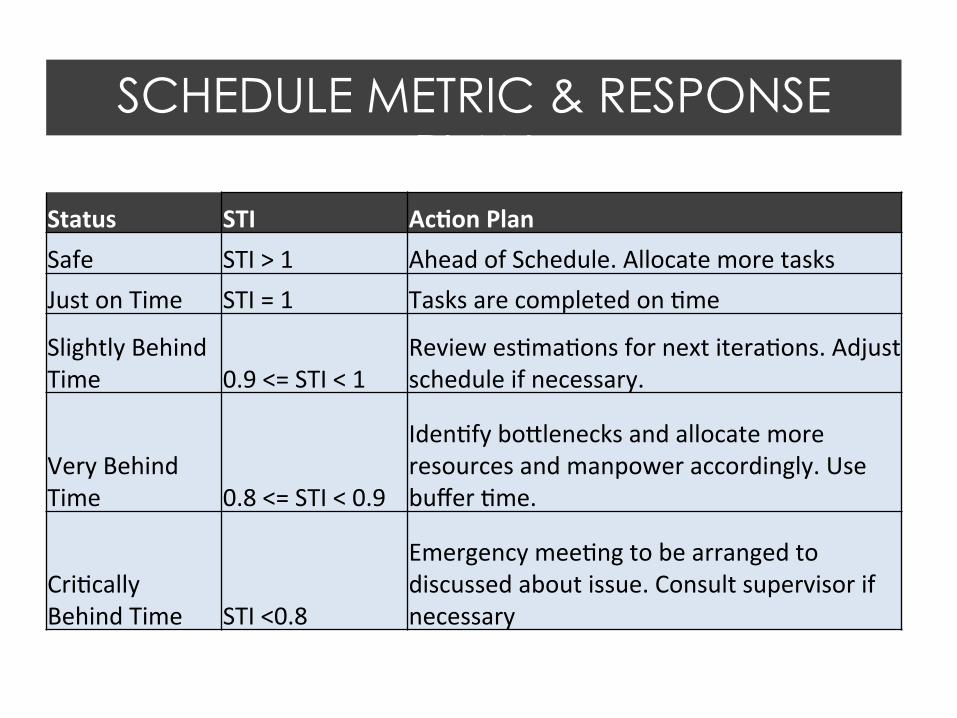
Status STI Ac<on Plan Safe STI > 1 Ahead of Schedule. Allocate more tasks Just on Time STI = 1 Tasks are completed on /me
Slightly Behind Time 0.9 <= STI < 1
Review es/ma/ons for next itera/ons. Adjust schedule if necessary.
Very Behind Time 0.8 <= STI < 0.9
Iden/fy boolenecks and allocate more resources and manpower accordingly. Use buffer /me.
Cri/cally Behind Time STI <0.8
Emergency mee/ng to be arranged to discussed about issue. Consult supervisor if necessary
SCHEDULE METRIC & RESPONSE PLAN
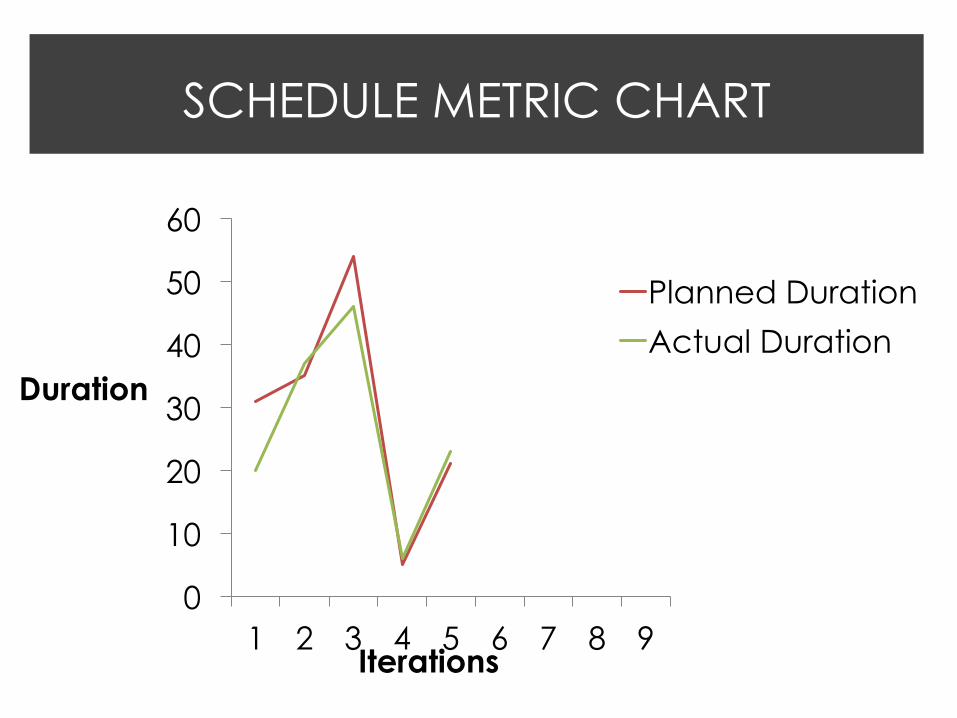
0
10
20
30
40
50
60
1 2 3 4 5 6 7 8 9
Duration
Iterations
Planned Duration
Actual Duration
SCHEDULE METRIC CHART
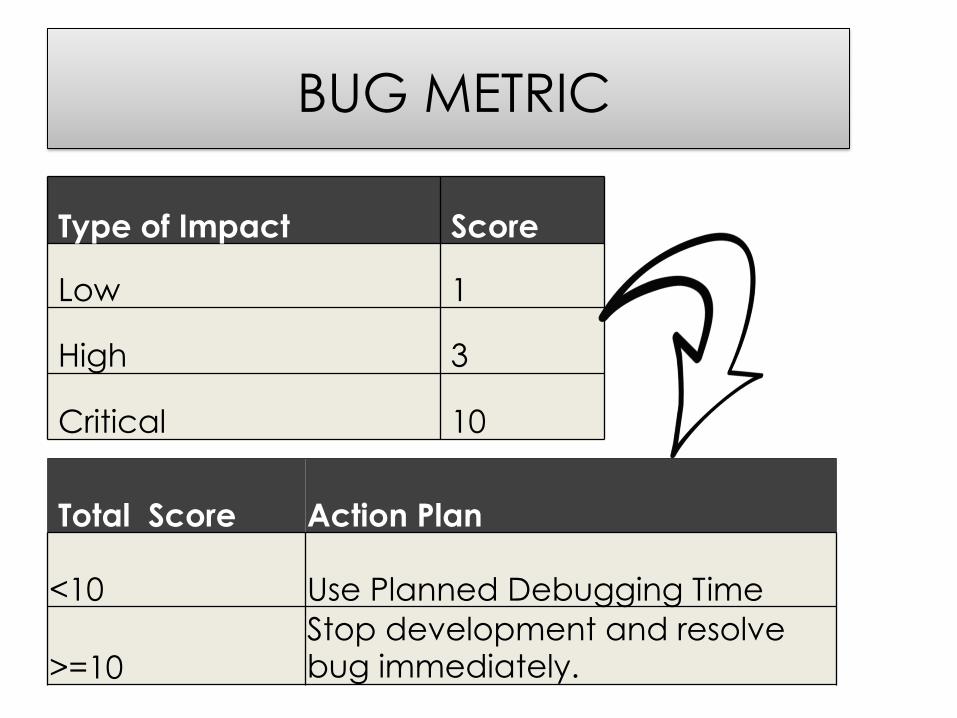
BUG METRIC
Type of Impact Score
Low 1
High 3
Critical 10
Total Score Action Plan
<10 Use Planned Debugging Time
>=10 Stop development and resolve bug immediately.
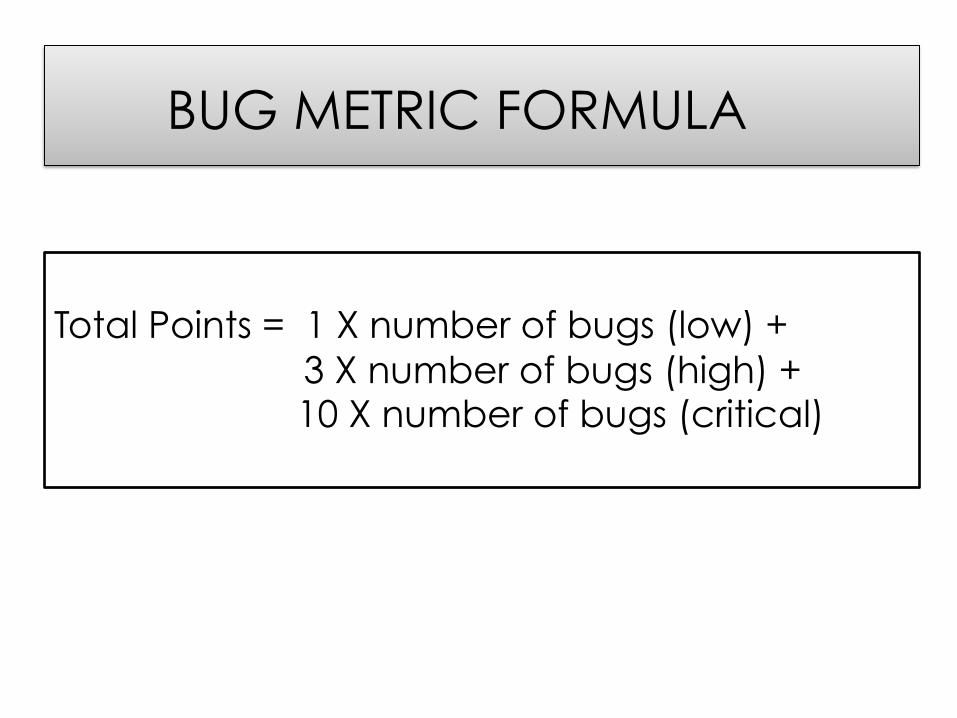
BUG METRIC FORMULA
Total Points = 1 X number of bugs (low) +
3 X number of bugs (high) + 10 X number of bugs (critical)
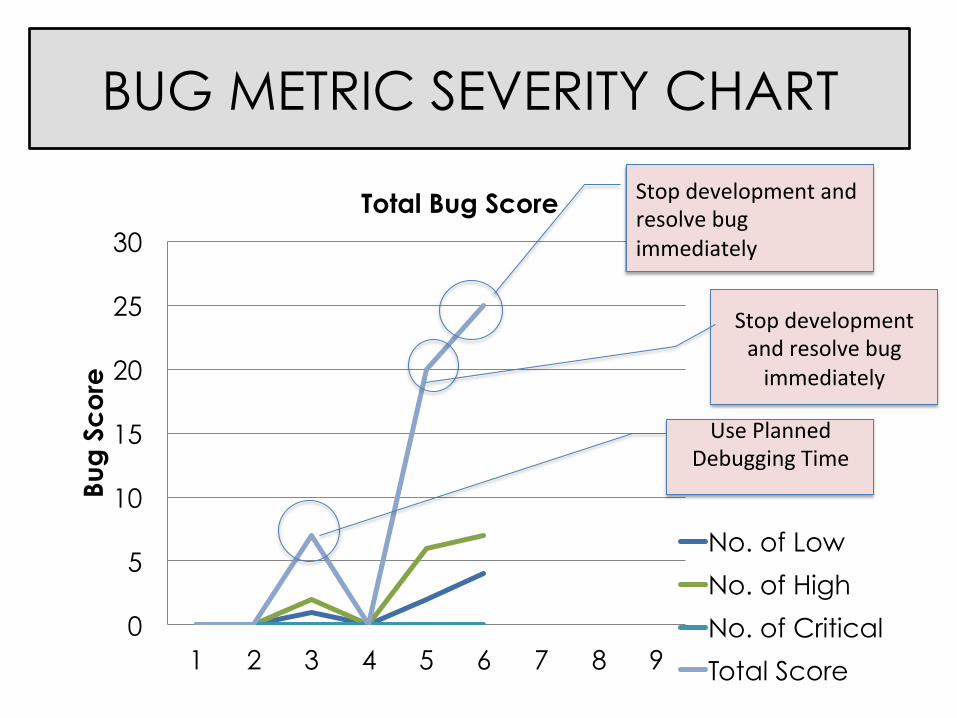
BUG METRIC SEVERITY CHART
0
5
10
15
20
25
30
1 2 3 4 5 6 7 8 9
Bug
Sc
ore
Total Bug Score
No. of Low
No. of High
No. of Critical
Total Score
Use Planned Debugging Time
Stop development and resolve bug immediately
Stop development and resolve bug immediately
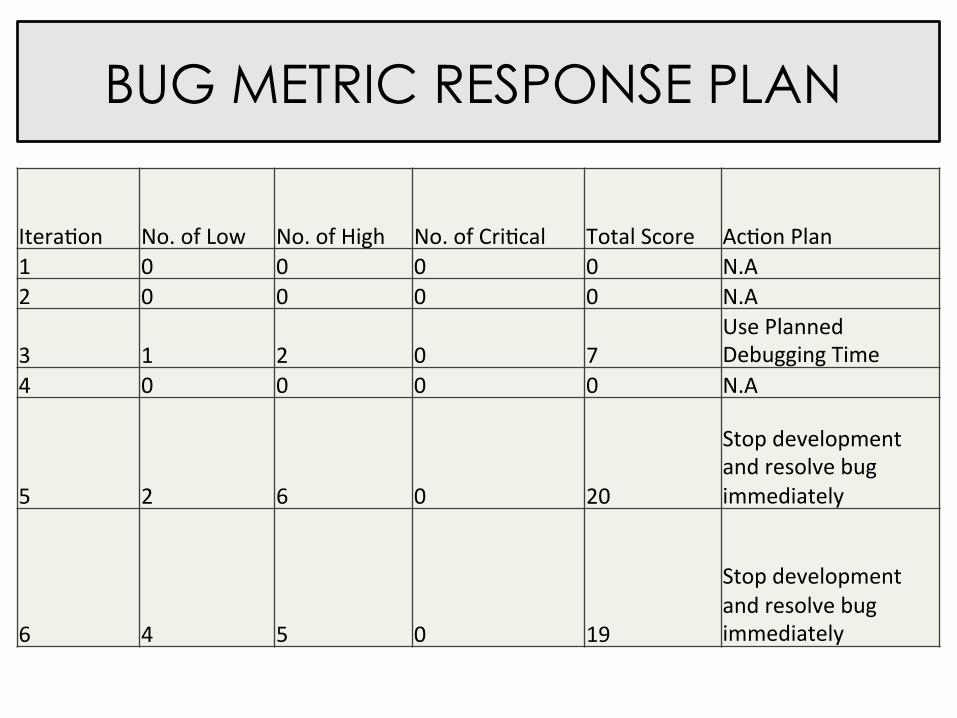
BUG METRIC RESPONSE PLAN
Itera/on No. of Low No. of High No. of Cri/cal Total Score Ac/on Plan 1 0 0 0 0 N.A 2 0 0 0 0 N.A
3 1 2 0 7 Use Planned Debugging Time
4 0 0 0 0 N.A
5 2 6 0 20
Stop development and resolve bug immediately
6 4 5 0 19
Stop development and resolve bug immediately

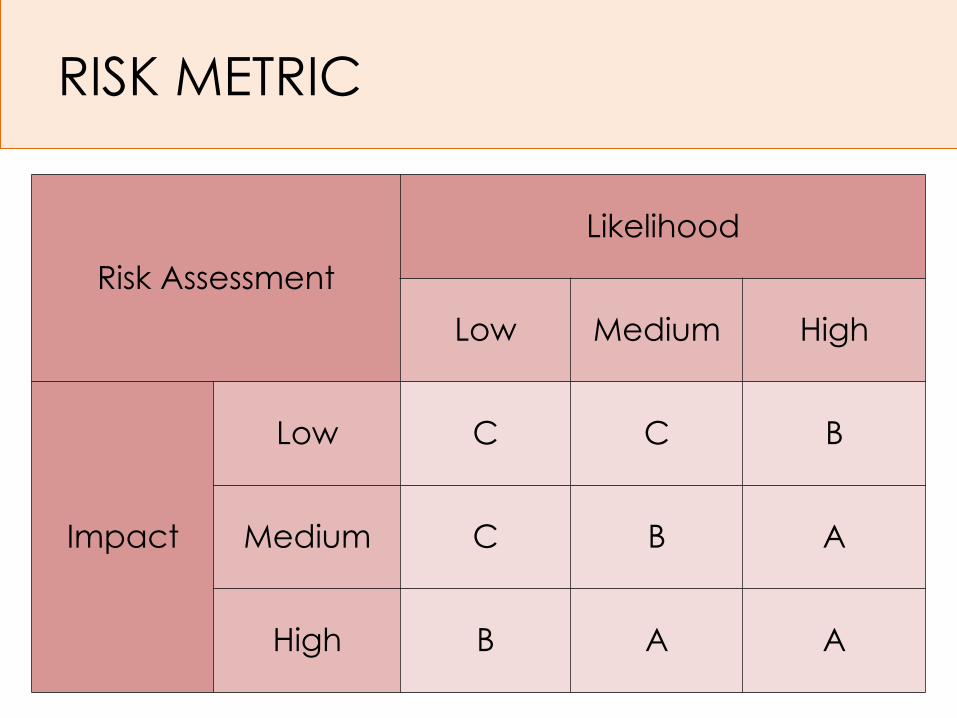
RISK METRIC
Risk Assessment
Likelihood
Low Medium High
Impact
Low C C B
Medium C B A
High B A A
Risk 1: Not able to launch application in accordance to B1G1 Marketing Plan before finals.
Mitigation Strategy: Vigorous testing on application and to keep Client updated on progress.
Risk 2: Cross-browser Compatibility
Mitigation Strategy: Discuss with client on their base acceptance level. “Best viewed in Chrome”
Risk 3: Delay in development due to excessive work from other modules (Unexpected)
Mitigation Strategy: Ensure that sufficient time is allocated to the team for development and that they have enough time for their other modules as well.
Risk 1: Technical Risk
Mitigation Strategy: Ensure that sufficient time in allocated for learning. Keep our code lightweight. Constant refactoring to minimize latency Deploy early and resolve any critical issues
ü Making the website to be mobile friendly
ü Ensure multi browser compatibility
ü Slow response time ü Application fails to deploy
on client's server
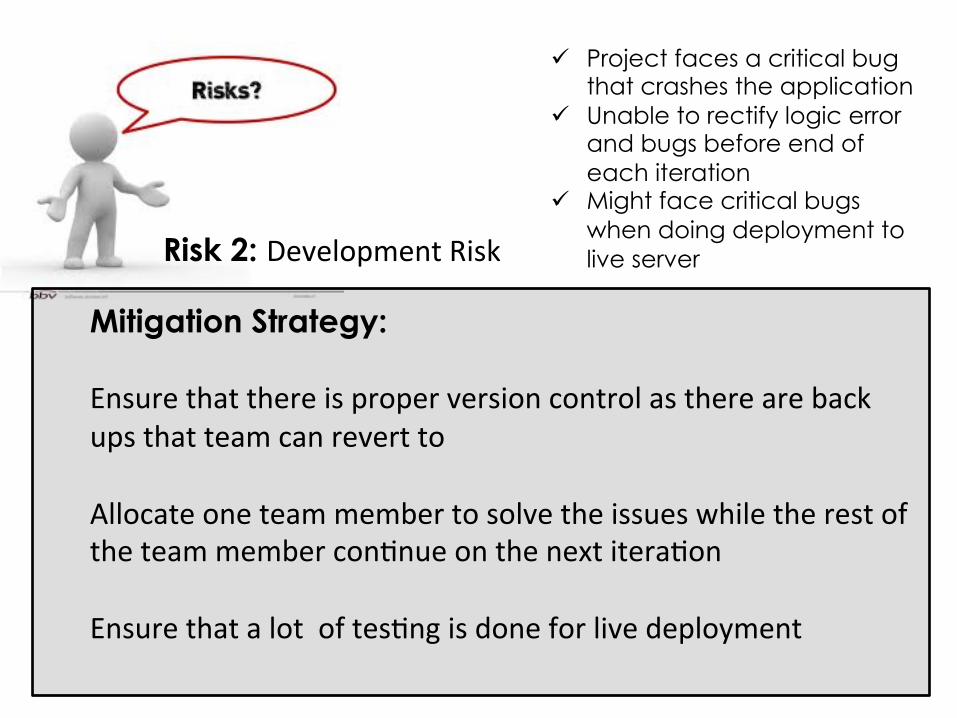
Risk 2: Development Risk
Mitigation Strategy: Ensure that there is proper version control as there are back ups that team can revert to
Allocate one team member to solve the issues while the rest of the team member con/nue on the next itera/on
Ensure that a lot of tes/ng is done for live deployment
ü Project faces a critical bug that crashes the application
ü Unable to rectify logic error and bugs before end of each iteration
ü Might face critical bugs when doing deployment to live server
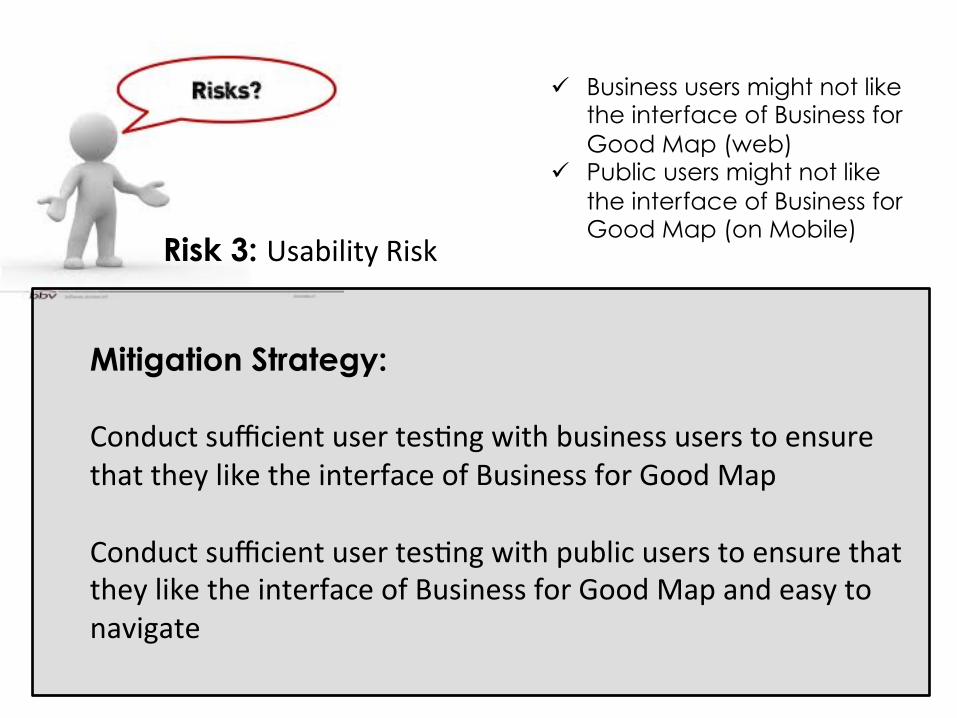
Risk 3: Usability Risk
Mitigation Strategy: Conduct sufficient user tes/ng with business users to ensure that they like the interface of Business for Good Map Conduct sufficient user tes/ng with public users to ensure that they like the interface of Business for Good Map and easy to navigate
ü Business users might not like the interface of Business for Good Map (web)
ü Public users might not like the interface of Business for Good Map (on Mobile)
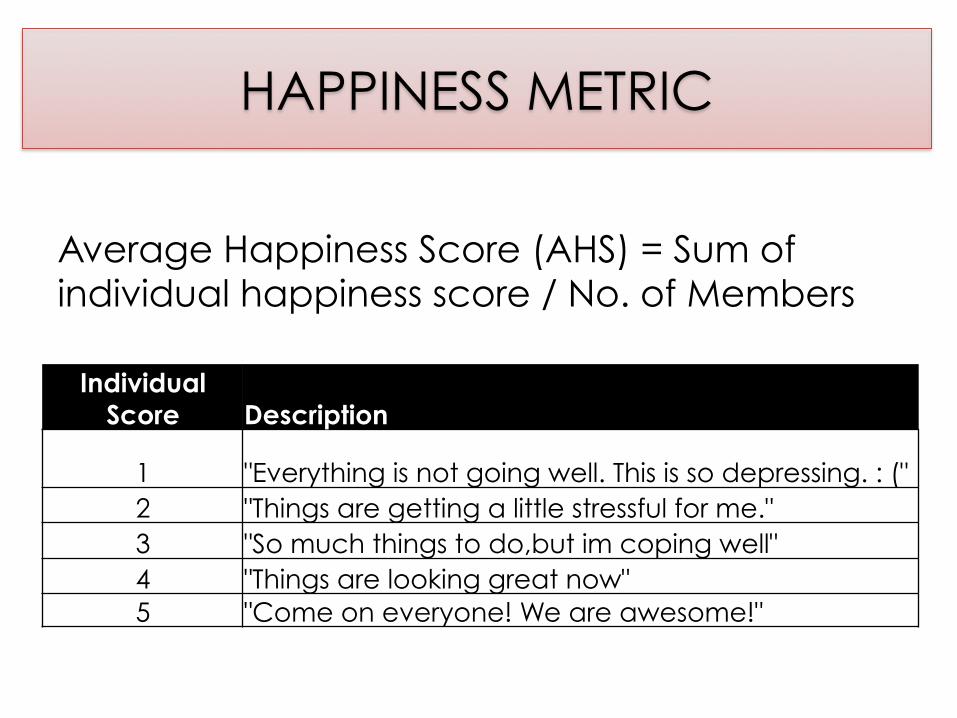
HAPPINESS METRIC
Average Happiness Score (AHS) = Sum of individual happiness score / No. of Members
Individual Score Description
1 "Everything is not going well. This is so depressing. : (" 2 "Things are getting a little stressful for me." 3 "So much things to do,but im coping well" 4 "Things are looking great now" 5 "Come on everyone! We are awesome!"
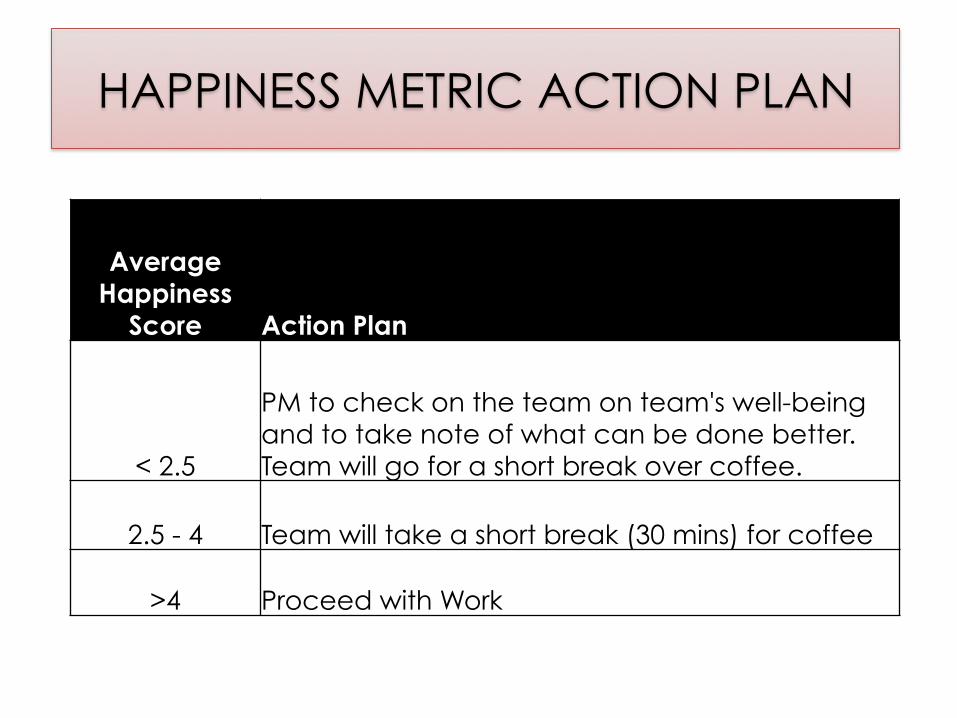
Average Happiness
Score Action Plan
< 2.5
PM to check on the team on team's well-being and to take note of what can be done better. Team will go for a short break over coffee.
2.5 - 4 Team will take a short break (30 mins) for coffee
>4 Proceed with Work
HAPPINESS METRIC ACTION PLAN
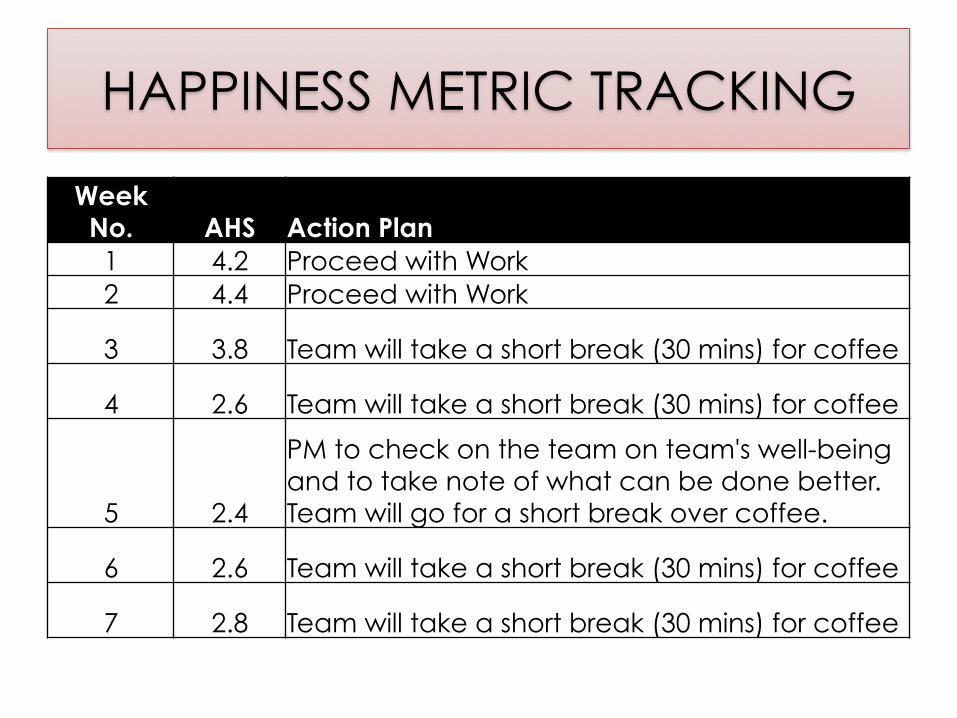
Week No. AHS Action Plan 1 4.2 Proceed with Work 2 4.4 Proceed with Work
3 3.8 Team will take a short break (30 mins) for coffee
4 2.6 Team will take a short break (30 mins) for coffee
5 2.4
PM to check on the team on team's well-being and to take note of what can be done better. Team will go for a short break over coffee.
6 2.6 Team will take a short break (30 mins) for coffee
7 2.8 Team will take a short break (30 mins) for coffee
HAPPINESS METRIC TRACKING
STAKEHOLDER MANAGEMENT
STAKEHOLDER MANAGEMENT
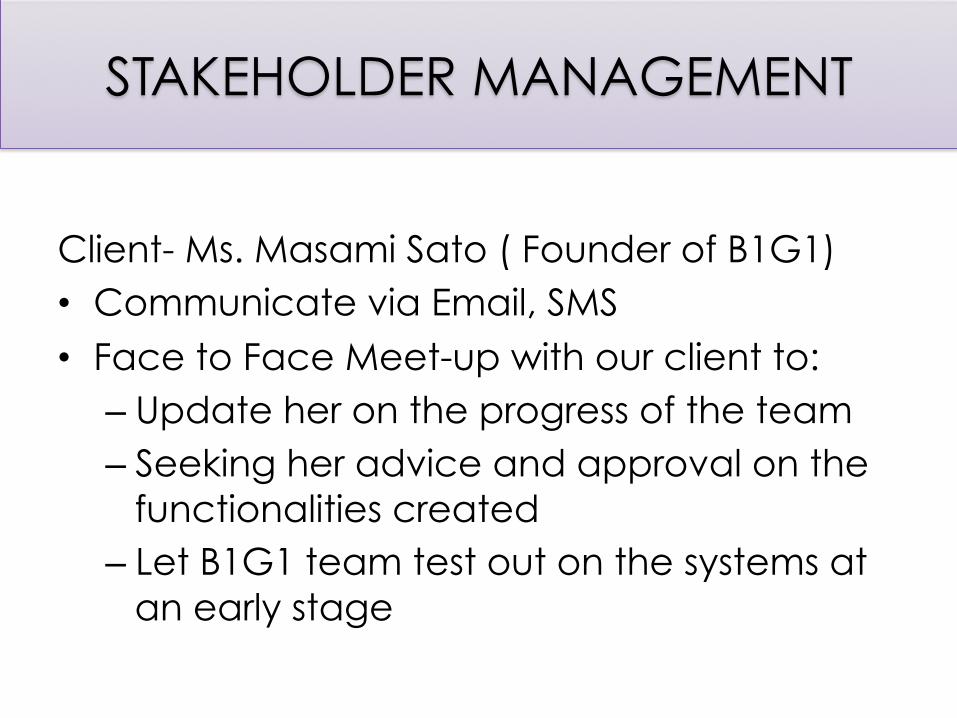
Client- Ms. Masami Sato ( Founder of B1G1) • Communicate via Email, SMS • Face to Face Meet-up with our client to: – Update her on the progress of the team – Seeking her advice and approval on the
functionalities created – Let B1G1 team test out on the systems at
an early stage
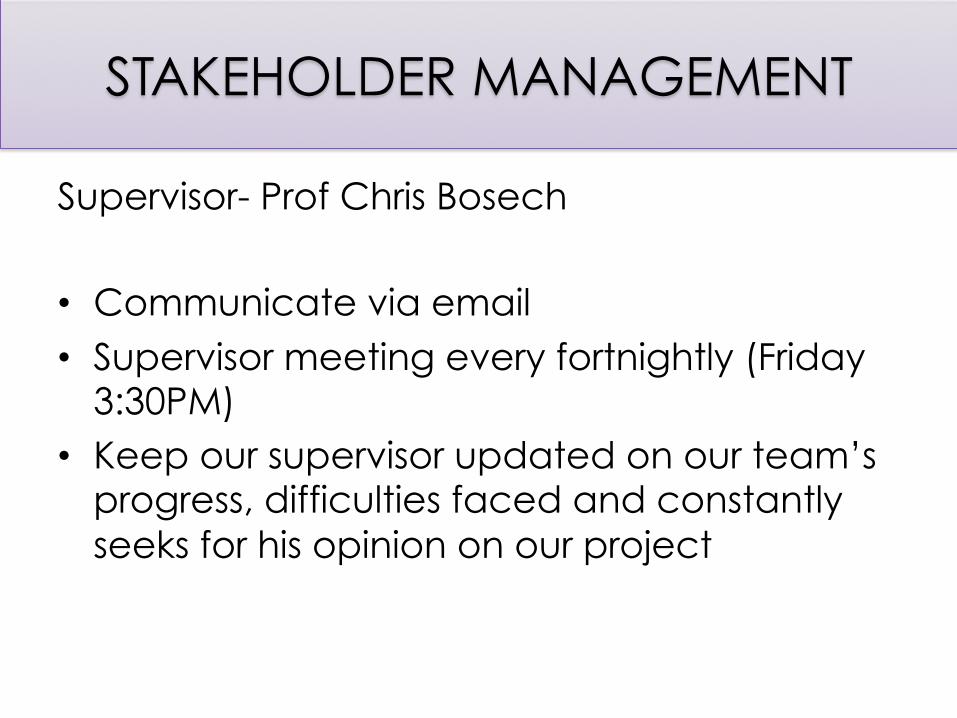
Supervisor- Prof Chris Bosech • Communicate via email • Supervisor meeting every fortnightly (Friday
3:30PM) • Keep our supervisor updated on our team’s
progress, difficulties faced and constantly seeks for his opinion on our project
STAKEHOLDER MANAGEMENT
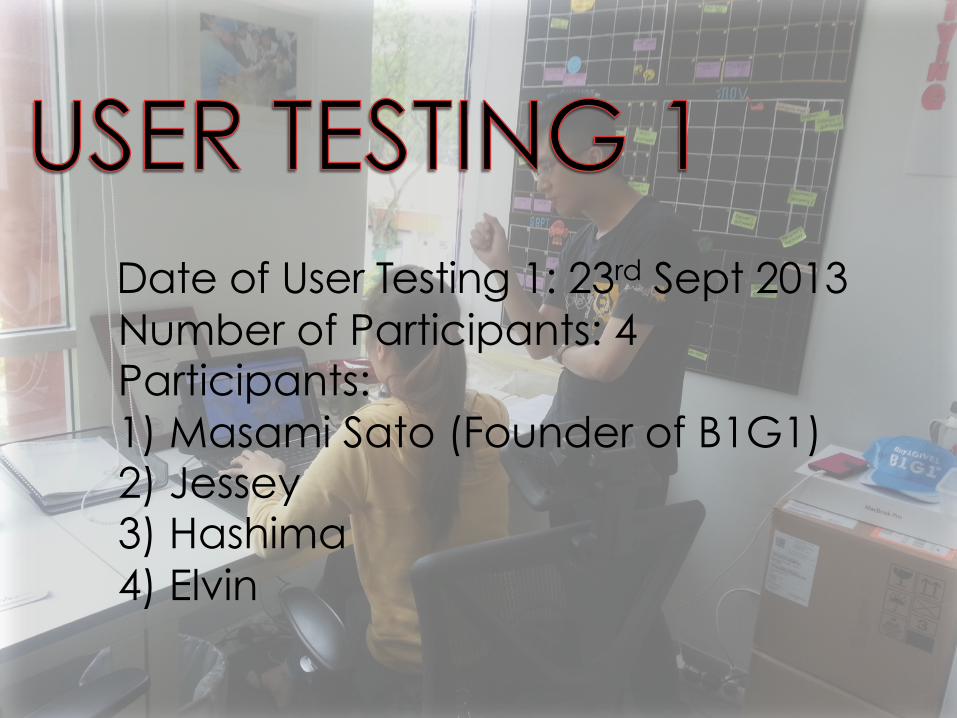
Date of User Testing 1: 23rd Sept 2013 Number of Participants: 4 Participants:
1) Masami Sato (Founder of B1G1) 2) Jessey 3) Hashima 4) Elvin
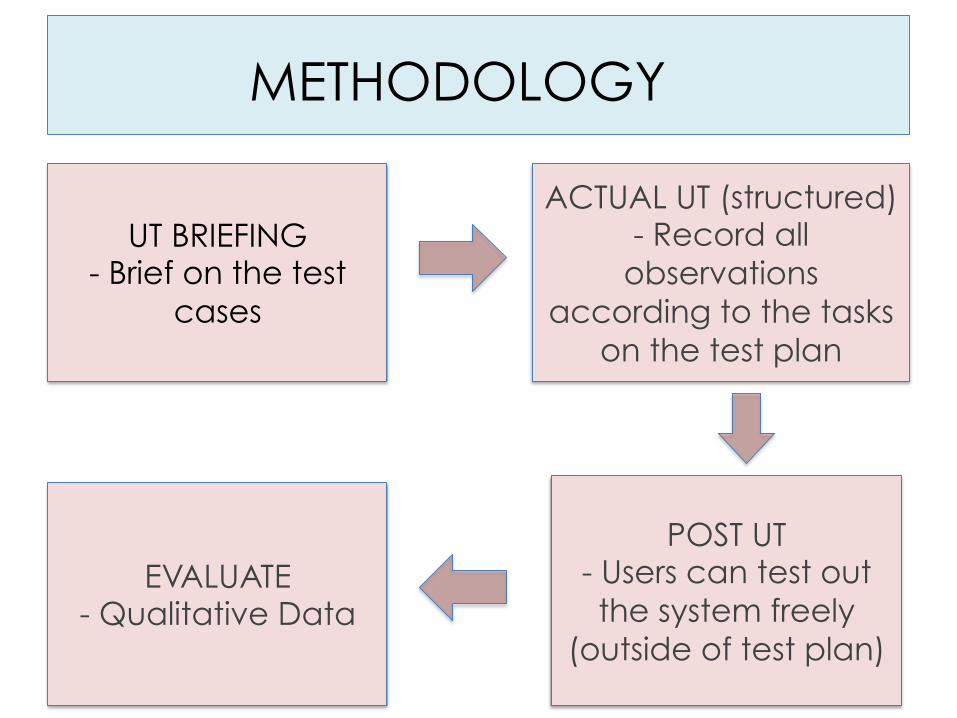
METHODOLOGY
UT BRIEFING - Brief on the test
cases
ACTUAL UT (structured) - Record all
observations according to the tasks
on the test plan
POST UT - Users can test out the system freely
(outside of test plan)
EVALUATE - Qualitative Data
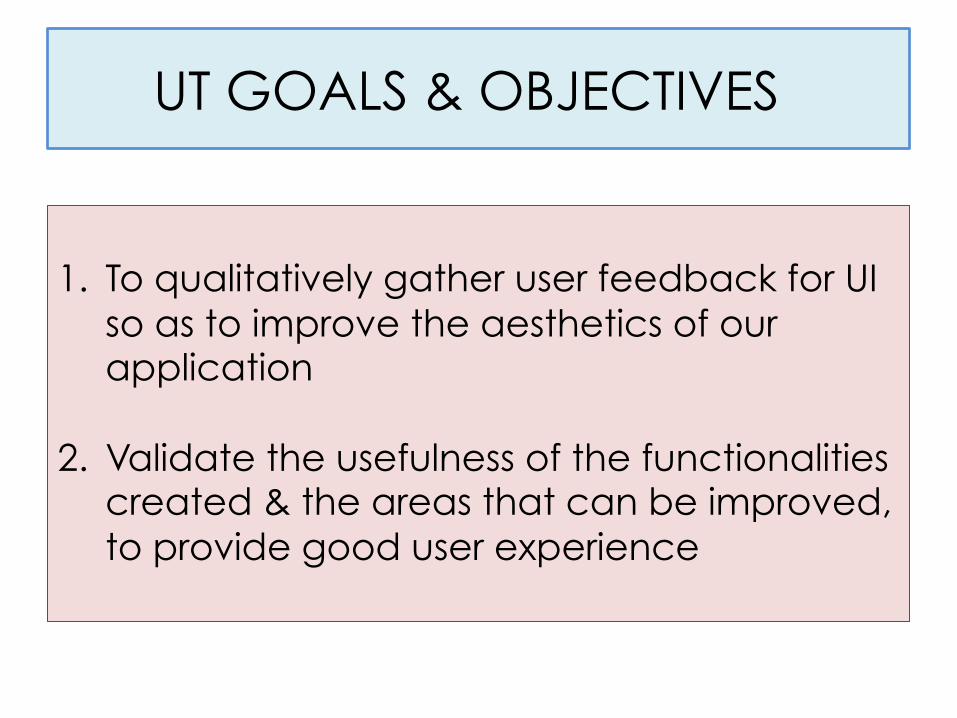
UT GOALS & OBJECTIVES
1. To qualitatively gather user feedback for UI
so as to improve the aesthetics of our application
2. Validate the usefulness of the functionalities
created & the areas that can be improved, to provide good user experience
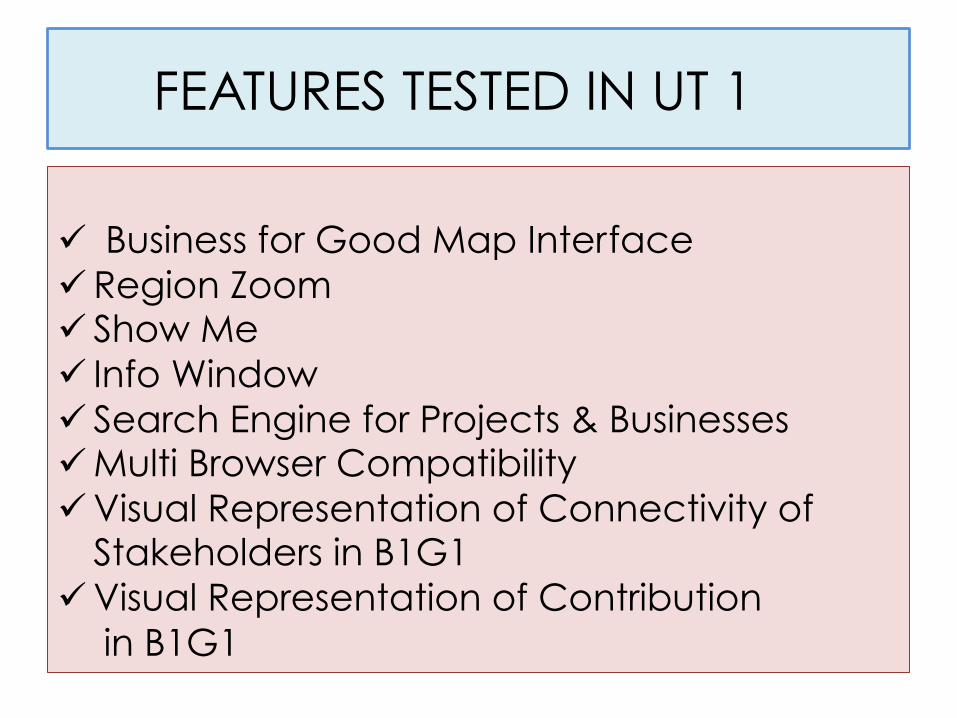
FEATURES TESTED IN UT 1
ü Business for Good Map Interface ü Region Zoom ü Show Me ü Info Window ü Search Engine for Projects & Businesses ü Multi Browser Compatibility ü Visual Representation of Connectivity of
Stakeholders in B1G1 ü Visual Representation of Contribution
in B1G1
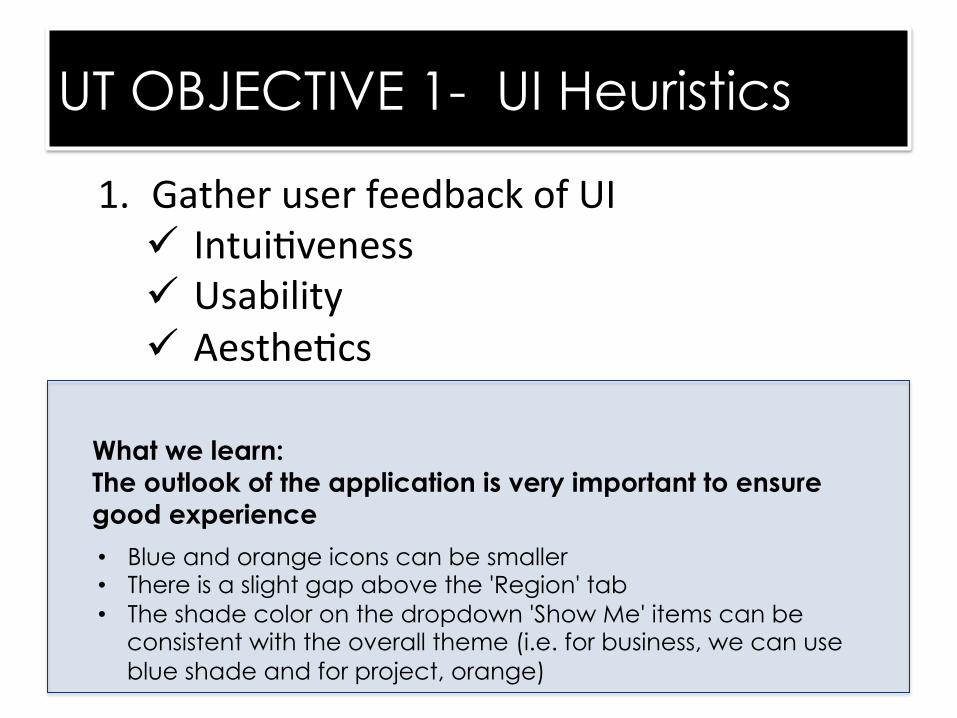
UT OBJECTIVE 1- UI Heuristics
1. Gather user feedback of UI ü Intui/veness ü Usability ü Aesthe/cs
What we learn: The outlook of the application is very important to ensure good experience • Blue and orange icons can be smaller • There is a slight gap above the 'Region' tab • The shade color on the dropdown 'Show Me' items can be
consistent with the overall theme (i.e. for business, we can use blue shade and for project, orange)
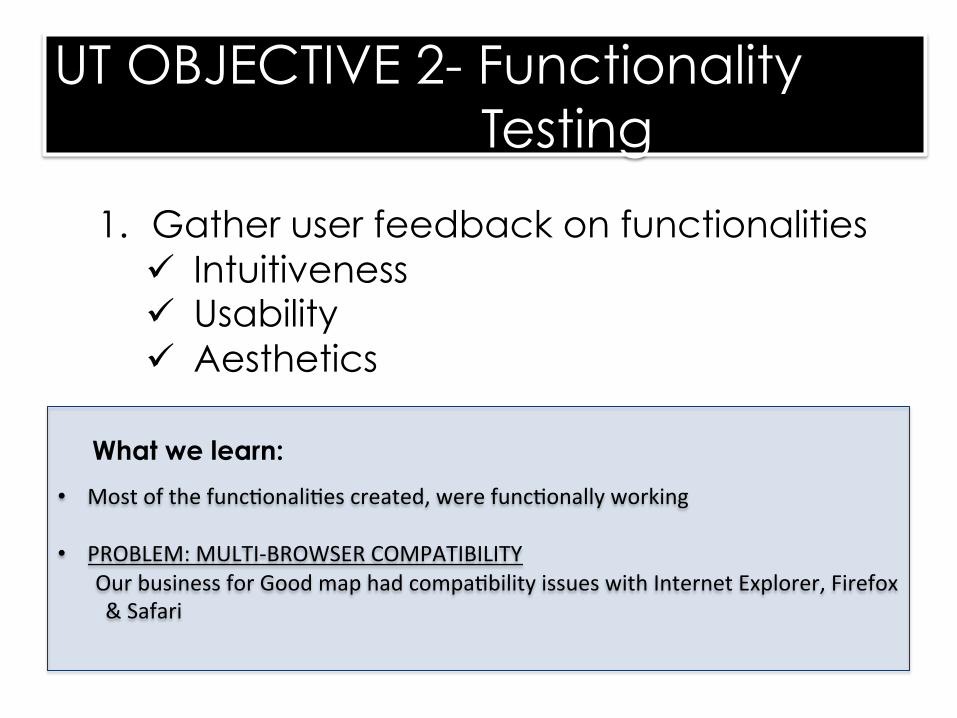
UT OBJECTIVE 2- Functionality Testing
1. Gather user feedback on functionalities ü Intuitiveness ü Usability ü Aesthetics
• Most of the func/onali/es created, were func/onally working • PROBLEM: MULTI-‐BROWSER COMPATIBILITY Our business for Good map had compa/bility issues with Internet Explorer, Firefox
& Safari
What we learn:
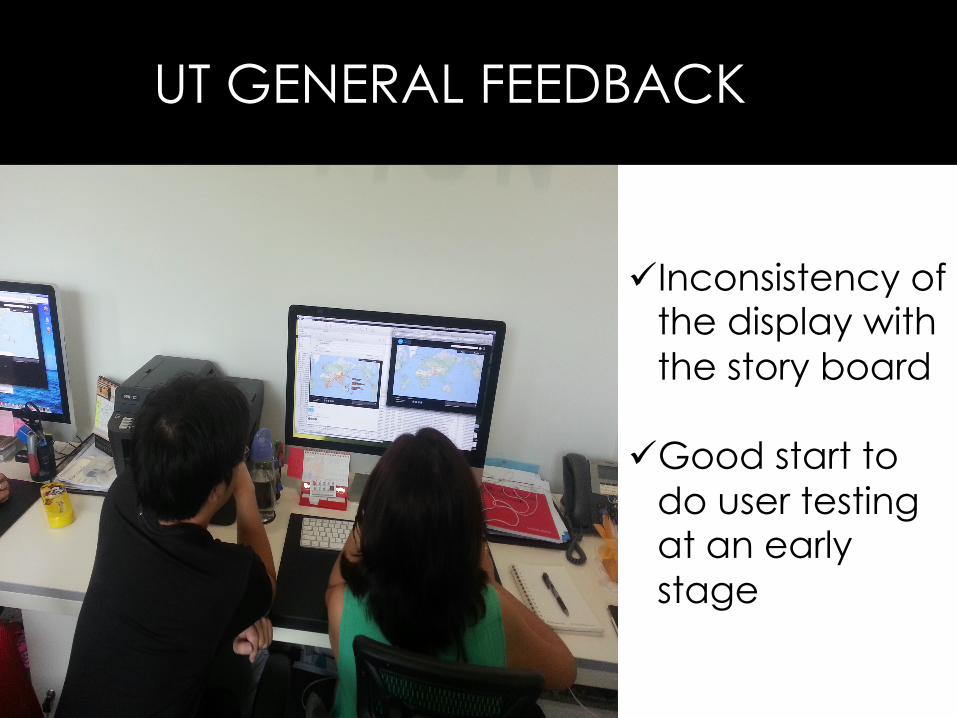
UT GENERAL FEEDBACK
ü Inconsistency of the display with the story board
ü Good start to
do user testing at an early stage
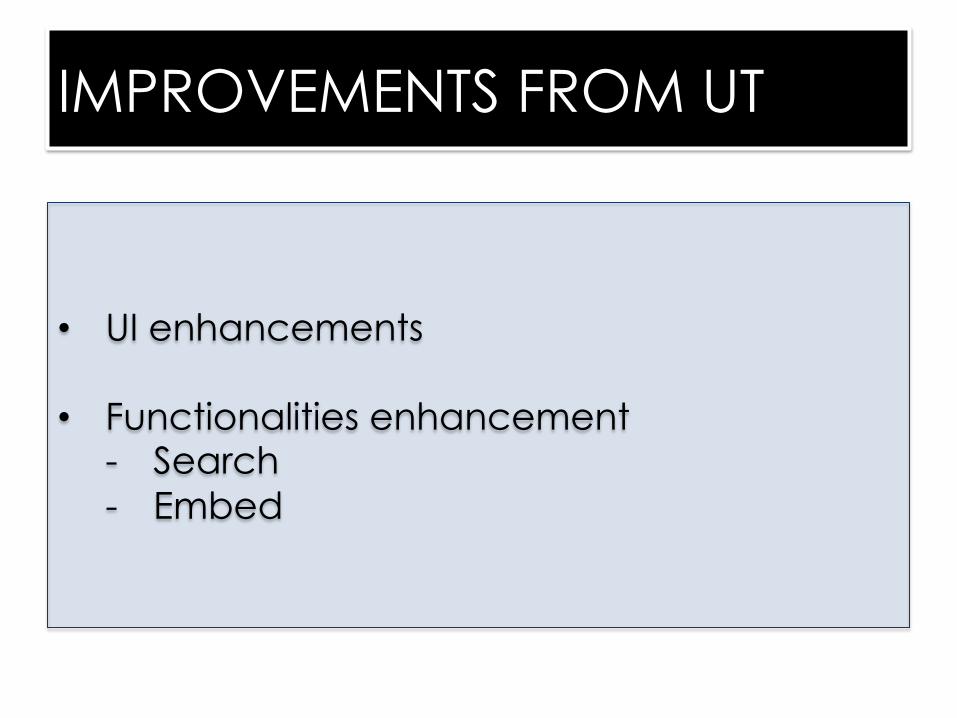
IMPROVEMENTS FROM UT
• UI enhancements • Functionalities enhancement
- Search - Embed
LEARNING OUTCOMES
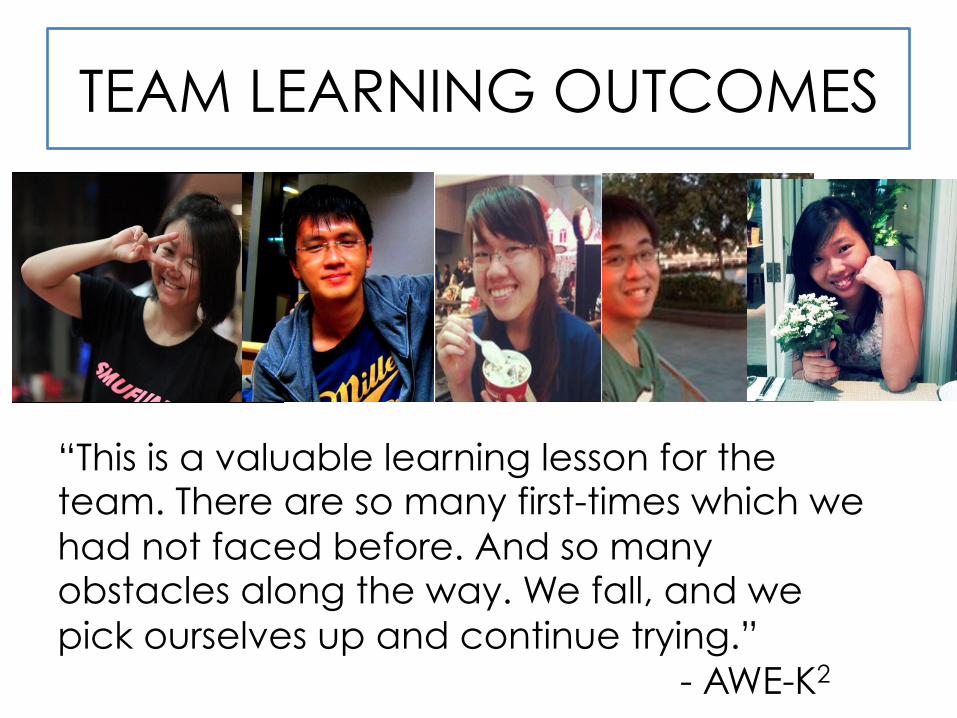
TEAM LEARNING OUTCOMES
“This is a valuable learning lesson for the team. There are so many first-times which we had not faced before. And so many obstacles along the way. We fall, and we pick ourselves up and continue trying.”
- AWE-K2
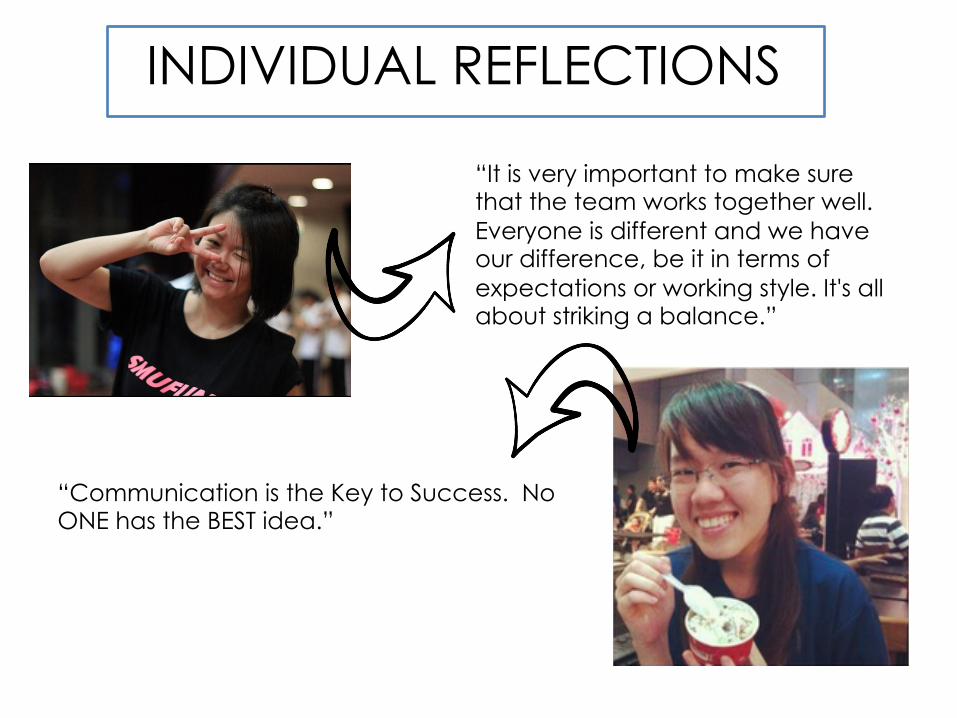
INDIVIDUAL REFLECTIONS
“It is very important to make sure that the team works together well. Everyone is different and we have our difference, be it in terms of expectations or working style. It's all about striking a balance.”
“Communication is the Key to Success. No ONE has the BEST idea.”
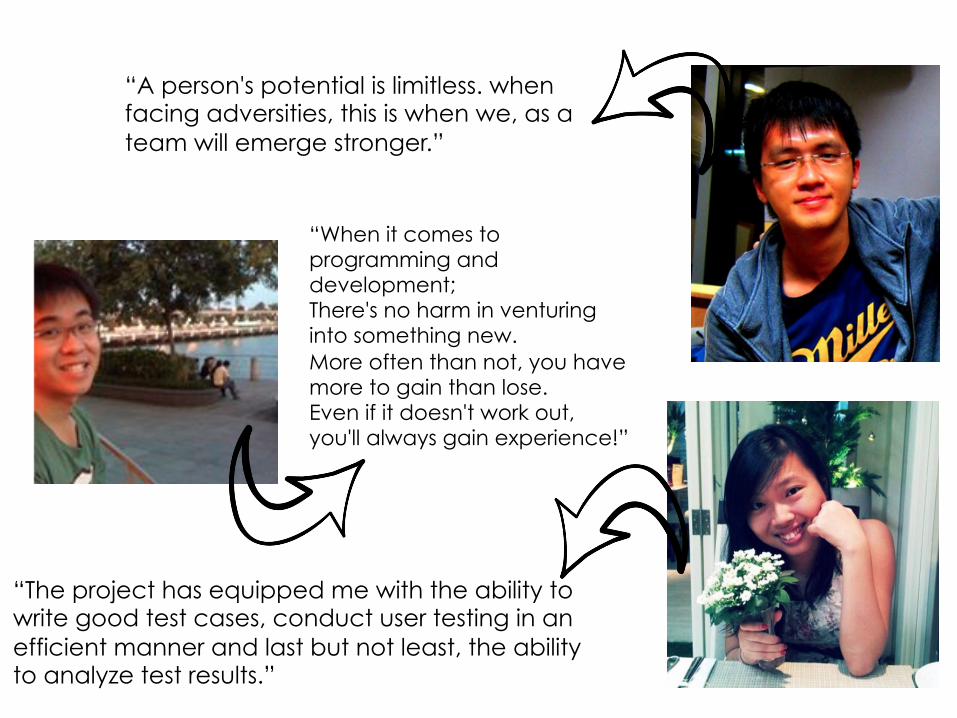
“The project has equipped me with the ability to write good test cases, conduct user testing in an efficient manner and last but not least, the ability to analyze test results.”
“When it comes to programming and development; There's no harm in venturing into something new. More often than not, you have more to gain than lose. Even if it doesn't work out, you'll always gain experience!”
“A person's potential is limitless. when facing adversities, this is when we, as a team will emerge stronger.”
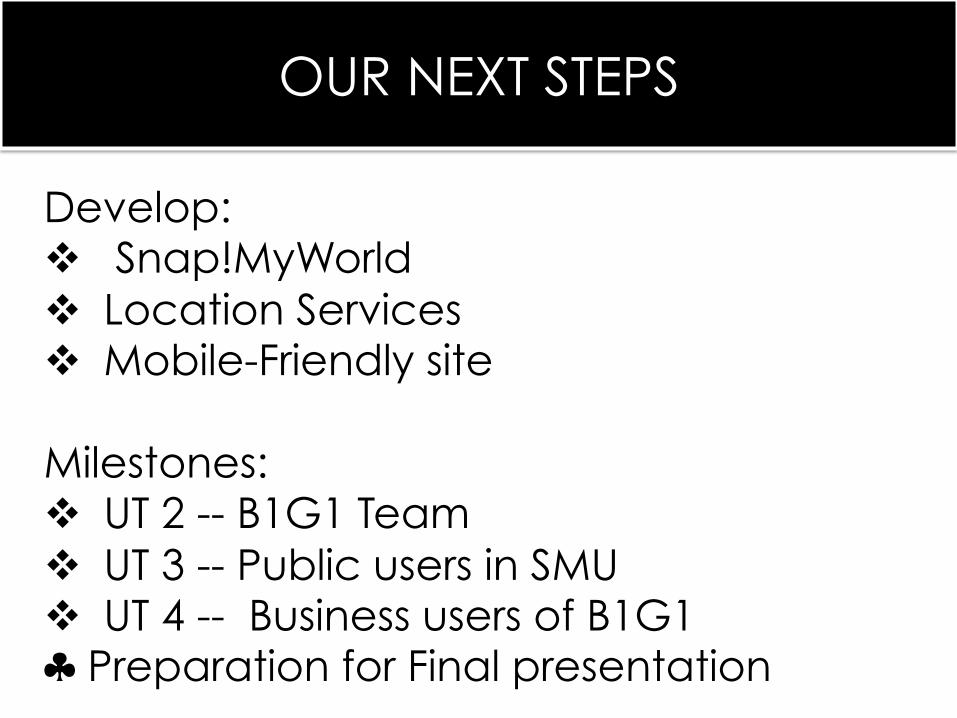
OUR NEXT STEPS Develop: v Snap!MyWorld v Location Services v Mobile-Friendly site Milestones: v UT 2 -- B1G1 Team v UT 3 -- Public users in SMU v UT 4 -- Business users of B1G1 ♣ Preparation for Final presentation