avr studio tutorial
DESCRIPTION
Avr studio guideTRANSCRIPT
AVR Studio Software TutorialSepehr Naimi (BIHE)
2010-06-08

Introduction

This tutorial will teach you how to write, compile, and trace a simple program in AVR Studio. For more information, you can see AVR Studio’s help.
2
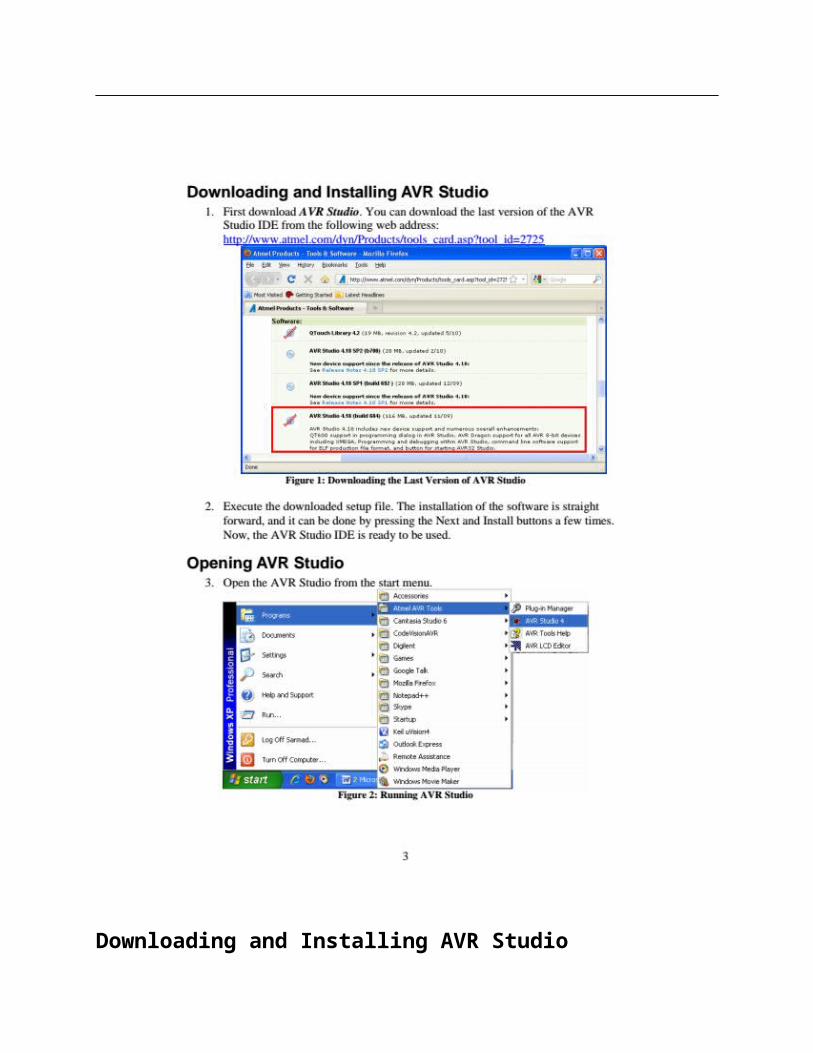
Downloading and Installing AVR Studio
1. First download AVR Studio. You can download the last version of the AVR
Studio IDE from the following web address: http://www.atmel.com/dyn/Products/tools_card.asp?tool_id=2725
Figure 1: Downloading the Last Version of AVR Studio
2. Execute the downloaded setup file. The installation of the software is straight
forward, and it can be done by pressing the Next and Install buttons a few times. Now, the AVR Studio IDE is ready to be used.
Opening AVR Studio
3. Open the AVR Studio from the start menu.
Figure 2: Running AVR Studio
3
Creating a new Project
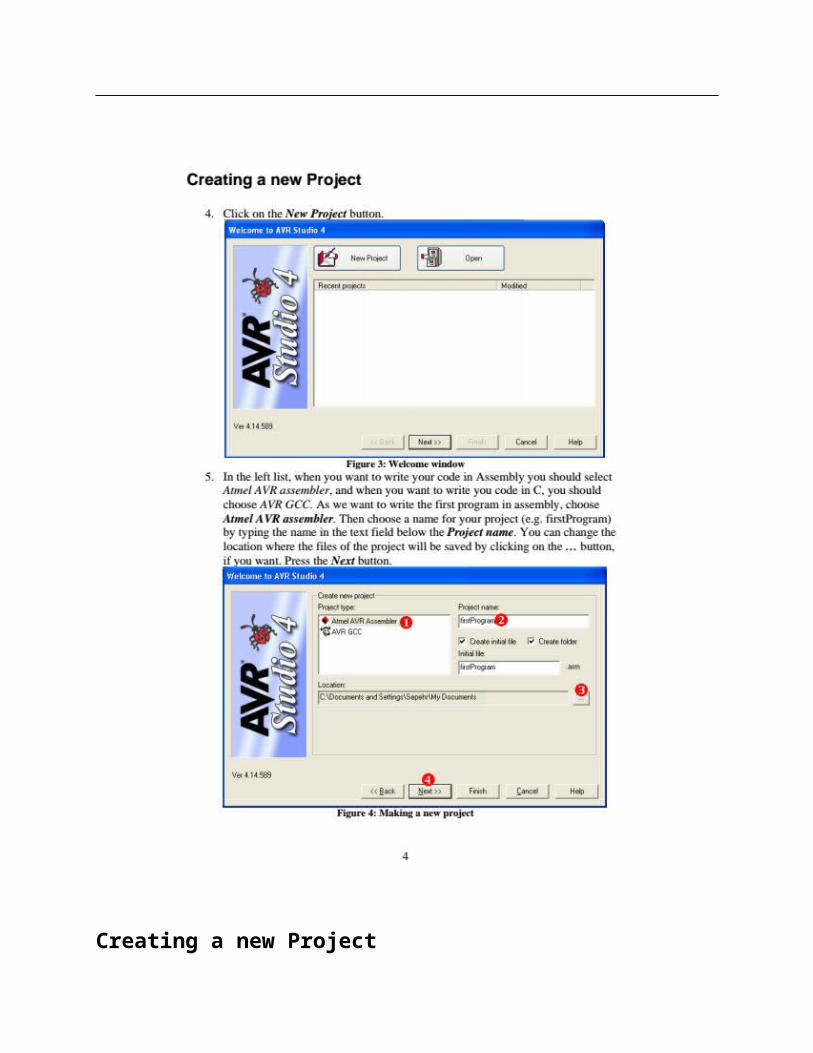
4. Click on the New Project button.
Figure 3: Welcome window 5. In the left list, when you want to write your code in Assembly you should select
Atmel AVR assembler, and when you want to write you code in C, you should choose AVR GCC. As we want to write the first program in assembly, choose Atmel AVR assembler. Then choose a name for your project (e.g. firstProgram) by typing the name in the text field below the Project name. You can change the location where the files of the project will be saved by clicking on the ... button, if you want. Press the Next button.
Figure 4: Making a new project
4
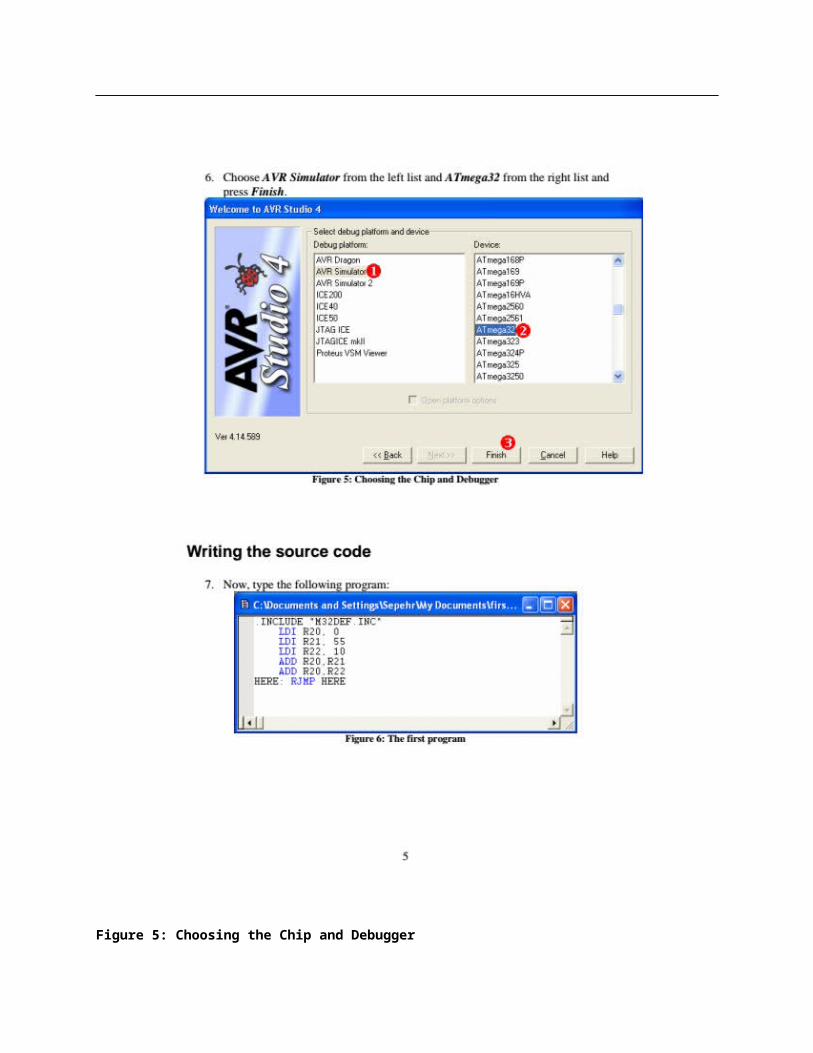
Figure 5: Choosing the Chip and Debugger
Writing the source code
7. Now, type the following program:
6. Choose AVR Simulator from the left list and ATmega32 from the right list and
press Finish.
Figure 6: The first program
5
Saving
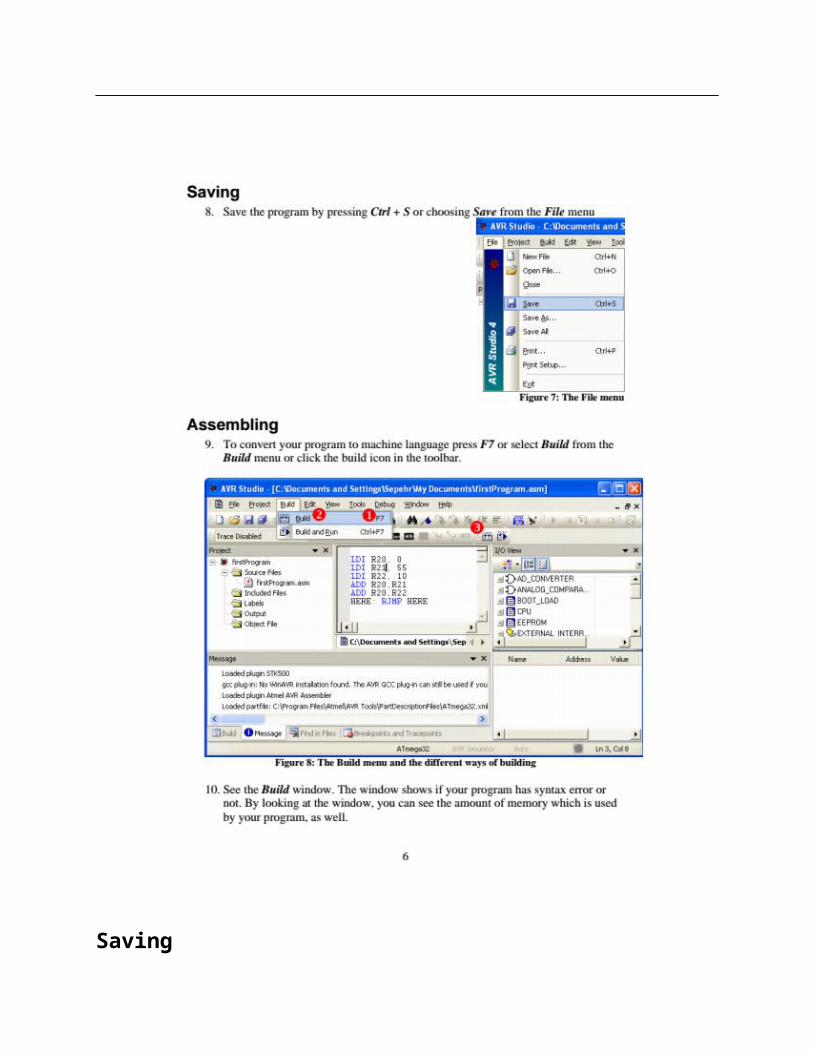
8. Save the program by pressing Ctrl + S or choosing Save from the File menu
Figure 7: The File menu
Assembling
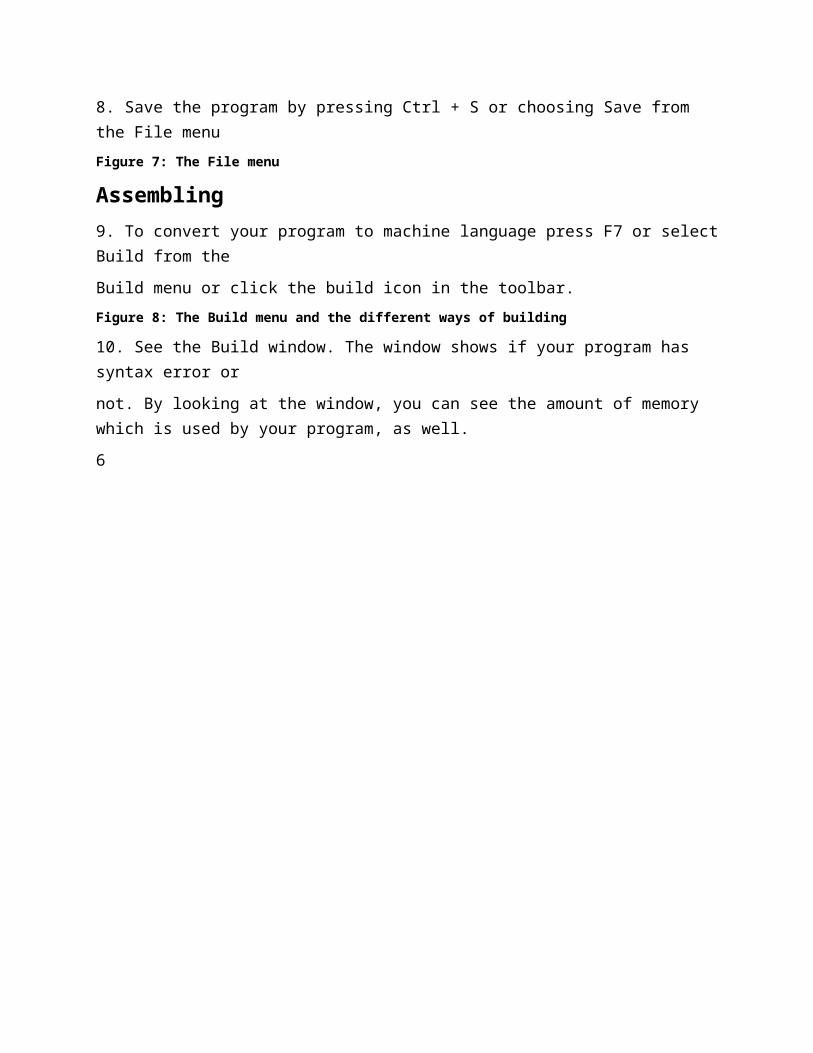
9. To convert your program to machine language press F7 or select Build from the
Build menu or click the build icon in the toolbar.
Figure 8: The Build menu and the different ways of building
10. See the Build window. The window shows if your program has syntax error or
not. By looking at the window, you can see the amount of memory which is used by your program, as well.
6
Tracing and Debugging

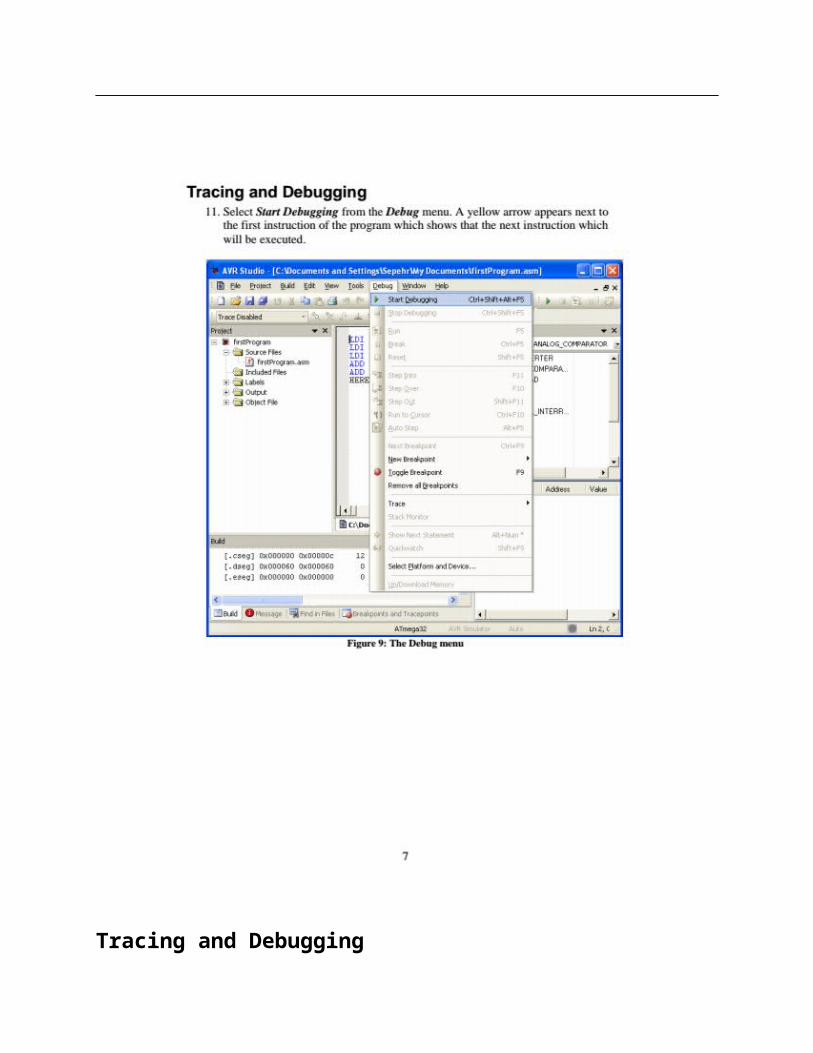
11. Select Start Debugging from the Debug menu. A yellow arrow appears next to the first instruction of the program which shows that the next instruction which will be executed.
Figure 9: The Debug menu
7
Tracing
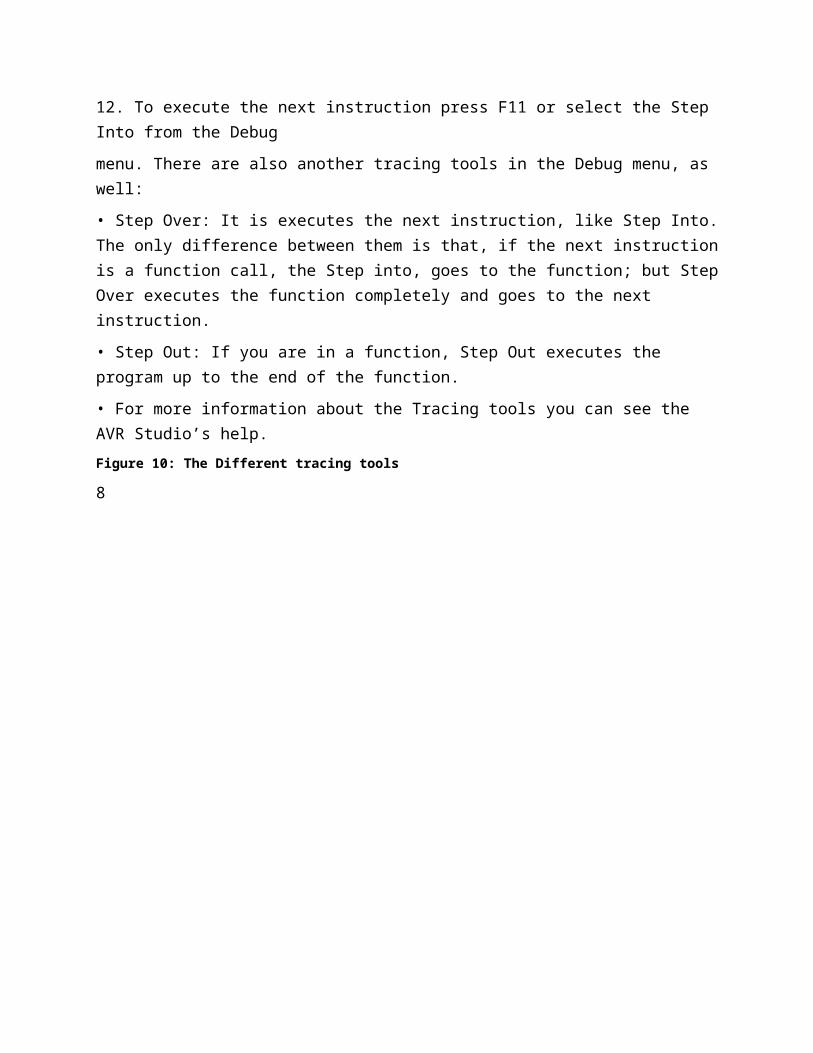
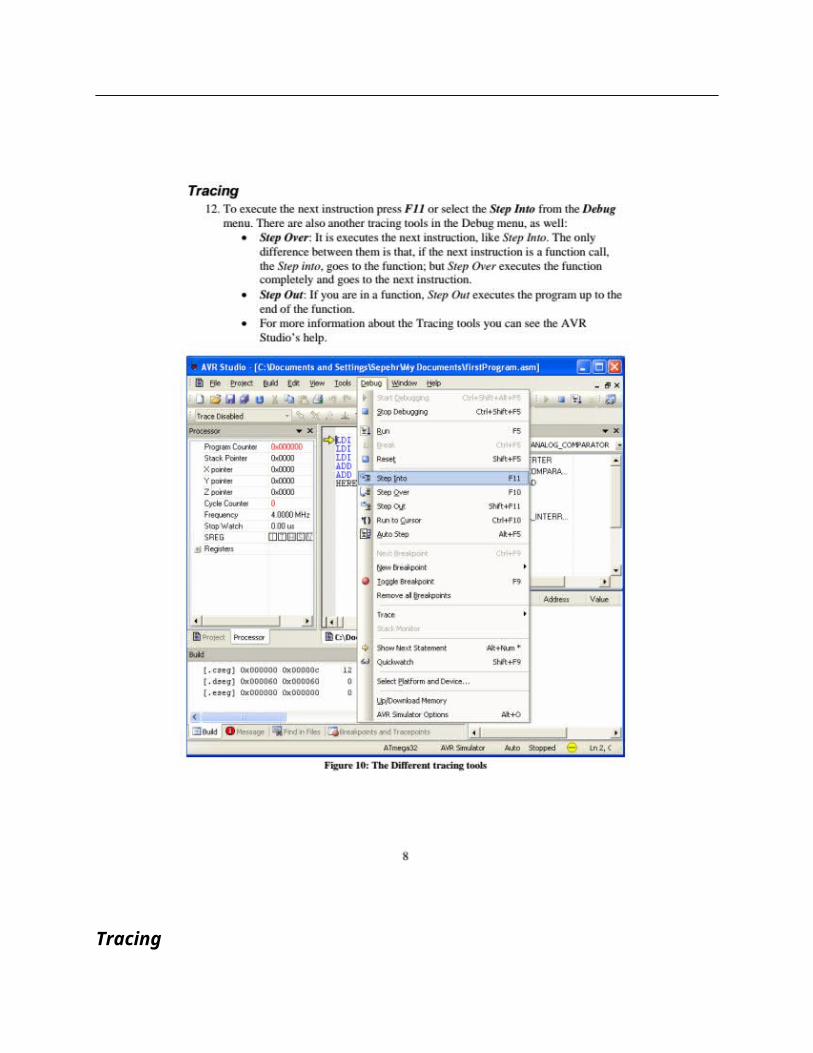
12. To execute the next instruction press F11 or select the Step Into from the Debug
menu. There are also another tracing tools in the Debug menu, as well:
• Step Over: It is executes the next instruction, like Step Into. The only difference between them is that, if the next instruction is a function call, the Step into, goes to the function; but Step Over executes the function completely and goes to the next instruction.
• Step Out: If you are in a function, Step Out executes the program up to the end of the function.
• For more information about the Tracing tools you can see the AVR Studio’s help.
Figure 10: The Different tracing tools
8
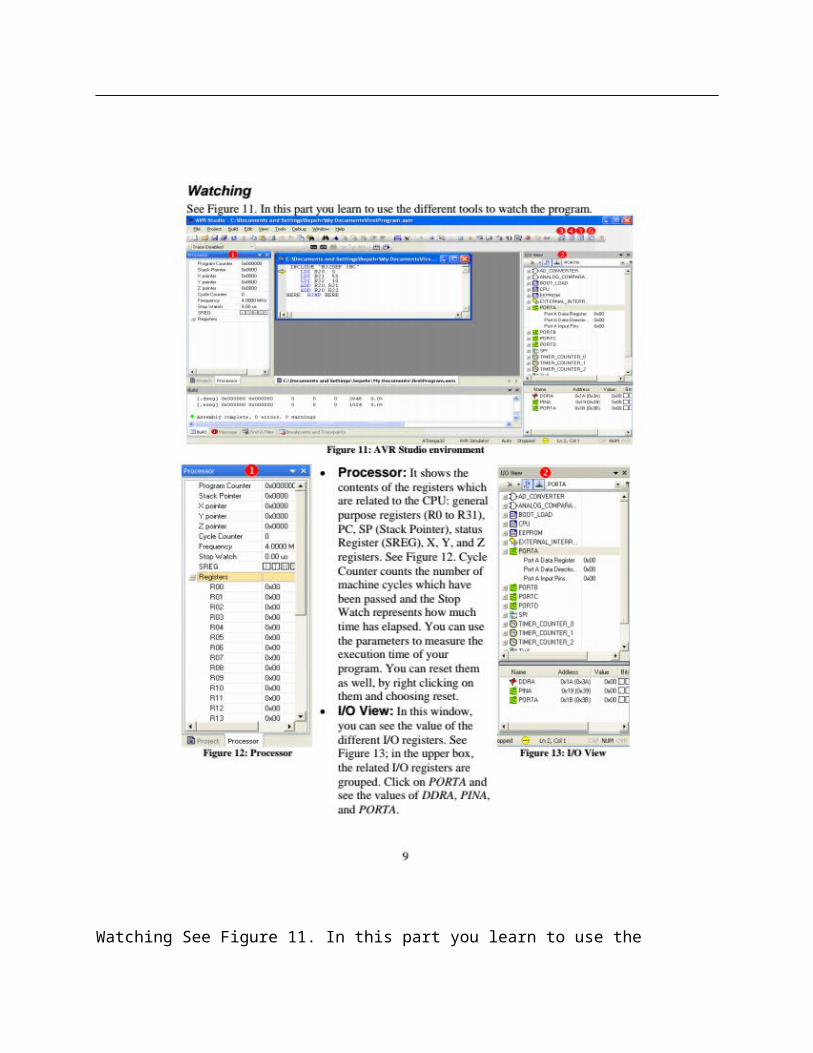
Watching See Figure 11. In this part you learn to use the different tools to watch the program.
Figure 11: AVR Studio environment
Figure 12: Processor
• Processor: It shows the contents of the registers which are related to the CPU: general purpose registers (R0 to R31), PC, SP (Stack Pointer), status Register (SREG), X, Y, and Z registers. See Figure 12. Cycle Counter counts the number of machine cycles which have been passed and the Stop Watch represents how much time has elapsed. You can use the parameters to measure the execution time of your program. You can reset them as well, by right clicking on them and choosing reset.
• I/O View: In this window, you can see the value of the different I/O registers. See Figure 13; in the upper box, the related I/O registers are grouped. Click on PORTA and see the values of DDRA, PINA, and PORTA.
9
Figure 13: I/O View
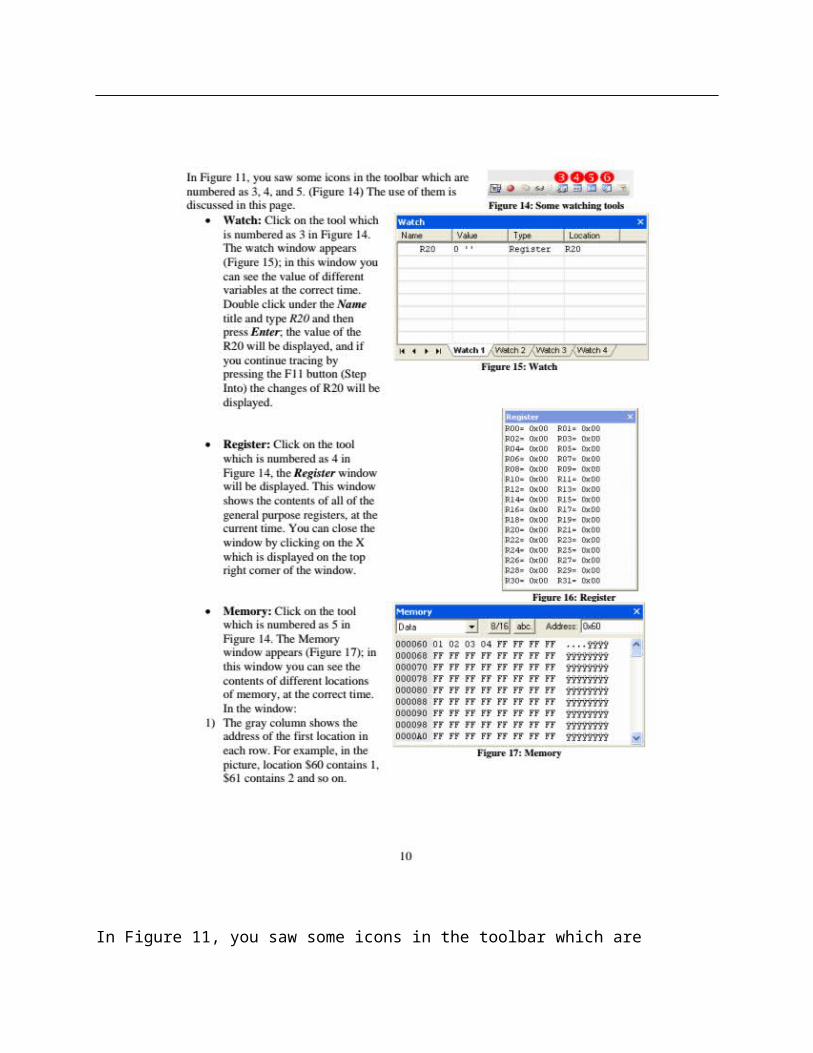
In Figure 11, you saw some icons in the toolbar which are numbered as 3, 4, and 5. (Figure 14)
The use of them is discussed in this page. Figure 14: Some watching tools
• Watch: Click on the tool which is numbered as 3 in Figure 14. The watch window appears (Figure 15); in this window you can see the value of different variables at the correct time. Double click under the Name title and type R20 and then press Enter; the value of the R20 will be displayed, and if you continue tracing by pressing the F11 button (Step Into) the changes of R20 will be displayed.
Figure 15: Watch
• Register: Click on the tool which is numbered as 4 in Figure 14, the Register window will be displayed. This window shows the contents of all of the general purpose registers, at the current time. You can close the window by clicking on the X which is displayed on the top right corner of the window.
Figure 16: Register
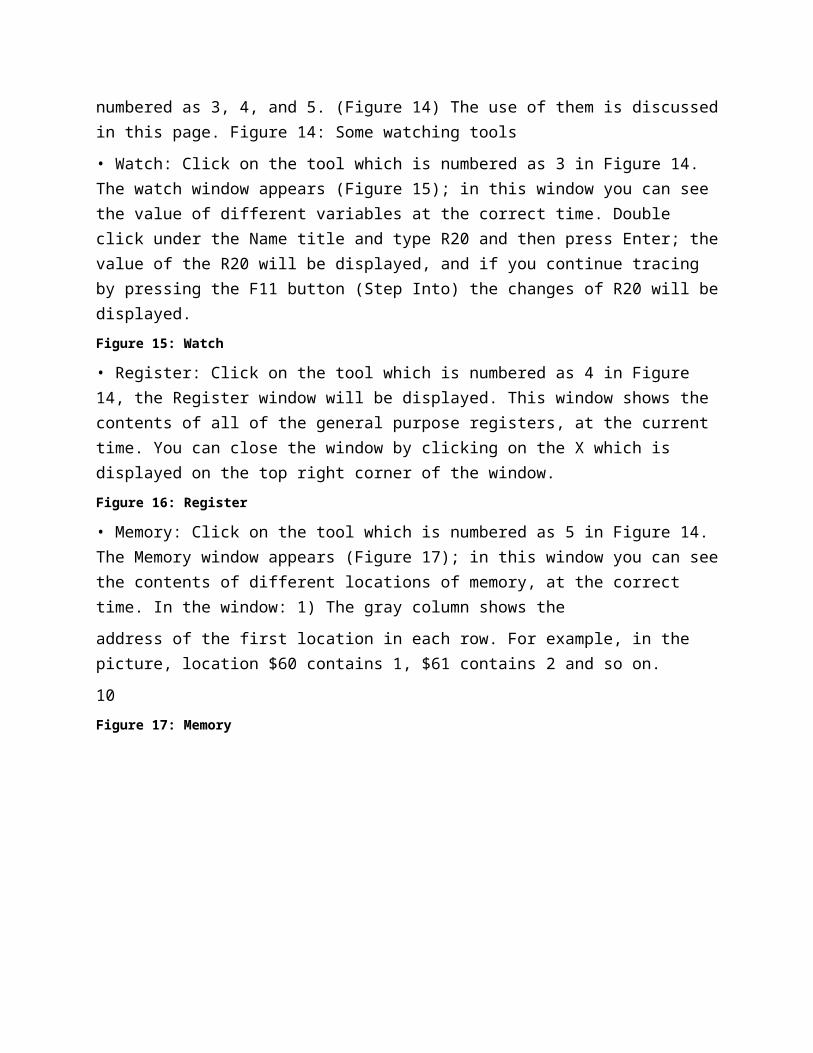
• Memory: Click on the tool which is numbered as 5 in Figure 14. The Memory window appears (Figure 17); in this window you can see the contents of different locations of memory, at the correct time. In the window: 1) The gray column shows the
address of the first location in each row. For example, in the picture, location $60 contains 1, $61 contains 2 and so on.
10
Figure 17: Memory