automotive transactions and trends 2016 · automotive value chain automotive sub-sector 7...
TRANSCRIPT

Automotive transactions and trends 2016Global automotive mergers and acquisitions review
Produced by Global Markets — EY Knowledge
ContentsExecutive summary 1
3Analysis by deal sizes
4Cross-border deals in 2016
6Transaction drivers for the automotive value chain
7Automotive sub-sector transaction trends and drivers
12Investing in mobility
13Capital and M&A outlook
14EY’s Capital Agenda — key considerations and implications
The global automotive industry is in a rapid state of change. An evolution of products and processes, people and places, software and services. The industry is likely to experience more change in the next decade than it has in the previous 50 years. Digitalization and innovation will drive this change. So too will relationships, whether they be with consumers or strategic partners. Success in this new age of automotive will rely heavily on the ability to adapt and adjust, quickly. To access the products, services and skillsets of tomorrow’s automotive industry today.
While organic growth remains important, automotive companies continue to utilize M&A as a strategic tool to access the critical talent, intellectual property and innovation necessary to prosper in the reshaping automotive landscape. Smaller, smarter deals are likely to drive transaction activities.
Traditional deal challenges remain, but many others have emerged in this new environment. As sector convergence increases, the integration of assets outside a company’s traditional core is far less straightforward, requiring customer-centric solutions. Additionally, the rise of nationalist politics adds a new layer of complexity to cross-border investment strategies and deal assessments.
Despite the challenges, automotive companies fully understand that improving their competitive edge requires a sharp focus on acquiring innovative assets that best position them for success in the new automotive ecosystem.
Mark ShortEY Global Automotive and Transportation Industry Leader, Transaction Advisory Services
M&A plays a key, strategic role in the reinvention of the automotive industry
1Automotive transactions and trends 2016 |
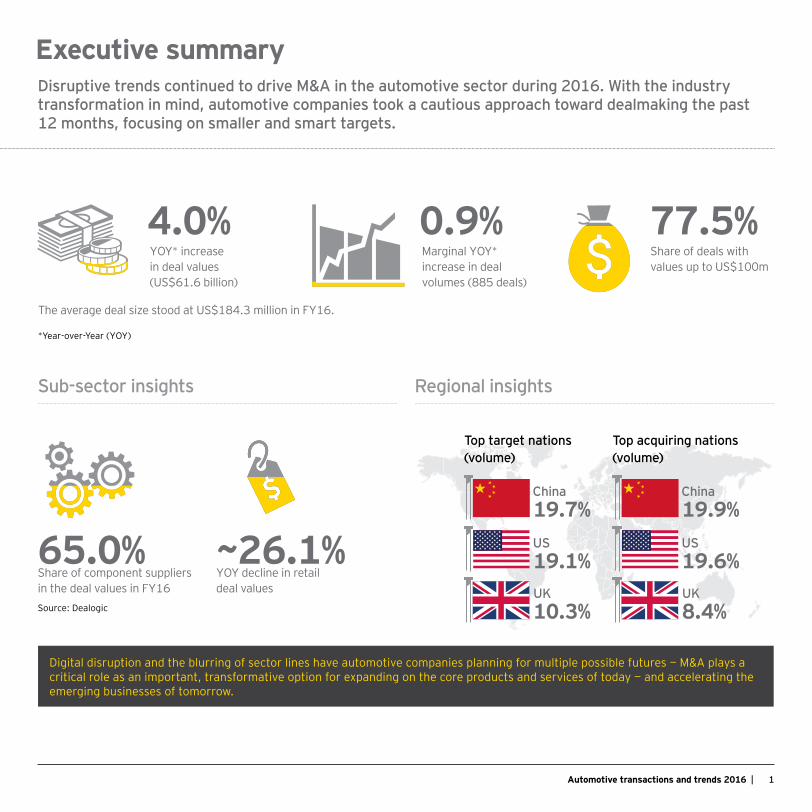
Executive summary
Sub-sector insights Regional insights
Share of component suppliers in the deal values in FY16
65.0%YOY decline in retail deal values
~26.1%
The average deal size stood at US$184.3 million in FY16.
Source: Dealogic
YOY* increase in deal values (US$61.6 billion)
4.0% 0.9%Marginal YOY* increase in deal volumes (885 deals)
77.5%Share of deals with values up to US$100m
Disruptive trends continued to drive M&A in the automotive sector during 2016. With the industry transformation in mind, automotive companies took a cautious approach toward dealmaking the past 12 months, focusing on smaller and smart targets.
Top target nations (volume)
Top acquiring nations (volume)
19.1%US
China19.7%
UK10.3%
19.6%US
China19.9%
UK8.4%
Digital disruption and the blurring of sector lines have automotive companies planning for multiple possible futures — M&A plays a critical role as an important, transformative option for expanding on the core products and services of today — and accelerating the emerging businesses of tomorrow.
*Year-over-Year (YOY)

2 | Automotive transactions and trends 2016
Despite strong deal fundamentals and a healthy deal environment, the rate of automotive transactions moderated in 2016, likely caused by Brexit, the US presidential election and weakening economic growth in China, among other factors.
Overall completion rate for deals announced in last nine quarters
89.7%
Average deals closed in the announced quarter, during 4Q14 to 4Q16
77.1%
Deal completion scenario* in the last two years
Continued confidence in the M&A market**
*Based on deal volumes.** Insights from the latest Capital Confidence Barometer.Source: Dealogic and Capital Confidence Barometer
of automotive executives expect to pursue acquisitions in the next 12 months
58%of automotive executives have a positive level of confidence with regard to the number of acquisition opportunities
62%of automotive executives expect the M&A market to improve in next 12 months, while an additional 63% expect a stable M&A market
31%
Deals completed in the same quarter (%)Deals completed (%)
97.6% 97.8% 96.9%90.5%
75.2%
94.9% 93.9% 88.8%
71.6%83.0% 82.1% 77.2% 80.6%
72.8% 78.3% 73.7% 76.3%70.1%
4Q14 1Q15 2Q15 3Q15 4Q15 1Q16 2Q16 3Q16 4Q16
Executive summary
The pace of investment in mobility, autonomous driving technologies and connected infotainment is accelerating. With the profit potential and growth opportunities within the new mobility landscape becoming more clear, both automotive and non-automotive companies are leveraging M&A or strategic partnerships to advance their market positioning, as evidenced by General Motors’ US$500 million Lyft investment and the US$8 billion Samsung-Harman international deal.

Middle-market transactions (those valued up to US$250m) continued to dominate acquisition plans. The number of upper-middle-market deals (those valued above US$250m and under US$1b) increased.
Deal volumes split by deal size, 4Q13–4Q16
•
0%
10%
20%
30%
40%
50%
60%
70%
80%
90%
100%
Transaction values in US$ million>250101–250<100
• Access to new customers, data
• Acquiring talent�• Access new
technologies and intellectual property
• Move into new geographical markets
83%
9%
9%
79%
8%
13%
89%
2%9%
80%
7%
12%
87%
6%8%
75%
10%
14%
82%
8%
10%
76%
15%
9%
77%
12%
11%
78%
7%
16%
82%
13%
5%
76%
16%
8%
75%
14%
10%
1Q144Q13 2Q14 3Q14 4Q14 1Q15 2Q15 3Q15 4Q15 1Q16 2Q16 3Q16 4Q16
Deal drivers
*Calculation based on deals with disclosed values.Source: Dealogic
Analysis by deal sizes
3
Tech companies such as Microsoft, Baidu, Alibaba, Google, IBM, Apple and CISCO, among others, are increasing collaboration with automotive players to develop next-generation technologies.
Automotive transactions and trends 2016 |

4 | Automotive transactions and trends 2016
Cross-border deals in 2016Cross-border acquisitions provide companies access to new markets, new business segments and new customers. However, these activities may be temporarily delayed due to recent events like the outcome of the US presidential election, Brexit and China’s new regulations on outbound foreign investment.
(73)
86%
(95)
74%
22%
4%
UK
74%
22%
4%
Domestic deals Outbound deals Inbound deals
(214)
US
19%
21%61%
(78)
Canada
19%
56%
24% 27%40%
33%
Germany
(72)
France
75%
13%
13% (200)
China
75%
12%
13%
75%
Japan
(68)
7%
40%53%
*The number in brackets represents the total number of deals in that country/region.Source: Dealogic
Where a company operates is as important as the segments in which it operates. Enterprises that undertake a robust portfolio review often move toward geographies that fill gaps or are ripe for disruption.
China is playing an increasing role in Asia-Pacific M&A activity, with their volume increasing from 120 deals in FY14 to 200 deals in FY16. China’s outbound M&A activity surged in 2015 and 2016 with an increase in pace and deal size. In addition, some of the largest domestic deals within Asia-Pacific during FY16 were announced by China, followed by Australia and Japan.
5Automotive transactions and trends 2016 |
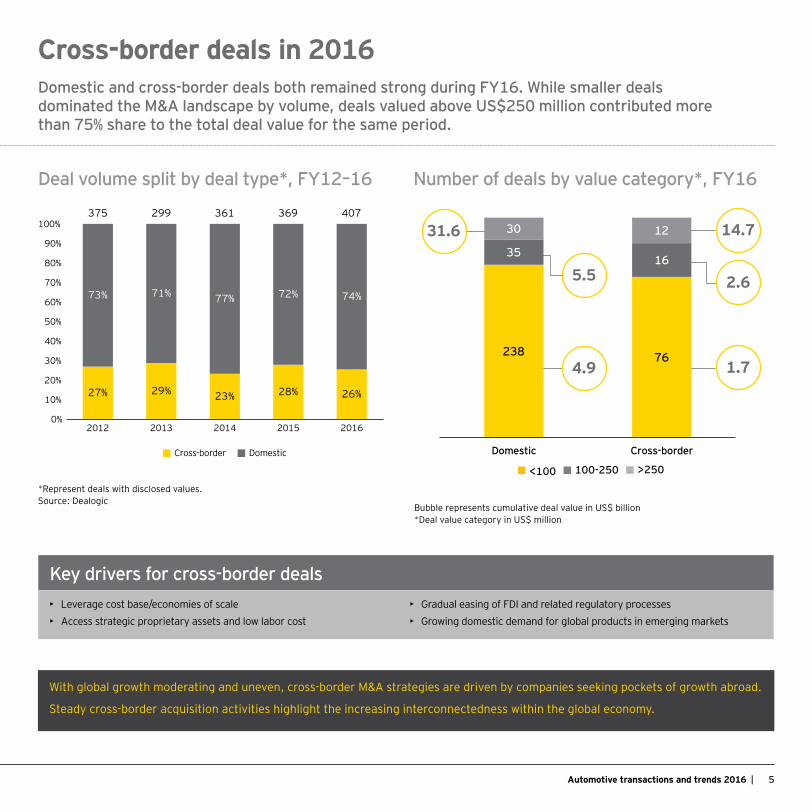
Domestic and cross-border deals both remained strong during FY16. While smaller deals dominated the M&A landscape by volume, deals valued above US$250 million contributed more than 75% share to the total deal value for the same period.
*Represent deals with disclosed values.Source: Dealogic
Bubble represents cumulative deal value in US$ billion *Deal value category in US$ million
*The size of the circle represents deal value in US$ billion
4.9
14.7
2.65.5
238 76
3516
30 12
Domestic Cross-border
31.6
1.7
>250100-250<100
Number of deals by value category*, FY16Deal volume split by deal type*, FY12–16
Cross-border deals in 2016
With global growth moderating and uneven, cross-border M&A strategies are driven by companies seeking pockets of growth abroad.
Steady cross-border acquisition activities highlight the increasing interconnectedness within the global economy.
27%
375 299 361 369 407
29% 23% 28% 26%
73% 71% 77% 72% 74%
0%
10%
20%
30%
40%
50%
60%
70%
80%
90%
100%
2012 2013 2014 2015 2016
Cross-border Domestic
Key drivers for cross-border deals• Leverage cost base/economies of scale• Access strategic proprietary assets and low labor cost
• Gradual easing of FDI and related regulatory processes• Growing domestic demand for global products in emerging markets
6 | Automotive transactions and trends 2016
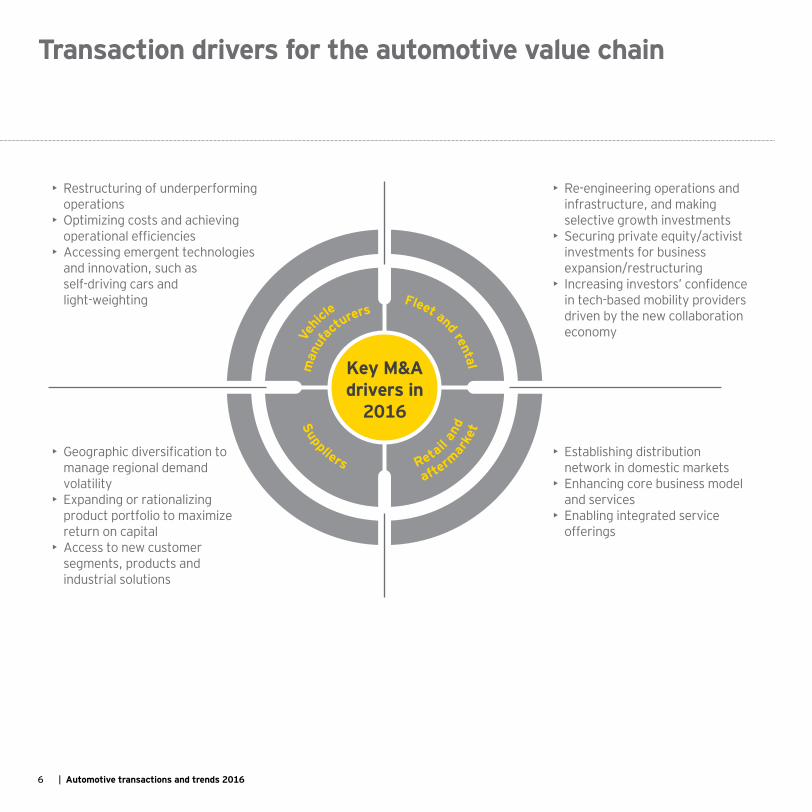
• Restructuring of underperforming operations
• Optimizing costs and achieving operational efficiencies
• Accessing emergent technologies and innovation, such as self-driving cars and light-weighting
• Re-engineering operations and infrastructure, and making selective growth investments
• Securing private equity/activist investments for business expansion/restructuring
• Increasing investors’ confidence in tech-based mobility providers driven by the new collaboration economy
• Establishing distribution network in domestic markets
• Enhancing core business model and services
• Enabling integrated service offerings
• Geographic diversification to manage regional demand volatility
• Expanding or rationalizing product portfolio to maximize return on capital
• Access to new customer segments, products and industrial solutions
Key M&Adrivers in
2016
Fleet and rental
Retail an
d
afterm
arke
tSuppliers
Vehic
lem
anuf
acturers
Transaction drivers for the automotive value chain

Automotive sub-sector transaction trends and drivers

8 | Automotive transactions and trends 2016
4Q13 1Q14 2Q14 3Q14 4Q14 1Q15 2Q15 3Q15 4Q15 1Q16 2Q16 3Q16 4Q16
Deal value (US$m) No. of deals
969
14,868
6741,654
3071,491
3,901 1,903 2,269
5,871 3,3702,296
1,237
17
35
2118
2621 21
2732
24 21
1724
2016 deals weredriven by autonomous driving, connectivity
and alternate powertrain technologies. OEMs continue
to accelerate the paceof their engagementwith tech companies,both large and small.
Deal values increased by ~28%
YOY to reach US$12.3 billion
Deal volumes decline by 16% YOY
China, Japanand US were the largest acquirer countries, with a
combined 91% share in deal value and
56% share indeal volume
Fleet and rental
Retail an
d
afterm
arke
tSuppliers
Vehic
le
man
ufac
turers
Key M&Adrivers in
1H16
Source: Dealogic*The Porsche-Scania deal contributed more than 60% to the total deal value during 1Q14.
Vehicle manufacturers (OEMs) transactions
M&Astrategyoutlook
Operational restructuring tounlock capital for expansion
Access to future mobility
solutions/services, autonomous driving
and connectivity technologies
Energy/powertrain, parking and rentals/
marketplaces
Deal indicatorsShare of the top five deals in FY16 in total deal values
68% Completion rate of deals announced in 2H16 based on deal volumes
76% Completion rate of deals announced in 4Q16 based on deal volumes
70%
The growing number of autonomous driving, connectivity and powertrain technologies acquisitions highlights the importance of leadership positioning among passenger vehicle manufacturers in the burgeoning mobility landscape.

9Automotive transactions and trends 2016 |
China, the US and Japan emerged as the largest acquirer countries, with 83% share in deal value
Deal values declined by 4% YOY to US$31.8 billion, while deal volumes increased by 3% YOY
China, the US and Germany were the largest target nations, accounting for more than 53% share by deal volume
Parts and equipment (supplier) transactions
2016 deals were driven by self-driving revolution, control of multipart modules and interior business consolidation
Fleet and rental
Retail an
d
afterm
arke
tSuppliers
Vehic
le
man
ufac
turers
Key M&Adrivers in
1H16
4Q13 1Q14 2Q14 3Q14 4Q14 1Q15 2Q15 3Q15 4Q15 1Q16 2Q16 3Q16 4Q16
Deal value (US$m) No. of deals
4,609
7,771 8,917
16,600
1,606
15,255
5,695 6,976
5,182
7,236
4,397 4,478
15,740
84
112
89 111100 100
111
88
82
96 94
110
91
Source: Dealogic
M&Astrategyoutlook
To keep up with advances
in self-driving cars, infotainment
and powertrains
Wave of consolidation and access to the all-
important interface between driver
and vehicle
Gaining access to new safety
and electronics technologies
Deal indicatorsShare of the top five deals in FY16 in total deal values
45% Completion rate of deals announced in 2H16 based on deal volumes
72% Completion rate of deals announced in 4Q16 based on deal volumes
63%
With Samsung’s acquisition of Harman, a “new market entrant” booked the largest deal in the supplier space.
10 | Automotive transactions and trends 2016
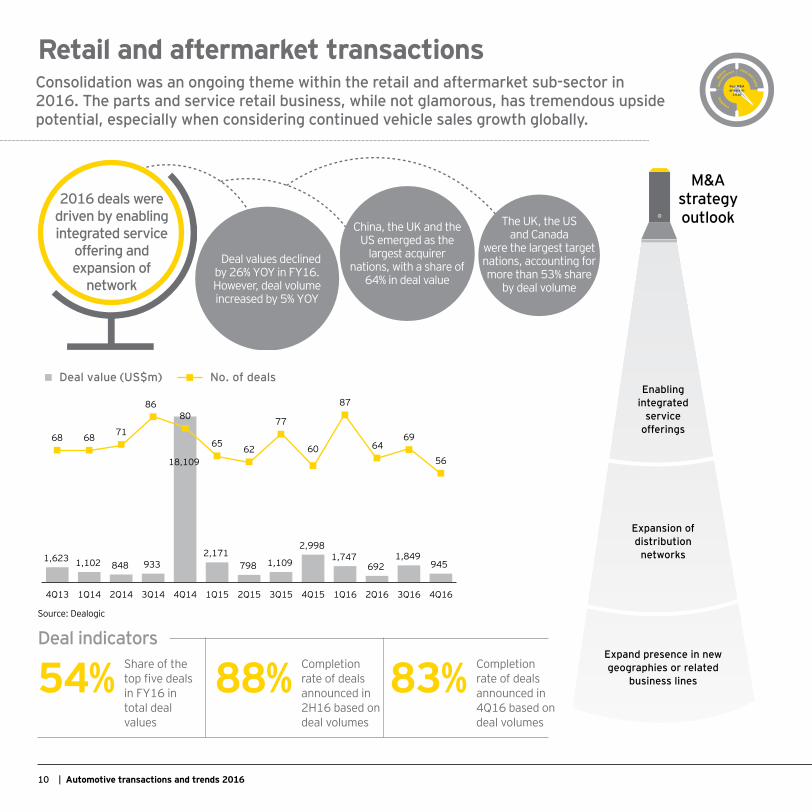
4Q13 1Q14 2Q14 3Q14 4Q14 1Q15 2Q15 3Q15 4Q15 1Q16 2Q16 3Q16 4Q16
Deal value (US$m) No. of deals
1,623 1,102 848 933
18,109
2,171 798 1,109
2,998 1,747
692 1,849
945
68 68 71
8680
65 62
77
60
87
64 69
56
Fleet and rental
Retail an
d
afterm
arke
tSuppliers
Vehic
le
man
ufac
turers
Key M&Adrivers in
1H16
The UK, the USand Canada
were the largest target nations, accounting for more than 53% share
by deal volume
China, the UK and the US emerged as the
largest acquirer nations, with a share of
64% in deal value
Deal values declined by 26% YOY in FY16. However, deal volume increased by 5% YOY
2016 deals were driven by enabling integrated service
offering and expansion of
network
Source: Dealogic
M&Astrategyoutlook
Enabling integrated
service offerings
Expansion of distribution
networks
Expand presence in new geographies or related
business lines
Retail and aftermarket transactions
Deal indicatorsShare of the top five deals in FY16 in total deal values
54% Completion rate of deals announced in 2H16 based on deal volumes
88% Completion rate of deals announced in 4Q16 based on deal volumes
83%
Consolidation was an ongoing theme within the retail and aftermarket sub-sector in 2016. The parts and service retail business, while not glamorous, has tremendous upside potential, especially when considering continued vehicle sales growth globally.
11Automotive transactions and trends 2016 |
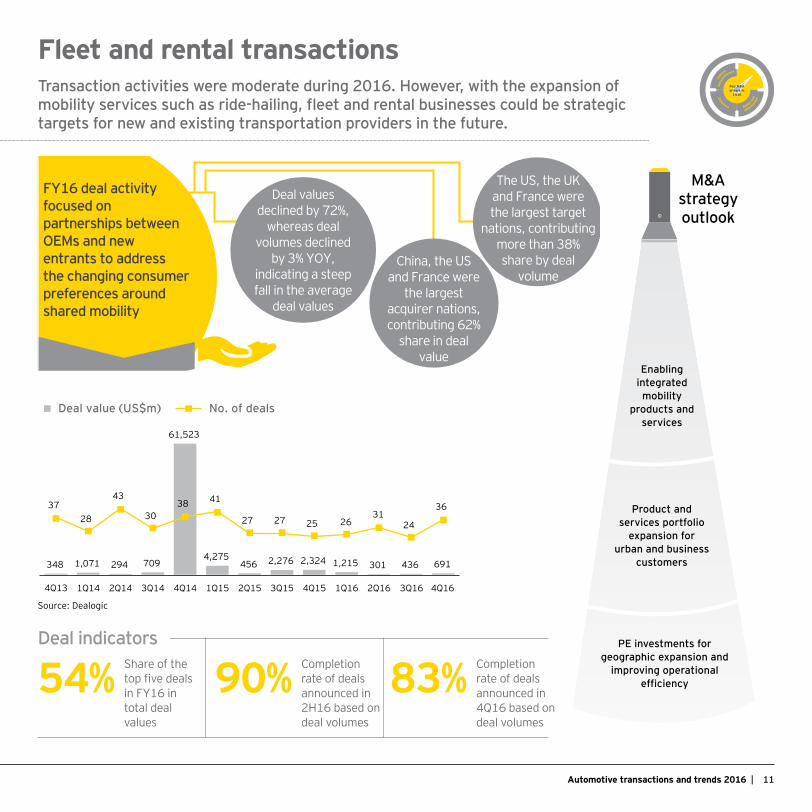
Deal value (US$m) No. of deals
4Q13 1Q14 2Q14 3Q14 4Q14 1Q15 2Q15 3Q15 4Q15 1Q16 2Q16 3Q16 4Q16
348 1,071 294 709
61,523
4,275 456 2,276 2,324 1,215 301 436 691
3728
43
3038 41
27 27 25 26 31
24
36
Fleet and rental
Retail an
d
afterm
arke
tSuppliers
Vehic
le
man
ufac
turers
Key M&Adrivers in
1H16
FY16 deal activity focused on partnerships between OEMs and new entrants to address the changing consumer preferences around shared mobility
Deal values declined by 72%,
whereas deal volumes declined
by 3% YOY, indicating a steep fall in the average
deal values
China, the US and France were
the largest acquirer nations, contributing 62%
share in deal value
The US, the UKand France werethe largest target
nations, contributing more than 38% share by deal
volume
Source: Dealogic
M&Astrategyoutlook
Enabling integrated mobility
products and services
Product and services portfolio
expansion for urban and business
customers
PE investments for geographic expansion and
improving operational efficiency
Fleet and rental transactions
Deal indicatorsShare of the top five deals in FY16 in total deal values
54% Completion rate of deals announced in 2H16 based on deal volumes
90% Completion rate of deals announced in 4Q16 based on deal volumes
83%
Transaction activities were moderate during 2016. However, with the expansion of mobility services such as ride-hailing, fleet and rental businesses could be strategic targets for new and existing transportation providers in the future.

12 | Automotive transactions and trends 2016
Investing in mobilityAutomotive companies are seeking leadership positions in the fast-evolving transportation landscape; M&A, strategic partnerships, collaboration complement in-house initiatives.
Active acquirers: OEMs, suppliers and technology companies
• Audi, BMW (venture arm BMW i ventures), and Daimler have the highest number of acquisitions and collaborations among traditional automotive companies.
• Samsung, Siemens and Didi are leading non-automotive investors in mobility. Advancements in autonomous driving, connected vehicle, infotainment and GPS/mapping solutions are driving supplier investment activities.
• Recent high-value deals: Samsung-Harman (US$8 billion), Siemens-Mentor Graphics (US$4.5 billion) and the Uber-Otto acquisition (US$680 million).
• OEMs and suppliers have been actively increasing investments in technology start-ups, particularly in the US, where OEMs are in an ongoing battle (among themselves and other tech giants – Apple, Google, etc.) for new talent, IP and breakthrough technologies.
• Germany is also an active region, with Daimler, Volkswagen, BMW, as well as large tier-1 suppliers, seeking innovation and talent.
• China has a growing presence in mobility M&A activities, including the blockbuster Uber-Didi merger (resulting in a ride-hailing service valued at US$35 billion).
Top target nations: US, China, Germany
Since 2012, more than US$22 billion in deals have been finalized in the automotive-mobility space
Rapid growth in autonomous and connected vehicle technologies has yielded investments of US$14 billion in the last five years
When considering deals by region, the US has been the most active market, with deal values reaching over US$15 billion*
The US had the highest number of deals, 27, with a lot of American automotive players investing in start-ups working in the autonomous and connected tech space
*US$8 billion attributed to Samsung-Harman deal

13Automotive transactions and trends 2016 |
Capital and M&A outlookInsights from the Automotive Capital Confidence Barometer
Digital and innovation drive M&A market
Digitalization and sector convergence are
likely prominent boardroom focus
points
Global economic confidence challenged
by volatility in currencies, commodities
and other capital markets
Acquiring talents and access to new
customers, data fuel cross-sector M&A
M&A strategy focused on cross-border
acquisitions
Respondents view the economy as either stable or modestly improving
70%
34%
Respondents indicating the impact of digital technology on business model as most prominent boardroom discussion point
34%
Respondents indicating sector convergence/increased competition from other sectors as2nd most prominent boardroom discussion point
Respondents cited geopolitical instability as the greatestbusiness risk
49%
Respondents cited acquiring talent as the main driver for acquisition outside of automotive sector
55%
Respondents cited access to new customers, details and databases as drivers for acquisition outside of automotive sector �
31%
Respondents planningacquisitions outsidetheir immediate region
42%
Respondents planningdomestic or intra-regional acquisitions in the next12 months
58%
1 2 3 4

14 | Automotive transactions and trends 2016
The CapitalAgenda
Raisin
g Investing
Preserving Optimizi
ng
What is the best way for your company to grow and is it aligned to core business?
How can you improve the performance of your assets?
What steps can you take to maximize your portfolio’s performance?
• Assess investment opportunities and risks associated with new segments and business models
• Use need-based and strategic alliances, JVs and acquisition to gain technology and geographic coverage
• Build flexibility in emerging market investments
Do you have the right capital structure to meet your strategic priorities?
• Improve information flows to support enhanced visibility of liquidity and cash risks
• Enhance business modeling and cash forecasting systems and capabilities
• Maintain a dynamic business and product portfolio assessment process to support liquidity needs
• Evaluate effectiveness of currency and raw material hedging strategies
EY’s Capital Agenda — key considerations and implications
• Integrate government incentives, direct loans and guarantees in capital-raising strategies
• Refinance debt, equity and other obligations
• Execute “loan-to-own strategies” providing opportunities to raise capital
• Balance cost reduction with sustainable process change
• Institutionalize and integrate working capital initiatives
• Divest carefully — implement risk management process around divestiture cycle to maximize cash benefits
• Benchmark leading-class performance and pursue targeted change

For a conversation about your capital strategy, please contact us:
Acknowledgements
Special thanks to EY Knowledge automotive analysts Joe Sebestyen and Sudarshan Vyas for the analysis and compilation of this study
Randall Miller Global Automotive and Transportation Industry Leader +1 313 628 8642 [email protected]
Mark Short Global Automotive and Transportation Industry Leader, Transaction Advisory Services +1 313 628 8760 [email protected]
Jim Carter Americas Automotive and Transportation Industry Leader, Transaction Advisory Services +1 313 628 8690 [email protected]
Constantin Gall GSA Automotive and Transportation Leader, Transaction Advisory Services +49 711 988114878 [email protected]
Tony Tsang Far East and Oceania Automotive Industry Leader, Transaction Advisory Services +86 21 2228 2358 [email protected]
Peter Wesp Japan Automotive Leader, Transaction Advisory Services +49 6196 996 27282 [email protected]
Anil Valsan Global Automotive and Transportation Lead Analyst +44 20 7951 6879 [email protected]
Regan Grant Global Automotive and Transportation Marketing Leader +1 313 628 8974 [email protected]
EY | Assurance | Tax | Transactions | Advisory
About EYEY is a global leader in assurance, tax, transaction and advisory services. The insights and quality services we deliver help build trust and confidence in the capital markets and in economies the world over. We develop outstanding leaders who team to deliver on our promises to all of our stakeholders. In so doing, we play a critical role in building a better working world for our people, for our clients and for our communities.
EY refers to the global organization, and may refer to one or more, of the member firms of Ernst & Young Global Limited, each of which is a separate legal entity. Ernst & Young Global Limited, a UK company limited by guarantee, does not provide services to clients. For more information about our organization, please visit ey.com.
© 2017 EYGM Limited. All Rights Reserved.
EYG no. 01182-174Gbl
BMC Agency GA 0665_09923
ED None.
In line with EY’s commitment to minimize its impact on the environment, this document has been printed on paper with a high recycled content.
This material has been prepared for general informational purposes only and is not intended to be relied upon as accounting, tax or other professional advice. Please refer to your advisors for specific advice.
ey.com