autofile: february 21
DESCRIPTION
The government is being urged to allow marques, dealers and lenders to keep spare car keys when finance is approved. In the second part of an investigation, Autofile reveals this long-established practice could be under threat in the loan-shark laws. The vehicle industry has provided Ports of Auckland with a massive boost, as profits jump by 70 per cent. CEO Tony Gibson told Autofile: “Having almost 100,000 units in the second half of 2013 is a sign the economy seems to be picking up.” The MTA has raised issues with the Commerce Commission about IAG wanting to buy out Lumley. “We’re concerned with the impact on collision repairers and labour rates,” says Dougal Morrison. And Malcolm Yorston, of the IMVIA, compares cheap imported toasters to some after-market car parts, such brake-disc pads. Find out why this reminds him of five-and-dime stores.TRANSCRIPT
Car dealers’ safety net may be bannedThe Financial Services
Federation (FSF) is urging the government to allow
motor vehicle manufacturers, traders and lenders to hold spare sets of car keys after finance is approved for purchases.
The long-established practice could be banned under the Credit Contracts and Financial Services Reform Bill, which the government describes as the biggest overhaul of the sector for a decade.
Most of the proposals are aimed at cracking down on
unscrupulous lenders, particularly in the lower end of the market.
But in its present form, the legislation will affect how finance companies and car dealers go about their business – as revealed in the previous issue of Autofile.
The FSF has also raised concerns with other parts of the bill and is calling for Craig Foss, Minister of Consumer Affairs, to address them.
The federation submits there’s nothing wrong in principle with lenders and registered motor vehicle dealers holding duplicate
sets of keys from day one of loans. “Doing so may facilitate
subsequent repossession to the benefit of all concerned in terms of cost savings,” says executive director Lyn McMorran. “The use of keys should be regulated, not the custody of them.”
The issue is particularly important with car finance because manufacturers typically hold duplicate keys for their vehicles with many having outlets that provide point-of-sale finance for new stock.
The FSF questions if one section [continued on page 4]
The trusted voice of the auto industry for more than 25 yearsIssue 3-2014
21 February 2014
In this issuep6 Trader’s view on WOFs
p9 IMVIA’s capital venture
p10 Kia Soul EV unveiled
p12 Spotlight on Hamilton
p15 MTA’s take on Lumley
p18 Buyer was ‘trying it on’
Specialised training to increase your sales
Find out more on Page 17
Vehicles boost profits at port
www.autofile.co.nz
New Zealand’s booming motor vehicle industry is providing Ports of
Auckland Ltd with a massive increase in business, as reflected in its half-yearly financial statement.
The company has announced a 70 per cent increase in profits for the six months up to December 31.
One of the port’s star
performers was the automotive sector, with motor vehicle imports increasing by 29.3 per cent to 99,710 units from 77,122.
Volumes of break-bulk – or general – cargo, which is non-containerised and includes cars, were up 41.9 per cent to 2.87m tonnes compared to 2.02m over the same timescale.
“The motor vehicle numbers we’ve been experiencing have been very good,” Tony Gibson, chief executive officer, told Autofile.
“Having almost 100,000 units coming through the port in the second half of 2013 is a good sign – the economy seems to be really picking up.”
[continued on page 8]
Retro Vehicle Enhancementwww.rve.co.nz
0800 RETRO 4 U
Driving Solutions
ACCESSORY BUNDLINGCREATE AN EXCLUSIVE MODEL FOR YOUR BRAND
MORE SALES MORE PROFIT
CUSTOMERS FOR LIFE
WWW.DEALERSHIPEDITIONS.CO.NZVIEW VIDEO
p10
From Gran Turismo to Chicago -
Toyota’s FT-1 PlayStation racer becomes reality

Protect your investmentwith
E A S Y T O I N S TA L L A N D R E M O V E
P R E V E N T S K E R B I N G D A M A G E R A N G E O F C O L O U R S C O S T-E F F E C T I V E
0 8 00 4 R I M P R OWWW.R I M P R O-T E C.C O M
M A Y C O V E R E X I S T I N G D A M A G E

www.autofile.co.nz | 3
editor’s note
Getting fuelled up in the futureIt’s often said that because
New Zealand no longer manufactures as much stuff as
it used to – such as motor vehicles – that this country is more of a technology taker than provider.
That’s not to knock what is made here or belittle how high in the innovation stakes we come.
But perhaps more could be done to prepare us for new technology before it actually arrives on our wharves inside cars, or powering them.
Latest statistics from the Imported Motor Vehicle Industry Association (IMVIA) on what’s happening in Japan shouldn’t be underestimated.
The bottom line is that motorists in that country – the biggest source market for all vehicles crossing our border – are falling in love with hybrids.
Like it or not, the revolution there is in full swing and that will eventually impact on what can be sourced and brought over to be sold on yards here.
The IMVIA’s views are covered in-depth online at www.autofile.co.nz.
Among the news is the fact that Toyota is leading the charge by announcing it will introduce 15 more hybrids in Japan over the next two years to complement its existing fleet.
The two best-sellers there last year were the Aqua and Prius, with the two hybrids making up almost 16 per cent of over-1,000cc registrations.
And the hybrid version of the new Honda Fit accounted for more than 70 per cent of the model’s sales in four months.
The massive rise in the popularity of hybrids in Japan appears to be coming at the expense of some tried and tested models on dealers’ yards here.
There were notable month-on-
month drops in market share for the Nissan Cube and Mazda Demio – both due to be replaced shortly – and sales of Suzuki’s Swift are decreasing.
Another gem of information was that the Nissan’s Leaf was the only pure electric vehicle (EV) to show up in the Japanese charts. It notched up 13,021 registrations in 2013, with a number arriving on these shores.
EVs are continuing to find their feet in New Zealand and their uptake will be slower than hybrids but where Australia leads, surely we can try to follow.
The Leaf scored a sales and exposure goal last year when the Lord Mayor of Sydney took delivery of 10 of the small hatchbacks.
The council’s purchase marked the largest single order of Leafs in Australia at the time and they joined four Mitsubishi i-MiEVs.
They replaced a fleet of Toyota Prius petrol-electric hybrids because the use of zero-emission vehicles was seen as a wholesale gain in an urban environment.
Citizens can also make their own choices about what they drive because dozens of charging points have been installed in council car parks to overcome range anxiety.
It was also interesting to find out that EVs were a common thread at the IMVIA’s national executive meeting in Wellington, which was attended by cabinet members, government officials and representatives of motor vehicle industry associations.
Perhaps it’s time to realise that alternative ways of powering our cars are coming to New Zealand.
It’s already happening in other parts of the world – be that with hybrids, EVs or fuel-cell technology.
Darren RisbyEditor
Copyright: Published twice monthly by 4Media, PO Box 6222, Dunedin 9059 All statements made, although based on information believed to be accurate and reliable, cannot be guaranteed, and no liability can be accepted for any errors or omissions. Reproduction of autofile in whole or part, without written permission, whether by xerography or any other means, is strictly forbidden. All rights reserved.
Editor
darren risby [email protected] 021 137 5430
Journalist & onlinE producEr
cameron carpenter [email protected]
advErtising
Brian Mccutcheon [email protected] 021 455 775
dEsignEr
adrian payne [email protected]
Autofile is also available as an electronic copy via email. If you’d like to receive electronic copies please send an email with your name and organisation to: [email protected]. Back copies are also available on request.
Call Steve Owens now on 021 947 752
AUCKLAND
WELLINGTONNE LSON
KAWASAK I
NAGOYAOSAKA
RVessels arriving every two weeksRServicing Auckland, Wellington, Lyttelton
& Nelson with ‘Direct Port Calls’
w w w . d o l p h i n s h i p p i n g . c o . n z
Full PORT to DOOR service
Karla Sorensen Mob: 0276 796 981 Ph: 09 373 5881 Fx: 09 303 0072Email: [email protected]
JAPAN to
NEW ZEALAND
CALL ME NOW!
L YTT E L TON

4 | www.autofile.co.nz
At a glance The loan-shark law changes include lenders taking responsibility for the likely effect of their credit. They will only be able to provide loans to meet borrowers’ needs and repayments shouldn’t cause substantial hardship.
Companies may be banned for irresponsible lending and there will be tighter controls on misleading adverts.
Repossession will be banned unless specified in the paperwork, while agents and employees will be licensed.
[continued from page 1]
news
of the bill, which defines these proposals, is intended to prevent marques, dealers and financiers from holding duplicate keys.
“Our members submit the cost to replace modern motor vehicle keys is significant,” says McMorran.
“This cost would be passed onto consumers and is one which will often need to be incurred by lenders if the clause is enacted without change.”
The issue is flagged up elsewhere in the bill, which states lenders must not “hold” keys or similar access devices until the goods have been repossessed.
With regard to holding duplicate keys – particularly by car finance companies – the FSF says that seems undesirable because: It would prevent a debtor
voluntarily giving the lender
the keys at the start of the repossession process, which may be sensible for the borrower to do.
There’s nothing wrong with a financier holding a duplicate set after a contract has been signed because this can facilitate repossession to the benefit of everyone concerned.
The FSF wants the word “hold” replaced with “use” in the relevant parts of the legislation to overcome some of the issues.
DEVICES TO BE REGULATEDDisabling devices – including those fitted to vehicles – will be regulated under the bill.
Lenders may not activate one unless the borrower is in default, has been given reasonable notice
it will be activated and advised how to prevent this.
They must not be connected to, or used with, essential household goods and important documents, and devices will be defined by having functions that warn debtors repayments are overdue, prevent goods from being used and limit their use.
Their other functions include enabling creditors to locate goods and achieving beneficial outcomes for lenders.
While the FSF is sympathetic to disabling devices being regulated, McMorran says it’s “odd the regime being proposed is different to repossessions generally”.
GUIDELINES FOR LENDINGThe Credit Contracts and
Disabling devices under scrutinyAccess to goodsPart of the Credit Contracts
and Financial Services Law Reform Bill covers devices that disable goods.
“A contract may not provide for keys or other devices to be held by the creditor prior to repossession,” it states.
When a contract states the creditor has security over the goods, they
must be identified in the contract – and to what the device is
connected and what the right to activate it is.
Is your desk limiting your sales opportunities ? Use MotorWeb where and when it is convenient for you.
Our new mobile responsive website allows access from your smartphone while you are on the move.
Nothing to download or setup; just login to your MotorWeb account or scan the QR code at the base of this page. It’s that simple!
You will then be greeted by our login page with a handy ‘remember me’ function
Now you’re done!
ph 0800 668 679
Paying arrearsThe proposed legislation says creditors must give debtors time to remedy defaults.
“A creditor may repossess goods [for] which a repossession warning notice has been served unless the period for remedying the default has expired and the debtor has failed to remedy [it].”
This will also be the case if the debtor has returned the goods or reinstated the agreement by paying any arrears.
Financial Services Reform Bill will result in responsible lending principles being introduced.
The FSF already has a set of guidelines for its members, which
www.autofile.co.nz | 5
of responsible behaviour are prevented from preying on the vulnerable.
“Enforcement will need to be stepped up on the enactment of this bill.”
She adds there is some “horrendously irresponsible behaviour” in parts of the market, including unjustifiably high interest rates and fees charged by some providers.
The Motor Trade Association is supporting the submission made by the FSF, while three other areas of concern to car dealers have previously been highlighted by Autofile.
One issue is the bill defining
traders and point-of-sale retailers as lenders.
It also says dealers, by being classed as lenders, will have to publish loan terms, borrowing costs, and information on repayment waivers and extended warranties.
The proposals include lenders and traders being banned from charging commission on insurance if people have no
choice but to buy policies from one provider.
McMorran told Autofile: “The Commerce Committee is due to report back in March, so we will see what difference our submissions have made then.”
arrears or repossession action,” explains McMorran.
“This provides bad customers with the
ability to have the loan without paying for it. This disadvantages all consumers because good ones are paying for those who abuse the system.”
It is in financiers’ interests to help customers
through short-term hardship so loans are fully repaid.
“The provider secures payments by dealing with
hardship situations effectively for both parties,” she says.
“Repossession is a last resort. More often than not, it results in recovering less than the debt owed, leaving the borrower with a residual obligation.”
The FSF has entered into a memorandum of understanding with the NZ Federation of Family Budgeting Services.
This requires its members to refer on clients when they recognise borrowers may be under financial stress and heading towards hardship.
‘PREYING ON VULNERABLE’On one hand, the government says its loan-shark laws will better protect borrowers from lenders, especially at the lower end of the market.
On the other, FSF members – which provide finance, investment, banking and insurance services to more than one million Kiwis – already take compliance seriously.
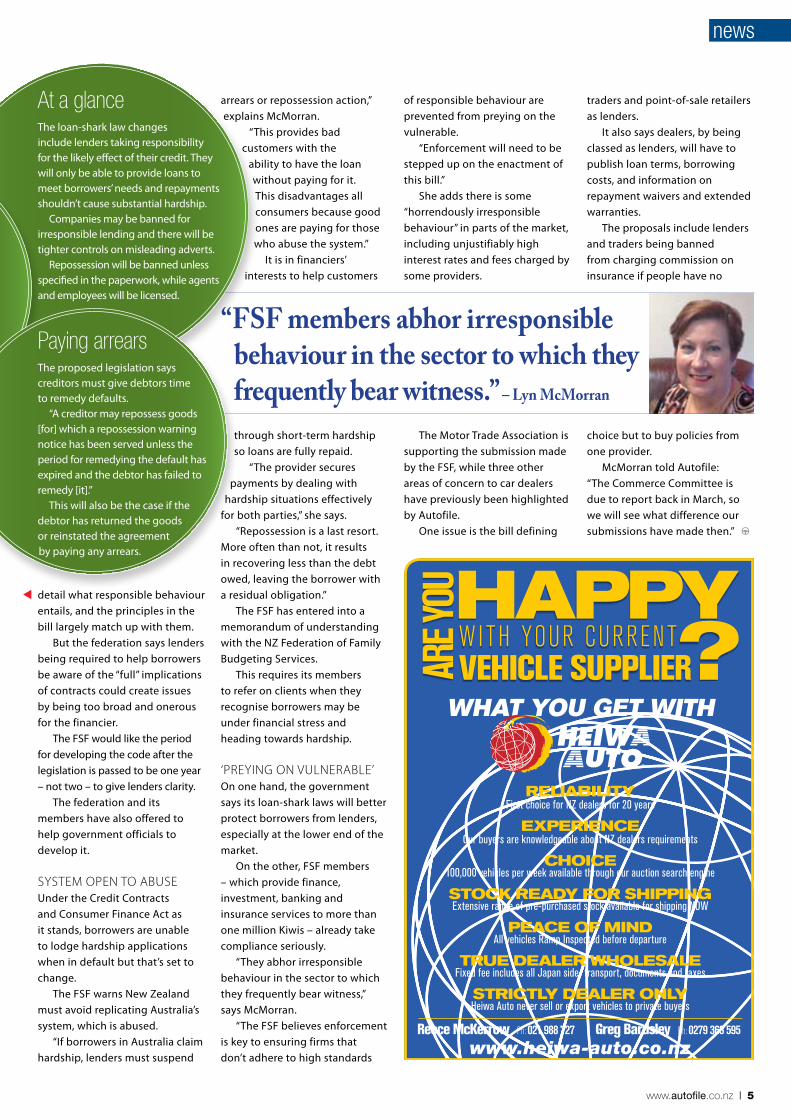
“They abhor irresponsible behaviour in the sector to which they frequently bear witness,” says McMorran.
“The FSF believes enforcement is key to ensuring firms that don’t adhere to high standards
“FSF members abhor irresponsible behaviour in the sector to which they frequently bear witness.” – Lyn McMorran
detail what responsible behaviour entails, and the principles in the bill largely match up with them.
But the federation says lenders being required to help borrowers be aware of the “full” implications of contracts could create issues by being too broad and onerous for the financier.
The FSF would like the period for developing the code after the legislation is passed to be one year – not two – to give lenders clarity.
The federation and its members have also offered to help government officials to develop it.
SYSTEM OPEN TO ABUSEUnder the Credit Contracts and Consumer Finance Act as it stands, borrowers are unable to lodge hardship applications when in default but that’s set to change.
The FSF warns New Zealand must avoid replicating Australia’s system, which is abused.
“If borrowers in Australia claim hardship, lenders must suspend
At a glance The loan-shark law changes include lenders taking responsibility for the likely effect of their credit. They will only be able to provide loans to meet borrowers’ needs and repayments shouldn’t cause substantial hardship.
Companies may be banned for irresponsible lending and there will be tighter controls on misleading adverts.
Repossession will be banned unless specified in the paperwork, while agents and employees will be licensed.
news
RELIABILITYFirst choice for NZ dealers for 20 years
EXPERIENCEOur buyers are knowledgeable about NZ dealers requirements
CHOICE100,000 vehicles per week available through our auction search engine
STOCK READY FOR SHIPPINGExtensive range of pre-purchased stock available for shipping NOW
PEACE OF MINDAll vehicles Ramp Inspected before departure
TRUE DEALER WHOLESALEFixed fee includes all Japan side: transport, documents and taxes
STRICTLY DEALER ONLY Heiwa Auto never sell or export vehicles to private buyers
WITH YOUR CURRENT VEHICLE SUPPLIER
WHAT YOU GET WITH
ARE Y
OUHAPPY?
www.heiwa-auto.co.nzReece McKerrow Ph: 021 988 727 Greg Bardsley Ph: 0279 363 595
Access to goodsPart of the Credit Contracts
and Financial Services Law Reform Bill covers devices that disable goods.
“A contract may not provide for keys or other devices to be held by the creditor prior to repossession,” it states.
When a contract states the creditor has security over the goods, they
must be identified in the contract – and to what the device is
connected and what the right to activate it is.
Paying arrearsThe proposed legislation says creditors must give debtors time to remedy defaults.
“A creditor may repossess goods [for] which a repossession warning notice has been served unless the period for remedying the default has expired and the debtor has failed to remedy [it].”
This will also be the case if the debtor has returned the goods or reinstated the agreement by paying any arrears.
6 | www.autofile.co.nz
newsnews
WE TRANSPORT
• MOTOR VEHICLES
• FARM TRACTORS
• MACHINERY
• AGRICULTURAL EQUIPMENT
• CONSTRUCTION EQUIPMENT
• PLEASURE CRAFT
• CONTAINERS
OTHER SERVICES
• VEHICLE STORAGE
• VEHICLE DISTRIBUTION MANAGEMENT
• HANDLING OF RARE AND RACE CARS
• FILMING PROJECTS
• ENCLOSED TRANSPORTERS
• M.A.F & CUSTOMS FACILITIES
• SECURITY & CONFIDENTIALITY
p: 0800 4 JEFFSe: vehicles: [email protected] pleasure craft: [email protected]: www.jeffs.co.nz
Vehicles revenue boost profitsstatement would have included extra revenue of $4.2m with no significant profit change.
The company describes the cost of the buy-out as “modest” and “a clean purchase at an attractive multiple”, with “earnings accretive, funded from cash”.
It says MotorWeb is strategically aligned with its customers, the industry and for data giving it an opportunity to “strengthen connectivity”, and grow revenue and earnings in a growing market.
Its addition has been positive for earnings before interest, taxes, depreciation and amortisation, but it has increased Trade Me’s expenses and reduced margins.
Trade Me Motors’ total revenue was up by 16 per cent year-on-year, which was led by dealer
revenue and premium uptake.Listing volumes grew by 1.8
per cent and it’s expected this will remain flat. Direct listings rose by 0.8 per cent and those placed by dealers increased by 3.5 per cent.
Details about Trade Me’s acquisition of MotorWeb have been published in
its half-year financial report.Overall, it shows revenue
increasing by seven per cent year-on-year to $85.7 million, while net profits went up by two per cent to $38m.
Jon Macdonald, chief executive officer, says the classifieds division, which includes vehicles, performed well in the six months to December 31 with revenue growth of 17 per cent.
Trade Me Motors has been strengthened by acquiring MotorWeb, the vehicle information authority.
“MotorWeb is an excellent fit given its great reputation and strong expertise in data,” says Macdonald.
“There’s a lot of potential around broadening and deepening products we provide
for buyers and sellers of vehicles.”MotorWeb was acquired through
a combination of asset and share purchases on December 20.
Trade Me paid $19.5m for its assets, which included goodwill of $11.7m, software valued at $7.8m and $71,000 worth of
property, plant and equipment.MotorWeb has had no significant
impact on revenue or profit, but had the takeover happened at the start of the reporting period, Trade Me’s consolidated income
I write in reference to the story in the February 10, 2014, issue of Autofile headlined “traders responsible for WOFs”.
The issue of warrants of fitness covered in this article has previously been subject to appeal in the district court.
The applicant (end user/buyer) claimed the respondent (dealer) was responsible for a seat-belt standards error. A new WOF had been issued and the seat belt had an incorrect standard.
The respondent lost at the Motor Vehicle Disputes Tribunal but appealed. The argument given was the dealer was no different to any person or organisation presenting a vehicle for a WOF.
He argued he was entitled to rely on the WOF-issuing agent to correctly test the subject vehicle and pass or fail it.
The act merely requires the WOF must be properly issued and be no
older than 28 days at the time of sale. A seller complies if the vehicle is presented for inspection by a properly authorised inspection centre.
The responsibility for a poor and incorrect inspection lies technically with the NZTA in the first instance, and then the issuing agent and inspector. The district court judge agreed and the appeal was successful. This precedent is common sense really – the inspection is technical and the inspection manual is a significant document with strict training, audit and equipment criteria.
Any person presenting a vehicle for a WOF at a properly authorised centre must be able to rely on the inspection carried out.
The tribunal referee in this matter covered by Autofile, in my view, has overstepped his jurisdiction.Arthur Murray, Hatchback Autos, Kelston, Auckland
Decision ‘oversteps’ jurisdiction
Email your letters, news and views to [email protected]. Please include your full name and daytime contact details.
Letter to the editor
“There’s a lot of potential around broadening and deepening products we provide for buyers and sellers of vehicles.” – Jon Macdonald, Trade Me
www.autofile.co.nz | 7
news
Yield in the motors division increased from ongoing premium products and dealer price increases.
Dealer yield jumped by 23.3 per cent compared to a direct yield rise of 9.2 per cent.
When it came to premium spend, the average spend per dealer was $288 a month, a year-on-year increase of 38 per cent.
Macdonald says this part of the business delivered innovation with improvements to selling processes, DealerBase, the boats category and new premium products.
Future growth levers include product enhancements – sell process and data – yield opportunities with premium products and people with account management and technology, while there has been some promotional and trade spend.
Overall, Trade Me’s expenses were up by 19 per cent year-on-year.
“This is a hefty increase, but it’s necessary for us to properly convert on the opportunities and position the business for the longer term,” says Macdonald.
The main contributors to the increase were people and marketing, with about 350 staff now employed.
“Trade Me has embarked on a period of reinvestment in the business with slow growth in short-term earnings as costs rise faster than revenue. We are convinced this is the right approach.”
More than half of website visits in January came from mobile devices and Macdonald expects strong growth to continue.
“We’ve put an enormous amount of work into making Trade Me a great experience across tablets and smart phones,” he says.
“E-commerce trends, the migration of advertising revenue to online and growth in online retail are in our favour.
“We expect stronger profit growth as we roll out products, phase in yield improvements in classifieds and increase activity in general items.
“However, we expect to talk about mobile less rather than more as it becomes completely ingrained in the business, rather
than separate to our websites.”Trade Me intends to pay a
dividend of 7.6 cents per share, which it says is consistent with its policy of having payments based on about 80 per cent of net profit after tax.
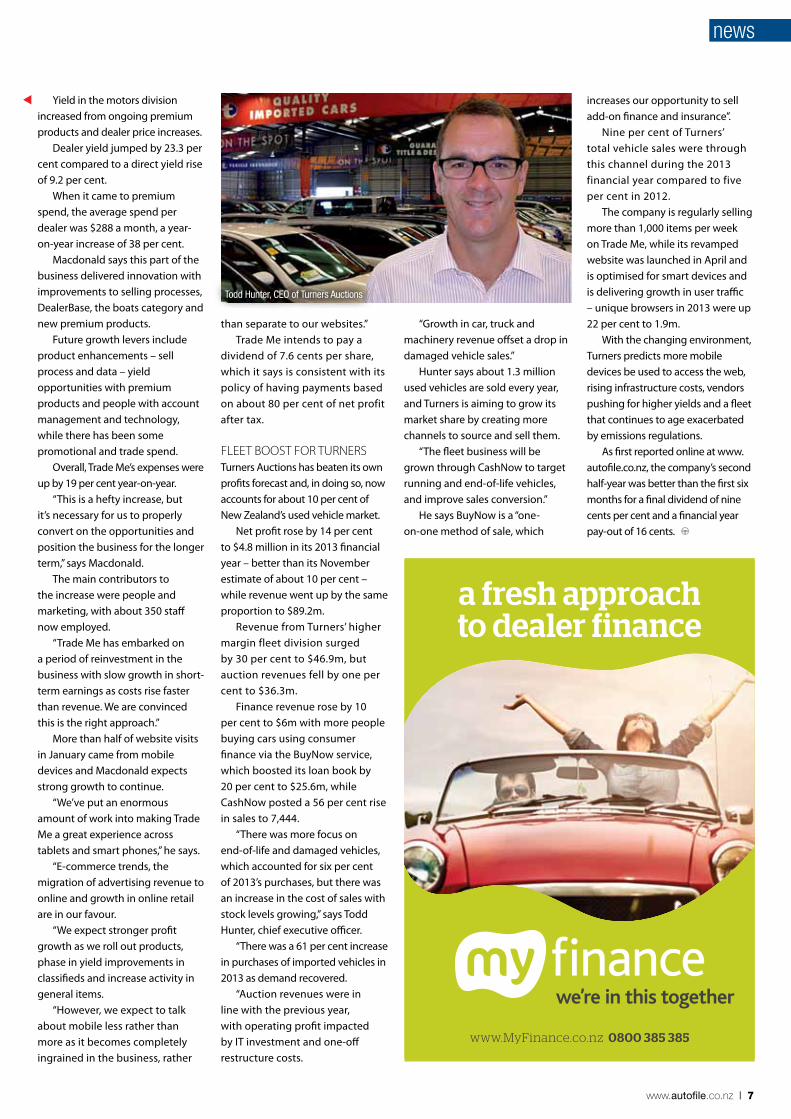
FLEET BOOST FOR TURNERSTurners Auctions has beaten its own profits forecast and, in doing so, now accounts for about 10 per cent of New Zealand’s used vehicle market.
Net profit rose by 14 per cent to $4.8 million in its 2013 financial year – better than its November estimate of about 10 per cent – while revenue went up by the same proportion to $89.2m.
Revenue from Turners’ higher margin fleet division surged by 30 per cent to $46.9m, but auction revenues fell by one per cent to $36.3m.
Finance revenue rose by 10 per cent to $6m with more people buying cars using consumer finance via the BuyNow service, which boosted its loan book by 20 per cent to $25.6m, while CashNow posted a 56 per cent rise in sales to 7,444.
“There was more focus on end-of-life and damaged vehicles, which accounted for six per cent of 2013’s purchases, but there was an increase in the cost of sales with stock levels growing,” says Todd Hunter, chief executive officer.
“There was a 61 per cent increase in purchases of imported vehicles in 2013 as demand recovered.
“Auction revenues were in line with the previous year, with operating profit impacted by IT investment and one‐off restructure costs.
“Growth in car, truck and machinery revenue offset a drop in damaged vehicle sales.”
Hunter says about 1.3 million used vehicles are sold every year, and Turners is aiming to grow its market share by creating more channels to source and sell them.
“The fleet business will be grown through CashNow to target running and end-of-life vehicles, and improve sales conversion.”
He says BuyNow is a “one-on-one method of sale, which
increases our opportunity to sell add‐on finance and insurance”.
Nine per cent of Turners’ total vehicle sales were through this channel during the 2013 financial year compared to five per cent in 2012.
The company is regularly selling more than 1,000 items per week on Trade Me, while its revamped website was launched in April and is optimised for smart devices and is delivering growth in user traffic – unique browsers in 2013 were up 22 per cent to 1.9m.
With the changing environment, Turners predicts more mobile devices be used to access the web, rising infrastructure costs, vendors pushing for higher yields and a fleet that continues to age exacerbated by emissions regulations.
As first reported online at www.autofile.co.nz, the company’s second half-year was better than the first six months for a final dividend of nine cents per cent and a financial year pay-out of 16 cents.
a fresh approachto dealer finance
we’re in this together
www.MyFinance.co.nz 0800 385 385
Todd Hunter, CEO of Turners Auctions
8 | www.autofile.co.nz
Trans Future 5 Voyage 72
osaka 10 Feb, Nagoya 11 Feb, kawasaki 15 Feb,auckland 5 Mar, lyttelton 7 Mar, wellington 9 Mar, Nelson 10 Mar
Trans Future 6 Voyage 69
osaka 24 Feb, Nagoya 25 Feb, kawasaki 1 Mar,auckland 20 Mar, lyttelton 22 Mar, wellington 24 Mar, Nelson 25 Mar
Morning Miracle Voyage 7
osaka 16 Feb, Nagoya 17 Feb, kawasaki 18 Feb,auckland 8 Mar
news
depreciation, rose by just 4.6 per cent to $56.8m despite the lift in freight volumes and the record number of containers handled in the six months to December 31.
Gibson says: “Productivity has improved since we started restructuring in 2011, which has enabled us to take advantage of an improving economy and Auckland’s growth.”
Since 2011, the company has reorganised its management structure, improved container handling and technology, and 60 per cent of stevedores are now working a flexible shift and roster system.
“Looking ahead, we’re focusing on developing our leaders, increasing opportunities for women and investing in the training,” he adds.
“This year has started well with volumes holding up. As as a result, we recently announced investment to support growth – a larger tug to handle bigger ships and two straddle carriers for rising container numbers.”
Gibson says there’s pressure on ports to become more efficient because supply and demand imbalances are driving down freight rates and hurting big shipping companies.
The port’s next development will be introducing a new terminal management system in July.
This will create a platform for the later introduction of new technology, such as optical recognition to identify containers at crane level and at the port’s gate.
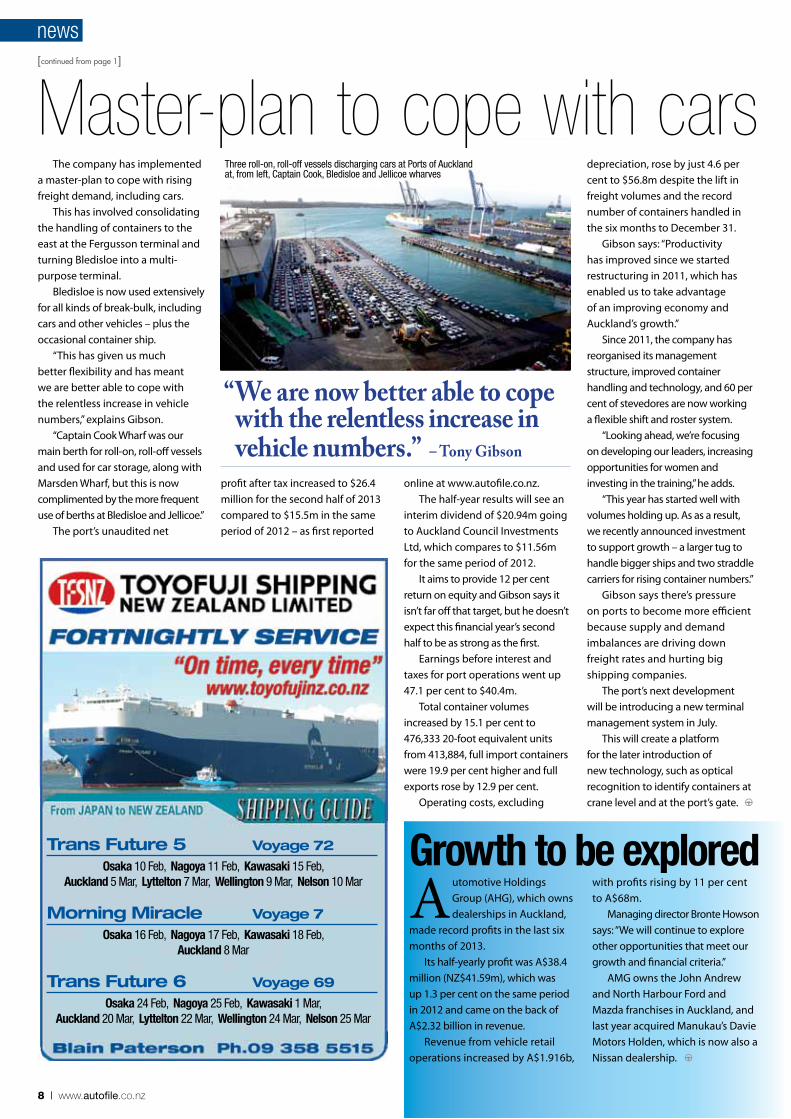
The company has implemented a master-plan to cope with rising freight demand, including cars.
This has involved consolidating the handling of containers to the east at the Fergusson terminal and turning Bledisloe into a multi-purpose terminal.
Bledisloe is now used extensively for all kinds of break-bulk, including cars and other vehicles – plus the occasional container ship.
“This has given us much better flexibility and has meant we are better able to cope with the relentless increase in vehicle numbers,” explains Gibson.
“Captain Cook Wharf was our main berth for roll-on, roll-off vessels and used for car storage, along with Marsden Wharf, but this is now complimented by the more frequent use of berths at Bledisloe and Jellicoe.”
The port’s unaudited net
[continued from page 1]
Master-plan to cope with carsThree roll-on, roll-off vessels discharging cars at Ports of Auckland at, from left, Captain Cook, Bledisloe and Jellicoe wharves
profit after tax increased to $26.4 million for the second half of 2013 compared to $15.5m in the same period of 2012 – as first reported
online at www.autofile.co.nz.The half-year results will see an
interim dividend of $20.94m going to Auckland Council Investments Ltd, which compares to $11.56m for the same period of 2012.
It aims to provide 12 per cent return on equity and Gibson says it isn’t far off that target, but he doesn’t expect this financial year’s second half to be as strong as the first.
Earnings before interest and taxes for port operations went up 47.1 per cent to $40.4m.
Total container volumes increased by 15.1 per cent to 476,333 20-foot equivalent units from 413,884, full import containers were 19.9 per cent higher and full exports rose by 12.9 per cent.
Operating costs, excluding
“We are now better able to cope with the relentless increase in vehicle numbers.” – Tony Gibson
Automotive Holdings Group (AHG), which owns dealerships in Auckland,
made record profits in the last six months of 2013.
Its half-yearly profit was A$38.4 million (NZ$41.59m), which was up 1.3 per cent on the same period in 2012 and came on the back of A$2.32 billion in revenue.
Revenue from vehicle retail operations increased by A$1.916b,
with profits rising by 11 per cent to A$68m.
Managing director Bronte Howson says: “We will continue to explore other opportunities that meet our growth and financial criteria.”
AMG owns the John Andrew and North Harbour Ford and Mazda franchises in Auckland, and last year acquired Manukau’s Davie Motors Holden, which is now also a Nissan dealership.
Growth to be explored
www.autofile.co.nz | 9
The future roll-out of electric vehicles (EVs) was one of the “common
threads” discussed at an Imported Motor Vehicle Industry Association (IMVIA) two-day meeting attended by politicians, government officials and automotive organisations.
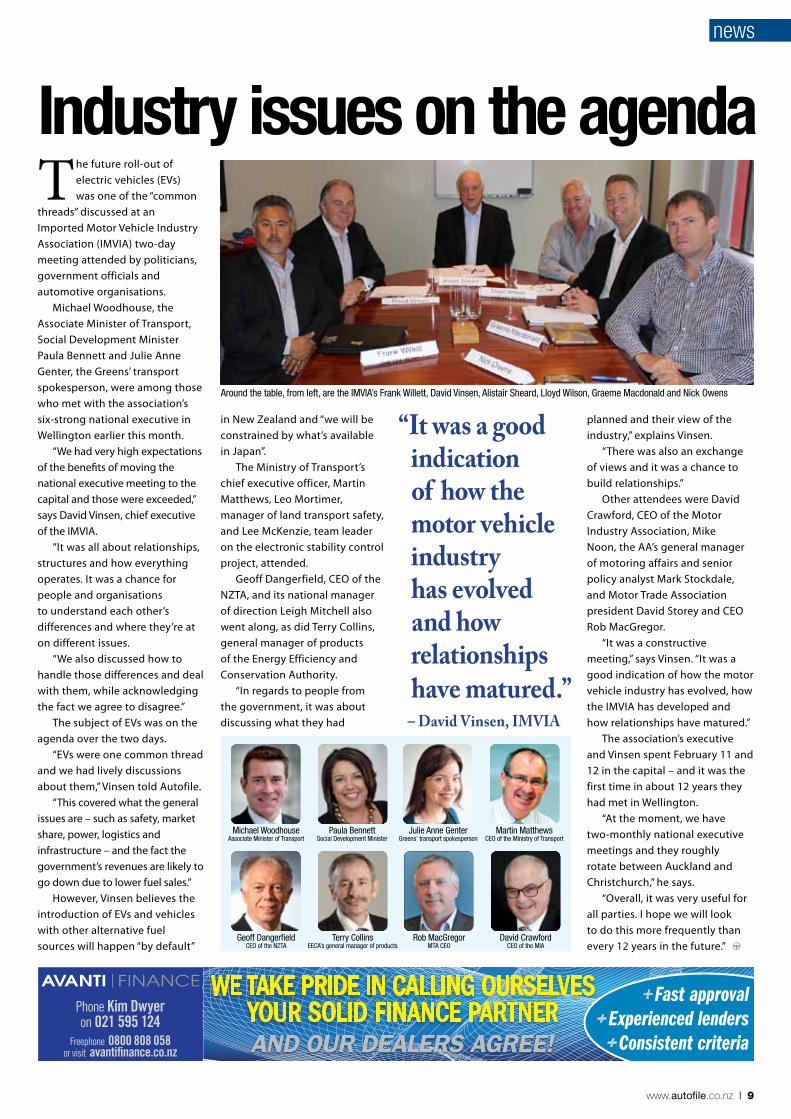
Michael Woodhouse, the Associate Minister of Transport, Social Development Minister Paula Bennett and Julie Anne Genter, the Greens’ transport spokesperson, were among those who met with the association’s six-strong national executive in Wellington earlier this month.
“We had very high expectations of the benefits of moving the national executive meeting to the capital and those were exceeded,” says David Vinsen, chief executive of the IMVIA.
“It was all about relationships, structures and how everything operates. It was a chance for people and organisations to understand each other’s differences and where they’re at on different issues.
“We also discussed how to handle those differences and deal with them, while acknowledging the fact we agree to disagree.”
The subject of EVs was on the agenda over the two days.
“EVs were one common thread and we had lively discussions about them,” Vinsen told Autofile.
“This covered what the general issues are – such as safety, market share, power, logistics and infrastructure – and the fact the government’s revenues are likely to go down due to lower fuel sales.”
However, Vinsen believes the introduction of EVs and vehicles with other alternative fuel sources will happen “by default”
news
Industry issues on the agenda
planned and their view of the industry,” explains Vinsen.
“There was also an exchange of views and it was a chance to build relationships.”
Other attendees were David Crawford, CEO of the Motor Industry Association, Mike Noon, the AA’s general manager of motoring affairs and senior policy analyst Mark Stockdale, and Motor Trade Association president David Storey and CEO Rob MacGregor.
“It was a constructive meeting,” says Vinsen. “It was a good indication of how the motor vehicle industry has evolved, how the IMVIA has developed and how relationships have matured.”
The association’s executive and Vinsen spent February 11 and 12 in the capital – and it was the first time in about 12 years they had met in Wellington.
“At the moment, we have two-monthly national executive meetings and they roughly rotate between Auckland and Christchurch,” he says.
“Overall, it was very useful for all parties. I hope we will look to do this more frequently than every 12 years in the future.”
AND OUR DEALERS AGREE!
WE TAKE PRIDE IN CALLING OURSELVES YOUR SOLID FINANCE PARTNERPhone Kim Dwyer
on 021 595 124 Freephone 0800 808 058
or visit avantifi nance.co.nz
+ Fast approval+ Experienced lenders
+ Consistent criteria
Around the table, from left, are the IMVIA’s Frank Willett, David Vinsen, Alistair Sheard, Lloyd Wilson, Graeme Macdonald and Nick Owens
in New Zealand and “we will be constrained by what’s available in Japan”.
The Ministry of Transport’s chief executive officer, Martin Matthews, Leo Mortimer, manager of land transport safety, and Lee McKenzie, team leader on the electronic stability control project, attended.
Geoff Dangerfield, CEO of the NZTA, and its national manager of direction Leigh Mitchell also went along, as did Terry Collins, general manager of products of the Energy Efficiency and Conservation Authority.
“In regards to people from the government, it was about discussing what they had
“It was a good indication of how the motor vehicle industry has evolved and how relationships have matured.”
– David Vinsen, IMVIA
Michael Woodhouse Associate Minister of Transport
Julie Anne Genter Greens’ transport spokesperson
Terry CollinsEECA’s general manager of products
Paula BennettSocial Development Minister
Martin MatthewsCEO of the Ministry of Transport
Geoff DangerfieldCEO of the NZTA
Rob MacGregorMTA CEO
David CrawfordCEO of the MIA
new cars
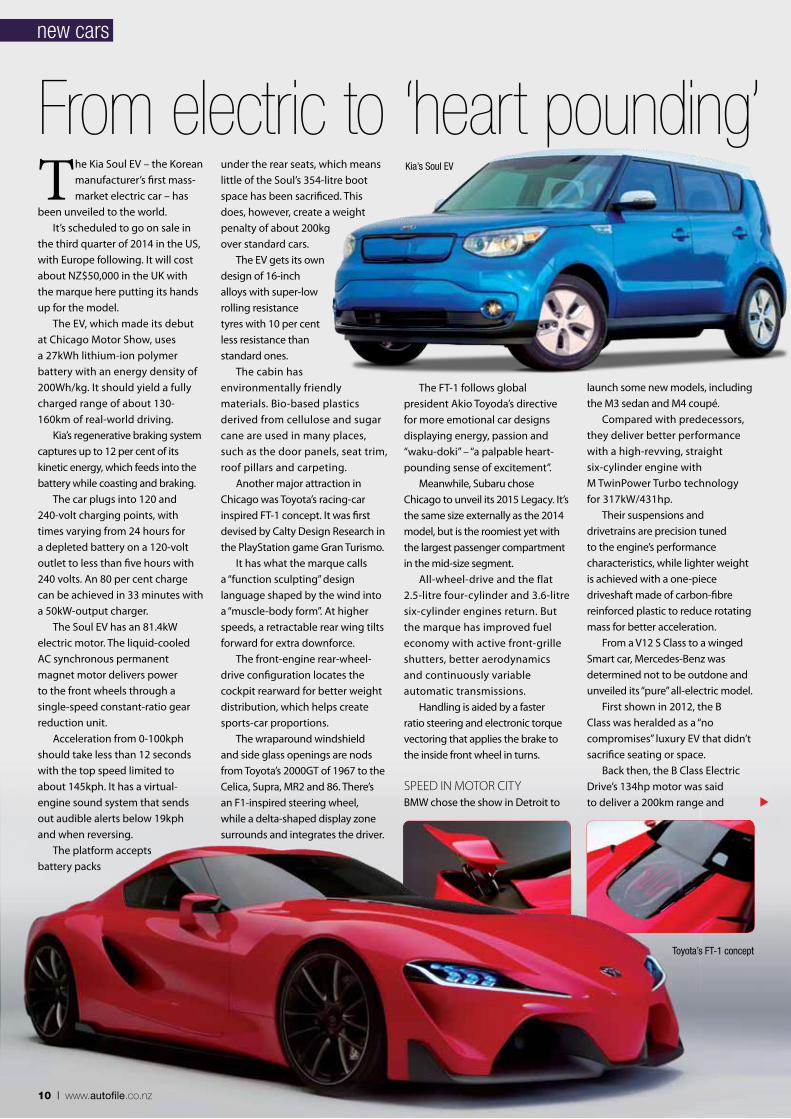
Toyota’s FT-1 concept
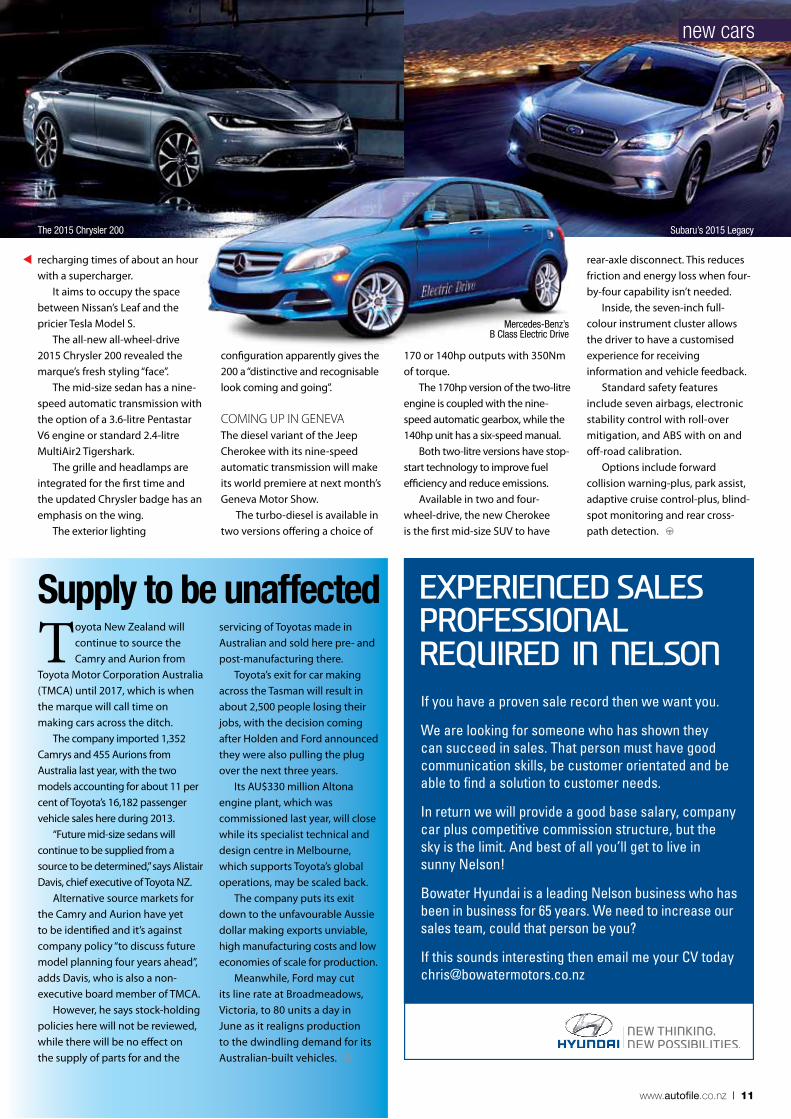
From electric to ‘heart pounding’The Kia Soul EV – the Korean
manufacturer’s first mass-market electric car – has
been unveiled to the world.It’s scheduled to go on sale in
the third quarter of 2014 in the US, with Europe following. It will cost about NZ$50,000 in the UK with the marque here putting its hands up for the model.
The EV, which made its debut at Chicago Motor Show, uses a 27kWh lithium-ion polymer battery with an energy density of 200Wh/kg. It should yield a fully charged range of about 130-160km of real-world driving.
Kia’s regenerative braking system captures up to 12 per cent of its kinetic energy, which feeds into the battery while coasting and braking.
The car plugs into 120 and 240-volt charging points, with times varying from 24 hours for a depleted battery on a 120-volt outlet to less than five hours with 240 volts. An 80 per cent charge can be achieved in 33 minutes with a 50kW-output charger.
The Soul EV has an 81.4kW electric motor. The liquid-cooled AC synchronous permanent magnet motor delivers power to the front wheels through a single-speed constant-ratio gear reduction unit.
Acceleration from 0-100kph should take less than 12 seconds with the top speed limited to about 145kph. It has a virtual-engine sound system that sends out audible alerts below 19kph and when reversing.
The platform accepts battery packs
under the rear seats, which means little of the Soul’s 354-litre boot space has been sacrificed. This does, however, create a weight penalty of about 200kg over standard cars.
The EV gets its own design of 16-inch alloys with super-low rolling resistance tyres with 10 per cent less resistance than standard ones.
The cabin has environmentally friendly materials. Bio-based plastics derived from cellulose and sugar cane are used in many places, such as the door panels, seat trim, roof pillars and carpeting.
Another major attraction in Chicago was Toyota’s racing-car inspired FT-1 concept. It was first devised by Calty Design Research in the PlayStation game Gran Turismo.
It has what the marque calls a “function sculpting” design language shaped by the wind into a “muscle-body form”. At higher speeds, a retractable rear wing tilts forward for extra downforce.
The front-engine rear-wheel-drive configuration locates the cockpit rearward for better weight distribution, which helps create sports-car proportions.
The wraparound windshield and side glass openings are nods from Toyota’s 2000GT of 1967 to the Celica, Supra, MR2 and 86. There’s an F1-inspired steering wheel, while a delta-shaped display zone surrounds and integrates the driver.
The FT-1 follows global president Akio Toyoda’s directive for more emotional car designs displaying energy, passion and “waku-doki” – “a palpable heart-pounding sense of excitement”.
Meanwhile, Subaru chose Chicago to unveil its 2015 Legacy. It’s the same size externally as the 2014 model, but is the roomiest yet with the largest passenger compartment in the mid-size segment.
All-wheel-drive and the flat 2.5-litre four-cylinder and 3.6-litre six-cylinder engines return. But the marque has improved fuel economy with active front-grille shutters, better aerodynamics and continuously variable automatic transmissions.
Handling is aided by a faster ratio steering and electronic torque vectoring that applies the brake to the inside front wheel in turns.
SPEED IN MOTOR CITYBMW chose the show in Detroit to
launch some new models, including the M3 sedan and M4 coupé.
Compared with predecessors, they deliver better performance with a high-revving, straight six-cylinder engine with M TwinPower Turbo technology for 317kW/431hp.
Their suspensions and drivetrains are precision tuned to the engine’s performance characteristics, while lighter weight is achieved with a one-piece driveshaft made of carbon-fibre reinforced plastic to reduce rotating mass for better acceleration.
From a V12 S Class to a winged Smart car, Mercedes-Benz was determined not to be outdone and unveiled its “pure” all-electric model.
First shown in 2012, the B Class was heralded as a “no compromises” luxury EV that didn’t sacrifice seating or space.
Back then, the B Class Electric Drive’s 134hp motor was said to deliver a 200km range and
Kia’s Soul EV
10 | www.autofile.co.nz
www.autofile.co.nz | 11
configuration apparently gives the 200 a “distinctive and recognisable look coming and going”.
COMING UP IN GENEVAThe diesel variant of the Jeep Cherokee with its nine-speed automatic transmission will make its world premiere at next month’s Geneva Motor Show.
The turbo-diesel is available in two versions offering a choice of
170 or 140hp outputs with 350Nm of torque.
The 170hp version of the two-litre engine is coupled with the nine-speed automatic gearbox, while the 140hp unit has a six-speed manual.
Both two-litre versions have stop-start technology to improve fuel efficiency and reduce emissions.
Available in two and four-wheel-drive, the new Cherokee is the first mid-size SUV to have
recharging times of about an hour with a supercharger.
It aims to occupy the space between Nissan’s Leaf and the pricier Tesla Model S.
The all-new all-wheel-drive 2015 Chrysler 200 revealed the marque’s fresh styling “face”.
The mid-size sedan has a nine-speed automatic transmission with the option of a 3.6-litre Pentastar V6 engine or standard 2.4-litre MultiAir2 Tigershark.
The grille and headlamps are integrated for the first time and the updated Chrysler badge has an emphasis on the wing.
The exterior lighting
Toyota New Zealand will continue to source the Camry and Aurion from
Toyota Motor Corporation Australia (TMCA) until 2017, which is when the marque will call time on making cars across the ditch.
The company imported 1,352 Camrys and 455 Aurions from Australia last year, with the two models accounting for about 11 per cent of Toyota’s 16,182 passenger vehicle sales here during 2013.
“Future mid-size sedans will continue to be supplied from a source to be determined,” says Alistair Davis, chief executive of Toyota NZ.
Alternative source markets for the Camry and Aurion have yet to be identified and it’s against company policy “to discuss future model planning four years ahead”, adds Davis, who is also a non-executive board member of TMCA.
However, he says stock-holding policies here will not be reviewed, while there will be no effect on the supply of parts for and the
servicing of Toyotas made in Australian and sold here pre- and post-manufacturing there.
Toyota’s exit for car making across the Tasman will result in about 2,500 people losing their jobs, with the decision coming after Holden and Ford announced they were also pulling the plug over the next three years.
Its AU$330 million Altona engine plant, which was commissioned last year, will close while its specialist technical and design centre in Melbourne, which supports Toyota’s global operations, may be scaled back.
The company puts its exit down to the unfavourable Aussie dollar making exports unviable, high manufacturing costs and low economies of scale for production.
Meanwhile, Ford may cut its line rate at Broadmeadows, Victoria, to 80 units a day in June as it realigns production to the dwindling demand for its Australian-built vehicles.
Supply to be unaffected
rear-axle disconnect. This reduces friction and energy loss when four-by-four capability isn’t needed.
Inside, the seven-inch full-colour instrument cluster allows the driver to have a customised experience for receiving information and vehicle feedback.
Standard safety features include seven airbags, electronic stability control with roll-over mitigation, and ABS with on and off-road calibration.
Options include forward collision warning-plus, park assist, adaptive cruise control-plus, blind-spot monitoring and rear cross-path detection.
If you have a proven sale record then we want you.
We are looking for someone who has shown they can succeed in sales. That person must have good communication skills, be customer orientated and be able to find a solution to customer needs.
In return we will provide a good base salary, company car plus competitive commission structure, but the sky is the limit. And best of all you’ll get to live in sunny Nelson!
Bowater Hyundai is a leading Nelson business who has been in business for 65 years. We need to increase our sales team, could that person be you?
If this sounds interesting then email me your CV today [email protected]
new cars
Mercedes-Benz’s B Class Electric Drive
Subaru’s 2015 LegacyThe 2015 Chrysler 200
12 | www.autofile.co.nz
There’s a perception of Hamilton being a “cow-bell town” but dairying
is only one aspect of the region’s economy, which includes food and high-tech manufacturing, forestry and wood production.
Waikato Chamber of Commerce also says it’s the most important mineral-producing area in New Zealand – and these sectors combined account for 8.5 per cent of the country’s gross domestic product.
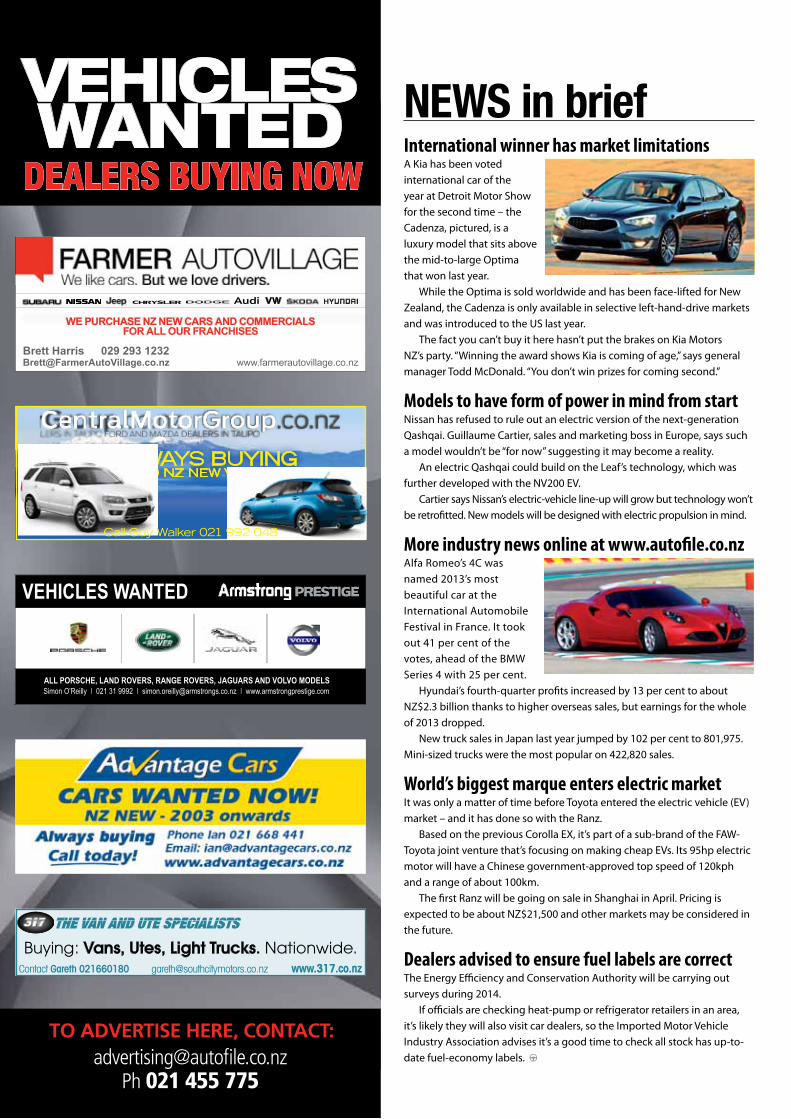
Sandra Perry, chief executive officer, says: “The manufacturing and engineering sectors continue to grow, particularly larger companies that have secured new contracts.”
She says the business community’s general sentiments are positive and optimistic after a tough couple of years.
“We have a population younger than the national average and we’re well-positioned as a region to support the business and housing overflow from Auckland.”
Waikato is, however, the country’s largest dairying region and as Fonterra boosted its pay-outs last
year, car sales drove up as well. New car sales totalled 5,258
last year. This was a 13 per cent increase on 2012, putting it ahead of the rest of the country by six per cent on average.
There were 6,052 used imports sold, up by 27 per cent on 2012 and one per cent above the national average.
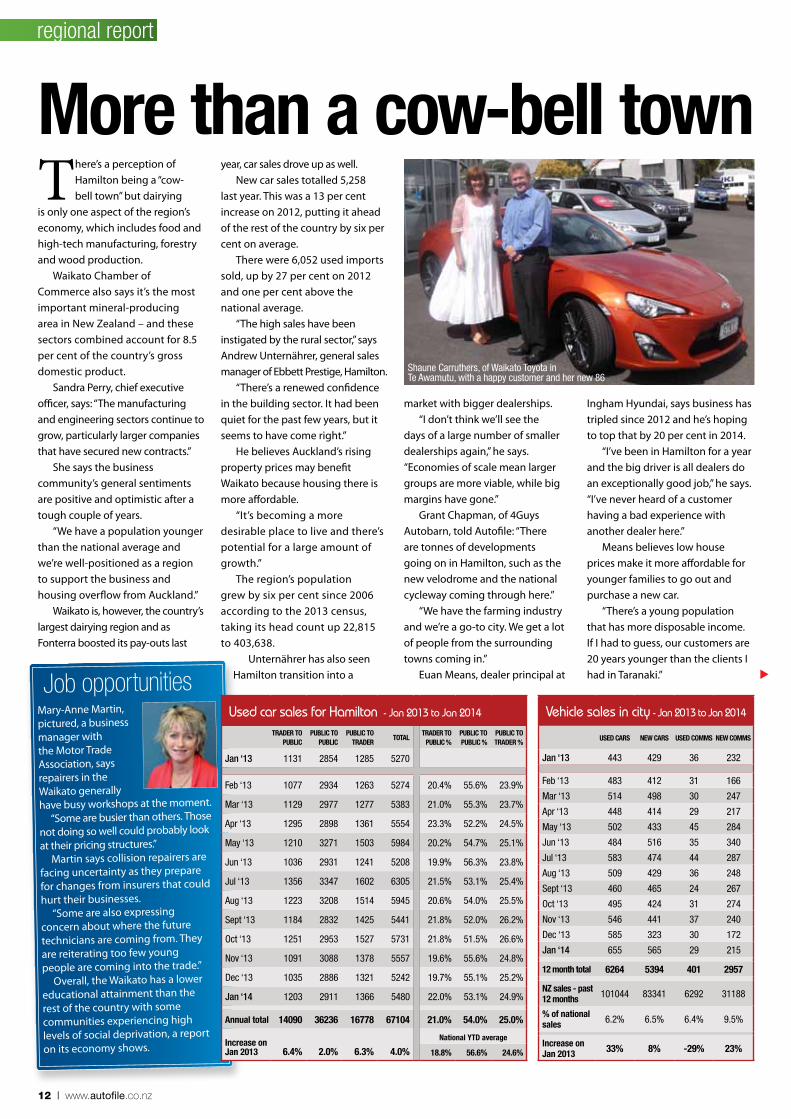
“The high sales have been instigated by the rural sector,” says Andrew Unternährer, general sales manager of Ebbett Prestige, Hamilton.
“There’s a renewed confidence in the building sector. It had been quiet for the past few years, but it seems to have come right.”
He believes Auckland’s rising property prices may benefit Waikato because housing there is more affordable.
“It’s becoming a more desirable place to live and there’s potential for a large amount of growth.”
The region’s population grew by six per cent since 2006 according to the 2013 census, taking its head count up 22,815 to 403,638.
Unternährer has also seen Hamilton transition into a
More than a cow-bell town
market with bigger dealerships.“I don’t think we’ll see the
days of a large number of smaller dealerships again,” he says. “Economies of scale mean larger groups are more viable, while big margins have gone.”
Grant Chapman, of 4Guys Autobarn, told Autofile: “There are tonnes of developments going on in Hamilton, such as the new velodrome and the national cycleway coming through here.”
“We have the farming industry and we’re a go-to city. We get a lot of people from the surrounding towns coming in.”
Euan Means, dealer principal at
Ingham Hyundai, says business has tripled since 2012 and he’s hoping to top that by 20 per cent in 2014.
“I’ve been in Hamilton for a year and the big driver is all dealers do an exceptionally good job,” he says. “I’ve never heard of a customer having a bad experience with another dealer here.”
Means believes low house prices make it more affordable for younger families to go out and purchase a new car.
“There’s a young population that has more disposable income. If I had to guess, our customers are 20 years younger than the clients I had in Taranaki.”
regional report
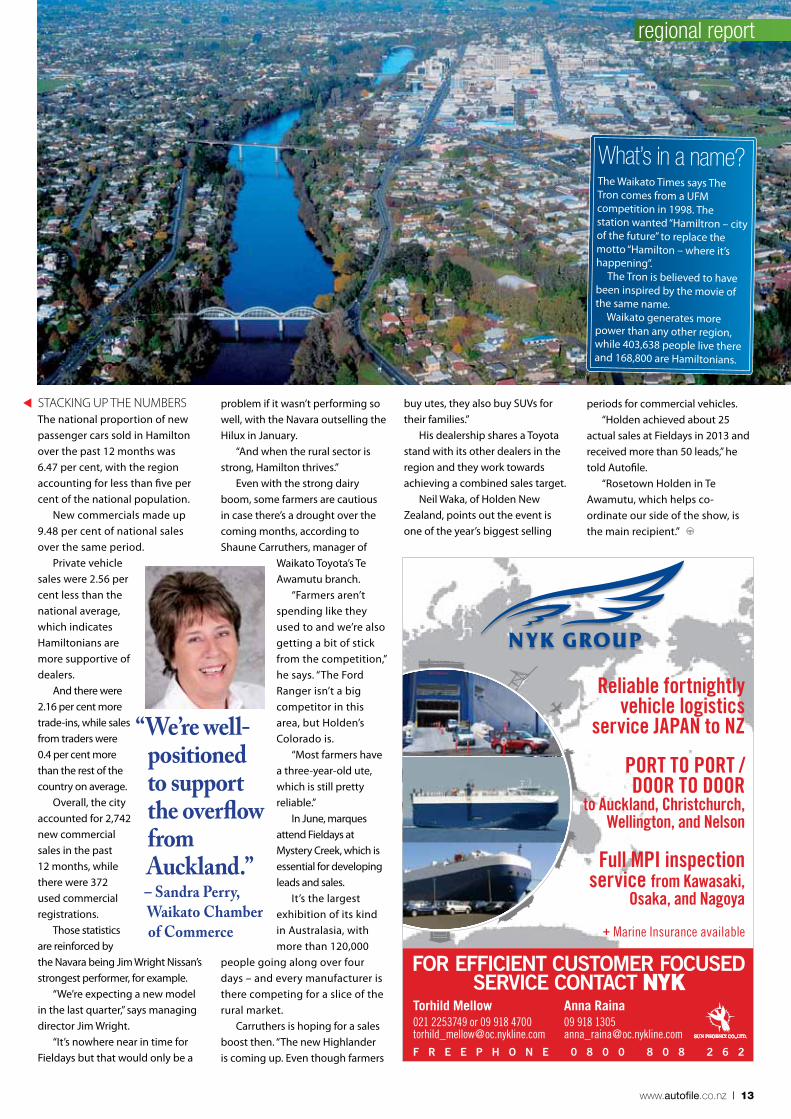
Vehicle sales in city - Jan 2013 to Jan 2014
USeD CarS New CarS USeD CoMMS New CoMMS
Jan ‘13 443 429 36 232
Feb ‘13 483 412 31 166
Mar ‘13 514 498 30 247
Apr ‘13 448 414 29 217
May ‘13 502 433 45 284
Jun ‘13 484 516 35 340
Jul ‘13 583 474 44 287
Aug ‘13 509 429 36 248
Sept ‘13 460 465 24 267
Oct ‘13 495 424 31 274
Nov ‘13 546 441 37 240
Dec ‘13 585 323 30 172
Jan ‘14 655 565 29 215
12 month total 6264 5394 401 2957
NZ sales - past 12 months 101044 83341 6292 31188
% of national sales 6.2% 6.5% 6.4% 9.5%
Increase on Jan 2013 33% 8% -29% 23%
Job opportunitiesMary-Anne Martin, pictured, a business manager with the Motor Trade Association, says repairers in the Waikato generally have busy workshops at the moment.
“Some are busier than others. Those not doing so well could probably look at their pricing structures.”
Martin says collision repairers are facing uncertainty as they prepare for changes from insurers that could hurt their businesses.
“Some are also expressing concern about where the future technicians are coming from. They are reiterating too few young people are coming into the trade.”
Overall, the Waikato has a lower educational attainment than the rest of the country with some communities experiencing high levels of social deprivation, a report on its economy shows.
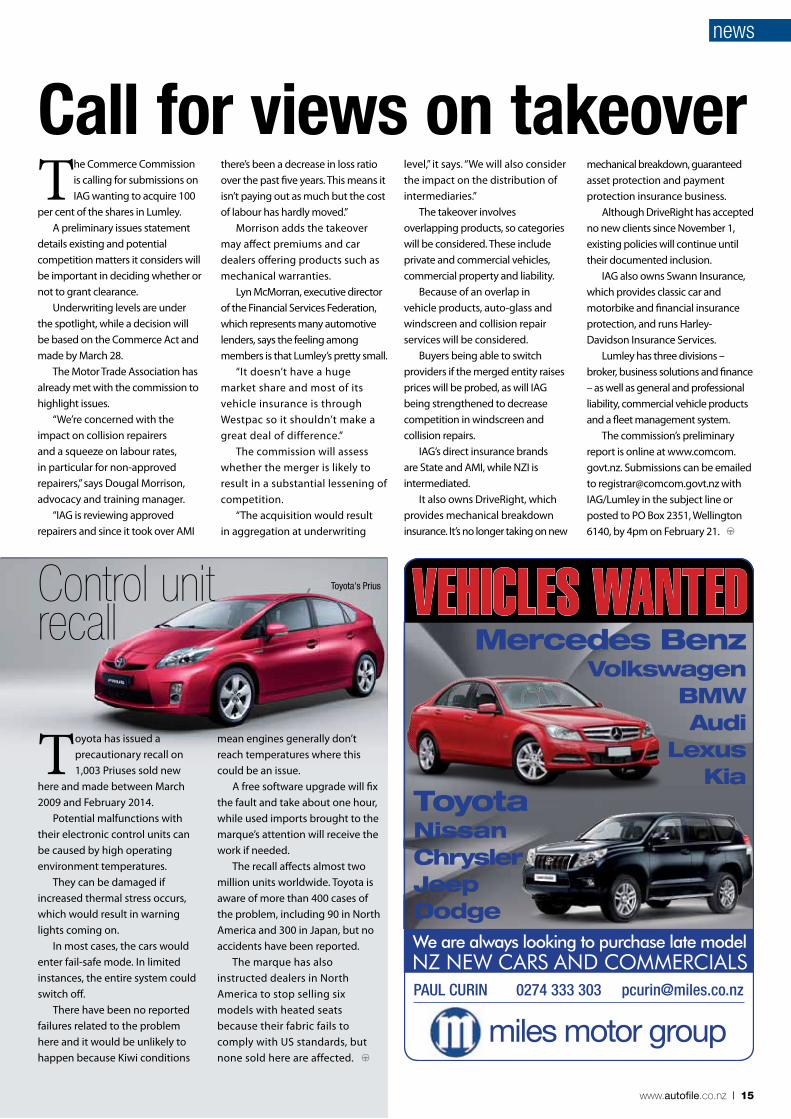
Used car sales for Hamilton - Jan 2013 to Jan 2014
TraDer To PUblIC
PUblIC To PUblIC
PUblIC To TraDer
ToTalTraDer To
PUblIC %PUblIC To PUblIC %
PUblIC To TraDer %
Jan ‘13 1131 2854 1285 5270
Feb ‘13 1077 2934 1263 5274 20.4% 55.6% 23.9%
Mar ‘13 1129 2977 1277 5383 21.0% 55.3% 23.7%
Apr ‘13 1295 2898 1361 5554 23.3% 52.2% 24.5%
May ‘13 1210 3271 1503 5984 20.2% 54.7% 25.1%
Jun ‘13 1036 2931 1241 5208 19.9% 56.3% 23.8%
Jul ‘13 1356 3347 1602 6305 21.5% 53.1% 25.4%
Aug ‘13 1223 3208 1514 5945 20.6% 54.0% 25.5%
Sept ‘13 1184 2832 1425 5441 21.8% 52.0% 26.2%
Oct ‘13 1251 2953 1527 5731 21.8% 51.5% 26.6%
Nov ‘13 1091 3088 1378 5557 19.6% 55.6% 24.8%
Dec ‘13 1035 2886 1321 5242 19.7% 55.1% 25.2%
Jan ‘14 1203 2911 1366 5480 22.0% 53.1% 24.9%
annual total 14090 36236 16778 67104 21.0% 54.0% 25.0%
Increase on Jan 2013 6.4% 2.0% 6.3% 4.0%
National YTD average
18.8% 56.6% 24.6%
Shaune Carruthers, of Waikato Toyota in Te Awamutu, with a happy customer and her new 86
www.autofile.co.nz | 13
Reliable fortnightly vehicle logistics
service JAPAN to NZ
PORT TO PORT / DOOR TO DOOR
to Auckland, Christchurch, Wellington, and Nelson
Full MPI inspection service from Kawasaki,
Osaka, and Nagoya
+ Marine Insurance available
Torhild Mellow 021 2253749 or 09 918 [email protected]
Anna Raina09 918 1305 [email protected]
FOR EFFICIENT CUSTOMER FOCUSED SERVICE CONTACT NYK
SSUUNN PPHHOOEENNIIXX CCOO..,,LLTTDD..
F R E E P H O N E 0 8 0 0 8 0 8 2 6 2
buy utes, they also buy SUVs for their families.”
His dealership shares a Toyota stand with its other dealers in the region and they work towards achieving a combined sales target.
Neil Waka, of Holden New Zealand, points out the event is one of the year’s biggest selling
STACKING UP THE NUMBERSThe national proportion of new passenger cars sold in Hamilton over the past 12 months was 6.47 per cent, with the region accounting for less than five per cent of the national population.
New commercials made up 9.48 per cent of national sales over the same period.
Private vehicle sales were 2.56 per cent less than the national average, which indicates Hamiltonians are more supportive of dealers.
And there were 2.16 per cent more trade-ins, while sales from traders were 0.4 per cent more than the rest of the country on average.
Overall, the city accounted for 2,742 new commercial sales in the past 12 months, while there were 372 used commercial registrations.
Those statistics are reinforced by the Navara being Jim Wright Nissan’s strongest performer, for example.
“We’re expecting a new model in the last quarter,” says managing director Jim Wright.
“It’s nowhere near in time for Fieldays but that would only be a
problem if it wasn’t performing so well, with the Navara outselling the Hilux in January.
“And when the rural sector is strong, Hamilton thrives.”
Even with the strong dairy boom, some farmers are cautious in case there’s a drought over the coming months, according to Shaune Carruthers, manager of
Waikato Toyota’s Te Awamutu branch.
“Farmers aren’t spending like they used to and we’re also getting a bit of stick from the competition,” he says. “The Ford Ranger isn’t a big competitor in this area, but Holden’s Colorado is.
“Most farmers have a three-year-old ute, which is still pretty reliable.”
In June, marques attend Fieldays at Mystery Creek, which is essential for developing leads and sales.
It’s the largest exhibition of its kind in Australasia, with more than 120,000
people going along over four days – and every manufacturer is there competing for a slice of the rural market.
Carruthers is hoping for a sales boost then. “The new Highlander is coming up. Even though farmers
periods for commercial vehicles.“Holden achieved about 25
actual sales at Fieldays in 2013 and received more than 50 leads,” he told Autofile.
“Rosetown Holden in Te Awamutu, which helps co-ordinate our side of the show, is the main recipient.”
regional report
What’s in a name?The Waikato Times says The Tron comes from a UFM competition in 1998. The station wanted “Hamiltron – city of the future” to replace the motto “Hamilton – where it’s happening”.
The Tron is believed to have been inspired by the movie of the same name.
Waikato generates more power than any other region, while 403,638 people live there and 168,800 are Hamiltonians.
“We’re well-positioned to support the overflow from Auckland.” – Sandra Perry, Waikato Chamber of Commerce
To adverTise here, conTacT:
Vehicles wanted
[email protected] 021 455 775
dealers Buying now
NewS in briefInternational winner has market limitationsA Kia has been voted international car of the year at Detroit Motor Show for the second time – the Cadenza, pictured, is a luxury model that sits above the mid-to-large Optima that won last year.
While the Optima is sold worldwide and has been face-lifted for New Zealand, the Cadenza is only available in selective left-hand-drive markets and was introduced to the US last year.
The fact you can’t buy it here hasn’t put the brakes on Kia Motors NZ’s party. “Winning the award shows Kia is coming of age,” says general manager Todd McDonald. “You don’t win prizes for coming second.”
Models to have form of power in mind from startNissan has refused to rule out an electric version of the next-generation Qashqai. Guillaume Cartier, sales and marketing boss in Europe, says such a model wouldn’t be “for now” suggesting it may become a reality.
An electric Qashqai could build on the Leaf’s technology, which was further developed with the NV200 EV.
Cartier says Nissan’s electric-vehicle line-up will grow but technology won’t be retrofitted. New models will be designed with electric propulsion in mind.
More industry news online at www.autofile.co.nzAlfa Romeo’s 4C was named 2013’s most beautiful car at the International Automobile Festival in France. It took out 41 per cent of the votes, ahead of the BMW Series 4 with 25 per cent.
Hyundai’s fourth-quarter profits increased by 13 per cent to about NZ$2.3 billion thanks to higher overseas sales, but earnings for the whole of 2013 dropped.
New truck sales in Japan last year jumped by 102 per cent to 801,975. Mini-sized trucks were the most popular on 422,820 sales.
World’s biggest marque enters electric marketIt was only a matter of time before Toyota entered the electric vehicle (EV) market – and it has done so with the Ranz.
Based on the previous Corolla EX, it’s part of a sub-brand of the FAW-Toyota joint venture that’s focusing on making cheap EVs. Its 95hp electric motor will have a Chinese government-approved top speed of 120kph and a range of about 100km.
The first Ranz will be going on sale in Shanghai in April. Pricing is expected to be about NZ$21,500 and other markets may be considered in the future.
Dealers advised to ensure fuel labels are correctThe Energy Efficiency and Conservation Authority will be carrying out surveys during 2014.
If officials are checking heat-pump or refrigerator retailers in an area, it’s likely they will also visit car dealers, so the Imported Motor Vehicle Industry Association advises it’s a good time to check all stock has up-to-date fuel-economy labels.
ALWAYS BUYING GOOD NZ NEW VEHICLES
Call Guy Walker 021 992 048
VEHICLES WANTED
Simon O’Reilly 021 31 9992 [email protected] www.armstrongprestige.com I I I
ALL PORSCHE, LAND ROVERS, RANGE ROVERS, JAGUARS AND VOLVO MODELS
Contact Gareth 021660180 [email protected] www.317.co.nz
Buying: Vans, Utes, Light Trucks. Nationwide.
Brett Harris 029 293 1232 [email protected] www.farmerautovillage.co.nz
VWAudi
WE PURCHASE NZ NEW CARS AND COMMERCIALS FOR ALL OUR FRANCHISES
miles motor groupPAUL CURiN 0274 333 303 [email protected]
Mercedes BenzVolkswagen
BMwaudi
lexusKia
toyotanissanchryslerJeep dodge
VEHICLES WANTED
We are always looking to purchase late model NZ NEW CARS AND COMMERCIALS
www.autofile.co.nz | 15
news
The Commerce Commission is calling for submissions on IAG wanting to acquire 100
per cent of the shares in Lumley.A preliminary issues statement
details existing and potential competition matters it considers will be important in deciding whether or not to grant clearance.
Underwriting levels are under the spotlight, while a decision will be based on the Commerce Act and made by March 28.
The Motor Trade Association has already met with the commission to highlight issues.
“We’re concerned with the impact on collision repairers and a squeeze on labour rates, in particular for non-approved repairers,” says Dougal Morrison, advocacy and training manager.
“IAG is reviewing approved repairers and since it took over AMI
level,” it says. “We will also consider the impact on the distribution of intermediaries.”
The takeover involves overlapping products, so categories will be considered. These include private and commercial vehicles, commercial property and liability.
Because of an overlap in vehicle products, auto-glass and windscreen and collision repair services will be considered.
Buyers being able to switch providers if the merged entity raises prices will be probed, as will IAG being strengthened to decrease competition in windscreen and collision repairs.
IAG’s direct insurance brands are State and AMI, while NZI is intermediated.
It also owns DriveRight, which provides mechanical breakdown insurance. It’s no longer taking on new
there’s been a decrease in loss ratio over the past five years. This means it isn’t paying out as much but the cost of labour has hardly moved.”
Morrison adds the takeover may affect premiums and car dealers offering products such as mechanical warranties.
Lyn McMorran, executive director of the Financial Services Federation, which represents many automotive lenders, says the feeling among members is that Lumley’s pretty small.
“It doesn’t have a huge market share and most of its vehicle insurance is through Westpac so it shouldn’t make a great deal of difference.”
The commission will assess whether the merger is likely to result in a substantial lessening of competition.
“The acquisition would result in aggregation at underwriting
mechanical breakdown, guaranteed asset protection and payment protection insurance business.
Although DriveRight has accepted no new clients since November 1, existing policies will continue until their documented inclusion.
IAG also owns Swann Insurance, which provides classic car and motorbike and financial insurance protection, and runs Harley-Davidson Insurance Services.
Lumley has three divisions – broker, business solutions and finance – as well as general and professional liability, commercial vehicle products and a fleet management system.
The commission’s preliminary report is online at www.comcom.govt.nz. Submissions can be emailed to [email protected] with IAG/Lumley in the subject line or posted to PO Box 2351, Wellington 6140, by 4pm on February 21.
Call for views on takeover
Toyota has issued a precautionary recall on 1,003 Priuses sold new
here and made between March 2009 and February 2014.
Potential malfunctions with their electronic control units can be caused by high operating environment temperatures.
They can be damaged if increased thermal stress occurs, which would result in warning lights coming on.
In most cases, the cars would enter fail-safe mode. In limited instances, the entire system could switch off.
There have been no reported failures related to the problem here and it would be unlikely to happen because Kiwi conditions
mean engines generally don’t reach temperatures where this could be an issue.
A free software upgrade will fix the fault and take about one hour, while used imports brought to the marque’s attention will receive the work if needed.
The recall affects almost two million units worldwide. Toyota is aware of more than 400 cases of the problem, including 90 in North America and 300 in Japan, but no accidents have been reported.
The marque has also instructed dealers in North America to stop selling six models with heated seats because their fabric fails to comply with US standards, but none sold here are affected.
Control unit recall
Toyota's Prius
16 | www.autofile.co.nz
Five and dime in disguise
The IMVIa Technical report is proudly brought to you by leading certifi cation service provider, VINZ
from the trade and for the trade
foisted on us. This time it’s coming from different low-wage source markets, such as China, Sri Lanka and other developing countries.
I’m not talking about vehicles made in those places because manufacturers must meet strict standards.
For example, Kiwis buy toasters from major chains at low prices. When they pack up, they get replacements then moan about the junk they’re being sold.
The same can be said about some after-market car parts. You can buy brake-disc pads for ridiculously low prices, but later find they have to be replaced many times within the distance a quality set would last.
A lot of people are screwing down prices of car parts until the quality is lacking
When I was growing up in the 1950s, the cars we were driving
were referred to as “Brit sh*t” and “Yank tanks”.
The products on the shelves of Woolworths and McKenzies were – in the main – called “Jap crap”, while in the 1960s the first Japanese motorbikes and cars were talked about in the same vernacular.
But were these derogatory terms warranted? In many cases they were.
We had shocking vehicles on the road sourced from UK and US manufacturers, and we had rubbish being sold to the consumer from – as Americans called them – five-and-dime stores.
Are things any better today? I believe they are. We have a much better fleet that meets international safety and environmental standards, and it’s far more durable and better built than 1940s-60s vehicles.
Consumer goods from Japan are now recognised as world class and leaders in their fields.
My gripe is we still have cheap, mass-produced junk being
tech report
places, they look for the cheapest price – where quality is low – instead of paying a few more dollars.
A product sold for $25 today may retail for $35 and be of much better quality and durability had the distribution chain paid another $1 to the manufacturer for a better product.
Are we doing so-called “China Incorporated” and other developing economies a dis-service? I believe we are because we complain about “Chinese junk” as we complained about “Jap crap” in the 1950s and ‘60s.
If we vote with our feet and buy better quality items, retailers will ask themselves why products aren’t selling.
They will realise consumers want better products and change supply arrangements to ensure they are available.
Will this be cost-effective? Yes it will because there will be less waste and fewer replacement costs because products will be more durable.
China Incorporated, as Japan Incorporated did, will come to realise quality will be increasingly required by developed nations – as is in the car industry where requirements are standards based.
I’m not knocking Chinese manufacturing because top-quality products are coming from there in the electronic and other fields.
But when we will realise we can change product quality on retailers’ shelves? As soon as we decide we can make a difference, the sooner change will come.
– all for a few dollars.This market has a real
effect on the fleet’s safety – cheap brake pads wear out faster and increase the chance of in-service failure.
Dealers should bear in mind the quality of parts put in their vehicles – they need to pass
warrants of fitness and be fit for purpose so they comply with safety and consumer protection laws.
But is buying cheap, sub-standard parts cost-effective? No. The cost of parts and labour for replacements exceeds using a quality product in the first place.
Can we change this? Of course we can. When distribution chains buy products from China and other
JEVIC NZ 09 966 1779 www.jevic.co.nzNew Zealand
Japan
Singaporenngnngin
Specialists in Pre Shipment Inspections Full Border Inspections Biosecurity Inspections
Structural Inspections Odometer Verification
Pre Export Appraisal Vehicle History Reports
JEVIC Authorised NZTA Border Inspection Agency
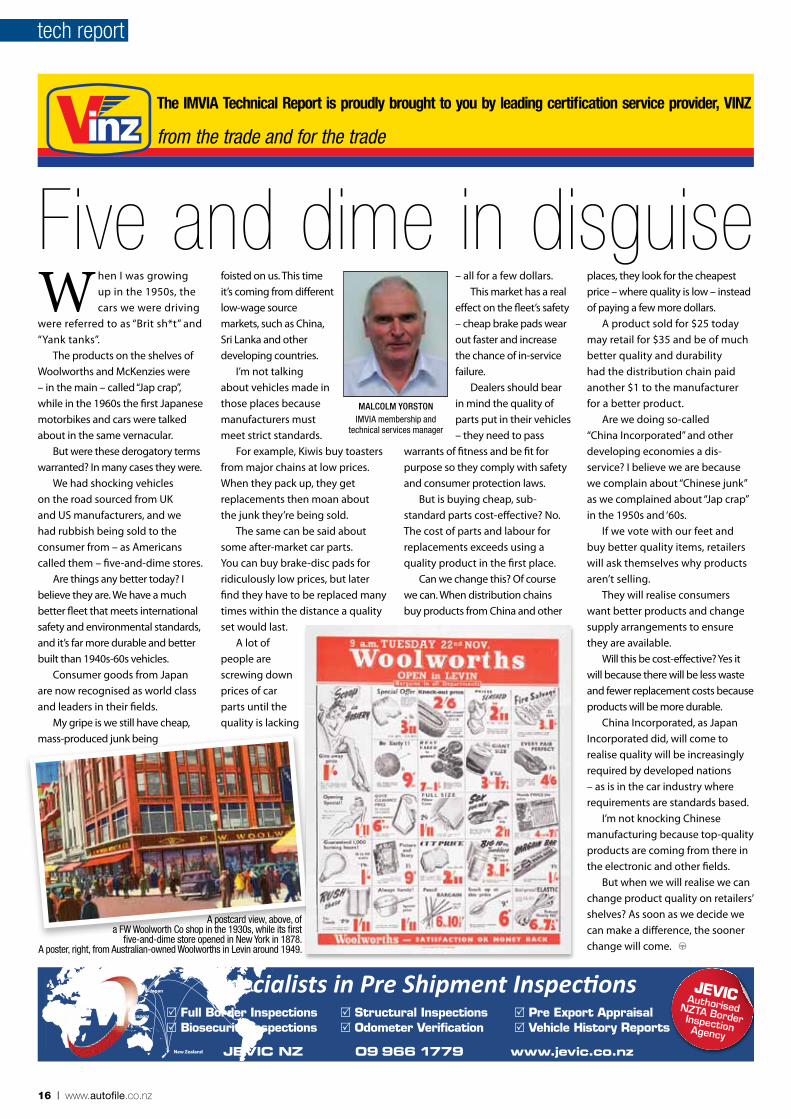
MALCOLM YORSTONIMVIA membership and
technical services manager
A postcard view, above, of a FW Woolworth Co shop in the 1930s, while its first
five-and-dime store opened in New York in 1878. A poster, right, from Australian-owned Woolworths in Levin around 1949.
www.autofile.co.nz | 17
The automotive industry is highly competitive, and
reaching sales targets is often challenging and sometimes impossible to achieve month after month and year after year.
While there are effective sales and marketing initiatives to achieve targets, they don’t always support long-term strategies.
Without long-term strategies, dealers may face added pressures and challenges, ranging from unattainable sales targets to decreasing levels of employee satisfaction, performance and retention.
Niche industry provider, Protecta Insurance, has worked with a range of dealers over the past 30 years and has seen clients with similar strengths and weaknesses.
While some of these weaknesses are indicative of industry, there are many that aren’t and they could be prevented through long-term strategies.
In response to industry challenges, Protecta could see clients needed more from their insurance provider so the company shifted its focus from selling products to selling service and expertise.
It achieved this by taking a proactive approach to helping clients achieve sales targets.
Stephen Glading, managing director of Protecta Insurance, says: “Selling competitively priced products has never been a challenge for us and possibly not for other insurance providers either.
“We know the industry well because we have been working in it for a long time. We wanted to be able to show greater value to our clients, so we diversified our business to include specialist finance and insurance [F&I] training.”
Protecta’s F&I training is facilitated by Erin Mills, who has extensive experience working in
the business manager’s seat for some of Australasia’s largest dealers.
Her understanding of what makes a great business manager and having a great sales team are paying dividends for Protecta’s dealers.
Mills says: “It’s rewarding for me to be
able to continue working alongside an industry I built my career in and to share my 20 years’ worth of skills, experience and passion.
“Clients are growing more and more aware of our F&I training and we’re finding an increasing demand from dealers to consult with them on their sales capability and how we can assist.”
Protecta’s intensive one-day workshops are also benefiting clients by increasing product knowledge – and building individual and team confidence in a practical and interactive way.
“Most dealerships face similar, if not the same, challenges,” explains Mills. “Without industry experience and a deep understanding, I wouldn’t be able to deliver results-focused F&I training to strengthen long-term sales functions.
“I believe the critical attributes of business managers are high degrees of motivation, and the ability to build and maintain productive relationships with their teams.
“Sales teams and business managers need to be working in unison to optimise every sales opportunity. These are the kinds of areas our workshops also cover.
“I recommend dealers who think they may be able to strengthen their workforce through specialist F&I training to get in touch with me today to see how I may be able to assist.”
For more details, call Erin Mills at Protecta on 021-807-148 or email [email protected].
Specialist training is helping our motor dealers to achieve
longer term sales targets.
We’re raising the bar...
contact: erin Mills from Protecta insurance
Phone: 021 807 148 email: [email protected]
Find out more today.
Specialist training delivers dividends
f & i stats
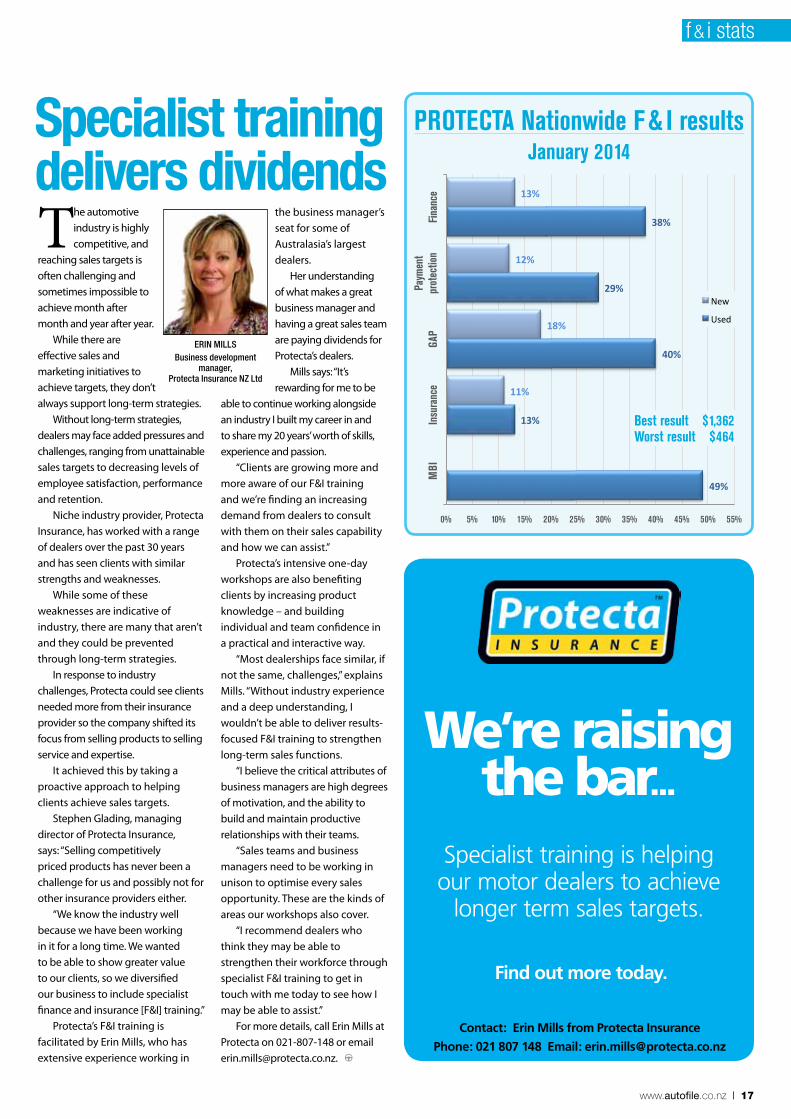
13%
12%
18%
11%
38%
29%
40%
13%
49%
0% 5% 10% 15% 20% 25% 30% 35% 40% 45% 50% 55%
Fina
nce
Paym
ent
prot
ectio
n GA
P In
sura
nce
MBI
New
Used
Best result $ 1,362Worst result $ 464
PROTECTA Nationwide F & I resultsJanuary 2014
ERiN MiLLSBusiness development
manager, Protecta insurance NZ Ltd
18 | www.autofile.co.nz
BackgroundScott Harvey bought a 1999 Mitsubishi Chariot for $7,999 – funded by swapping a 2004 Holden Barina – from Orange Autos Ltd on May 24 last year.
On July 8, he traded in the Mitsubishi for a 2006 Suzuki SX4 and a purchase price of $12,000.
The buyer rejected the Suzuki after its transmission failed and claimed he also rejected the Mitsubishi.
The trader said Harvey wasn’t entitled to a refund on either vehicle because he didn’t reject the Chariot and the SX4 was repaired.
The caseHarvey paid for the Mitsubishi through swapping and trading in his Barina. The vehicle offer and sale agreement (VOSA) recorded the swap’s value at $7,999 and the Chariot had 129,975km on its clock.
Within a few days, the Mitsubishi started shuddering and Harvey didn’t know what was wrong with it. The car shuddered at 70-80kph but the problem worsened and became evident at other speeds.
Harvey took the Chariot back to the trader and said he no longer wanted it. The dealer denied telling him it didn’t “do” refunds.
Carl Loader, the trader’s manager, said the value given to the Mitsubishi was $6,500 – $1,500 less than on the original VOSA.
The Suzuki’s total price was $12,000 and its odometer was on 81,831km when sold.
Harvey didn’t pay attention to the Mitsubishi’s recorded trade-in value because he was focusing on the money he needed to secure the Suzuki.
About three weeks after Harvey bought the SX4, its transmission
failed causing the car to go into limp mode.
On July 30, Loader told Harvey he would fix it. Harvey told him he wanted a refund and for the car to be returned.
Loader said that under the Consumer Guarantees Act (CGA) he had the right to repair it within a reasonable time.
The next day, Harvey texted Loader asking to be kept informed of what repairs were needed.
He wanted to know the extent of the damage and consider what remedy he might be entitled to. Loader refused his request to arrange an independent inspection.
Loader emailed Harvey on August 5 to say the transmission had been stripped, parts were coming and the work would take about eight hours.
A second-hand transmission was located in Wanganui that day and shipped to Autoshop Ltd to be fitted.
Harvey contacted Ryan Gerard at Autoshop and found out that parts referred to in Loader’s email included the transmission.
The same day Harvey wrote to Loader rejecting the Suzuki claiming it was a substantial failure of the CGA’s guarantee of acceptable quality.
The trader didn’t accept Harvey was entitled to reject the car because he collected the Suzuki and continued to pay its insurance.
Harvey said he did this to ensure it was safe until the application was determined, there had been some use of the car and its November 9 odometer reading was 83,340km.
Loader disputed Harvey rejected the Chariot and decided to
trade out of the Mitsubishi. In regard to the Suzuki,
Loader said the trader had met its CGA responsibilities by repairing the car in a reasonable time and Harvey wasn’t entitled to reject it because it was repairable.
Autoshop charged the dealer $639 to remove, strip and inspect the transmission, fit the second-hand one and refill it.
The replacement transmission from Wanganui Auto Wreckers cost $1,748. All of the repairs came to $2,387.
Ryan Gerard, who carried out the work, said this included a trade discount and the alternative was to rebuild the transmission, which would have cost about $3,000.
He said a bearing inside it had failed causing metal filings to be distributed throughout it.
The likely cause of the Suzuki losing drive was the filings getting into the valve body causing the valves controlling fluid pressure to the clutch packs to stick.
Loader said the Mitsubishi needed only a minor repair, with a knock sensor replaced for $265.
The ruling The Mitsubishi was 14 years old with 129,975km on the clock when sold for $7,999. Its failed knock sensor was repaired at minimal cost.
In most cases, such a fault wouldn’t fail the guarantee of acceptable quality but given it occurred within a week of purchase, the tribunal ruled it did.
The Suzuki was seven years old and had 81,831km on the clock when sold for $12,000. Within a month, the transmission needed replacing.
The tribunal ruled it failed
The case: The buyer rejected
a Suzuki SX4 after its transmission
failed and also claimed to reject
a Mitsubishi Chariot. The dealer said the customer didn’t reject the
Chariot and the SX4 was repaired.
The decision: The tribunal
ruled the purchaser had no right
rejecting the Chariot because there was no failure to fix the problem. But he was entitled to reject the Suzuki because its issues were substantial.
At: The Motor Vehicle Disputes
Tribunal, Christchurch.
the CGA guarantee because no reasonable buyer would regard as acceptable a car that needed repairs amounting to about 20 per cent of its price a month later.
It found the knock sensor failure wasn’t substantial. It wasn’t persuaded a reasonable buyer would have decided not to purchase the Mitsubishi with full knowledge of this problem.
But the Suzuki’s failure was significant and the tribunal was satisfied a reasonable purchaser – acquainted with the failure’s nature and extent – wouldn’t have bought it.
Harvey asked the trader to fix the Mitsubishi and didn’t have the right to reject it because there was no failure to repair.
There was no evidence Harvey asked for it to be repaired and nor was the failure substantial, which would have entitled him to reject.
However, Harvey was entitled to reject the Suzuki because of the transmission failure. He did this promptly once he knew what the problem was and the tribunal ruled this rejection was lawful.
Orders The rejection of the Suzuki was upheld and the trader was ordered to pay $12,000 to Harvey, who was to return the car after payment. The Mitsubishi’s rejection was dismissed.
Dealer’s repairs on vehicle defeats one out of two rejection applications
disputes
5500
6000
6500
7000
7500
8000
8500
9000
9500
10000
Jan Feb Mar Apr May Jun Jul Aug Sep Oct Nov Dec
2013
2012
17%
12%
13%
9%
41%
14%
22%
16%
43%
0% 5% 10% 15% 20% 25% 30% 35% 40% 45% 50% 55%
Fina
nce
Paym
ent
prot
ectio
n GA
P In
sura
nce
MBI
New
Used
Whangarei Auckland Hamilton Thames Tauranga Rotorua Gisborne Napier New Plymouth Wanganui Palmerston North Masterton Wellington Nelson Blenheim Greymouth Whangarei Auckland Hamilton Thames Tauranga Rotorua Gisborne
Napier New Plymouth Wanganui Palmerston North Masterton Wellington Nelson Blenheim Greymouth Westport Christchurch Timaru Oamaru Dunedin
Invercargill Whangarei Auckland Hamilton Thames Tauranga Rotorua Gisborne Napier New Plymouth
Wanganui Palmerston North Masterton Wellington Nelson Blenheim Greymouth Whangarei Auckland Hamilton Thames Tauranga Rotorua
Ar
ou
n d t h e c ou nt
ry
20 | www.autofile.co.nz
0800 7000 44autoport.netwww.
UK, Japanese and local vehicles.Finance available.
The TRUSTED online wholesale trading site.
PHONE 0800 ARMACUP (276 2287) or 09 303 3314EMAIL [email protected]
www.armacup.com
YOUR FIRST CHOICE IN SHIPPING
TWO SAILINGS PER MONTH JAPAN TO NZ
Port Calls Hoegh Xiamen V20
Sepang Express V9
Morning Miracle V5
Liberty V1
Osaka 20 Oct 30 Oct 15 Nov 29 Nov Nagoya 21 Oct 31 Oct 16 Nov 30 Nov Yokohama 22 Oct 1 Nov 17 Nov 1 Dec Auckland 7 Nov 17 Nov 4 Dec 19 Dec Wellington 13 Nov 23 Nov 11 Dec 26 Dec Lyttelton 16 Nov 29 Nov 11 Dec 29 Dec
LATEST SCHEDULE
PORT TO DOOR SERVICEINCLUDING: MPI Border inspection Odometer certifi cation Digital Photography for prior sales in NZ NZ Customs clearance Delivery Nationwide Insurance
GENEROUS REWARDS PROGRAMMEShip your motor vehicles on Armacup vessels and you can earn seamiles points for air travel (only applicable to used imports)
Biggest increases/Decreases By town year-on-year
(OctOber 2013 vs OctOber 2012)
Biggest increases new Used
westport 100.0% Blenheim 95.5% thames 51.2% nelson 64.9% napier 34.1% rotorua 52.0%
Biggest decreases new Used
wanganui 27.7% westport 41.7% gisborne 26.8% Masterton 20.0% timaru 23.7% timaru 12.4%
7000
6000
5000
4000
3000
2000
1000
Nov
‘12
DEC
‘12
JAN
‘13
FEb
‘13
MAr
‘13
APr
‘13
MAy
‘13
JuN
‘13
JuL
‘13
AuG
‘13
SEP ‘
13
Oct
‘13
North Island
South Island
10000
9000
8000
7000
6000
5000
4000
Nov
‘12
DEC
‘12
JAN
‘13
FEb
‘13
MAr
‘13
APr
‘13
MAy
‘13
JuN
‘13
JuL
‘13
AuG
‘13
SEP ‘
13
Oct
‘13
Used
New7962
8545
1805
6740
Used Vehicle RegistRatiOnsNorth IslaNd versus south IslaNd
PassengeR Vehicle RegistRatiOnsNew versus used
Vehi
cles
sol
d
4500
4000
3500
3000
2500
2000
1500
1000
500
0
Nov
‘12
DEC
‘12
JAN
‘13
FEb
‘13
MAr
‘13
APr
‘13
MAy
‘13
JuN
‘13
JuL
‘13
AuG
‘13
SEP ‘
13
Oct
‘13
Auckland
Wellington
Vehi
cles
sol
d
600
500
400
300
200
100
0
Nov
‘12
DEC
‘12
JAN
‘13
FEb
‘13
MAr
‘13
APr
‘13
MAy
‘13
JuN
‘13
JuL
‘13
AuG
‘13
SEP ‘
13
Oct
‘13
Hamilton
Tauranga
Palmerston Nth
DunedinChristchurch
4320
495
1185
290
729
229
216
aucklaNd, wellINgtoN, chrIstchurch hamIltoN, tauraNga, duNedIN, PalmerstoN North
Used imPORt PassengeR Vehicle RegistRatiOns by city
october 2013
autoport.net
The TRUSTED online wholesale trading site.
26 | www.autofile.co.nz
www.autofile.co.nz | 27
Annual high for stockpileThe amount of stock held
by used car dealers during
October was the highest
monthly total of the year.
There were 10,374 units
imported last month with a
variance of 1,829 on 8,545 sales.
The number of cars in stock
amounted to 9,323 compared to
7,494 in September.
There have been two other
major increases during 2013 – with
variances between imports and sales
of 3,121 in April and 2,507 in May.
Graeme Macdonald, chairman
of the North Island branch of the
Imported Motor Vehicle Industry
Association, says the current
stockpile should correct itself – as it
normally does.“If the monthly stockpile was
10,000 on a regular basis it means
there are solid holding numbers,”
he told Autofile. “North of that
and we would be looking at an
oversupply issue.
“There was good buying in Japan
in March, and we saw high arrival
numbers in April, May and June.
“The stockpile occurs more at
certain times of the year. Since
I came back into the industry in
1996, it has ebbed and flowed.”
Used car stock levels are
traditionally based on what’s
happening in Japan and what
consumers are buying here.
Conditions there have improved
recently and the exchange rate
has gone up.“October and November are
normally difficult for the industry,
so the stockpile tends to go
up,” says Macdonald. “But trade
swings up over Christmas and the
holidays, so it goes down.
“December and January are
good months for sales because
people take time off work, the kids
are off school and people may have
Christmas bonuses or holiday pay.
“It’s a time when Kiwis tend to
make financial decisions, so dealers
need to have plenty of stock to
match demand.“When the market’s down in
Japan, stock is hard to get. When
it’s buoyant, you tend to buy what
you can because you don’t know
what will be available next time.
“Dealers also need to bear in
mind it takes four to six weeks to
get stock from Japan.”
Larger operations, of say 300
units, are more static with their
holding not changing too much.
A drop of 50 units may not be
too drastic. But stock can vary
enormously by proportion on yards
with 30 to 40 cars.
“They can suddenly be selling
without having bought for a few
weeks and being 10-15 units down
makes them more susceptible,”
says Macdonald.
“Dealers then jump online to
buy more from Japan, but that’s
always been the way.
“You can oversupply when
buying conditions are good, but
the marketplace normally corrects
itself by pulling back from Japan or
selling down. The numbers might
drop for a month or two before
trundling up again.
“There’s no magic supply-chain
miracle. When it’s slow, it tends to be
slow for everybody. If you can get
good supply with a good exchange
rate, everyone benefits.”
did come down after the global
financial crisis [GFC].
“Stocking levels then increased
again and they respond to the
number of new vehicles sold and
the rate at which they are sold.
“They basically go up when
sales go up, but I’m not so sure
about the days stock is held for
being longer and can’t explain that.
“Average sales per day came
down during the GFC and before
that they were much higher.”
If 80,000 vehicles are sold one
year and 100,000 are sold the
following year, the average sales
per day should be higher – and
the MIA is expecting more new
vehicles to be sold this year than
during 2012.There were 54,404 sales in 2009,
62,029 in 2010, 64,019 in 2011
and 76,871 in 2012, and the MIA is
predicting about 82,000 passenger
vehicle and SUV sales this year.
“We’re looking at about 30,600
light commercials and we’re on
track for 112,000 or 113,000 new
vehicle sales overall.”
Business confidence being
high and strong regional
economies in Auckland and
Christchurch are boosting sales.
“Trades people are upgrading
their vehicles,” says Crawford.
“Although passenger cars aren’t so
hot, SUVs are.“People in the housing market
are refinancing their mortgages
to buy big-ticket items especially
when they are confident about
keeping their jobs.”
All that said, some of the
regional centres, such as Hawke’s
Bay and Palmerston North, aren’t
showing as much growth as
other centres.“But 80 per cent of New Zealand’s
population is in Auckland and
Christchurch. “If you add in Dunedin and
Wellington, these centres cover a
large proportion of the population
and all have strong economies.”
Year to date, 77,438 new cars
have been imported and 68,612
have been registered to give a
variance of 8,826 so far this year.
Days with stock at hand has
been steadily increasing from 78 in
January to 131 in October.
Last year 90,754 units were
imported and there were 76,871
sales for a variance of 13,883.
Stock levels of new cars have
increased every month
except one this year, with
October’s total of 29,509 being the
highest of 2013.There were 7,962 sales last
month, also this year’s biggest
amount, while the variance was
1,400 with 9,362 units imported –
the second highest amount after
11,065 imports in August.
The total stock figure at the
end of December was 20,683 and
that dropped to this year’s low of
18,653 in January.
David Crawford, chief executive
officer of the Motor Industry
Association (MIA), says current
models aren’t sitting around in
stock for too long.
“The industry tends to manage
stock levels quite well and does this
day in, day out,” he told Autofile.
“My data suggests this is a
cyclical thing and levels were no
higher in previous years, but they
Industry manages levels well
Dealer stock of new cars in New Zealand - Oct 2013
2012 Imported NeW CArS SoLd VArIANCe StoCk
AVerAge SALeS per dAy - ytd
dAyS StoCk
At hANd
MIA stock estimate as at end of December 2011 12,984
Jan ‘12 5,026 7,499 (2,473) 10,511 242 43
Feb ‘12 7,368 5,633 1,735 12,246 223 55
Mar ‘12 7,228 6,499 729 12,975 218 59
Apr ‘12 6,285 5,430 855 13,830 209 66
May ‘12 7,742 5,942 1,800 15,630 205 76
Jun ‘12 8,870 7,142 1,728 17,358 211 82
Jul ‘12 7,894 6,208 1,686 19,044 209 91
Aug ‘12 8,589 5,959 2,630 21,674 207 105
Sep ‘12 6,828 6,637 191 21,865 209 105
Oct ‘12 8,155 7,336 819 22,684 211 107
Nov ‘12 8,953 6,484 2,469 25,153 212 119
Dec ‘12 7,816 6,102 1,714 26,867 211 128
ytd total 90,754 76,871 13,883
2013 Imported NeW CArS SoLd VArIANCe StoCk
AVerAge SALeS per dAy - ytd
dAyS StoCk
At hANd
Total stock at the end of December 2012 26,867
Jan ‘13 5,355 7,385 (2,030) 24,837 238 104
Feb ‘13 7,027 5,799 1,228 26,065 223 117
Mar ‘13 6,329 6,800 (471) 25,594 222 115
Apr ‘13 7,391 5,908 1,483 27,077 216 125
May ‘13 7,429 6,347 1,082 28,159 214 132
Jun ‘13 8,051 7,542 509 28,668 220 130
Jul ‘13 8,423 6,769 1,654 30,322 220 138
Aug ‘13 11,065 6,828 4,237 34,559 220 157
Sep ‘13 7,006 7,272 (266) 34,293 222 154
Oct ‘13 9,362 7,962 1,400 35,693 226 158
Nov ‘13 - - - - - -
Dec ‘13 - - - - - -
ytd total 77,438 68,612 8,826
2013 predicted sales 82,380
Dealer stock of used car imports in New Zealand - Oct 2013
2012 Imported USed ImportS SoLd VArIANCe StoCk
AVerAge SALeS per dAy - ytd
dAyS StoCk
At hANd
Total stock at the end of December 2011 8,579
Jan ‘12 3,191 6,375 (3,184) 5,395 206 26
Feb ‘12 4,920 6,000 (1,080) 4,315 210 21
Mar ‘12 6,504 6,429 75 4,390 209 21
Apr ‘12 6,613 5,877 736 5,126 206 25
May ‘12 7,693 6,793 900 6,026 208 29
Jun ‘12 6,947 6,184 763 6,789 208 33
Jul ‘12 5,335 6,641 (1,306) 5,483 209 26
Aug ‘12 5,540 6,621 (1,081) 4,402 210 21
Sep ‘12 5,506 6,222 (716) 3,686 209 18
Oct ‘12 5,688 6,867 (1,179) 2,507 211 12
Nov ‘12 8,486 7,183 1,303 3,810 213 18
Dec ‘12 6,414 7,119 (705) 3,105 215 14
ytd total 72,837 78,311 (5,474)
2013 Imported USed ImportS SoLd VArIANCe StoCk
AVerAge SALeS per dAy - ytd
dAyS StoCk
At hANd
Total stock at the end of December 2012 3105
Jan ‘13 4,468 7,397 (2,929) 176 239 0.7
Feb ‘13 8,247 6,922 1,325 1,501 243 6
Mar ‘13 8,852 7,581 1,271 2,772 243 11
Apr ‘13 10,539 7,418 3,121 5,893 244 24
May ‘13 10,967 8,460 2,507 8,400 250 34
Jun ‘13 8,089 7,862 227 8,627 252 34
Jul ‘13 8,623 9,629 (1,006) 7,621 261 29
Aug ‘13 8,635 8,648 (13) 7,608 263 29
Sep ‘13 7,501 7,615 (114) 7,494 262 29
Oct ‘13 10,374 8,545 1,829 9,323 263 35
Nov ‘13 - - - - - -
Dec ‘13 - - - - - -
ytd total 86,295 80,077 6,218
2013 predicted sales 96,145
xxxxxxxxxxxxxxxxxxxx
Days stock in nZ - UseD import cars
180
160
140
120
100
80
60
40
20
0
Jan
Feb
mar
apr
may
JUn
JUL
aUG
sep
oct
nov
Dec
2013
2012
Days stock in nZ - new cars
180
160
140
120
100
80
60
40
20
0
Jan
Feb
mar
apr
may
JUn
JUL
aUG
sep
oct
nov
Dec
2013
2012
Day
s of
sto
ck
Day
s of
sto
ck
SPONSORSHIP OF THE NEW AND USED COMMERCIAL STATISTICS
PAGES IS NOW AVAILABLE FOR YOUR BUSINESSTARGETED ADVERTISING SPACE
SHOULDN’T WE BE LOOKING AT YOUR BUSINESS? For all enquiries contact Brian on 021 455 775 or email brian@autofi le.co.nz
34 | www.autofile.co.nz
www.autofile.co.nz | 35
UDC Finance Limited lending criteria applies.
Seal the deal with UDC.Ph 0800 500 832 or visit www.udc.co.nz
New Passenger Vehicle Sales by Make - November 2013Make Nov '13 Nov '12 +/- % Nov '13
Mkt Share 2013 total 2013 Mkt ShareToyota 1746 1190 46.7 23.4% 14670 19.3%Holden 685 673 1.8 9.2% 8102 10.7%Ford 618 596 3.7 8.3% 6519 8.6%Hyundai 572 624 -8.3 7.7% 6695 8.8%Mazda 512 485 5.6 6.9% 5447 7.2%Nissan 382 281 35.9 5.1% 3342 4.4%Suzuki 376 405 -7.2 5.0% 4436 5.8%Mitsubishi 351 272 29.0 4.7% 3661 4.8%Honda 310 312 -0.6 4.2% 2994 3.9%Volkswagen 288 261 10.3 3.9% 3527 4.6%Kia 202 240 -15.8 2.7% 2563 3.4%BMw 172 178 -3.4 2.3% 1861 2.4%Subaru 165 153 7.8 2.2% 1645 2.2%Audi 163 150 8.7 2.2% 1748 2.3%Mercedes-Benz 128 82 56.1 1.7% 1398 1.8%Peugeot 108 60 80.0 1.4% 1001 1.3%Jeep 92 65 41.5 1.2% 775 1.0%Ssangyong 86 49 75.5 1.2% 724 1.0%Dodge 64 46 39.1 0.9% 478 0.6%Skoda 63 56 12.5 0.8% 654 0.9%Lexus 54 44 22.7 0.7% 508 0.7%Land Rover 51 22 131.8 0.7% 443 0.6%Mini 44 43 2.3 0.6% 474 0.6%Chery 34 21 61.9 0.5% 351 0.5%Alfa Romeo 24 31 -22.6 0.3% 182 0.2%Great wall 23 38 -39.5 0.3% 211 0.3%Fiat 21 2 950.0 0.3% 142 0.2%Renault 21 8 162.5 0.3% 98 0.1%Volvo 18 19 -5.3 0.2% 229 0.3%Porsche 13 11 18.2 0.2% 182 0.2%Citroen 12 16 -25.0 0.2% 286 0.4%Jaguar 12 5 140.0 0.2% 128 0.2%Chrysler 10 13 -23.1 0.1% 120 0.2%Can-Am 9 6 50.0 0.1% 75 0.1%Daihatsu 6 19 -68.4 0.1% 258 0.3%Aston Martin 4 1 300.0 0.1% 25 0.0%Maserati 4 2 100.0 0.1% 14 0.0%Mahindra 3 - - 0.0% 6 0.0%MG 2 0 200.0 0.0% 12 0.0%Chrysler Jeep 1 - - 0.0% 1 0.0%Mclaren 1 0 100.0 0.0% 6 0.0%Others 3 5 -40.0 0.0% 71 0.1%total 7453 6484 14.9 100.0% 76062 100.0%
New Passenger Vehicle Sales by Model - November 2013Make Model Nov '13 Nov '12 +/- % Nov Mkt
Share2013
total2013 Mkt
ShareToyota Corolla 626 462 35.5 8.4% 5283 6.9%Toyota RAV4 289 80 261.3 3.9% 2521 3.3%Holden Commodore 260 171 52.0 3.5% 2399 3.2%Mazda Cx-5 239 141 69.5 3.2% 1989 2.6%Toyota yaris 227 267 -15.0 3.0% 2235 2.9%Suzuki Swift 218 254 -14.2 2.9% 2750 3.6%Ford Mondeo 184 98 87.8 2.5% 1201 1.6%Hyundai ix35 168 81 107.4 2.3% 1338 1.8%Mitsubishi Lancer 168 84 100.0 2.3% 894 1.2%Toyota Camry 168 131 28.2 2.3% 1270 1.7%Holden Captiva 135 319 -57.7 1.8% 2039 2.7%Volkswagen Golf 134 103 30.1 1.8% 1469 1.9%Toyota Highlander 118 79 49.4 1.6% 1092 1.4%Ford Focus 114 212 -46.2 1.5% 1429 1.9%Honda Jazz 113 76 48.7 1.5% 922 1.2%Ford Kuga 112 18 522.2 1.5% 952 1.3%Mazda Mazda3 109 151 -27.8 1.5% 1537 2.0%Toyota Aurion 107 23 365.2 1.4% 447 0.6%Holden Cruze 106 80 32.5 1.4% 1925 2.5%Hyundai Santa Fe 103 261 -60.5 1.4% 1847 2.4%Honda Civic 100 115 -13.0 1.3% 852 1.1%Mitsubishi Outlander 97 118 -17.8 1.3% 1258 1.7%Hyundai i30 95 103 -7.8 1.3% 1255 1.6%Nissan Qashqai 93 106 -12.3 1.2% 884 1.2%Toyota Landcruiser Prado 87 38 128.9 1.2% 557 0.7%Nissan x-Trail 86 52 65.4 1.2% 779 1.0%Ford Territory 83 137 -39.4 1.1% 1188 1.6%Volkswagen Tiguan 78 53 47.2 1.0% 689 0.9%Hyundai Accent 77 29 165.5 1.0% 572 0.8%Honda CRV 71 82 -13.4 1.0% 793 1.0%Mazda Mazda6 70 82 -14.6 0.9% 960 1.3%Mazda Mazda2 66 77 -14.3 0.9% 712 0.9%Ford Falcon 65 45 44.4 0.9% 835 1.1%Nissan Pathfinder 65 7 828.6 0.9% 191 0.3%Dodge Journey 64 46 39.1 0.9% 476 0.6%Jeep Grand Cherokee 64 39 64.1 0.9% 502 0.7%Ssangyong Korando 63 36 75.0 0.8% 480 0.6%Ford Fiesta 60 85 -29.4 0.8% 892 1.2%Bmw 116i 59 13 353.8 0.8% 378 0.5%Holden Malibu 58 - - 0.8% 334 0.4%Others2254 2130 5.8 30.2% 25936 34.1%total7453 6484 14.9 100.0% 76062 100.0%
Your fi rst choice in automotive lending.UDC Finance Limited lending criteria applies.
Ph 0800 500 832 or visit www.udc.co.nz
850 wds
5000
5500
6000
6500
7000
7500
8000
8500
Jan Feb Mar Apr May Jun Jul Aug Sep Oct Nov Dec
2012
2013
New Passenger registrations - 2012-2013
Subscribe - FREEgo to www.autofi le.co.nz/subscribe for the latest industry newsCONNECT & ENGAGE
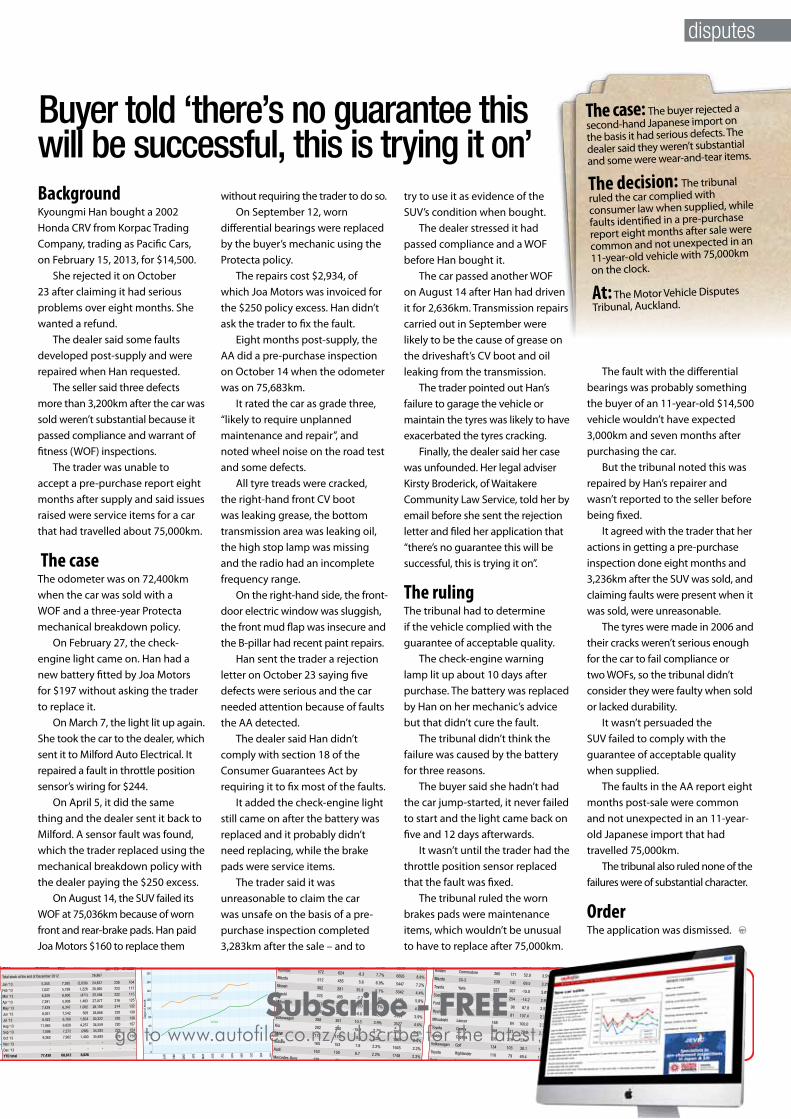
BackgroundKyoungmi Han bought a 2002 Honda CRV from Korpac Trading Company, trading as Pacific Cars, on February 15, 2013, for $14,500.
She rejected it on October 23 after claiming it had serious problems over eight months. She wanted a refund.
The dealer said some faults developed post-supply and were repaired when Han requested.
The seller said three defects more than 3,200km after the car was sold weren’t substantial because it passed compliance and warrant of fitness (WOF) inspections.
The trader was unable to accept a pre-purchase report eight months after supply and said issues raised were service items for a car that had travelled about 75,000km.
The caseThe odometer was on 72,400km when the car was sold with a WOF and a three-year Protecta mechanical breakdown policy.
On February 27, the check-engine light came on. Han had a new battery fitted by Joa Motors for $197 without asking the trader to replace it.
On March 7, the light lit up again. She took the car to the dealer, which sent it to Milford Auto Electrical. It repaired a fault in throttle position sensor’s wiring for $244.
On April 5, it did the same thing and the dealer sent it back to Milford. A sensor fault was found, which the trader replaced using the mechanical breakdown policy with the dealer paying the $250 excess.
On August 14, the SUV failed its WOF at 75,036km because of worn front and rear-brake pads. Han paid Joa Motors $160 to replace them
without requiring the trader to do so.On September 12, worn
differential bearings were replaced by the buyer’s mechanic using the Protecta policy.
The repairs cost $2,934, of which Joa Motors was invoiced for the $250 policy excess. Han didn’t ask the trader to fix the fault.
Eight months post-supply, the AA did a pre-purchase inspection on October 14 when the odometer was on 75,683km.
It rated the car as grade three, “likely to require unplanned maintenance and repair”, and noted wheel noise on the road test and some defects.
All tyre treads were cracked, the right-hand front CV boot was leaking grease, the bottom transmission area was leaking oil, the high stop lamp was missing and the radio had an incomplete frequency range.
On the right-hand side, the front-door electric window was sluggish, the front mud flap was insecure and the B-pillar had recent paint repairs.
Han sent the trader a rejection letter on October 23 saying five defects were serious and the car needed attention because of faults the AA detected.
The dealer said Han didn’t comply with section 18 of the Consumer Guarantees Act by requiring it to fix most of the faults.
It added the check-engine light still came on after the battery was replaced and it probably didn’t need replacing, while the brake pads were service items.
The trader said it was unreasonable to claim the car was unsafe on the basis of a pre-purchase inspection completed 3,283km after the sale – and to
try to use it as evidence of the SUV’s condition when bought.
The dealer stressed it had passed compliance and a WOF before Han bought it.
The car passed another WOF on August 14 after Han had driven it for 2,636km. Transmission repairs carried out in September were likely to be the cause of grease on the driveshaft’s CV boot and oil leaking from the transmission.
The trader pointed out Han’s failure to garage the vehicle or maintain the tyres was likely to have exacerbated the tyres cracking.
Finally, the dealer said her case was unfounded. Her legal adviser Kirsty Broderick, of Waitakere Community Law Service, told her by email before she sent the rejection letter and filed her application that “there’s no guarantee this will be successful, this is trying it on”.
The ruling The tribunal had to determine if the vehicle complied with the guarantee of acceptable quality.
The check-engine warning lamp lit up about 10 days after purchase. The battery was replaced by Han on her mechanic’s advice but that didn’t cure the fault.
The tribunal didn’t think the failure was caused by the battery for three reasons.
The buyer said she hadn’t had the car jump-started, it never failed to start and the light came back on five and 12 days afterwards.
It wasn’t until the trader had the throttle position sensor replaced that the fault was fixed.
The tribunal ruled the worn brakes pads were maintenance items, which wouldn’t be unusual to have to replace after 75,000km.
The case: The buyer rejected a
second-hand Japanese import on
the basis it had serious defects. The
dealer said they weren’t substantial
and some were wear-and-tear items.
The decision: The tribunal
ruled the car complied with consumer law when supplied, while
faults identified in a pre-purchase
report eight months after sale were
common and not unexpected in an
11-year-old vehicle with 75,000km
on the clock.
At: The Motor Vehicle Disputes
Tribunal, Auckland.
The fault with the differential bearings was probably something the buyer of an 11-year-old $14,500 vehicle wouldn’t have expected 3,000km and seven months after purchasing the car.
But the tribunal noted this was repaired by Han’s repairer and wasn’t reported to the seller before being fixed.
It agreed with the trader that her actions in getting a pre-purchase inspection done eight months and 3,236km after the SUV was sold, and claiming faults were present when it was sold, were unreasonable.
The tyres were made in 2006 and their cracks weren’t serious enough for the car to fail compliance or two WOFs, so the tribunal didn’t consider they were faulty when sold or lacked durability.
It wasn’t persuaded the SUV failed to comply with the guarantee of acceptable quality when supplied.
The faults in the AA report eight months post-sale were common and not unexpected in an 11-year-old Japanese import that had travelled 75,000km.
The tribunal also ruled none of the failures were of substantial character.
OrderThe application was dismissed.
Buyer told ‘there’s no guarantee this will be successful, this is trying it on’
disputes
5500
6000
6500
7000
7500
8000
8500
9000
9500
10000
Jan Feb Mar Apr May Jun Jul Aug Sep Oct Nov Dec
2013
2012
17%
12%
13%
9%
41%
14%
22%
16%
43%
0% 5% 10% 15% 20% 25% 30% 35% 40% 45% 50% 55%
Fina
nce
Paym
ent
prot
ectio
n GA
P In
sura
nce
MBI
New
Used
Whangarei Auckland Hamilton Thames Tauranga Rotorua Gisborne Napier New Plymouth Wanganui Palmerston North Masterton Wellington Nelson Blenheim Greymouth Whangarei Auckland Hamilton Thames Tauranga Rotorua Gisborne
Napier New Plymouth Wanganui Palmerston North Masterton Wellington Nelson Blenheim Greymouth Westport Christchurch Timaru Oamaru Dunedin
Invercargill Whangarei Auckland Hamilton Thames Tauranga Rotorua Gisborne Napier New Plymouth
Wanganui Palmerston North Masterton Wellington Nelson Blenheim Greymouth Whangarei Auckland Hamilton Thames Tauranga Rotorua
Ar
ou
n d t h e c ou nt
ry
20 | www.autofile.co.nz
0800 7000 44autoport.netwww.
UK, Japanese and local vehicles.Finance available.
The TRUSTED online wholesale trading site.
PHONE 0800 ARMACUP (276 2287) or 09 303 3314EMAIL [email protected]
www.armacup.com
YOUR FIRST CHOICE IN SHIPPING
TWO SAILINGS PER MONTH JAPAN TO NZ
Port Calls Hoegh Xiamen V20
Sepang Express V9
Morning Miracle V5
Liberty V1
Osaka 20 Oct 30 Oct 15 Nov 29 Nov Nagoya 21 Oct 31 Oct 16 Nov 30 Nov Yokohama 22 Oct 1 Nov 17 Nov 1 Dec Auckland 7 Nov 17 Nov 4 Dec 19 Dec Wellington 13 Nov 23 Nov 11 Dec 26 Dec Lyttelton 16 Nov 29 Nov 11 Dec 29 Dec
LATEST SCHEDULE
PORT TO DOOR SERVICEINCLUDING: MPI Border inspection Odometer certifi cation Digital Photography for prior sales in NZ NZ Customs clearance Delivery Nationwide Insurance
GENEROUS REWARDS PROGRAMMEShip your motor vehicles on Armacup vessels and you can earn seamiles points for air travel (only applicable to used imports)
Biggest increases/Decreases By town year-on-year
(OctOber 2013 vs OctOber 2012)
Biggest increases new Used
westport 100.0% Blenheim 95.5% thames 51.2% nelson 64.9% napier 34.1% rotorua 52.0%
Biggest decreases new Used
wanganui 27.7% westport 41.7% gisborne 26.8% Masterton 20.0% timaru 23.7% timaru 12.4%
7000
6000
5000
4000
3000
2000
1000
Nov
‘12
DEC
‘12
JAN
‘13
FEb
‘13
MAr
‘13
APr
‘13
MAy
‘13
JuN
‘13
JuL
‘13
AuG
‘13
SEP ‘
13
Oct
‘13
North Island
South Island
10000
9000
8000
7000
6000
5000
4000
Nov
‘12
DEC
‘12
JAN
‘13
FEb
‘13
MAr
‘13
APr
‘13
MAy
‘13
JuN
‘13
JuL
‘13
AuG
‘13
SEP ‘
13
Oct
‘13
Used
New7962
8545
1805
6740
Used Vehicle RegistRatiOnsNorth IslaNd versus south IslaNd
PassengeR Vehicle RegistRatiOnsNew versus used
Vehi
cles
sol
d
4500
4000
3500
3000
2500
2000
1500
1000
500
0
Nov
‘12
DEC
‘12
JAN
‘13
FEb
‘13
MAr
‘13
APr
‘13
MAy
‘13
JuN
‘13
JuL
‘13
AuG
‘13
SEP ‘
13
Oct
‘13
Auckland
Wellington
Vehi
cles
sol
d
600
500
400
300
200
100
0
Nov
‘12
DEC
‘12
JAN
‘13
FEb
‘13
MAr
‘13
APr
‘13
MAy
‘13
JuN
‘13
JuL
‘13
AuG
‘13
SEP ‘
13
Oct
‘13
Hamilton
Tauranga
Palmerston Nth
DunedinChristchurch
4320
495
1185
290
729
229
216
aucklaNd, wellINgtoN, chrIstchurch hamIltoN, tauraNga, duNedIN, PalmerstoN North
Used imPORt PassengeR Vehicle RegistRatiOns by city
october 2013
autoport.net
The TRUSTED online wholesale trading site.
26 | www.autofile.co.nz
www.autofile.co.nz | 27
Annual high for stockpileThe amount of stock held
by used car dealers during
October was the highest
monthly total of the year.
There were 10,374 units
imported last month with a
variance of 1,829 on 8,545 sales.
The number of cars in stock
amounted to 9,323 compared to
7,494 in September.
There have been two other
major increases during 2013 – with
variances between imports and sales
of 3,121 in April and 2,507 in May.
Graeme Macdonald, chairman
of the North Island branch of the
Imported Motor Vehicle Industry
Association, says the current
stockpile should correct itself – as it
normally does.“If the monthly stockpile was
10,000 on a regular basis it means
there are solid holding numbers,”
he told Autofile. “North of that
and we would be looking at an
oversupply issue.
“There was good buying in Japan
in March, and we saw high arrival
numbers in April, May and June.
“The stockpile occurs more at
certain times of the year. Since
I came back into the industry in
1996, it has ebbed and flowed.”
Used car stock levels are
traditionally based on what’s
happening in Japan and what
consumers are buying here.
Conditions there have improved
recently and the exchange rate
has gone up.“October and November are
normally difficult for the industry,
so the stockpile tends to go
up,” says Macdonald. “But trade
swings up over Christmas and the
holidays, so it goes down.
“December and January are
good months for sales because
people take time off work, the kids
are off school and people may have
Christmas bonuses or holiday pay.
“It’s a time when Kiwis tend to
make financial decisions, so dealers
need to have plenty of stock to
match demand.“When the market’s down in
Japan, stock is hard to get. When
it’s buoyant, you tend to buy what
you can because you don’t know
what will be available next time.
“Dealers also need to bear in
mind it takes four to six weeks to
get stock from Japan.”
Larger operations, of say 300
units, are more static with their
holding not changing too much.
A drop of 50 units may not be
too drastic. But stock can vary
enormously by proportion on yards
with 30 to 40 cars.
“They can suddenly be selling
without having bought for a few
weeks and being 10-15 units down
makes them more susceptible,”
says Macdonald.
“Dealers then jump online to
buy more from Japan, but that’s
always been the way.
“You can oversupply when
buying conditions are good, but
the marketplace normally corrects
itself by pulling back from Japan or
selling down. The numbers might
drop for a month or two before
trundling up again.
“There’s no magic supply-chain
miracle. When it’s slow, it tends to be
slow for everybody. If you can get
good supply with a good exchange
rate, everyone benefits.”
did come down after the global
financial crisis [GFC].
“Stocking levels then increased
again and they respond to the
number of new vehicles sold and
the rate at which they are sold.
“They basically go up when
sales go up, but I’m not so sure
about the days stock is held for
being longer and can’t explain that.
“Average sales per day came
down during the GFC and before
that they were much higher.”
If 80,000 vehicles are sold one
year and 100,000 are sold the
following year, the average sales
per day should be higher – and
the MIA is expecting more new
vehicles to be sold this year than
during 2012.There were 54,404 sales in 2009,
62,029 in 2010, 64,019 in 2011
and 76,871 in 2012, and the MIA is
predicting about 82,000 passenger
vehicle and SUV sales this year.
“We’re looking at about 30,600
light commercials and we’re on
track for 112,000 or 113,000 new
vehicle sales overall.”
Business confidence being
high and strong regional
economies in Auckland and
Christchurch are boosting sales.
“Trades people are upgrading
their vehicles,” says Crawford.
“Although passenger cars aren’t so
hot, SUVs are.“People in the housing market
are refinancing their mortgages
to buy big-ticket items especially
when they are confident about
keeping their jobs.”
All that said, some of the
regional centres, such as Hawke’s
Bay and Palmerston North, aren’t
showing as much growth as
other centres.“But 80 per cent of New Zealand’s
population is in Auckland and
Christchurch. “If you add in Dunedin and
Wellington, these centres cover a
large proportion of the population
and all have strong economies.”
Year to date, 77,438 new cars
have been imported and 68,612
have been registered to give a
variance of 8,826 so far this year.
Days with stock at hand has
been steadily increasing from 78 in
January to 131 in October.
Last year 90,754 units were
imported and there were 76,871
sales for a variance of 13,883.
Stock levels of new cars have
increased every month
except one this year, with
October’s total of 29,509 being the
highest of 2013.There were 7,962 sales last
month, also this year’s biggest
amount, while the variance was
1,400 with 9,362 units imported –
the second highest amount after
11,065 imports in August.
The total stock figure at the
end of December was 20,683 and
that dropped to this year’s low of
18,653 in January.
David Crawford, chief executive
officer of the Motor Industry
Association (MIA), says current
models aren’t sitting around in
stock for too long.
“The industry tends to manage
stock levels quite well and does this
day in, day out,” he told Autofile.
“My data suggests this is a
cyclical thing and levels were no
higher in previous years, but they
Industry manages levels well
Dealer stock of new cars in New Zealand - Oct 2013
2012 Imported NeW CArS SoLd VArIANCe StoCk
AVerAge SALeS per dAy - ytd
dAyS StoCk
At hANd
MIA stock estimate as at end of December 2011 12,984
Jan ‘12 5,026 7,499 (2,473) 10,511 242 43
Feb ‘12 7,368 5,633 1,735 12,246 223 55
Mar ‘12 7,228 6,499 729 12,975 218 59
Apr ‘12 6,285 5,430 855 13,830 209 66
May ‘12 7,742 5,942 1,800 15,630 205 76
Jun ‘12 8,870 7,142 1,728 17,358 211 82
Jul ‘12 7,894 6,208 1,686 19,044 209 91
Aug ‘12 8,589 5,959 2,630 21,674 207 105
Sep ‘12 6,828 6,637 191 21,865 209 105
Oct ‘12 8,155 7,336 819 22,684 211 107
Nov ‘12 8,953 6,484 2,469 25,153 212 119
Dec ‘12 7,816 6,102 1,714 26,867 211 128
ytd total 90,754 76,871 13,883
2013 Imported NeW CArS SoLd VArIANCe StoCk
AVerAge SALeS per dAy - ytd
dAyS StoCk
At hANd
Total stock at the end of December 2012 26,867
Jan ‘13 5,355 7,385 (2,030) 24,837 238 104
Feb ‘13 7,027 5,799 1,228 26,065 223 117
Mar ‘13 6,329 6,800 (471) 25,594 222 115
Apr ‘13 7,391 5,908 1,483 27,077 216 125
May ‘13 7,429 6,347 1,082 28,159 214 132
Jun ‘13 8,051 7,542 509 28,668 220 130
Jul ‘13 8,423 6,769 1,654 30,322 220 138
Aug ‘13 11,065 6,828 4,237 34,559 220 157
Sep ‘13 7,006 7,272 (266) 34,293 222 154
Oct ‘13 9,362 7,962 1,400 35,693 226 158
Nov ‘13 - - - - - -
Dec ‘13 - - - - - -
ytd total 77,438 68,612 8,826
2013 predicted sales 82,380
Dealer stock of used car imports in New Zealand - Oct 2013
2012 Imported USed ImportS SoLd VArIANCe StoCk
AVerAge SALeS per dAy - ytd
dAyS StoCk
At hANd
Total stock at the end of December 2011 8,579
Jan ‘12 3,191 6,375 (3,184) 5,395 206 26
Feb ‘12 4,920 6,000 (1,080) 4,315 210 21
Mar ‘12 6,504 6,429 75 4,390 209 21
Apr ‘12 6,613 5,877 736 5,126 206 25
May ‘12 7,693 6,793 900 6,026 208 29
Jun ‘12 6,947 6,184 763 6,789 208 33
Jul ‘12 5,335 6,641 (1,306) 5,483 209 26
Aug ‘12 5,540 6,621 (1,081) 4,402 210 21
Sep ‘12 5,506 6,222 (716) 3,686 209 18
Oct ‘12 5,688 6,867 (1,179) 2,507 211 12
Nov ‘12 8,486 7,183 1,303 3,810 213 18
Dec ‘12 6,414 7,119 (705) 3,105 215 14
ytd total 72,837 78,311 (5,474)
2013 Imported USed ImportS SoLd VArIANCe StoCk
AVerAge SALeS per dAy - ytd
dAyS StoCk
At hANd
Total stock at the end of December 2012 3105
Jan ‘13 4,468 7,397 (2,929) 176 239 0.7
Feb ‘13 8,247 6,922 1,325 1,501 243 6
Mar ‘13 8,852 7,581 1,271 2,772 243 11
Apr ‘13 10,539 7,418 3,121 5,893 244 24
May ‘13 10,967 8,460 2,507 8,400 250 34
Jun ‘13 8,089 7,862 227 8,627 252 34
Jul ‘13 8,623 9,629 (1,006) 7,621 261 29
Aug ‘13 8,635 8,648 (13) 7,608 263 29
Sep ‘13 7,501 7,615 (114) 7,494 262 29
Oct ‘13 10,374 8,545 1,829 9,323 263 35
Nov ‘13 - - - - - -
Dec ‘13 - - - - - -
ytd total 86,295 80,077 6,218
2013 predicted sales 96,145
xxxxxxxxxxxxxxxxxxxx
Days stock in nZ - UseD import cars
180
160
140
120
100
80
60
40
20
0
Jan
Feb
mar
apr
may
JUn
JUL
aUG
sep
oct
nov
Dec
2013
2012
Days stock in nZ - new cars
180
160
140
120
100
80
60
40
20
0
Jan
Feb
mar
apr
may
JUn
JUL
aUG
sep
oct
nov
Dec
2013
2012
Day
s of
sto
ck
Day
s of
sto
ck
SPONSORSHIP OF THE NEW AND USED COMMERCIAL STATISTICS
PAGES IS NOW AVAILABLE FOR YOUR BUSINESSTARGETED ADVERTISING SPACE
SHOULDN’T WE BE LOOKING AT YOUR BUSINESS? For all enquiries contact Brian on 021 455 775 or email brian@autofi le.co.nz
34 | www.autofile.co.nz
www.autofile.co.nz | 35
UDC Finance Limited lending criteria applies.
Seal the deal with UDC.Ph 0800 500 832 or visit www.udc.co.nz
New Passenger Vehicle Sales by Make - November 2013Make Nov '13 Nov '12 +/- % Nov '13
Mkt Share 2013 total 2013 Mkt ShareToyota 1746 1190 46.7 23.4% 14670 19.3%Holden 685 673 1.8 9.2% 8102 10.7%Ford 618 596 3.7 8.3% 6519 8.6%Hyundai 572 624 -8.3 7.7% 6695 8.8%Mazda 512 485 5.6 6.9% 5447 7.2%Nissan 382 281 35.9 5.1% 3342 4.4%Suzuki 376 405 -7.2 5.0% 4436 5.8%Mitsubishi 351 272 29.0 4.7% 3661 4.8%Honda 310 312 -0.6 4.2% 2994 3.9%Volkswagen 288 261 10.3 3.9% 3527 4.6%Kia 202 240 -15.8 2.7% 2563 3.4%BMw 172 178 -3.4 2.3% 1861 2.4%Subaru 165 153 7.8 2.2% 1645 2.2%Audi 163 150 8.7 2.2% 1748 2.3%Mercedes-Benz 128 82 56.1 1.7% 1398 1.8%Peugeot 108 60 80.0 1.4% 1001 1.3%Jeep 92 65 41.5 1.2% 775 1.0%Ssangyong 86 49 75.5 1.2% 724 1.0%Dodge 64 46 39.1 0.9% 478 0.6%Skoda 63 56 12.5 0.8% 654 0.9%Lexus 54 44 22.7 0.7% 508 0.7%Land Rover 51 22 131.8 0.7% 443 0.6%Mini 44 43 2.3 0.6% 474 0.6%Chery 34 21 61.9 0.5% 351 0.5%Alfa Romeo 24 31 -22.6 0.3% 182 0.2%Great wall 23 38 -39.5 0.3% 211 0.3%Fiat 21 2 950.0 0.3% 142 0.2%Renault 21 8 162.5 0.3% 98 0.1%Volvo 18 19 -5.3 0.2% 229 0.3%Porsche 13 11 18.2 0.2% 182 0.2%Citroen 12 16 -25.0 0.2% 286 0.4%Jaguar 12 5 140.0 0.2% 128 0.2%Chrysler 10 13 -23.1 0.1% 120 0.2%Can-Am 9 6 50.0 0.1% 75 0.1%Daihatsu 6 19 -68.4 0.1% 258 0.3%Aston Martin 4 1 300.0 0.1% 25 0.0%Maserati 4 2 100.0 0.1% 14 0.0%Mahindra 3 - - 0.0% 6 0.0%MG 2 0 200.0 0.0% 12 0.0%Chrysler Jeep 1 - - 0.0% 1 0.0%Mclaren 1 0 100.0 0.0% 6 0.0%Others 3 5 -40.0 0.0% 71 0.1%total 7453 6484 14.9 100.0% 76062 100.0%
New Passenger Vehicle Sales by Model - November 2013Make Model Nov '13 Nov '12 +/- % Nov Mkt
Share2013
total2013 Mkt
ShareToyota Corolla 626 462 35.5 8.4% 5283 6.9%Toyota RAV4 289 80 261.3 3.9% 2521 3.3%Holden Commodore 260 171 52.0 3.5% 2399 3.2%Mazda Cx-5 239 141 69.5 3.2% 1989 2.6%Toyota yaris 227 267 -15.0 3.0% 2235 2.9%Suzuki Swift 218 254 -14.2 2.9% 2750 3.6%Ford Mondeo 184 98 87.8 2.5% 1201 1.6%Hyundai ix35 168 81 107.4 2.3% 1338 1.8%Mitsubishi Lancer 168 84 100.0 2.3% 894 1.2%Toyota Camry 168 131 28.2 2.3% 1270 1.7%Holden Captiva 135 319 -57.7 1.8% 2039 2.7%Volkswagen Golf 134 103 30.1 1.8% 1469 1.9%Toyota Highlander 118 79 49.4 1.6% 1092 1.4%Ford Focus 114 212 -46.2 1.5% 1429 1.9%Honda Jazz 113 76 48.7 1.5% 922 1.2%Ford Kuga 112 18 522.2 1.5% 952 1.3%Mazda Mazda3 109 151 -27.8 1.5% 1537 2.0%Toyota Aurion 107 23 365.2 1.4% 447 0.6%Holden Cruze 106 80 32.5 1.4% 1925 2.5%Hyundai Santa Fe 103 261 -60.5 1.4% 1847 2.4%Honda Civic 100 115 -13.0 1.3% 852 1.1%Mitsubishi Outlander 97 118 -17.8 1.3% 1258 1.7%Hyundai i30 95 103 -7.8 1.3% 1255 1.6%Nissan Qashqai 93 106 -12.3 1.2% 884 1.2%Toyota Landcruiser Prado 87 38 128.9 1.2% 557 0.7%Nissan x-Trail 86 52 65.4 1.2% 779 1.0%Ford Territory 83 137 -39.4 1.1% 1188 1.6%Volkswagen Tiguan 78 53 47.2 1.0% 689 0.9%Hyundai Accent 77 29 165.5 1.0% 572 0.8%Honda CRV 71 82 -13.4 1.0% 793 1.0%Mazda Mazda6 70 82 -14.6 0.9% 960 1.3%Mazda Mazda2 66 77 -14.3 0.9% 712 0.9%Ford Falcon 65 45 44.4 0.9% 835 1.1%Nissan Pathfinder 65 7 828.6 0.9% 191 0.3%Dodge Journey 64 46 39.1 0.9% 476 0.6%Jeep Grand Cherokee 64 39 64.1 0.9% 502 0.7%Ssangyong Korando 63 36 75.0 0.8% 480 0.6%Ford Fiesta 60 85 -29.4 0.8% 892 1.2%Bmw 116i 59 13 353.8 0.8% 378 0.5%Holden Malibu 58 - - 0.8% 334 0.4%Others2254 2130 5.8 30.2% 25936 34.1%total7453 6484 14.9 100.0% 76062 100.0%
Your fi rst choice in automotive lending.UDC Finance Limited lending criteria applies.
Ph 0800 500 832 or visit www.udc.co.nz
850 wds
5000
5500
6000
6500
7000
7500
8000
8500
Jan Feb Mar Apr May Jun Jul Aug Sep Oct Nov Dec
2012
2013
New Passenger registrations - 2012-2013
Subscribe - FREEgo to www.autofi le.co.nz/subscribe for the latest industry newsCONNECT & ENGAGE
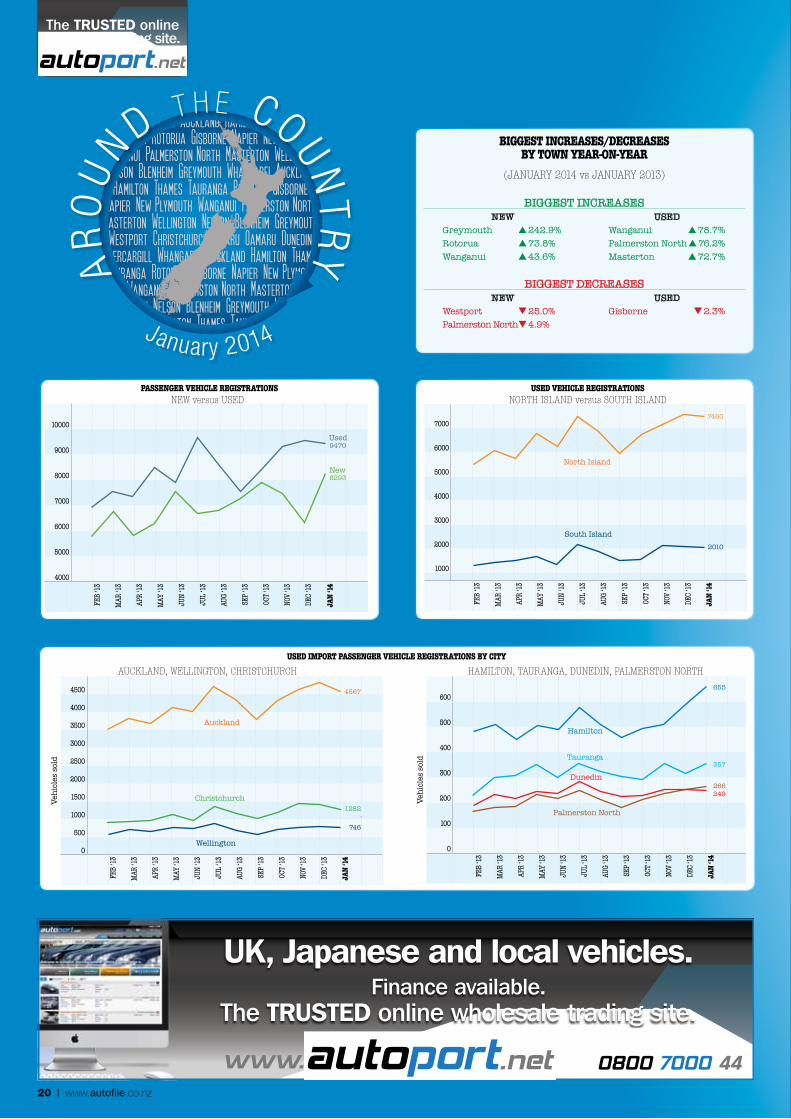
Whangarei Auckland Hamilton Thames Tauranga Rotorua Gisborne Napier New Plymouth Wanganui Palmerston North Masterton Wellington Nelson Blenheim Greymouth Whangarei Auckland Hamilton Thames Tauranga Rotorua Gisborne
Napier New Plymouth Wanganui Palmerston North Masterton Wellington Nelson Blenheim Greymouth Westport Christchurch Timaru Oamaru Dunedin
Invercargill Whangarei Auckland Hamilton Thames Tauranga Rotorua Gisborne Napier New Plymouth
Wanganui Palmerston North Masterton Wellington Nelson Blenheim Greymouth Whangarei Auckland Hamilton Thames Tauranga Rotorua
Ar
Ou
n d t h E c Ou nT
ry
January 2014
20 | www.autofile.co.nz
PHONE 0800 ARMACUP (276 2287) or 09 303 3314EMAIL [email protected]
www.armacup.com
YOUR FIRST CHOICE IN SHIPPING
TWO SAILINGS PER MONTH JAPAN TO NZ
Port CallsMorning Miracle
V7Liberty
V3Sepang Express
V12Morning Miracle
V8
Osaka 16 Feb 28 Feb 17 Mar 30 Mar
Nagoya 17 Feb 1 Mar 18 Mar 31 Mar
Yokohama 18 Feb 2 Mar 19 Mar 1 Apr
Auckland 8 Mar 19 Mar 7 Apr 16 Apr
Wellington 15 Mar 24 Mar 14 Apr 20 Apr
Lyttelton 22 Mar 22 Mar 19 Apr 19 Apr
LATEST SCHEDULE
PORT TO DOOR SERVICEINCLUDING:
NZ Customs clearance Odometer certifi cation Delivery Nationwide
MPI Border inspection Insurance
Digital Photography for prior sales in NZ
0800 7000 44autoport.netwww.
UK, Japanese and local vehicles.Finance available.
The TRUSTED online wholesale trading site.
Biggest increases/Decreases By town year-on-year
(January 2014 vs January 2013)
Biggest increases new Used
greymouth 242.9% wanganui 78.7% rotorua 73.8% Palmerston north 76.2% wanganui 43.6% Masterton 72.7%
Biggest decreases new Used
westport 25.0% gisborne 2.3% Palmerston north 4.9%
7000
6000
5000
4000
3000
2000
1000
Feb
‘13
Mar
‘13
aPr
‘13
May
‘13
Jun
‘13
JuL
‘13
auG
‘13
SeP ‘
13
Oct ‘
13
nOv
‘13
Dec
‘13
JAN
‘14
North Island
South Island
10000
9000
8000
7000
6000
5000
4000
Feb
‘13
Mar
‘13
aPr
‘13
May
‘13
Jun
‘13
JuL
‘13
a uG
‘13
SeP ‘
13
Oct ‘
13
nOv
‘13
Dec
‘13
JAN
‘14
Used
New8293
9470
2010
7460
Used Vehicle RegistRAtioNsNorth IslaNd versus south IslaNd
PAsseNgeR Vehicle RegistRAtioNsNew versus used
Vehi
cles
sol
d
4500
4000
3500
3000
2500
2000
1500
1000
500
0
Feb
‘13
Mar
‘13
aPr
‘13
May
‘13
Jun
‘13
JuL
‘13
auG
‘13
SeP ‘
13
Oct ‘
13
nOv
‘13
Dec
‘13
JAN
‘14
Auckland
Wellington
Vehi
cles
sol
d
600
500
400
300
200
100
0
Feb
‘13
Mar
‘13
aPr
‘13
May
‘13
Jun
‘13
JuL
‘13
auG
‘13
SeP ‘
13
Oct ‘
13
nOv
‘13
Dec
‘13
JAN
‘14
Hamilton
Tauranga
Palmerston North
Dunedin
Christchurch
4567 655
1282
357
746
249266
aucklaNd, wellINgtoN, chrIstchurch hamIltoN, tauraNga, duNedIN, PalmerstoN North Used imPoRt PAsseNgeR Vehicle RegistRAtioNs by city
autoport.net
The TRUSTED online wholesale trading site.
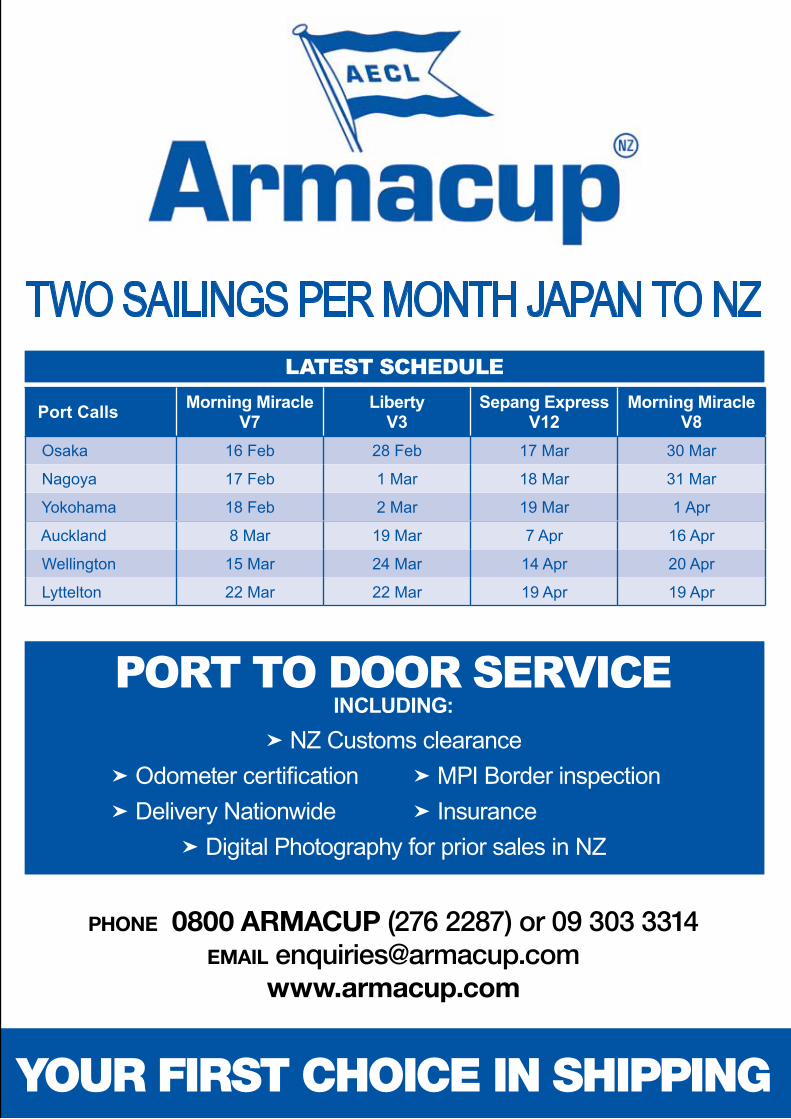
www.autofile.co.nz | 21
PHONE 0800 ARMACUP (276 2287) or 09 303 3314EMAIL [email protected]
www.armacup.com
YOUR FIRST CHOICE IN SHIPPING
TWO SAILINGS PER MONTH JAPAN TO NZ
Port CallsMorning Miracle
V7Liberty
V3Sepang Express
V12Morning Miracle
V8
Osaka 16 Feb 28 Feb 17 Mar 30 Mar
Nagoya 17 Feb 1 Mar 18 Mar 31 Mar
Yokohama 18 Feb 2 Mar 19 Mar 1 Apr
Auckland 8 Mar 19 Mar 7 Apr 16 Apr
Wellington 15 Mar 24 Mar 14 Apr 20 Apr
Lyttelton 22 Mar 22 Mar 19 Apr 19 Apr
LATEST SCHEDULE
PORT TO DOOR SERVICEINCLUDING:
NZ Customs clearance Odometer certifi cation Delivery Nationwide
MPI Border inspection Insurance
Digital Photography for prior sales in NZ
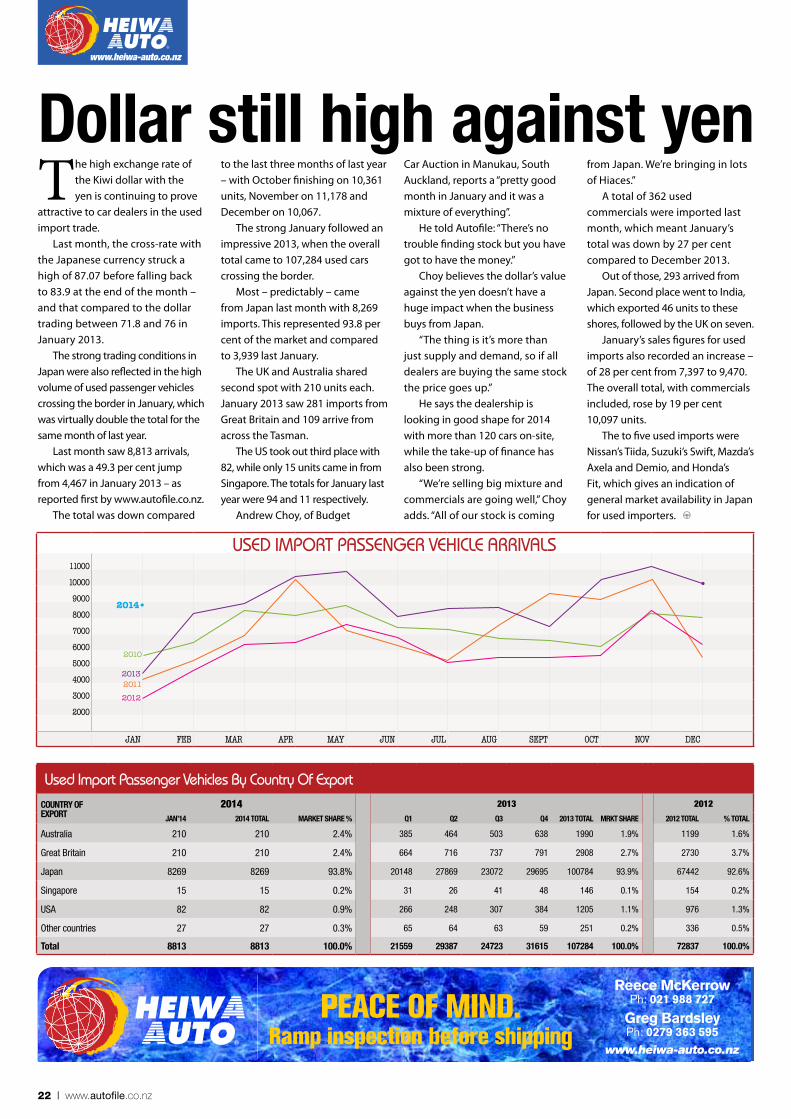
22 | www.autofile.co.nz
Dollar still high against yenThe high exchange rate of
the Kiwi dollar with the yen is continuing to prove
attractive to car dealers in the used import trade.
Last month, the cross-rate with the Japanese currency struck a high of 87.07 before falling back to 83.9 at the end of the month – and that compared to the dollar trading between 71.8 and 76 in January 2013.
The strong trading conditions in Japan were also reflected in the high volume of used passenger vehicles crossing the border in January, which was virtually double the total for the same month of last year.
Last month saw 8,813 arrivals, which was a 49.3 per cent jump from 4,467 in January 2013 – as reported first by www.autofile.co.nz.
The total was down compared
to the last three months of last year – with October finishing on 10,361 units, November on 11,178 and December on 10,067.
The strong January followed an impressive 2013, when the overall total came to 107,284 used cars crossing the border.
Most – predictably – came from Japan last month with 8,269 imports. This represented 93.8 per cent of the market and compared to 3,939 last January.
The UK and Australia shared second spot with 210 units each. January 2013 saw 281 imports from Great Britain and 109 arrive from across the Tasman.
The US took out third place with 82, while only 15 units came in from Singapore. The totals for January last year were 94 and 11 respectively.
Andrew Choy, of Budget
Car Auction in Manukau, South Auckland, reports a “pretty good month in January and it was a mixture of everything”.
He told Autofile: “There’s no trouble finding stock but you have got to have the money.”
Choy believes the dollar’s value against the yen doesn’t have a huge impact when the business buys from Japan.
“The thing is it’s more than just supply and demand, so if all dealers are buying the same stock the price goes up.”
He says the dealership is looking in good shape for 2014 with more than 120 cars on-site, while the take-up of finance has also been strong.
“We’re selling big mixture and commercials are going well,” Choy adds. “All of our stock is coming
from Japan. We’re bringing in lots of Hiaces.”
A total of 362 used commercials were imported last month, which meant January’s total was down by 27 per cent compared to December 2013.
Out of those, 293 arrived from Japan. Second place went to India, which exported 46 units to these shores, followed by the UK on seven.
January’s sales figures for used imports also recorded an increase – of 28 per cent from 7,397 to 9,470. The overall total, with commercials included, rose by 19 per cent 10,097 units.
The to five used imports were Nissan’s Tiida, Suzuki’s Swift, Mazda’s Axela and Demio, and Honda’s Fit, which gives an indication of general market availability in Japan for used importers.
www.heiwa-auto.co.nz
11000
10000
9000
8000
7000
6000
5000
4000
3000
2000
Jan Feb Mar aPr May Jun JuL auG SePt Oct nOv Dec
2011
2010
2012
Used import passenger VeHicle arriVals
PEACE OF MIND. Ramp inspection before shipping
Reece McKerrowPh: 021 988 727
Greg Bardsley Ph: 0279 363 595
www.heiwa-auto.co.nz
2013
2014
Used import passenger Vehicles By country of export CoUNTrY oF exPorT
2014 2013 2012
JaN’14 2014 ToTal MarkeT Share % Q1 Q2 Q3 Q4 2013 ToTal MrkT Share 2012 ToTal % ToTal
Australia 210 210 2.4% 385 464 503 638 1990 1.9% 1199 1.6%
Great Britain 210 210 2.4% 664 716 737 791 2908 2.7% 2730 3.7%
Japan 8269 8269 93.8% 20148 27869 23072 29695 100784 93.9% 67442 92.6%
Singapore 15 15 0.2% 31 26 41 48 146 0.1% 154 0.2%
USA 82 82 0.9% 266 248 307 384 1205 1.1% 976 1.3%
Other countries 27 27 0.3% 65 64 63 59 251 0.2% 336 0.5%
Total 8813 8813 100.0% 21559 29387 24723 31615 107284 100.0% 72837 100.0%
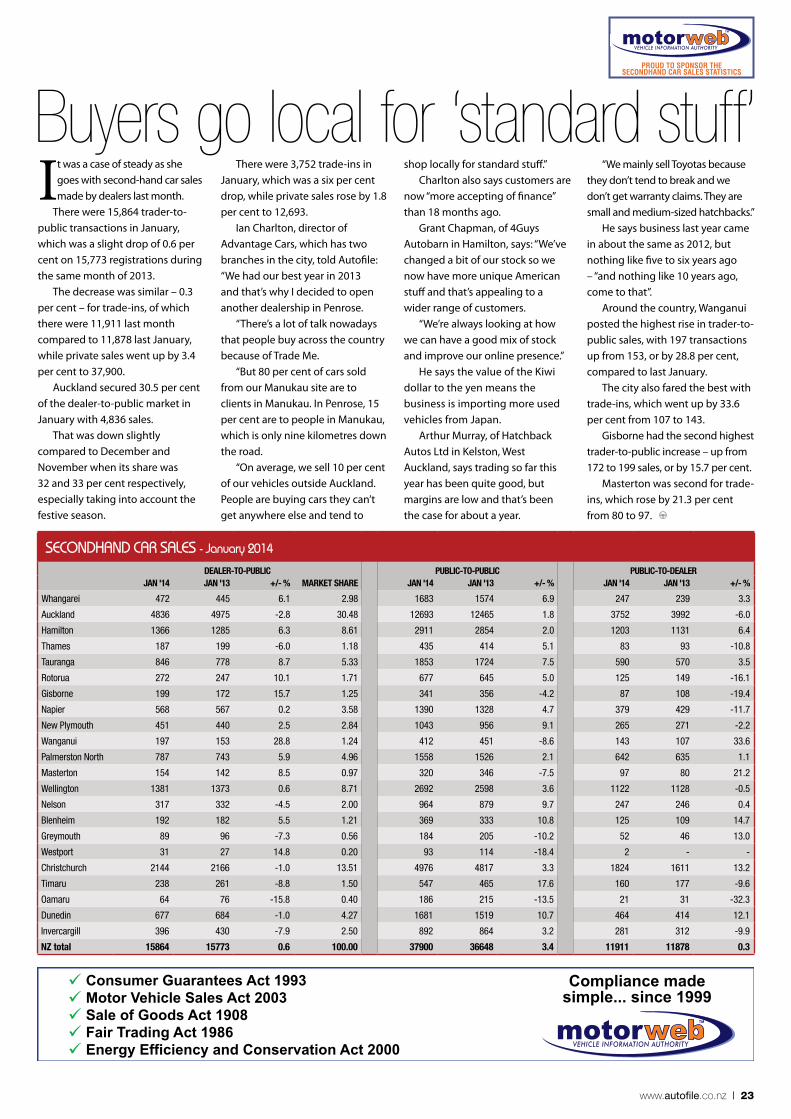
www.autofile.co.nz | 23
Buyers go local for ‘standard stuff’
secondHand car sales - January 2014
Dealer-To-PUblIC PUblIC-To-PUblIC PUblIC-To-DealerJaN '14 JaN '13 +/- % MarkeT Share JaN '14 JaN '13 +/- % JaN '14 JaN '13 +/- %
Whangarei 472 445 6.1 2.98 1683 1574 6.9 247 239 3.3
Auckland 4836 4975 -2.8 30.48 12693 12465 1.8 3752 3992 -6.0
Hamilton 1366 1285 6.3 8.61 2911 2854 2.0 1203 1131 6.4
Thames 187 199 -6.0 1.18 435 414 5.1 83 93 -10.8
Tauranga 846 778 8.7 5.33 1853 1724 7.5 590 570 3.5
Rotorua 272 247 10.1 1.71 677 645 5.0 125 149 -16.1
Gisborne 199 172 15.7 1.25 341 356 -4.2 87 108 -19.4
Napier 568 567 0.2 3.58 1390 1328 4.7 379 429 -11.7
New Plymouth 451 440 2.5 2.84 1043 956 9.1 265 271 -2.2
Wanganui 197 153 28.8 1.24 412 451 -8.6 143 107 33.6
Palmerston North 787 743 5.9 4.96 1558 1526 2.1 642 635 1.1
Masterton 154 142 8.5 0.97 320 346 -7.5 97 80 21.2
Wellington 1381 1373 0.6 8.71 2692 2598 3.6 1122 1128 -0.5
Nelson 317 332 -4.5 2.00 964 879 9.7 247 246 0.4
Blenheim 192 182 5.5 1.21 369 333 10.8 125 109 14.7
Greymouth 89 96 -7.3 0.56 184 205 -10.2 52 46 13.0
Westport 31 27 14.8 0.20 93 114 -18.4 2 - -
Christchurch 2144 2166 -1.0 13.51 4976 4817 3.3 1824 1611 13.2
Timaru 238 261 -8.8 1.50 547 465 17.6 160 177 -9.6
Oamaru 64 76 -15.8 0.40 186 215 -13.5 21 31 -32.3
Dunedin 677 684 -1.0 4.27 1681 1519 10.7 464 414 12.1
Invercargill 396 430 -7.9 2.50 892 864 3.2 281 312 -9.9
NZ total 15864 15773 0.6 100.00 37900 36648 3.4 11911 11878 0.3
Consumer Guarantees Act 1993 Motor Vehicle Sales Act 2003 Sale of Goods Act 1908 Fair Trading Act 1986 Energy Efficiency and Conservation Act 2000
Compliance made simple... since 1999
Proud to sPonsor the secondhand car sales statistics
It was a case of steady as she goes with second-hand car sales made by dealers last month.
There were 15,864 trader-to-public transactions in January, which was a slight drop of 0.6 per cent on 15,773 registrations during the same month of 2013.
The decrease was similar – 0.3 per cent – for trade-ins, of which there were 11,911 last month compared to 11,878 last January, while private sales went up by 3.4 per cent to 37,900.
Auckland secured 30.5 per cent of the dealer-to-public market in January with 4,836 sales.
That was down slightly compared to December and November when its share was 32 and 33 per cent respectively, especially taking into account the festive season.
There were 3,752 trade-ins in January, which was a six per cent drop, while private sales rose by 1.8 per cent to 12,693.
Ian Charlton, director of Advantage Cars, which has two branches in the city, told Autofile: “We had our best year in 2013 and that’s why I decided to open another dealership in Penrose.
“There’s a lot of talk nowadays that people buy across the country because of Trade Me.
“But 80 per cent of cars sold from our Manukau site are to clients in Manukau. In Penrose, 15 per cent are to people in Manukau, which is only nine kilometres down the road.
“On average, we sell 10 per cent of our vehicles outside Auckland. People are buying cars they can’t get anywhere else and tend to
shop locally for standard stuff.”Charlton also says customers are
now “more accepting of finance” than 18 months ago.
Grant Chapman, of 4Guys Autobarn in Hamilton, says: “We’ve changed a bit of our stock so we now have more unique American stuff and that’s appealing to a wider range of customers.
“We’re always looking at how we can have a good mix of stock and improve our online presence.”
He says the value of the Kiwi dollar to the yen means the business is importing more used vehicles from Japan.
Arthur Murray, of Hatchback Autos Ltd in Kelston, West Auckland, says trading so far this year has been quite good, but margins are low and that’s been the case for about a year.
“We mainly sell Toyotas because they don’t tend to break and we don’t get warranty claims. They are small and medium-sized hatchbacks.”
He says business last year came in about the same as 2012, but nothing like five to six years ago – “and nothing like 10 years ago, come to that”.
Around the country, Wanganui posted the highest rise in trader-to-public sales, with 197 transactions up from 153, or by 28.8 per cent, compared to last January.
The city also fared the best with trade-ins, which went up by 33.6 per cent from 107 to 143.
Gisborne had the second highest trader-to-public increase – up from 172 to 199 sales, or by 15.7 per cent.
Masterton was second for trade-ins, which rose by 21.3 per cent from 80 to 97.
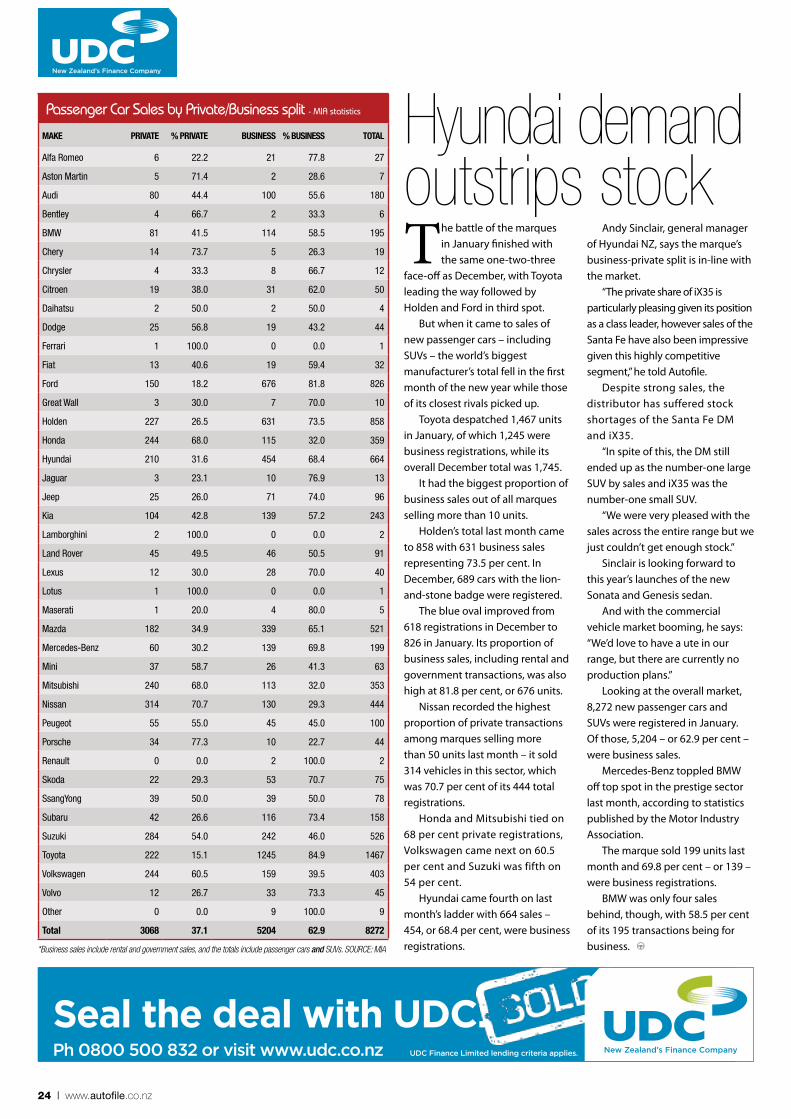
24 | www.autofile.co.nz
UDC Finance Limited lending criteria applies.
Seal the deal with UDC.Ph 0800 500 832 or visit www.udc.co.nz
Hyundai demand outstrips stockThe battle of the marques
in January finished with the same one-two-three
face-off as December, with Toyota leading the way followed by Holden and Ford in third spot.
But when it came to sales of new passenger cars – including SUVs – the world’s biggest manufacturer’s total fell in the first month of the new year while those of its closest rivals picked up.
Toyota despatched 1,467 units in January, of which 1,245 were business registrations, while its overall December total was 1,745.
It had the biggest proportion of business sales out of all marques selling more than 10 units.
Holden’s total last month came to 858 with 631 business sales representing 73.5 per cent. In December, 689 cars with the lion-and-stone badge were registered.
The blue oval improved from 618 registrations in December to 826 in January. Its proportion of business sales, including rental and government transactions, was also high at 81.8 per cent, or 676 units.
Nissan recorded the highest proportion of private transactions among marques selling more than 50 units last month – it sold 314 vehicles in this sector, which was 70.7 per cent of its 444 total registrations.
Honda and Mitsubishi tied on 68 per cent private registrations, Volkswagen came next on 60.5 per cent and Suzuki was fifth on 54 per cent.
Hyundai came fourth on last month’s ladder with 664 sales – 454, or 68.4 per cent, were business registrations.
Andy Sinclair, general manager of Hyundai NZ, says the marque’s business-private split is in-line with the market.
“The private share of iX35 is particularly pleasing given its position as a class leader, however sales of the Santa Fe have also been impressive given this highly competitive segment,” he told Autofile.
Despite strong sales, the distributor has suffered stock shortages of the Santa Fe DM and iX35.
“In spite of this, the DM still ended up as the number-one large SUV by sales and iX35 was the number-one small SUV.
“We were very pleased with the sales across the entire range but we just couldn’t get enough stock.”
Sinclair is looking forward to this year’s launches of the new Sonata and Genesis sedan.
And with the commercial vehicle market booming, he says: “We’d love to have a ute in our range, but there are currently no production plans.”
Looking at the overall market, 8,272 new passenger cars and SUVs were registered in January. Of those, 5,204 – or 62.9 per cent – were business sales.
Mercedes-Benz toppled BMW off top spot in the prestige sector last month, according to statistics published by the Motor Industry Association.
The marque sold 199 units last month and 69.8 per cent – or 139 – were business registrations.
BMW was only four sales behind, though, with 58.5 per cent of its 195 transactions being for business.
passenger car sales by private/Business split - mia statistics
Make PrIVaTe % PrIVaTe bUSINeSS % bUSINeSS ToTal
Alfa Romeo 6 22.2 21 77.8 27
Aston Martin 5 71.4 2 28.6 7
Audi 80 44.4 100 55.6 180
Bentley 4 66.7 2 33.3 6
BMW 81 41.5 114 58.5 195
Chery 14 73.7 5 26.3 19
Chrysler 4 33.3 8 66.7 12
Citroen 19 38.0 31 62.0 50
Daihatsu 2 50.0 2 50.0 4
Dodge 25 56.8 19 43.2 44
Ferrari 1 100.0 0 0.0 1
Fiat 13 40.6 19 59.4 32
Ford 150 18.2 676 81.8 826
Great Wall 3 30.0 7 70.0 10
Holden 227 26.5 631 73.5 858
Honda 244 68.0 115 32.0 359
Hyundai 210 31.6 454 68.4 664
Jaguar 3 23.1 10 76.9 13
Jeep 25 26.0 71 74.0 96
Kia 104 42.8 139 57.2 243
Lamborghini 2 100.0 0 0.0 2
Land Rover 45 49.5 46 50.5 91
Lexus 12 30.0 28 70.0 40
Lotus 1 100.0 0 0.0 1
Maserati 1 20.0 4 80.0 5
Mazda 182 34.9 339 65.1 521
Mercedes-Benz 60 30.2 139 69.8 199
Mini 37 58.7 26 41.3 63
Mitsubishi 240 68.0 113 32.0 353
Nissan 314 70.7 130 29.3 444
Peugeot 55 55.0 45 45.0 100
Porsche 34 77.3 10 22.7 44
Renault 0 0.0 2 100.0 2
Skoda 22 29.3 53 70.7 75
SsangYong 39 50.0 39 50.0 78
Subaru 42 26.6 116 73.4 158
Suzuki 284 54.0 242 46.0 526
Toyota 222 15.1 1245 84.9 1467
Volkswagen 244 60.5 159 39.5 403
Volvo 12 26.7 33 73.3 45
Other 0 0.0 9 100.0 9
Total 3068 37.1 5204 62.9 8272
*Business sales include rental and government sales, and the totals include passenger cars and SUVs. SOURCE: MIA
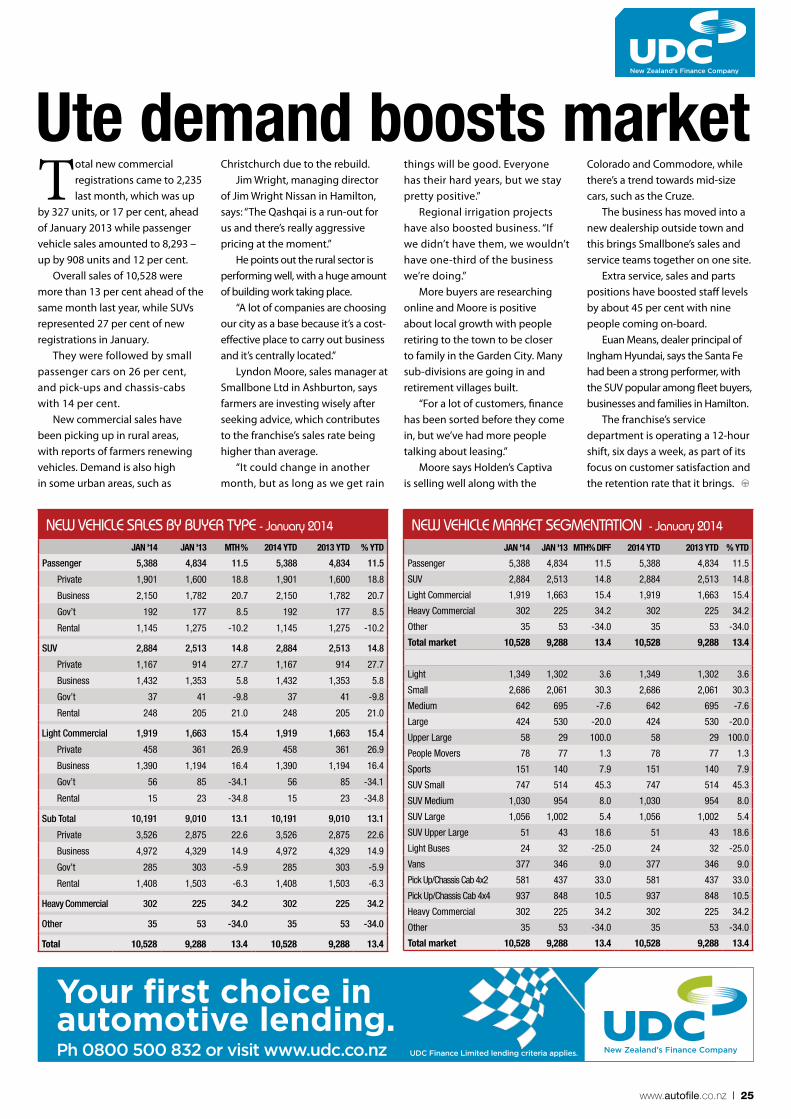
www.autofile.co.nz | 25
Your fi rst choice in automotive lending.
UDC Finance Limited lending criteria applies.Ph 0800 500 832 or visit www.udc.co.nz
neW VeHicle marKet segmentation - January 2014
JaN '14 JaN '13 MTh% DIFF 2014 YTD 2013 YTD % YTD
Passenger 5,388 4,834 11.5 5,388 4,834 11.5
SUV 2,884 2,513 14.8 2,884 2,513 14.8
Light Commercial 1,919 1,663 15.4 1,919 1,663 15.4
Heavy Commercial 302 225 34.2 302 225 34.2
Other 35 53 -34.0 35 53 -34.0
Total market 10,528 9,288 13.4 10,528 9,288 13.4
Light 1,349 1,302 3.6 1,349 1,302 3.6
Small 2,686 2,061 30.3 2,686 2,061 30.3
Medium 642 695 -7.6 642 695 -7.6
Large 424 530 -20.0 424 530 -20.0
Upper Large 58 29 100.0 58 29 100.0
People Movers 78 77 1.3 78 77 1.3
Sports 151 140 7.9 151 140 7.9
SUV Small 747 514 45.3 747 514 45.3
SUV Medium 1,030 954 8.0 1,030 954 8.0
SUV Large 1,056 1,002 5.4 1,056 1,002 5.4
SUV Upper Large 51 43 18.6 51 43 18.6
Light Buses 24 32 -25.0 24 32 -25.0
Vans 377 346 9.0 377 346 9.0
Pick Up/Chassis Cab 4x2 581 437 33.0 581 437 33.0
Pick Up/Chassis Cab 4x4 937 848 10.5 937 848 10.5
Heavy Commercial 302 225 34.2 302 225 34.2
Other 35 53 -34.0 35 53 -34.0
Total market 10,528 9,288 13.4 10,528 9,288 13.4
neW VeHicle sales BY BUYer tYpe - January 2014
JaN '14 JaN '13 MTh % 2014 YTD 2013 YTD % YTD
Passenger 5,388 4,834 11.5 5,388 4,834 11.5
Private 1,901 1,600 18.8 1,901 1,600 18.8
Business 2,150 1,782 20.7 2,150 1,782 20.7
Gov’t 192 177 8.5 192 177 8.5
Rental 1,145 1,275 -10.2 1,145 1,275 -10.2
SUV 2,884 2,513 14.8 2,884 2,513 14.8
Private 1,167 914 27.7 1,167 914 27.7
Business 1,432 1,353 5.8 1,432 1,353 5.8
Gov’t 37 41 -9.8 37 41 -9.8
Rental 248 205 21.0 248 205 21.0
Light Commercial 1,919 1,663 15.4 1,919 1,663 15.4
Private 458 361 26.9 458 361 26.9
Business 1,390 1,194 16.4 1,390 1,194 16.4
Gov’t 56 85 -34.1 56 85 -34.1
Rental 15 23 -34.8 15 23 -34.8
Sub Total 10,191 9,010 13.1 10,191 9,010 13.1
Private 3,526 2,875 22.6 3,526 2,875 22.6
Business 4,972 4,329 14.9 4,972 4,329 14.9
Gov’t 285 303 -5.9 285 303 -5.9
Rental 1,408 1,503 -6.3 1,408 1,503 -6.3
Heavy Commercial 302 225 34.2 302 225 34.2
Other 35 53 -34.0 35 53 -34.0
Total 10,528 9,288 13.4 10,528 9,288 13.4
Total new commercial registrations came to 2,235 last month, which was up
by 327 units, or 17 per cent, ahead of January 2013 while passenger vehicle sales amounted to 8,293 – up by 908 units and 12 per cent.
Overall sales of 10,528 were more than 13 per cent ahead of the same month last year, while SUVs represented 27 per cent of new registrations in January.
They were followed by small passenger cars on 26 per cent, and pick-ups and chassis-cabs with 14 per cent.
New commercial sales have been picking up in rural areas, with reports of farmers renewing vehicles. Demand is also high in some urban areas, such as
things will be good. Everyone has their hard years, but we stay pretty positive.”
Regional irrigation projects have also boosted business. “If we didn’t have them, we wouldn’t have one-third of the business we’re doing.”
More buyers are researching online and Moore is positive about local growth with people retiring to the town to be closer to family in the Garden City. Many sub-divisions are going in and retirement villages built.
“For a lot of customers, finance has been sorted before they come in, but we’ve had more people talking about leasing.”
Moore says Holden’s Captiva is selling well along with the
Ute demand boosts marketChristchurch due to the rebuild.
Jim Wright, managing director of Jim Wright Nissan in Hamilton, says: “The Qashqai is a run-out for us and there’s really aggressive pricing at the moment.”
He points out the rural sector is performing well, with a huge amount of building work taking place.
“A lot of companies are choosing our city as a base because it’s a cost-effective place to carry out business and it’s centrally located.”
Lyndon Moore, sales manager at Smallbone Ltd in Ashburton, says farmers are investing wisely after seeking advice, which contributes to the franchise’s sales rate being higher than average.
“It could change in another month, but as long as we get rain
Colorado and Commodore, while there’s a trend towards mid-size cars, such as the Cruze.
The business has moved into a new dealership outside town and this brings Smallbone’s sales and service teams together on one site.
Extra service, sales and parts positions have boosted staff levels by about 45 per cent with nine people coming on-board.
Euan Means, dealer principal of Ingham Hyundai, says the Santa Fe had been a strong performer, with the SUV popular among fleet buyers, businesses and families in Hamilton.
The franchise’s service department is operating a 12-hour shift, six days a week, as part of its focus on customer satisfaction and the retention rate that it brings.
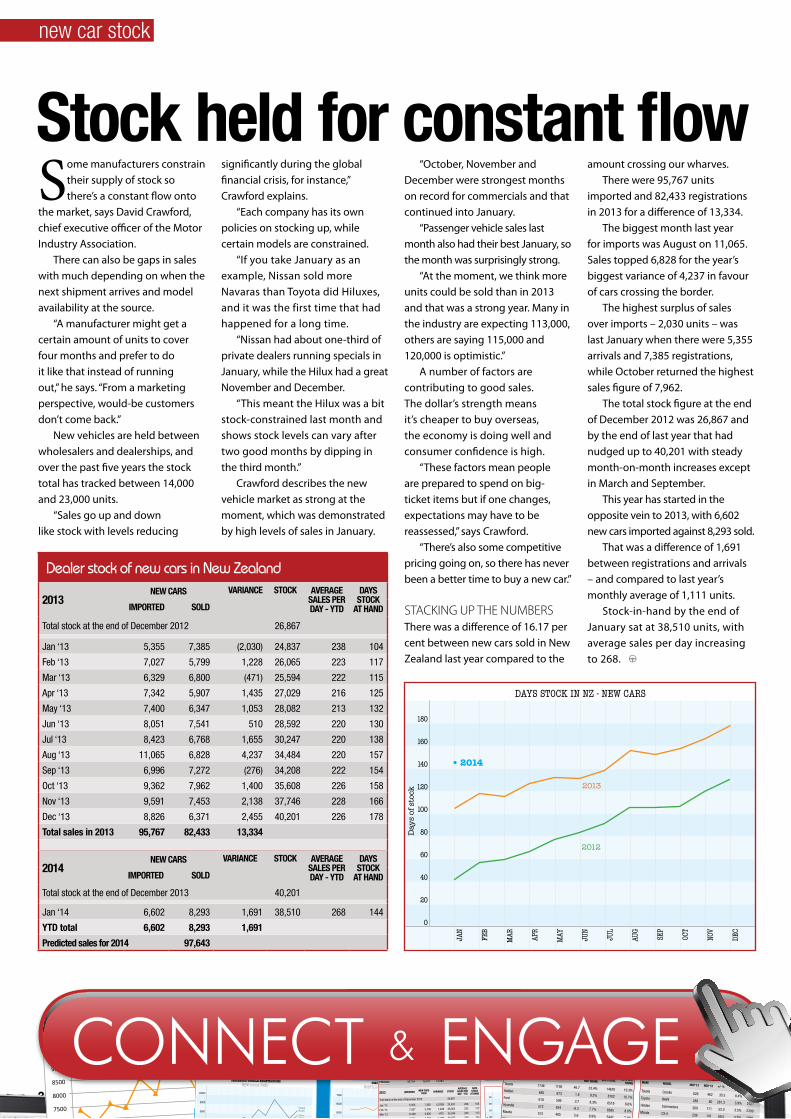
26 | www.autofile.co.nz
dealer stock of new cars in new Zealand
2013New CarS VarIaNCe SToCk aVeraGe
SaleS Per DaY - YTD
DaYS SToCk
aT haNDIMPorTeD SolD
Total stock at the end of December 2012 26,867
Jan ‘13 5,355 7,385 (2,030) 24,837 238 104
Feb ‘13 7,027 5,799 1,228 26,065 223 117
Mar ‘13 6,329 6,800 (471) 25,594 222 115
Apr ‘13 7,342 5,907 1,435 27,029 216 125
May ‘13 7,400 6,347 1,053 28,082 213 132
Jun ‘13 8,051 7,541 510 28,592 220 130
Jul ‘13 8,423 6,768 1,655 30,247 220 138
Aug ‘13 11,065 6,828 4,237 34,484 220 157
Sep ‘13 6,996 7,272 (276) 34,208 222 154
Oct ‘13 9,362 7,962 1,400 35,608 226 158
Nov ‘13 9,591 7,453 2,138 37,746 228 166
Dec ‘13 8,826 6,371 2,455 40,201 226 178
Total sales in 2013 95,767 82,433 13,334
2014New CarS VarIaNCe SToCk aVeraGe
SaleS Per DaY - YTD
DaYS SToCk
aT haNDIMPorTeD SolD
Total stock at the end of December 2013 40,201
Jan ‘14 6,602 8,293 1,691 38,510 268 144
YTD total 6,602 8,293 1,691
Predicted sales for 2014 97,643
5500
6000
6500
7000
7500
8000
8500
9000
9500
10000
Jan Feb Mar Apr May Jun Jul Aug Sep Oct Nov Dec
2013
2012
Whangarei Auckland Hamilton Thames Tauranga Rotorua Gisborne Napier New Plymouth Wanganui Palmerston North Masterton Wellington Nelson Blenheim Greymouth Whangarei Auckland Hamilton Thames Tauranga Rotorua Gisborne
Napier New Plymouth Wanganui Palmerston North Masterton Wellington Nelson Blenheim Greymouth Westport Christchurch Timaru Oamaru Dunedin
Invercargill Whangarei Auckland Hamilton Thames Tauranga Rotorua Gisborne Napier New Plymouth
Wanganui Palmerston North Masterton Wellington Nelson Blenheim Greymouth Whangarei Auckland Hamilton Thames Tauranga Rotorua
Ar
ou
n d t h e c ou nt
ry
20 | www.autofile.co.nz
0800 7000 44autoport.netwww.
UK, Japanese and local vehicles.Finance available.
The TRUSTED online wholesale trading site.
PHONE 0800 ARMACUP (276 2287) or 09 303 3314EMAIL [email protected]
www.armacup.com
YOUR FIRST CHOICE IN SHIPPING
TWO SAILINGS PER MONTH JAPAN TO NZ
Port Calls Hoegh Xiamen V20
Sepang Express V9
Morning Miracle V5
Liberty V1
Osaka 20 Oct 30 Oct 15 Nov 29 Nov Nagoya 21 Oct 31 Oct 16 Nov 30 Nov Yokohama 22 Oct 1 Nov 17 Nov 1 Dec Auckland 7 Nov 17 Nov 4 Dec 19 Dec Wellington 13 Nov 23 Nov 11 Dec 26 Dec Lyttelton 16 Nov 29 Nov 11 Dec 29 Dec
LATEST SCHEDULE
PORT TO DOOR SERVICEINCLUDING: MPI Border inspection Odometer certifi cation Digital Photography for prior sales in NZ NZ Customs clearance Delivery Nationwide Insurance
GENEROUS REWARDS PROGRAMMEShip your motor vehicles on Armacup vessels and you can earn seamiles points for air travel (only applicable to used imports)
Biggest increases/Decreases By town year-on-year
(OctOber 2013 vs OctOber 2012)
Biggest increases new Used
westport 100.0% Blenheim 95.5% thames 51.2% nelson 64.9% napier 34.1% rotorua 52.0%
Biggest decreases new Used
wanganui 27.7% westport 41.7% gisborne 26.8% Masterton 20.0% timaru 23.7% timaru 12.4%
7000
6000
5000
4000
3000
2000
1000
Nov
‘12
DEC
‘12
JAN
‘13
FEb
‘13
MAr
‘13
APr
‘13
MAy
‘13
JuN
‘13
JuL
‘13
AuG
‘13
SEP ‘
13
Oct
‘13
North Island
South Island
10000
9000
8000
7000
6000
5000
4000
Nov
‘12
DEC
‘12
JAN
‘13
FEb
‘13
MAr
‘13
APr
‘13
MAy
‘13
JuN
‘13
JuL
‘13
AuG
‘13
SEP ‘
13
Oct
‘13
Used
New7962
8545
1805
6740
Used Vehicle RegistRatiOnsNorth IslaNd versus south IslaNd
PassengeR Vehicle RegistRatiOnsNew versus used
Vehi
cles
sol
d
4500
4000
3500
3000
2500
2000
1500
1000
500
0
Nov
‘12
DEC
‘12
JAN
‘13
FEb
‘13
MAr
‘13
APr
‘13
MAy
‘13
JuN
‘13
JuL
‘13
AuG
‘13
SEP ‘
13
Oct
‘13
Auckland
Wellington
Vehi
cles
sol
d600
500
400
300
200
100
0
Nov
‘12
DEC
‘12
JAN
‘13
FEb
‘13
MAr
‘13
APr
‘13
MAy
‘13
JuN
‘13
JuL
‘13
AuG
‘13
SEP ‘
13
Oct
‘13
Hamilton
Tauranga
Palmerston Nth
DunedinChristchurch
4320
495
1185
290
729
229
216
aucklaNd, wellINgtoN, chrIstchurch hamIltoN, tauraNga, duNedIN, PalmerstoN North
Used imPORt PassengeR Vehicle RegistRatiOns by city
october 2013
autoport.net
The TRUSTED online wholesale trading site.
26 | www.autofile.co.nz
www.autofile.co.nz | 27
Annual high for stockpileThe amount of stock held
by used car dealers during
October was the highest
monthly total of the year.
There were 10,374 units
imported last month with a
variance of 1,829 on 8,545 sales.
The number of cars in stock
amounted to 9,323 compared to
7,494 in September.
There have been two other
major increases during 2013 – with
variances between imports and sales
of 3,121 in April and 2,507 in May.
Graeme Macdonald, chairman
of the North Island branch of the
Imported Motor Vehicle Industry
Association, says the current
stockpile should correct itself – as it
normally does.“If the monthly stockpile was
10,000 on a regular basis it means
there are solid holding numbers,”
he told Autofile. “North of that
and we would be looking at an
oversupply issue.
“There was good buying in Japan
in March, and we saw high arrival
numbers in April, May and June.
“The stockpile occurs more at
certain times of the year. Since
I came back into the industry in
1996, it has ebbed and flowed.”
Used car stock levels are
traditionally based on what’s
happening in Japan and what
consumers are buying here.
Conditions there have improved
recently and the exchange rate
has gone up.“October and November are
normally difficult for the industry,
so the stockpile tends to go
up,” says Macdonald. “But trade
swings up over Christmas and the
holidays, so it goes down.
“December and January are
good months for sales because
people take time off work, the kids
are off school and people may have
Christmas bonuses or holiday pay.
“It’s a time when Kiwis tend to
make financial decisions, so dealers
need to have plenty of stock to
match demand.“When the market’s down in
Japan, stock is hard to get. When
it’s buoyant, you tend to buy what
you can because you don’t know
what will be available next time.
“Dealers also need to bear in
mind it takes four to six weeks to
get stock from Japan.”
Larger operations, of say 300
units, are more static with their
holding not changing too much.
A drop of 50 units may not be
too drastic. But stock can vary
enormously by proportion on yards
with 30 to 40 cars.
“They can suddenly be selling
without having bought for a few
weeks and being 10-15 units down
makes them more susceptible,”
says Macdonald.
“Dealers then jump online to
buy more from Japan, but that’s
always been the way.
“You can oversupply when
buying conditions are good, but
the marketplace normally corrects
itself by pulling back from Japan or
selling down. The numbers might
drop for a month or two before
trundling up again.
“There’s no magic supply-chain
miracle. When it’s slow, it tends to be
slow for everybody. If you can get
good supply with a good exchange
rate, everyone benefits.”
did come down after the global
financial crisis [GFC].
“Stocking levels then increased
again and they respond to the
number of new vehicles sold and
the rate at which they are sold.
“They basically go up when
sales go up, but I’m not so sure
about the days stock is held for
being longer and can’t explain that.
“Average sales per day came
down during the GFC and before
that they were much higher.”
If 80,000 vehicles are sold one
year and 100,000 are sold the
following year, the average sales
per day should be higher – and
the MIA is expecting more new
vehicles to be sold this year than
during 2012.There were 54,404 sales in 2009,
62,029 in 2010, 64,019 in 2011
and 76,871 in 2012, and the MIA is
predicting about 82,000 passenger
vehicle and SUV sales this year.
“We’re looking at about 30,600
light commercials and we’re on
track for 112,000 or 113,000 new
vehicle sales overall.”
Business confidence being
high and strong regional
economies in Auckland and
Christchurch are boosting sales.
“Trades people are upgrading
their vehicles,” says Crawford.
“Although passenger cars aren’t so
hot, SUVs are.“People in the housing market
are refinancing their mortgages
to buy big-ticket items especially
when they are confident about
keeping their jobs.”
All that said, some of the
regional centres, such as Hawke’s
Bay and Palmerston North, aren’t
showing as much growth as
other centres.“But 80 per cent of New Zealand’s
population is in Auckland and
Christchurch. “If you add in Dunedin and
Wellington, these centres cover a
large proportion of the population
and all have strong economies.”
Year to date, 77,438 new cars
have been imported and 68,612
have been registered to give a
variance of 8,826 so far this year.
Days with stock at hand has
been steadily increasing from 78 in
January to 131 in October.
Last year 90,754 units were
imported and there were 76,871
sales for a variance of 13,883.
Stock levels of new cars have
increased every month
except one this year, with
October’s total of 29,509 being the
highest of 2013.There were 7,962 sales last
month, also this year’s biggest
amount, while the variance was
1,400 with 9,362 units imported –
the second highest amount after
11,065 imports in August.
The total stock figure at the
end of December was 20,683 and
that dropped to this year’s low of
18,653 in January.
David Crawford, chief executive
officer of the Motor Industry
Association (MIA), says current
models aren’t sitting around in
stock for too long.
“The industry tends to manage
stock levels quite well and does this
day in, day out,” he told Autofile.
“My data suggests this is a
cyclical thing and levels were no
higher in previous years, but they
Industry manages levels well
Dealer stock of new cars in New Zealand - Oct 2013
2012 Imported NeW CArS SoLd VArIANCe StoCk
AVerAge SALeS per dAy - ytd
dAyS StoCk
At hANd
MIA stock estimate as at end of December 2011 12,984
Jan ‘12 5,026 7,499 (2,473) 10,511 242 43
Feb ‘12 7,368 5,633 1,735 12,246 223 55
Mar ‘12 7,228 6,499 729 12,975 218 59
Apr ‘12 6,285 5,430 855 13,830 209 66
May ‘12 7,742 5,942 1,800 15,630 205 76
Jun ‘12 8,870 7,142 1,728 17,358 211 82
Jul ‘12 7,894 6,208 1,686 19,044 209 91
Aug ‘12 8,589 5,959 2,630 21,674 207 105
Sep ‘12 6,828 6,637 191 21,865 209 105
Oct ‘12 8,155 7,336 819 22,684 211 107
Nov ‘12 8,953 6,484 2,469 25,153 212 119
Dec ‘12 7,816 6,102 1,714 26,867 211 128
ytd total 90,754 76,871 13,883
2013 Imported NeW CArS SoLd VArIANCe StoCk
AVerAge SALeS per dAy - ytd
dAyS StoCk
At hANd
Total stock at the end of December 2012 26,867
Jan ‘13 5,355 7,385 (2,030) 24,837 238 104
Feb ‘13 7,027 5,799 1,228 26,065 223 117
Mar ‘13 6,329 6,800 (471) 25,594 222 115
Apr ‘13 7,391 5,908 1,483 27,077 216 125
May ‘13 7,429 6,347 1,082 28,159 214 132
Jun ‘13 8,051 7,542 509 28,668 220 130
Jul ‘13 8,423 6,769 1,654 30,322 220 138
Aug ‘13 11,065 6,828 4,237 34,559 220 157
Sep ‘13 7,006 7,272 (266) 34,293 222 154
Oct ‘13 9,362 7,962 1,400 35,693 226 158
Nov ‘13 - - - - - -
Dec ‘13 - - - - - -
ytd total 77,438 68,612 8,826
2013 predicted sales 82,380
Dealer stock of used car imports in New Zealand - Oct 2013
2012 Imported USed ImportS SoLd VArIANCe StoCk
AVerAge SALeS per dAy - ytd
dAyS StoCk
At hANd
Total stock at the end of December 2011 8,579
Jan ‘12 3,191 6,375 (3,184) 5,395 206 26
Feb ‘12 4,920 6,000 (1,080) 4,315 210 21
Mar ‘12 6,504 6,429 75 4,390 209 21
Apr ‘12 6,613 5,877 736 5,126 206 25
May ‘12 7,693 6,793 900 6,026 208 29
Jun ‘12 6,947 6,184 763 6,789 208 33
Jul ‘12 5,335 6,641 (1,306) 5,483 209 26
Aug ‘12 5,540 6,621 (1,081) 4,402 210 21
Sep ‘12 5,506 6,222 (716) 3,686 209 18
Oct ‘12 5,688 6,867 (1,179) 2,507 211 12
Nov ‘12 8,486 7,183 1,303 3,810 213 18
Dec ‘12 6,414 7,119 (705) 3,105 215 14
ytd total 72,837 78,311 (5,474)
2013 Imported USed ImportS SoLd VArIANCe StoCk
AVerAge SALeS per dAy - ytd
dAyS StoCk
At hANd
Total stock at the end of December 2012 3105
Jan ‘13 4,468 7,397 (2,929) 176 239 0.7
Feb ‘13 8,247 6,922 1,325 1,501 243 6
Mar ‘13 8,852 7,581 1,271 2,772 243 11
Apr ‘13 10,539 7,418 3,121 5,893 244 24
May ‘13 10,967 8,460 2,507 8,400 250 34
Jun ‘13 8,089 7,862 227 8,627 252 34
Jul ‘13 8,623 9,629 (1,006) 7,621 261 29
Aug ‘13 8,635 8,648 (13) 7,608 263 29
Sep ‘13 7,501 7,615 (114) 7,494 262 29
Oct ‘13 10,374 8,545 1,829 9,323 263 35
Nov ‘13 - - - - - -
Dec ‘13 - - - - - -
ytd total 86,295 80,077 6,218
2013 predicted sales 96,145
xxxxxxxxxxxxxxxxxxxx
Days stock in nZ - UseD import cars
180
160
140
120
100
80
60
40
20
0
Jan
Feb
mar
apr
may
JUn
JUL
aUG
sep
oct
nov
Dec
2013
2012
Days stock in nZ - new cars
180
160
140
120
100
80
60
40
20
0
Jan
Feb
mar
apr
may
JUn
JUL
aUG
sep
oct
nov
Dec
2013
2012
Day
s of
sto
ck
Day
s of
sto
ck
SPONSORSHIP OF THE NEW AND USED COMMERCIAL STATISTICS
PAGES IS NOW AVAILABLE FOR YOUR BUSINESSTARGETED ADVERTISING SPACE
SHOULDN’T WE BE LOOKING AT YOUR BUSINESS? For all enquiries contact Brian on 021 455 775 or email brian@autofi le.co.nz
34 | www.autofile.co.nz
www.autofile.co.nz | 35
UDC Finance Limited lending criteria applies.Seal the deal with UDC.Ph 0800 500 832 or visit www.udc.co.nz
New Passenger Vehicle Sales by Make - November 2013
Make Nov '13 Nov '12 +/- % Nov '13
Mkt Share2013 total
2013 Mkt Share
Toyota 1746 1190 46.7 23.4% 14670 19.3%
Holden 685 673 1.8 9.2% 8102 10.7%
Ford 618 596 3.7 8.3% 6519 8.6%
Hyundai 572 624 -8.3 7.7% 6695 8.8%
Mazda 512 485 5.6 6.9% 5447 7.2%
Nissan 382 281 35.9 5.1% 3342 4.4%
Suzuki 376 405 -7.2 5.0% 4436 5.8%
Mitsubishi 351 272 29.0 4.7% 3661 4.8%
Honda 310 312 -0.6 4.2% 2994 3.9%
Volkswagen 288 261 10.3 3.9% 3527 4.6%
Kia 202 240 -15.8 2.7% 2563 3.4%
BMw 172 178 -3.4 2.3% 1861 2.4%
Subaru 165 153 7.8 2.2% 1645 2.2%
Audi 163 150 8.7 2.2% 1748 2.3%
Mercedes-Benz 128 82 56.1 1.7% 1398 1.8%
Peugeot 108 60 80.0 1.4% 1001 1.3%
Jeep 92 65 41.5 1.2% 775 1.0%
Ssangyong 86 49 75.5 1.2% 724 1.0%
Dodge 64 46 39.1 0.9% 478 0.6%
Skoda 63 56 12.5 0.8% 654 0.9%
Lexus 54 44 22.7 0.7% 508 0.7%
Land Rover 51 22 131.8 0.7% 443 0.6%
Mini 44 43 2.3 0.6% 474 0.6%
Chery 34 21 61.9 0.5% 351 0.5%
Alfa Romeo 24 31 -22.6 0.3% 182 0.2%
Great wall 23 38 -39.5 0.3% 211 0.3%
Fiat 21 2 950.0 0.3% 142 0.2%
Renault 21 8 162.5 0.3% 98 0.1%
Volvo 18 19 -5.3 0.2% 229 0.3%
Porsche 13 11 18.2 0.2% 182 0.2%
Citroen 12 16 -25.0 0.2% 286 0.4%
Jaguar 12 5 140.0 0.2% 128 0.2%
Chrysler 10 13 -23.1 0.1% 120 0.2%
Can-Am 9 6 50.0 0.1% 75 0.1%
Daihatsu 6 19 -68.4 0.1% 258 0.3%
Aston Martin 4 1 300.0 0.1% 25 0.0%
Maserati 4 2 100.0 0.1% 14 0.0%
Mahindra 3 - - 0.0% 6 0.0%
MG 2 0 200.0 0.0% 12 0.0%
Chrysler Jeep 1 - - 0.0% 1 0.0%
Mclaren 1 0 100.0 0.0% 6 0.0%
Others 3 5 -40.0 0.0% 71 0.1%
total 7453 6484 14.9 100.0% 76062 100.0%
New Passenger Vehicle Sales by Model - November 2013
Make Model Nov '13 Nov '12 +/- %Nov Mkt
Share2013
total2013 Mkt
Share
Toyota Corolla 626 462 35.5 8.4% 5283 6.9%
Toyota RAV4 289 80 261.3 3.9% 2521 3.3%
Holden Commodore 260 171 52.0 3.5% 2399 3.2%
Mazda Cx-5 239 141 69.5 3.2% 1989 2.6%
Toyota yaris 227 267 -15.0 3.0% 2235 2.9%
Suzuki Swift 218 254 -14.2 2.9% 2750 3.6%
Ford Mondeo 184 98 87.8 2.5% 1201 1.6%
Hyundai ix35 168 81 107.4 2.3% 1338 1.8%
Mitsubishi Lancer 168 84 100.0 2.3% 894 1.2%
Toyota Camry 168 131 28.2 2.3% 1270 1.7%
Holden Captiva 135 319 -57.7 1.8% 2039 2.7%
Volkswagen Golf 134 103 30.1 1.8% 1469 1.9%
Toyota Highlander 118 79 49.4 1.6% 1092 1.4%
Ford Focus 114 212 -46.2 1.5% 1429 1.9%
Honda Jazz 113 76 48.7 1.5% 922 1.2%
Ford Kuga 112 18 522.2 1.5% 952 1.3%
Mazda Mazda3 109 151 -27.8 1.5% 1537 2.0%
Toyota Aurion 107 23 365.2 1.4% 447 0.6%
Holden Cruze 106 80 32.5 1.4% 1925 2.5%
Hyundai Santa Fe 103 261 -60.5 1.4% 1847 2.4%
Honda Civic 100 115 -13.0 1.3% 852 1.1%
Mitsubishi Outlander 97 118 -17.8 1.3% 1258 1.7%
Hyundai i30 95 103 -7.8 1.3% 1255 1.6%
Nissan Qashqai 93 106 -12.3 1.2% 884 1.2%
Toyota Landcruiser Prado 87 38 128.9 1.2% 557 0.7%
Nissan x-Trail 86 52 65.4 1.2% 779 1.0%
Ford Territory 83 137 -39.4 1.1% 1188 1.6%
Volkswagen Tiguan 78 53 47.2 1.0% 689 0.9%
Hyundai Accent 77 29 165.5 1.0% 572 0.8%
Honda CRV 71 82 -13.4 1.0% 793 1.0%
Mazda Mazda6 70 82 -14.6 0.9% 960 1.3%
Mazda Mazda2 66 77 -14.3 0.9% 712 0.9%
Ford Falcon 65 45 44.4 0.9% 835 1.1%
Nissan Pathfinder 65 7 828.6 0.9% 191 0.3%
Dodge Journey 64 46 39.1 0.9% 476 0.6%
Jeep Grand Cherokee 64 39 64.1 0.9% 502 0.7%
Ssangyong Korando 63 36 75.0 0.8% 480 0.6%
Ford Fiesta 60 85 -29.4 0.8% 892 1.2%
Bmw 116i 59 13 353.8 0.8% 378 0.5%
Holden Malibu 58 - - 0.8% 334 0.4%
Others2254 2130 5.8 30.2% 25936 34.1%
total7453 6484 14.9 100.0% 76062 100.0%
Your fi rst choice in automotive lending.
UDC Finance Limited lending criteria applies.
Ph 0800 500 832 or visit www.udc.co.nz
850 wds
5000
5500
6000
6500
7000
7500
8000
8500
Jan Feb Mar Apr May Jun Jul Aug Sep Oct Nov Dec
2012
2013
New Passenger registrations - 2012-2013
5500
6000
6500
7000
7500
8000
8500
9000
9500
10000
Jan Feb Mar Apr May Jun Jul Aug Sep Oct Nov Dec
2013
2012
Whangarei Auckland Hamilton Thames Tauranga Rotorua Gisborne Napier New Plymouth Wanganui Palmerston North Masterton Wellington Nelson Blenheim Greymouth Whangarei Auckland Hamilton Thames Tauranga Rotorua Gisborne
Napier New Plymouth Wanganui Palmerston North Masterton Wellington Nelson Blenheim Greymouth Westport Christchurch Timaru Oamaru Dunedin
Invercargill Whangarei Auckland Hamilton Thames Tauranga Rotorua Gisborne Napier New Plymouth
Wanganui Palmerston North Masterton Wellington Nelson Blenheim Greymouth Whangarei Auckland Hamilton Thames Tauranga Rotorua
Ar
ou
n d t h e c ou nt
ry
20 | www.autofile.co.nz
0800 7000 44autoport.netwww.
UK, Japanese and local vehicles.Finance available.
The TRUSTED online wholesale trading site.
PHONE 0800 ARMACUP (276 2287) or 09 303 3314EMAIL [email protected]
www.armacup.com
YOUR FIRST CHOICE IN SHIPPING
TWO SAILINGS PER MONTH JAPAN TO NZ
Port Calls Hoegh Xiamen V20
Sepang Express V9
Morning Miracle V5
Liberty V1
Osaka 20 Oct 30 Oct 15 Nov 29 Nov Nagoya 21 Oct 31 Oct 16 Nov 30 Nov Yokohama 22 Oct 1 Nov 17 Nov 1 Dec Auckland 7 Nov 17 Nov 4 Dec 19 Dec Wellington 13 Nov 23 Nov 11 Dec 26 Dec Lyttelton 16 Nov 29 Nov 11 Dec 29 Dec
LATEST SCHEDULE
PORT TO DOOR SERVICEINCLUDING: MPI Border inspection Odometer certifi cation Digital Photography for prior sales in NZ NZ Customs clearance Delivery Nationwide Insurance
GENEROUS REWARDS PROGRAMMEShip your motor vehicles on Armacup vessels and you can earn seamiles points for air travel (only applicable to used imports)
Biggest increases/Decreases By town year-on-year
(OctOber 2013 vs OctOber 2012)
Biggest increases new Used
westport 100.0% Blenheim 95.5% thames 51.2% nelson 64.9% napier 34.1% rotorua 52.0%
Biggest decreases new Used
wanganui 27.7% westport 41.7% gisborne 26.8% Masterton 20.0% timaru 23.7% timaru 12.4%
7000
6000
5000
4000
3000
2000
1000
Nov
‘12
DEC
‘12
JAN
‘13
FEb
‘13
MAr
‘13
APr
‘13
MAy
‘13
JuN
‘13
JuL
‘13
AuG
‘13
SEP ‘
13
Oct
‘13
North Island
South Island
10000
9000
8000
7000
6000
5000
4000
Nov
‘12
DEC
‘12
JAN
‘13
FEb
‘13
MAr
‘13
APr
‘13
MAy
‘13
JuN
‘13
JuL
‘13
AuG
‘13
SEP ‘
13
Oct
‘13
Used
New7962
8545
1805
6740
Used Vehicle RegistRatiOnsNorth IslaNd versus south IslaNd
PassengeR Vehicle RegistRatiOnsNew versus used
Vehi
cles
sol
d
4500
4000
3500
3000
2500
2000
1500
1000
500
0
Nov
‘12
DEC
‘12
JAN
‘13
FEb
‘13
MAr
‘13
APr
‘13
MAy
‘13
JuN
‘13
JuL
‘13
AuG
‘13
SEP ‘
13
Oct
‘13
Auckland
Wellington
Vehi
cles
sol
d
600
500
400
300
200
100
0
Nov
‘12
DEC
‘12
JAN
‘13
FEb
‘13
MAr
‘13
APr
‘13
MAy
‘13
JuN
‘13
JuL
‘13
AuG
‘13
SEP ‘
13
Oct
‘13
Hamilton
Tauranga
Palmerston Nth
DunedinChristchurch
4320
495
1185
290
729
229
216
aucklaNd, wellINgtoN, chrIstchurch hamIltoN, tauraNga, duNedIN, PalmerstoN North
Used imPORt PassengeR Vehicle RegistRatiOns by city
october 2013
autoport.net
The TRUSTED online wholesale trading site.
26 | www.autofile.co.nz
www.autofile.co.nz | 27
Annual high for stockpileThe amount of stock held
by used car dealers during
October was the highest
monthly total of the year.
There were 10,374 units
imported last month with a
variance of 1,829 on 8,545 sales.
The number of cars in stock
amounted to 9,323 compared to
7,494 in September.
There have been two other
major increases during 2013 – with
variances between imports and sales
of 3,121 in April and 2,507 in May.
Graeme Macdonald, chairman
of the North Island branch of the
Imported Motor Vehicle Industry
Association, says the current
stockpile should correct itself – as it
normally does.“If the monthly stockpile was
10,000 on a regular basis it means
there are solid holding numbers,”
he told Autofile. “North of that
and we would be looking at an
oversupply issue.
“There was good buying in Japan
in March, and we saw high arrival
numbers in April, May and June.
“The stockpile occurs more at
certain times of the year. Since
I came back into the industry in
1996, it has ebbed and flowed.”
Used car stock levels are
traditionally based on what’s
happening in Japan and what
consumers are buying here.
Conditions there have improved
recently and the exchange rate
has gone up.“October and November are
normally difficult for the industry,
so the stockpile tends to go
up,” says Macdonald. “But trade
swings up over Christmas and the
holidays, so it goes down.
“December and January are
good months for sales because
people take time off work, the kids
are off school and people may have
Christmas bonuses or holiday pay.
“It’s a time when Kiwis tend to
make financial decisions, so dealers
need to have plenty of stock to
match demand.“When the market’s down in
Japan, stock is hard to get. When
it’s buoyant, you tend to buy what
you can because you don’t know
what will be available next time.
“Dealers also need to bear in
mind it takes four to six weeks to
get stock from Japan.”
Larger operations, of say 300
units, are more static with their
holding not changing too much.
A drop of 50 units may not be
too drastic. But stock can vary
enormously by proportion on yards
with 30 to 40 cars.
“They can suddenly be selling
without having bought for a few
weeks and being 10-15 units down
makes them more susceptible,”
says Macdonald.
“Dealers then jump online to
buy more from Japan, but that’s
always been the way.
“You can oversupply when
buying conditions are good, but
the marketplace normally corrects
itself by pulling back from Japan or
selling down. The numbers might
drop for a month or two before
trundling up again.
“There’s no magic supply-chain
miracle. When it’s slow, it tends to be
slow for everybody. If you can get
good supply with a good exchange
rate, everyone benefits.”
did come down after the global
financial crisis [GFC].
“Stocking levels then increased
again and they respond to the
number of new vehicles sold and
the rate at which they are sold.
“They basically go up when
sales go up, but I’m not so sure
about the days stock is held for
being longer and can’t explain that.
“Average sales per day came
down during the GFC and before
that they were much higher.”
If 80,000 vehicles are sold one
year and 100,000 are sold the
following year, the average sales
per day should be higher – and
the MIA is expecting more new
vehicles to be sold this year than
during 2012.There were 54,404 sales in 2009,
62,029 in 2010, 64,019 in 2011
and 76,871 in 2012, and the MIA is
predicting about 82,000 passenger
vehicle and SUV sales this year.
“We’re looking at about 30,600
light commercials and we’re on
track for 112,000 or 113,000 new
vehicle sales overall.”
Business confidence being
high and strong regional
economies in Auckland and
Christchurch are boosting sales.
“Trades people are upgrading
their vehicles,” says Crawford.
“Although passenger cars aren’t so
hot, SUVs are.“People in the housing market
are refinancing their mortgages
to buy big-ticket items especially
when they are confident about
keeping their jobs.”
All that said, some of the
regional centres, such as Hawke’s
Bay and Palmerston North, aren’t
showing as much growth as
other centres.“But 80 per cent of New Zealand’s
population is in Auckland and
Christchurch. “If you add in Dunedin and
Wellington, these centres cover a
large proportion of the population
and all have strong economies.”
Year to date, 77,438 new cars
have been imported and 68,612
have been registered to give a
variance of 8,826 so far this year.
Days with stock at hand has
been steadily increasing from 78 in
January to 131 in October.
Last year 90,754 units were
imported and there were 76,871
sales for a variance of 13,883.
Stock levels of new cars have
increased every month
except one this year, with
October’s total of 29,509 being the
highest of 2013.There were 7,962 sales last
month, also this year’s biggest
amount, while the variance was
1,400 with 9,362 units imported –
the second highest amount after
11,065 imports in August.
The total stock figure at the
end of December was 20,683 and
that dropped to this year’s low of
18,653 in January.
David Crawford, chief executive
officer of the Motor Industry
Association (MIA), says current
models aren’t sitting around in
stock for too long.
“The industry tends to manage
stock levels quite well and does this
day in, day out,” he told Autofile.
“My data suggests this is a
cyclical thing and levels were no
higher in previous years, but they
Industry manages levels well
Dealer stock of new cars in New Zealand - Oct 2013
2012 Imported NeW CArS SoLd VArIANCe StoCk
AVerAge SALeS per dAy - ytd
dAyS StoCk
At hANd
MIA stock estimate as at end of December 2011 12,984
Jan ‘12 5,026 7,499 (2,473) 10,511 242 43
Feb ‘12 7,368 5,633 1,735 12,246 223 55
Mar ‘12 7,228 6,499 729 12,975 218 59
Apr ‘12 6,285 5,430 855 13,830 209 66
May ‘12 7,742 5,942 1,800 15,630 205 76
Jun ‘12 8,870 7,142 1,728 17,358 211 82
Jul ‘12 7,894 6,208 1,686 19,044 209 91
Aug ‘12 8,589 5,959 2,630 21,674 207 105
Sep ‘12 6,828 6,637 191 21,865 209 105
Oct ‘12 8,155 7,336 819 22,684 211 107
Nov ‘12 8,953 6,484 2,469 25,153 212 119
Dec ‘12 7,816 6,102 1,714 26,867 211 128
ytd total 90,754 76,871 13,883
2013 Imported NeW CArS SoLd VArIANCe StoCk
AVerAge SALeS per dAy - ytd
dAyS StoCk
At hANd
Total stock at the end of December 2012 26,867
Jan ‘13 5,355 7,385 (2,030) 24,837 238 104
Feb ‘13 7,027 5,799 1,228 26,065 223 117
Mar ‘13 6,329 6,800 (471) 25,594 222 115
Apr ‘13 7,391 5,908 1,483 27,077 216 125
May ‘13 7,429 6,347 1,082 28,159 214 132
Jun ‘13 8,051 7,542 509 28,668 220 130
Jul ‘13 8,423 6,769 1,654 30,322 220 138
Aug ‘13 11,065 6,828 4,237 34,559 220 157
Sep ‘13 7,006 7,272 (266) 34,293 222 154
Oct ‘13 9,362 7,962 1,400 35,693 226 158
Nov ‘13 - - - - - -
Dec ‘13 - - - - - -
ytd total 77,438 68,612 8,826
2013 predicted sales 82,380
Dealer stock of used car imports in New Zealand - Oct 2013
2012 Imported USed ImportS SoLd VArIANCe StoCk
AVerAge SALeS per dAy - ytd
dAyS StoCk
At hANd
Total stock at the end of December 2011 8,579
Jan ‘12 3,191 6,375 (3,184) 5,395 206 26
Feb ‘12 4,920 6,000 (1,080) 4,315 210 21
Mar ‘12 6,504 6,429 75 4,390 209 21
Apr ‘12 6,613 5,877 736 5,126 206 25
May ‘12 7,693 6,793 900 6,026 208 29
Jun ‘12 6,947 6,184 763 6,789 208 33
Jul ‘12 5,335 6,641 (1,306) 5,483 209 26
Aug ‘12 5,540 6,621 (1,081) 4,402 210 21
Sep ‘12 5,506 6,222 (716) 3,686 209 18
Oct ‘12 5,688 6,867 (1,179) 2,507 211 12
Nov ‘12 8,486 7,183 1,303 3,810 213 18
Dec ‘12 6,414 7,119 (705) 3,105 215 14
ytd total 72,837 78,311 (5,474)
2013 Imported USed ImportS SoLd VArIANCe StoCk
AVerAge SALeS per dAy - ytd
dAyS StoCk
At hANd
Total stock at the end of December 2012 3105
Jan ‘13 4,468 7,397 (2,929) 176 239 0.7
Feb ‘13 8,247 6,922 1,325 1,501 243 6
Mar ‘13 8,852 7,581 1,271 2,772 243 11
Apr ‘13 10,539 7,418 3,121 5,893 244 24
May ‘13 10,967 8,460 2,507 8,400 250 34
Jun ‘13 8,089 7,862 227 8,627 252 34
Jul ‘13 8,623 9,629 (1,006) 7,621 261 29
Aug ‘13 8,635 8,648 (13) 7,608 263 29
Sep ‘13 7,501 7,615 (114) 7,494 262 29
Oct ‘13 10,374 8,545 1,829 9,323 263 35
Nov ‘13 - - - - - -
Dec ‘13 - - - - - -
ytd total 86,295 80,077 6,218
2013 predicted sales 96,145
xxxxxxxxxxxxxxxxxxxx
Days stock in nZ - UseD import cars
180
160
140
120
100
80
60
40
20
0
Jan
Feb
mar
apr
may
JUn
JUL
aUG
sep
oct
nov
Dec
2013
2012
Days stock in nZ - new cars
180
160
140
120
100
80
60
40
20
0
Jan
Feb
mar
apr
may
JUn
JUL
aUG
sep
oct
nov
Dec
2013
2012
Day
s of
sto
ck
Day
s of
sto
ck
SPONSORSHIP OF THE NEW AND USED COMMERCIAL STATISTICS
PAGES IS NOW AVAILABLE FOR YOUR BUSINESSTARGETED ADVERTISING SPACE
SHOULDN’T WE BE LOOKING AT YOUR BUSINESS? For all enquiries contact Brian on 021 455 775 or email brian@autofi le.co.nz
34 | www.autofile.co.nz
www.autofile.co.nz | 35
UDC Finance Limited lending criteria applies.
Seal the deal with UDC.Ph 0800 500 832 or visit www.udc.co.nz
New Passenger Vehicle Sales by Make - November 2013Make Nov '13 Nov '12 +/- % Nov '13
Mkt Share 2013 total 2013 Mkt ShareToyota 1746 1190 46.7 23.4% 14670 19.3%Holden 685 673 1.8 9.2% 8102 10.7%Ford 618 596 3.7 8.3% 6519 8.6%Hyundai 572 624 -8.3 7.7% 6695 8.8%Mazda 512 485 5.6 6.9% 5447 7.2%Nissan 382 281 35.9 5.1% 3342 4.4%Suzuki 376 405 -7.2 5.0% 4436 5.8%Mitsubishi 351 272 29.0 4.7% 3661 4.8%Honda 310 312 -0.6 4.2% 2994 3.9%Volkswagen 288 261 10.3 3.9% 3527 4.6%Kia 202 240 -15.8 2.7% 2563 3.4%BMw 172 178 -3.4 2.3% 1861 2.4%Subaru 165 153 7.8 2.2% 1645 2.2%Audi 163 150 8.7 2.2% 1748 2.3%Mercedes-Benz 128 82 56.1 1.7% 1398 1.8%Peugeot 108 60 80.0 1.4% 1001 1.3%Jeep 92 65 41.5 1.2% 775 1.0%Ssangyong 86 49 75.5 1.2% 724 1.0%Dodge 64 46 39.1 0.9% 478 0.6%Skoda 63 56 12.5 0.8% 654 0.9%Lexus 54 44 22.7 0.7% 508 0.7%Land Rover 51 22 131.8 0.7% 443 0.6%Mini 44 43 2.3 0.6% 474 0.6%Chery 34 21 61.9 0.5% 351 0.5%Alfa Romeo 24 31 -22.6 0.3% 182 0.2%Great wall 23 38 -39.5 0.3% 211 0.3%Fiat 21 2 950.0 0.3% 142 0.2%Renault 21 8 162.5 0.3% 98 0.1%Volvo 18 19 -5.3 0.2% 229 0.3%Porsche 13 11 18.2 0.2% 182 0.2%Citroen 12 16 -25.0 0.2% 286 0.4%Jaguar 12 5 140.0 0.2% 128 0.2%Chrysler 10 13 -23.1 0.1% 120 0.2%Can-Am 9 6 50.0 0.1% 75 0.1%Daihatsu 6 19 -68.4 0.1% 258 0.3%Aston Martin 4 1 300.0 0.1% 25 0.0%Maserati 4 2 100.0 0.1% 14 0.0%Mahindra 3 - - 0.0% 6 0.0%MG 2 0 200.0 0.0% 12 0.0%Chrysler Jeep 1 - - 0.0% 1 0.0%Mclaren 1 0 100.0 0.0% 6 0.0%Others 3 5 -40.0 0.0% 71 0.1%total 7453 6484 14.9 100.0% 76062 100.0%
New Passenger Vehicle Sales by Model - November 2013Make Model Nov '13 Nov '12 +/- % Nov Mkt
Share2013
total2013 Mkt
ShareToyota Corolla 626 462 35.5 8.4% 5283 6.9%Toyota RAV4 289 80 261.3 3.9% 2521 3.3%Holden Commodore 260 171 52.0 3.5% 2399 3.2%Mazda Cx-5 239 141 69.5 3.2% 1989 2.6%Toyota yaris 227 267 -15.0 3.0% 2235 2.9%Suzuki Swift 218 254 -14.2 2.9% 2750 3.6%Ford Mondeo 184 98 87.8 2.5% 1201 1.6%Hyundai ix35 168 81 107.4 2.3% 1338 1.8%Mitsubishi Lancer 168 84 100.0 2.3% 894 1.2%Toyota Camry 168 131 28.2 2.3% 1270 1.7%Holden Captiva 135 319 -57.7 1.8% 2039 2.7%Volkswagen Golf 134 103 30.1 1.8% 1469 1.9%Toyota Highlander 118 79 49.4 1.6% 1092 1.4%Ford Focus 114 212 -46.2 1.5% 1429 1.9%Honda Jazz 113 76 48.7 1.5% 922 1.2%Ford Kuga 112 18 522.2 1.5% 952 1.3%Mazda Mazda3 109 151 -27.8 1.5% 1537 2.0%Toyota Aurion 107 23 365.2 1.4% 447 0.6%Holden Cruze 106 80 32.5 1.4% 1925 2.5%Hyundai Santa Fe 103 261 -60.5 1.4% 1847 2.4%Honda Civic 100 115 -13.0 1.3% 852 1.1%Mitsubishi Outlander 97 118 -17.8 1.3% 1258 1.7%Hyundai i30 95 103 -7.8 1.3% 1255 1.6%Nissan Qashqai 93 106 -12.3 1.2% 884 1.2%Toyota Landcruiser Prado 87 38 128.9 1.2% 557 0.7%Nissan x-Trail 86 52 65.4 1.2% 779 1.0%Ford Territory 83 137 -39.4 1.1% 1188 1.6%Volkswagen Tiguan 78 53 47.2 1.0% 689 0.9%Hyundai Accent 77 29 165.5 1.0% 572 0.8%Honda CRV 71 82 -13.4 1.0% 793 1.0%Mazda Mazda6 70 82 -14.6 0.9% 960 1.3%Mazda Mazda2 66 77 -14.3 0.9% 712 0.9%Ford Falcon 65 45 44.4 0.9% 835 1.1%Nissan Pathfinder 65 7 828.6 0.9% 191 0.3%Dodge Journey 64 46 39.1 0.9% 476 0.6%Jeep Grand Cherokee 64 39 64.1 0.9% 502 0.7%Ssangyong Korando 63 36 75.0 0.8% 480 0.6%Ford Fiesta 60 85 -29.4 0.8% 892 1.2%Bmw 116i 59 13 353.8 0.8% 378 0.5%Holden Malibu 58 - - 0.8% 334 0.4%Others2254 2130 5.8 30.2% 25936 34.1%total7453 6484 14.9 100.0% 76062 100.0%
Your fi rst choice in automotive lending.UDC Finance Limited lending criteria applies.
Ph 0800 500 832 or visit www.udc.co.nz
850 wds
5000
5500
6000
6500
7000
7500
8000
8500
Jan Feb Mar Apr May Jun Jul Aug Sep Oct Nov Dec
2012
2013
New Passenger registrations - 2012-2013
Subscribe to the latest industry news for FREE by visiting www.autofi le.co.nz/subscribeCONNECT & ENGAGE
DayS StOck in nZ - new carS
180
160
140
120
100
80
60
40
20
0
Jan
Feb
Mar
aPr
May
Jun
J uL
auG
SeP
Oct
nOv
Dec
2013
2012
Day
s of
sto
ck
2014
Some manufacturers constrain their supply of stock so there’s a constant flow onto
the market, says David Crawford, chief executive officer of the Motor Industry Association.
There can also be gaps in sales with much depending on when the next shipment arrives and model availability at the source.
“A manufacturer might get a certain amount of units to cover four months and prefer to do it like that instead of running out,” he says. “From a marketing perspective, would-be customers don’t come back.”
New vehicles are held between wholesalers and dealerships, and over the past five years the stock total has tracked between 14,000 and 23,000 units.
“Sales go up and down like stock with levels reducing
“October, November and December were strongest months on record for commercials and that continued into January.
“Passenger vehicle sales last month also had their best January, so the month was surprisingly strong.
“At the moment, we think more units could be sold than in 2013 and that was a strong year. Many in the industry are expecting 113,000, others are saying 115,000 and 120,000 is optimistic.”
A number of factors are contributing to good sales. The dollar’s strength means it’s cheaper to buy overseas, the economy is doing well and consumer confidence is high.
“These factors mean people are prepared to spend on big-ticket items but if one changes, expectations may have to be reassessed,” says Crawford.
“There’s also some competitive pricing going on, so there has never been a better time to buy a new car.”
STACKING UP THE NUMBERSThere was a difference of 16.17 per cent between new cars sold in New Zealand last year compared to the
Stock held for constant flowsignificantly during the global financial crisis, for instance,” Crawford explains.
“Each company has its own policies on stocking up, while certain models are constrained.
“If you take January as an example, Nissan sold more Navaras than Toyota did Hiluxes, and it was the first time that had happened for a long time.
“Nissan had about one-third of private dealers running specials in January, while the Hilux had a great November and December.
“This meant the Hilux was a bit stock-constrained last month and shows stock levels can vary after two good months by dipping in the third month.”
Crawford describes the new vehicle market as strong at the moment, which was demonstrated by high levels of sales in January.
amount crossing our wharves.There were 95,767 units
imported and 82,433 registrations in 2013 for a difference of 13,334.
The biggest month last year for imports was August on 11,065. Sales topped 6,828 for the year’s biggest variance of 4,237 in favour of cars crossing the border.
The highest surplus of sales over imports – 2,030 units – was last January when there were 5,355 arrivals and 7,385 registrations, while October returned the highest sales figure of 7,962.
The total stock figure at the end of December 2012 was 26,867 and by the end of last year that had nudged up to 40,201 with steady month-on-month increases except in March and September.
This year has started in the opposite vein to 2013, with 6,602 new cars imported against 8,293 sold.
That was a difference of 1,691 between registrations and arrivals – and compared to last year’s monthly average of 1,111 units.
Stock-in-hand by the end of January sat at 38,510 units, with average sales per day increasing to 268.
new car stock
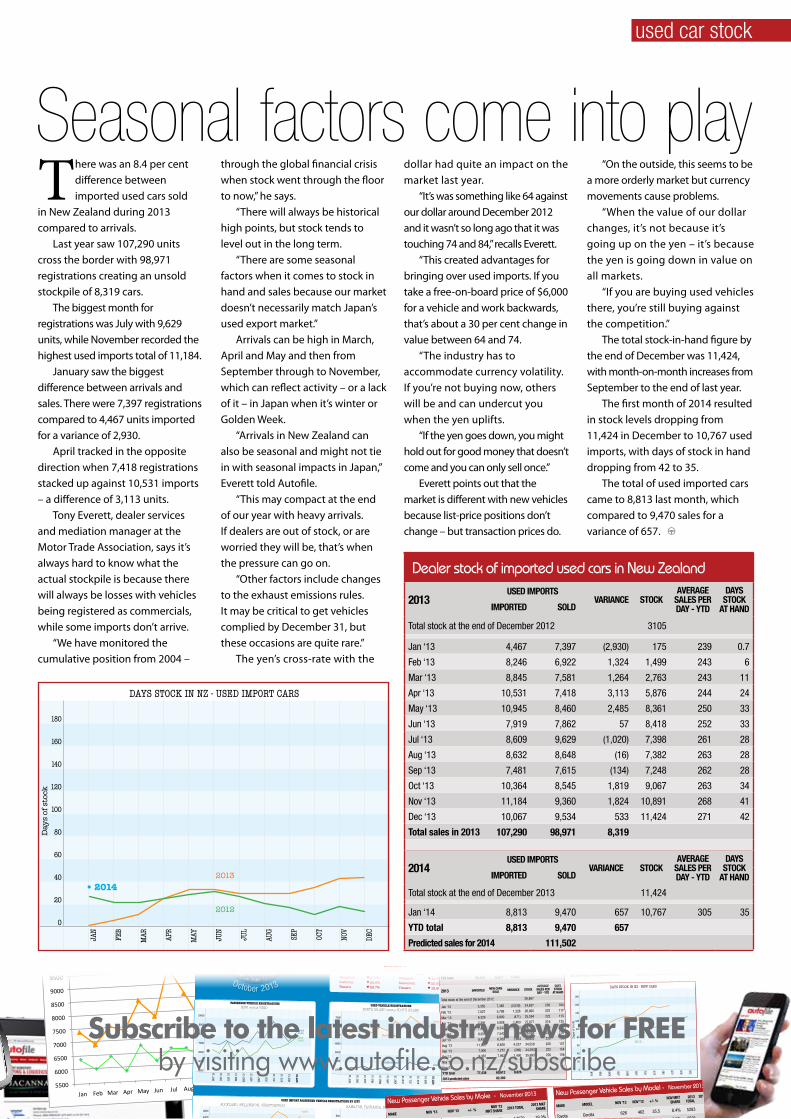
www.autofile.co.nz | 27
dealer stock of imported used cars in new Zealand
2013USeD IMPorTS
VarIaNCe SToCkaVeraGe
SaleS Per DaY - YTD
DaYS SToCk
aT haNDIMPorTeD SolD
Total stock at the end of December 2012 3105
Jan ‘13 4,467 7,397 (2,930) 175 239 0.7
Feb ‘13 8,246 6,922 1,324 1,499 243 6
Mar ‘13 8,845 7,581 1,264 2,763 243 11
Apr ‘13 10,531 7,418 3,113 5,876 244 24
May ‘13 10,945 8,460 2,485 8,361 250 33
Jun ‘13 7,919 7,862 57 8,418 252 33
Jul ‘13 8,609 9,629 (1,020) 7,398 261 28
Aug ‘13 8,632 8,648 (16) 7,382 263 28
Sep ‘13 7,481 7,615 (134) 7,248 262 28
Oct ‘13 10,364 8,545 1,819 9,067 263 34
Nov ‘13 11,184 9,360 1,824 10,891 268 41
Dec ‘13 10,067 9,534 533 11,424 271 42
Total sales in 2013 107,290 98,971 8,319
2014USeD IMPorTS
VarIaNCe SToCkaVeraGe
SaleS Per DaY - YTD
DaYS SToCk
aT haNDIMPorTeD SolD
Total stock at the end of December 2013 11,424
Jan ‘14 8,813 9,470 657 10,767 305 35
YTD total 8,813 9,470 657
Predicted sales for 2014 111,502
5500
6000
6500
7000
7500
8000
8500
9000
9500
10000
Jan Feb Mar Apr May Jun Jul Aug Sep Oct Nov Dec
2013
2012
Whangarei Auckland Hamilton Thames Tauranga Rotorua Gisborne Napier New Plymouth Wanganui Palmerston North Masterton Wellington Nelson Blenheim Greymouth Whangarei Auckland Hamilton Thames Tauranga Rotorua Gisborne
Napier New Plymouth Wanganui Palmerston North Masterton Wellington Nelson Blenheim Greymouth Westport Christchurch Timaru Oamaru Dunedin
Invercargill Whangarei Auckland Hamilton Thames Tauranga Rotorua Gisborne Napier New Plymouth
Wanganui Palmerston North Masterton Wellington Nelson Blenheim Greymouth Whangarei Auckland Hamilton Thames Tauranga Rotorua
Ar
ou
n d t h e c ou nt
ry
20 | www.autofile.co.nz
0800 7000 44autoport.netwww.
UK, Japanese and local vehicles.Finance available.
The TRUSTED online wholesale trading site.
PHONE 0800 ARMACUP (276 2287) or 09 303 3314EMAIL [email protected]
www.armacup.com
YOUR FIRST CHOICE IN SHIPPING
TWO SAILINGS PER MONTH JAPAN TO NZ
Port Calls Hoegh Xiamen V20
Sepang Express V9
Morning Miracle V5
Liberty V1
Osaka 20 Oct 30 Oct 15 Nov 29 Nov Nagoya 21 Oct 31 Oct 16 Nov 30 Nov Yokohama 22 Oct 1 Nov 17 Nov 1 Dec Auckland 7 Nov 17 Nov 4 Dec 19 Dec Wellington 13 Nov 23 Nov 11 Dec 26 Dec Lyttelton 16 Nov 29 Nov 11 Dec 29 Dec
LATEST SCHEDULE
PORT TO DOOR SERVICEINCLUDING: MPI Border inspection Odometer certifi cation Digital Photography for prior sales in NZ NZ Customs clearance Delivery Nationwide Insurance
GENEROUS REWARDS PROGRAMMEShip your motor vehicles on Armacup vessels and you can earn seamiles points for air travel (only applicable to used imports)
Biggest increases/Decreases By town year-on-year
(OctOber 2013 vs OctOber 2012)
Biggest increases new Used
westport 100.0% Blenheim 95.5% thames 51.2% nelson 64.9% napier 34.1% rotorua 52.0%
Biggest decreases new Used
wanganui 27.7% westport 41.7% gisborne 26.8% Masterton 20.0% timaru 23.7% timaru 12.4%
7000
6000
5000
4000
3000
2000
1000
Nov
‘12
DEC
‘12
JAN
‘13
FEb
‘13
MAr
‘13
APr
‘13
MAy
‘13
JuN
‘13
JuL
‘13
AuG
‘13
SEP ‘
13
Oct
‘13
North Island
South Island
10000
9000
8000
7000
6000
5000
4000
Nov
‘12
DEC
‘12
JAN
‘13
FEb
‘13
MAr
‘13
APr
‘13
MAy
‘13
JuN
‘13
JuL
‘13
AuG
‘13
SEP ‘
13
Oct
‘13
Used
New7962
8545
1805
6740
Used Vehicle RegistRatiOnsNorth IslaNd versus south IslaNd
PassengeR Vehicle RegistRatiOnsNew versus used
Vehi
cles
sol
d
4500
4000
3500
3000
2500
2000
1500
1000
500
0
Nov
‘12
DEC
‘12
JAN
‘13
FEb
‘13
MAr
‘13
APr
‘13
MAy
‘13
JuN
‘13
JuL
‘13
AuG
‘13
SEP ‘
13
Oct
‘13
Auckland
Wellington
Vehi
cles
sol
d
600
500
400
300
200
100
0
Nov
‘12
DEC
‘12
JAN
‘13
FEb
‘13
MAr
‘13
APr
‘13
MAy
‘13
JuN
‘13
JuL
‘13
AuG
‘13
SEP ‘
13
Oct
‘13
Hamilton
Tauranga
Palmerston Nth
DunedinChristchurch
4320
495
1185
290
729
229
216
aucklaNd, wellINgtoN, chrIstchurch hamIltoN, tauraNga, duNedIN, PalmerstoN North
Used imPORt PassengeR Vehicle RegistRatiOns by city
october 2013
autoport.net
The TRUSTED online wholesale trading site.
26 | www.autofile.co.nz
www.autofile.co.nz | 27
Annual high for stockpileThe amount of stock held
by used car dealers during
October was the highest
monthly total of the year.
There were 10,374 units
imported last month with a
variance of 1,829 on 8,545 sales.
The number of cars in stock
amounted to 9,323 compared to
7,494 in September.
There have been two other
major increases during 2013 – with
variances between imports and sales
of 3,121 in April and 2,507 in May.
Graeme Macdonald, chairman
of the North Island branch of the
Imported Motor Vehicle Industry
Association, says the current
stockpile should correct itself – as it
normally does.“If the monthly stockpile was
10,000 on a regular basis it means
there are solid holding numbers,”
he told Autofile. “North of that
and we would be looking at an
oversupply issue.
“There was good buying in Japan
in March, and we saw high arrival
numbers in April, May and June.
“The stockpile occurs more at
certain times of the year. Since
I came back into the industry in
1996, it has ebbed and flowed.”
Used car stock levels are
traditionally based on what’s
happening in Japan and what
consumers are buying here.
Conditions there have improved
recently and the exchange rate
has gone up.“October and November are
normally difficult for the industry,
so the stockpile tends to go
up,” says Macdonald. “But trade
swings up over Christmas and the
holidays, so it goes down.
“December and January are
good months for sales because
people take time off work, the kids
are off school and people may have
Christmas bonuses or holiday pay.
“It’s a time when Kiwis tend to
make financial decisions, so dealers
need to have plenty of stock to
match demand.“When the market’s down in
Japan, stock is hard to get. When
it’s buoyant, you tend to buy what
you can because you don’t know
what will be available next time.
“Dealers also need to bear in
mind it takes four to six weeks to
get stock from Japan.”
Larger operations, of say 300
units, are more static with their
holding not changing too much.
A drop of 50 units may not be
too drastic. But stock can vary
enormously by proportion on yards
with 30 to 40 cars.
“They can suddenly be selling
without having bought for a few
weeks and being 10-15 units down
makes them more susceptible,”
says Macdonald.
“Dealers then jump online to
buy more from Japan, but that’s
always been the way.
“You can oversupply when
buying conditions are good, but
the marketplace normally corrects
itself by pulling back from Japan or
selling down. The numbers might
drop for a month or two before
trundling up again.
“There’s no magic supply-chain
miracle. When it’s slow, it tends to be
slow for everybody. If you can get
good supply with a good exchange
rate, everyone benefits.”
did come down after the global
financial crisis [GFC].
“Stocking levels then increased
again and they respond to the
number of new vehicles sold and
the rate at which they are sold.
“They basically go up when
sales go up, but I’m not so sure
about the days stock is held for
being longer and can’t explain that.
“Average sales per day came
down during the GFC and before
that they were much higher.”
If 80,000 vehicles are sold one
year and 100,000 are sold the
following year, the average sales
per day should be higher – and
the MIA is expecting more new
vehicles to be sold this year than
during 2012.There were 54,404 sales in 2009,
62,029 in 2010, 64,019 in 2011
and 76,871 in 2012, and the MIA is
predicting about 82,000 passenger
vehicle and SUV sales this year.
“We’re looking at about 30,600
light commercials and we’re on
track for 112,000 or 113,000 new
vehicle sales overall.”
Business confidence being
high and strong regional
economies in Auckland and
Christchurch are boosting sales.
“Trades people are upgrading
their vehicles,” says Crawford.
“Although passenger cars aren’t so
hot, SUVs are.“People in the housing market
are refinancing their mortgages
to buy big-ticket items especially
when they are confident about
keeping their jobs.”
All that said, some of the
regional centres, such as Hawke’s
Bay and Palmerston North, aren’t
showing as much growth as
other centres.“But 80 per cent of New Zealand’s
population is in Auckland and
Christchurch. “If you add in Dunedin and
Wellington, these centres cover a
large proportion of the population
and all have strong economies.”
Year to date, 77,438 new cars
have been imported and 68,612
have been registered to give a
variance of 8,826 so far this year.
Days with stock at hand has
been steadily increasing from 78 in
January to 131 in October.
Last year 90,754 units were
imported and there were 76,871
sales for a variance of 13,883.
Stock levels of new cars have
increased every month
except one this year, with
October’s total of 29,509 being the
highest of 2013.There were 7,962 sales last
month, also this year’s biggest
amount, while the variance was
1,400 with 9,362 units imported –
the second highest amount after
11,065 imports in August.
The total stock figure at the
end of December was 20,683 and
that dropped to this year’s low of
18,653 in January.
David Crawford, chief executive
officer of the Motor Industry
Association (MIA), says current
models aren’t sitting around in
stock for too long.
“The industry tends to manage
stock levels quite well and does this
day in, day out,” he told Autofile.
“My data suggests this is a
cyclical thing and levels were no
higher in previous years, but they
Industry manages levels well
Dealer stock of new cars in New Zealand - Oct 2013
2012 Imported NeW CArS SoLd VArIANCe StoCk
AVerAge SALeS per dAy - ytd
dAyS StoCk
At hANd
MIA stock estimate as at end of December 2011 12,984
Jan ‘12 5,026 7,499 (2,473) 10,511 242 43
Feb ‘12 7,368 5,633 1,735 12,246 223 55
Mar ‘12 7,228 6,499 729 12,975 218 59
Apr ‘12 6,285 5,430 855 13,830 209 66
May ‘12 7,742 5,942 1,800 15,630 205 76
Jun ‘12 8,870 7,142 1,728 17,358 211 82
Jul ‘12 7,894 6,208 1,686 19,044 209 91
Aug ‘12 8,589 5,959 2,630 21,674 207 105
Sep ‘12 6,828 6,637 191 21,865 209 105
Oct ‘12 8,155 7,336 819 22,684 211 107
Nov ‘12 8,953 6,484 2,469 25,153 212 119
Dec ‘12 7,816 6,102 1,714 26,867 211 128
ytd total 90,754 76,871 13,883
2013 Imported NeW CArS SoLd VArIANCe StoCk
AVerAge SALeS per dAy - ytd
dAyS StoCk
At hANd
Total stock at the end of December 2012 26,867
Jan ‘13 5,355 7,385 (2,030) 24,837 238 104
Feb ‘13 7,027 5,799 1,228 26,065 223 117
Mar ‘13 6,329 6,800 (471) 25,594 222 115
Apr ‘13 7,391 5,908 1,483 27,077 216 125
May ‘13 7,429 6,347 1,082 28,159 214 132
Jun ‘13 8,051 7,542 509 28,668 220 130
Jul ‘13 8,423 6,769 1,654 30,322 220 138
Aug ‘13 11,065 6,828 4,237 34,559 220 157
Sep ‘13 7,006 7,272 (266) 34,293 222 154
Oct ‘13 9,362 7,962 1,400 35,693 226 158
Nov ‘13 - - - - - -
Dec ‘13 - - - - - -
ytd total 77,438 68,612 8,826
2013 predicted sales 82,380
Dealer stock of used car imports in New Zealand - Oct 2013
2012 Imported USed ImportS SoLd VArIANCe StoCk
AVerAge SALeS per dAy - ytd
dAyS StoCk
At hANd
Total stock at the end of December 2011 8,579
Jan ‘12 3,191 6,375 (3,184) 5,395 206 26
Feb ‘12 4,920 6,000 (1,080) 4,315 210 21
Mar ‘12 6,504 6,429 75 4,390 209 21
Apr ‘12 6,613 5,877 736 5,126 206 25
May ‘12 7,693 6,793 900 6,026 208 29
Jun ‘12 6,947 6,184 763 6,789 208 33
Jul ‘12 5,335 6,641 (1,306) 5,483 209 26
Aug ‘12 5,540 6,621 (1,081) 4,402 210 21
Sep ‘12 5,506 6,222 (716) 3,686 209 18
Oct ‘12 5,688 6,867 (1,179) 2,507 211 12
Nov ‘12 8,486 7,183 1,303 3,810 213 18
Dec ‘12 6,414 7,119 (705) 3,105 215 14
ytd total 72,837 78,311 (5,474)
2013 Imported USed ImportS SoLd VArIANCe StoCk
AVerAge SALeS per dAy - ytd
dAyS StoCk
At hANd
Total stock at the end of December 2012 3105
Jan ‘13 4,468 7,397 (2,929) 176 239 0.7
Feb ‘13 8,247 6,922 1,325 1,501 243 6
Mar ‘13 8,852 7,581 1,271 2,772 243 11
Apr ‘13 10,539 7,418 3,121 5,893 244 24
May ‘13 10,967 8,460 2,507 8,400 250 34
Jun ‘13 8,089 7,862 227 8,627 252 34
Jul ‘13 8,623 9,629 (1,006) 7,621 261 29
Aug ‘13 8,635 8,648 (13) 7,608 263 29
Sep ‘13 7,501 7,615 (114) 7,494 262 29
Oct ‘13 10,374 8,545 1,829 9,323 263 35
Nov ‘13 - - - - - -
Dec ‘13 - - - - - -
ytd total 86,295 80,077 6,218
2013 predicted sales 96,145
xxxxxxxxxxxxxxxxxxxx
Days stock in nZ - UseD import cars
180
160
140
120
100
80
60
40
20
0
Jan
Feb
mar
apr
may
JUn
JUL
aUG
sep
oct
nov
Dec
2013
2012
Days stock in nZ - new cars
180
160
140
120
100
80
60
40
20
0
Jan
Feb
mar
apr
may
JUn
JUL
aUG
sep
oct
nov
Dec
2013
2012
Day
s of
sto
ck
Day
s of
sto
ck
SPONSORSHIP OF THE NEW AND USED COMMERCIAL STATISTICS
PAGES IS NOW AVAILABLE FOR YOUR BUSINESSTARGETED ADVERTISING SPACE
SHOULDN’T WE BE LOOKING AT YOUR BUSINESS? For all enquiries contact Brian on 021 455 775 or email brian@autofi le.co.nz
34 | www.autofile.co.nz
www.autofile.co.nz | 35
UDC Finance Limited lending criteria applies.Seal the deal with UDC.Ph 0800 500 832 or visit www.udc.co.nz
New Passenger Vehicle Sales by Make - November 2013
Make Nov '13 Nov '12 +/- % Nov '13
Mkt Share2013 total
2013 Mkt Share
Toyota 1746 1190 46.7 23.4% 14670 19.3%
Holden 685 673 1.8 9.2% 8102 10.7%
Ford 618 596 3.7 8.3% 6519 8.6%
Hyundai 572 624 -8.3 7.7% 6695 8.8%
Mazda 512 485 5.6 6.9% 5447 7.2%
Nissan 382 281 35.9 5.1% 3342 4.4%
Suzuki 376 405 -7.2 5.0% 4436 5.8%
Mitsubishi 351 272 29.0 4.7% 3661 4.8%
Honda 310 312 -0.6 4.2% 2994 3.9%
Volkswagen 288 261 10.3 3.9% 3527 4.6%
Kia 202 240 -15.8 2.7% 2563 3.4%
BMw 172 178 -3.4 2.3% 1861 2.4%
Subaru 165 153 7.8 2.2% 1645 2.2%
Audi 163 150 8.7 2.2% 1748 2.3%
Mercedes-Benz 128 82 56.1 1.7% 1398 1.8%
Peugeot 108 60 80.0 1.4% 1001 1.3%
Jeep 92 65 41.5 1.2% 775 1.0%
Ssangyong 86 49 75.5 1.2% 724 1.0%
Dodge 64 46 39.1 0.9% 478 0.6%
Skoda 63 56 12.5 0.8% 654 0.9%
Lexus 54 44 22.7 0.7% 508 0.7%
Land Rover 51 22 131.8 0.7% 443 0.6%
Mini 44 43 2.3 0.6% 474 0.6%
Chery 34 21 61.9 0.5% 351 0.5%
Alfa Romeo 24 31 -22.6 0.3% 182 0.2%
Great wall 23 38 -39.5 0.3% 211 0.3%
Fiat 21 2 950.0 0.3% 142 0.2%
Renault 21 8 162.5 0.3% 98 0.1%
Volvo 18 19 -5.3 0.2% 229 0.3%
Porsche 13 11 18.2 0.2% 182 0.2%
Citroen 12 16 -25.0 0.2% 286 0.4%
Jaguar 12 5 140.0 0.2% 128 0.2%
Chrysler 10 13 -23.1 0.1% 120 0.2%
Can-Am 9 6 50.0 0.1% 75 0.1%
Daihatsu 6 19 -68.4 0.1% 258 0.3%
Aston Martin 4 1 300.0 0.1% 25 0.0%
Maserati 4 2 100.0 0.1% 14 0.0%
Mahindra 3 - - 0.0% 6 0.0%
MG 2 0 200.0 0.0% 12 0.0%
Chrysler Jeep 1 - - 0.0% 1 0.0%
Mclaren 1 0 100.0 0.0% 6 0.0%
Others 3 5 -40.0 0.0% 71 0.1%
total 7453 6484 14.9 100.0% 76062 100.0%
New Passenger Vehicle Sales by Model - November 2013
Make Model Nov '13 Nov '12 +/- %Nov Mkt
Share2013
total2013 Mkt
Share
Toyota Corolla 626 462 35.5 8.4% 5283 6.9%
Toyota RAV4 289 80 261.3 3.9% 2521 3.3%
Holden Commodore 260 171 52.0 3.5% 2399 3.2%
Mazda Cx-5 239 141 69.5 3.2% 1989 2.6%
Toyota yaris 227 267 -15.0 3.0% 2235 2.9%
Suzuki Swift 218 254 -14.2 2.9% 2750 3.6%
Ford Mondeo 184 98 87.8 2.5% 1201 1.6%
Hyundai ix35 168 81 107.4 2.3% 1338 1.8%
Mitsubishi Lancer 168 84 100.0 2.3% 894 1.2%
Toyota Camry 168 131 28.2 2.3% 1270 1.7%
Holden Captiva 135 319 -57.7 1.8% 2039 2.7%
Volkswagen Golf 134 103 30.1 1.8% 1469 1.9%
Toyota Highlander 118 79 49.4 1.6% 1092 1.4%
Ford Focus 114 212 -46.2 1.5% 1429 1.9%
Honda Jazz 113 76 48.7 1.5% 922 1.2%
Ford Kuga 112 18 522.2 1.5% 952 1.3%
Mazda Mazda3 109 151 -27.8 1.5% 1537 2.0%
Toyota Aurion 107 23 365.2 1.4% 447 0.6%
Holden Cruze 106 80 32.5 1.4% 1925 2.5%
Hyundai Santa Fe 103 261 -60.5 1.4% 1847 2.4%
Honda Civic 100 115 -13.0 1.3% 852 1.1%
Mitsubishi Outlander 97 118 -17.8 1.3% 1258 1.7%
Hyundai i30 95 103 -7.8 1.3% 1255 1.6%
Nissan Qashqai 93 106 -12.3 1.2% 884 1.2%
Toyota Landcruiser Prado 87 38 128.9 1.2% 557 0.7%
Nissan x-Trail 86 52 65.4 1.2% 779 1.0%
Ford Territory 83 137 -39.4 1.1% 1188 1.6%
Volkswagen Tiguan 78 53 47.2 1.0% 689 0.9%
Hyundai Accent 77 29 165.5 1.0% 572 0.8%
Honda CRV 71 82 -13.4 1.0% 793 1.0%
Mazda Mazda6 70 82 -14.6 0.9% 960 1.3%
Mazda Mazda2 66 77 -14.3 0.9% 712 0.9%
Ford Falcon 65 45 44.4 0.9% 835 1.1%
Nissan Pathfinder 65 7 828.6 0.9% 191 0.3%
Dodge Journey 64 46 39.1 0.9% 476 0.6%
Jeep Grand Cherokee 64 39 64.1 0.9% 502 0.7%
Ssangyong Korando 63 36 75.0 0.8% 480 0.6%
Ford Fiesta 60 85 -29.4 0.8% 892 1.2%
Bmw 116i 59 13 353.8 0.8% 378 0.5%
Holden Malibu 58 - - 0.8% 334 0.4%
Others2254 2130 5.8 30.2% 25936 34.1%
total7453 6484 14.9 100.0% 76062 100.0%
Your fi rst choice in automotive lending.
UDC Finance Limited lending criteria applies.
Ph 0800 500 832 or visit www.udc.co.nz
850 wds
5000
5500
6000
6500
7000
7500
8000
8500
Jan Feb Mar Apr May Jun Jul Aug Sep Oct Nov Dec
2012
2013
New Passenger registrations - 2012-2013
5500
6000
6500
7000
7500
8000
8500
9000
9500
10000
Jan Feb Mar Apr May Jun Jul Aug Sep Oct Nov Dec
2013
2012
Whangarei Auckland Hamilton Thames Tauranga Rotorua Gisborne Napier New Plymouth Wanganui Palmerston North Masterton Wellington Nelson Blenheim Greymouth Whangarei Auckland Hamilton Thames Tauranga Rotorua Gisborne
Napier New Plymouth Wanganui Palmerston North Masterton Wellington Nelson Blenheim Greymouth Westport Christchurch Timaru Oamaru Dunedin
Invercargill Whangarei Auckland Hamilton Thames Tauranga Rotorua Gisborne Napier New Plymouth
Wanganui Palmerston North Masterton Wellington Nelson Blenheim Greymouth Whangarei Auckland Hamilton Thames Tauranga Rotorua
Ar
ou
n d t h e c ou nt
ry
20 | www.autofile.co.nz
0800 7000 44autoport.netwww.
UK, Japanese and local vehicles.Finance available.
The TRUSTED online wholesale trading site.
PHONE 0800 ARMACUP (276 2287) or 09 303 3314EMAIL [email protected]
www.armacup.com
YOUR FIRST CHOICE IN SHIPPING
TWO SAILINGS PER MONTH JAPAN TO NZ
Port Calls Hoegh Xiamen V20
Sepang Express V9
Morning Miracle V5
Liberty V1
Osaka 20 Oct 30 Oct 15 Nov 29 Nov Nagoya 21 Oct 31 Oct 16 Nov 30 Nov Yokohama 22 Oct 1 Nov 17 Nov 1 Dec Auckland 7 Nov 17 Nov 4 Dec 19 Dec Wellington 13 Nov 23 Nov 11 Dec 26 Dec Lyttelton 16 Nov 29 Nov 11 Dec 29 Dec
LATEST SCHEDULE
PORT TO DOOR SERVICEINCLUDING: MPI Border inspection Odometer certifi cation Digital Photography for prior sales in NZ NZ Customs clearance Delivery Nationwide Insurance
GENEROUS REWARDS PROGRAMMEShip your motor vehicles on Armacup vessels and you can earn seamiles points for air travel (only applicable to used imports)
Biggest increases/Decreases By town year-on-year
(OctOber 2013 vs OctOber 2012)
Biggest increases new Used
westport 100.0% Blenheim 95.5% thames 51.2% nelson 64.9% napier 34.1% rotorua 52.0%
Biggest decreases new Used
wanganui 27.7% westport 41.7% gisborne 26.8% Masterton 20.0% timaru 23.7% timaru 12.4%
7000
6000
5000
4000
3000
2000
1000
Nov
‘12
DEC
‘12
JAN
‘13
FEb
‘13
MAr
‘13
APr
‘13
MAy
‘13
JuN
‘13
JuL
‘13
AuG
‘13
SEP ‘
13
Oct
‘13
North Island
South Island
10000
9000
8000
7000
6000
5000
4000
Nov
‘12
DEC
‘12
JAN
‘13
FEb
‘13
MAr
‘13
APr
‘13
MAy
‘13
JuN
‘13
JuL
‘13
AuG
‘13
SEP ‘
13
Oct
‘13
Used
New7962
8545
1805
6740
Used Vehicle RegistRatiOnsNorth IslaNd versus south IslaNd
PassengeR Vehicle RegistRatiOnsNew versus used
Vehi
cles
sol
d
4500
4000
3500
3000
2500
2000
1500
1000
500
0
Nov
‘12
DEC
‘12
JAN
‘13
FEb
‘13
MAr
‘13
APr
‘13
MAy
‘13
JuN
‘13
JuL
‘13
AuG
‘13
SEP ‘
13
Oct
‘13
Auckland
Wellington
Vehi
cles
sol
d
600
500
400
300
200
100
0
Nov
‘12
DEC
‘12
JAN
‘13
FEb
‘13
MAr
‘13
APr
‘13
MAy
‘13
JuN
‘13
JuL
‘13
AuG
‘13
SEP ‘
13
Oct
‘13
Hamilton
Tauranga
Palmerston Nth
DunedinChristchurch
4320
495
1185
290
729
229
216
aucklaNd, wellINgtoN, chrIstchurch hamIltoN, tauraNga, duNedIN, PalmerstoN North
Used imPORt PassengeR Vehicle RegistRatiOns by city
october 2013
autoport.net
The TRUSTED online wholesale trading site.
26 | www.autofile.co.nz
www.autofile.co.nz | 27
Annual high for stockpileThe amount of stock held
by used car dealers during
October was the highest
monthly total of the year.
There were 10,374 units
imported last month with a
variance of 1,829 on 8,545 sales.
The number of cars in stock
amounted to 9,323 compared to
7,494 in September.
There have been two other
major increases during 2013 – with
variances between imports and sales
of 3,121 in April and 2,507 in May.
Graeme Macdonald, chairman
of the North Island branch of the
Imported Motor Vehicle Industry
Association, says the current
stockpile should correct itself – as it
normally does.“If the monthly stockpile was
10,000 on a regular basis it means
there are solid holding numbers,”
he told Autofile. “North of that
and we would be looking at an
oversupply issue.
“There was good buying in Japan
in March, and we saw high arrival
numbers in April, May and June.
“The stockpile occurs more at
certain times of the year. Since
I came back into the industry in
1996, it has ebbed and flowed.”
Used car stock levels are
traditionally based on what’s
happening in Japan and what
consumers are buying here.
Conditions there have improved
recently and the exchange rate
has gone up.“October and November are
normally difficult for the industry,
so the stockpile tends to go
up,” says Macdonald. “But trade
swings up over Christmas and the
holidays, so it goes down.
“December and January are
good months for sales because
people take time off work, the kids
are off school and people may have
Christmas bonuses or holiday pay.
“It’s a time when Kiwis tend to
make financial decisions, so dealers
need to have plenty of stock to
match demand.“When the market’s down in
Japan, stock is hard to get. When
it’s buoyant, you tend to buy what
you can because you don’t know
what will be available next time.
“Dealers also need to bear in
mind it takes four to six weeks to
get stock from Japan.”
Larger operations, of say 300
units, are more static with their
holding not changing too much.
A drop of 50 units may not be
too drastic. But stock can vary
enormously by proportion on yards
with 30 to 40 cars.
“They can suddenly be selling
without having bought for a few
weeks and being 10-15 units down
makes them more susceptible,”
says Macdonald.
“Dealers then jump online to
buy more from Japan, but that’s
always been the way.
“You can oversupply when
buying conditions are good, but
the marketplace normally corrects
itself by pulling back from Japan or
selling down. The numbers might
drop for a month or two before
trundling up again.
“There’s no magic supply-chain
miracle. When it’s slow, it tends to be
slow for everybody. If you can get
good supply with a good exchange
rate, everyone benefits.”
did come down after the global
financial crisis [GFC].
“Stocking levels then increased
again and they respond to the
number of new vehicles sold and
the rate at which they are sold.
“They basically go up when
sales go up, but I’m not so sure
about the days stock is held for
being longer and can’t explain that.
“Average sales per day came
down during the GFC and before
that they were much higher.”
If 80,000 vehicles are sold one
year and 100,000 are sold the
following year, the average sales
per day should be higher – and
the MIA is expecting more new
vehicles to be sold this year than
during 2012.There were 54,404 sales in 2009,
62,029 in 2010, 64,019 in 2011
and 76,871 in 2012, and the MIA is
predicting about 82,000 passenger
vehicle and SUV sales this year.
“We’re looking at about 30,600
light commercials and we’re on
track for 112,000 or 113,000 new
vehicle sales overall.”
Business confidence being
high and strong regional
economies in Auckland and
Christchurch are boosting sales.
“Trades people are upgrading
their vehicles,” says Crawford.
“Although passenger cars aren’t so
hot, SUVs are.“People in the housing market
are refinancing their mortgages
to buy big-ticket items especially
when they are confident about
keeping their jobs.”
All that said, some of the
regional centres, such as Hawke’s
Bay and Palmerston North, aren’t
showing as much growth as
other centres.“But 80 per cent of New Zealand’s
population is in Auckland and
Christchurch. “If you add in Dunedin and
Wellington, these centres cover a
large proportion of the population
and all have strong economies.”
Year to date, 77,438 new cars
have been imported and 68,612
have been registered to give a
variance of 8,826 so far this year.
Days with stock at hand has
been steadily increasing from 78 in
January to 131 in October.
Last year 90,754 units were
imported and there were 76,871
sales for a variance of 13,883.
Stock levels of new cars have
increased every month
except one this year, with
October’s total of 29,509 being the
highest of 2013.There were 7,962 sales last
month, also this year’s biggest
amount, while the variance was
1,400 with 9,362 units imported –
the second highest amount after
11,065 imports in August.
The total stock figure at the
end of December was 20,683 and
that dropped to this year’s low of
18,653 in January.
David Crawford, chief executive
officer of the Motor Industry
Association (MIA), says current
models aren’t sitting around in
stock for too long.
“The industry tends to manage
stock levels quite well and does this
day in, day out,” he told Autofile.
“My data suggests this is a
cyclical thing and levels were no
higher in previous years, but they
Industry manages levels well
Dealer stock of new cars in New Zealand - Oct 2013
2012 Imported NeW CArS SoLd VArIANCe StoCk
AVerAge SALeS per dAy - ytd
dAyS StoCk
At hANd
MIA stock estimate as at end of December 2011 12,984
Jan ‘12 5,026 7,499 (2,473) 10,511 242 43
Feb ‘12 7,368 5,633 1,735 12,246 223 55
Mar ‘12 7,228 6,499 729 12,975 218 59
Apr ‘12 6,285 5,430 855 13,830 209 66
May ‘12 7,742 5,942 1,800 15,630 205 76
Jun ‘12 8,870 7,142 1,728 17,358 211 82
Jul ‘12 7,894 6,208 1,686 19,044 209 91
Aug ‘12 8,589 5,959 2,630 21,674 207 105
Sep ‘12 6,828 6,637 191 21,865 209 105
Oct ‘12 8,155 7,336 819 22,684 211 107
Nov ‘12 8,953 6,484 2,469 25,153 212 119
Dec ‘12 7,816 6,102 1,714 26,867 211 128
ytd total 90,754 76,871 13,883
2013 Imported NeW CArS SoLd VArIANCe StoCk
AVerAge SALeS per dAy - ytd
dAyS StoCk
At hANd
Total stock at the end of December 2012 26,867
Jan ‘13 5,355 7,385 (2,030) 24,837 238 104
Feb ‘13 7,027 5,799 1,228 26,065 223 117
Mar ‘13 6,329 6,800 (471) 25,594 222 115
Apr ‘13 7,391 5,908 1,483 27,077 216 125
May ‘13 7,429 6,347 1,082 28,159 214 132
Jun ‘13 8,051 7,542 509 28,668 220 130
Jul ‘13 8,423 6,769 1,654 30,322 220 138
Aug ‘13 11,065 6,828 4,237 34,559 220 157
Sep ‘13 7,006 7,272 (266) 34,293 222 154
Oct ‘13 9,362 7,962 1,400 35,693 226 158
Nov ‘13 - - - - - -
Dec ‘13 - - - - - -
ytd total 77,438 68,612 8,826
2013 predicted sales 82,380
Dealer stock of used car imports in New Zealand - Oct 2013
2012 Imported USed ImportS SoLd VArIANCe StoCk
AVerAge SALeS per dAy - ytd
dAyS StoCk
At hANd
Total stock at the end of December 2011 8,579
Jan ‘12 3,191 6,375 (3,184) 5,395 206 26
Feb ‘12 4,920 6,000 (1,080) 4,315 210 21
Mar ‘12 6,504 6,429 75 4,390 209 21
Apr ‘12 6,613 5,877 736 5,126 206 25
May ‘12 7,693 6,793 900 6,026 208 29
Jun ‘12 6,947 6,184 763 6,789 208 33
Jul ‘12 5,335 6,641 (1,306) 5,483 209 26
Aug ‘12 5,540 6,621 (1,081) 4,402 210 21
Sep ‘12 5,506 6,222 (716) 3,686 209 18
Oct ‘12 5,688 6,867 (1,179) 2,507 211 12
Nov ‘12 8,486 7,183 1,303 3,810 213 18
Dec ‘12 6,414 7,119 (705) 3,105 215 14
ytd total 72,837 78,311 (5,474)
2013 Imported USed ImportS SoLd VArIANCe StoCk
AVerAge SALeS per dAy - ytd
dAyS StoCk
At hANd
Total stock at the end of December 2012 3105
Jan ‘13 4,468 7,397 (2,929) 176 239 0.7
Feb ‘13 8,247 6,922 1,325 1,501 243 6
Mar ‘13 8,852 7,581 1,271 2,772 243 11
Apr ‘13 10,539 7,418 3,121 5,893 244 24
May ‘13 10,967 8,460 2,507 8,400 250 34
Jun ‘13 8,089 7,862 227 8,627 252 34
Jul ‘13 8,623 9,629 (1,006) 7,621 261 29
Aug ‘13 8,635 8,648 (13) 7,608 263 29
Sep ‘13 7,501 7,615 (114) 7,494 262 29
Oct ‘13 10,374 8,545 1,829 9,323 263 35
Nov ‘13 - - - - - -
Dec ‘13 - - - - - -
ytd total 86,295 80,077 6,218
2013 predicted sales 96,145
xxxxxxxxxxxxxxxxxxxx
Days stock in nZ - UseD import cars
180
160
140
120
100
80
60
40
20
0
Jan
Feb
mar
apr
may
JUn
JUL
aUG
sep
oct
nov
Dec
2013
2012
Days stock in nZ - new cars
180
160
140
120
100
80
60
40
20
0
Jan
Feb
mar
apr
may
JUn
JUL
aUG
sep
oct
nov
Dec
2013
2012
Day
s of
sto
ck
Day
s of
sto
ck
SPONSORSHIP OF THE NEW AND USED COMMERCIAL STATISTICS
PAGES IS NOW AVAILABLE FOR YOUR BUSINESSTARGETED ADVERTISING SPACE
SHOULDN’T WE BE LOOKING AT YOUR BUSINESS? For all enquiries contact Brian on 021 455 775 or email brian@autofi le.co.nz
34 | www.autofile.co.nz
www.autofile.co.nz | 35
UDC Finance Limited lending criteria applies.
Seal the deal with UDC.Ph 0800 500 832 or visit www.udc.co.nz
New Passenger Vehicle Sales by Make - November 2013Make Nov '13 Nov '12 +/- % Nov '13
Mkt Share 2013 total 2013 Mkt ShareToyota 1746 1190 46.7 23.4% 14670 19.3%Holden 685 673 1.8 9.2% 8102 10.7%Ford 618 596 3.7 8.3% 6519 8.6%Hyundai 572 624 -8.3 7.7% 6695 8.8%Mazda 512 485 5.6 6.9% 5447 7.2%Nissan 382 281 35.9 5.1% 3342 4.4%Suzuki 376 405 -7.2 5.0% 4436 5.8%Mitsubishi 351 272 29.0 4.7% 3661 4.8%Honda 310 312 -0.6 4.2% 2994 3.9%Volkswagen 288 261 10.3 3.9% 3527 4.6%Kia 202 240 -15.8 2.7% 2563 3.4%BMw 172 178 -3.4 2.3% 1861 2.4%Subaru 165 153 7.8 2.2% 1645 2.2%Audi 163 150 8.7 2.2% 1748 2.3%Mercedes-Benz 128 82 56.1 1.7% 1398 1.8%Peugeot 108 60 80.0 1.4% 1001 1.3%Jeep 92 65 41.5 1.2% 775 1.0%Ssangyong 86 49 75.5 1.2% 724 1.0%Dodge 64 46 39.1 0.9% 478 0.6%Skoda 63 56 12.5 0.8% 654 0.9%Lexus 54 44 22.7 0.7% 508 0.7%Land Rover 51 22 131.8 0.7% 443 0.6%Mini 44 43 2.3 0.6% 474 0.6%Chery 34 21 61.9 0.5% 351 0.5%Alfa Romeo 24 31 -22.6 0.3% 182 0.2%Great wall 23 38 -39.5 0.3% 211 0.3%Fiat 21 2 950.0 0.3% 142 0.2%Renault 21 8 162.5 0.3% 98 0.1%Volvo 18 19 -5.3 0.2% 229 0.3%Porsche 13 11 18.2 0.2% 182 0.2%Citroen 12 16 -25.0 0.2% 286 0.4%Jaguar 12 5 140.0 0.2% 128 0.2%Chrysler 10 13 -23.1 0.1% 120 0.2%Can-Am 9 6 50.0 0.1% 75 0.1%Daihatsu 6 19 -68.4 0.1% 258 0.3%Aston Martin 4 1 300.0 0.1% 25 0.0%Maserati 4 2 100.0 0.1% 14 0.0%Mahindra 3 - - 0.0% 6 0.0%MG 2 0 200.0 0.0% 12 0.0%Chrysler Jeep 1 - - 0.0% 1 0.0%Mclaren 1 0 100.0 0.0% 6 0.0%Others 3 5 -40.0 0.0% 71 0.1%total 7453 6484 14.9 100.0% 76062 100.0%
New Passenger Vehicle Sales by Model - November 2013Make Model Nov '13 Nov '12 +/- % Nov Mkt
Share2013
total2013 Mkt
ShareToyota Corolla 626 462 35.5 8.4% 5283 6.9%Toyota RAV4 289 80 261.3 3.9% 2521 3.3%Holden Commodore 260 171 52.0 3.5% 2399 3.2%Mazda Cx-5 239 141 69.5 3.2% 1989 2.6%Toyota yaris 227 267 -15.0 3.0% 2235 2.9%Suzuki Swift 218 254 -14.2 2.9% 2750 3.6%Ford Mondeo 184 98 87.8 2.5% 1201 1.6%Hyundai ix35 168 81 107.4 2.3% 1338 1.8%Mitsubishi Lancer 168 84 100.0 2.3% 894 1.2%Toyota Camry 168 131 28.2 2.3% 1270 1.7%Holden Captiva 135 319 -57.7 1.8% 2039 2.7%Volkswagen Golf 134 103 30.1 1.8% 1469 1.9%Toyota Highlander 118 79 49.4 1.6% 1092 1.4%Ford Focus 114 212 -46.2 1.5% 1429 1.9%Honda Jazz 113 76 48.7 1.5% 922 1.2%Ford Kuga 112 18 522.2 1.5% 952 1.3%Mazda Mazda3 109 151 -27.8 1.5% 1537 2.0%Toyota Aurion 107 23 365.2 1.4% 447 0.6%Holden Cruze 106 80 32.5 1.4% 1925 2.5%Hyundai Santa Fe 103 261 -60.5 1.4% 1847 2.4%Honda Civic 100 115 -13.0 1.3% 852 1.1%Mitsubishi Outlander 97 118 -17.8 1.3% 1258 1.7%Hyundai i30 95 103 -7.8 1.3% 1255 1.6%Nissan Qashqai 93 106 -12.3 1.2% 884 1.2%Toyota Landcruiser Prado 87 38 128.9 1.2% 557 0.7%Nissan x-Trail 86 52 65.4 1.2% 779 1.0%Ford Territory 83 137 -39.4 1.1% 1188 1.6%Volkswagen Tiguan 78 53 47.2 1.0% 689 0.9%Hyundai Accent 77 29 165.5 1.0% 572 0.8%Honda CRV 71 82 -13.4 1.0% 793 1.0%Mazda Mazda6 70 82 -14.6 0.9% 960 1.3%Mazda Mazda2 66 77 -14.3 0.9% 712 0.9%Ford Falcon 65 45 44.4 0.9% 835 1.1%Nissan Pathfinder 65 7 828.6 0.9% 191 0.3%Dodge Journey 64 46 39.1 0.9% 476 0.6%Jeep Grand Cherokee 64 39 64.1 0.9% 502 0.7%Ssangyong Korando 63 36 75.0 0.8% 480 0.6%Ford Fiesta 60 85 -29.4 0.8% 892 1.2%Bmw 116i 59 13 353.8 0.8% 378 0.5%Holden Malibu 58 - - 0.8% 334 0.4%Others2254 2130 5.8 30.2% 25936 34.1%total7453 6484 14.9 100.0% 76062 100.0%
Your fi rst choice in automotive lending.UDC Finance Limited lending criteria applies.
Ph 0800 500 832 or visit www.udc.co.nz
850 wds
5000
5500
6000
6500
7000
7500
8000
8500
Jan Feb Mar Apr May Jun Jul Aug Sep Oct Nov Dec
2012
2013
New Passenger registrations - 2012-2013
Subscribe to the latest industry news for FREE by visiting www.autofi le.co.nz/subscribeCONNECT & ENGAGE
DayS StOck in nZ - uSeD iMPOrt carS
180
160
140
120
100
80
60
40
20
0
Jan
Feb
Mar
aPr
May
Jun
JuL
auG
SeP
Oct
nOv
Dec
2013
2012
Day
s of
sto
ck
2014
There was an 8.4 per cent difference between imported used cars sold
in New Zealand during 2013 compared to arrivals.
Last year saw 107,290 units cross the border with 98,971 registrations creating an unsold stockpile of 8,319 cars.
The biggest month for registrations was July with 9,629 units, while November recorded the highest used imports total of 11,184.
January saw the biggest difference between arrivals and sales. There were 7,397 registrations compared to 4,467 units imported for a variance of 2,930.
April tracked in the opposite direction when 7,418 registrations stacked up against 10,531 imports – a difference of 3,113 units.
Tony Everett, dealer services and mediation manager at the Motor Trade Association, says it’s always hard to know what the actual stockpile is because there will always be losses with vehicles being registered as commercials, while some imports don’t arrive.
“We have monitored the cumulative position from 2004 –
dollar had quite an impact on the market last year.
“It’s was something like 64 against our dollar around December 2012 and it wasn’t so long ago that it was touching 74 and 84,” recalls Everett.
“This created advantages for bringing over used imports. If you take a free-on-board price of $6,000 for a vehicle and work backwards, that’s about a 30 per cent change in value between 64 and 74.
“The industry has to accommodate currency volatility. If you’re not buying now, others will be and can undercut you when the yen uplifts.
“If the yen goes down, you might hold out for good money that doesn’t come and you can only sell once.”
Everett points out that the market is different with new vehicles because list-price positions don’t change – but transaction prices do.
Seasonal factors come into playthrough the global financial crisis when stock went through the floor to now,” he says.
“There will always be historical high points, but stock tends to level out in the long term.
“There are some seasonal factors when it comes to stock in hand and sales because our market doesn’t necessarily match Japan’s used export market.”
Arrivals can be high in March, April and May and then from September through to November, which can reflect activity – or a lack of it – in Japan when it’s winter or Golden Week.
“Arrivals in New Zealand can also be seasonal and might not tie in with seasonal impacts in Japan,” Everett told Autofile.
“This may compact at the end of our year with heavy arrivals. If dealers are out of stock, or are worried they will be, that’s when the pressure can go on.
“Other factors include changes to the exhaust emissions rules. It may be critical to get vehicles complied by December 31, but these occasions are quite rare.”
The yen’s cross-rate with the
“On the outside, this seems to be a more orderly market but currency movements cause problems.
“When the value of our dollar changes, it’s not because it’s going up on the yen – it’s because the yen is going down in value on all markets.
“If you are buying used vehicles there, you’re still buying against the competition.”
The total stock-in-hand figure by the end of December was 11,424, with month-on-month increases from September to the end of last year.
The first month of 2014 resulted in stock levels dropping from 11,424 in December to 10,767 used imports, with days of stock in hand dropping from 42 to 35.
The total of used imported cars came to 8,813 last month, which compared to 9,470 sales for a variance of 657.
used car stock

+64 9 411 7425www.autohub.co.nz
Shoulda used AUTOHUB
Use AUTOHUB for reliable delivery (of Cars NOT Horses).
Print Ads Wife has a point to make.indd 1 4/02/14 5:41 pm