australian government ict trends report 2013-14 · 2.3 general notes 7 ... australian government...
TRANSCRIPT
Australian Government ICT Trends Report
2013-14
VERSION 1.0 | JUNE 2015

Australian Government ICT Trends Report
2013-14
VERSION 1.0 | JUNE 2015
Australian Government ICT Trends Report 2013-14 | 2
Contents
Contents 2
1. Executive Summary 5
2. Notes 6
2.1 Agency cohort definitions 6
2.2 Agency cohort composition 6
2.3 General notes 7
2.4 Applicable qualifications 8
2.5 Glossary 9
2.6 Definitions 9
3. Metrics: ICT Expenditure 12
3.1 Total ICT expenditure as a proportion of total agency expenditure 12
3.2 ICT expenditure as a proportion of Government expenditure 13
3.3 ICT expenditure as a proportion of operational expenditure 14
3.4 Business as usual (BAU) ICT expenditure 15
3.5 Operating vs. capital ICT expenditure 16
3.6 ICT expenditure per service tower 17
3.7 ICT expenditure by cost element 18
4. Metrics: ICT FTE 19
4.1 Total ICT FTE 19
4.2 ICT FTE as a proportion of total government FTE 20
4.3 ICT expenditure (excludes voice service tower) per employee head count 21
4.4 Internal ICT FTE 22
4.5 Internal ICT FTE vs. APS employees by pay grade 2013-2014 23
4.6 Internal vs. external BAU and Non-BAU 24
5. Infrastructure 25
5.1 Virtualisation 25
5.2 End user devices 26
5.3 Storage 27
6. Future Directions 28
Australian Government ICT Trends Report 2013-14 | 3
Licensing The Department of Finance is licensed to use, reproduce, adapt, modify, distribute and communicate the information contained in this report. With the exception of the Commonwealth Coat of Arms, and subject to any copyright notices contained in individual documents, all material presented in this report is provided under a Creative Commons Australia Licence (Attribution-Non Commercial 3.0 Unported) (http://creativecommons.org/licenses/by-nc/3.0/). To the extent that copyright subsists in a third party (such as in the material relating to the definitions of cost elements and service towers at pages 11 to 13), permission will be required from the third party to reuse the material. The document must be attributed: “Australian Government ICT Trends Report 2013–14”. Use of the Coat of Arms The terms under which the Coat of Arms can be used are detailed on the following website: http://www.itsanhonour.gov.au/coat-arms/. Contact us Inquiries regarding the licence and any use of this data are welcome at: Digital Government Investment and Assurance Branch Efficiency, Assurance, and Digital Government Governance and Resource Management Group Department of Finance John Gorton Building King Edward Terrace Parkes ACT 2600
Email: [email protected]
Australian Government ICT Trends Report 2013-14 | 4
Australian Government ICT Trends Report 2013-14 | 5
1. Executive Summary
The Australian Government introduced the ICT Benchmarking programme to facilitate better practice and rigour in monitoring the efficiency and effectiveness of ICT investments. The Australian Government ICT Trends Report 2013–14 (the Report) informs the general community and industry about Government ICT use and expenditure.
All Non-Corporate Commonwealth entities participate in the annual ICT benchmarking exercise. Agencies provide data about their ICT costs, personnel and infrastructure. The Department of Finance (Finance) uses the data to assess the whole-of-Australian-Government ICT environment.
The Report provides aggregate figures on:
• total ICT expenditure, breakdowns of expenditure by service tower, and by cost element;
• ICT personnel, including by service tower, whether internal or external, and by level; and
• ICT infrastructure deployed by agencies, including numbers of servers and desktop devices.
Key findings of the Report are:
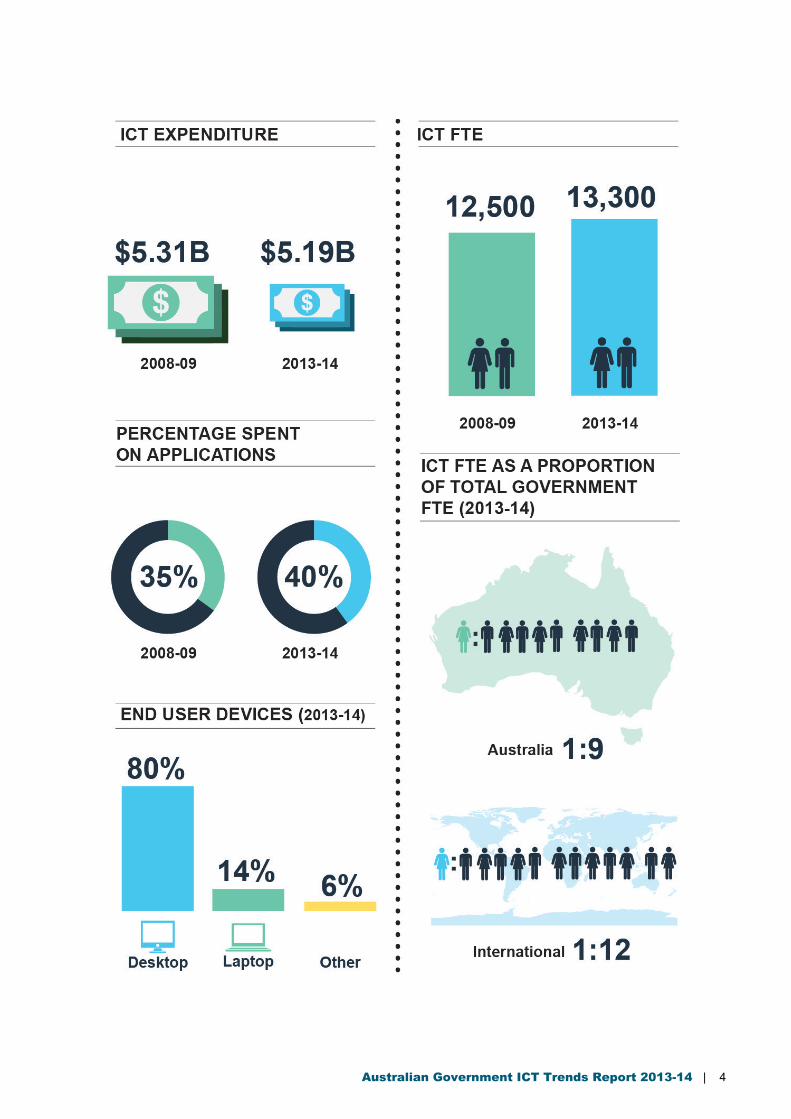
• the Government has an ICT expenditure of $5.19 billion in the Financial Year 2013–14;
• when compared to 2008–09, the total reported ICT expenditure in 2013-14 has decreased by 2.3 per cent (from $5.31 billion to $5.19 billion) while the total reported agency expenditure decreased by 14.7 per cent (from $63.29 billion to $53.96 billion). This has resulted in an increase of ICT expenditure as a proportion of total reported agency expenditure by 14 per cent over the same time period (8.4 per cent to 9.6 per cent);
• from 2012–13 to 2013–14 there was an increase in ICT expenditure of $130 million across the Australian Government; and
• business-as-usual costs remain within the target 70 per cent of expenditure, indicating a sufficient proportion of funds is directed to building new capability.
Finance, in consultation with agencies, has reviewed the programme. A revised framework is proposed to be phased in over the next two years, to provide increased transparency, analysis, and value to the Government and agencies. This will include changes to this Report.
Australian Government ICT Trends Report 2013-14 | 6
2. Notes
2.1 Agency cohort definitions In 2013-14, agencies are classified into cohorts based on their ICT expenditure in the 2012-13 financial year.
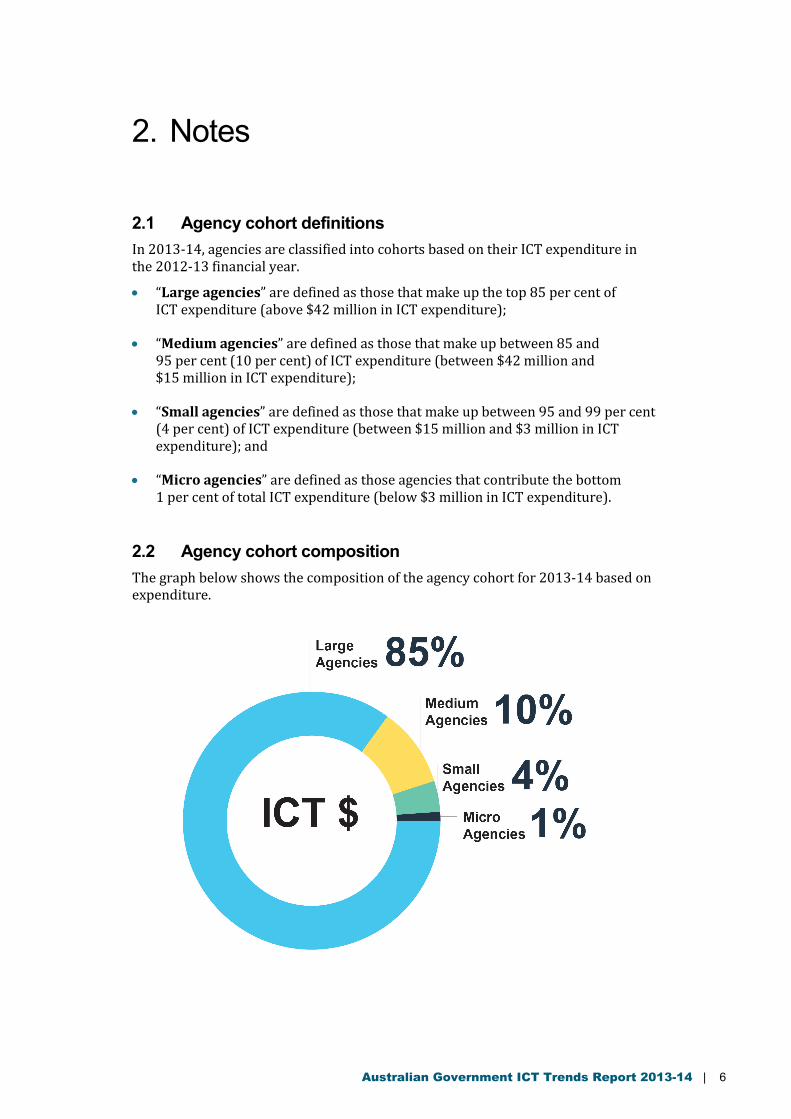
• “Large agencies” are defined as those that make up the top 85 per cent of ICT expenditure (above $42 million in ICT expenditure);
• “Medium agencies” are defined as those that make up between 85 and 95 per cent (10 per cent) of ICT expenditure (between $42 million and $15 million in ICT expenditure);
• “Small agencies” are defined as those that make up between 95 and 99 per cent (4 per cent) of ICT expenditure (between $15 million and $3 million in ICT expenditure); and
• “Micro agencies” are defined as those agencies that contribute the bottom 1 per cent of total ICT expenditure (below $3 million in ICT expenditure).
2.2 Agency cohort composition The graph below shows the composition of the agency cohort for 2013-14 based on expenditure.
Australian Government ICT Trends Report 2013-14 | 7
2.3 General notes
The report should be considered in the wider context ICT expenditure and other metrics should be viewed in conjunction with other efficiency indicators and the Government’s broader agenda.
The data underlying this analysis may change This analysis is based on the data presented to Finance, by agencies, as at 6 May 2015. The findings in these material is subject to the provision of any updated data by agencies after the date of this analysis.
Machinery of Government (MOG), incomplete data, and improvements in the quality of agency reporting makes comparison over time difficult Only agencies that have provided complete and valid data for the calculation of each metric, in all years, have typically been included in the analysis; this is assessed on a metric by metric basis. Data presented in previous iterations of the ICT trends reports may vary to those presented in this report, both as a result of these factors, and as a result of refinements to the data quality. These variations are generally of low significance in the context of whole-of-government reporting.
Agencies have been provided the opportunity to assure the accuracy of their data All data provided have been assessed using a standard statistical methodology; data points that were found to be statistically significant, or shown to have significant variations from data provided in previous years, have been identified to agencies. Agencies were then invited to confirm the accuracy of their data; as such all data included in this analysis are considered to be accurate and, where possible, all available data have been included in the analysis.
Total expenditure metrics excludes intra-government spending Intra-government spending is excluded from whole-of-government expenditure analysis to eliminate double-counting of expenditure.
Most of the data presented relates to Large and Medium cohort agencies Micro and Small Cohort agencies are excluded from some analyses as relevant data is not collected from them.
Australian Government ICT Trends Report 2013-14 | 8
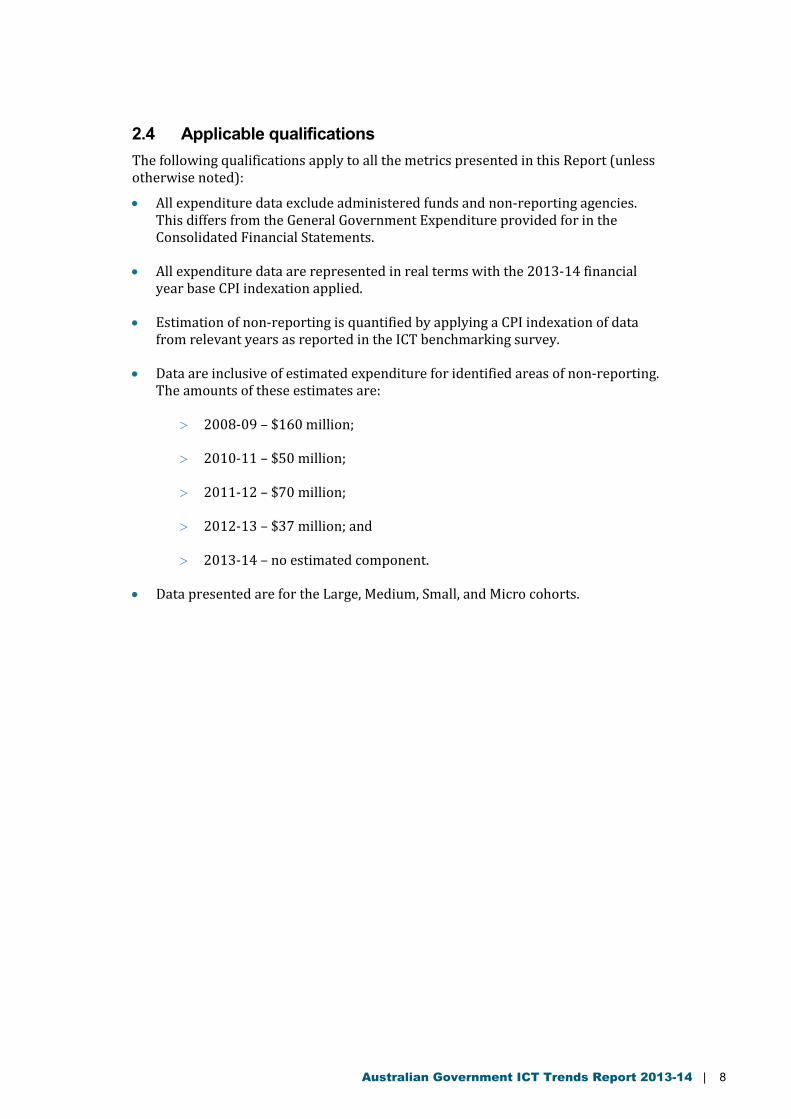
2.4 Applicable qualifications The following qualifications apply to all the metrics presented in this Report (unless otherwise noted):
• All expenditure data exclude administered funds and non-reporting agencies. This differs from the General Government Expenditure provided for in the Consolidated Financial Statements.
• All expenditure data are represented in real terms with the 2013-14 financial year base CPI indexation applied.
• Estimation of non-reporting is quantified by applying a CPI indexation of data from relevant years as reported in the ICT benchmarking survey.
• Data are inclusive of estimated expenditure for identified areas of non-reporting. The amounts of these estimates are:
> 2008-09 – $160 million;
> 2010-11 – $50 million;
> 2011-12 – $70 million;
> 2012-13 – $37 million; and
> 2013-14 – no estimated component.
• Data presented are for the Large, Medium, Small, and Micro cohorts.
Australian Government ICT Trends Report 2013-14 | 9
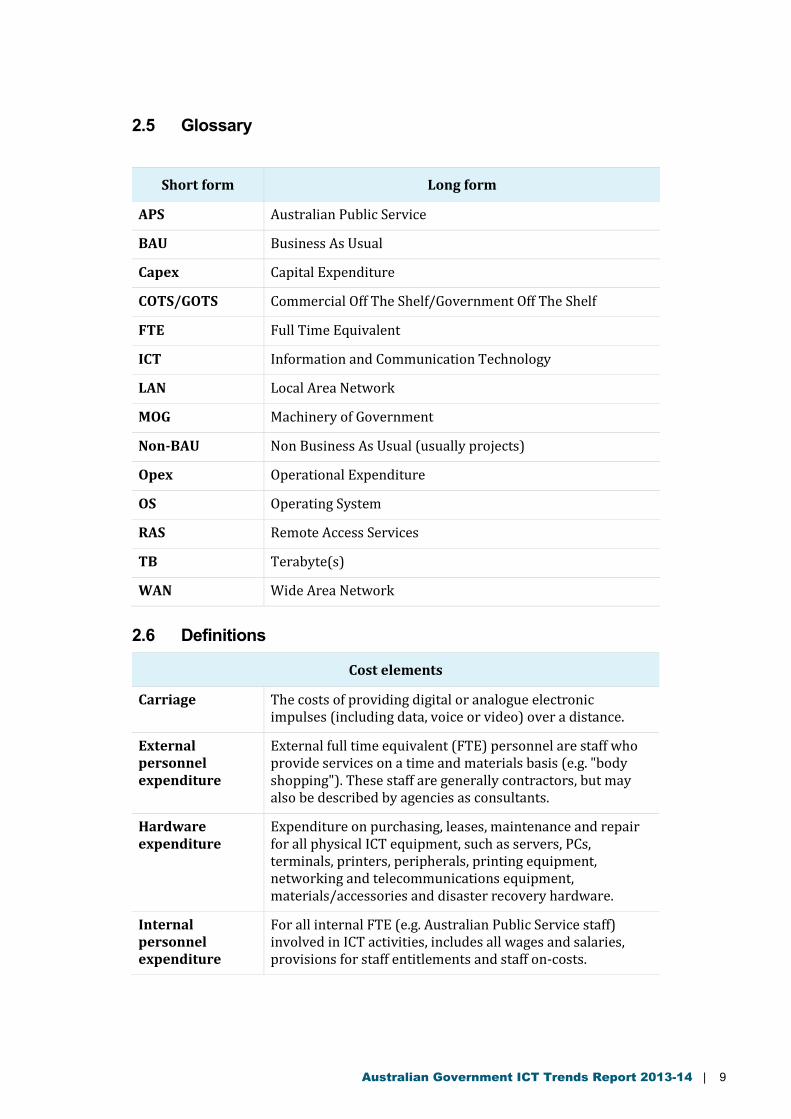
2.5 Glossary
Short form Long form
APS Australian Public Service
BAU Business As Usual
Capex Capital Expenditure
COTS/GOTS Commercial Off The Shelf/Government Off The Shelf
FTE Full Time Equivalent
ICT Information and Communication Technology
LAN Local Area Network
MOG Machinery of Government
Non-BAU Non Business As Usual (usually projects)
Opex Operational Expenditure
OS Operating System
RAS Remote Access Services
TB Terabyte(s)
WAN Wide Area Network
2.6 Definitions
Cost elements
Carriage The costs of providing digital or analogue electronic impulses (including data, voice or video) over a distance.
External personnel expenditure
External full time equivalent (FTE) personnel are staff who provide services on a time and materials basis (e.g. "body shopping"). These staff are generally contractors, but may also be described by agencies as consultants.
Hardware expenditure
Expenditure on purchasing, leases, maintenance and repair for all physical ICT equipment, such as servers, PCs, terminals, printers, peripherals, printing equipment, networking and telecommunications equipment, materials/accessories and disaster recovery hardware.
Internal personnel expenditure
For all internal FTE (e.g. Australian Public Service staff) involved in ICT activities, includes all wages and salaries, provisions for staff entitlements and staff on-costs.
Australian Government ICT Trends Report 2013-14 | 10
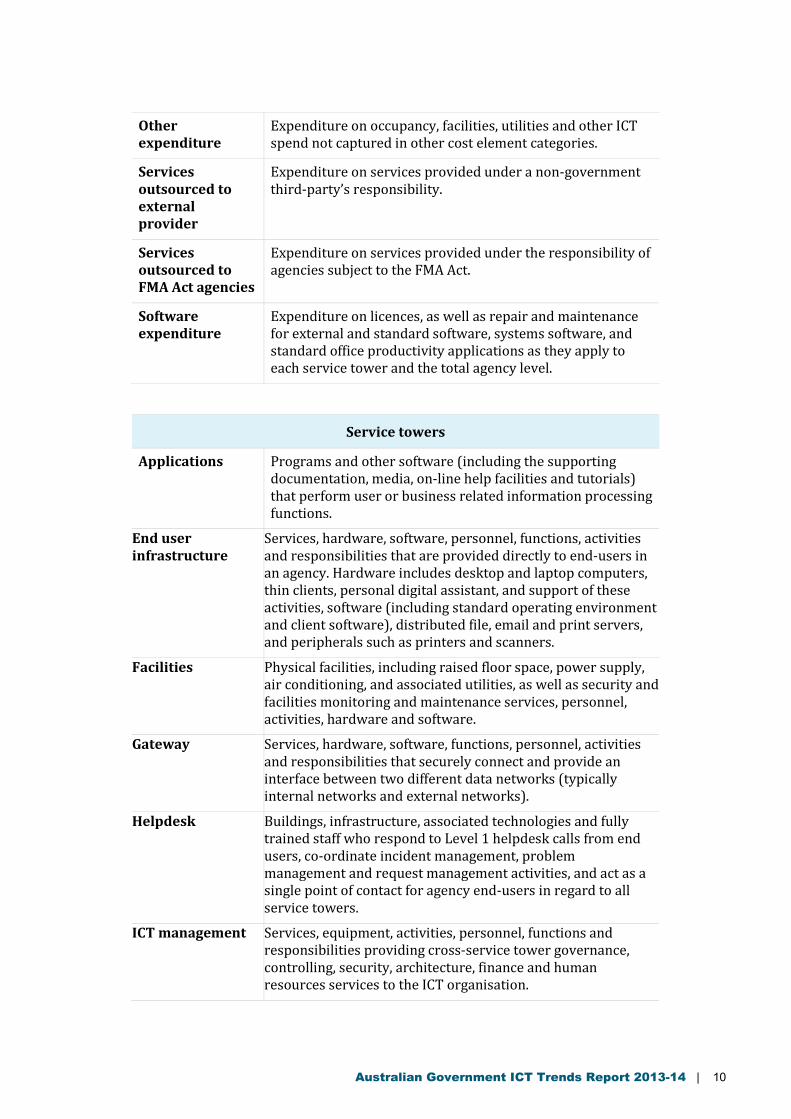
Other expenditure
Expenditure on occupancy, facilities, utilities and other ICT spend not captured in other cost element categories.
Services outsourced to external provider
Expenditure on services provided under a non-government third-party’s responsibility.
Services outsourced to FMA Act agencies
Expenditure on services provided under the responsibility of agencies subject to the FMA Act.
Software expenditure
Expenditure on licences, as well as repair and maintenance for external and standard software, systems software, and standard office productivity applications as they apply to each service tower and the total agency level.
Service towers
Applications Programs and other software (including the supporting documentation, media, on-line help facilities and tutorials) that perform user or business related information processing functions.
End user infrastructure
Services, hardware, software, personnel, functions, activities and responsibilities that are provided directly to end-users in an agency. Hardware includes desktop and laptop computers, thin clients, personal digital assistant, and support of these activities, software (including standard operating environment and client software), distributed file, email and print servers, and peripherals such as printers and scanners.
Facilities Physical facilities, including raised floor space, power supply, air conditioning, and associated utilities, as well as security and facilities monitoring and maintenance services, personnel, activities, hardware and software.
Gateway Services, hardware, software, functions, personnel, activities and responsibilities that securely connect and provide an interface between two different data networks (typically internal networks and external networks).
Helpdesk Buildings, infrastructure, associated technologies and fully trained staff who respond to Level 1 helpdesk calls from end users, co-ordinate incident management, problem management and request management activities, and act as a single point of contact for agency end-users in regard to all service towers.
ICT management Services, equipment, activities, personnel, functions and responsibilities providing cross-service tower governance, controlling, security, architecture, finance and human resources services to the ICT organisation.
Australian Government ICT Trends Report 2013-14 | 11
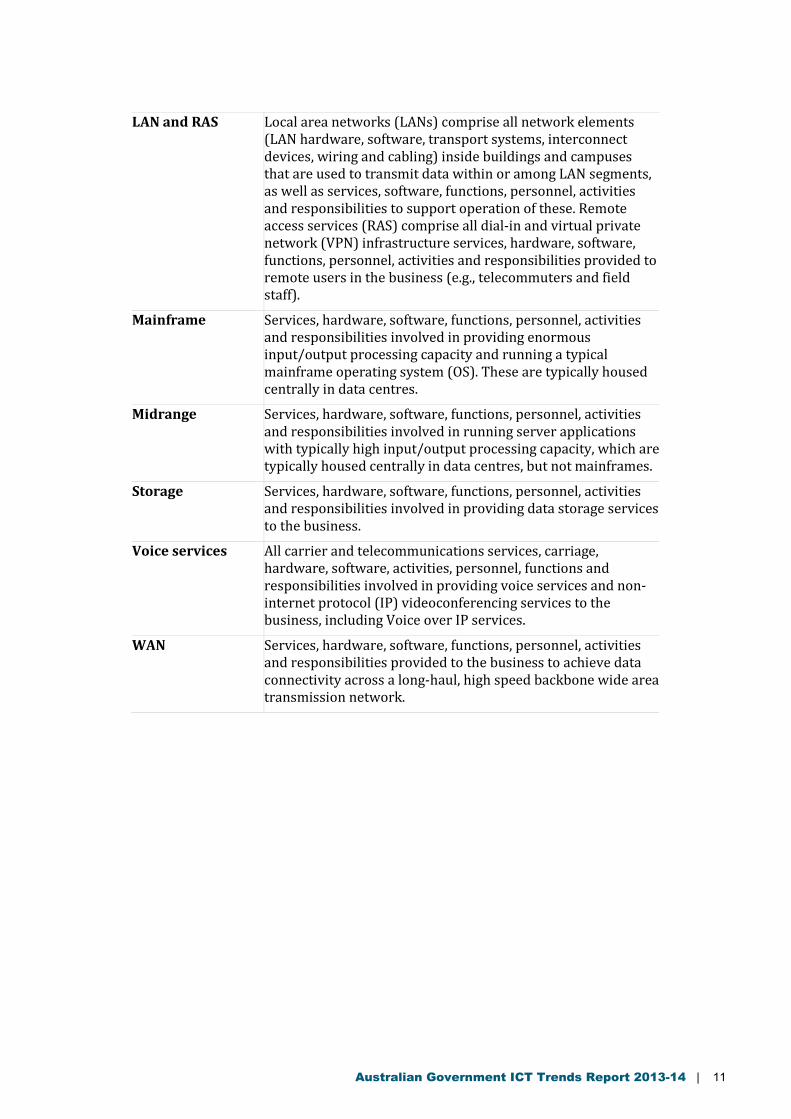
LAN and RAS Local area networks (LANs) comprise all network elements (LAN hardware, software, transport systems, interconnect devices, wiring and cabling) inside buildings and campuses that are used to transmit data within or among LAN segments, as well as services, software, functions, personnel, activities and responsibilities to support operation of these. Remote access services (RAS) comprise all dial-in and virtual private network (VPN) infrastructure services, hardware, software, functions, personnel, activities and responsibilities provided to remote users in the business (e.g., telecommuters and field staff).
Mainframe Services, hardware, software, functions, personnel, activities and responsibilities involved in providing enormous input/output processing capacity and running a typical mainframe operating system (OS). These are typically housed centrally in data centres.
Midrange Services, hardware, software, functions, personnel, activities and responsibilities involved in running server applications with typically high input/output processing capacity, which are typically housed centrally in data centres, but not mainframes.
Storage Services, hardware, software, functions, personnel, activities and responsibilities involved in providing data storage services to the business.
Voice services All carrier and telecommunications services, carriage, hardware, software, activities, personnel, functions and responsibilities involved in providing voice services and non-internet protocol (IP) videoconferencing services to the business, including Voice over IP services.
WAN Services, hardware, software, functions, personnel, activities and responsibilities provided to the business to achieve data connectivity across a long-haul, high speed backbone wide area transmission network.
Australian Government ICT Trends Report 2013-14 | 12
3. Metrics: ICT Expenditure
3.1 Total ICT expenditure as a proportion of total agency expenditure
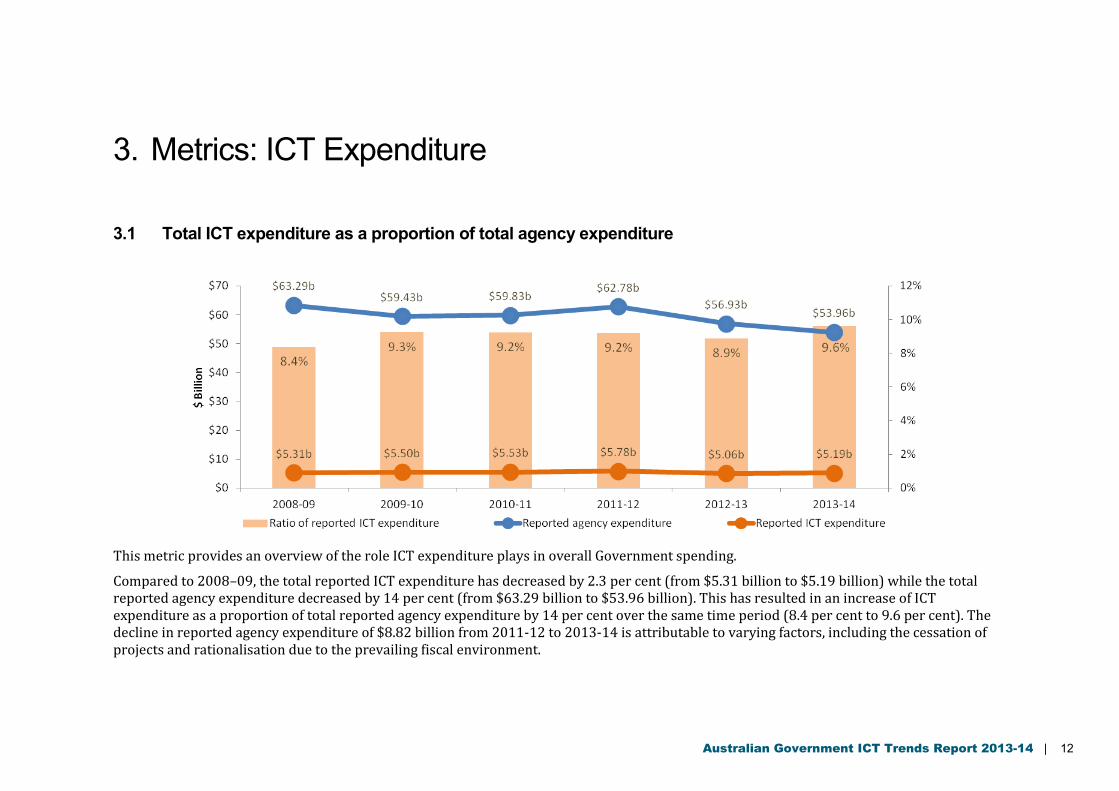
This metric provides an overview of the role ICT expenditure plays in overall Government spending.
Compared to 2008–09, the total reported ICT expenditure has decreased by 2.3 per cent (from $5.31 billion to $5.19 billion) while the total reported agency expenditure decreased by 14 per cent (from $63.29 billion to $53.96 billion). This has resulted in an increase of ICT expenditure as a proportion of total reported agency expenditure by 14 per cent over the same time period (8.4 per cent to 9.6 per cent). The decline in reported agency expenditure of $8.82 billion from 2011-12 to 2013-14 is attributable to varying factors, including the cessation of projects and rationalisation due to the prevailing fiscal environment.
Australian Government ICT Trends Report 2013-14 | 13
3.2 ICT expenditure as a proportion of Government expenditure
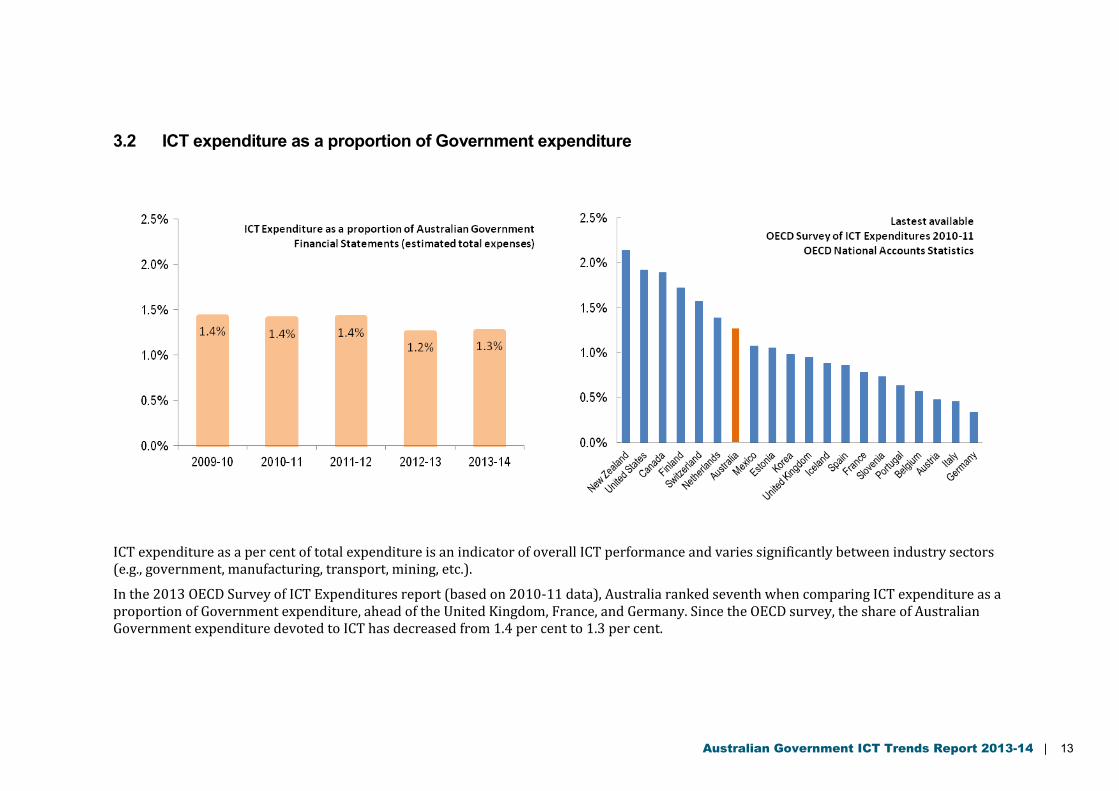
ICT expenditure as a per cent of total expenditure is an indicator of overall ICT performance and varies significantly between industry sectors (e.g., government, manufacturing, transport, mining, etc.).
In the 2013 OECD Survey of ICT Expenditures report (based on 2010-11 data), Australia ranked seventh when comparing ICT expenditure as a proportion of Government expenditure, ahead of the United Kingdom, France, and Germany. Since the OECD survey, the share of Australian Government expenditure devoted to ICT has decreased from 1.4 per cent to 1.3 per cent.
Australian Government ICT Trends Report 2013-14 | 14
3.3 ICT expenditure as a proportion of operational expenditure
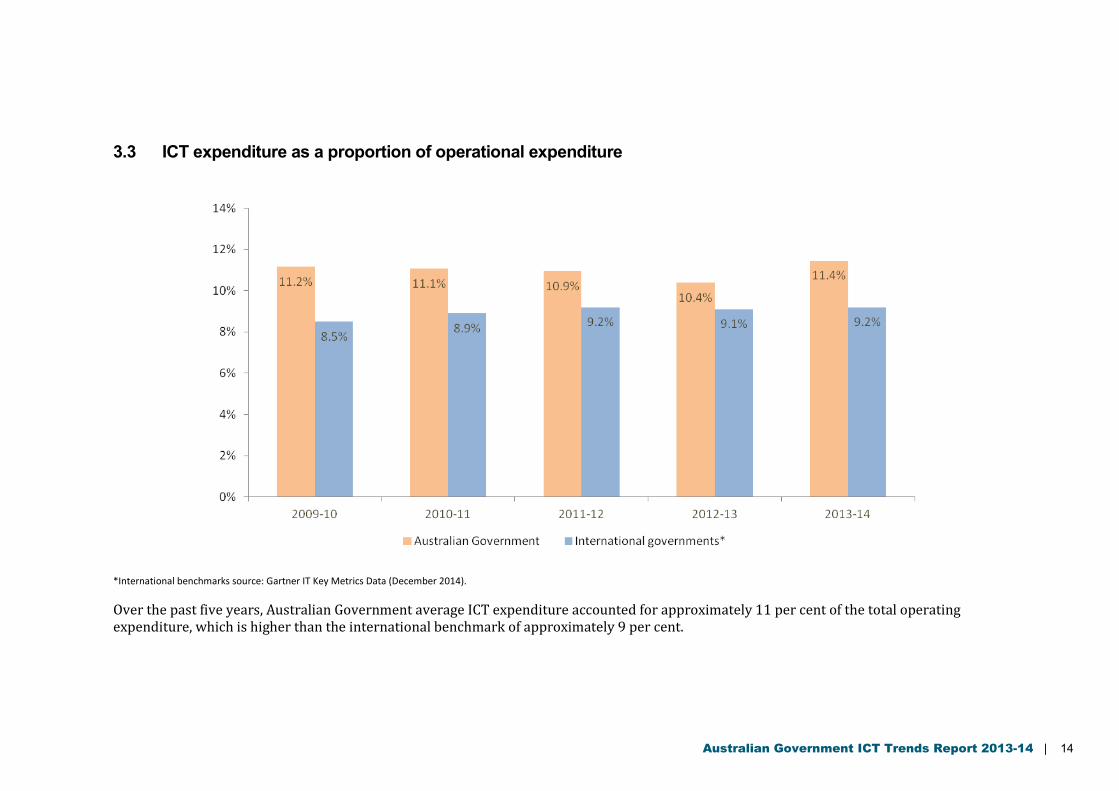
*International benchmarks source: Gartner IT Key Metrics Data (December 2014).
Over the past five years, Australian Government average ICT expenditure accounted for approximately 11 per cent of the total operating expenditure, which is higher than the international benchmark of approximately 9 per cent.
Australian Government ICT Trends Report 2013-14 | 15
3.4 Business as usual (BAU) ICT expenditure
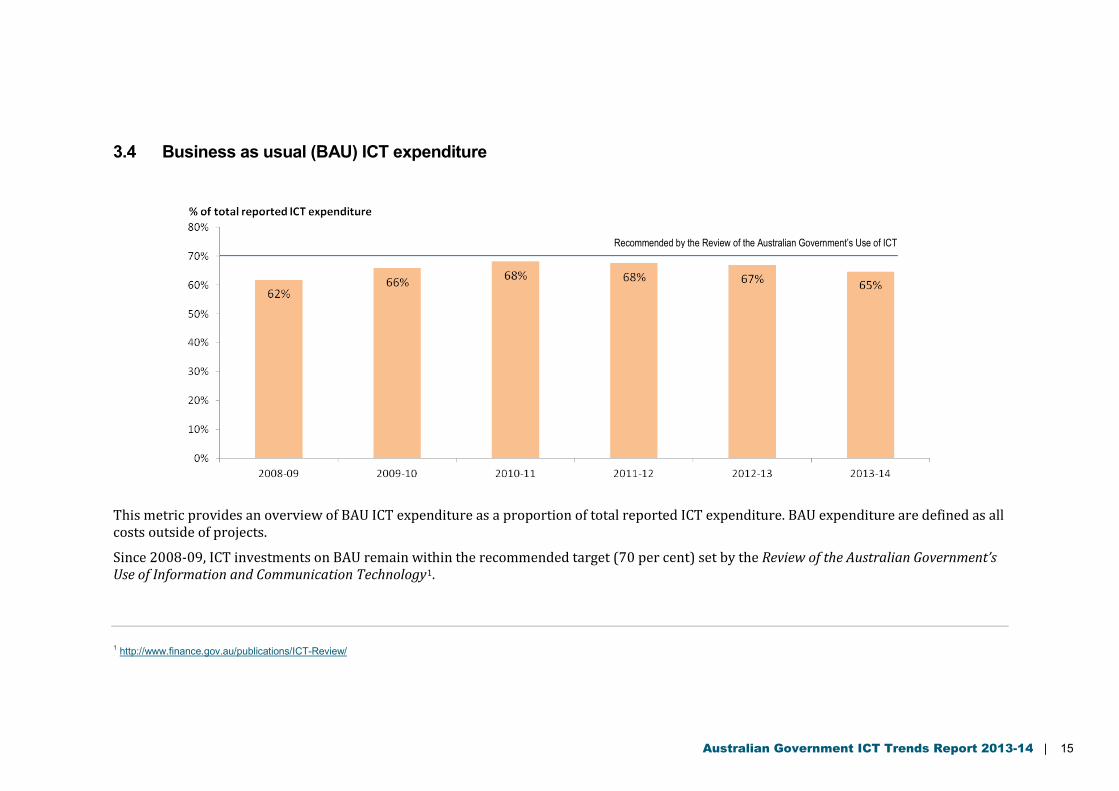
This metric provides an overview of BAU ICT expenditure as a proportion of total reported ICT expenditure. BAU expenditure are defined as all costs outside of projects.
Since 2008-09, ICT investments on BAU remain within the recommended target (70 per cent) set by the Review of the Australian Government’s Use of Information and Communication Technology1.
1 http://www.finance.gov.au/publications/ICT-Review/
Recommended by the Review of the Australian Government’s Use of ICT
Australian Government ICT Trends Report 2013-14 | 16
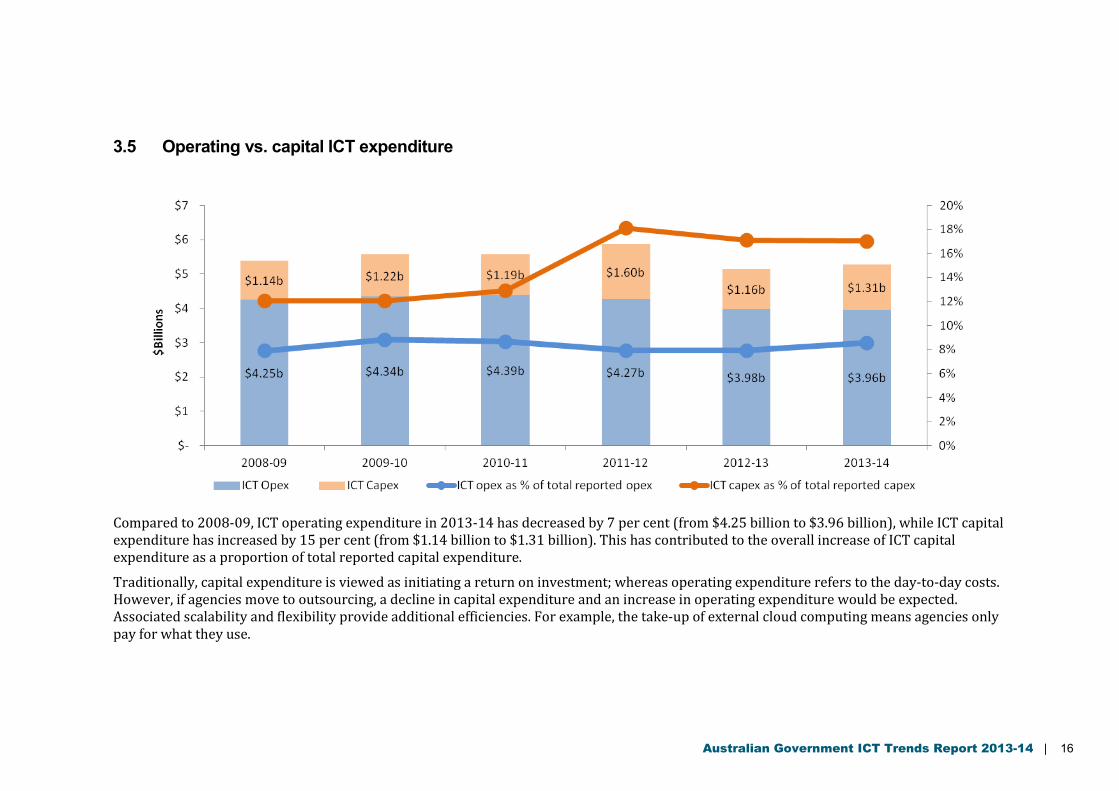
3.5 Operating vs. capital ICT expenditure
Compared to 2008-09, ICT operating expenditure in 2013-14 has decreased by 7 per cent (from $4.25 billion to $3.96 billion), while ICT capital expenditure has increased by 15 per cent (from $1.14 billion to $1.31 billion). This has contributed to the overall increase of ICT capital expenditure as a proportion of total reported capital expenditure.
Traditionally, capital expenditure is viewed as initiating a return on investment; whereas operating expenditure refers to the day-to-day costs. However, if agencies move to outsourcing, a decline in capital expenditure and an increase in operating expenditure would be expected. Associated scalability and flexibility provide additional efficiencies. For example, the take-up of external cloud computing means agencies only pay for what they use.
Australian Government ICT Trends Report 2013-14 | 17
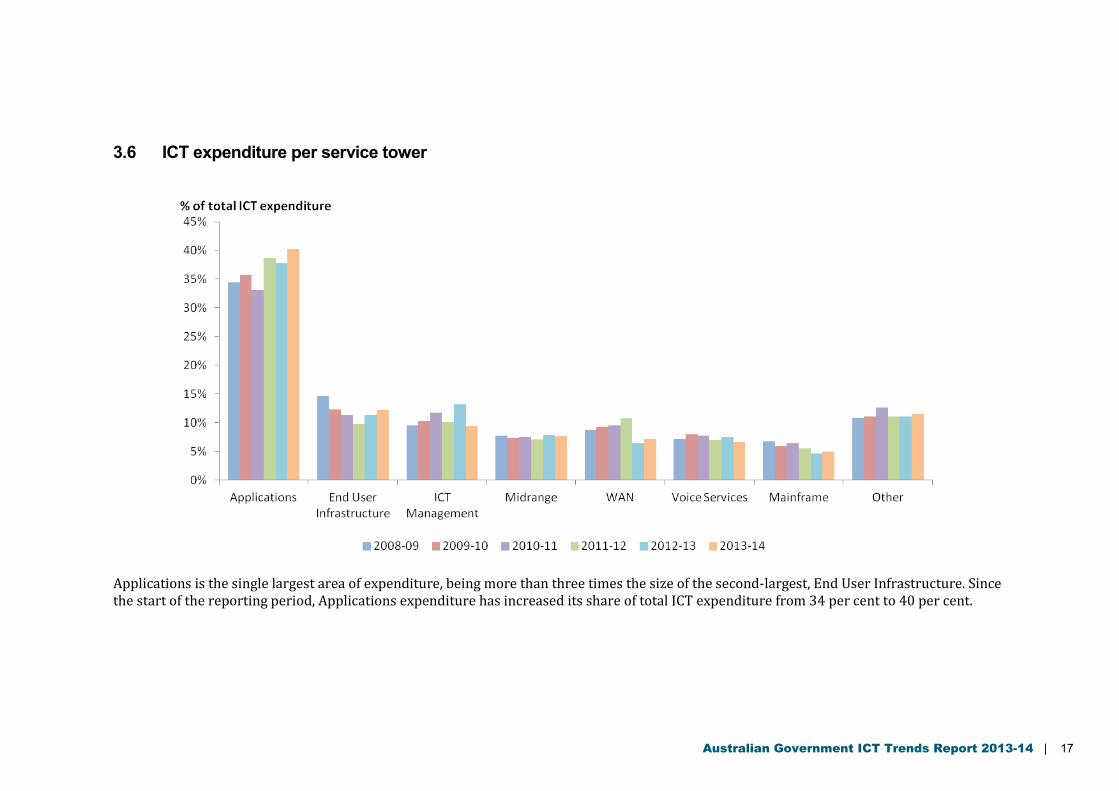
3.6 ICT expenditure per service tower
Applications is the single largest area of expenditure, being more than three times the size of the second-largest, End User Infrastructure. Since the start of the reporting period, Applications expenditure has increased its share of total ICT expenditure from 34 per cent to 40 per cent.
Australian Government ICT Trends Report 2013-14 | 18
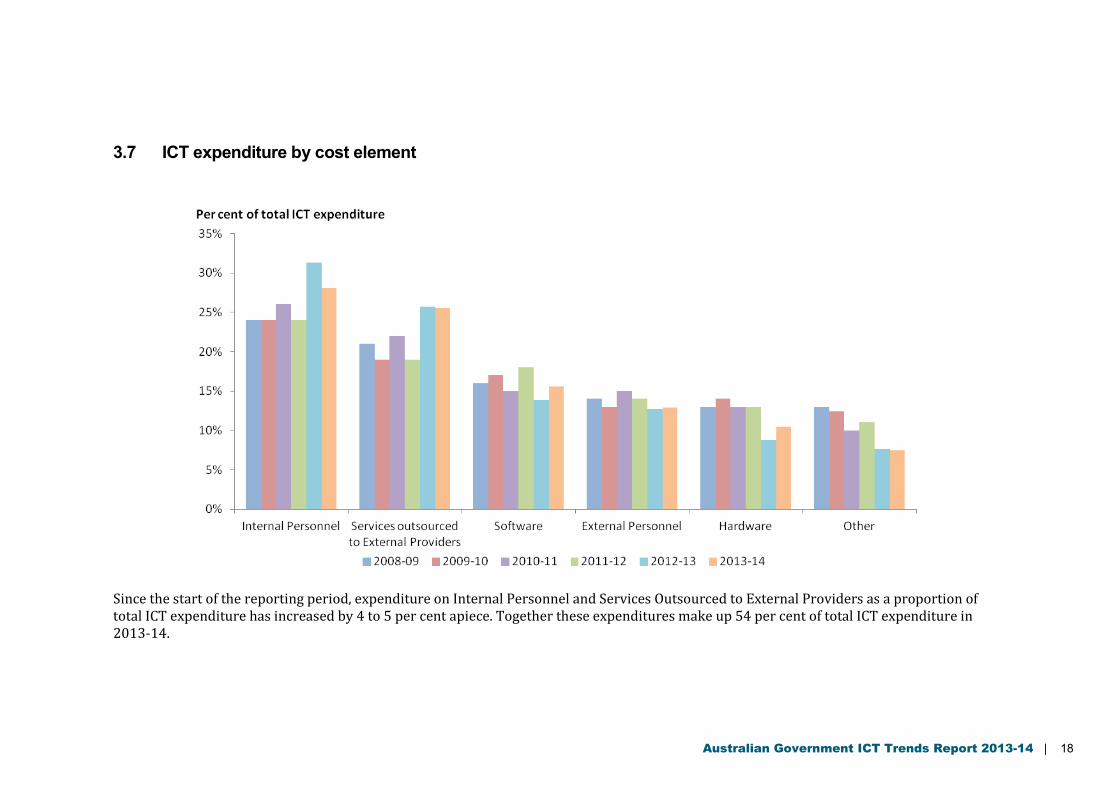
3.7 ICT expenditure by cost element
Since the start of the reporting period, expenditure on Internal Personnel and Services Outsourced to External Providers as a proportion of total ICT expenditure has increased by 4 to 5 per cent apiece. Together these expenditures make up 54 per cent of total ICT expenditure in 2013-14.
Australian Government ICT Trends Report 2013-14 | 19
4. Metrics: ICT FTE
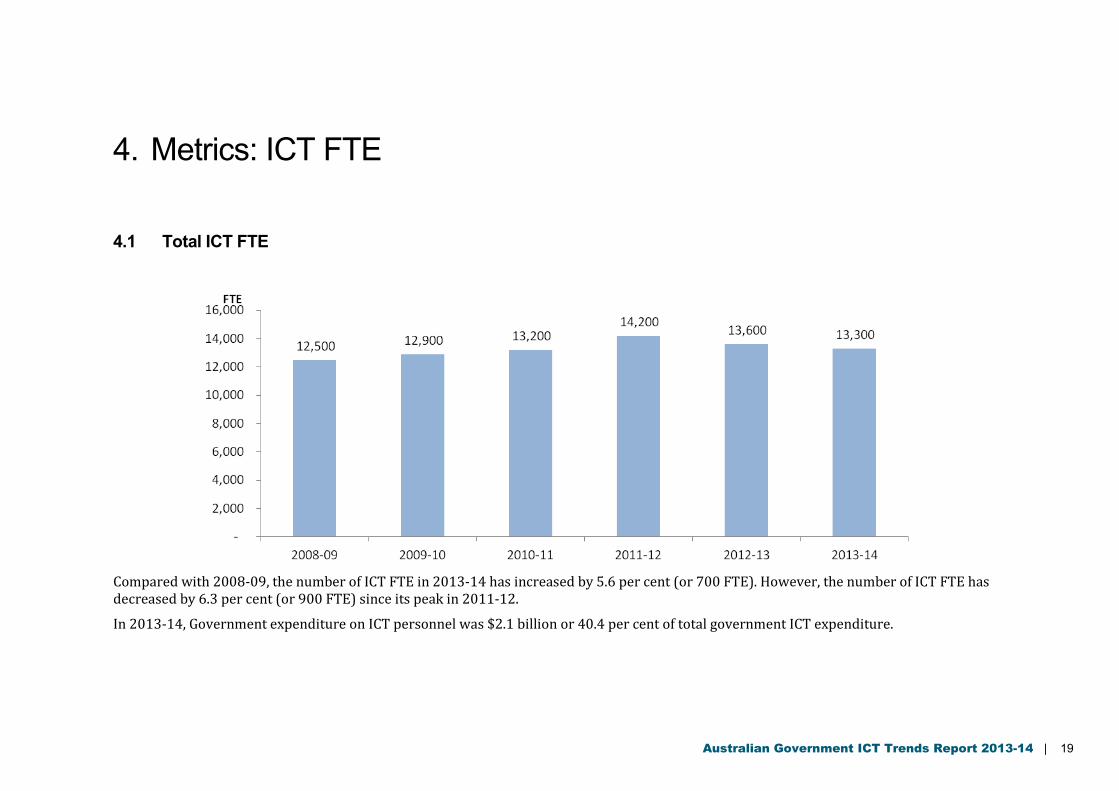
4.1 Total ICT FTE
Compared with 2008-09, the number of ICT FTE in 2013-14 has increased by 5.6 per cent (or 700 FTE). However, the number of ICT FTE has decreased by 6.3 per cent (or 900 FTE) since its peak in 2011-12.
In 2013-14, Government expenditure on ICT personnel was $2.1 billion or 40.4 per cent of total government ICT expenditure.
Australian Government ICT Trends Report 2013-14 | 20
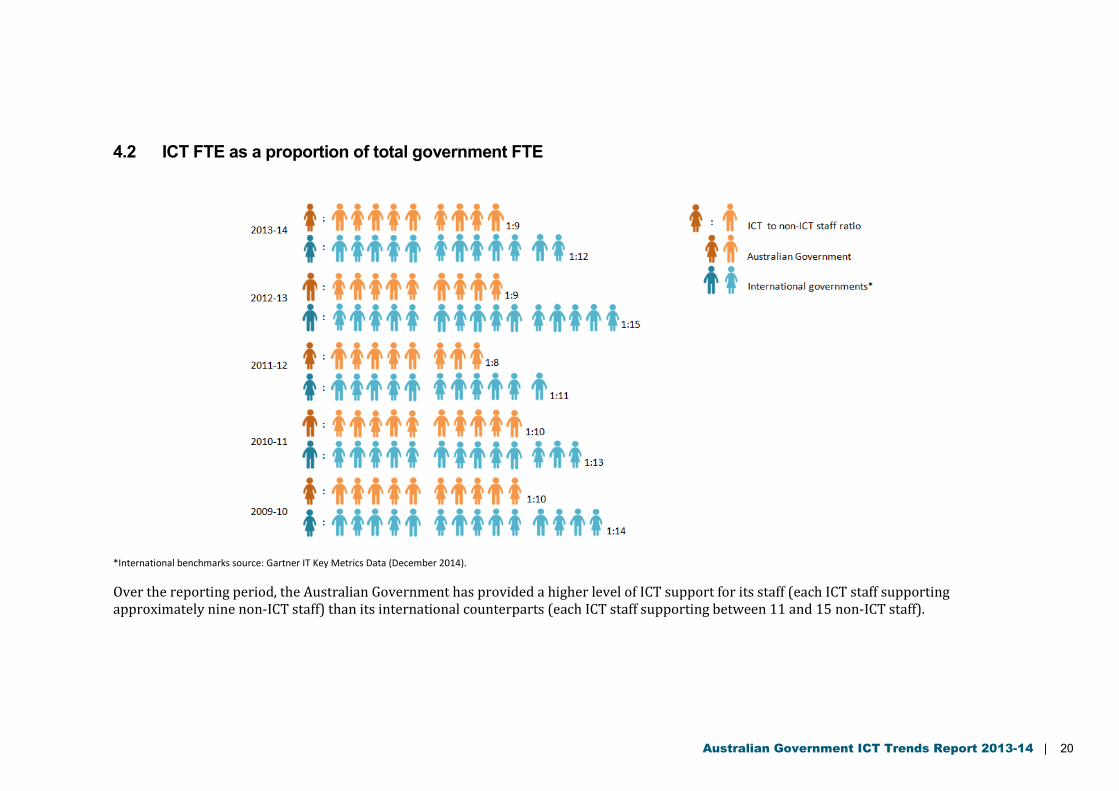
4.2 ICT FTE as a proportion of total government FTE
*International benchmarks source: Gartner IT Key Metrics Data (December 2014).
Over the reporting period, the Australian Government has provided a higher level of ICT support for its staff (each ICT staff supporting approximately nine non-ICT staff) than its international counterparts (each ICT staff supporting between 11 and 15 non-ICT staff).
Australian Government ICT Trends Report 2013-14 | 21
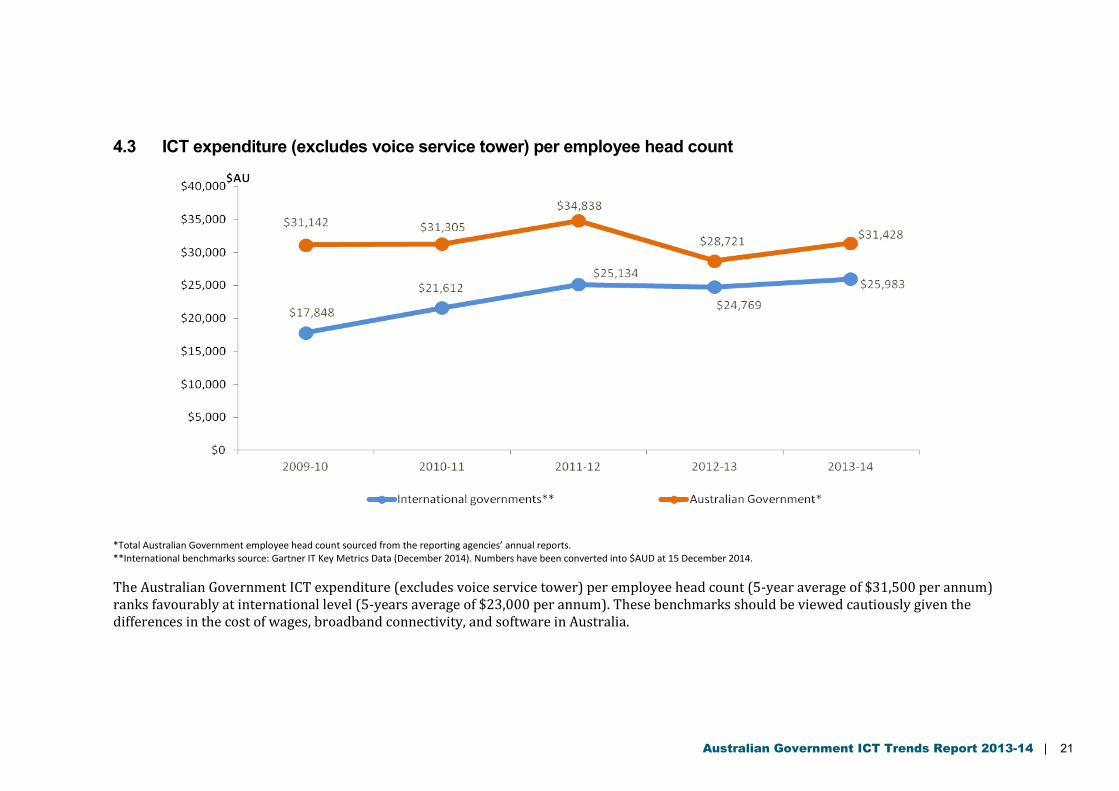
4.3 ICT expenditure (excludes voice service tower) per employee head count
*Total Australian Government employee head count sourced from the reporting agencies’ annual reports. **International benchmarks source: Gartner IT Key Metrics Data (December 2014). Numbers have been converted into $AUD at 15 December 2014.
The Australian Government ICT expenditure (excludes voice service tower) per employee head count (5-year average of $31,500 per annum) ranks favourably at international level (5-years average of $23,000 per annum). These benchmarks should be viewed cautiously given the differences in the cost of wages, broadband connectivity, and software in Australia.
Australian Government ICT Trends Report 2013-14 | 22
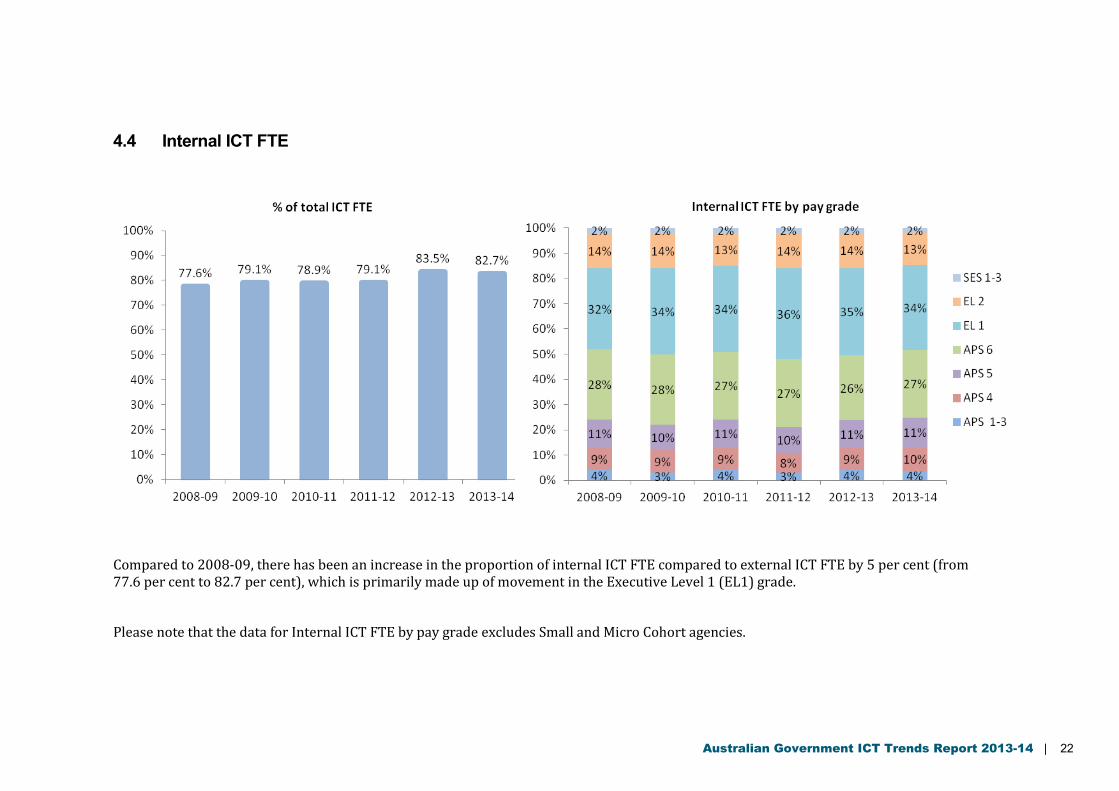
4.4 Internal ICT FTE
Compared to 2008-09, there has been an increase in the proportion of internal ICT FTE compared to external ICT FTE by 5 per cent (from 77.6 per cent to 82.7 per cent), which is primarily made up of movement in the Executive Level 1 (EL1) grade.
Please note that the data for Internal ICT FTE by pay grade excludes Small and Micro Cohort agencies.
Australian Government ICT Trends Report 2013-14 | 23
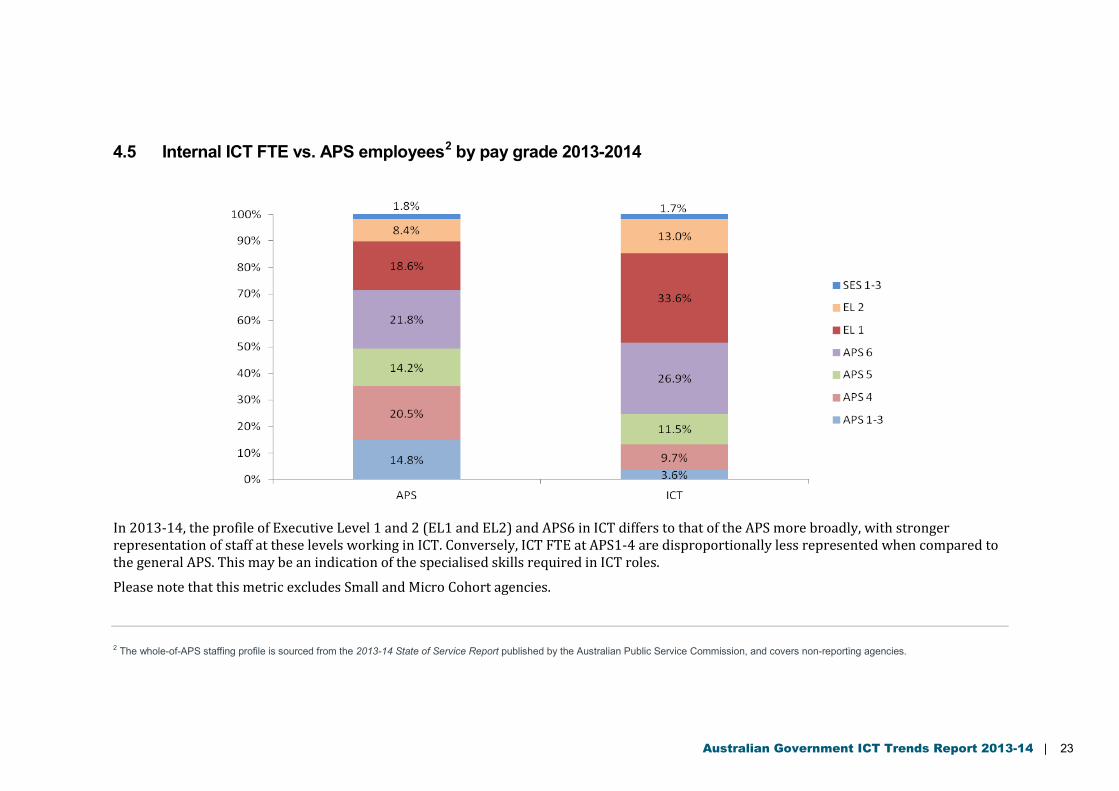
4.5 Internal ICT FTE vs. APS employees2 by pay grade 2013-2014
In 2013-14, the profile of Executive Level 1 and 2 (EL1 and EL2) and APS6 in ICT differs to that of the APS more broadly, with stronger representation of staff at these levels working in ICT. Conversely, ICT FTE at APS1-4 are disproportionally less represented when compared to the general APS. This may be an indication of the specialised skills required in ICT roles.
Please note that this metric excludes Small and Micro Cohort agencies.
2 The whole-of-APS staffing profile is sourced from the 2013-14 State of Service Report published by the Australian Public Service Commission, and covers non-reporting agencies.
Australian Government ICT Trends Report 2013-14 | 24
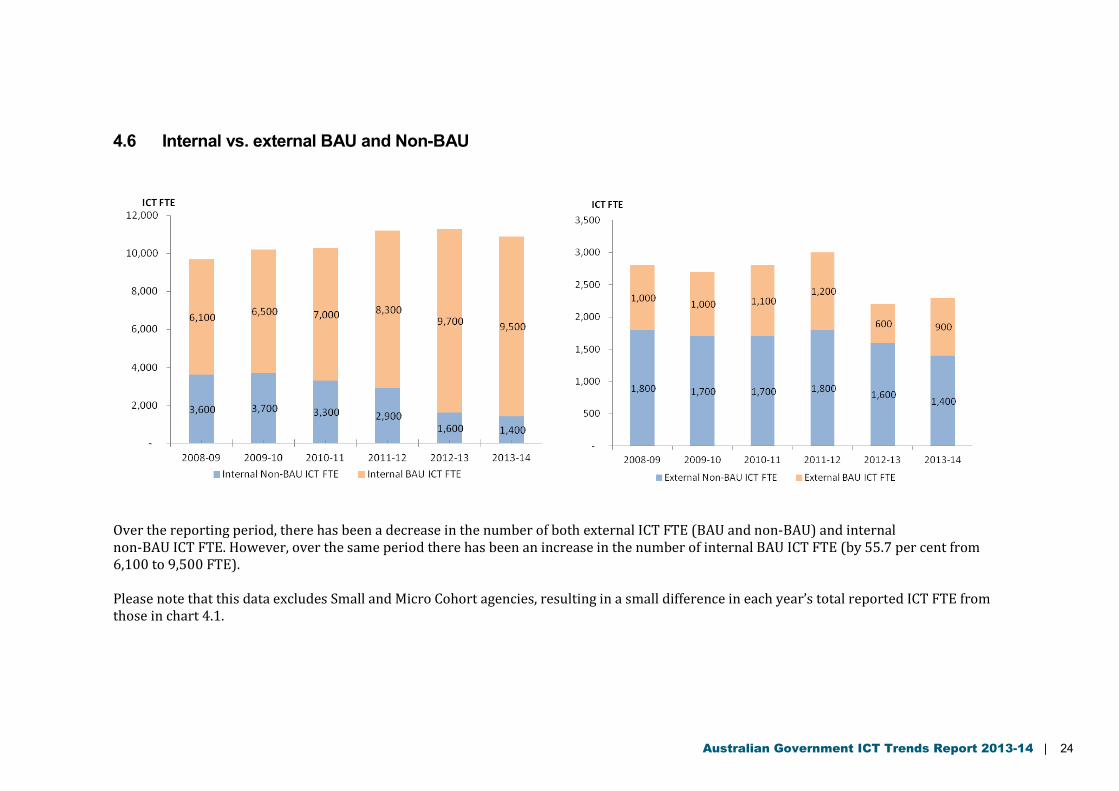
4.6 Internal vs. external BAU and Non-BAU
Over the reporting period, there has been a decrease in the number of both external ICT FTE (BAU and non-BAU) and internal non-BAU ICT FTE. However, over the same period there has been an increase in the number of internal BAU ICT FTE (by 55.7 per cent from 6,100 to 9,500 FTE). Please note that this data excludes Small and Micro Cohort agencies, resulting in a small difference in each year’s total reported ICT FTE from those in chart 4.1.
Australian Government ICT Trends Report 2013-14 | 25
5. Infrastructure
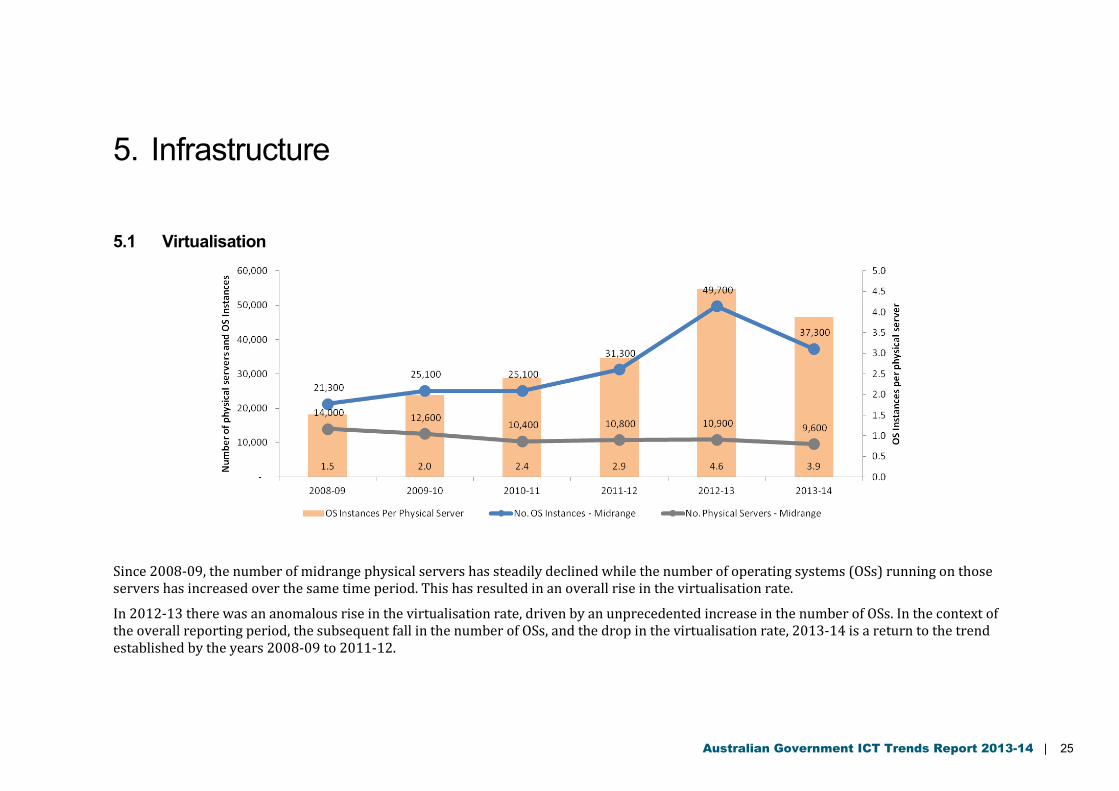
5.1 Virtualisation
Since 2008-09, the number of midrange physical servers has steadily declined while the number of operating systems (OSs) running on those servers has increased over the same time period. This has resulted in an overall rise in the virtualisation rate.
In 2012-13 there was an anomalous rise in the virtualisation rate, driven by an unprecedented increase in the number of OSs. In the context of the overall reporting period, the subsequent fall in the number of OSs, and the drop in the virtualisation rate, 2013-14 is a return to the trend established by the years 2008-09 to 2011-12.
Australian Government ICT Trends Report 2013-14 | 26
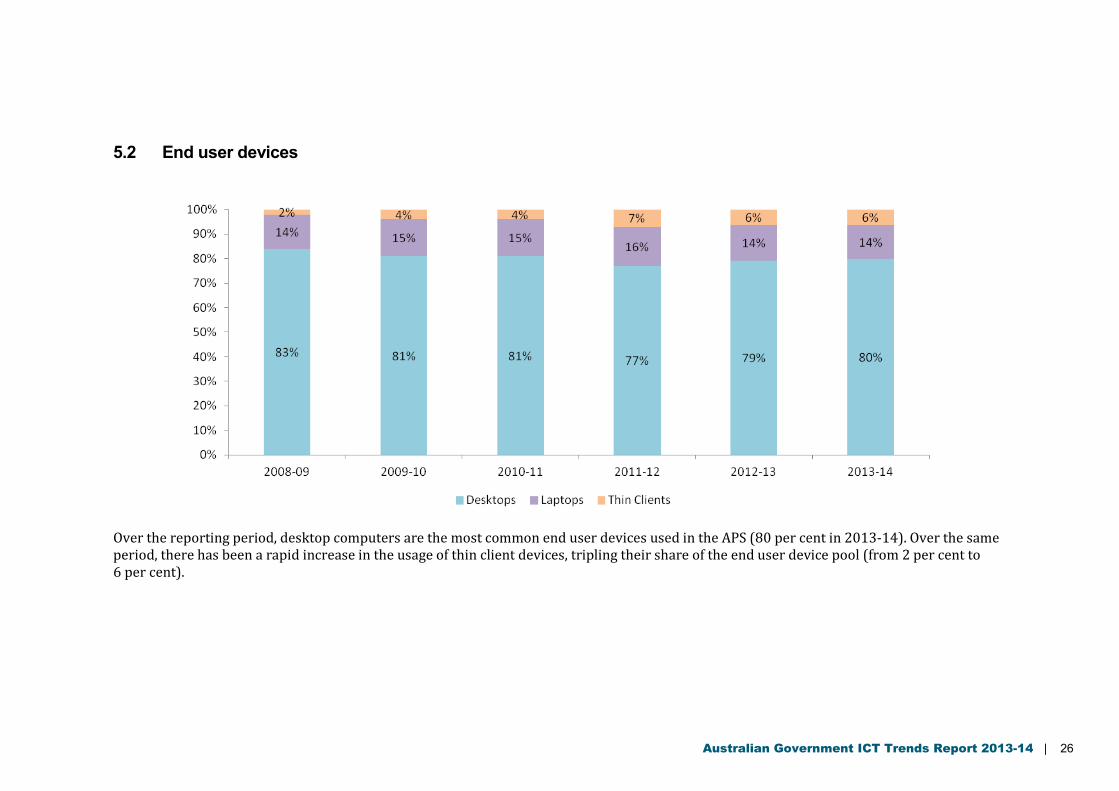
5.2 End user devices
Over the reporting period, desktop computers are the most common end user devices used in the APS (80 per cent in 2013-14). Over the same period, there has been a rapid increase in the usage of thin client devices, tripling their share of the end user device pool (from 2 per cent to 6 per cent).
Australian Government ICT Trends Report 2013-14 | 27
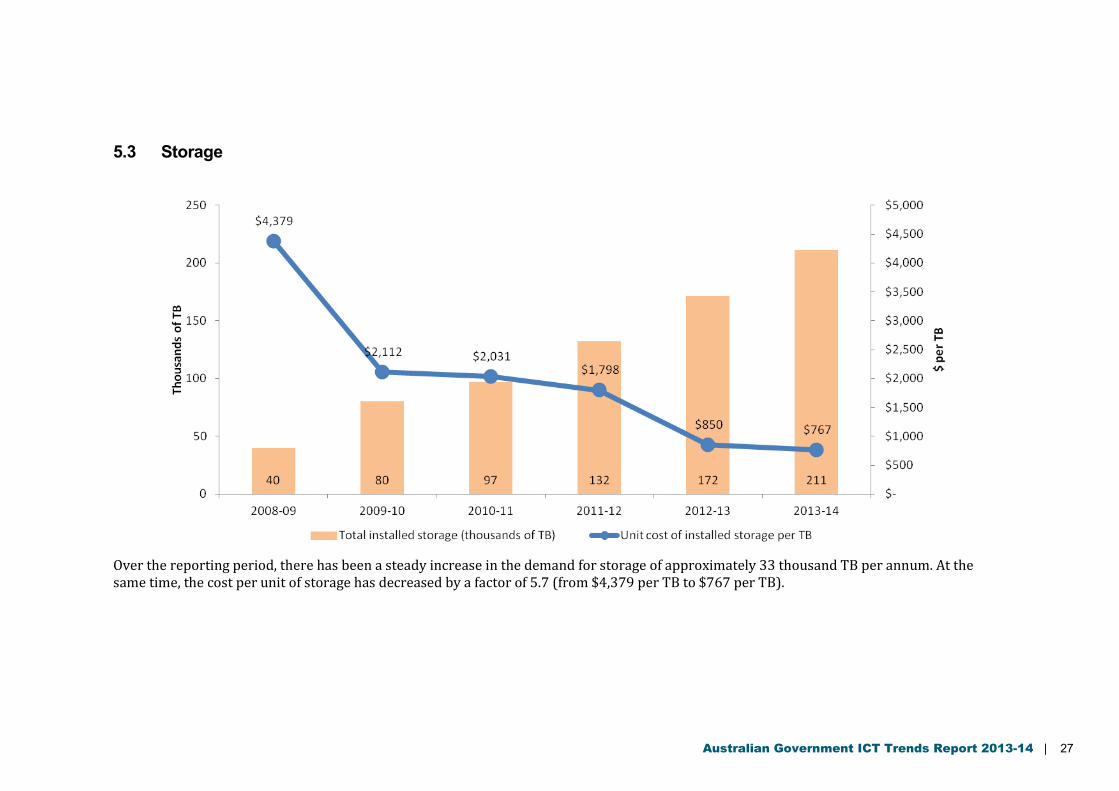
5.3 Storage
Over the reporting period, there has been a steady increase in the demand for storage of approximately 33 thousand TB per annum. At the same time, the cost per unit of storage has decreased by a factor of 5.7 (from $4,379 per TB to $767 per TB).
Australian Government ICT Trends Report 2013-14 | 28
6. Future Directions
Finance, in consultation with agencies, has reviewed the programme. A revised framework is proposed to be phased in over the next two years, to provide increased transparency, analysis, and value to the Government and agencies. This will include changes to this Report.
Finance welcomes questions or feedback on this report via email at [email protected].