august 2011 - global energy network institute - geni ... · 1. germany’s current ... biogas-block...
TRANSCRIPT
Is 100% Renewable Energy possible for Germany by 2020?
August 2011
Patrick Grosskopf Research Associate, Global Energy Network Institute (GENI)
Under the supervision of and editing by Peter Meisen
President, Global Energy Network Institute (GENI) www.geni.org
[email protected] (619) 595-0139
- 2 -
Table of Contents
Introduction 5
1. Germany’s current situation – energy supply and consumption 6
1.1. Current CO2 emissions and consumption 7
2. Job Creation 9
3. The Electrical Grid 10
4. Five Different Plans for 100% Renewable Electricity in Germany 15
5. Renewable Technologies and their Potential 15
5.1. Wind Power 16
5.2. Solar Power in Germany 22
5.3. Geothermal Energy Production in Germany 25
5.4. Hydropower in Germany 26
5.5. Biomass Energy in Germany 28
6. Combined Cycle Power Plant 30
7. Steps in the Wrong Direction – Lignite (Brown Coal) 31
8. Concluding Remarks 34
9. Bibliography 36
- 3 -
Table of figures
1. Figure 1 The electricity mix in Germany 6
2. Figure 2 CO2 Emissions Germany 7
3. Figure 3 Different power plant types and their CO2 emissions 8
4. Figure 4 Gross Power consumption Germany 8
5. Figure 5 Development of jobs in the renewable energy sector 9
6. Figure 6 Renewable Energy: 300,000 jobs in 2009 9
7. Figure 7 The electric grid system in Germany 11
8. Figure 8 Transmission network operators 12
9. Figure 9 Germany electricity exchange 13
10. Figure 10 Planned expansion of the German electricity grid. 2007 15
11. Figure 11 Energy Concept 2050: The FVEE feasibility study 15
12. Figure 12 Climate-friendly, safe, affordable: The SRU’s cost study 15
13. Figure 13 Energy Goal 2050: Federal Environment Agency Study 15
14. Figure 14 Energy Concept 2050 15
15. Figure 15 Climate-friendly, safe, affordable: The SRU’s cost study 15
16. Figure16 Installed Capacity 2008 16
17. Figure 17 Top 10 Wind Countries 17
18. Figure 18 Wind capacity per land area 17
19. Figure 19 Repowering 18
20. Figure 20 Expanding size of wind turbines 18
21. Figure 21 Model of a 5MW wind turbine at Alpha 19
22. Figure 22 Off-Shore regions Germany 20
23. Figure 23 Solar irradiation Germany 22
24. Figure 24 Future solar and domestic electricity development 23
- 4 -
25. Figure 25 PV system prices decrease steadily 24
26. Figure 26 Silicon-Solar-cell in a solar module 24
27. Figure 27 Energy from the depth – Geothermal Energy 26
28. Figure 28 Technologies and operating depths 26
29. Figure 29 Development of hydropower use in Germany 27
30. Figure 30 Roundup of Germany’s future available biomass sources and
their technical potential 28
31. Figure 31 Structure of heat supply from biomass in Germany 2010 29
32. Figure 32 Development of biomass use for heat supply in Germany 29
33. Figure 33 Combined Cycle Plant 30
34. Figure 34 Lignite extraction by country 31
35. Figure 35 Actual and planned coal power plants in Germany 32
36. Figure 36 Space requirements of coal mines 33
- 5 -
Introduction
This report focuses on how and whether it is possible for Germany to have all of its electricity
generated by renewable energy resources within the next ten years. It is fairly obvious that if
possible, the chances of fruition are extremely low. Nevertheless is it extremely important to
show decision makers and leaders the high potential, technology and possibility of green energy
in Germany.
Germany is like many other OECD countries which are highly dependent on fossil fuels,
especially fossil fuels. Germany’s fossil fuel deposits are very minor. Only 20.9 million tons1 of
petroleum oil are available for production. The lack of resources has created a high dependency
on oil producing countries in the Middle East and Russia. Prices are rising every year and
political conflicts have caused shortcuts several times in the past. Incidents and rising prices will
continue.
For many decades, nuclear power plants were considered a safe and eco-friendly alternative to
burning fossil fuels. The Fukushima nuclear disaster in 2011 has proven the advocates of nuclear
power wrong. The dangers of this technology are simply too high and the waste problem has
never been resolved. This catastrophe has led German politicians to pass a law that all remaining
nuclear power plants have to be shut down by 2022. Consequently, nuclear power will not be
taken into consideration in this report.
Detractors of renewables often state that by shutting down coal and nuclear power plants, etc.
many will lose their jobs and create high economic losses. Many studies have proven them
wrong. In 2011 Germany is already one of the world leaders in wind, solar and bioenergy and by
the year 2020 there will be estimated investments of over €200 billion into the renewable sector
and 500,000 jobs could be created by 2020 (More about the job market in the following).
So Germany has the potential and the need of becoming a leading market for resource-
efficiency and green energies. The first step has been taken by phasing out its nuclear power
plants. The clean energy technologies are ready and the urgency can be felt in everybody’s
consciousness.
1 http://www.erdoel-erdgas.de/Reserven-175-1-69b.html
- 6 -
1. Germany’s current situation – energy supply and consumption
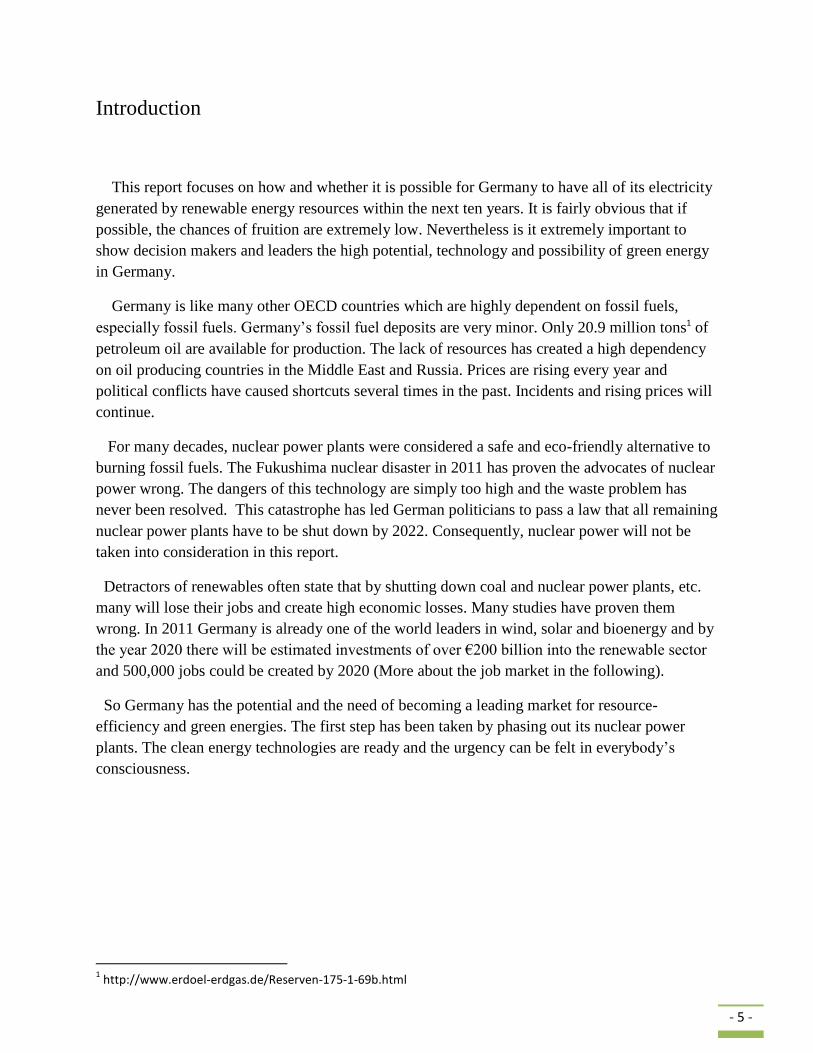
Germany is amongst world leaders when it comes to renewable energies. But what is the
current share of renewables in the energy generation mix? The following graphic shows that
renewables already produce 16.3% of all electricity generated in 2009 where wind power has the
biggest share with 6.6%. (38.6 bn. kWh)
Lignite, coal and nuclear power still produce about two-thirds (64.8%) of all electricity.
Based on official guidelines through the European Union the current German government has
to increase the renewable percentage up to minimum 18% by 2020.2 Due to the high rate of the
actual development this goal will be reached and exceeded easily.
Figure 1 The electricity mix in Germany
The government has also committed to have all public buildings to become role models in
energy efficiency. This will cost approximately €176 million (US $250 million) per annum. On
the other hand €12 million will be saved per year.3 This shows a serious commitment to decrease
greenhouse gases to maintain Germany´s leading position in the renewables sector.
2 http://www.bundestag.de/presse/hib/2010_11/2010_375/03.html
3 http://dip21.bundestag.de/dip21/btd/17/036/1703629.pdf
- 7 -
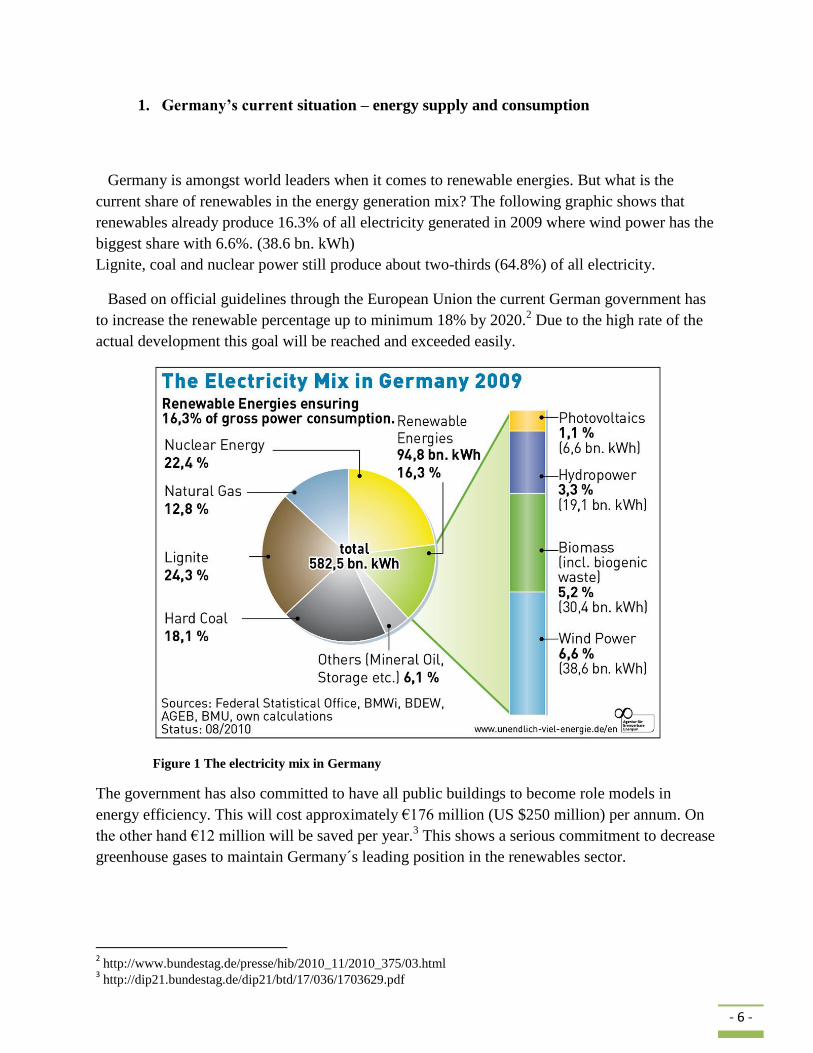
1.1 Current CO2 emissions and consumption
In the past seventeen years Germany has reduced its CO2 emissions by approximately 22.2%.
Bringing its total emissions today around 9.5 metric tons per capita. Since 1990, the production
of greenhouse gases has been reduced by 220 million tons. With those numbers Germany has
actually achieved its climate goals set 1997 in Kyoto (The goal was 21% by 2012) -- four years
earlier than expected.4
Its enormous efforts in supporting the renewable energies will continue the downward reduction
of carbon dioxide emissions.
DIFFERENT POWER PLANTS AND THEIR CO2 BALANCE
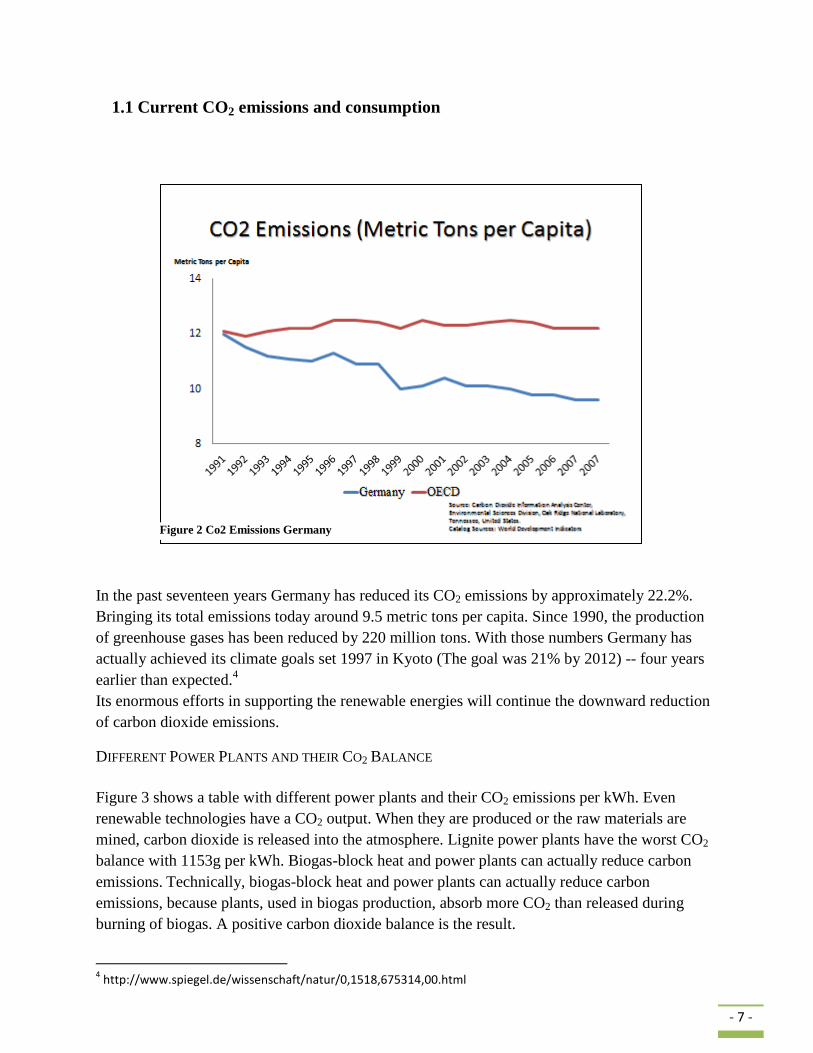
Figure 3 shows a table with different power plants and their CO2 emissions per kWh. Even
renewable technologies have a CO2 output. When they are produced or the raw materials are
mined, carbon dioxide is released into the atmosphere. Lignite power plants have the worst CO2
balance with 1153g per kWh. Biogas-block heat and power plants can actually reduce carbon
emissions. Technically, biogas-block heat and power plants can actually reduce carbon
emissions, because plants, used in biogas production, absorb more CO2 than released during
burning of biogas. A positive carbon dioxide balance is the result.
4 http://www.spiegel.de/wissenschaft/natur/0,1518,675314,00.html
Figure 2 Co2 Emissions Germany
- 8 -
Plant type CO2-emissions CO2-Emission
Biogas-block heat and power plant - 409 g per kWh
Renewables
Wind energy off-shore 23 g per kWh
Wind energy on-shore 24 g per kWh
Solarpower imported from Spanien 27 g per kWh
Nuclear power plant 32 g per kWh
Hydro-electric power plant 40 g per kWh
Multicrystalline solar cell 101 g per kWh
Natural gas
Natural gas-combined-cycle plant-heating plant 148 g per kWh
Natural gas-combined-cycle plant-power plant 428 g per kWh
Coals
Hard Coal-heating power plant 622 g per kWh
Lignite-heating plant 729 g per kWh
Bituminous coal-power plant 949 g per kWh
Lignite-powerplant 1153 g per kWh
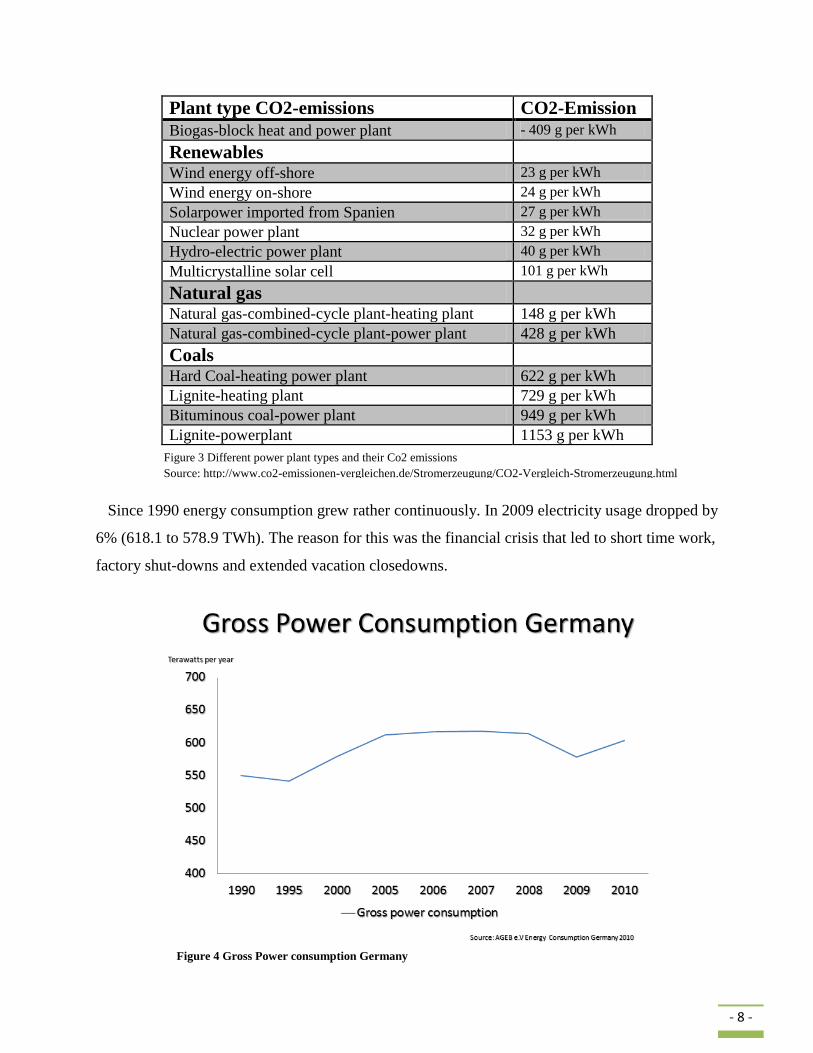
Since 1990 energy consumption grew rather continuously. In 2009 electricity usage dropped by
6% (618.1 to 578.9 TWh). The reason for this was the financial crisis that led to short time work,
factory shut-downs and extended vacation closedowns.
Figure 4 Gross Power consumption Germany
Figure 3 Different power plant types and their Co2 emissions
Source: http://www.co2-emissionen-vergleichen.de/Stromerzeugung/CO2-Vergleich-Stromerzeugung.html
- 9 -
2. Job creation
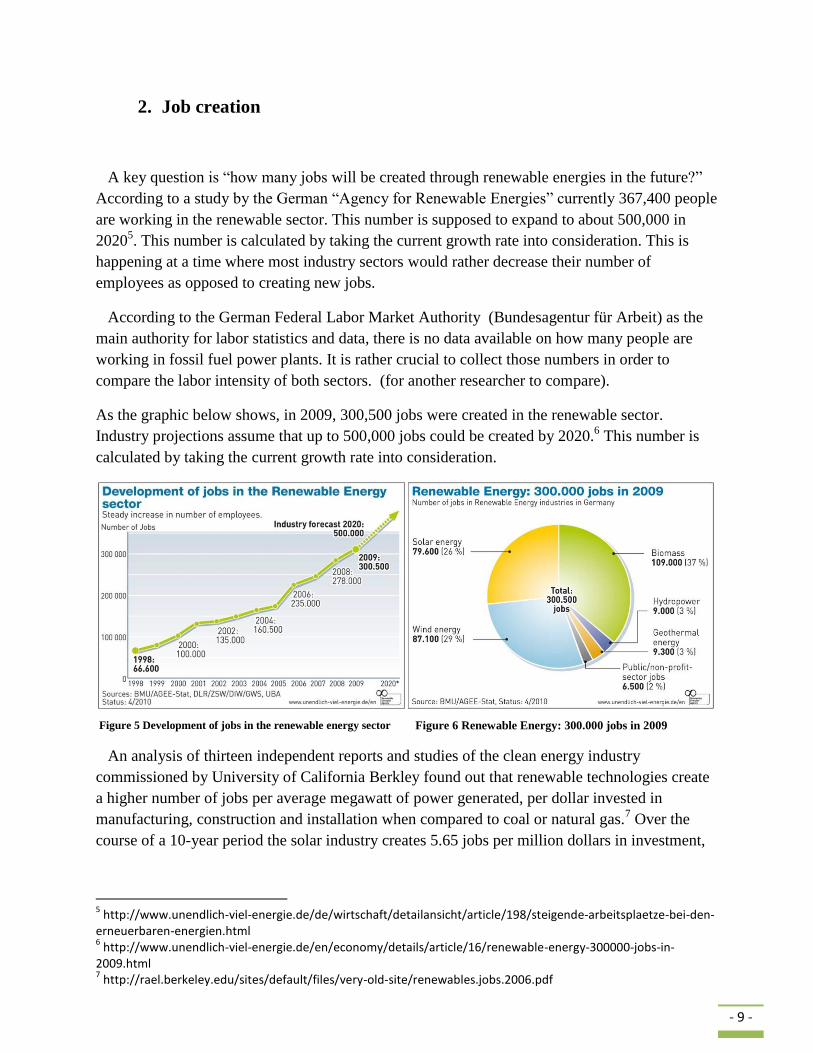
A key question is “how many jobs will be created through renewable energies in the future?”
According to a study by the German “Agency for Renewable Energies” currently 367,400 people
are working in the renewable sector. This number is supposed to expand to about 500,000 in
20205. This number is calculated by taking the current growth rate into consideration. This is
happening at a time where most industry sectors would rather decrease their number of
employees as opposed to creating new jobs.
According to the German Federal Labor Market Authority (Bundesagentur für Arbeit) as the
main authority for labor statistics and data, there is no data available on how many people are
working in fossil fuel power plants. It is rather crucial to collect those numbers in order to
compare the labor intensity of both sectors. (for another researcher to compare).
As the graphic below shows, in 2009, 300,500 jobs were created in the renewable sector.
Industry projections assume that up to 500,000 jobs could be created by 2020.6 This number is
calculated by taking the current growth rate into consideration.
An analysis of thirteen independent reports and studies of the clean energy industry
commissioned by University of California Berkley found out that renewable technologies create
a higher number of jobs per average megawatt of power generated, per dollar invested in
manufacturing, construction and installation when compared to coal or natural gas.7 Over the
course of a 10-year period the solar industry creates 5.65 jobs per million dollars in investment,
5 http://www.unendlich-viel-energie.de/de/wirtschaft/detailansicht/article/198/steigende-arbeitsplaetze-bei-den-
erneuerbaren-energien.html 6 http://www.unendlich-viel-energie.de/en/economy/details/article/16/renewable-energy-300000-jobs-in-
2009.html 7 http://rael.berkeley.edu/sites/default/files/very-old-site/renewables.jobs.2006.pdf
Figure 5 Development of jobs in the renewable energy sector Figure 6 Renewable Energy: 300.000 jobs in 2009
- 10 -
the wind energy industry 5.7 jobs, and the coal industry only 3.96.8 In the case of coal mining,
wind and solar energy generate 40 percent more jobs per dollar invested.9
It has to be said that those numbers were calculated in and for the United States and might not be
completely accurate for Germany but an obvious trend arises. A more detailed analysis of the
job situation and development in certain renewable sectors follows in the Chapter 3.
8 http://blog.greenpointpartners.com/real-estate/solar%E2%80%99s-push-to-reach-the-mainstream/
9 Virinder Singh, BBC Research and Consulting, and Jeffrey Fehrs, “The Work That Goes into Renewable Energy,”
Renewable Energy Policy Project, November 2001, 8.
- 11 -
3. The Electrical Grid in Germany
The German electrical grid is about 1.74 Million kilometers10
long which is about 4 ½ times the
distance of the earth to the moon. There are four voltage levels: Extra High, High, Distribution
and Low. It is operated and divided by four transmission network operators.
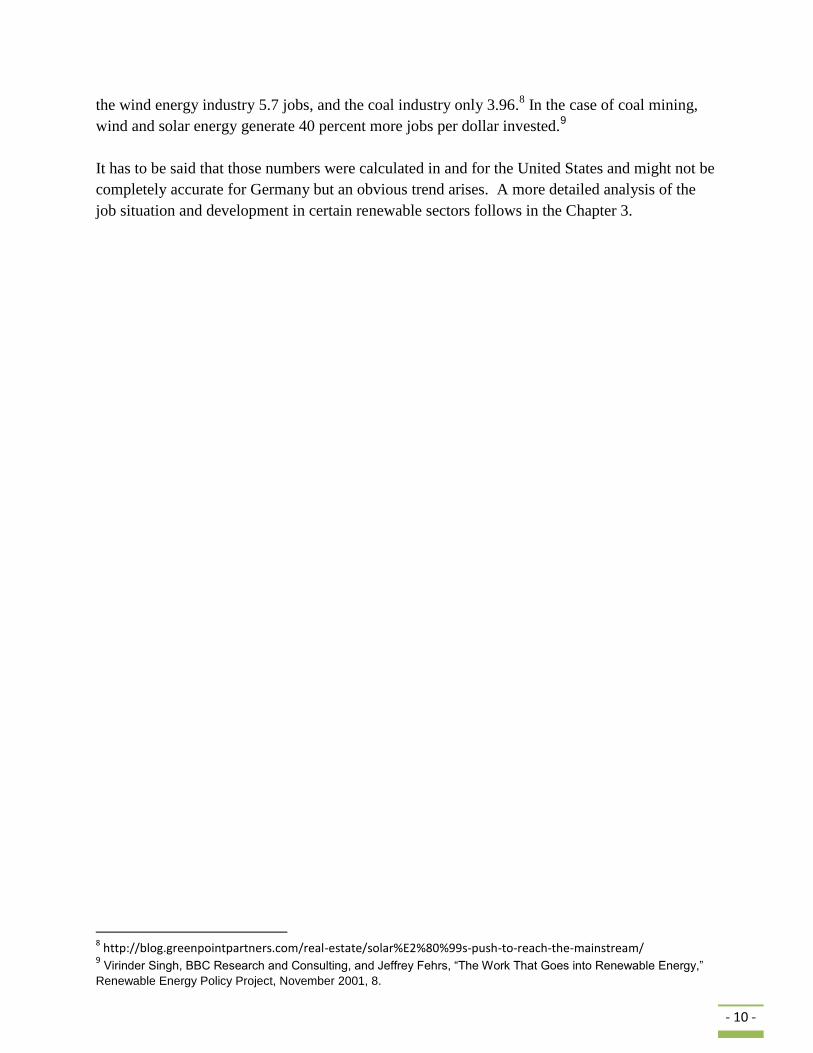
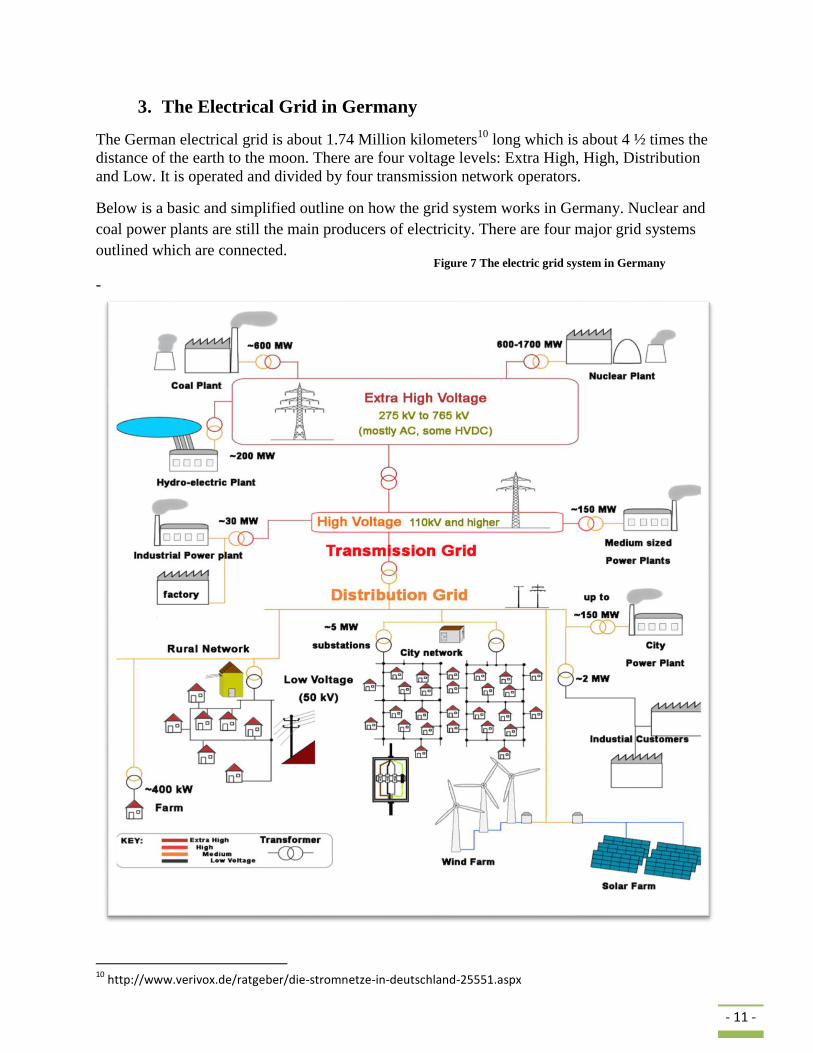
Below is a basic and simplified outline on how the grid system works in Germany. Nuclear and
coal power plants are still the main producers of electricity. There are four major grid systems
outlined which are connected.
-
10
http://www.verivox.de/ratgeber/die-stromnetze-in-deutschland-25551.aspx
Figure 7 The electric grid system in Germany
- 12 -
Extra High Voltage – The main transmission grid is a long-distance line that passes
electricity from power plants and wind parks into the grid. The
electricity is transmitted state- and nationwide and also within
Europe. Most of the electricity exchange is done with France.
High Voltage Grid – Is a transmission network. Regional transmission is its main task. Lines
carry electricity into different regions, congested areas or big industrial centers.
Distribution Grid – Distributes the electricity to the local transformer stations of the low
voltage network to institutional users like schools, public authorities or
factories. Municipal Utilities, which quite often run power plants or
operate cogeneration feed power into this system.
Low Voltage Grid – Low Voltage Grids are responsible for local delivery. Electricity from the
distribution grid in Europe is usually transformed into the usual 400V or
230V and then delivered to private households, smaller industrial
establishments, businesses and municipal administrations. This grid is
often referred as the “last mile”
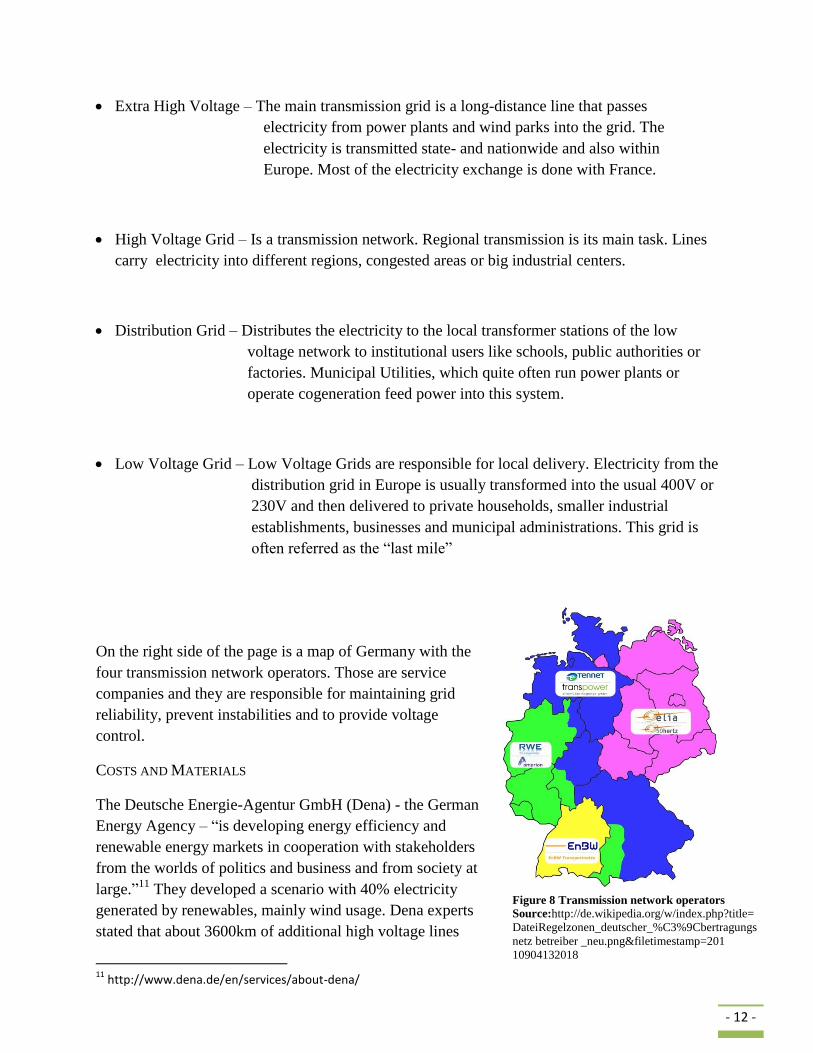
On the right side of the page is a map of Germany with the
four transmission network operators. Those are service
companies and they are responsible for maintaining grid
reliability, prevent instabilities and to provide voltage
control.
COSTS AND MATERIALS
The Deutsche Energie-Agentur GmbH (Dena) - the German
Energy Agency – “is developing energy efficiency and
renewable energy markets in cooperation with stakeholders
from the worlds of politics and business and from society at
large.”11
They developed a scenario with 40% electricity
generated by renewables, mainly wind usage. Dena experts
stated that about 3600km of additional high voltage lines
11
http://www.dena.de/en/services/about-dena/
Figure 8 Transmission network operators
Source:http://de.wikipedia.org/w/index.php?title=
DateiRegelzonen_deutscher_%C3%9Cbertragungs
netz betreiber _neu.png&filetimestamp=201
10904132018
- 13 -
would be necessary. Also about 3100km of existing lines are supposed to be modified. The costs
for expanding and modifying the grid are about 9.7 billion euros.12
Since those numbers are only
calculated for a 40% scenario the amount of commitment and the costs would be much higher in
the 100% scenario due to increased material input, faster installation time frames and
complicated application processes.
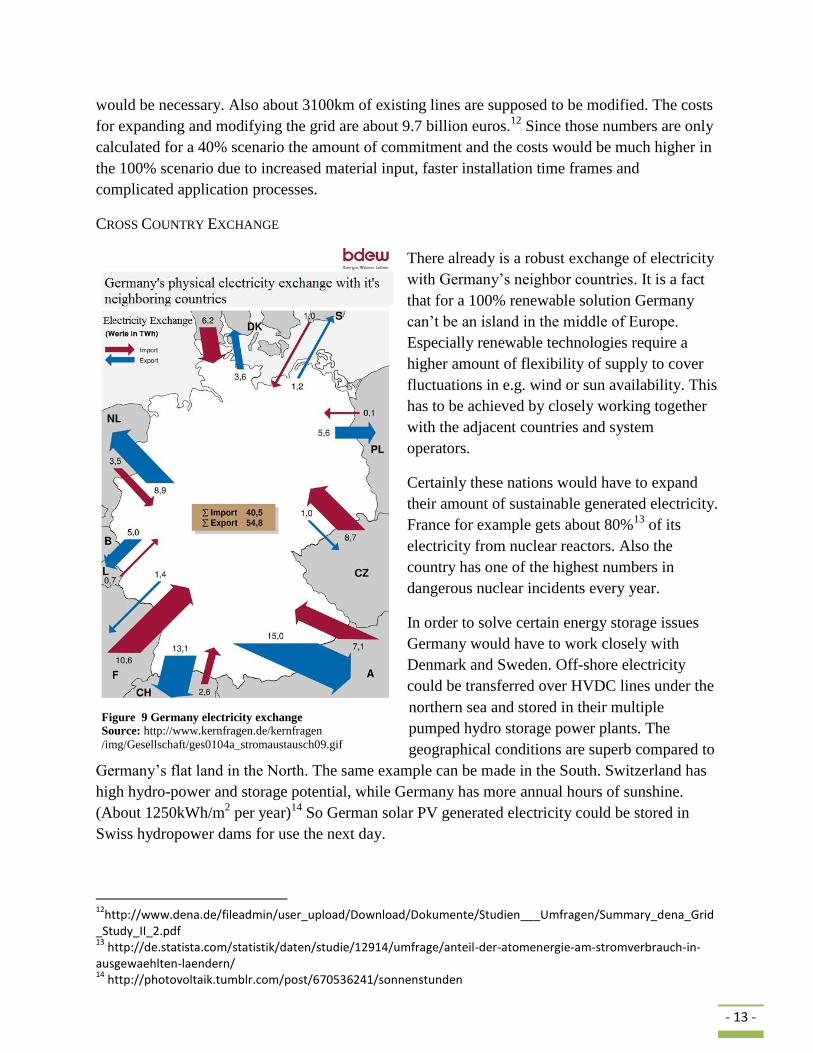
CROSS COUNTRY EXCHANGE
There already is a robust exchange of electricity
with Germany’s neighbor countries. It is a fact
that for a 100% renewable solution Germany
can’t be an island in the middle of Europe.
Especially renewable technologies require a
higher amount of flexibility of supply to cover
fluctuations in e.g. wind or sun availability. This
has to be achieved by closely working together
with the adjacent countries and system
operators.
Certainly these nations would have to expand
their amount of sustainable generated electricity.
France for example gets about 80%13
of its
electricity from nuclear reactors. Also the
country has one of the highest numbers in
dangerous nuclear incidents every year.
In order to solve certain energy storage issues
Germany would have to work closely with
Denmark and Sweden. Off-shore electricity
could be transferred over HVDC lines under the
northern sea and stored in their multiple
pumped hydro storage power plants. The
geographical conditions are superb compared to
Germany’s flat land in the North. The same example can be made in the South. Switzerland has
high hydro-power and storage potential, while Germany has more annual hours of sunshine.
(About 1250kWh/m2 per year)
14 So German solar PV generated electricity could be stored in
Swiss hydropower dams for use the next day.
12
http://www.dena.de/fileadmin/user_upload/Download/Dokumente/Studien___Umfragen/Summary_dena_Grid_Study_II_2.pdf 13
http://de.statista.com/statistik/daten/studie/12914/umfrage/anteil-der-atomenergie-am-stromverbrauch-in-ausgewaehlten-laendern/ 14
http://photovoltaik.tumblr.com/post/670536241/sonnenstunden
Figure 9 Germany electricity exchange
Source: http://www.kernfragen.de/kernfragen
/img/Gesellschaft/ges0104a_stromaustausch09.gif
- 14 -
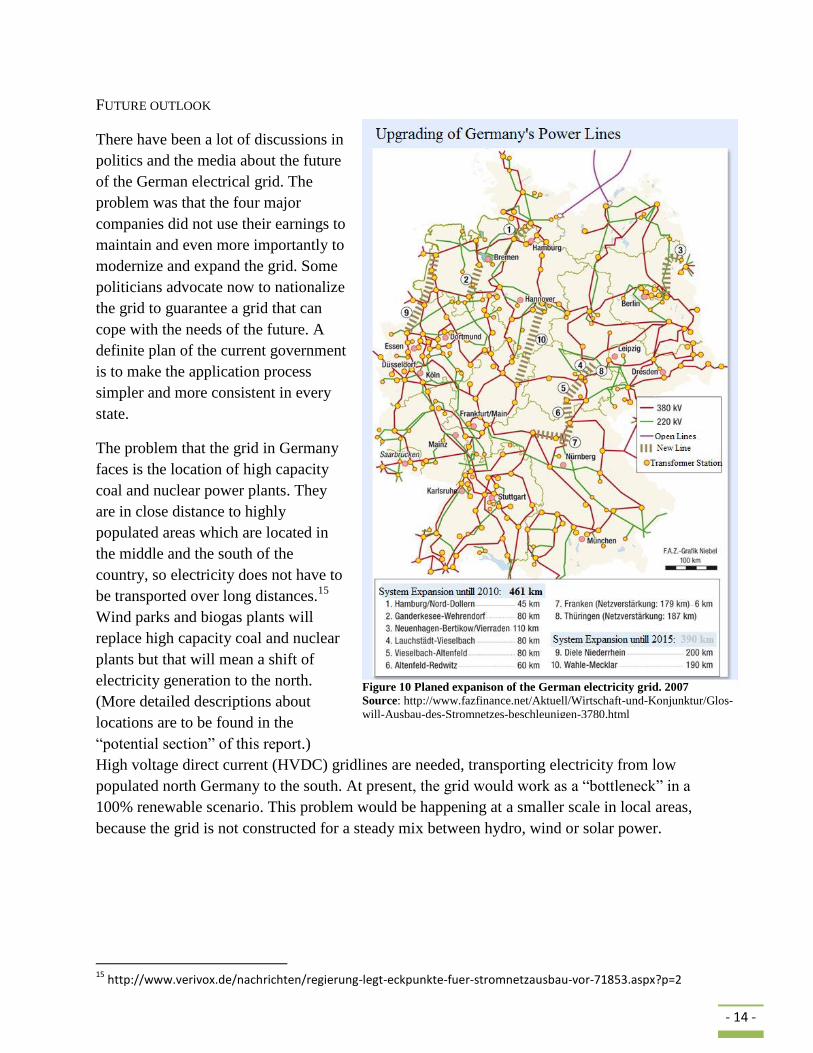
FUTURE OUTLOOK
There have been a lot of discussions in
politics and the media about the future
of the German electrical grid. The
problem was that the four major
companies did not use their earnings to
maintain and even more importantly to
modernize and expand the grid. Some
politicians advocate now to nationalize
the grid to guarantee a grid that can
cope with the needs of the future. A
definite plan of the current government
is to make the application process
simpler and more consistent in every
state.
The problem that the grid in Germany
faces is the location of high capacity
coal and nuclear power plants. They
are in close distance to highly
populated areas which are located in
the middle and the south of the
country, so electricity does not have to
be transported over long distances.15
Wind parks and biogas plants will
replace high capacity coal and nuclear
plants but that will mean a shift of
electricity generation to the north.
(More detailed descriptions about
locations are to be found in the
“potential section” of this report.)
High voltage direct current (HVDC) gridlines are needed, transporting electricity from low
populated north Germany to the south. At present, the grid would work as a “bottleneck” in a
100% renewable scenario. This problem would be happening at a smaller scale in local areas,
because the grid is not constructed for a steady mix between hydro, wind or solar power.
15
http://www.verivox.de/nachrichten/regierung-legt-eckpunkte-fuer-stromnetzausbau-vor-71853.aspx?p=2
Figure 10 Planed expanison of the German electricity grid. 2007 Source: http://www.fazfinance.net/Aktuell/Wirtschaft-und-Konjunktur/Glos-
will-Ausbau-des-Stromnetzes-beschleunigen-3780.html
- 15 -
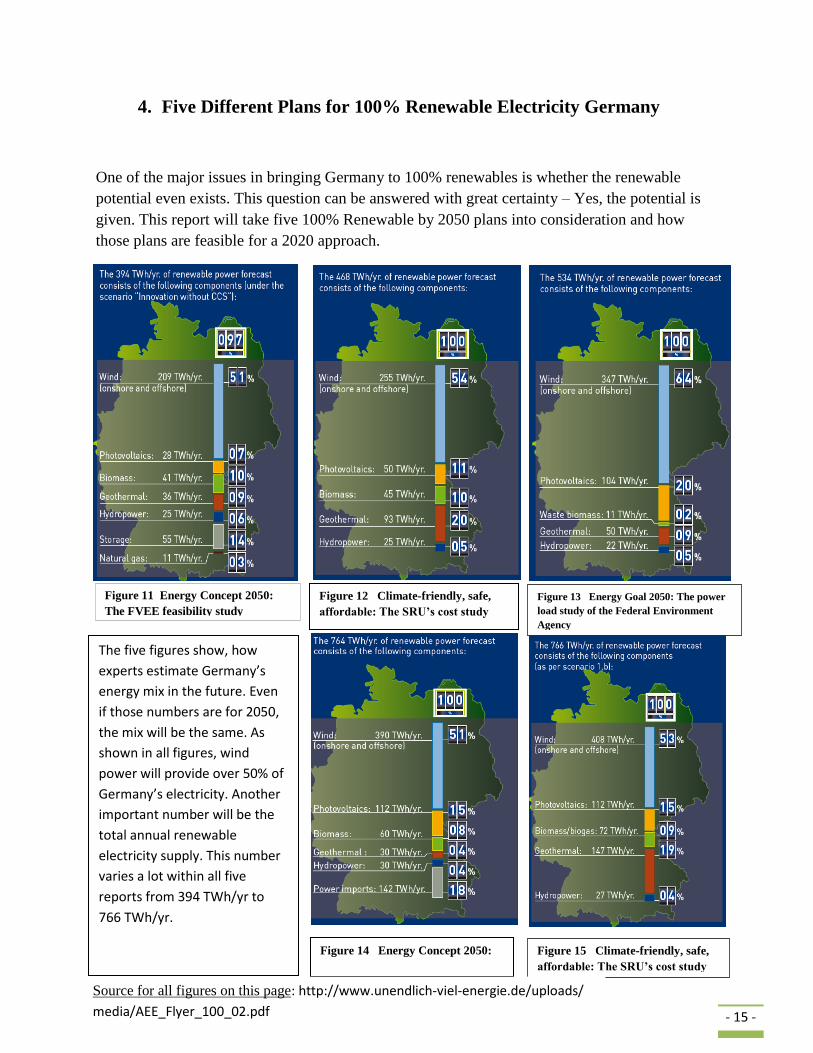
4. Five Different Plans for 100% Renewable Electricity Germany
One of the major issues in bringing Germany to 100% renewables is whether the renewable
potential even exists. This question can be answered with great certainty – Yes, the potential is
given. This report will take five 100% Renewable by 2050 plans into consideration and how
those plans are feasible for a 2020 approach.
Figure 11 Energy Concept 2050:
The FVEE feasibility study
Figure 12 Climate-friendly, safe,
affordable: The SRU’s cost study
Figure 13 Energy Goal 2050: The power
load study of the Federal Environment
Agency
Figure 15 Climate-friendly, safe,
affordable: The SRU’s cost study
Figure 14 Energy Concept 2050:
The FVEE feasibility study
The five figures show, how
experts estimate Germany’s
energy mix in the future. Even
if those numbers are for 2050,
the mix will be the same. As
shown in all figures, wind
power will provide over 50% of
Germany’s electricity. Another
important number will be the
total annual renewable
electricity supply. This number
varies a lot within all five
reports from 394 TWh/yr to
766 TWh/yr.
Source for all figures on this page: http://www.unendlich-viel-energie.de/uploads/
media/AEE_Flyer_100_02.pdf
- 16 -
5. Renewable Technologies and their Potential
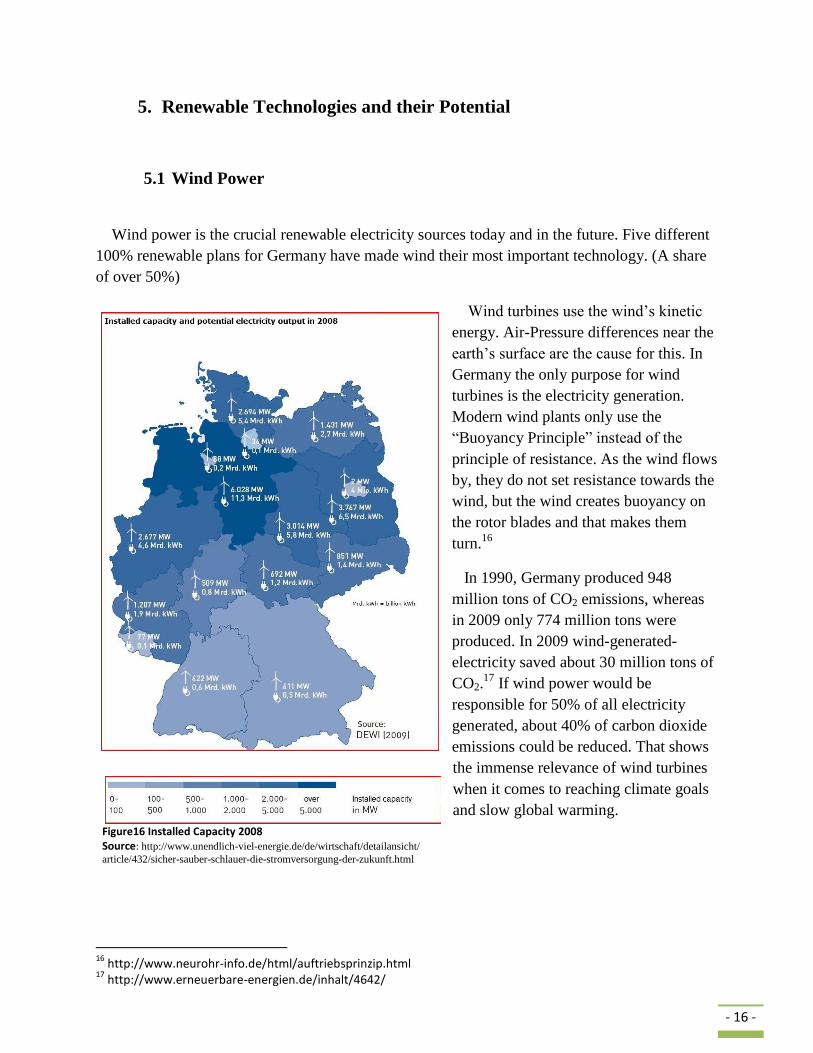
5.1 Wind Power
Wind power is the crucial renewable electricity sources today and in the future. Five different
100% renewable plans for Germany have made wind their most important technology. (A share
of over 50%)
Wind turbines use the wind’s kinetic
energy. Air-Pressure differences near the
earth’s surface are the cause for this. In
Germany the only purpose for wind
turbines is the electricity generation.
Modern wind plants only use the
“Buoyancy Principle” instead of the
principle of resistance. As the wind flows
by, they do not set resistance towards the
wind, but the wind creates buoyancy on
the rotor blades and that makes them
turn.16
In 1990, Germany produced 948
million tons of CO2 emissions, whereas
in 2009 only 774 million tons were
produced. In 2009 wind-generated-
electricity saved about 30 million tons of
CO2.17
If wind power would be
responsible for 50% of all electricity
generated, about 40% of carbon dioxide
emissions could be reduced. That shows
the immense relevance of wind turbines
when it comes to reaching climate goals
and slow global warming.
16
http://www.neurohr-info.de/html/auftriebsprinzip.html 17
http://www.erneuerbare-energien.de/inhalt/4642/
Figure16 Installed Capacity 2008 Source: http://www.unendlich-viel-energie.de/de/wirtschaft/detailansicht/
article/432/sicher-sauber-schlauer-die-stromversorgung-der-zukunft.html
- 17 -
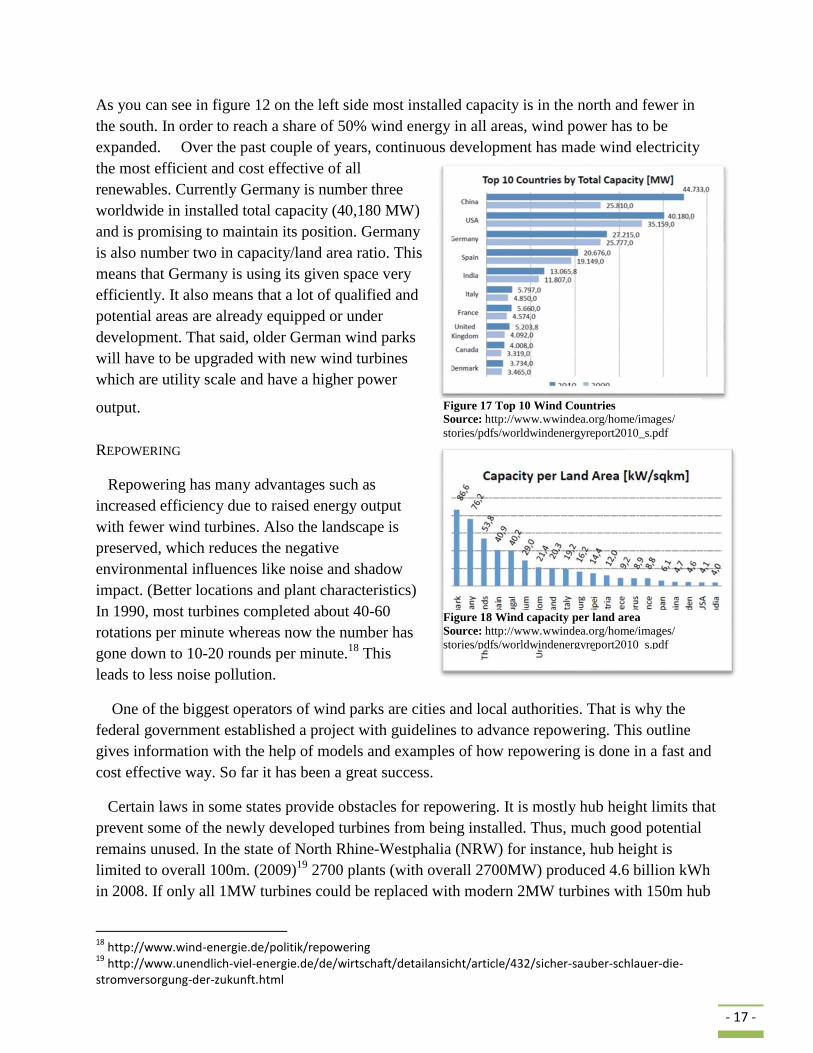
As you can see in figure 12 on the left side most installed capacity is in the north and fewer in
the south. In order to reach a share of 50% wind energy in all areas, wind power has to be
expanded. Over the past couple of years, continuous development has made wind electricity
the most efficient and cost effective of all
renewables. Currently Germany is number three
worldwide in installed total capacity (40,180 MW)
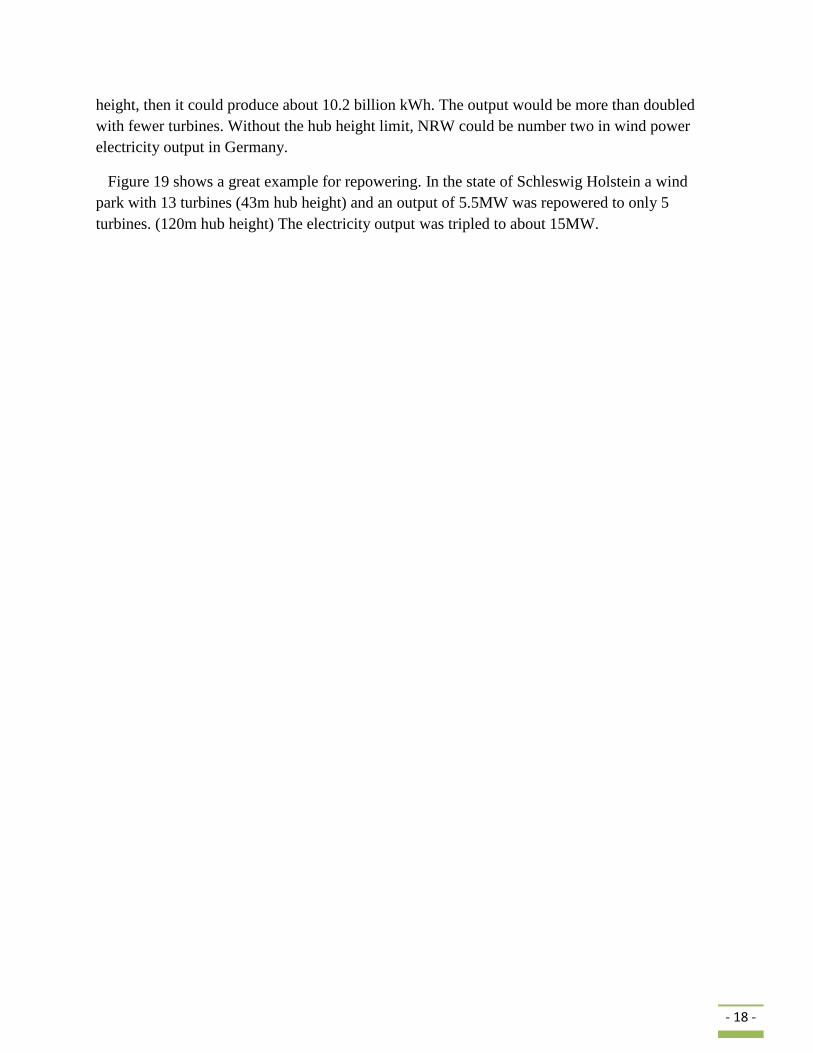
and is promising to maintain its position. Germany
is also number two in capacity/land area ratio. This
means that Germany is using its given space very
efficiently. It also means that a lot of qualified and
potential areas are already equipped or under
development. That said, older German wind parks
will have to be upgraded with new wind turbines
which are utility scale and have a higher power
output.
REPOWERING
Repowering has many advantages such as
increased efficiency due to raised energy output
with fewer wind turbines. Also the landscape is
preserved, which reduces the negative
environmental influences like noise and shadow
impact. (Better locations and plant characteristics)
In 1990, most turbines completed about 40-60
rotations per minute whereas now the number has
gone down to 10-20 rounds per minute.18
This
leads to less noise pollution.
One of the biggest operators of wind parks are cities and local authorities. That is why the
federal government established a project with guidelines to advance repowering. This outline
gives information with the help of models and examples of how repowering is done in a fast and
cost effective way. So far it has been a great success.
Certain laws in some states provide obstacles for repowering. It is mostly hub height limits that
prevent some of the newly developed turbines from being installed. Thus, much good potential
remains unused. In the state of North Rhine-Westphalia (NRW) for instance, hub height is
limited to overall 100m. (2009)19
2700 plants (with overall 2700MW) produced 4.6 billion kWh
in 2008. If only all 1MW turbines could be replaced with modern 2MW turbines with 150m hub
18
http://www.wind-energie.de/politik/repowering 19
http://www.unendlich-viel-energie.de/de/wirtschaft/detailansicht/article/432/sicher-sauber-schlauer-die-stromversorgung-der-zukunft.html
Figure 17 Top 10 Wind Countries
Source: http://www.wwindea.org/home/images/
stories/pdfs/worldwindenergyreport2010_s.pdf
Figure 18 Wind capacity per land area
Source: http://www.wwindea.org/home/images/
stories/pdfs/worldwindenergyreport2010_s.pdf
- 18 -
height, then it could produce about 10.2 billion kWh. The output would be more than doubled
with fewer turbines. Without the hub height limit, NRW could be number two in wind power
electricity output in Germany.
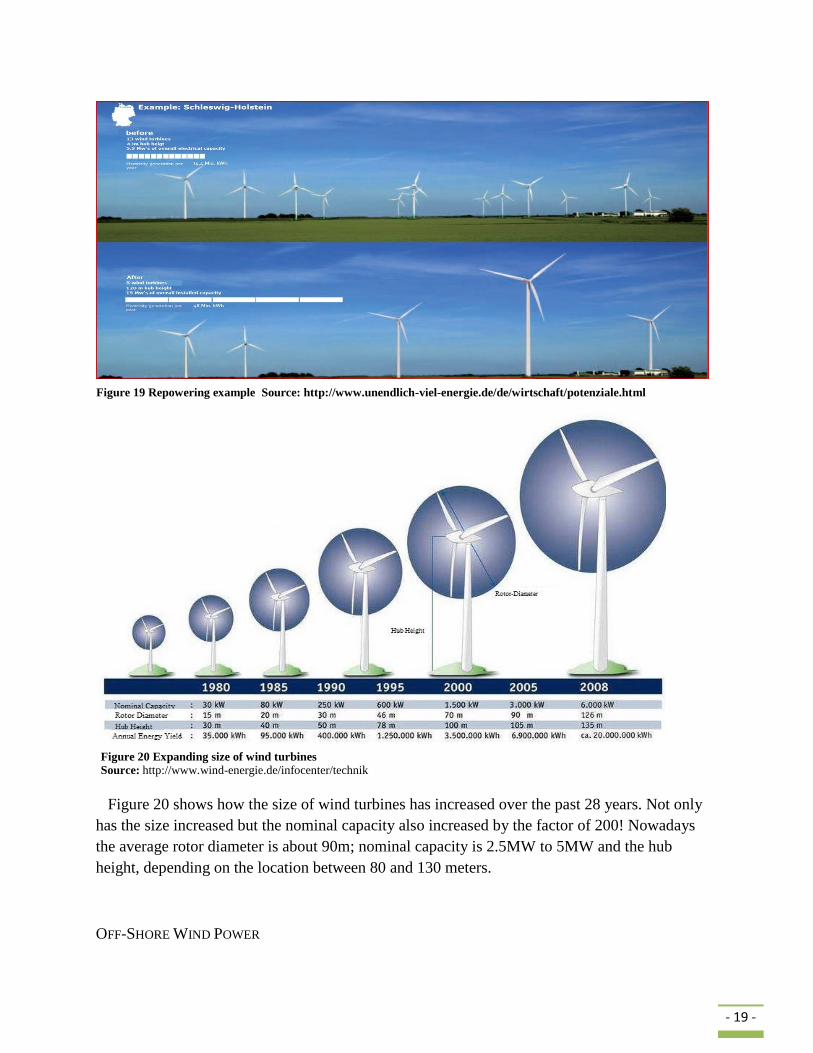
Figure 19 shows a great example for repowering. In the state of Schleswig Holstein a wind
park with 13 turbines (43m hub height) and an output of 5.5MW was repowered to only 5
turbines. (120m hub height) The electricity output was tripled to about 15MW.
- 19 -
Figure 20 shows how the size of wind turbines has increased over the past 28 years. Not only
has the size increased but the nominal capacity also increased by the factor of 200! Nowadays
the average rotor diameter is about 90m; nominal capacity is 2.5MW to 5MW and the hub
height, depending on the location between 80 and 130 meters.
OFF-SHORE WIND POWER
Figure 19 Repowering example Source: http://www.unendlich-viel-energie.de/de/wirtschaft/potenziale.html
Figure 20 Expanding size of wind turbines
Source: http://www.wind-energie.de/infocenter/technik
- 20 -
Germany has just begun its off-shore
development. There is a great potential at the
Northwestern and Northeastern coasts of the
country, which only needs to be harnessed.
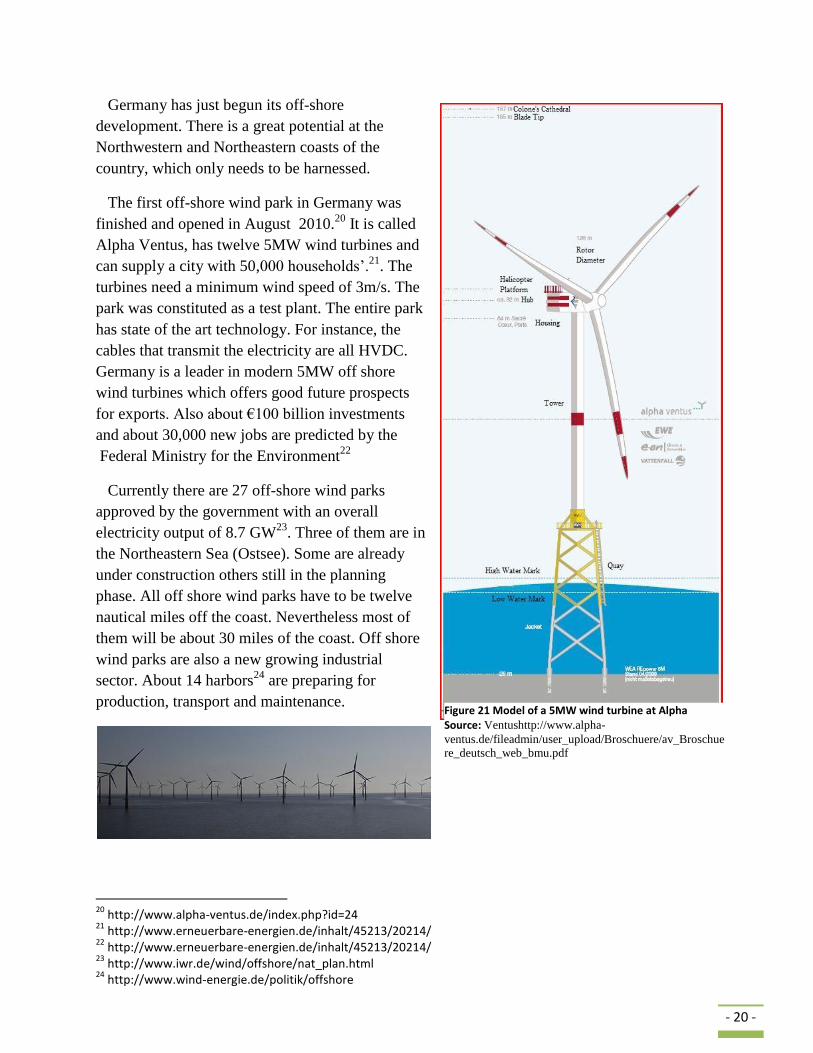
The first off-shore wind park in Germany was
finished and opened in August 2010.20
It is called
Alpha Ventus, has twelve 5MW wind turbines and
can supply a city with 50,000 households’.21
. The
turbines need a minimum wind speed of 3m/s. The
park was constituted as a test plant. The entire park
has state of the art technology. For instance, the
cables that transmit the electricity are all HVDC.
Germany is a leader in modern 5MW off shore
wind turbines which offers good future prospects
for exports. Also about €100 billion investments
and about 30,000 new jobs are predicted by the
Federal Ministry for the Environment22
Currently there are 27 off-shore wind parks
approved by the government with an overall
electricity output of 8.7 GW23
. Three of them are in
the Northeastern Sea (Ostsee). Some are already
under construction others still in the planning
phase. All off shore wind parks have to be twelve
nautical miles off the coast. Nevertheless most of
them will be about 30 miles of the coast. Off shore
wind parks are also a new growing industrial
sector. About 14 harbors24
are preparing for
production, transport and maintenance.
20
http://www.alpha-ventus.de/index.php?id=24 21
http://www.erneuerbare-energien.de/inhalt/45213/20214/ 22
http://www.erneuerbare-energien.de/inhalt/45213/20214/ 23
http://www.iwr.de/wind/offshore/nat_plan.html 24
http://www.wind-energie.de/politik/offshore
Figure 21 Model of a 5MW wind turbine at Alpha Source: Ventushttp://www.alpha-
ventus.de/fileadmin/user_upload/Broschuere/av_Broschue
re_deutsch_web_bmu.pdf
- 21 -
Also training facilities for service, assembling and maintenance personal are under
development. Off shore wind parks are becoming a leading industry in northern parts of
Germany. This can be shown in one example. The shipyard Emden had to close in 2010 due to
its unprofitability. Many workers were about to be laid off when a new Company called Siag Off
Shore took over the plant, kept all workers and actually hired extra labor.25
Examples like this
are found in many places that show the importance of wind energy for coastal regions.
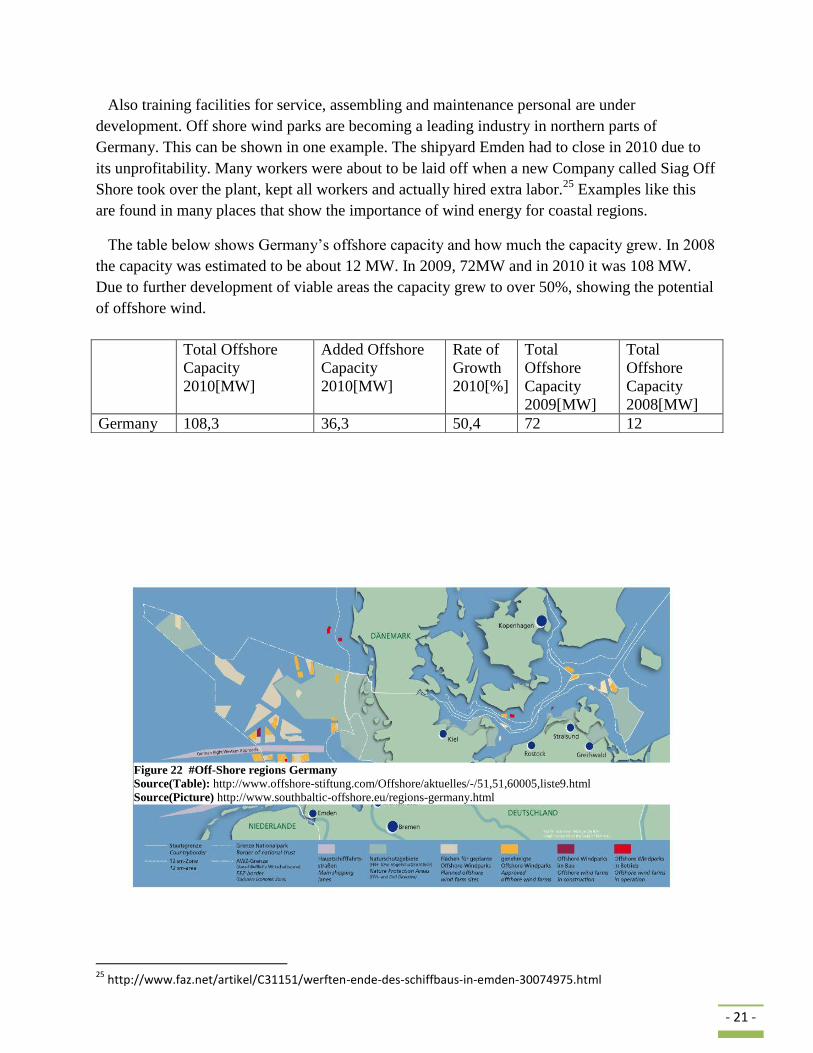
The table below shows Germany’s offshore capacity and how much the capacity grew. In 2008
the capacity was estimated to be about 12 MW. In 2009, 72MW and in 2010 it was 108 MW.
Due to further development of viable areas the capacity grew to over 50%, showing the potential
of offshore wind.
25
http://www.faz.net/artikel/C31151/werften-ende-des-schiffbaus-in-emden-30074975.html
Total Offshore
Capacity
2010[MW]
Added Offshore
Capacity
2010[MW]
Rate of
Growth
2010[%]
Total
Offshore
Capacity
2009[MW]
Total
Offshore
Capacity
2008[MW]
Germany 108,3 36,3 50,4 72 12
Figure 22 #Off-Shore regions Germany
Source(Table): http://www.offshore-stiftung.com/Offshore/aktuelles/-/51,51,60005,liste9.html
Source(Picture) http://www.southbaltic-offshore.eu/regions-germany.html
- 22 -
5.2 Solar Power in Germany
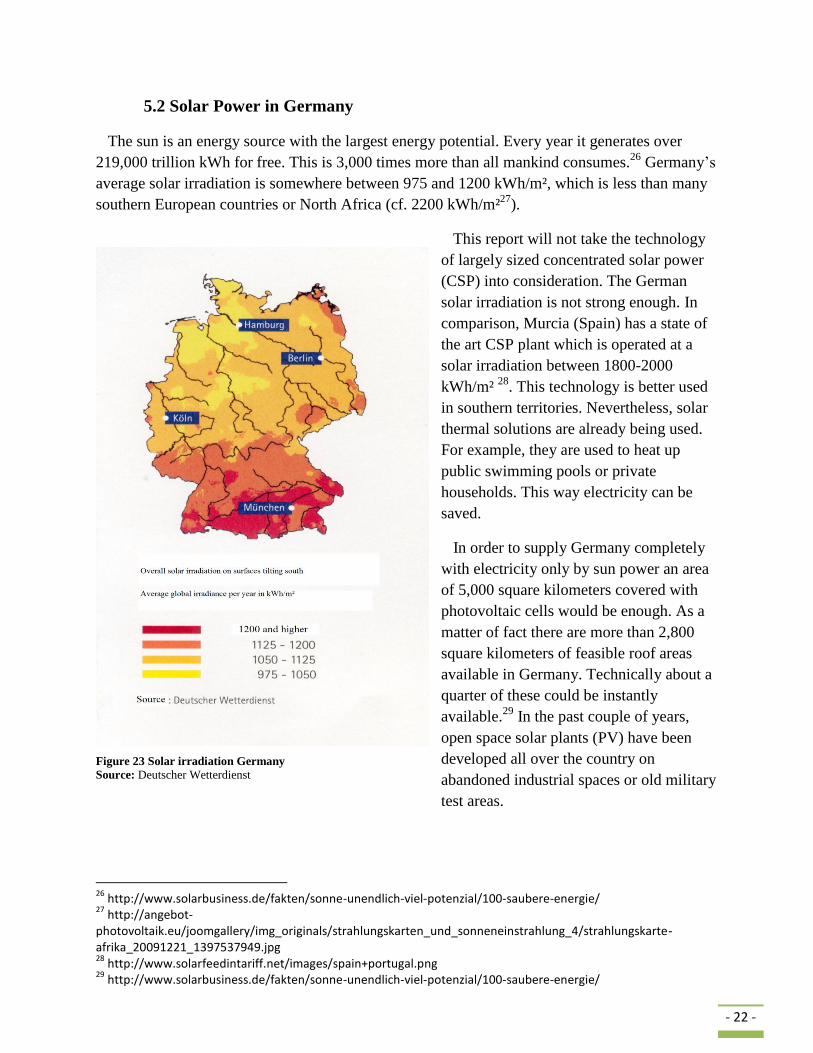
The sun is an energy source with the largest energy potential. Every year it generates over
219,000 trillion kWh for free. This is 3,000 times more than all mankind consumes.26
Germany’s
average solar irradiation is somewhere between 975 and 1200 kWh/m², which is less than many
southern European countries or North Africa (cf. 2200 kWh/m²27
).
This report will not take the technology
of largely sized concentrated solar power
(CSP) into consideration. The German
solar irradiation is not strong enough. In
comparison, Murcia (Spain) has a state of
the art CSP plant which is operated at a
solar irradiation between 1800-2000
kWh/m² 28
. This technology is better used
in southern territories. Nevertheless, solar
thermal solutions are already being used.
For example, they are used to heat up
public swimming pools or private
households. This way electricity can be
saved.
In order to supply Germany completely
with electricity only by sun power an area
of 5,000 square kilometers covered with
photovoltaic cells would be enough. As a
matter of fact there are more than 2,800
square kilometers of feasible roof areas
available in Germany. Technically about a
quarter of these could be instantly
available.29
In the past couple of years,
open space solar plants (PV) have been
developed all over the country on
abandoned industrial spaces or old military
test areas.
26
http://www.solarbusiness.de/fakten/sonne-unendlich-viel-potenzial/100-saubere-energie/ 27
http://angebot-photovoltaik.eu/joomgallery/img_originals/strahlungskarten_und_sonneneinstrahlung_4/strahlungskarte-afrika_20091221_1397537949.jpg 28
http://www.solarfeedintariff.net/images/spain+portugal.png 29
http://www.solarbusiness.de/fakten/sonne-unendlich-viel-potenzial/100-saubere-energie/
Figure 23 Solar irradiation Germany
Source: Deutscher Wetterdienst
- 23 -
Only 10m² of rooftop solar panels can generate enough electricity to supply one quarter of a
household’s electricity.30
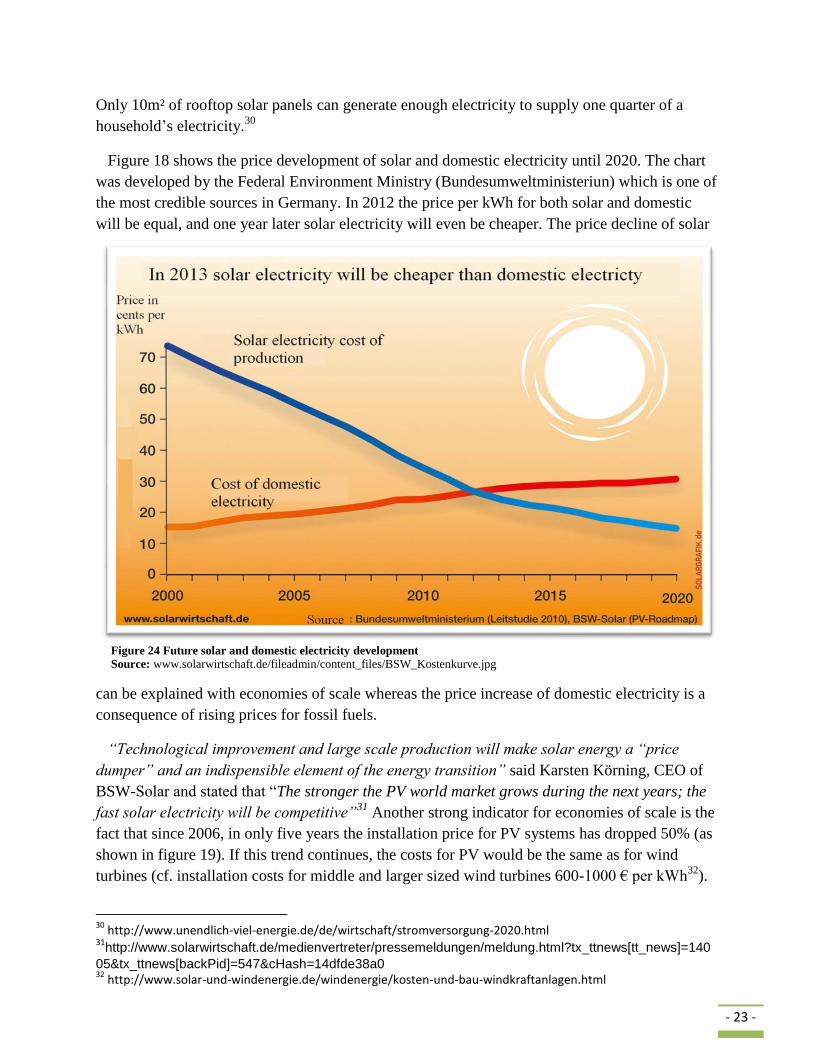
Figure 18 shows the price development of solar and domestic electricity until 2020. The chart
was developed by the Federal Environment Ministry (Bundesumweltministeriun) which is one of
the most credible sources in Germany. In 2012 the price per kWh for both solar and domestic
will be equal, and one year later solar electricity will even be cheaper. The price decline of solar
can be explained with economies of scale whereas the price increase of domestic electricity is a
consequence of rising prices for fossil fuels.
“Technological improvement and large scale production will make solar energy a “price
dumper” and an indispensible element of the energy transition” said Karsten Körning, CEO of
BSW-Solar and stated that “The stronger the PV world market grows during the next years; the
fast solar electricity will be competitive”31
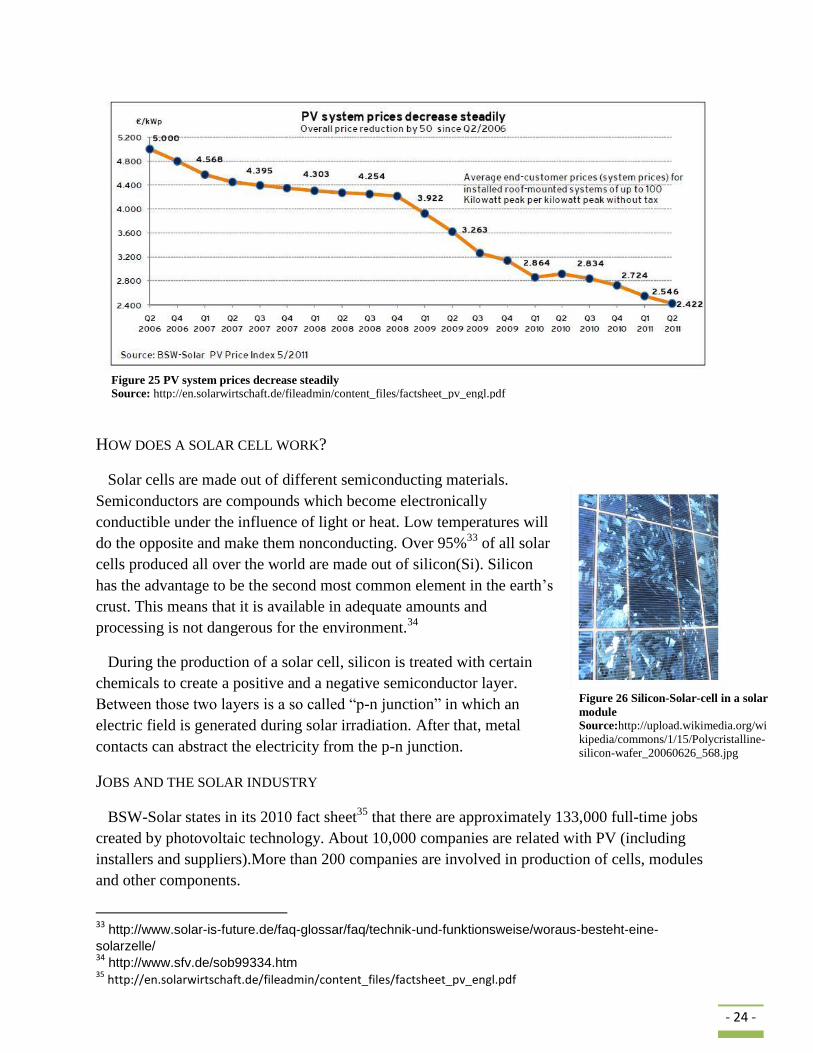
Another strong indicator for economies of scale is the
fact that since 2006, in only five years the installation price for PV systems has dropped 50% (as
shown in figure 19). If this trend continues, the costs for PV would be the same as for wind
turbines (cf. installation costs for middle and larger sized wind turbines 600-1000 € per kWh32
).
30
http://www.unendlich-viel-energie.de/de/wirtschaft/stromversorgung-2020.html 31
http://www.solarwirtschaft.de/medienvertreter/pressemeldungen/meldung.html?tx_ttnews[tt_news]=140
05&tx_ttnews[backPid]=547&cHash=14dfde38a0 32
http://www.solar-und-windenergie.de/windenergie/kosten-und-bau-windkraftanlagen.html
Figure 24 Future solar and domestic electricity development
Source: www.solarwirtschaft.de/fileadmin/content_files/BSW_Kostenkurve.jpg
- 24 -
HOW DOES A SOLAR CELL WORK?
Solar cells are made out of different semiconducting materials.
Semiconductors are compounds which become electronically
conductible under the influence of light or heat. Low temperatures will
do the opposite and make them nonconducting. Over 95%33
of all solar
cells produced all over the world are made out of silicon(Si). Silicon
has the advantage to be the second most common element in the earth’s
crust. This means that it is available in adequate amounts and
processing is not dangerous for the environment.34
During the production of a solar cell, silicon is treated with certain
chemicals to create a positive and a negative semiconductor layer.
Between those two layers is a so called “p-n junction” in which an
electric field is generated during solar irradiation. After that, metal
contacts can abstract the electricity from the p-n junction.
JOBS AND THE SOLAR INDUSTRY
BSW-Solar states in its 2010 fact sheet35
that there are approximately 133,000 full-time jobs
created by photovoltaic technology. About 10,000 companies are related with PV (including
installers and suppliers).More than 200 companies are involved in production of cells, modules
and other components.
33 http://www.solar-is-future.de/faq-glossar/faq/technik-und-funktionsweise/woraus-besteht-eine-
solarzelle/ 34 http://www.sfv.de/sob99334.htm 35
http://en.solarwirtschaft.de/fileadmin/content_files/factsheet_pv_engl.pdf
Figure 26 Silicon-Solar-cell in a solar
module
Source:http://upload.wikimedia.org/wi
kipedia/commons/1/15/Polycristalline-
silicon-wafer_20060626_568.jpg
Figure 25 PV system prices decrease steadily
Source: http://en.solarwirtschaft.de/fileadmin/content_files/factsheet_pv_engl.pdf
- 25 -
5.3 Geothermal Energy Production in Germany
The percentage of how geothermal energy will contribute to Germany’s energy mix in the
future is still debated between experts. The forecast ranges from 9% to 20% through the five
studies mentioned before. The question is: Why is it so different to determine the future role of
geothermal energy in Germany? – The answer to this leads us to another question: Should
geothermal heat be used to produce electricity or to provide heat for the industry and private
households?
Currently there are only three combined heat and power plans installed in Germany. Another
ten heat plants only produce heat for industrial and private use. The Federal Environment
Ministry assumes about 50 new combined heat 7 power plants by 2020. These plants are
supposed to have an output of 280MW which is about 40 times more than existing plants.36
One
major advantage of geothermal energy is weather independence. It is available 24 hours 7 days a
week, and even more significant when there is a lack of sun or wind production.
PREFERRED AREAS
From a human point of view geothermal energy is an inexhaustible source of energy. There is
more than enough geothermal heat to supply all of Germany with electricity and heat. It is
theoretically available at every place in Germany but not yet profitable to use elsewhere.
Generally, when drilled into the ground the first 100 meters of temperature are about 10°C. After
that the temperature increases by an average of 3°C per every 100m depth.37
At a temperature of
about 90°C electricity production gets interesting.
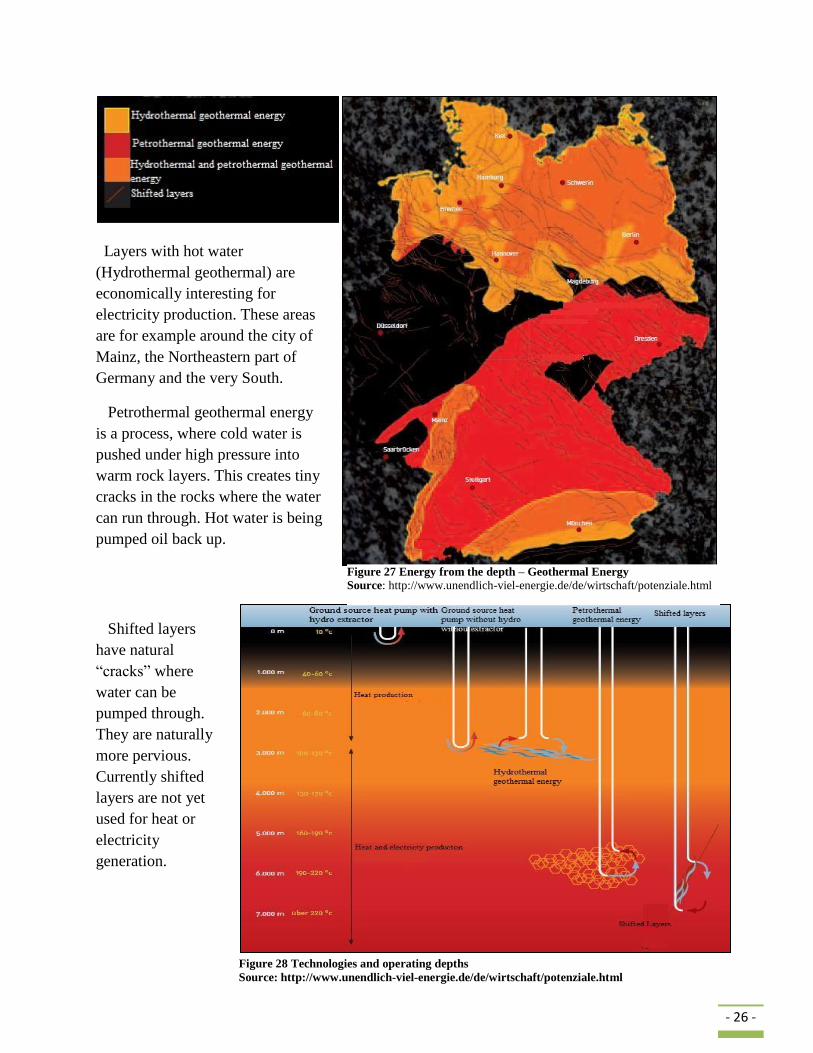
There is a distinction between three different depth levels where geothermal heat is “harvested.”
1. Near – Surface Geothermal Systems down to max 400m deep. Mostly extracted with heat
pumps for heat supply in private and industrial use. For the private house market there
was quite a boom and technical development of heat pumps in the last two to three years.
2. Warm–Underground–Water systems that harvest warm underground water. Drilling
depths can be down to 4500m.
3. Shifted layers Energy – These systems extract heat from deep rock layers up to the
surface for power generation (Enhanced geothermal systems EGS) down to 5000m.
Tariffs for the next 20 years are fixed by the government. Also certain funding help is
provided by the government
36
http://www.erneuerbare-energien.de/inhalt/44002/4594/ 37
http://www.erneuerbare-energien.de/inhalt/42723/
- 26 -
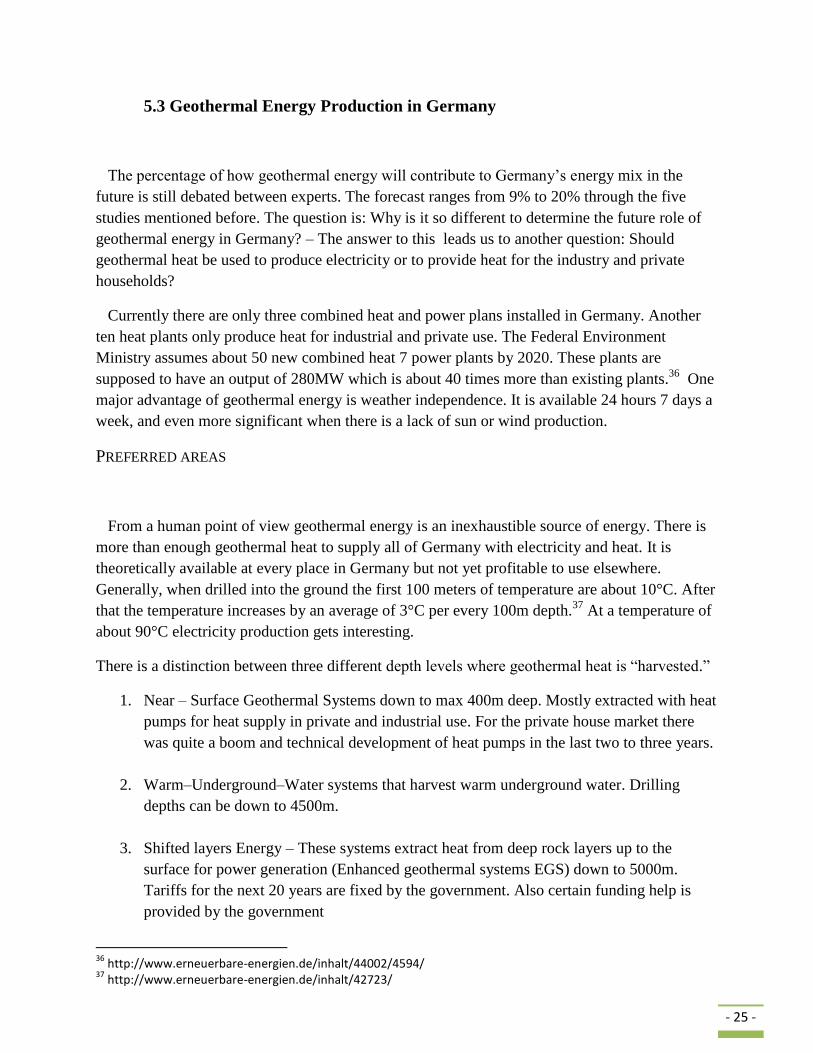
Layers with hot water
(Hydrothermal geothermal) are
economically interesting for
electricity production. These areas
are for example around the city of
Mainz, the Northeastern part of
Germany and the very South.
Petrothermal geothermal energy
is a process, where cold water is
pushed under high pressure into
warm rock layers. This creates tiny
cracks in the rocks where the water
can run through. Hot water is being
pumped oil back up.
Shifted layers
have natural
“cracks” where
water can be
pumped through.
They are naturally
more pervious.
Currently shifted
layers are not yet
used for heat or
electricity
generation.
Figure 27 Energy from the depth – Geothermal Energy
Source: http://www.unendlich-viel-energie.de/de/wirtschaft/potenziale.html
Figure 28 Technologies and operating depths
Source: http://www.unendlich-viel-energie.de/de/wirtschaft/potenziale.html
- 27 -
5.4 Hydropower in Germany
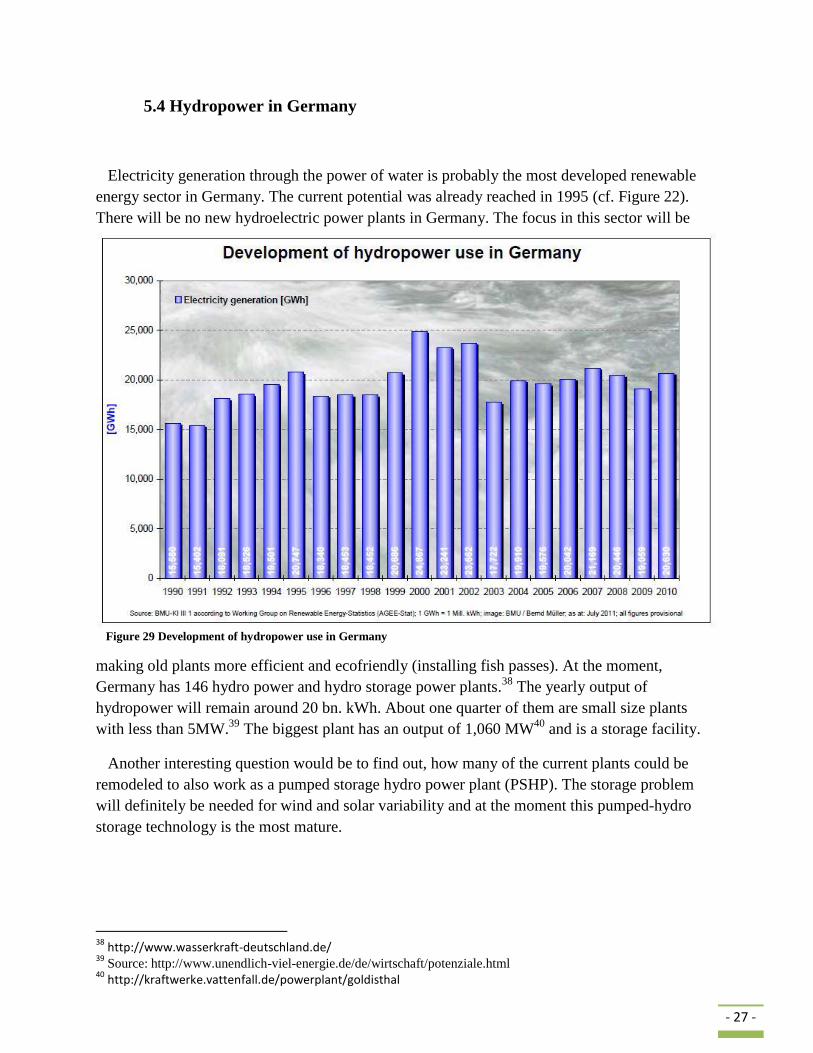
Electricity generation through the power of water is probably the most developed renewable
energy sector in Germany. The current potential was already reached in 1995 (cf. Figure 22).
There will be no new hydroelectric power plants in Germany. The focus in this sector will be
making old plants more efficient and ecofriendly (installing fish passes). At the moment,
Germany has 146 hydro power and hydro storage power plants.38
The yearly output of
hydropower will remain around 20 bn. kWh. About one quarter of them are small size plants
with less than 5MW.39
The biggest plant has an output of 1,060 MW40
and is a storage facility.
Another interesting question would be to find out, how many of the current plants could be
remodeled to also work as a pumped storage hydro power plant (PSHP). The storage problem
will definitely be needed for wind and solar variability and at the moment this pumped-hydro
storage technology is the most mature.
38
http://www.wasserkraft-deutschland.de/ 39
Source: http://www.unendlich-viel-energie.de/de/wirtschaft/potenziale.html 40
http://kraftwerke.vattenfall.de/powerplant/goldisthal
Figure 29 Development of hydropower use in Germany
- 28 -
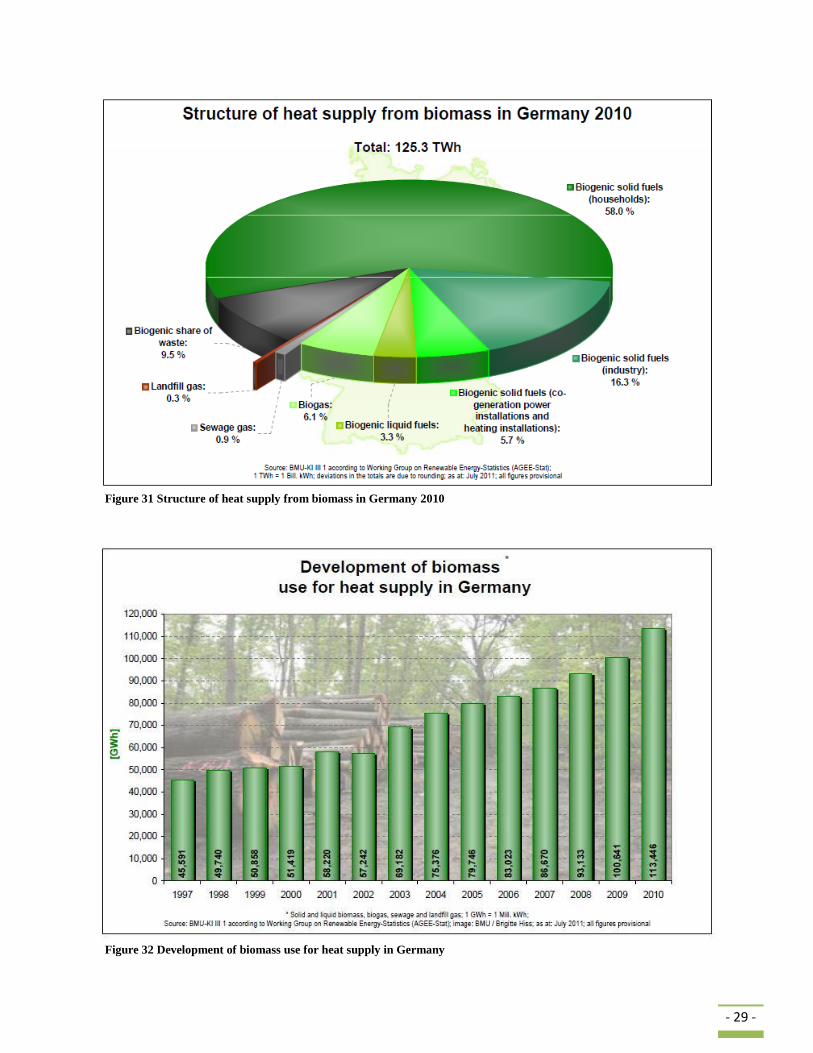
5.5 Biomass Energy in Germany
The Federal Environment Ministry believes biomass to be the “most important and
multifunctional source of energy for Germany.”41
Referring to Figure 1, 5.2% of Germany‘s
electricity was generated through biomass. That makes it for now the second largest renewable
energy source in Germany. Regarding the land availability there are about 17 million hectare of
agricultural spaces (approximately 12 million hectare of agricultural crop land and
approximately 5 million hectare of grassland) . Primary Canola (1.1 mil. hectare, 200742
) was
used as biofuel. There is also another 11 million hectare of woodland area.43
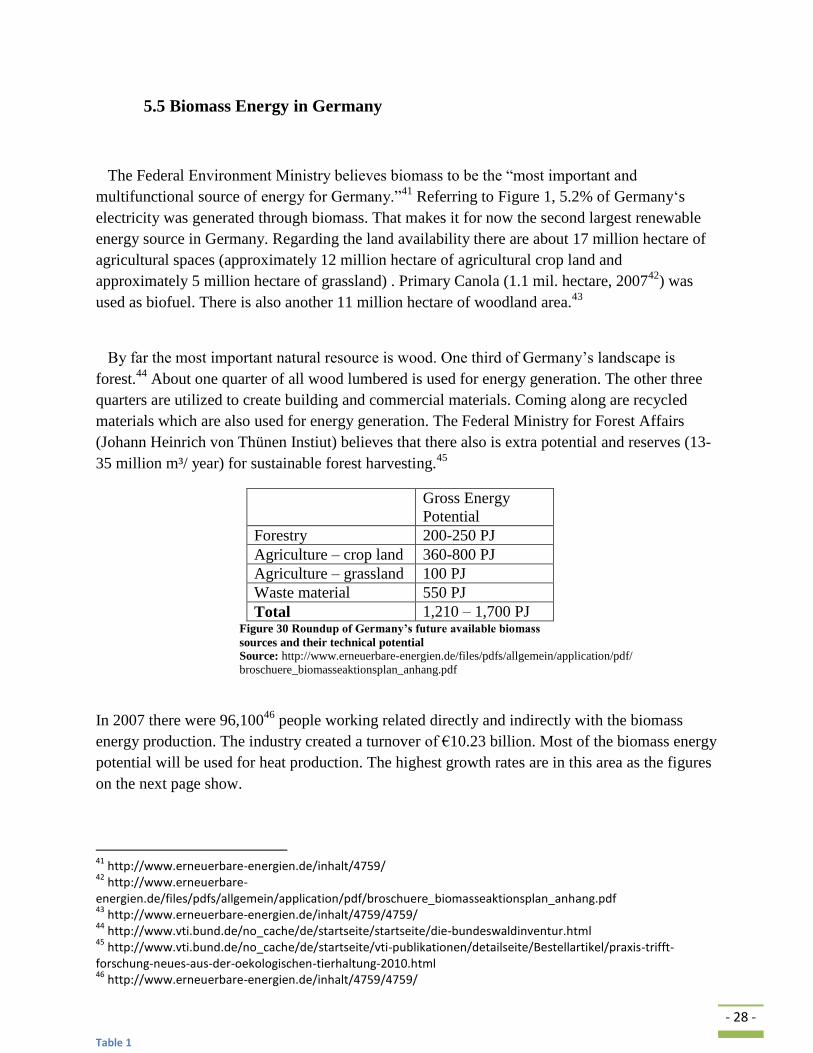
By far the most important natural resource is wood. One third of Germany’s landscape is
forest.44
About one quarter of all wood lumbered is used for energy generation. The other three
quarters are utilized to create building and commercial materials. Coming along are recycled
materials which are also used for energy generation. The Federal Ministry for Forest Affairs
(Johann Heinrich von Thünen Instiut) believes that there also is extra potential and reserves (13-
35 million m³/ year) for sustainable forest harvesting.45
Gross Energy
Potential
Forestry 200-250 PJ
Agriculture – crop land 360-800 PJ
Agriculture – grassland 100 PJ
Waste material 550 PJ
Total 1,210 – 1,700 PJ Figure 30 Roundup of Germany’s future available biomass
sources and their technical potential
Source: http://www.erneuerbare-energien.de/files/pdfs/allgemein/application/pdf/
broschuere_biomasseaktionsplan_anhang.pdf
In 2007 there were 96,10046
people working related directly and indirectly with the biomass
energy production. The industry created a turnover of €10.23 billion. Most of the biomass energy
potential will be used for heat production. The highest growth rates are in this area as the figures
on the next page show.
41
http://www.erneuerbare-energien.de/inhalt/4759/ 42
http://www.erneuerbare-energien.de/files/pdfs/allgemein/application/pdf/broschuere_biomasseaktionsplan_anhang.pdf 43
http://www.erneuerbare-energien.de/inhalt/4759/4759/ 44
http://www.vti.bund.de/no_cache/de/startseite/startseite/die-bundeswaldinventur.html 45
http://www.vti.bund.de/no_cache/de/startseite/vti-publikationen/detailseite/Bestellartikel/praxis-trifft-forschung-neues-aus-der-oekologischen-tierhaltung-2010.html 46
http://www.erneuerbare-energien.de/inhalt/4759/4759/
Table 1
- 29 -
Figure 31 Structure of heat supply from biomass in Germany 2010
Figure 32 Development of biomass use for heat supply in Germany
- 30 -
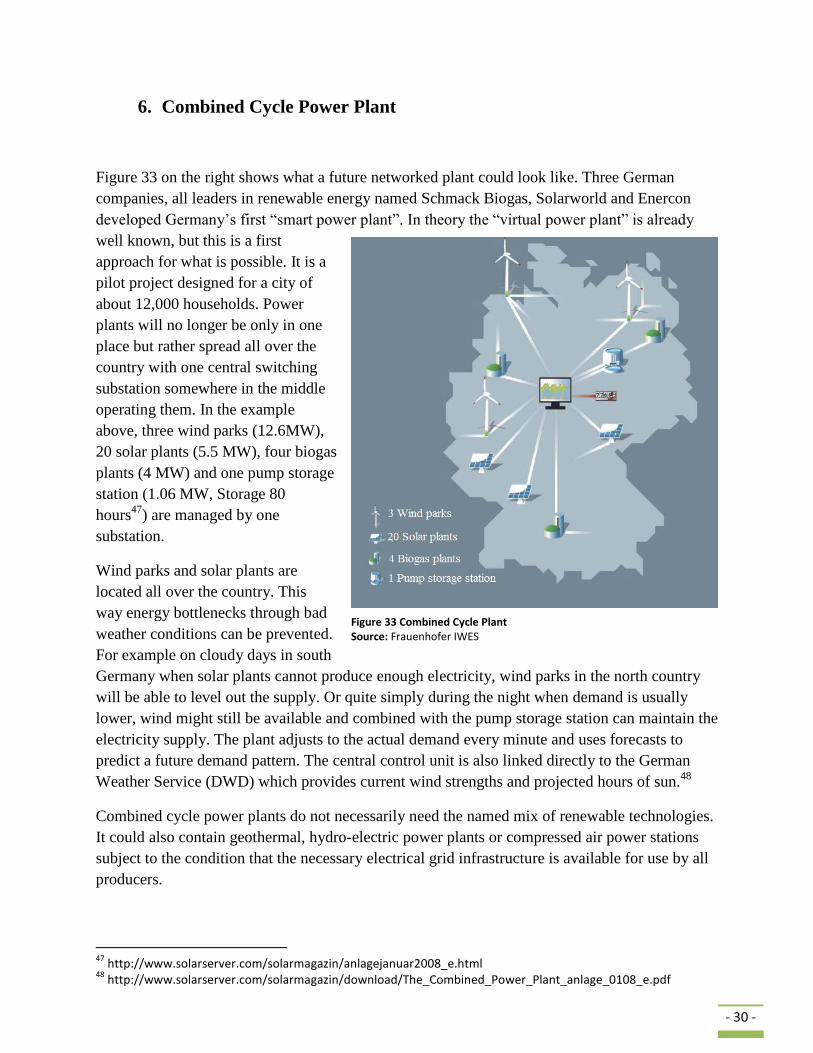
6. Combined Cycle Power Plant
Figure 33 on the right shows what a future networked plant could look like. Three German
companies, all leaders in renewable energy named Schmack Biogas, Solarworld and Enercon
developed Germany’s first “smart power plant”. In theory the “virtual power plant” is already
well known, but this is a first
approach for what is possible. It is a
pilot project designed for a city of
about 12,000 households. Power
plants will no longer be only in one
place but rather spread all over the
country with one central switching
substation somewhere in the middle
operating them. In the example
above, three wind parks (12.6MW),
20 solar plants (5.5 MW), four biogas
plants (4 MW) and one pump storage
station (1.06 MW, Storage 80
hours47
) are managed by one
substation.
Wind parks and solar plants are
located all over the country. This
way energy bottlenecks through bad
weather conditions can be prevented.
For example on cloudy days in south
Germany when solar plants cannot produce enough electricity, wind parks in the north country
will be able to level out the supply. Or quite simply during the night when demand is usually
lower, wind might still be available and combined with the pump storage station can maintain the
electricity supply. The plant adjusts to the actual demand every minute and uses forecasts to
predict a future demand pattern. The central control unit is also linked directly to the German
Weather Service (DWD) which provides current wind strengths and projected hours of sun.48
Combined cycle power plants do not necessarily need the named mix of renewable technologies.
It could also contain geothermal, hydro-electric power plants or compressed air power stations
subject to the condition that the necessary electrical grid infrastructure is available for use by all
producers.
47
http://www.solarserver.com/solarmagazin/anlagejanuar2008_e.html 48
http://www.solarserver.com/solarmagazin/download/The_Combined_Power_Plant_anlage_0108_e.pdf
Figure 33 Combined Cycle Plant Source: Frauenhofer IWES
- 31 -
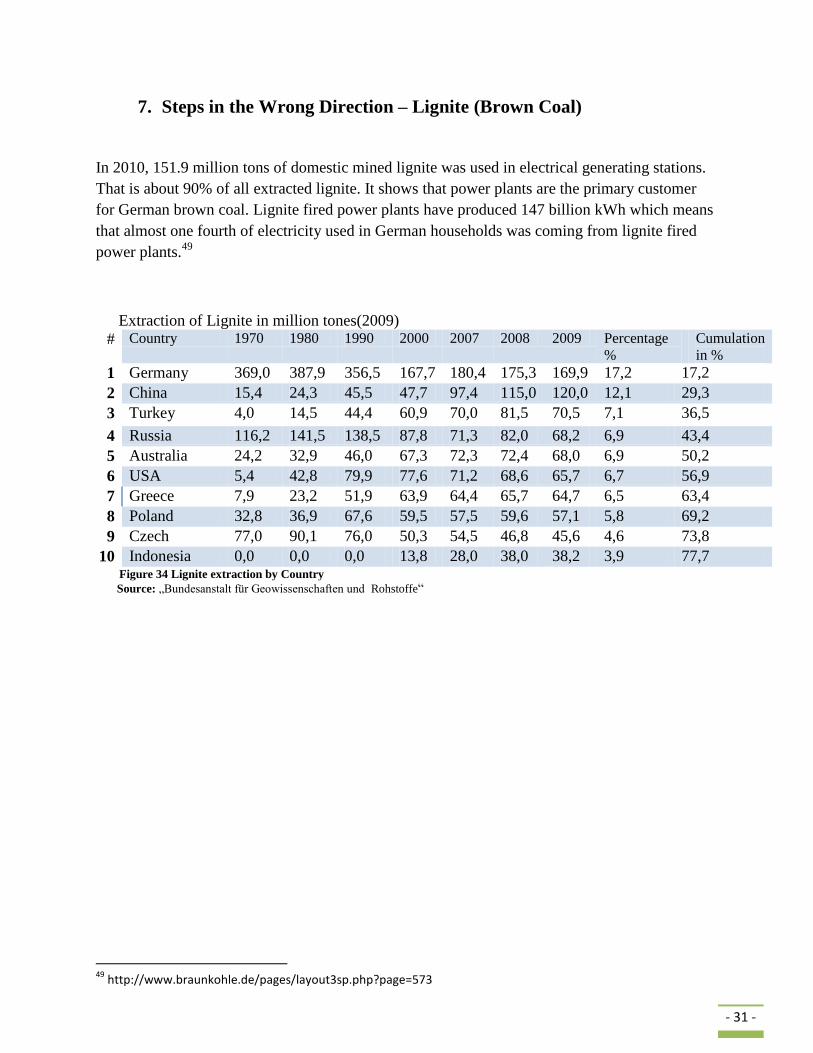
7. Steps in the Wrong Direction – Lignite (Brown Coal)
In 2010, 151.9 million tons of domestic mined lignite was used in electrical generating stations.
That is about 90% of all extracted lignite. It shows that power plants are the primary customer
for German brown coal. Lignite fired power plants have produced 147 billion kWh which means
that almost one fourth of electricity used in German households was coming from lignite fired
power plants.49
Extraction of Lignite in million tones(2009)
# Country 1970 1980 1990 2000 2007 2008 2009 Percentage
%
Cumulation
in %
1 Germany 369,0 387,9 356,5 167,7 180,4 175,3 169,9 17,2 17,2
2 China 15,4 24,3 45,5 47,7 97,4 115,0 120,0 12,1 29,3
3 Turkey 4,0 14,5 44,4 60,9 70,0 81,5 70,5 7,1 36,5
4 Russia 116,2 141,5 138,5 87,8 71,3 82,0 68,2 6,9 43,4
5 Australia 24,2 32,9 46,0 67,3 72,3 72,4 68,0 6,9 50,2
6 USA 5,4 42,8 79,9 77,6 71,2 68,6 65,7 6,7 56,9
7 Greece 7,9 23,2 51,9 63,9 64,4 65,7 64,7 6,5 63,4
8 Poland 32,8 36,9 67,6 59,5 57,5 59,6 57,1 5,8 69,2
9 Czech 77,0 90,1 76,0 50,3 54,5 46,8 45,6 4,6 73,8
10 Indonesia 0,0 0,0 0,0 13,8 28,0 38,0 38,2 3,9 77,7 Figure 34 Lignite extraction by Country
Source: „Bundesanstalt für Geowissenschaften und Rohstoffe“
49
http://www.braunkohle.de/pages/layout3sp.php?page=573
- 32 -
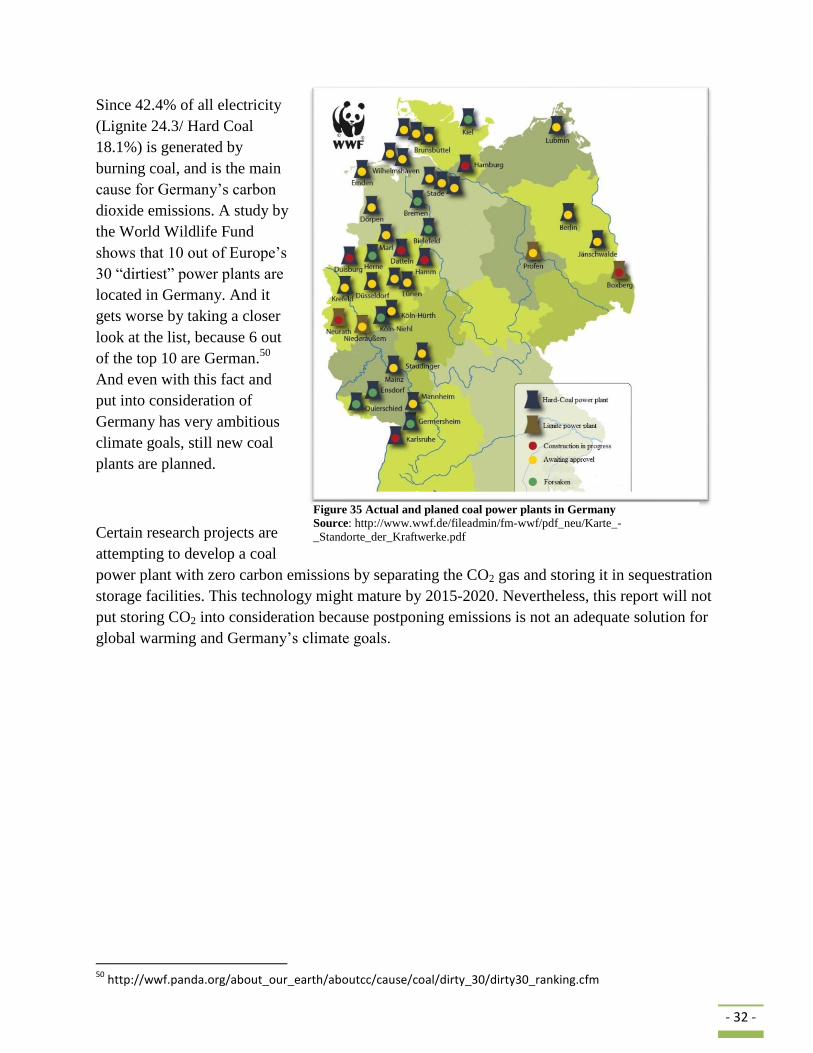
Since 42.4% of all electricity
(Lignite 24.3/ Hard Coal
18.1%) is generated by
burning coal, and is the main
cause for Germany’s carbon
dioxide emissions. A study by
the World Wildlife Fund
shows that 10 out of Europe’s
30 “dirtiest” power plants are
located in Germany. And it
gets worse by taking a closer
look at the list, because 6 out
of the top 10 are German.50
And even with this fact and
put into consideration of
Germany has very ambitious
climate goals, still new coal
plants are planned.
Certain research projects are
attempting to develop a coal
power plant with zero carbon emissions by separating the CO2 gas and storing it in sequestration
storage facilities. This technology might mature by 2015-2020. Nevertheless, this report will not
put storing CO2 into consideration because postponing emissions is not an adequate solution for
global warming and Germany’s climate goals.
50
http://wwf.panda.org/about_our_earth/aboutcc/cause/coal/dirty_30/dirty30_ranking.cfm
Figure 35 Actual and planed coal power plants in Germany Source: http://www.wwf.de/fileadmin/fm-wwf/pdf_neu/Karte_-
_Standorte_der_Kraftwerke.pdf
- 33 -
Coal mine
Garzweiler
II
2008 2008 Wind park
Bergheim(Rheidt)
Annual
potential
return per
hectare
approx 7.3
million
kWh
approx.
22.5
million
kWh
only fundamental
space
Annual potential
return per hectare
approx.
225.000
kWh
including setbacks
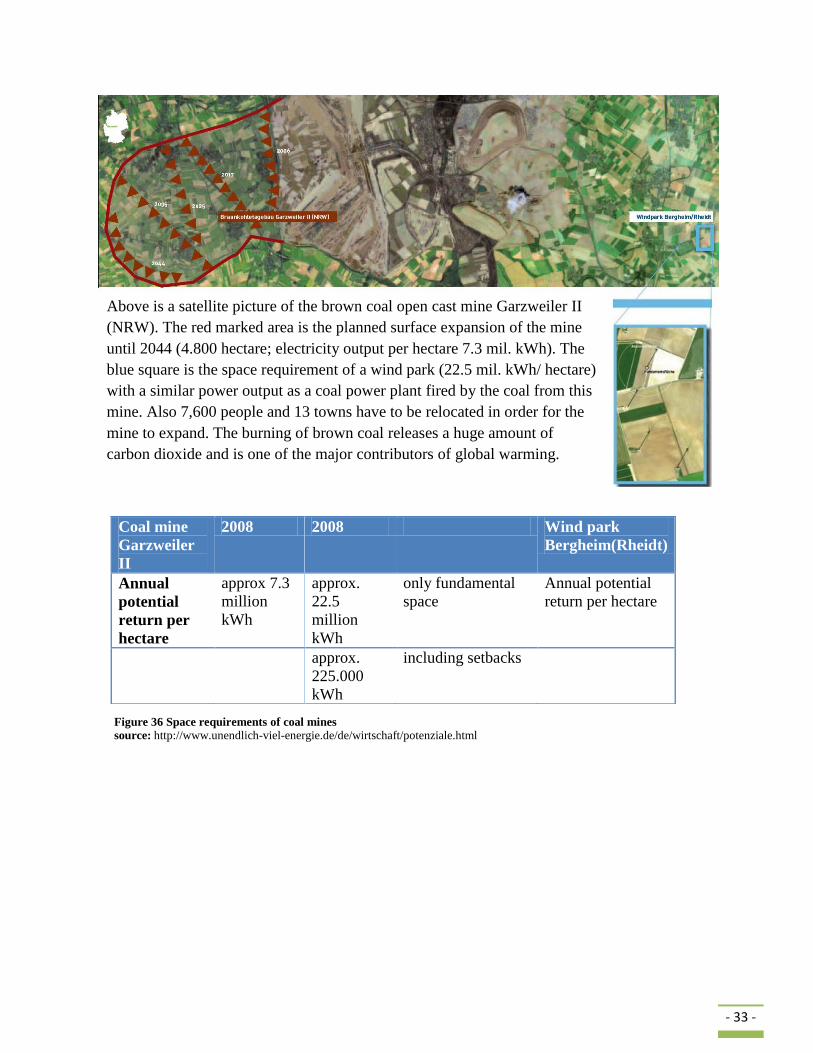
Above is a satellite picture of the brown coal open cast mine Garzweiler II
(NRW). The red marked area is the planned surface expansion of the mine
until 2044 (4.800 hectare; electricity output per hectare 7.3 mil. kWh). The
blue square is the space requirement of a wind park (22.5 mil. kWh/ hectare)
with a similar power output as a coal power plant fired by the coal from this
mine. Also 7,600 people and 13 towns have to be relocated in order for the
mine to expand. The burning of brown coal releases a huge amount of
carbon dioxide and is one of the major contributors of global warming.
Figure 36 Space requirements of coal mines
source: http://www.unendlich-viel-energie.de/de/wirtschaft/potenziale.html
- 34 -
8. Concluding Remarks
When the Berlin Wall collapsed in 1989, people around the world wondered how long it would
take the country to integrate former GDR (German Democratic Republic) into the BRD (Federal
Republic of Germany). A country under the protection of the Soviet Union had become
extremely worn down. The industry was in a very sorry state, infrastructure was poor, political
leaders were released by the people, environmental standards did not exist, currency had to be
replaced and a cultural integration took place between two populations that had been separated
for 40 years. It was a great challenge; probably the biggest challenge apart from rebuilding the
country after WWI. However, in only two decades, Germany reunited and accomplished
something that many countries aren’t able to do.
Now there is a new mission. Germany has to end its dependence on fossil fuels and stop emitting
greenhouse gases to prevent the consequences of global warming. When Germany decided to
shut down all of its nuclear power plants within ten years it became a role model for the rest of
the world. Germany’s efforts are being watched around the world and if successful will guide
other countries to follow the same path.
After working on this report and reviewing the question if 100% clean, green energy supply for
Germany is possible, the answer is: Yes. The past 15 years have shown how fast Germany can
develop renewable energies. Germany has the renewable potential, the technical know-how and
the mentality to do it. But how can it be done?
There has to be a mix of many different renewable technologies – the more the better.
However, two are most prominent. A major role in Germanys’ future energy supply will have
wind turbines and solar cells. Both will be responsible to secure the electrical base load where
Germany is one of the world leaders in both. Extreme growth rates were accomplished in the
past years but the rate is slowing down due to the financial crises. Germany has to help out
flagging EU Countries financially which takes away money from being invested into the wind
and solar sectors.
On-shore wind park development is very advanced especially in the northern and central parts
of Germany. With the help of the world’s largest wind turbine manufactured by the company
Enercon, newer, better and higher wind turbine models made it profitable in weaker wind sites to
install wind plants. Wind is the renewable technology with the fastest return on investment.
Economies of scale and constant research and development have made wind electricity the
cheapest and grid-compatible electricity source. Wind turbines are also very efficient. In 2009,
3% of all European electricity was generated through wind. This is equivalent to the power that
10 nuclear power plants would have produced.51
Estimates from reputable institutions attach
great importance and high growth projections to wind power.
51
http://www.energieblog24.de/e126/
- 35 -
Experts say it will produce more than 50% of Germany’s electricity in the future.
Included in the 50% is off-shore wind power. Germany is massively expanding its off-shore
efforts by building 27 wind parks along the coast while many more are pending.
Electricity generated by the sun, the world's largest energy source, will be Germany's second
primary source of electricity. Photo-voltaic PVcells are already installed on many roof tops.
Especially on large roof buildings and farm sheds. The acceptance of solar cells is immense.
Farmers, which often show bias against any new technology, have suddenly invested in solar
panels on farms. Some would think Germany does not have great potential for solar power but
this is not true. Almost every roof top facing south has the potential to supply electricity at a
profitable level, particularly with declining production costs. The decision of the German
government to eliminate subsidies has hit the industry hard but many companies are still making
profits. Daytime solar power, combined with wind power at night will be Germany’s energy
future.
In cases of low wind and solar input, alternate renewable electricity sources such as
geothermal, hydro and biomass energy will assist to maintain base load generation.
It will be very interesting to see how fast the development of geothermal energy will be and how
much of the immense potential can be developed. The government has guaranteed to support
investments for the next 20 years so planning security has already been given. The problem is
that in the past, Germany failed to be consistent in policy. It also has to be said that even if
geothermal energy might not play a major role in electricity production, it definitely will be very
important for heat production. It will also indirectly help to reduce electricity demand. The same
can be expected for certain solar technologies installed on rooftops that can help heat up water
and therefore reduce energy consumption.
The importance and urgency of the expansion and improvement of the German electrical grid
cannot be emphasized enough. Without a modern grid, Germany’s transition into a green country
will not be possible. The government needs to invest in the electrical grid order to achieve
climate goals. It will pay off in the long run. Only with a state of the art grid can Combined
Cycle Power Plants be able to compensate for the intermittency of wind and solar power
mentioned earlier. That’s why modern HVDC power lines are essential. They will connect off-
shore wind to the inland. Off-shore wind is more reliable and readily available.
But are there any alternatives? With a limited supply of oil and the effects of global warming
already taking place, action needs to be taken now. Do we really want our kids to live with the
consequences of global warming? It is imperative that we change our mentality and fix what we
have done before it becomes too late. With the findings presented here, and a positive new
attitude, Germany can be a leader for a zero CO2 emission future.
- 36 -
9. Bibliography
(IWR), I. W. (kein Datum). iwr.de. Von http://www.iwr.de/wind/offshore/nat_plan.html abgerufen
Deutscher Bundestag. (11. 11 2010). Abgerufen am 16. 05 2011 von
http://www.bundestag.de/presse/hib/2010_11/2010_375/03.html
Green Point Partners. (2. 12 2010). Von http://blog.greenpointpartners.com/real-
estate/solar%E2%80%99s-push-to-reach-the-mainstream/ abgerufen
Deutschland hat 2008 Klimaziele erfüllt. (01. 02 2012). Der Spiegel.
Agency, I. I. (2011). Satista.com. Von
http://de.statista.com/statistik/daten/studie/12914/umfrage/anteil-der-atomenergie-am-
stromverbrauch-in-ausgewaehlten-laendern/ abgerufen
Alpha-Ventus. (2008). Alpha-Ventus.de. Von http://www.alpha-ventus.de/index.php?id=24 abgerufen
angebot-photovoltaik.eu. (kein Datum). Von http://angebot-
photovoltaik.eu/joomgallery/img_originals/strahlungskarten_und_sonneneinstrahlung_4/strahl
ungskarte-afrika_20091221_1397537949.jpg abgerufen
Blatzheim, T. S. (09. 05 2008). Verivox.de. Von http://www.verivox.de/ratgeber/die-stromnetze-in-
deutschland-25551.aspx abgerufen
braunkohle.de. (kein Datum). Von http://www.braunkohle.de/pages/layout3sp.php?page=573
abgerufen
Bundesministerium fürUmwelt, N. u. (2011). Bundesministerium fürUmwelt, Natur und
Reaktorsicherheit. Von http://www.erneuerbare-energien.de/inhalt/4642/ abgerufen
Bundestag, D. (11. 11 2010). Von http://www.bundestag.de/presse/hib/2010_11/2010_375/03.html
abgerufen
Bundestag, D. (08. 11 2010). Von http://dip21.bundestag.de/dip21/btd/17/036/1703629.pdf abgerufen
Bundeswaldinventur. (2011). Von http://www.vti.bund.de/no_cache/de/startseite/startseite/die-
bundeswaldinventur.html abgerufen
Daniel M. Kammen, K. K. (21. 01 2006). Putting Renewables to Work: How Many Jobs Can the Clean
Energy Industry Create? Berkley, Calofornia, USA.
DEBRIV. (24. 05 2011). http://www.braunkohle.de/pages/layout3sp.php?page=573. Von
http://www.braunkohle.de. abgerufen
Dena.de. (kein Datum). Von http://www.dena.de/en/services/about-dena/ abgerufen
- 37 -
dpa. (29. 09 2009). faz.de. Von http://www.faz.net/artikel/C31151/werften-ende-des-schiffbaus-in-
emden-30074975.html abgerufen
e.V., S.-F. D. (31. 08 2011). sfv.de. Von http://www.sfv.de/sob99334.htm abgerufen
Enercon. (2010). enercon.de. Von http://www.energieblog24.de/e126/ abgerufen
Energies, A. f. (kein Datum). Von http://www.unendlich-viel-energie.de abgerufen
H.HeenemannGmbH&Co. (08. 11 2010). Gesetzentwurf der Bundesregierung. Abgerufen am 16. 05 2011
von Deutscher Bundestag: http://dip21.bundestag.de/dip21/btd/17/036/1703629.pdf
kraftwerke-Vattenfall. (kein Datum). Von http://kraftwerke.vattenfall.de/powerplant/goldisthal
abgerufen
Neurohr, E. (kein Datum). Das Auftriebsprinzip. Von http://www.neurohr-
info.de/html/auftriebsprinzip.html abgerufen
Nitsch, D. J. (kein Datum). solarbusiness.de. Von http://www.solarbusiness.de/fakten/sonne-unendlich-
viel-potenzial/100-saubere-energie/ abgerufen
OnlinePortalSolarEnergy, S. (kein Datum). solarserver.com. Von
http://www.solarserver.com/solarmagazin/anlagejanuar2008_e abgerufen
SOLAR, A. (06. 06 2010). Photovoltaik.tumblr.com. Von
http://photovoltaik.tumblr.com/post/670536241/sonnenstunden abgerufen
Solar, B. (kein Datum). Von http://en.solarwirtschaft.de/fileadmin/content_files/factsheet_pv_engl.pdf
abgerufen
solarfeedintariff.net. (kein Datum). Von http://www.solarfeedintariff.net/images/spain+portugal.png
abgerufen
solar-is-future.de. (kein Datum). Von http://www.solar-is-future.de/faq-glossar/faq/technik-und-
funktionsweise/woraus-besteht-eine-solarzelle/ abgerufen
Wasserkraftwerke, B. D. (kein Datum). www.wasserkraft-deutschland.de. Von http://www.wasserkraft-
deutschland.de/ abgerufen
WEG Wirtschaftsverband Erdöl- und Erdgasgewinnung e. V. . (08. 07 2011). erdoel-erdgas.de. Von
http://www.erdoel-erdgas.de/Reserven-175-1-69b.html abgerufen
WindEnergie, B. (kein Datum). Von http://www.wind-energie.de/politik/repowering abgerufen
WWF. (2005). Abgerufen am 10. 06 2011 von wwf.com:
http://wwf.panda.org/about_our_earth/aboutcc/cause/coal/dirty_30/dirty30_ranking.cfm

- 38 -
WWF. (kein Datum). wwf.com. Von
http://wwf.panda.org/about_our_earth/aboutcc/cause/coal/dirty_30/dirty30_ranking.cfm
abgerufen