attitude, aptitude, and testing in the efficient...
TRANSCRIPT
Attitude, Aptitude, and Testing in the Efficient Mobilization of
Military Manpower
Jonathan Lipow
Jay Simon
Abstract: Militaries commonly require recruits to pass a test that measures aptitude for
military service. In this paper, we show that such tests may also act as a device for screening
out low-motivation recruits, even if it is assumed that motivation is not measured by such tests
and is not correlated with aptitude.
JEL Codes: H56; D82; J45;
Key Words: Military; Recruitment; Testing; Aptitude; Motivation; Attitude;
The authors are, respectively, Associate Professor of Economics and Assistant Professor of
Operations Research at the Defense Resources Management Institute, Naval Postgraduate
School. Mailing Address: DRMI, Code 64, NPS, 699 Dyer Road, Monterey, CA 93943. Dr.
Lipow is the corresponding author and can be reached at [email protected] or 831-656-2661.
Dr, Simon can be reached at [email protected] or (831) 656-2457.

Attitude, Aptitude, and Testing in the Efficient Mobilization of Military Manpower
"Of every one hundred men in battle, ten should not even be there. Eighty are nothing
but targets. Nine are the real fighters, we are lucky to have them since they make the
battle. Ah, but the one—one is the Warrior—and he brings the others home.“
Heraclitus. Circa 400
BCE1
SECTION ONE: INTRODUCTION
It is widely understood that the most desirable candidates for military service are
intelligent and well educated.2 It is, however, generally overlooked that recruits’ motivation
for service matters as well. Those that really want to serve in the military are more likely to
perform well, avoid disciplinary problems, and re-enlist following completion of their initial
service commitment.3 The problem is that, unlike intelligence and educational attainment, it
is effectively impossible to identify potential recruits’ true level of motivation when they
wander in to speak with a recruiter.
Part of the reason why it is difficult to identify recruit motivation is that young people
volunteer to serve in the military for a remarkably wide variety of reasons. Some are
primarily motivated by the military’s offer of pay and benefits. Others are drawn to the
military due to a sense of adventure, or as an award winning Swedish recruitment video
suggests, by “an opportunity to emerge from the water holding a weird futuristic weapon.”4
Yet others see military service as an expression of their sexual identity, taking to heart Betty
Boop’s admonishment: “don’t be a sissy, join the army and get a kissy!”5 Still others are
drawn to service due to proud family traditions or, alternatively, by the need to get away from

their families. Some aren’t even really sure why they want to serve in the armed forces. And
then there are those who actually want to serve their country.
In this paper, we illustrate the influence of unobservable variation in recruit motivation
on the volunteer mobilization of military personnel, and the important and surprising role that
aptitude testing plays in screening out low-motivation recruits. We consider a pool of
potential recruits. The recruits differ in terms of their civilian reservation wages (a proxy of
the recruit’s aptitude for military service) and in terms of whether they have a “taste” for
military service. We assume that there is no correlation between reservation wages and tastes.
We then identify the characteristics of those who will volunteer for service at any given wage
level. Following that, we introduce a simple test similar to the U.S. Armed Forces’ “Armed
Forces Qualification Test” (AFQT) that perfectly reveals a potential recruit’s reservation
wage, and identify the combinations of wage and minimum test score that achieve different
levels of military capability at the least cost.
Our main result is that aptitude testing – while shedding no light directly on recruit
motivation – acts as a device for screening out low motivation recruits when used in
conjunction with wages. To the best of our knowledge, this is the first paper to identify this as
a possibility. In addition, our analysis challenges the conventional wisdom regarding a
number of topics in military planning and defense economics, such as the widely held beliefs
that declining test standards are evidence of eroding military capability and that military
conscription is socially inequitable.
This paper is closely related to a literature that considers the role of non-pecuniary
benefits in the compensation of workers and agents. Influential and/or recent papers in this
literature include Rosen (1986), Francois (2000), Dixit (2001), Murdock (2002), Benabou and
Tirole (2003), Akerlof and Kranton (2005), Besley and Ghatak (2005), and Delfgaauw and
Dur (2007), Makris (2009), and Arce (2012).
The papers in this literature consider a number of different definitions of motivation.
Some papers model motivation as being derived by the pleasure of doing a job that is fun or
interesting. Other papers consider situations where workers may be motivated by a desire to
maintain high ethical standards or enhance their self-esteem or sense of identity. Still other
papers consider workers deeply committed to the mission that their employer is pursuing, such
as education, scientific advancement, justice, or national security.
In this paper, we aren’t concerned with what causes greater motivation, but rather what
is caused by greater motivation. We assume only that “motivated people probably work
harder, which increases output, and because people derive utility from the job, they may be
willing to work for a lower wage”6 – an assumption made by virtually all papers in this
literature.
Many papers in this literature generally assume that agent motivation is directly
observable, but a number of papers consider situations where agent motivation is
unobservable, resulting in problems of adverse selection. .Handy and Katz (1998), Delfgaauw
and Dur (2007,) and Arce (2012) consider the role that wage offers can play in identifying
highly motivated job candidates. Handy and Katz (1997) find that in a labor market where
workers vary in terms of both motivation and ability, low wage offers weed out unmotivated
candidates and can result in the recruitment of workers that are both more talented and more
motivated. Delfgaauw and Dur (2007) focus on a labor market where workers vary only in
terms of motivation and candidates incur costs in applying for jobs. They find that while low
wage offers increase the likelihood that candidates will be highly motivated, they also increase
the risk that positions will go unfilled. Arce (2012) considers employers who screen for
motivation by offering a menu of contracts with different weightings of fixed wage and
compensation contingent on effort. He finds that highly motivated workers will prefer
contracts with little or no contingent compensation.
This paper follows Handy and Katz (1997) in assuming that job candidates differ un-
observably in terms of both ability and motivation. The main contribution of this paper is that
it illustrates that it is possible to overcome problems of adverse selection in agent motivation
at least partially by exploiting intelligence tests that offer no direct information regarding
agents’ level of enthusiasm.
Due to its focus on unobservable recruit characteristics, this paper is also tangentially
related to a literature that focuses on the role of asymmetric information in the recruitment of
military manpower. Recent papers in this literature include Perri (2010), Berck and Lipow
(2011), Lipow and Simon (2011), and Perri (2012). Excellent reviews of earlier research on
this subject can be found in Williams and Gilroy (2006) and Asch, Hosek, and Warner (2007).
The paper is organized into four sections. In Section Two, we introduce the model’s
basic architecture and evaluate the characteristics of a volunteer system in the absence of
aptitude testing. In Section Three, we evaluate the characteristics of a volunteer system where
a wage is offered and all those who volunteer and “pass” an aptitude test are accepted for
service. Section Four concludes the paper with a discussion of the implications of our
findings for military planning and defense economics.

SECTION TWO: A MODEL OF VOLUNTEER MILITARY MANPOWER
MOBILIZATION
Consider a pool of potential recruits for military service. We assume without loss of
generality that the size of this pool is 1. Each of these potential recruits can earn a wage, z, if
they decline to enlist and instead enter the civilian labor market. The value of z differs from
individual to individual, and acts as a proxy for the potential recruit’s aptitude for military
service. Let us assume that z ~ U[0,1]. For now, we also assume that each individual’s value
of z is known only to that potential recruit.
Potential recruits also differ in terms of their motivation to serve in the military. We
assume that there are two types of potential recruit. One type – the highly motivated - enjoys
some non-pecuniary benefit from serving in the military Let k represent the equivalent
monetary value of this benefit, while θ represents the proportion of potential recruits that are
highly motivated to serve in the military. The other type of potential recruit – the unmotivated
– enjoys no non-pecuniary benefits from military service. For this type, military service is
simply another job, and they measure the desirability of that job relative to civilian
employment based solely on the wages offered. We also assume that motivation is
uncorrelated with z.
Now, let us consider a simple – even naïve - volunteer system for the mobilization of
military manpower. In this system, the military simply sets a wage w, 0 1w . There are no
tests or screenings of potential recruits. Any potential recruit who observes w and decides to

volunteer joins the military and receives w as his or her wage. We assume that each potential
recruit makes the decision which will maximize his or her total benefit, that is, those left better
off by joining the military are those that volunteer. For the unmotivated, anyone whose
civilian wage z is less than w will join the military. For the highly motivated, anyone whose
reservation wage is less than w + k will join.
Let N be the total number of potential recruits who join the military, while z is the
average reservation wage of those that serve in the military, and r is the proportion of those
that serve who are highly motivated to do so. Given the response of potential recruits of both
types to the wage offer, as well as our assumptions that z is uniformly distributed and that
motivation is uncorrelated with z, it is straightforward to solve for N , r , and z in terms of w,
k, and θ:
, 1
1 , 1
w k w kN
w w k
, (1)
, 1
, 11
w kw k
w kr
w kw
,
(2)
2 2
2
2, 1
2
1, 1
2 1
kw w kw k
w kz
ww k
w
. (3)

Derivations for (1)-(3) are given in the Appendix. Two expressions are given for each of
these variables, since all the highly motivated potential recruits - regardless of their civilian
wage – will have joined the military by the time w reaches 1-k.
In Figure 1, the relationships between w and N, z , and r are illustrated graphically.
The relationships in Figure 1 have been drawn assuming that k = .2 and θ = .4, but
qualitatively, the graphs will look similar for 0 < θ < .5 and 0 < k < 1. The average aptitude
curve is qualitatively different when θ is between .5 and 1, as discussed below.
***INSERT FIGURE 1 ABOUT HERE***
The relationships graphed in Figure 1 define the decision space for defense planners
grappling with the volunteer mobilization of military manpower. Three relationships govern
the planners’ choices. First, there is a clear trade-off between numbers, aptitude, and
motivation. Higher wages always result in a larger and (almost always) higher aptitude
military, but progressively lower the proportion of recruits who are highly motivated to serve.
The second is that there is an important kink point where w = 1 - k. Up till that point,
each incremental increase in w induces the enlistment of two distinct types of recruit. One
type is highly motivated and has a relatively high value of z. The other type is unmotivated
and has a relatively low value of z. At w = 1 – k, however, the very last remaining high
motivation potential recruit enlists. As a result, from that point on, every incremental increase
in the wage attracts a smaller number of additional recruits and none of those recruits are
highly motivated.
Finally, the relationship between z and w depends on the value of θ. When the
military is very small, offering higher wages need not enhance the average aptitude of recruits.

The reason is that at w = 0, only highly motivated potential recruits join the military. Any
highly motivated volunteer whose civilian wage is less than k will volunteer. As a result, the
average value of z for those serving in the military is k/2. Now, as we discussed above, an
incremental increase in w would, at that point, attract two distinct types of volunteer. One
type would be highly motivated and have a value of z = k. The other type would be
unmotivated and have z = 0. The average value of z for the incremental volunteers would be
θz. As a result, if θ < .5, then z would be declining as a result of the incremental increase in
w. Should θ be greater than .5, then the average aptitude of recruits would monotonically
increase with the wage.
Now, we continue the analysis by following Berck and Lipow (2011) in assuming a
function for the production of defense capability of form Q Nzr
. Using this function, we
determine the value of w, w*, that provides the desired levels of capability at minimum cost.
We ignore capital expenditures, training, and operating expenses, and assume that the cost
function is given by wN, the military’s wage bill. Figure 2 shows w* and total cost as a
function of q, for the case where α = 1/3, 0.2k , and 0.2 (other sets of parameter values
do not yield qualitatively different results). The components of Q are determined using (1)-(3)
as previously.
***INSERT FIGURE 2 ABOUT HERE***
Figure 2 holds few surprises. The only way to boost defense capability is obviously to
raise the wage, and the marginal cost of military capability is increasing, since the higher
wage that attracts each new recruit is also paid to all those already in uniform. The wage and
force size curves are parallel for most of the graph, because a marginal increase in the wage

leads to a corresponding marginal increase in the force size. When w = .8, however, the kink
point mentioned above is reached – all those highly motivated to serve are now in the military.
At that point, incremental increases in the wage attract only unmotivated recruits, and thus
produce far less additional defense capability. Until w = 1, the average aptitude of the
marginal recruit is actually a bit lower than the recruits that volunteered when w reached .8
and a highly motivated recruit with z = 1 showed up and began what promised to be a stellar
military career.
SECTION THREE: EXPLOITING APTITUDE TESTS IN THE RECRUITMENT
PROCESS
In this section, we will assume that the military can give potential recruits a test similar
to the Armed Forces Qualification Test (AFQT) used in the United States. We will assume
that this test will perfectly identify each recruit’s level of z.7 The test, however, will not
directly shed any light on the potential recruit’s level of motivation. We also assume that the
potential recruit’s test score cannot be used to adjust the wage she is offered by the military.8
All recruits must earn the same wage.9
The test will be used solely to determine whether a recruit is accepted into the military.
Let t equal the cut-off test score potential recruits must attain if they are to join the armed
forces. We assume that w t k , which ensures a force size greater than zero.
As in Section Two, it is helpful to express N, r, and z in terms of t and w. In the case
where 1w k , i.e. not all of the highly motivated individuals will join:

,
,
k w t t wN
k w t t w
, (4)
,
1,
k w tt w
r N
t w
,
(5)
0.5 2,
0.5 ,
w t w t k k wt w
z N
w k t t w
.
(6)
In the case where 1w k , i.e. all highly motivated individuals join the military:
1 ,
1 ,
w t t wN
t t w
, (7)
1,
1,
tt w
r N
t w
,
(8)
2 20.5 1,
0.5 1 ,
w tt w
z N
t t w
.
(9)
As before, the formulation of (4)-(9) is facilitated by determining expressions for the
number of motivated and unmotivated recruits who will join the military. When t w ,
1 w t unmotivated recruits will join, and w k t motivated recruits will join if
1w k ; 1 t motivated recruits otherwise. When t w , no unmotivated recruits will
join, and the expressions for the number of motivated recruits remain the same.
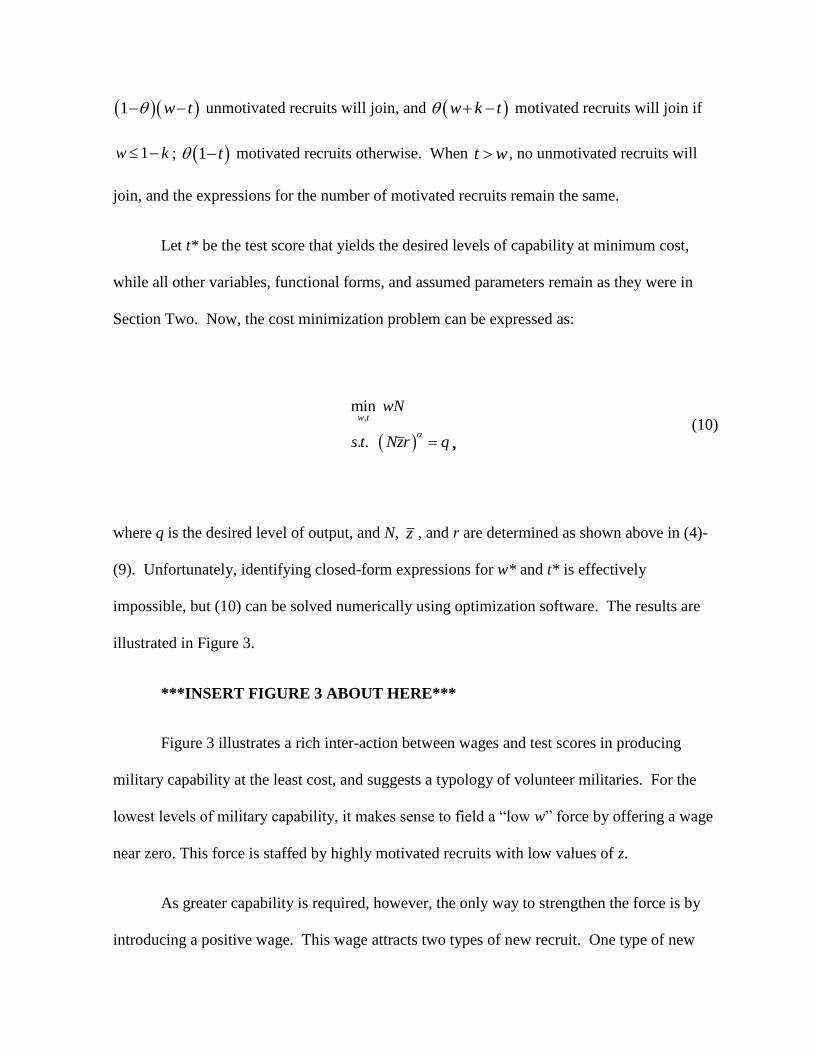
Let t* be the test score that yields the desired levels of capability at minimum cost,
while all other variables, functional forms, and assumed parameters remain as they were in
Section Two. Now, the cost minimization problem can be expressed as:
,min
. .
w twN
s t Nzr q ,
(10)
where q is the desired level of output, and N, z , and r are determined as shown above in (4)-
(9). Unfortunately, identifying closed-form expressions for w* and t* is effectively
impossible, but (10) can be solved numerically using optimization software. The results are
illustrated in Figure 3.
***INSERT FIGURE 3 ABOUT HERE***
Figure 3 illustrates a rich inter-action between wages and test scores in producing
military capability at the least cost, and suggests a typology of volunteer militaries. For the
lowest levels of military capability, it makes sense to field a “low w” force by offering a wage
near zero. This force is staffed by highly motivated recruits with low values of z.
As greater capability is required, however, the only way to strengthen the force is by
introducing a positive wage. This wage attracts two types of new recruit. One type of new

recruit has a higher value of z than anyone currently in the military. This type is highly
motivated to serve, but refrained from volunteering at a low wage because of his or her
relatively high civilian earning prospects. The other type has no motivation to serve and also
has a lower level of z than those currently serving in the military. This type sees the low wage
offered by the military as very attractive relative to civilian prospects. Furthermore, given the
assumption that θ = .2, for every new recruit of the highly desirable first type there are four
new recruits of the highly undesirable second type. In order to prevent these low quality
recruits from diluting the force’s average levels of aptitude and motivation, the military
introduces a minimum aptitude level for recruits. This screens out the four new recruits of the
second type, but also eliminates one highly motivated recruit who had a minimal value of z.
The net result is that the military’s size remains constant and its level of motivation remains
high, but recruits’ average level of aptitude increases.
This process continues until the point where the wage and the minimum value of z for
those accepted are now set at .8 and the military is attracting highly motivated recruits with a
reservation wage of as high as one. This military is now a small force of exceptionally capable
and highly motivated personnel - a “high t/high w” force staffed with SEALs.
Now, should greater military capability be required than the level provided by this elite
force, there are two possible approaches: (i) lower test standards; or (ii) raise the wage.
Initially, lowering test scores is unambiguously the preferable option. Both alternatives result
in new recruits of roughly the same level of aptitude – about .8 or so. Lowering entry
standards, however, adds some highly motivated recruits, while raising the wage does not.
Furthermore, when wages are raised, the additional wage is given not only to the new recruit,
but to all other recruits as well. These considerations assure that the most cost-effective

method of increasing capability is to lower test standards as a military builds up beyond the
capability produced by a small elite force.
As minimum test scores decline, however, new recruits mobilized through lower
standards increasingly pull down the force’s average level of aptitude. Eventually, it becomes
attractive to begin raising wages as well in order to stem the deterioration in average aptitude.
This continues until the point where the wage equals one. The result is a “low t/high w” force -
a mass military with great variation in recruit aptitude and motivation levels.
SECTION FOUR: DISCUSSION AND CONCLUSION
The widespread exploitation of aptitude testing as a manpower screening tool for
militaries should hardly be surprising. Such screening allows militaries to achieve required
levels of capability at lower cost. To illustrate this, Table 1 compares the cost of producing
different levels of defense capability for militaries with and without testing for the functional
forms and assumed parameters exploited in this paper.
Table 1. Optimal parameter levels and costs to produce various levels of capability.
Wage Test Cutoff Force Size
Average
Aptitude
Proportion
Motivated
Cost
No Testing, q=0.2 .15 - .19 .11 .37 .03
No Testing, q=0.3 .40 - .44 .23 .27 .18
No Testing, q=0.4 .68 - .72 .36 .24 .49
Testing, q=0.2 .10 .10 .04 .20 1.00 .00
Testing, q=0.3 .59 .59 .04 .69 1.00 .02

Testing, q=0.4 .80 .54 .30 .70 .31 .24
As can be seen, testing results in more cost-efficient outcomes. For each level of capability,
the volunteer force required is substantially smaller and of higher quality with testing than it is
in the absence of testing.
What we believe to be significant and surprising, however, is that this higher quality
doesn’t manifest itself only in terms of greater average aptitude but also in higher – indeed
much higher - average levels of motivation. In other words, aptitude testing is not only useful
in screening out recruits of low aptitude. When used in conjunction with a wage offer, it plays
a critical role in screening out recruits of low motivation, and this is the case even though
testing does not measure motivation and there is no tell-tale correlation between aptitude and
motivation.
In addition to offering this basic insight regarding the role of aptitude testing in
screening out low motivation military recruits, our analysis challenges the conventional
wisdom regarding two issues in defense manpower policy. The first is how to interpret a
decline in the military’s minimum aptitude standards.
The consensus view of the role played by the minimum aptitude standards is that they
are there to screen out potential recruits ill-suited for military service: “the fundamental
purpose of entry screening is the elimination of ‘bad risks’ or men who could not meet the
severe demands of war.”10
As such, evidence that recruitment standards are declining is
generally taken as prima facie evidence that a military is “in trouble” or that readiness is at
risk. For example, a 2008 analysis in Slate breathlessly comments that “the Army is lowering

recruitment standards to levels not seen in at least two decades, and the implications are severe—not
only for the future of the Army, but also for the direction of U.S. foreign policy.”11
Our analysis suggests something very different. Elite militaries, while a very cost-
efficient way of producing a low level of defense capability, are likely to be too small to
prevail in large conflicts. Reducing minimum recruitment standards may simply be the most
cost-efficient route to enhance defense capability when security conditions have deteriorated.
The historical record seems consistent with our hypothesis: “with each mobilization for war or
other national emergency, voluntary enlistment and induction standards have been lowered.”12
Second, let us consider the implications of our analysis for understanding the impact of
military conscription on social equity and income distribution. It is widely believed that the
draft exacerbates problems of social equity. For example, Asch et al. (2010) writes that
“conscription promotes a less equal distribution of income and tends to place the burden of
paying for national defense on lower income groups.”13
This certainly dovetails with the
public perception of the socio-economic impact of the Vietnam era draft in the U.S., where
more advantaged youth received college deferments while less educated young people were
conscripted and paid low wages.
Our analysis suggests, however, that cost-effective volunteer armies are likely to
screen out recruits of low aptitude, while paying most of those who do get accepted for service
a higher wage than they would have earned as civilians. Reliance on such a force is also
socially regressive. Instead of conscripting the less capable and paying them “below market”
wages, the volunteer military may instead be recruiting the more capable and paying them
“above market” wages while screening out less capable volunteers.

Consider the major wars fought by the U.S. military in Afghanistan and Iraq. These
conflicts have been waged with volunteers – but who exactly are these volunteers, and how
much do they get paid? According to a recent analysis, “recruit data support the finding that
U.S. military recruits are more similar than dissimilar to the American youth population. The
slight differences are that wartime U.S. military enlistees are better educated, wealthier, and
more rural on average than their civilian peers.”14
How much do these recruits get paid? A
typical volunteer with a three year commitment can expect to earn $20,000 a year, while
receiving free housing, food, and medical benefits worth about $5,000 - $10,000 more. In
addition, the volunteer will receive $70,000 or so in college benefits, as well as an enlistment
bonus of up to $40,000. Compare that to the most recent estimates of the average gross
income of an 18 year old high school graduate – about $20,000 per year. The reality is that 18
year old recruits are currently paid more than most 22 year old college graduates in the private
sector economy.15
Hence, the right question to ask in terms of manpower policy and social equity is not
whether the Vietnam era draft was regressive (it clearly was), but whether the draft was more
regressive than what would have resulted had the Vietnam war been fought by highly paid and
highly educated volunteers such as those that are fighting today in central Asia. Our analysis
suggests that the answer to that question is far from clear.

REFERENCES:
Akerlof, G. and Kranton, R. (2005) “Identity and the Economics of Organizations,”
Journal of Economic Perspectives, 19 (1): 9-32.
Arce, D. (2012) “Principals’ preferences for agents with social preferences.”
Journal of Economic Behavior and Organization, forthcoming.
Asch, B., Hosek, J., and Warner, J. (2001) “An Analysis of Pay for Enlisted Personnel,”
DB-344-OSD. Santa Monica, CA: RAND.
Asch, B., Hosek, J., and Warner, J. (2007) “New Economics of Manpower in the
Post-Cold War Era,” in Handbook of Defense Economics, Volume Two: Defense in a
Globalized World, edited by T. Sandler and K. Hartley. Amsterdam and Boston:
North-Holland.
Asch, B., Miller, J., and Warner, J. (2010) “Economics and the All-Volunteer Military Force,”
in Better Living Through Economics, edited by J. Siegfried. Cambridge, MA: Harvard
University Press, 253-269.
Asch, B., Romley, J., and Totten, M. (2005) “The Quality of Personnel in the Enlisted
Ranks.” MG-324-OSD. Santa Monica, CA: RAND.
Benabou, R. and Tirole, J. (2003) “Intrinsic and extrinsic motivation.” Review of Economic
Studies, 70 (3): 489-520.
Berck, P. and Lipow, J. (2011) “Military Conscription and the (Socially) Optimal
Number of Boots on the Ground.” Southern Economic Journal, 78 (1): 95-106.
Besley, T. and Ghatak, M. (2005) “Competition and incentives with motivated agents.”
American Economic Review, 95 (3): 616-636.
Delfgaauw, J. and Dur, R. (2007) “Signaling and screening of workers’ motivation.”
Journal of Economic Behavior and Organization, 62 (4): 605-624.
Dixit, A. (2002) “Incentives and organizations in the public sector: an interpretive review.”
Journal of Human Resources, 37 (4): 696-727.
Eitelberg, M., Lawrence, J., Waters, B., and Perelman, L. (1984) “Screening for
Service.” Report FR-PRD-83-24. Alexandria, VA: Human Resource Research
Organization.
Francois, P. (2000) “Public service motivation as an argument for government provision.”
Journal of Public Economics, 78 (3): 275-299.

Handy, F. and Katz, E. (1998) “The wage differential between non-profit institutions and
corporations: getting more by paying less.” Journal of Comparative Economics,
26 (2): 246-261.
Kavanaugh, J. (2005) “Determinants of Productivity for Military Personnel.”
TR-193-OSD. Santa Monica, CA: RAND.
Lipow, J. and Simon, J. (2011) “Military Reserves and Social Welfare.”
Economics Letters, 113 (3): 208-210.
Makris, M. (2009) “Incentives for motivated agents under an administrative constraint.”
Journal of Economic Behavior and Organization, 71 (2): 187-192.
Monks, J. (2000) “The returns to individual and college characteristics: Evidence from the
National Longitudinal Survey of Youth.” Economics of Education Review 19 (3):
279–289.
Murdock, K. (2002) “Intrinsic motivation and optimal incentive contracts.” RAND Journal
Of Economics, 33 (4): 650-671.
Patterson, A. (1978) “The Goal of Motivation in the Military: Soldier Satisfaction or Soldier
Performance?” Unpublished Thesis. United States Army Command and General Staff
College.
Perri, T. (2010) “Deferments and the Relative Cost of Conscription.” B.E. Journal
of Economic Analysis and Policy, 10 (1): Article 103.
Perri, T. (2012) “Uncle Sam Wants Whom? The Draft and the Quality of Military Personnel.”
Unpublished Working Paper. Appalachian State University.
Rosen, S. (1986) “The theory of equalizing differences.” In Handbook of Labor Economics,
Volume One., edited by O. Ashenfelter and R Layard. Amsterdam: Elsevier, 641-692.
Williams, C. and Gilroy, C. (2006) Service to Country: Personnel Policy and the
Transformation of Western Militaries, Cambridge and London: MIT Press.
NOTES:
1 There are only fragmentary remains of Heraclitus’ work. This quote can be found at:
http://www.goodreads.com/author/quotes/77989.Heraclitus.
2 See Kavanaugh (2005) for an excellent review of the extensive literature documenting the importance of
intelligence and education in the performance of military duties. 3 See Patterson (1978) for an excellent discussion of the influence of motivation of performance in the military.
4 Swedish Armed Forces. 2011. “Welcome to Our Reality,” Accessed October 15, 2012. URL:
http://www.youtube.com/watch?v=AprqomTW-Wo.
5 Max and Dave Fleischer. 1934. “Something about a Soldier,” Accessed 15 October 2012.
URL: http://www.youtube.com/watch?v=TSZ31YrEc9Q.
6 See Delfgaauw and Dur (2007), p. 607.
7 See Monks (2000) for evidence of the AFQT’s value in predicting future income.
8 See Akerlof and Kranton (2005), p. 17.
9 This is consistent with empirical evidence. Asch, Hosek, and Warner (2001), for example, find that civilian
wages – corrected for experience and education level – vary far more than military pay.
10 See Eitelberg et. al. (1984), p. 1.
11 See Fred Kaplan, “Dumb and Dumber,” Slate, 24 January 2008.
12 Eitelberg et. al. (1984), p. 26.
13 See Asch et. al. (2010), p. 256.
14 See Tim Kane, “Who Are the Recruits? The Demographic Characteristics of U.S. Military Enlistment, 2003-
2005,” Heritage Foundation Report, 27 October 2006.
15 See Heidi Shierholz, Natalie Sabadish, and Hilary Wething, “The Class of 2012,” Economic Policy Institute
Report, 3 May 2012.

FIGURES:
Figure 1:
Figure 2:
0
0.1
0.2
0.3
0.4
0.5
0.6
0.7
0.8
0.9
1
0 0.2 0.4 0.6 0.8 1
Wage
Force Characteristics by Wage
Force Size
Average Aptitude
Proportion Motivated
0
0.2
0.4
0.6
0.8
1
0.159 0.209 0.259 0.309 0.359 0.409 0.459
Output
Wage vs. Desired Level of Output:
No Testing
Wage
Cost
Force Size

Figure 3:
FIGURE CAPTIONS:
Figure 1: Force characteristics by wage, with k = 0.2 and θ = 0.4.
Figure 2: Wage required to achieve a given defense capability at least cost.
Figure 3: Combinations of wage and minimum test score that produce a given defense
capability at least cost.
APPENDIX:
To derive (1)-(3), it is helpful first to construct expressions for the number of
motivated and unmotivated recruits who will choose to join the military, denoted as N and
0N , respectively. The number of motivated individuals in the pool of potential recruits is ,
and each of these individuals will join if and only if z w k , that is, his or her reservation
0
0.2
0.4
0.6
0.8
1
0.159 0.209 0.259 0.309 0.359 0.409 0.459
Level of Output Needed
Optimal Wage and Test Cutoff for
Desired Levels of Output
Optimal wage
Optimal test cutoff
Cost
Force Size

wage does not exceed the total benefit (s)he would receive from joining. Since z ~ U[0,1],
there are w k such individuals if 1w k , and such individuals if 1w k . Thus:
, 1
, 1
w k w kN
w k
. (A-1)
The number of unmotivated individuals in the pool of potential recruits is 1 , and each of
these individuals will join if and only if z w , that is, his or her reservation wage does not
exceed the wage (s)he would receive from joining. Again, z ~ U[0,1]. Thus, there are
1 w such individuals:
0 1N w . (A-2)
Given (A-1) and (A-2), we can derive expressions for N , r , and z , as shown by (1), (2), and
(3), respectively.
Derivation of (1):
N is simply the sum of N and 0N , as given by (A-1) and (A-2). In the case where
1w k , N w k and 0 1N w . Thus,
1N w k w
w k w w
w k
, (A-3)
which is the first expression in (1).
In the case where 1w k , N and 0 1N w . Thus,

1
1
N w
w w
w
, (A-4)
which gives us the second expression in (1).
Derivation of (2):
Given (1), we can compute r easily, recognizing that it is equal to N
N
. In the case where
1w k , N w k and N w k . Thus,
w k w kr
w k w k
, (A-5)
which is the first expression in (2).
In the case where 1w k , N and 1N w . Thus,
1r
w
, (A-6)
which is the second expression in (2).
Derivation of (3):
We can compute z as a weighted average of the average reservation wages of the motivated
and unmotivated recruits who choose to join, where the weights are r and 1 r , respectively.
Since z is distributed uniformally, the average reservation wage of the unmotivated recruits

who choose to join is w/2. The average reservation wage of the motivated recruits who
choose to join is (w+k)/2 if 1w k , and 1/2 otherwise.
Thus, in the case where 1w k :
12 2
w k wz r r
1
2 2
ww k w k w
w k w k
21
2
w k w k w
w k
(A-7)
2 2 2 22
2
w kw k w w
w k
2 22
2
kw w k
w k
,
which establishes the first expression in (3).
In the case where 1w k , we have:
1
12 2
wz r r
11
1 2 1 2
w w
w w
2 2
2 1
w w
w
(A-8)
21
2 1
w
w
,
which establishes the second expression in (3).