attention-deficit/hyperactivity disorder polygenic risk ... · attention-deficit/hyperactivity...
TRANSCRIPT
NEW RESEARCH
JOURNAL
VOLUM
Attention-Deficit/Hyperactivity DisorderPolygenic Risk Scores Predict AttentionProblems in a Population-Based Sample
of ChildrenMaria M. Groen-Blokhuis, MD, PhD, Christel M. Middeldorp, MD, PhD, Kees-Jan Kan, PhD,
Abdel Abdellaoui, MSc, Catharina E.M. van Beijsterveldt, PhD, Erik A. Ehli, PhD,Gareth E. Davies, PhD, Paul A. Scheet, PhD, Xiangjun Xiao, MSc, James J. Hudziak, MD,Jouke-Jan Hottenga, PhD, Psychiatric Genomics Consortium ADHD Working Group,
Ben M. Neale, PhD, Dorret I. Boomsma, PhD
Objective: Clinically, attention-deficit/hyperactivity disorder (ADHD) is characterized byhyperactivity, impulsivity, and inattention and is among the most common childhood disor-ders. These same traits that define ADHD are variable in the general population, and theclinical diagnosis may represent the extreme end of a continuous distribution of inattentive andhyperactive behaviors. This hypothesis can be tested by assessing the predictive value ofpolygenic risk scores derived from a discovery sample of ADHD patients in a target samplefrom the general population with continuous scores of inattention and hyperactivity. In addi-tion, the genetic overlap between ADHD and continuous ADHD scores can be tested acrossrater and age. Method: The Psychiatric Genomics Consortium has performed the largestgenome-wide analysis (GWA) study of ADHD so far, including 5,621 clinical patientsand 13,589 controls. The effects sizes of single nucleotide polymorphisms (SNPs) estimatedin this meta-analysis were used to obtain individual polygenic risk scores in an indepen-dent population-based cohort of 2,437 children from the Netherlands Twin Register. Thevariance explained in Attention Problems (AP) scale scores by the polygenic risk scoreswas estimated by linear mixed modeling. Results: The ADHD polygenic risk scores signifi-cantly predicted both parent and teacher ratings of AP in preschool- and school-agedchildren. Conclusion: These results indicate genetic overlap between a diagnosis of ADHDand AP scale scores across raters and age groups and provides evidence for a dimensionalmodel of ADHD. Future GWA studies on ADHD can likely benefit from the inclusion ofpopulation-based cohorts and the analysis of continuous scores. J. Am. Acad. Child Adolesc.Psychiatry, 2014;53(10):1123–1129. Key Words: ADHD, attention problems, polygenic scores,genetics, dimensional models
ttention-deficit/hyperactivity disorder(ADHD) is a condition characterized by
A age-inappropriate hyperactivity/impul-sivity and inattention, resulting in significantimpairment in about 5% of children.1,2 In thediagnostic manuals used in clinical practice,for example, the International Classification ofDiseases, 10th Revision (ICD-10), DSM-IV, and theDSM-5,1,3,4 a clinical diagnosis of ADHD is a
Supplemental material cited in this article is available online.
OF THE AMERICAN ACADEMY OF CHILD & ADOLESCENT PSYCHIATR
E 53 NUMBER 10 OCTOBER 2014
binary trait that can be useful for guidingtreatment and care. At the population level,ADHD may represent the extreme end of acontinuous distribution of inattentive and hy-peractive behaviors.5-7 Classical twin studiessupport the validity of the dimensional model,8
but at this point in time, an additional ap-proach to test for a dimensional model ofADHD is to assess whether genetic risk factorsfor an ADHD diagnosis influence behavioracross the entire spectrum of inattentive andhyperactive behavior. Such an approach alsomay clarify apparent differences in the ADHD
Y
www.jaacap.org 1123
GROEN-BLOKHUIS et al.
assessment across raters and age groups. Cor-relations between parent and teacher ratings aregenerally only moderate, as are correlationswithin maternal ratings across preschool andschool age.8-10 Previous studies indicate that theextent to which assessment from different ratersand across different ages overlap is due tooverlap of genetic effects across both raters andtime,8-12 but these results are based on, forexample, latent variable modeling approachesrather than on measured genetic variants.ADHD diagnoses and continuous measures ofADHD behaviors are highly heritable in child-hood, with about 60% to 80% of the variancedue to genetic factors.13-17 Despite this highheritability, current genome-wide association(GWA) studies have thus far been unsuccessfulin detecting genetic risk variants for ADHD atgenome-wide significant levels, suggesting ahigh degree of polygenic inheritance.18 A studyby the Psychiatric Genomics Consortium (PGC)showed that 28% of the liability to ADHD isexplained by single nucleotide polymorphisms(SNPs) present on platforms that are commonlyused for genome-wide genotyping.19 These ob-servations imply that many common variants ofsmall effect stay undetected in current GWAstudies due to limited sample size but verylikely contribute to the genetic liability ofADHD. The effect sizes obtained in ADHDGWA studies can be used to estimate the geneticrisk of the individual; so-called polygenic riskscores are obtained by multiplying the measurednumber of risk alleles at a particular locus by theeffect size observed in a GWA study summingover all SNPs that surpass a certain threshold ofsignificance.20,21 With regard to ADHD, poly-genic risk scores based on the results of the PGCADHD meta-analysis published in 2010 signifi-cantly predicted ADHD status in an indepen-dent sample of 452 clinical patients with ADHDand 5,081 controls, with higher polygenic riskscores in patients with ADHD and comorbidaggression.18,22 Polygenic risk scores can also beused to assess the genetic overlap across traits.For example, polygenic risk scores based on aGWA study on schizophrenia predict quantita-tive measures of psychosis.23 Similarly, poly-genic risk scores based on a GWA study inpatients with major depressive disorder (MDD)are predictive of continuous scores of anxietyand depression in a general population sam-ple.24 In the current study, we obtained poly-genic risk scores to assess the genetic overlap
JOURN
1124 www.jaacap.org
between clinically assessed ADHD and attentionproblems (AP) in a general population sample ofchildren who were rated by their parent atpreschool age and by their parents and teachersat school age.
METHODGenotype and phenotype data were available in asample of 2,437 children of Dutch descent who areregistered with the Netherlands Twin Register(NTR).25,26 In the Young NTR (YNTR), surveys as-sessing the health and behavior of newborn twins aresent out to their parents at registration and at age 2, 3,5, 7, 10, and 12 years. At age 7, 10, and 12 years, parentsare asked for their consent to invite the teachers of thetwins to provide ratings of the children’s behavior.
APAge-appropriate versions of the Achenbach Systemof Empirically Based Assessment (ASEBA) have beenincluded in the YNTR surveys.27,28 At ages 3, 7, 10,and 12 years the Child Behavior Checklist (CBCL)was collected from parents. At ages 7, 10, and 12years, the Teacher Report Form (TRF) was includedin teacher surveys. Respondents were asked to ratethe child’s behavior on w120 items on a 3-point scale(0 ¼ not true; 1 ¼ somewhat or sometimes true; 2 ¼very true or often true). The AP scale describes hy-peractive and inattentive behavior. The AP scalecontains 5 items at preschool age, and at school age,10 items for parents, and 26 items for teachers. Whenmultiple measures were available for the school-age(age 6–13 years) mother or teacher ratings, the mea-sure closest to age 10 was chosen. There were 2,132twins with maternal AP ratings at school age; for1,888 twins (89%), AP was assessed between age 9and 11, for 50 twins at age 12, and for 194 twins, atage 7 or 8 years. Teacher ratings were available atage 9 to 11 for 1,018 twins, at age 7 to 8 for 152 twins,and at age 12 for 442 twins. Maternal and paternalratings were highly correlated (r ¼ 0.71 and 0.73 forpreschool and school age) and gave similar results;therefore, we report only on the larger set ofmaternal ratings.
Genotype DataAll participants were genotyped on the Affymetrix6.0 platform, which contains more than 900,000 SNPs.Quality control and imputation were performedon a larger dataset (N ¼ 14,003) that also includedgenotype data from the parents of the twins. SNPdata were cleaned with the following criteria: Hardy–Weinberg equilibrium (HWE) p value >.00001, minorallele frequency (MAF) >0.01, call rate >0.95, concor-dance rate in duplicate samples >0.98, Mendelianerror rate <0.02, and allele frequency differencewith reference set <0.20. C/G and A/T SNPs
AL OF THE AMERICAN ACADEMY OF CHILD & ADOLESCENT PSYCHIATRY
VOLUME 53 NUMBER 10 OCTOBER 2014
ADHD POLYGENIC RISK SCORES IN A POPULATION-BASED SAMPLE
were only included if MAF was <0.35. Sampleswere cleaned on the following criteria: call rate>0.90, heterozygosity �0.10 < F < 0.10, consistencyof X chromosome genotypes with known gender,consistency of expected and observed family relations,and Mendelian error rate <0.02. Ethnic outliers wereexcluded from the association analyses. Next, imputa-tion was done by using known haplotypes from the1000 Genomes Project (http://www.1000genomes.org/). The SNP data were phased in Mach 1.0 andimputed with Minimac using all ethnicity panels of the1000 Genomes Phase I Integrated Release Version 3build 37 (2010-11-23 sequence data freeze, 2012-03-14haplotypes).
Within the Psychiatrics Genomics Consortium, ameta-analysis of 5,621 clinical patients with ADHDand 13,589 controls was conducted (P. Holmans for thePGC: presentation 21st World Congress of PsychiatricGenetics, October 2013, Boston, MA). These data wereimputed using CEUþTSI Hapmap Phase 3 build 36 asthe reference set (http://hapmap.ncbi.nlm.nih.gov/).Polygenic risk scores were calculated in Plink. SNPswere selected on the following criteria: info score>0.30 (a measure of imputation quality) in both thediscovery and the target set, MAF >0.02 in both sets,consistency of reported alleles across sets, and afrequency difference across sets <.15. SNPs with C/Gor A/T alleles were included only if MAF was <0.35.For each individual, the number of observed riskalleles at a particular locus (0,1,2) was multiplied withthe ln(OR) observed in the PGC meta-analysis andsummed over all SNPs. Several sets of polygenic riskscores were created based on different p valuethresholds in the discovery set (thresholds .0001, .001,.01, .05, .1, .2, .3, .4, .5, and 1).
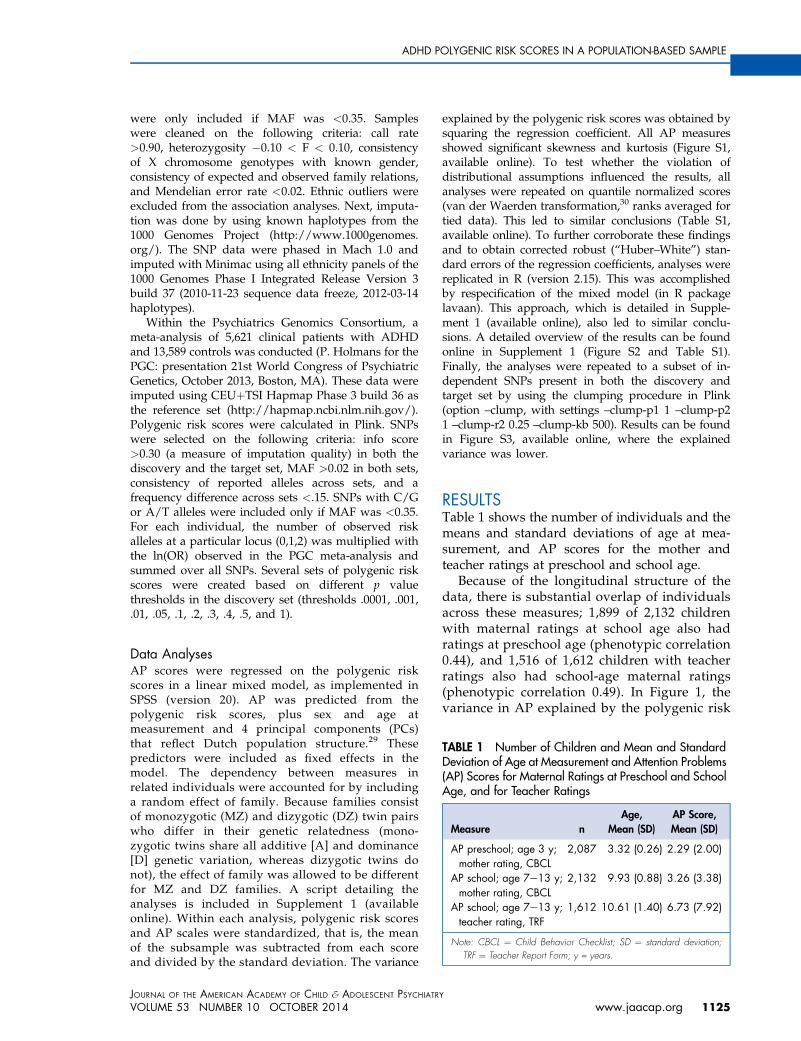
TABLE 1 Number of Children and Mean and StandardDeviation of Age at Measurement and Attention Problems(AP) Scores for Maternal Ratings at Preschool and SchoolAge, and for Teacher Ratings
Measure nAge,
Mean (SD)AP Score,Mean (SD)
AP preschool; age 3 y;mother rating, CBCL
2,087 3.32 (0.26) 2.29 (2.00)
AP school; age 7e13 y;mother rating, CBCL
2,132 9.93 (0.88) 3.26 (3.38)
AP school; age 7e13 y;teacher rating, TRF
1,612 10.61 (1.40) 6.73 (7.92)
Note: CBCL ¼ Child Behavior Checklist; SD ¼ standard deviation;TRF ¼ Teacher Report Form; y = years.
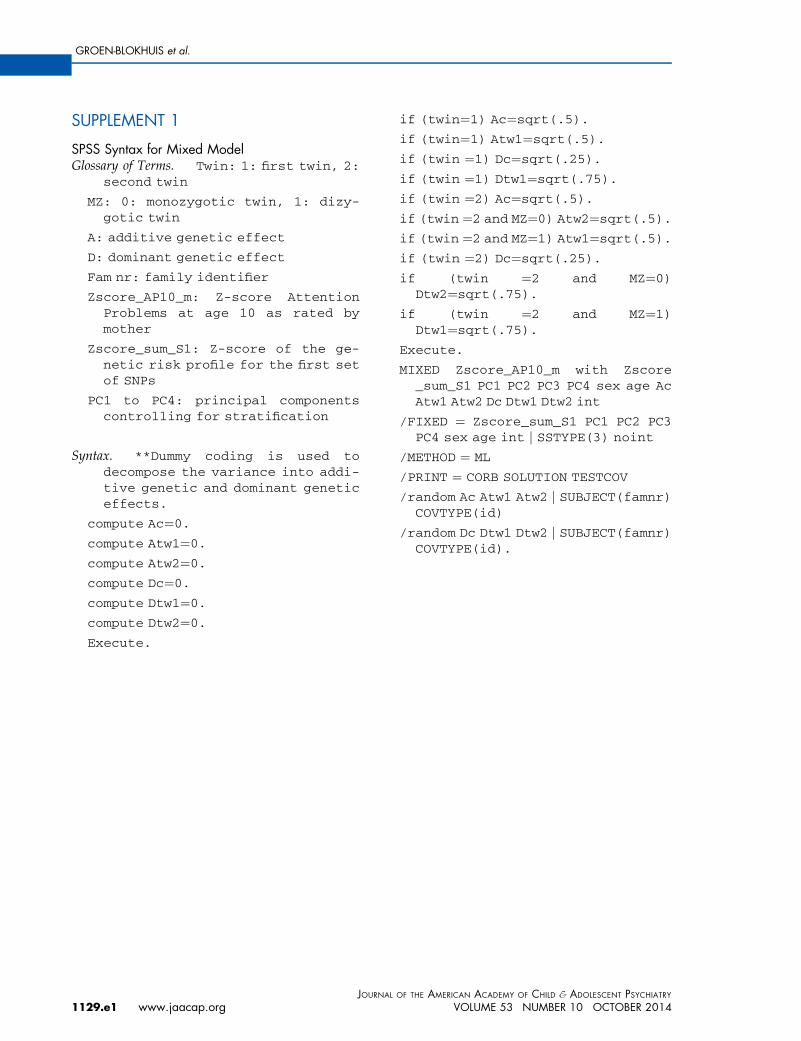
Data AnalysesAP scores were regressed on the polygenic riskscores in a linear mixed model, as implemented inSPSS (version 20). AP was predicted from thepolygenic risk scores, plus sex and age atmeasurement and 4 principal components (PCs)that reflect Dutch population structure.29 Thesepredictors were included as fixed effects in themodel. The dependency between measures inrelated individuals were accounted for by includinga random effect of family. Because families consistof monozygotic (MZ) and dizygotic (DZ) twin pairswho differ in their genetic relatedness (mono-zygotic twins share all additive [A] and dominance[D] genetic variation, whereas dizygotic twins donot), the effect of family was allowed to be differentfor MZ and DZ families. A script detailing theanalyses is included in Supplement 1 (availableonline). Within each analysis, polygenic risk scoresand AP scales were standardized, that is, the meanof the subsample was subtracted from each scoreand divided by the standard deviation. The variance
JOURNAL OF THE AMERICAN ACADEMY OF CHILD & ADOLESCENT PSYCHIATR
VOLUME 53 NUMBER 10 OCTOBER 2014
explained by the polygenic risk scores was obtained bysquaring the regression coefficient. All AP measuresshowed significant skewness and kurtosis (Figure S1,available online). To test whether the violation ofdistributional assumptions influenced the results, allanalyses were repeated on quantile normalized scores(van der Waerden transformation,30 ranks averaged fortied data). This led to similar conclusions (Table S1,available online). To further corroborate these findingsand to obtain corrected robust (“Huber–White”) stan-dard errors of the regression coefficients, analyses werereplicated in R (version 2.15). This was accomplishedby respecification of the mixed model (in R packagelavaan). This approach, which is detailed in Supple-ment 1 (available online), also led to similar conclu-sions. A detailed overview of the results can be foundonline in Supplement 1 (Figure S2 and Table S1).Finally, the analyses were repeated to a subset of in-dependent SNPs present in both the discovery andtarget set by using the clumping procedure in Plink(option –clump, with settings –clump-p1 1 –clump-p21 –clump-r2 0.25 –clump-kb 500). Results can be foundin Figure S3, available online, where the explainedvariance was lower.
RESULTSTable 1 shows the number of individuals and themeans and standard deviations of age at mea-surement, and AP scores for the mother andteacher ratings at preschool and school age.
Because of the longitudinal structure of thedata, there is substantial overlap of individualsacross these measures; 1,899 of 2,132 childrenwith maternal ratings at school age also hadratings at preschool age (phenotypic correlation0.44), and 1,516 of 1,612 children with teacherratings also had school-age maternal ratings(phenotypic correlation 0.49). In Figure 1, thevariance in AP explained by the polygenic risk
Y
www.jaacap.org 1125
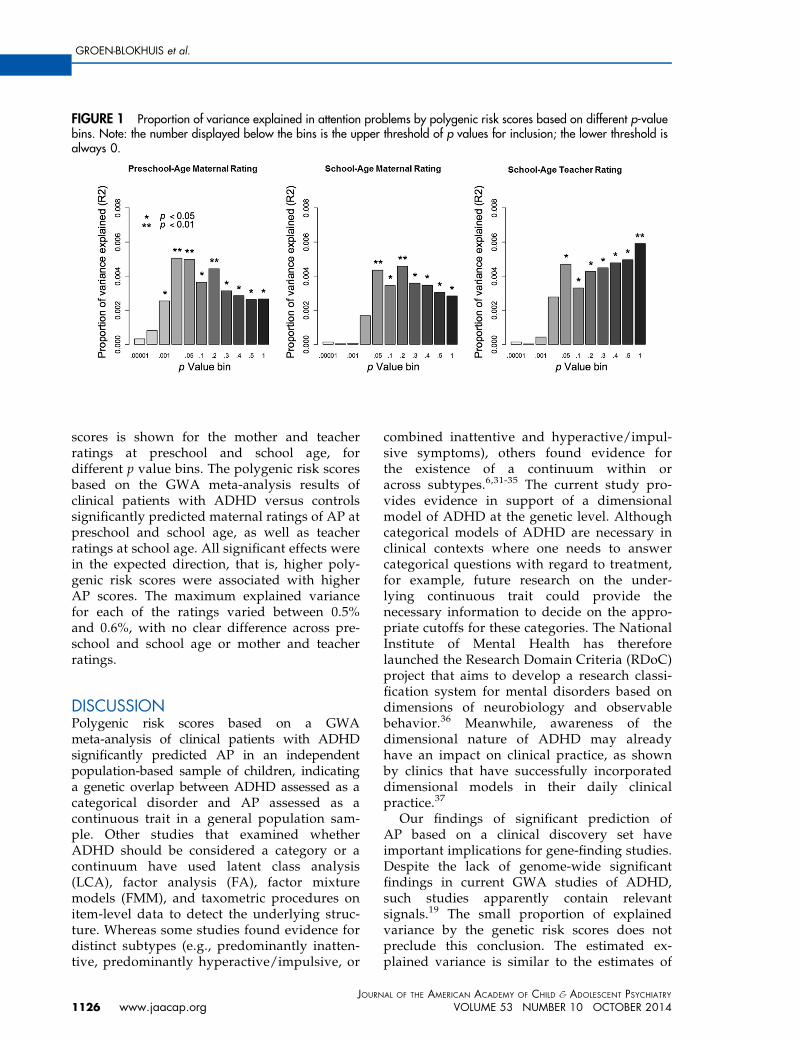
FIGURE 1 Proportion of variance explained in attention problems by polygenic risk scores based on different p-valuebins. Note: the number displayed below the bins is the upper threshold of p values for inclusion; the lower threshold isalways 0.
GROEN-BLOKHUIS et al.
scores is shown for the mother and teacherratings at preschool and school age, fordifferent p value bins. The polygenic risk scoresbased on the GWA meta-analysis results ofclinical patients with ADHD versus controlssignificantly predicted maternal ratings of AP atpreschool and school age, as well as teacherratings at school age. All significant effects werein the expected direction, that is, higher poly-genic risk scores were associated with higherAP scores. The maximum explained variancefor each of the ratings varied between 0.5%and 0.6%, with no clear difference across pre-school and school age or mother and teacherratings.
DISCUSSIONPolygenic risk scores based on a GWAmeta-analysis of clinical patients with ADHDsignificantly predicted AP in an independentpopulation-based sample of children, indicatinga genetic overlap between ADHD assessed as acategorical disorder and AP assessed as acontinuous trait in a general population sam-ple. Other studies that examined whetherADHD should be considered a category or acontinuum have used latent class analysis(LCA), factor analysis (FA), factor mixturemodels (FMM), and taxometric procedures onitem-level data to detect the underlying struc-ture. Whereas some studies found evidence fordistinct subtypes (e.g., predominantly inatten-tive, predominantly hyperactive/impulsive, or
JOURN
1126 www.jaacap.org
combined inattentive and hyperactive/impul-sive symptoms), others found evidence forthe existence of a continuum within oracross subtypes.6,31-35 The current study pro-vides evidence in support of a dimensionalmodel of ADHD at the genetic level. Althoughcategorical models of ADHD are necessary inclinical contexts where one needs to answercategorical questions with regard to treatment,for example, future research on the under-lying continuous trait could provide thenecessary information to decide on the appro-priate cutoffs for these categories. The NationalInstitute of Mental Health has thereforelaunched the Research Domain Criteria (RDoC)project that aims to develop a research classi-fication system for mental disorders based ondimensions of neurobiology and observablebehavior.36 Meanwhile, awareness of thedimensional nature of ADHD may alreadyhave an impact on clinical practice, as shownby clinics that have successfully incorporateddimensional models in their daily clinicalpractice.37
Our findings of significant prediction ofAP based on a clinical discovery set haveimportant implications for gene-finding studies.Despite the lack of genome-wide significantfindings in current GWA studies of ADHD,such studies apparently contain relevantsignals.19 The small proportion of explainedvariance by the genetic risk scores does notpreclude this conclusion. The estimated ex-plained variance is similar to the estimates of
AL OF THE AMERICAN ACADEMY OF CHILD & ADOLESCENT PSYCHIATRY
VOLUME 53 NUMBER 10 OCTOBER 2014
ADHD POLYGENIC RISK SCORES IN A POPULATION-BASED SAMPLE
Hamshere et al.22 that predicted patient-with-ADHD status by ADHD GWA meta-analysisresults, and to other studies using genetic riskscores to investigate the genetic architecture ofother psychiatric phenotypes.38-40 The explainedvariance is mostly dependent on the sample sizeof the discovery set; when this sample size islarge, the effects detected in the GWA containless noise, leading to more accurate predictionsin the target sample. Genetic Complex TraitAnalyses (GCTA), such as those performed forADHD in PGC,19 generally provide higher es-timates of the variance explained by all SNPs.This is due to the difference in approaches, asthe GCTA method does not rely on impreciseeffect estimates but on a regression of pheno-typic similarities on genotypic similiarities.41
However, the different approaches all implythat GWA studies on ADHD can be successful.Moreover, our results for continuous ADHD-related traits indicate that patient–control co-horts may benefit from an increase in power byincluding the available information on symp-tom severity in their analyses,42 although thisgain in power could be limited by the nonuni-formity of measurement error across the distri-bution. In practice, the choice of study designwill likely depend on the costs of genotypingand phenotyping and the availability of alreadyexistent datasets. In this context, it is worth-while to note that many population-based cohort studies have both genome-wideSNP data and continuous measures of ADHDavailable, but are currently underused for gene-finding studies on ADHD and other psychiatricphenotypes. Although patient–control studiesbenefit from the ascertainment of individualsfrom the extreme end of the distribution, thepower to find genetic variants for ADHD isroughly equal in an equal-sized population-based cohort with a continuous measure ofADHD, as in the latest PGC meta-analysis ofADHD, because of the relatively high prevalenceof ADHD and the somewhat small proportionof patients in the latest PGC meta-analysis.43
Other advantages of population-based studiesinclude the richness of available phenotypicinformation allowing for multivariate analysesand the investigation of gene–environmentinteractions.44
Given the small predictive value of thepolygenic risk scores on AP, they cannot beused to predict patient or control status at the
JOURNAL OF THE AMERICAN ACADEMY OF CHILD & ADOLESCENT PSYCHIATR
VOLUME 53 NUMBER 10 OCTOBER 2014
individual level or be used as biomarkers.However, they are still informative on thepopulation level, as polygenic risk score ana-lyses and GCTA do provide information on thegenetic architecture of traits and on the associ-ation between traits.19 The current study notonly showed genetic overlap between clinicaldiagnoses and continuously measured traits,but also indicated that this overlap was presentat both preschool and school age and fordifferent raters. This similarity of genetic effectsacross age is in line with twin studies thatdemonstrate a high genetic stability ofmaternal-rated AP in childhood,10,11 and thefinding that the behavior that parents andteachers rate in common is highly heritabledespite a moderate phenotypic correlation.8,45
Moreover, an ADHD diagnosis requires thebehavior to be present in multiple settings, andit is therefore expected that the genetic factorsthat influence a clinical diagnosis of ADHDcorrelate with both parent and teacher ratingsof ADHD symptoms. The results from theclumping analyses in which a smaller set of SNPslimited to independent SNP sets (Figure S3,available online) also speak to the highly poly-genic nature of ADHD and AP: by leaving outSNPs (based on a statistical criterion), the vari-ance that is explained by polygenic scores de-creases. When correlated SNPs are analyzed, itis not the case that such correlation results ininflation or bias in the amount of varianceexplained. In the regression of the phenotype onthe polygenetic scores, the collinearity due tocorrelations among predictors does not actuallyaffect the estimates; that is, in least-squaresregression, these remain best, linear, unbiasedestimates (BLUE). If regression estimates are un-biased, then the estimate of the explained vari-ance is also unbiased.46
Thus, ADHD/AP can be predicted fromADHD polygenic risk scores at the populationlevel, and it is clear that the PGC ADHD meta-analysis picks up genetic variation relevant toADHD. Next, these GWA results can be used toinvestigate the genetic overlap between ADHDand other disorders and gene–environmentinterplay. Our study supports the use ofdimensional models of ADHD and indicatesthat future GWA studies can benefit from theinclusion of both population-based and patient–control studies, and by analyzing ADHD as aquantitative rather than a categorical trait. &
Y
www.jaacap.org 1127
11
GROEN-BLOKHUIS et al.
Accepted August 12, 2014.
This article was reviewed under and accepted by ad hoc editor JamesF. Leckman, MD.
Drs. Groen-Blokhuis, Middeldorp, Kan, van Beijsterveldt, Hottenga,and Mr. Abdellaoui are with VU University Amsterdam, theNetherlands. Drs. Groen-Blokhuis and Boomsma are with the EMGO+Institute for Health and Care Research, VU University Medical Center,Amsterdam. Drs. Middeldorp and Boomsma and Mr. Abdellaoui arealso with the Neuroscience Campus Amsterdam, VU UniversityAmsterdam, and Dr. Middeldorp is also with GGZinGeest/ VU Uni-versity Medical Center. Drs. Ehli and Davies are with the Avera Institutefor Human Genetics, Sioux Falls, SD. Dr. Scheet is with the University ofTexas M. D. Anderson Cancer Center, Houston. Mr. Xiao is withDartmouth Medical School, Hanover, NH. Dr. Hudziak is with theVermont Center for Children, Youth, and Families and University ofVermont College of Medicine, Burlington, VT. Dr. Neale is withMassachusetts General Hospital and Harvard Medical School, Bos-ton, and the Stanley Center for Psychiatric Research, Broad Institute ofMIT and Harvard, Cambridge, MA.
This project was supported by ARRA RC2 2MH08995; the EuropeanResearch Council (Genetics of Mental Illness, ERC-230374); Spino-zapremie (NWO/SPI 56-464-14192); Neuroscience CampusAmsterdam (NCA) and the EMGOþ Institution; twin-family databasefor behavior genetics and genomics studies (NWO 480-04-004);Genetic influences on stability and change in psychopathology fromchildhood to young adulthood (ZonMW 912-10-020).
The Psychiatric GWAS Consortium ADHD Subgroup consists of:Richard J.L. Anney, PhD, Alejandro Arias Vasquez, PhD, Philip Asher-son, MD, Tobias Banaschewski, MD, PhD, M�onica Bay�es, PhD, Jo-seph Biederman, MD, Jan K. Buitelaar, MD, PhD, Miguel Casas, MD,PhD, Alice Charach, MD, MSc, Bru Cormand, PhD, Jennifer Crosbie,PhD, Mark J. Daly, PhD, Alysa E. Doyle, PhD, Richard P. Ebstein, PhD,Josephine Elia, MD, Stephen V. Faraone, PhD, Barbara Franke, PhD,Christine Freitag, MD, MA, Michael Gill, Mb BCh BAO, MD,
JOURNAL
28 www.jaacap.org
MRCPsych, FTCD, Hakon Hakonarson, MD, PhD, Peter Holmans,PhD, Lindsey Kent, MD, Jonna Kuntsi, PhD, Nanda Lambregts-Rommelse, PhD, Kate Langley, PhD, Klaus-Peter Lesch, MD, SandraK. Loo, PhD, James J. McGough, MD, Sarah E. Medland, PhD, JobstMeyer, PhD, Eric Mick, ScD, Ana Miranda, MD, Fernando Mulas,MD, PhD, Benjamin M. Neale, PhD, Stan F. Nelson, MD, Michael C.O’Donovan, FRCPsych, PhD, Robert D. Oades, PhD, Michael J.Owen, PhD, Haukur Palmason, PhD, Qiujin Qian, MD, Josep AntoniRamos-Quiroga, MD, PhD, Andreas Reif, MD, Tobias J. Renner, MD,Marta Ribas�es, PhD, Stephan Ripke, MD, Herbert Roeyers, MD, PhD,Marcel Romanos, MD, Jasmin Romanos, MD, Aribert Rothenberger,MD, Cristina S�anchez-Mora, PhD, Russell Schachar, MD, JosephSergeant, PhD, Susan L. Smalley, PhD, Edmund J. S. Sonuga-Barke,PhD, Hans-Christoph Steinhausen, MD, PhD, DMSc, Anita Thapar,MBBCh, FRCPsych, PhD, FMedSci, Alexandre Todorov, PhD, SusanneWalitza, MD, Yufeng Wang, MD, PhD, Andreas Warnke, MD, PhD,Nigel Williams, PhD, Li Yang, MD.
Disclosure: Dr. Hudziak has received grant or research funding fromthe National Institutes of Health and the National Institute of Diabetesand Digestive and Kidney Disease. His primary appointment is with theUniversity of Vermont. He has additional appointments with ErasmusUniversity in Rotterdam, Netherlands, Washington University School ofMedicine in St. Louis, Dartmouth School of Medicine in Hanover, NewHampshire, and Avera Institute of Human Behavioral Genetics in SiouxFalls, South Dakota. Drs. Groen-Blokhuis, Middeldorp, Kan, van Beij-sterveldt, Ehli, Davies, Scheet, Hottenga, Neale, and Boomsma, andMr. Abdellaoui and Mr. Xiao report no biomedical financial interests orpotential conflicts of interest.
Correspondence to Dorret I. Boomsma, PhD, VU, FPP, Van der Boe-chorststraat 1, Amsterdam, 1081 BT, Netherlands; e-mail: [email protected]
0890-8567/$36.00/ª2014 American Academy of Child andAdolescent Psychiatry
http://dx.doi.org/10.1016/j.jaac.2014.06.014
REFERENCES
1. American Psychiatric Association. Diagnostic and StatisticalManual of Mental Disorders. 5 ed. Arlington, VA: AmericanPsychiatric Publishing; 2013.
2. Polanczyk G, de Lima MS, Horta BL, Biederman J, Rohde LA. Theworldwide prevalence of ADHD: a systematic review and meta-regression analysis. Am J Psychiatry. 2007;164:942-948.
3. World Health Organisation. ICD-10 Classifications of Mental andBehavioural Disorder: Clinical Descriptions and DiagnosticGuidelines. Geneva: World Health Organisation; 1992.
4. American Psychiatric Association. Diagnostic and StatisticalManual of Mental Disorders. 4th ed, text rev ed. Washington,DC;2000.
5. Hudziak JJ, Achenbach TM, Althoff RR, Pine DS. A dimensionalapproach to developmental psychopathology. Int J Methods Psy-chiatr Res. 2007;16(Suppl 1):S16-S23.
6. Lubke GH, Hudziak JJ, Derks EM, van Bijsterveldt TC,Boomsma DI. Maternal ratings of attention problems in ADHD:evidence for the existence of a continuum. J Am Acad ChildAdolesc Psychiatry. 2009;48:1085-1093.
7. Pickles A, Angold A. Natural categories or fundamental di-mensions: on carving nature at the joints and the rearticulation ofpsychopathology. Dev Psychopathol. 2003;15:529-551.
8. Derks EM, Hudziak JJ, Beijsterveldt CE, Dolan CV, Boomsma DI.Genetic analyses of maternal and teacher ratings on attentionproblems in 7-year-old Dutch twins. Behav Genet. 2006;36:833-844.
9. Kuntsi J, Rijsdijk F, Ronald A, Asherson P, Plomin R. Genetic in-fluences on the stability of attention-deficit/hyperactivity disordersymptoms from early to middle childhood. Biol Psychiatry. 2005;57:647-654.
10. Rietveld MJ, Hudziak JJ, Bartels M, van Beijsterveldt CE,Boomsma DI. Heritability of attention problems in children: lon-gitudinal results from a study of twins, age 3 to 12. J Child PsycholPsychiatry. 2004;45:577-588.
11. Kan K-J, Dolan CV, Nivard MG, et al. Genetic and environmentalstability in attention problems across the lifespan: evidence from
the Netherlands Twin Register. J Am Acad Child Adolesc Psy-chiatry. 2013;52:12-25.
12. Larsson H, Anckarsater H, Rastam M, Chang Z, Lichtenstein P.Childhood attention-deficit hyperactivity disorder as an extremeof a continuous trait: a quantitative genetic study of 8,500 twinpairs. J Child Psychol Psychiatry. 2012;53:73-80.
13. Eaves LJ, Silberg JL, Meyer JM, et al. Genetics and developmentalpsychopathology: 2. The main effects of genes and environmenton behavioral problems in the Virginia Twin Study of AdolescentBehavioral Development. J Child Psychol Psychiatry. 1997;38:965-980.
14. Gjone H, Stevenson J, Sundet JM. Genetic influence on parent-reported attention-related problems in a Norwegian generalpopulation twin sample. J Am Acad Child Adolesc Psychiatry.1996;35:588-596.
15. Hudziak JJ, Rudiger LP, Neale MC, Heath AC, Todd RD. A twinstudy of inattentive, aggressive, and anxious/depressed behav-iors. J Am Acad Child Adolesc Psychiatry. 2000;39:469-476.
16. Rietveld MJ, Hudziak JJ, Bartels M, van Beijsterveldt CE,Boomsma DI. Heritability of attention problems in children: I.Cross-sectional results from a study of twins, age 3-12 years. Am JMed Genet B Neuropsychiatr Genet. 2003;117B:102-113.
17. Sherman DK, McGue MK, Iacono WG. Twin concordance forattention deficit hyperactivity disorder: a comparison of teachers’and mothers’ reports. Am J Psychiatry. 1997;154:532-535.
18. Neale BM, Medland SE, Ripke S, et al. Meta-analysis of genome-wide association studies of attention-deficit/hyperactivity disor-der. J Am Acad Child Adolesc Psychiatry. 2010;49:884-897.
19. Cross-Disorder Group of the Psychiatric Genomics Consortium,Lee SH, Ripke S, et al. Genetic relationship between five psychi-atric disorders estimated from genome-wide SNPs. Nat Genet.2013;45:984-994.
20. Purcell SM, Wray NR, Stone JL, et al. Common polygenic variationcontributes to risk of schizophrenia and bipolar disorder. Nature.2009;460:748-752.
OF THE AMERICAN ACADEMY OF CHILD & ADOLESCENT PSYCHIATRY
VOLUME 53 NUMBER 10 OCTOBER 2014
ADHD POLYGENIC RISK SCORES IN A POPULATION-BASED SAMPLE
21. Wray NR, Yang J, Hayes BJ, Price AL, Goddard ME, Visscher PM.Pitfalls of predicting complex traits from SNPs. Nat Rev Genet.2013;14:507-515.
22. Hamshere ML, Langley K, Martin J, et al. High loading of poly-genic risk for ADHD in children with comorbid aggression. Am JPsychiatry. 2013;170:909-916.
23. Derks EM, Vorstman JA, Ripke S, Kahn RS, Ophoff RA. Investi-gation of the genetic association between quantitative measures ofpsychosis and schizophrenia: a polygenic risk score analysis. PLoSOne. 2012;7:e37852.
24. Demirkan A, Penninx BW, Hek K, et al. Genetic risk profiles fordepression and anxiety in adult and elderly cohorts. Mol Psychi-atry. 2011;16:773-783.
25. van Beijsterveldt CE, Groen-Blokhuis M, Hottenga JJ, et al. TheYoung Netherlands Twin Register (YNTR): longitudinal twin andfamily studies in over 70,000 children. Twin Res Hum Genet. 2013;16:252-267.
26. Willemsen G, Vink JM, Abdellaoui A, et al. The AdultNetherlands Twin Register: twenty-five years of survey andbiological data collection. Twin Res Hum Genet. 2013;16:271-281.
27. Achenbach TM, Rescorla LA. Manual for the ASEBA Preschoolforms and Profiles. Burlington, VT: University of Vermont,Research Center for Children, Youth, and Families; 2000.
28. Achenbach TM, Rescorla LA. Manual for the ASEBA School-AgeForms and Profiles. Burlington, VT: University of Vermont,Research Center for Children, Youth, and Families; 2001.
29. Abdellaoui A, Hottenga JJ, de Knijff P, et al. Population structure,migration, and diversifying selection in the Netherlands. Eur JHum Genet. 2013;21:1277-1285.
30. Lehmann EL. Nonparametrics: Statistical Methods Based onRanks. San Francisco: Holden-Day; 1975.
31. Frazier TW, Youngstrom EA, Naugle RI. The latent structure ofattention-deficit/hyperactivity disorder in a clinic-referred sam-ple. Neuropsychology. 2007;21:45-64.
32. Hudziak JJ, Heath AC, Madden PF, et al. Latent class and factoranalysis of DSM-IV ADHD: a twin study of female adolescents.J Am Acad Child Adolesc Psychiatry. 1998;37:848-857.
33. Lubke GH, Muthen B, Moilanen IK, et al. Subtypes versus severitydifferences in attention-deficit/hyperactivity disorder in the
JOURNAL OF THE AMERICAN ACADEMY OF CHILD & ADOLESCENT PSYCHIATR
VOLUME 53 NUMBER 10 OCTOBER 2014
Northern Finnish Birth Cohort. J Am Acad Child Adolesc Psy-chiatry. 2007;46:1584-1593.
34. Neuman RJ, Todd RD, Heath AC, et al. Evaluation of ADHD ty-pology in three contrasting samples: a latent class approach. J AmAcad Child Adolesc Psychiatry. 1999;38:25-33.
35. Todd RD, Rasmussen ER, Neuman RJ, et al. Familiality and heri-tability of subtypes of attention deficit hyperactivity disorder in apopulation sample of adolescent female twins. Am J Psychiatry.2001;158:1891-1898.
36. Cuthbert BN, Insel TR. Toward the future of psychiatric diagnosis:the seven pillars of RDoC. BMC Med. 2013;11:126.
37. Rettew D. Child Temperament: New Thinking about the Bound-ary between Traits and Illness. New York: W.W. Norton andCompany; 2013.
38. de Zeeuw EL, van Beijsterveldt CE, Glasner TJ, et al. Polygenicscores associated with educational attainment in adults predicteducational achievement and ADHD symptoms in children. Am JMed Genet B Neuropsychiatr Genet. 2014;165:510-520.
39. Levinson DF, Shi J, Wang K, et al. Genome-wide association studyof multiplex schizophrenia pedigrees. Am J Psychiatry. 2012;169:963-973.
40. Anney R, Klei L, Pinto D, et al. Individual common variants exertweak effects on the risk for autism spectrum disorderspi. HumMol Genet. 2012;21:4781-4792.
41. Visscher PM, Yang J, Goddard ME. A commentary on ’commonSNPs explain a large proportion of the heritability for humanheight’ by Yang et al. Twin Res Hum Genet. 2010;13:517-524.
42. Lee SH, Wray NR. Novel genetic analysis for case-control genome-wide association studies: quantification of power and genomicprediction accuracy. PLoS One. 2013;8:e71494.
43. Yang J, Wray NR, Visscher PM. Comparing apples and oranges:equating the power of case-control and quantitative trait associa-tion studies. Genet Epidemiol. 2010;34:254-257.
44. Plomin R, Haworth CM, Davis OS. Common disorders arequantitative traits. Nat Rev Genet. 2009;10:872-878.
45. Thapar A, Harrington R, Ross K, McGuffin P. Does the definitionof ADHD affect heritability? J Am Acad Child Adolesc Psychiatry.2000;39:1528-1536.
46. Kennedy P. A Guide to Econometrics (6th ed). Hoboken, NJ:Wiley-Blackwell; 2008.
Y
www.jaacap.org 1129
GROEN-BLOKHUIS et al.
SUPPLEMENT 1
SPSS Syntax for Mixed ModelGlossary of Terms. Twin: 1: first twin, 2:
second twin
MZ: 0: monozygotic twin, 1: dizy-gotic twin
A: additive genetic effect
D: dominant genetic effect
Fam nr: family identifier
Zscore_AP10_m: Z-score AttentionProblems at age 10 as rated bymother
Zscore_sum_S1: Z-score of the ge-netic risk profile for the first setof SNPs
PC1 to PC4: principal componentscontrolling for stratification
Syntax. **Dummy coding is used todecompose the variance into addi-tive genetic and dominant geneticeffects.
compute Ac¼0.
compute Atw1¼0.
compute Atw2¼0.
compute Dc¼0.
compute Dtw1¼0.
compute Dtw2¼0.
Execute.
JOURNAL
1129.e1 www.jaacap.org
if (twin¼1) Ac¼sqrt(.5).
if (twin¼1) Atw1¼sqrt(.5).
if (twin ¼1) Dc¼sqrt(.25).
if (twin ¼1) Dtw1¼sqrt(.75).
if (twin ¼2) Ac¼sqrt(.5).
if (twin ¼2 and MZ¼0) Atw2¼sqrt(.5).
if (twin ¼2 and MZ¼1) Atw1¼sqrt(.5).
if (twin ¼2) Dc¼sqrt(.25).
if (twin ¼2 and MZ¼0)Dtw2¼sqrt(.75).
if (twin ¼2 and MZ¼1)Dtw1¼sqrt(.75).
Execute.
MIXED Zscore_AP10_m with Zscore_sum_S1 PC1 PC2 PC3 PC4 sex age AcAtw1 Atw2 Dc Dtw1 Dtw2 int
/FIXED ¼ Zscore_sum_S1 PC1 PC2 PC3PC4 sex age int j SSTYPE(3) noint
/METHOD ¼ ML
/PRINT ¼ CORB SOLUTION TESTCOV
/random Ac Atw1 Atw2 j SUBJECT(famnr)COVTYPE(id)
/random Dc Dtw1 Dtw2 j SUBJECT(famnr)COVTYPE(id).
OF THE AMERICAN ACADEMY OF CHILD & ADOLESCENT PSYCHIATRY
VOLUME 53 NUMBER 10 OCTOBER 2014
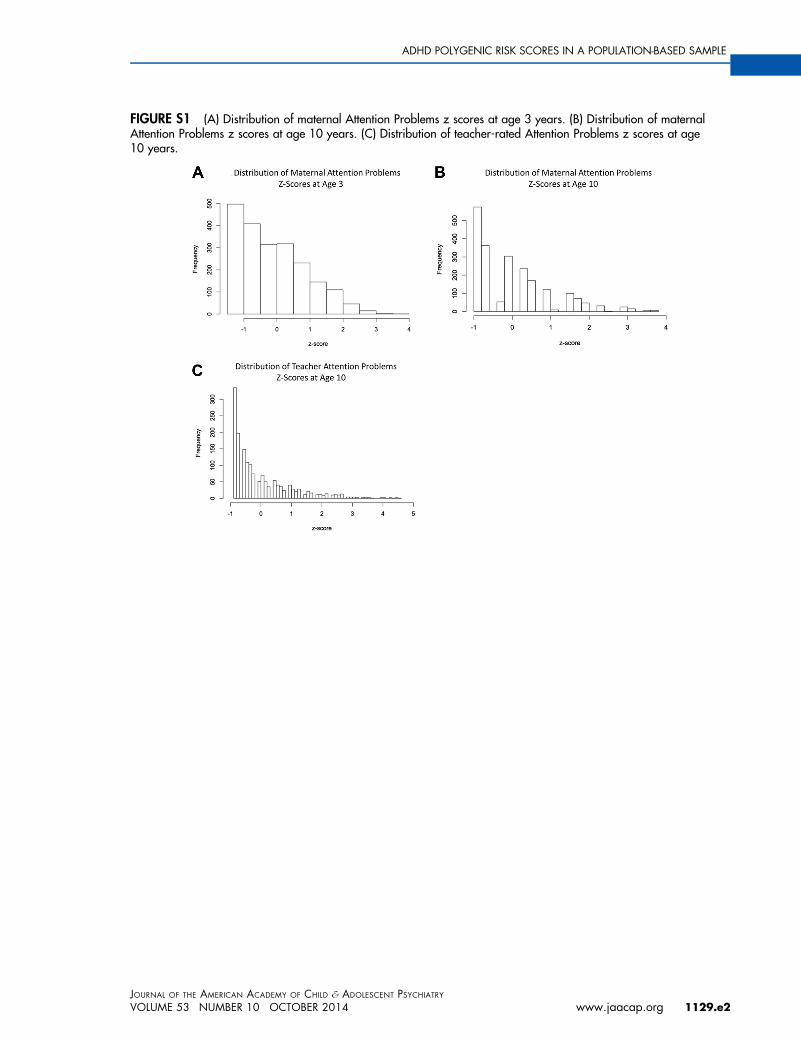
FIGURE S1 (A) Distribution of maternal Attention Problems z scores at age 3 years. (B) Distribution of maternalAttention Problems z scores at age 10 years. (C) Distribution of teacher-rated Attention Problems z scores at age10 years.
JOURNAL OF THE AMERICAN ACADEMY OF CHILD & ADOLESCENT PSYCHIATRY
VOLUME 53 NUMBER 10 OCTOBER 2014 www.jaacap.org 1129.e2
ADHD POLYGENIC RISK SCORES IN A POPULATION-BASED SAMPLE
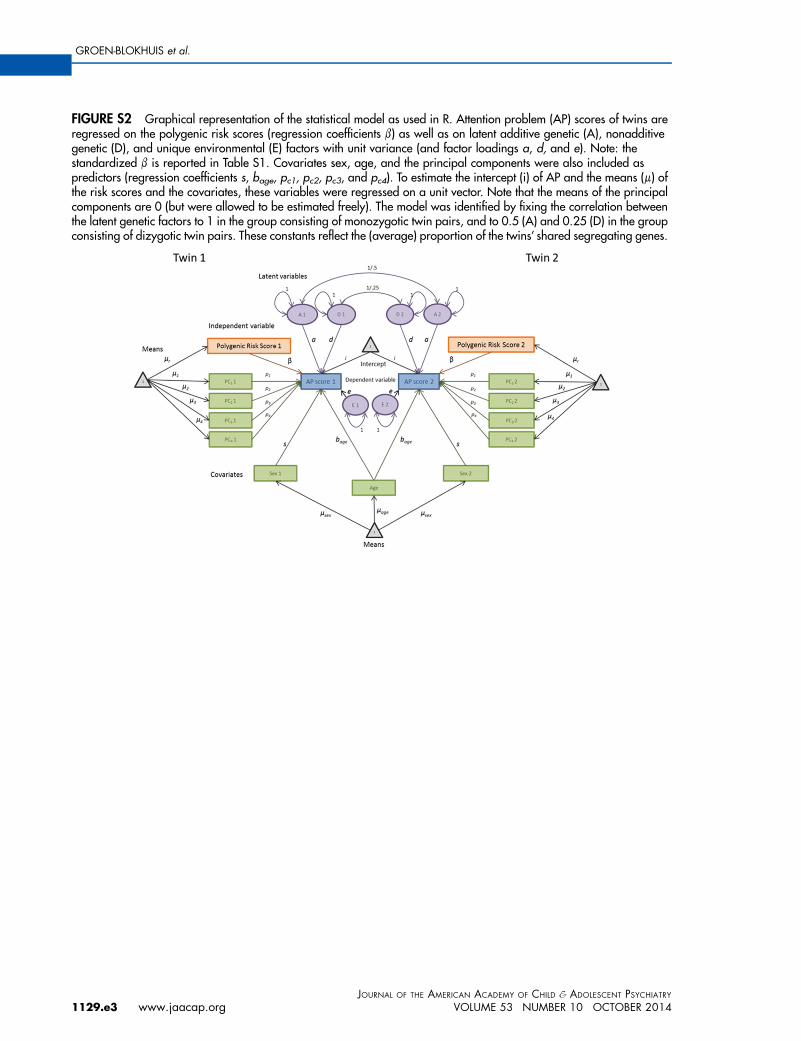
FIGURE S2 Graphical representation of the statistical model as used in R. Attention problem (AP) scores of twins areregressed on the polygenic risk scores (regression coefficients b) as well as on latent additive genetic (A), nonadditivegenetic (D), and unique environmental (E) factors with unit variance (and factor loadings a, d, and e). Note: thestandardized b is reported in Table S1. Covariates sex, age, and the principal components were also included aspredictors (regression coefficients s, bage, pc1, pc2, pc3, and pc4). To estimate the intercept (i) of AP and the means (m) ofthe risk scores and the covariates, these variables were regressed on a unit vector. Note that the means of the principalcomponents are 0 (but were allowed to be estimated freely). The model was identified by fixing the correlation betweenthe latent genetic factors to 1 in the group consisting of monozygotic twin pairs, and to 0.5 (A) and 0.25 (D) in the groupconsisting of dizygotic twin pairs. These constants reflect the (average) proportion of the twins’ shared segregating genes.
JOURNAL OF THE AMERICAN ACADEMY OF CHILD & ADOLESCENT PSYCHIATRY
1129.e3 www.jaacap.org VOLUME 53 NUMBER 10 OCTOBER 2014
GROEN-BLOKHUIS et al.
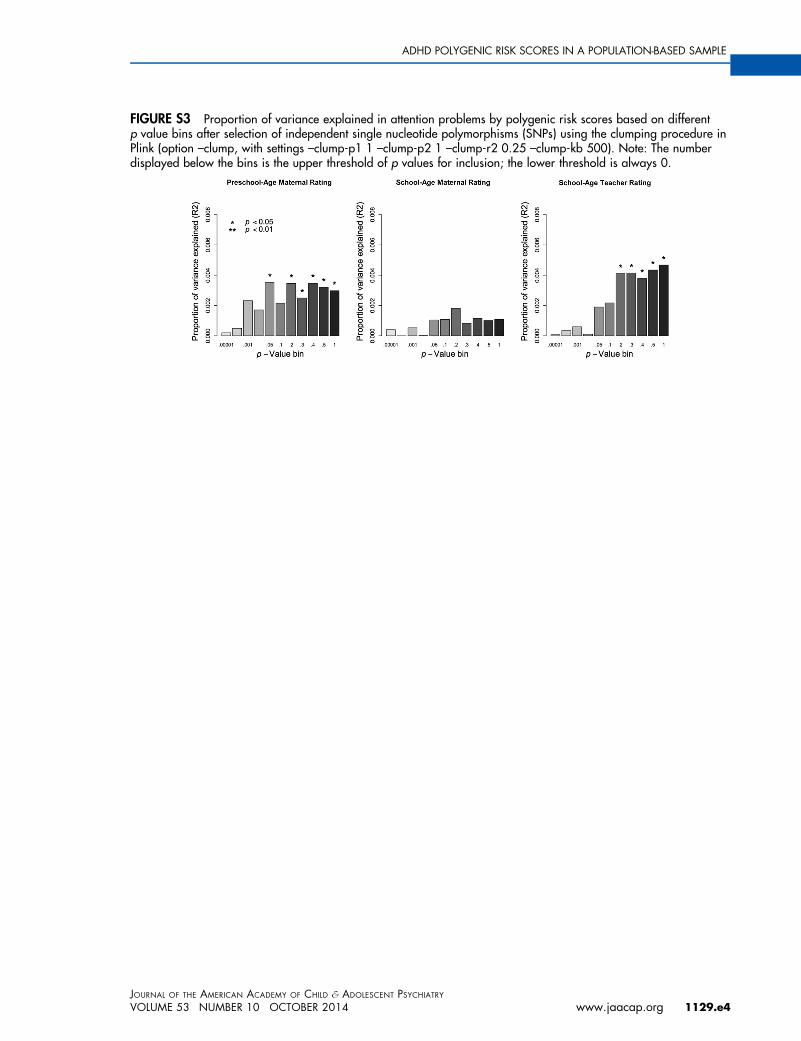
FIGURE S3 Proportion of variance explained in attention problems by polygenic risk scores based on differentp value bins after selection of independent single nucleotide polymorphisms (SNPs) using the clumping procedure inPlink (option –clump, with settings –clump-p1 1 –clump-p2 1 –clump-r2 0.25 –clump-kb 500). Note: The numberdisplayed below the bins is the upper threshold of p values for inclusion; the lower threshold is always 0.
JOURNAL OF THE AMERICAN ACADEMY OF CHILD & ADOLESCENT PSYCHIATRY
VOLUME 53 NUMBER 10 OCTOBER 2014 www.jaacap.org 1129.e4
ADHD POLYGENIC RISK SCORES IN A POPULATION-BASED SAMPLE
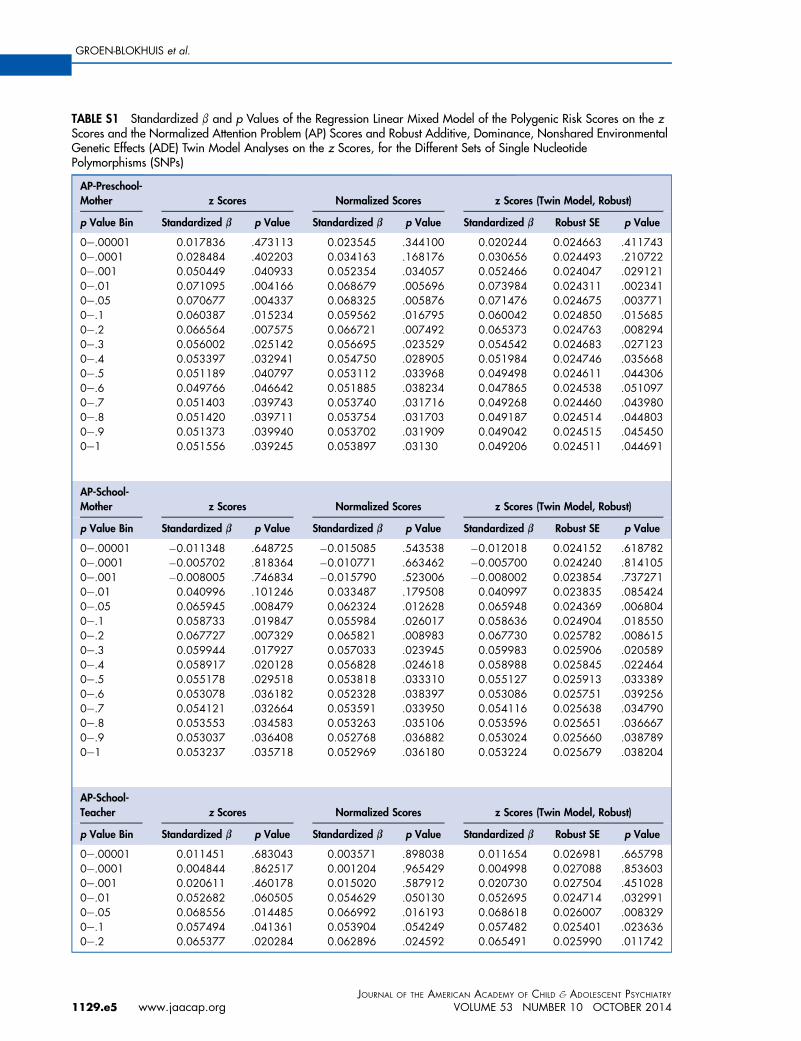
TABLE S1 Standardized b and p Values of the Regression Linear Mixed Model of the Polygenic Risk Scores on the zScores and the Normalized Attention Problem (AP) Scores and Robust Additive, Dominance, Nonshared EnvironmentalGenetic Effects (ADE) Twin Model Analyses on the z Scores, for the Different Sets of Single NucleotidePolymorphisms (SNPs)
AP-Preschool-Mother z Scores Normalized Scores z Scores (Twin Model, Robust)
p Value Bin Standardized b p Value Standardized b p Value Standardized b Robust SE p Value
0e.00001 0.017836 .473113 0.023545 .344100 0.020244 0.024663 .4117430e.0001 0.028484 .402203 0.034163 .168176 0.030656 0.024493 .2107220e.001 0.050449 .040933 0.052354 .034057 0.052466 0.024047 .0291210e.01 0.071095 .004166 0.068679 .005696 0.073984 0.024311 .0023410e.05 0.070677 .004337 0.068325 .005876 0.071476 0.024675 .0037710e.1 0.060387 .015234 0.059562 .016795 0.060042 0.024850 .0156850e.2 0.066564 .007575 0.066721 .007492 0.065373 0.024763 .0082940e.3 0.056002 .025142 0.056695 .023529 0.054542 0.024683 .0271230e.4 0.053397 .032941 0.054750 .028905 0.051984 0.024746 .0356680e.5 0.051189 .040797 0.053112 .033968 0.049498 0.024611 .0443060e.6 0.049766 .046642 0.051885 .038234 0.047865 0.024538 .0510970e.7 0.051403 .039743 0.053740 .031716 0.049268 0.024460 .0439800e.8 0.051420 .039711 0.053754 .031703 0.049187 0.024514 .0448030e.9 0.051373 .039940 0.053702 .031909 0.049042 0.024515 .0454500e1 0.051556 .039245 0.053897 .03130 0.049206 0.024511 .044691
AP-School-Mother z Scores Normalized Scores z Scores (Twin Model, Robust)
p Value Bin Standardized b p Value Standardized b p Value Standardized b Robust SE p Value
0e.00001 �0.011348 .648725 �0.015085 .543538 �0.012018 0.024152 .6187820e.0001 �0.005702 .818364 �0.010771 .663462 �0.005700 0.024240 .8141050e.001 �0.008005 .746834 �0.015790 .523006 �0.008002 0.023854 .7372710e.01 0.040996 .101246 0.033487 .179508 0.040997 0.023835 .0854240e.05 0.065945 .008479 0.062324 .012628 0.065948 0.024369 .0068040e.1 0.058733 .019847 0.055984 .026017 0.058636 0.024904 .0185500e.2 0.067727 .007329 0.065821 .008983 0.067730 0.025782 .0086150e.3 0.059944 .017927 0.057033 .023945 0.059983 0.025906 .0205890e.4 0.058917 .020128 0.056828 .024618 0.058988 0.025845 .0224640e.5 0.055178 .029518 0.053818 .033310 0.055127 0.025913 .0333890e.6 0.053078 .036182 0.052328 .038397 0.053086 0.025751 .0392560e.7 0.054121 .032664 0.053591 .033950 0.054116 0.025638 .0347900e.8 0.053553 .034583 0.053263 .035106 0.053596 0.025651 .0366670e.9 0.053037 .036408 0.052768 .036882 0.053024 0.025660 .0387890e1 0.053237 .035718 0.052969 .036180 0.053224 0.025679 .038204
AP-School-Teacher z Scores Normalized Scores z Scores (Twin Model, Robust)
p Value Bin Standardized b p Value Standardized b p Value Standardized b Robust SE p Value
0e.00001 0.011451 .683043 0.003571 .898038 0.011654 0.026981 .6657980e.0001 0.004844 .862517 0.001204 .965429 0.004998 0.027088 .8536030e.001 0.020611 .460178 0.015020 .587912 0.020730 0.027504 .4510280e.01 0.052682 .060505 0.054629 .050130 0.052695 0.024714 .0329910e.05 0.068556 .014485 0.066992 .016193 0.068618 0.026007 .0083290e.1 0.057494 .041361 0.053904 .054249 0.057482 0.025401 .0236360e.2 0.065377 .020284 0.062896 .024592 0.065491 0.025990 .011742
JOURNAL OF THE AMERICAN ACADEMY OF CHILD & ADOLESCENT PSYCHIATRY
1129.e5 www.jaacap.org VOLUME 53 NUMBER 10 OCTOBER 2014
GROEN-BLOKHUIS et al.

TABLE S1 Continued
AP-School-Teacher z Scores Normalized Scores z Scores (Twin Model, Robust)
p Value Bin Standardized b p Value Standardized b p Value Standardized b Robust SE p Value
0e.3 0.067006 .017499 0.064023 .022276 0.067002 0.026160 .0104310e.4 0.069177 .014303 0.065147 .020204 0.069164 0.026343 .0086510e.5 0.070475 .012547 0.065410 .019666 0.070554 0.026382 .0074880e.6 0.074195 .008561 0.068388 .014703 0.074285 0.026354 .0048220e.7 0.075919 .007148 0.070136 .012361 0.076006 0.026248 .0037840e.8 0.075996 .007114 0.070099 .012445 0.076086 0.026206 .0036920e.9 0.076641 .006652 0.070750 .011670 0.076736 0.026250 .0034630e1 0.076877 .006491 0.070965 .011425 0.076969 0.026272 .003393
Note: SE ¼ standard error.
ADHD POLYGENIC RISK SCORES IN A POPULATION-BASED SAMPLE
JOURNAL OF THE AMERICAN ACADEMY OF CHILD & ADOLESCENT PSYCHIATR
VOLUME 53 NUMBER 10 OCTOBER 2014
Ywww.jaacap.org 1129.e6