atmospheric dust and mesoscale/microscale …aslmd/spiga_a_exabst.pdf · atmospheric dust and...
TRANSCRIPT
ATMOSPHERIC DUST AND MESOSCALE/MICROSCALE METEOROLOGY. A. Spiga1, S.R. Lewis1, and F. For-get2. 1 Department of Physics and Astronomy, The Open University, Milton Keynes, United Kingdom ([email protected], [email protected]). 2Laboratoire de Météorologie Dynamique, CNRS/IPSL, Paris, France ([email protected]).
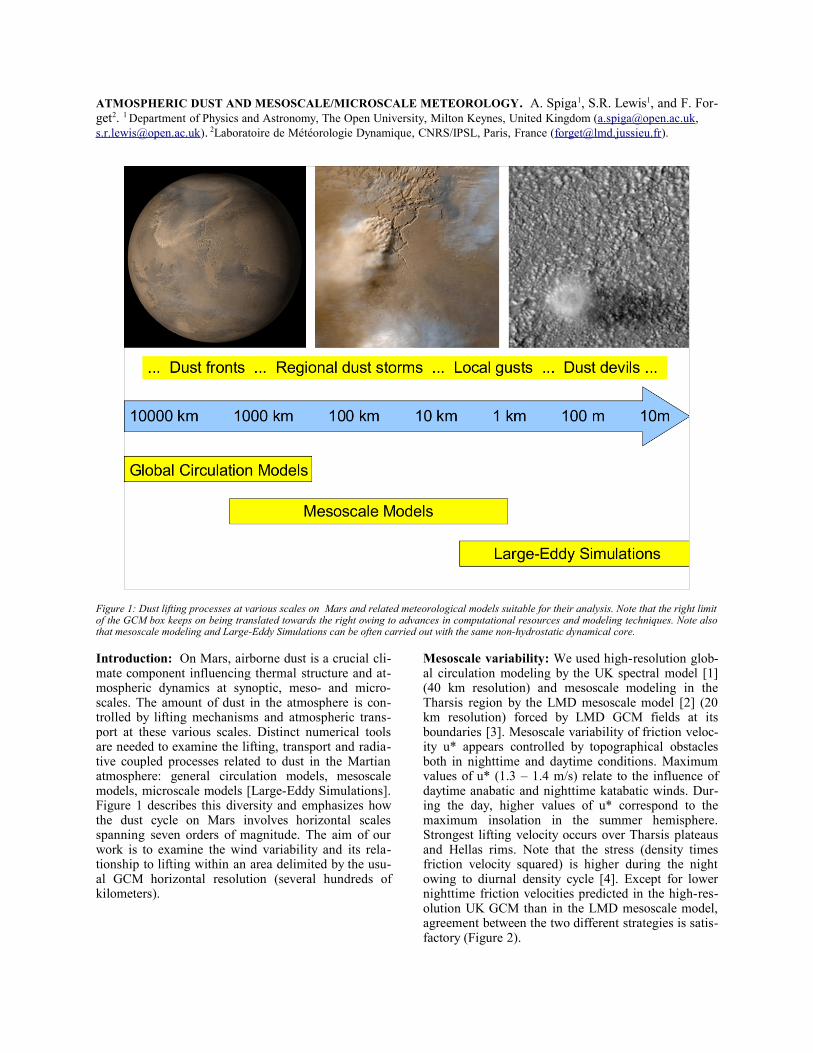
Figure 1: Dust lifting processes at various scales on Mars and related meteorological models suitable for their analysis. Note that the right limit of the GCM box keeps on being translated towards the right owing to advances in computational resources and modeling techniques. Note also that mesoscale modeling and Large-Eddy Simulations can be often carried out with the same non-hydrostatic dynamical core.
Introduction: On Mars, airborne dust is a crucial cli-mate component influencing thermal structure and at-mospheric dynamics at synoptic, meso- and micro- scales. The amount of dust in the atmosphere is con-trolled by lifting mechanisms and atmospheric trans-port at these various scales. Distinct numerical tools are needed to examine the lifting, transport and radia-tive coupled processes related to dust in the Martian atmosphere: general circulation models, mesoscale models, microscale models [Large-Eddy Simulations]. Figure 1 describes this diversity and emphasizes how the dust cycle on Mars involves horizontal scales spanning seven orders of magnitude. The aim of our work is to examine the wind variability and its rela-tionship to lifting within an area delimited by the usu-al GCM horizontal resolution (several hundreds of kilometers).
Mesoscale variability: We used high-resolution glob-al circulation modeling by the UK spectral model [1] (40 km resolution) and mesoscale modeling in the Tharsis region by the LMD mesoscale model [2] (20 km resolution) forced by LMD GCM fields at its boundaries [3]. Mesoscale variability of friction veloc-ity u* appears controlled by topographical obstacles both in nighttime and daytime conditions. Maximum values of u* (1.3 – 1.4 m/s) relate to the influence of daytime anabatic and nighttime katabatic winds. Dur-ing the day, higher values of u* correspond to the maximum insolation in the summer hemisphere. Strongest lifting velocity occurs over Tharsis plateaus and Hellas rims. Note that the stress (density times friction velocity squared) is higher during the night owing to diurnal density cycle [4]. Except for lower nighttime friction velocities predicted in the high-res-olution UK GCM than in the LMD mesoscale model, agreement between the two different strategies is satis-factory (Figure 2).
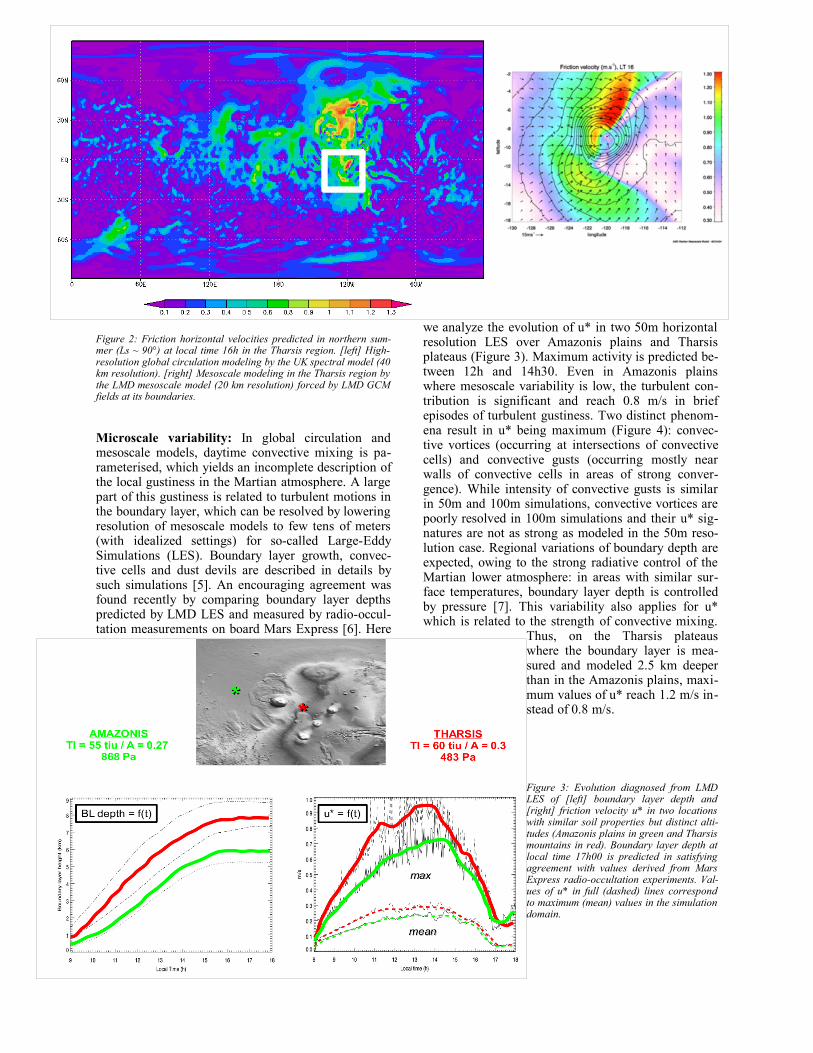
Figure 2: Friction horizontal velocities predicted in northern sum-mer (Ls ~ 90°) at local time 16h in the Tharsis region. [left] High-resolution global circulation modeling by the UK spectral model (40 km resolution). [right] Mesoscale modeling in the Tharsis region by the LMD mesoscale model (20 km resolution) forced by LMD GCM fields at its boundaries.
Microscale variability: In global circulation and mesoscale models, daytime convective mixing is pa-rameterised, which yields an incomplete description of the local gustiness in the Martian atmosphere. A large part of this gustiness is related to turbulent motions in the boundary layer, which can be resolved by lowering resolution of mesoscale models to few tens of meters (with idealized settings) for so-called Large-Eddy Simulations (LES). Boundary layer growth, convec-tive cells and dust devils are described in details by such simulations [5]. An encouraging agreement was found recently by comparing boundary layer depths predicted by LMD LES and measured by radio-occul-tation measurements on board Mars Express [6]. Here
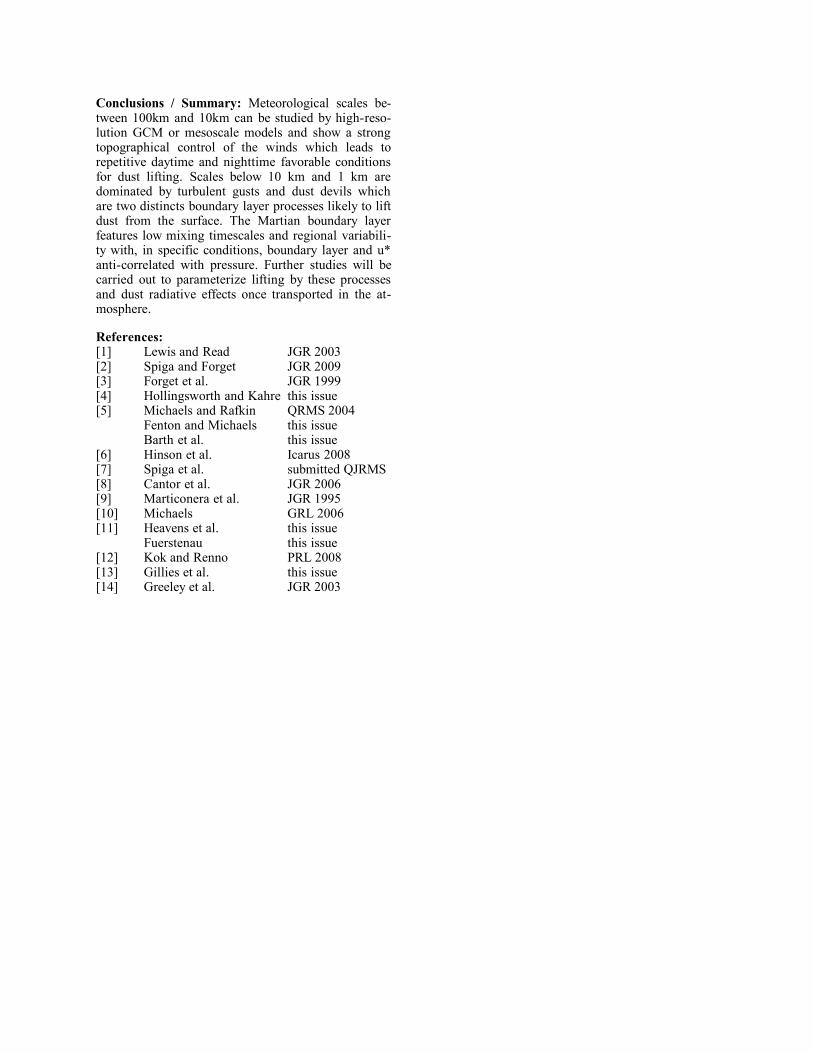
we analyze the evolution of u* in two 50m horizontal resolution LES over Amazonis plains and Tharsis plateaus (Figure 3). Maximum activity is predicted be-tween 12h and 14h30. Even in Amazonis plains where mesoscale variability is low, the turbulent con-tribution is significant and reach 0.8 m/s in brief episodes of turbulent gustiness. Two distinct phenom-ena result in u* being maximum (Figure 4): convec-tive vortices (occurring at intersections of convective cells) and convective gusts (occurring mostly near walls of convective cells in areas of strong conver-gence). While intensity of convective gusts is similar in 50m and 100m simulations, convective vortices are poorly resolved in 100m simulations and their u* sig-natures are not as strong as modeled in the 50m reso-lution case. Regional variations of boundary depth are expected, owing to the strong radiative control of the Martian lower atmosphere: in areas with similar sur-face temperatures, boundary layer depth is controlled by pressure [7]. This variability also applies for u* which is related to the strength of convective mixing.
Thus, on the Tharsis plateaus where the boundary layer is mea-sured and modeled 2.5 km deeper than in the Amazonis plains, maxi-mum values of u* reach 1.2 m/s in-stead of 0.8 m/s.
Figure 3: Evolution diagnosed from LMD LES of [left] boundary layer depth and [right] friction velocity u* in two locations with similar soil properties but distinct alti-tudes (Amazonis plains in green and Tharsis mountains in red). Boundary layer depth at local time 17h00 is predicted in satisfying agreement with values derived from Mars Express radio-occultation experiments. Val-ues of u* in full (dashed) lines correspond to maximum (mean) values in the simulation domain.
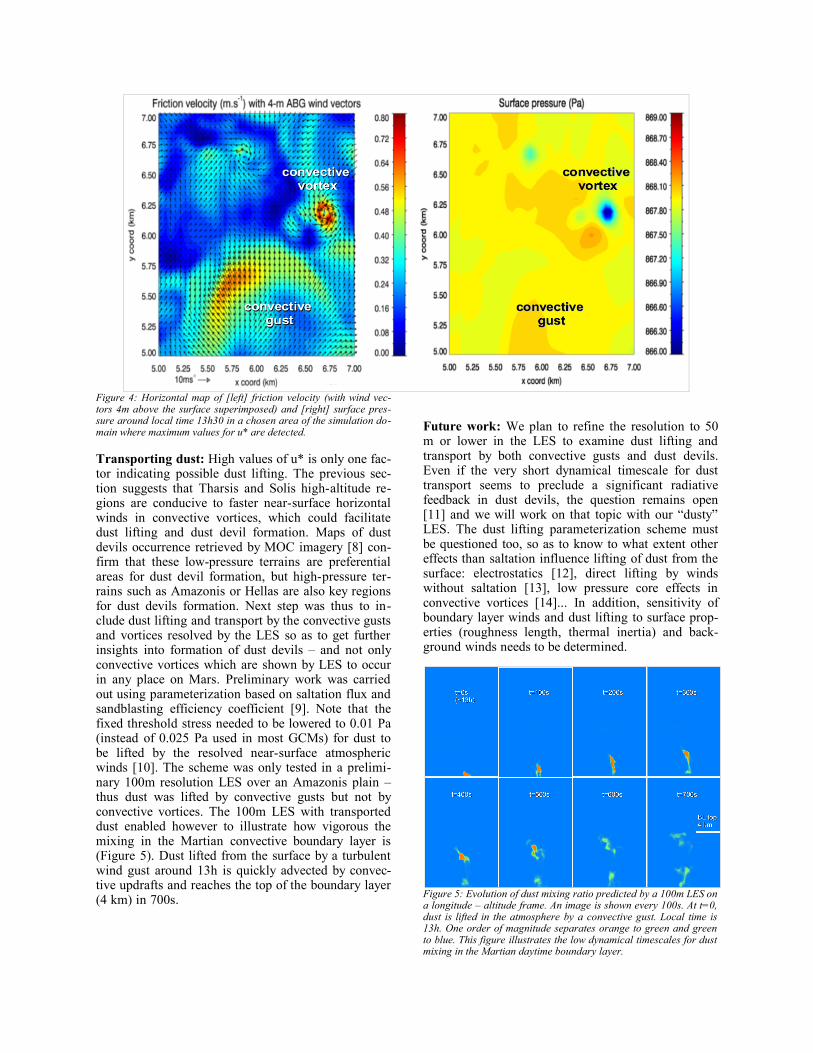
Figure 4: Horizontal map of [left] friction velocity (with wind vec-tors 4m above the surface superimposed) and [right] surface pres-sure around local time 13h30 in a chosen area of the simulation do-main where maximum values for u* are detected.
Transporting dust: High values of u* is only one fac-tor indicating possible dust lifting. The previous sec-tion suggests that Tharsis and Solis high-altitude re-gions are conducive to faster near-surface horizontal winds in convective vortices, which could facilitate dust lifting and dust devil formation. Maps of dust devils occurrence retrieved by MOC imagery [8] con-firm that these low-pressure terrains are preferential areas for dust devil formation, but high-pressure ter-rains such as Amazonis or Hellas are also key regions for dust devils formation. Next step was thus to in-clude dust lifting and transport by the convective gusts and vortices resolved by the LES so as to get further insights into formation of dust devils – and not only convective vortices which are shown by LES to occur in any place on Mars. Preliminary work was carried out using parameterization based on saltation flux and sandblasting efficiency coefficient [9]. Note that the fixed threshold stress needed to be lowered to 0.01 Pa (instead of 0.025 Pa used in most GCMs) for dust to be lifted by the resolved near-surface atmospheric winds [10]. The scheme was only tested in a prelimi-nary 100m resolution LES over an Amazonis plain – thus dust was lifted by convective gusts but not by convective vortices. The 100m LES with transported dust enabled however to illustrate how vigorous the mixing in the Martian convective boundary layer is (Figure 5). Dust lifted from the surface by a turbulent wind gust around 13h is quickly advected by convec-tive updrafts and reaches the top of the boundary layer (4 km) in 700s.
Future work: We plan to refine the resolution to 50 m or lower in the LES to examine dust lifting and transport by both convective gusts and dust devils. Even if the very short dynamical timescale for dust transport seems to preclude a significant radiative feedback in dust devils, the question remains open [11] and we will work on that topic with our “dusty” LES. The dust lifting parameterization scheme must be questioned too, so as to know to what extent other effects than saltation influence lifting of dust from the surface: electrostatics [12], direct lifting by winds without saltation [13], low pressure core effects in convective vortices [14]... In addition, sensitivity of boundary layer winds and dust lifting to surface prop-erties (roughness length, thermal inertia) and back-ground winds needs to be determined.
Figure 5: Evolution of dust mixing ratio predicted by a 100m LES on a longitude – altitude frame. An image is shown every 100s. At t=0, dust is lifted in the atmosphere by a convective gust. Local time is 13h. One order of magnitude separates orange to green and green to blue. This figure illustrates the low dynamical timescales for dust mixing in the Martian daytime boundary layer.
Conclusions / Summary: Meteorological scales be-tween 100km and 10km can be studied by high-reso-lution GCM or mesoscale models and show a strong topographical control of the winds which leads to repetitive daytime and nighttime favorable conditions for dust lifting. Scales below 10 km and 1 km are dominated by turbulent gusts and dust devils which are two distincts boundary layer processes likely to lift dust from the surface. The Martian boundary layer features low mixing timescales and regional variabili-ty with, in specific conditions, boundary layer and u* anti-correlated with pressure. Further studies will be carried out to parameterize lifting by these processes and dust radiative effects once transported in the at-mosphere.
References: [1] Lewis and Read JGR 2003 [2] Spiga and Forget JGR 2009[3] Forget et al. JGR 1999[4] Hollingsworth and Kahre this issue[5] Michaels and Rafkin QRMS 2004
Fenton and Michaels this issueBarth et al. this issue
[6] Hinson et al. Icarus 2008[7] Spiga et al. submitted QJRMS[8] Cantor et al. JGR 2006[9] Marticonera et al. JGR 1995[10] Michaels GRL 2006[11] Heavens et al. this issue
Fuerstenau this issue[12] Kok and Renno PRL 2008[13] Gillies et al. this issue[14] Greeley et al. JGR 2003