atmospheric chemistry day 5 ozone and air quality air quality and climate change
TRANSCRIPT
Atmospheric chemistry
Day 5Ozone and air quality
Air quality and climate change
Impact of air pollutionUK Air Quality Strategy, 2007
• “Air pollution is currently estimated to reduce the
life expectancy of every person in the UK by an average of 7-8 months. The measures outlined in the strategy could help to reduce the impact on average life expectancy to five months by 2020, and provide a significant step forward in protecting our environment.”
• Defra estimate the health impact of air pollution in 2005 cost £9.1–21.4 billion pa.
Air Quality Standards: Ozone
• European Union Limit Value: Target of 120μg.m-3 (60 ppb) for an 8 hour mean, not to be exceeded more than 25 times a year averaged over3 years. To be achieved by 31 December 2010.
• UK Air Quality Objective: Target of 100μg.m-3 (50 ppb) for an 8 hour mean, not to be exceeded more than 10 times a year. To be achieved by 31 December 2005.
Timescales of ozone chemistry
1. Global chemistry. Dominated by NOx + CH4 + sunlight. Timescales are long as are transport distances.
2. Regional chemistry. Many VOCs are emitted, e.g. over Europe. Each has its own lifetime governed by its rate constant for reaction with OH. The timescales of ozone production takes from hours to days. The transport distance for a wind speed of 5 m s-1 and a lifetime of 1 day is ~500 km.
3. Urban chemistry: high concentrations of NO from transport sources. Ozone is depressed by the reaction:
NO + O3 NO2 + O2
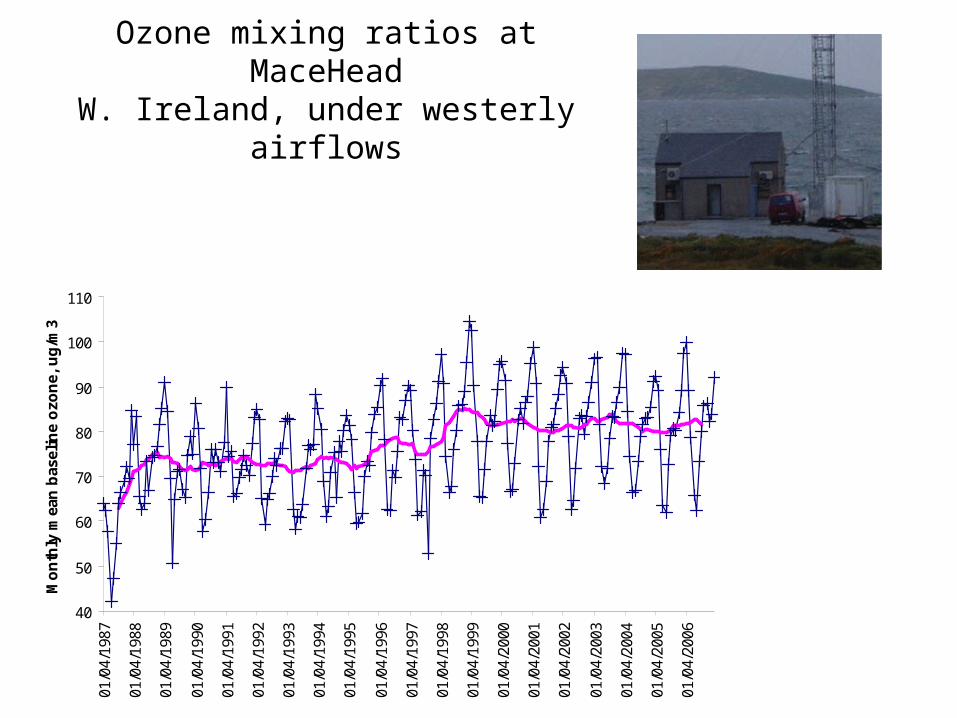
Ozone mixing ratios at MaceHeadW. Ireland, under westerly airflows
40
50
60
70
80
90
100
110
01/0
4/19
87
01/0
4/19
88
01/0
4/19
89
01/0
4/19
90
01/0
4/19
91
01/0
4/19
92
01/0
4/19
93
01/0
4/19
94
01/0
4/19
95
01/0
4/19
96
01/0
4/19
97
01/0
4/19
98
01/0
4/19
99
01/0
4/20
00
01/0
4/20
01
01/0
4/20
02
01/0
4/20
03
01/0
4/20
04
01/0
4/20
05
01/0
4/20
06
Mo
nth
ly m
ean
bas
elin
e o
zon
e, u
g/m
3
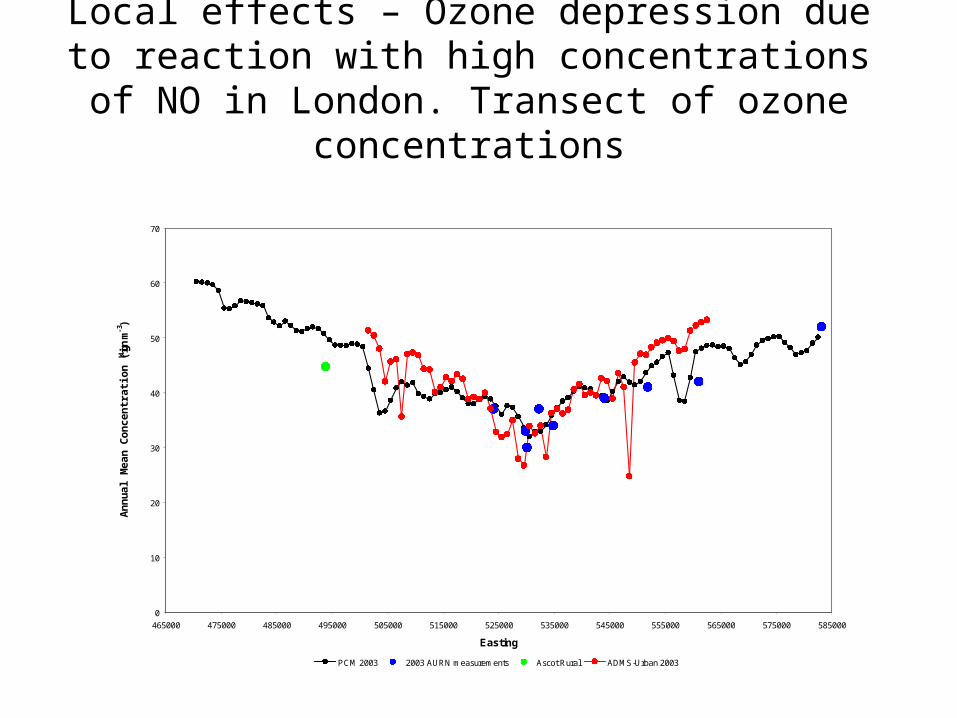
Local effects – Ozone depression due to reaction with high concentrations of NO in London. Transect of ozone concentrations
0
10
20
30
40
50
60
70
465000 475000 485000 495000 505000 515000 525000 535000 545000 555000 565000 575000 585000
Easting
An
nu
al
Me
an
Co
nc
en
tra
tio
n (
in g
m-3
)
PCM 2003 2003 AURN measurements Ascot Rural ADMS-Urban 2003
Radiative Forcing
• Radiative forcing: the change in the net radiation balance at the tropopause caused by a particular external factor in the absence of any climate feedbacks.
• These forcing mechanisms can be caused by:– change in the atmospheric constituents such as the
increase in greenhouse gases (GHGs)– aerosols due to anthropogenic activity, – changes in other components of the Earth/atmosphere
system such as changes in the surface albedo (the fraction of incoming radiation that is reflected). Albedo changes are caused, e.g., by changesin vegetation (e.g. burn scars or agriculture).
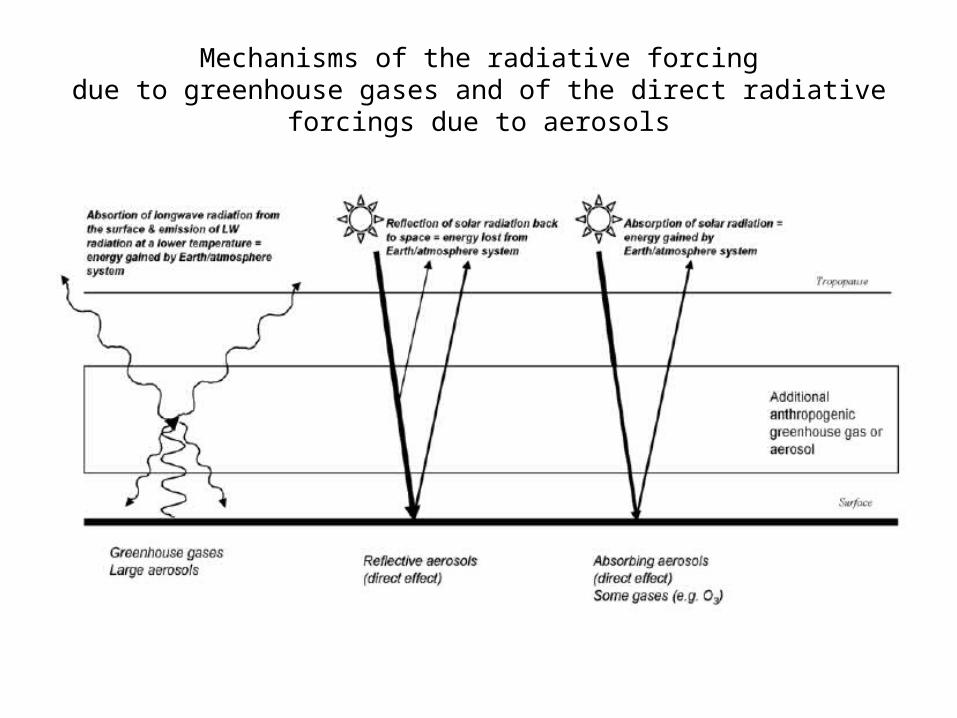
Mechanisms of the radiative forcingdue to greenhouse gases and of the direct radiative forcings
due to aerosols
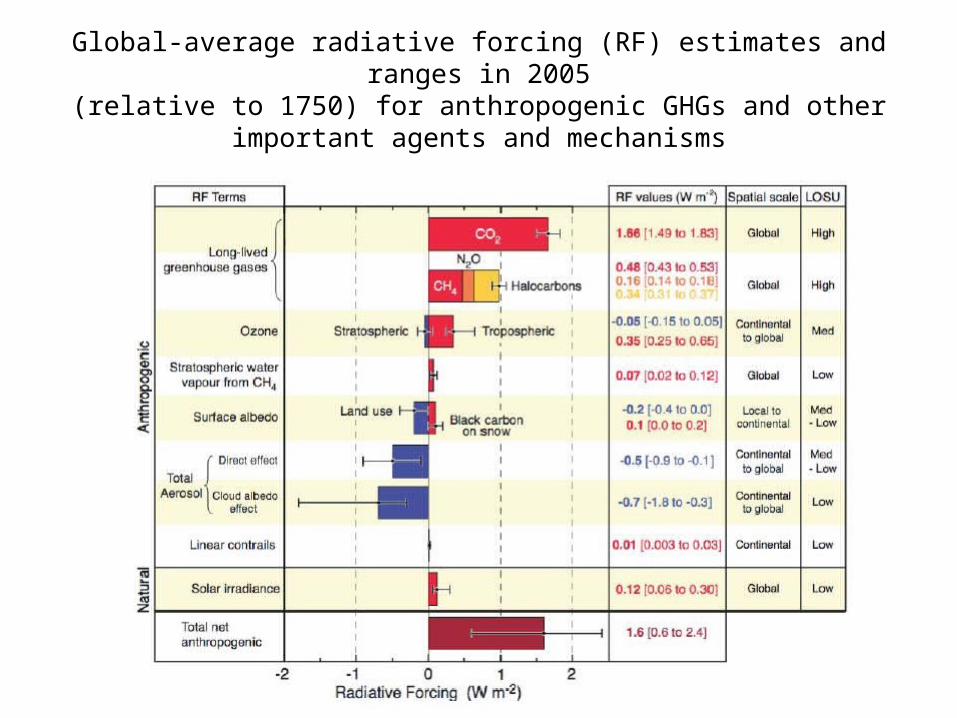
Global-average radiative forcing (RF) estimates and ranges in 2005
(relative to 1750) for anthropogenic GHGs and other important agents and mechanisms
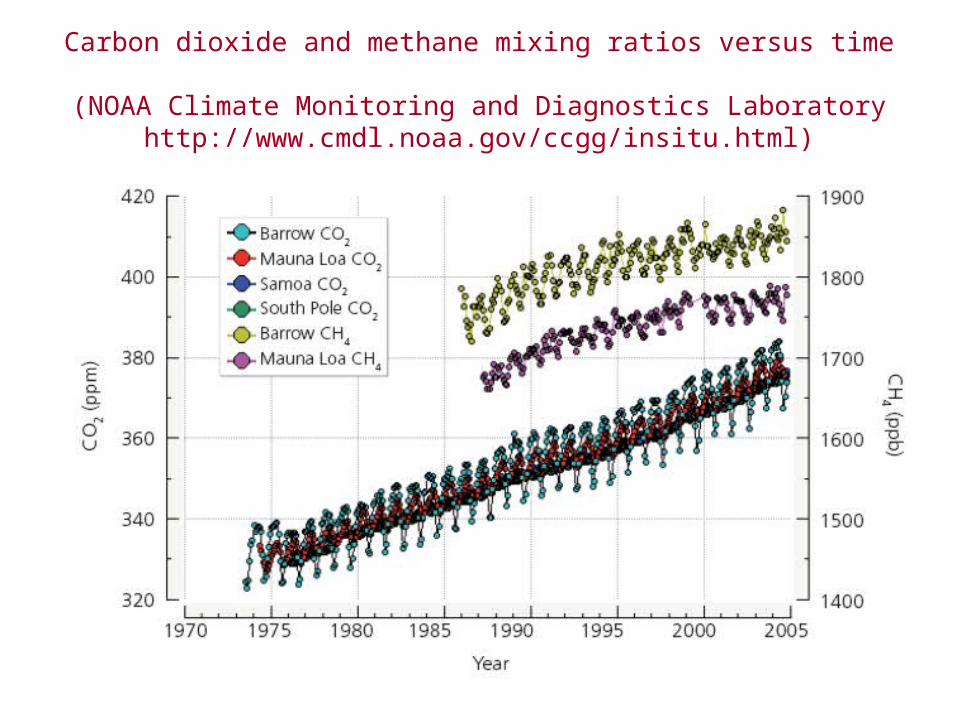
Carbon dioxide and methane mixing ratios versus time (NOAA Climate Monitoring and Diagnostics Laboratory
http://www.cmdl.noaa.gov/ccgg/insitu.html)
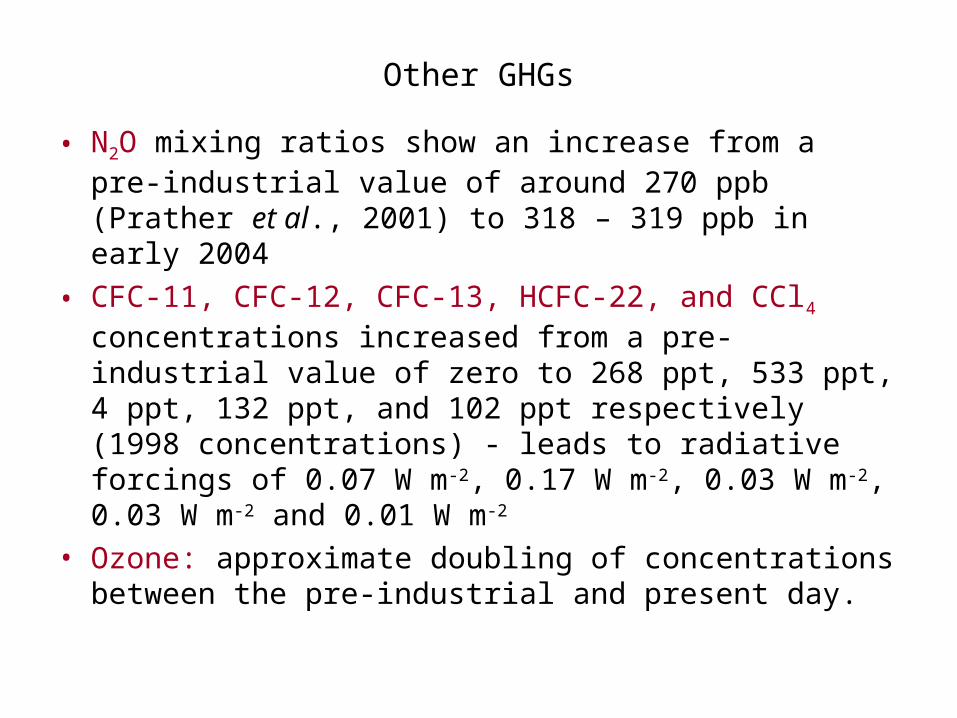
Other GHGs
• N2O mixing ratios show an increase from a pre-industrial value of around 270 ppb (Prather et al., 2001) to 318 – 319 ppb in early 2004
• CFC-11, CFC-12, CFC-13, HCFC-22, and CCl4 concentrations increased from a pre-industrial value of zero to 268 ppt, 533 ppt, 4 ppt, 132 ppt, and 102 ppt respectively (1998 concentrations) - leads to radiative forcings of 0.07 W m-2, 0.17 W m-2, 0.03 W m-2, 0.03 W m-2 and 0.01 W m-2
• Ozone: approximate doubling of concentrations between the pre-industrial and present day.
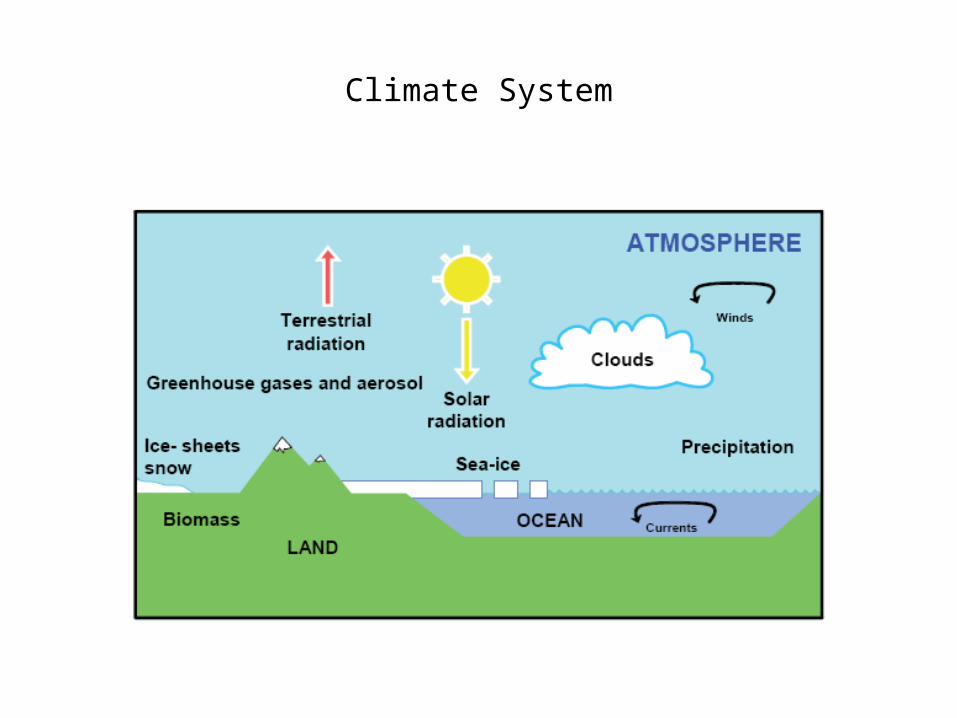
Climate System
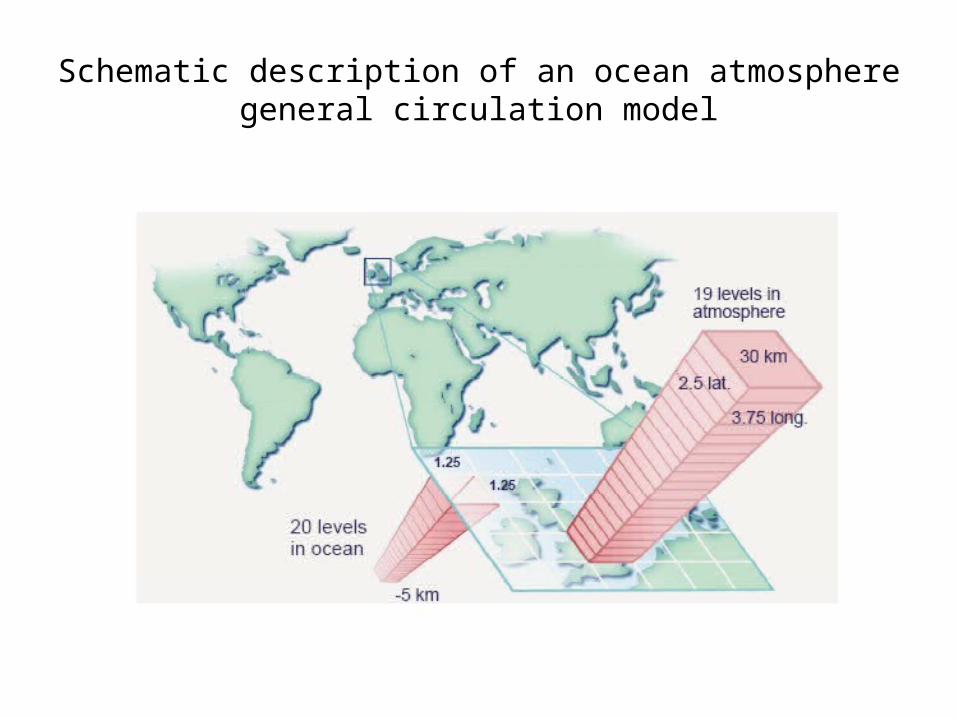
Schematic description of an ocean atmosphere general circulation model
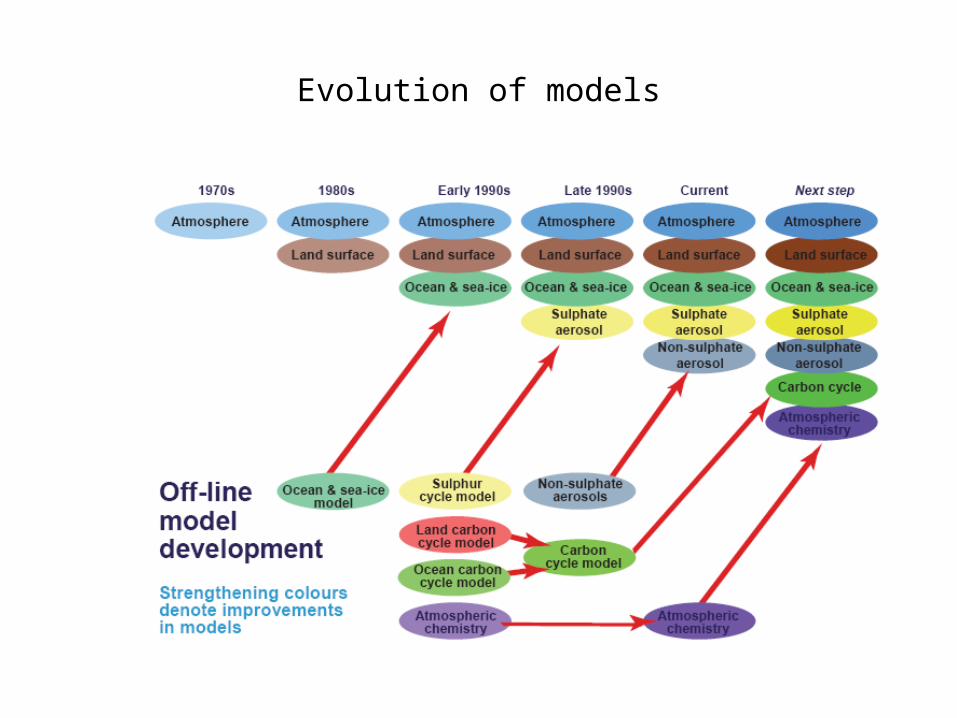
Evolution of models
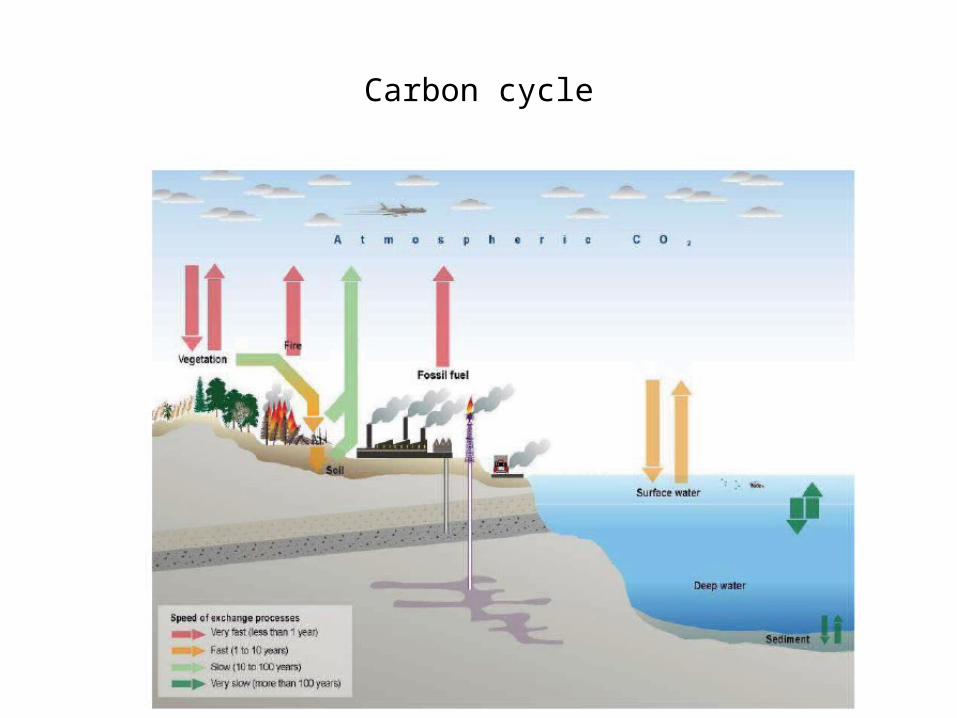
Carbon cycle
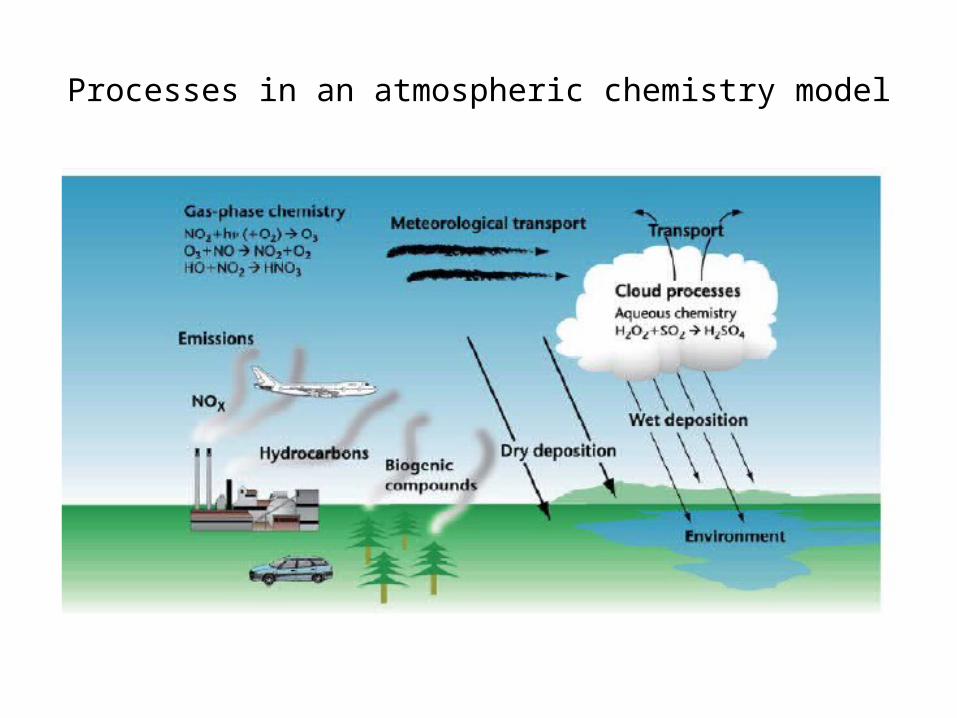
Processes in an atmospheric chemistry model
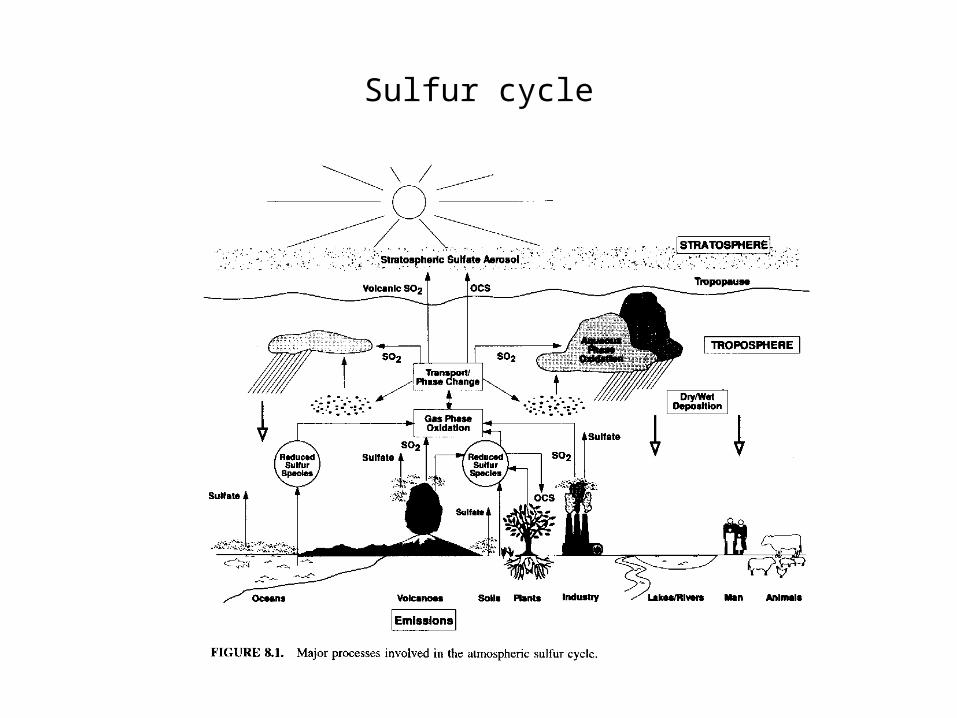
Sulfur cycle
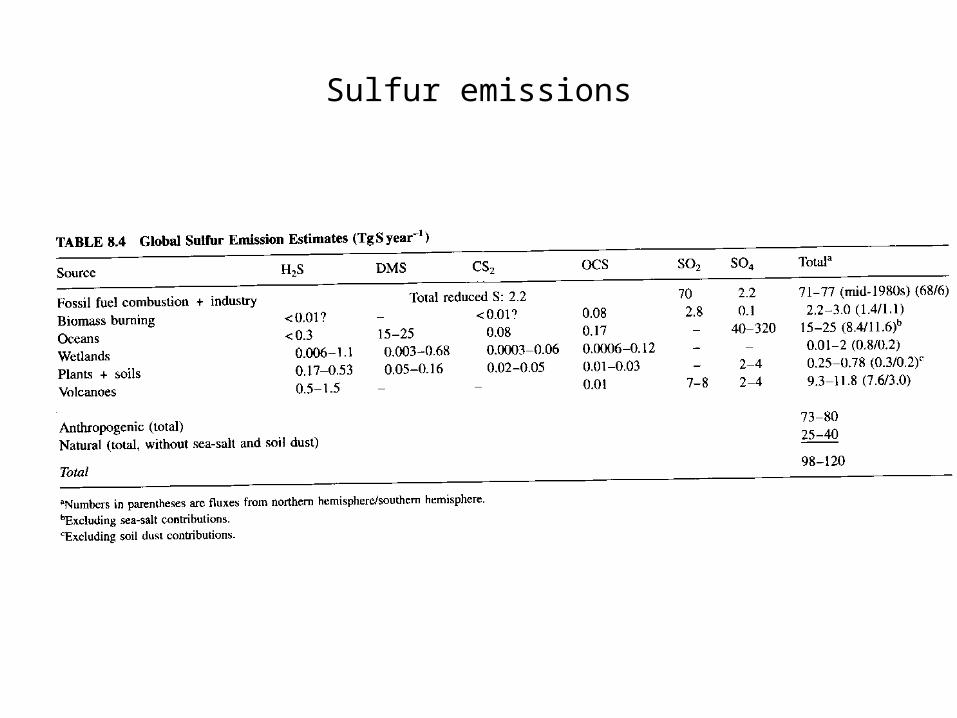
Sulfur emissions
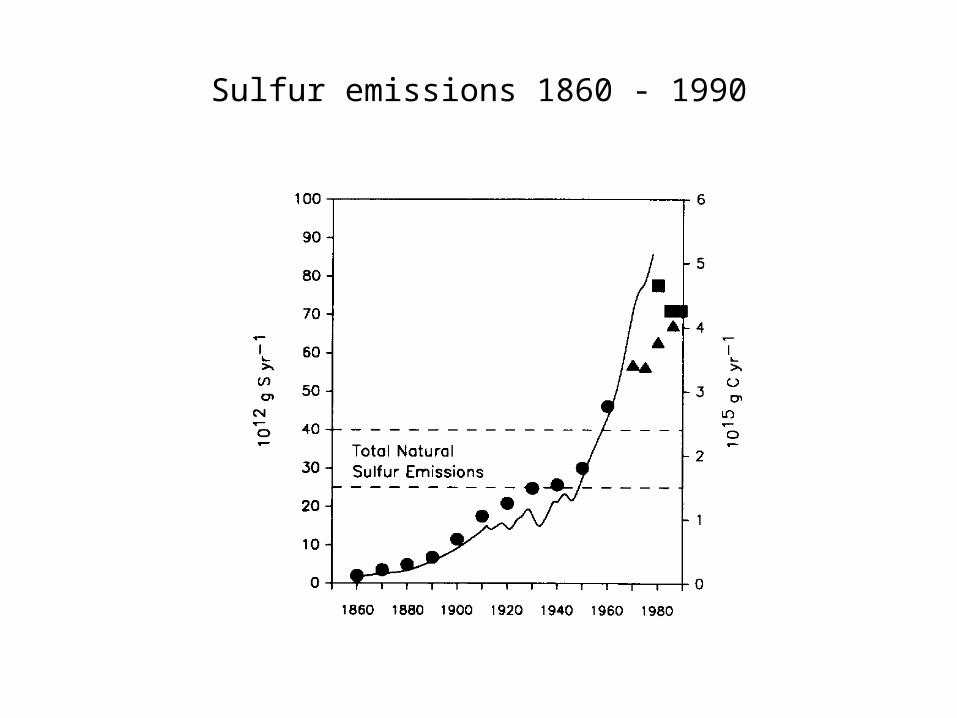
Sulfur emissions 1860 - 1990
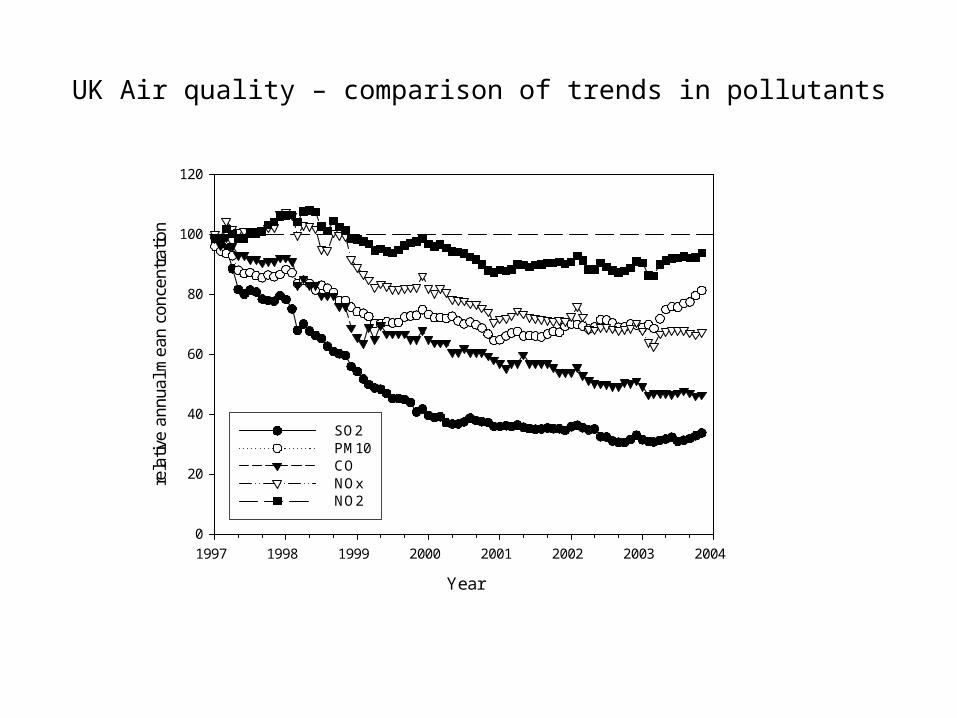
UK Air quality – comparison of trends in pollutants
Year
1997 1998 1999 2000 2001 2002 2003 2004
rela
tive
annu
al m
ean
conc
entr
atio
n
0
20
40
60
80
100
120
SO2PM10CONOxNO2
Relative annual mean concentration (monthly intervals): selection of monitoring sites in London.
AQEG PM report
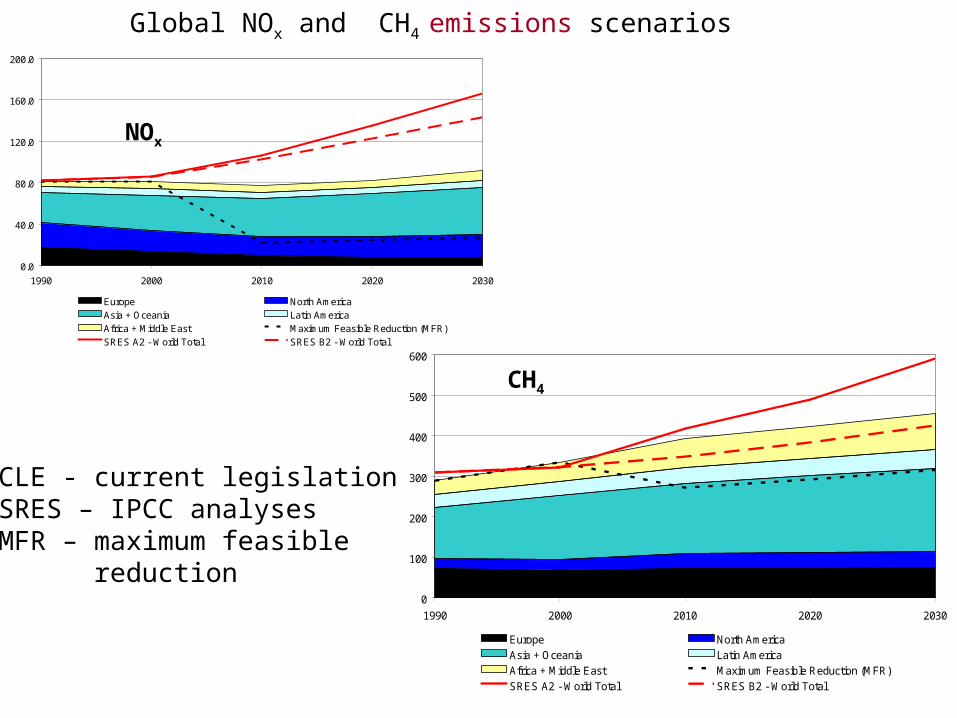
Global NOx and CH4 emissions scenarios
0.0
40.0
80.0
120.0
160.0
200.0
1990 2000 2010 2020 2030
Europe North AmericaAsia + Oceania Latin AmericaAfrica + Middle East Maximum Feasible Reduction (MFR)SRES A2 - World Total SRES B2 - World Total
NOx
0
100
200
300
400
500
600
1990 2000 2010 2020 2030
Europe North AmericaAsia + Oceania Latin AmericaAfrica + Middle East Maximum Feasible Reduction (MFR)SRES A2 - World Total SRES B2 - World Total
CH4
CLE - current legislation SRES – IPCC analysesMFR – maximum feasible
reduction
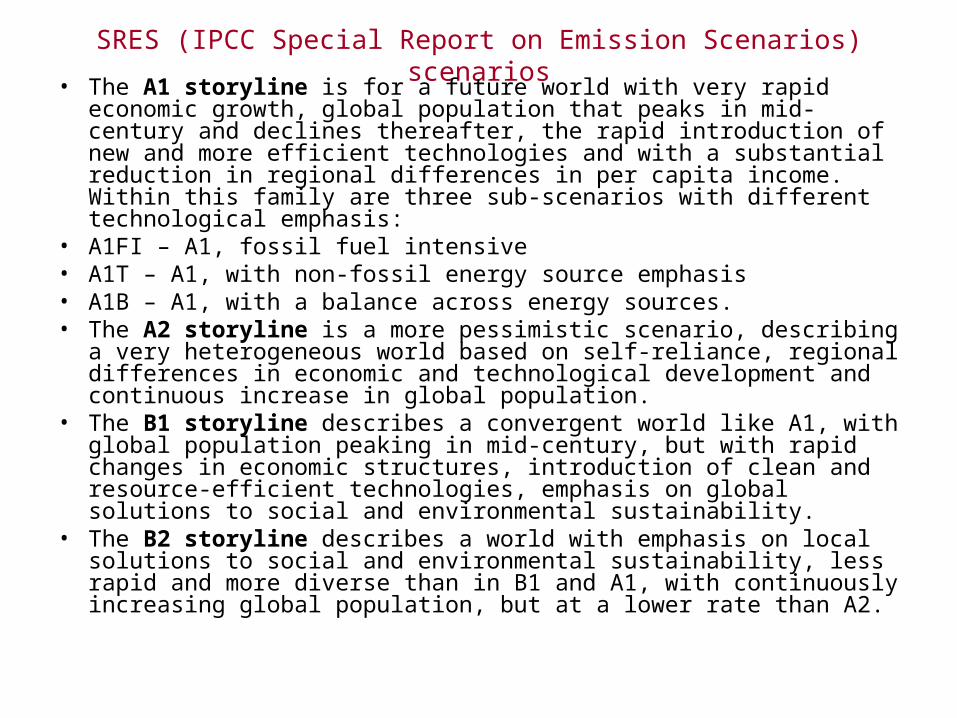
SRES (IPCC Special Report on Emission Scenarios) scenarios• The A1 storyline is for a future world with very rapid
economic growth, global population that peaks in mid-century and declines thereafter, the rapid introduction of new and more efficient technologies and with a substantial reduction in regional differences in per capita income. Within this family are three sub-scenarios with different technological emphasis:
• A1FI – A1, fossil fuel intensive• A1T – A1, with non-fossil energy source emphasis• A1B – A1, with a balance across energy sources.• The A2 storyline is a more pessimistic scenario, describing
a very heterogeneous world based on self-reliance, regional differences in economic and technological development and continuous increase in global population.
• The B1 storyline describes a convergent world like A1, with global population peaking in mid-century, but with rapid changes in economic structures, introduction of clean and resource-efficient technologies, emphasis on global solutions to social and environmental sustainability.
• The B2 storyline describes a world with emphasis on local solutions to social and environmental sustainability, less rapid and more diverse than in B1 and A1, with continuously increasing global population, but at a lower rate than A2.
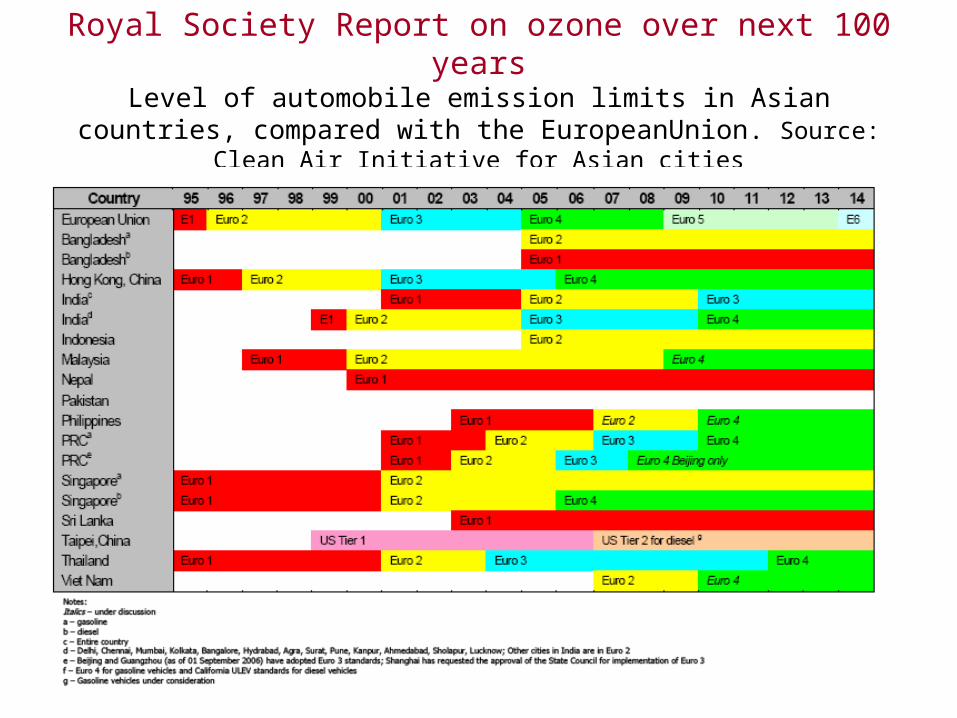
Royal Society Report on ozone over next 100 yearsLevel of automobile emission limits in Asian countries,
compared with the EuropeanUnion. Source: Clean Air Initiative for Asian cities
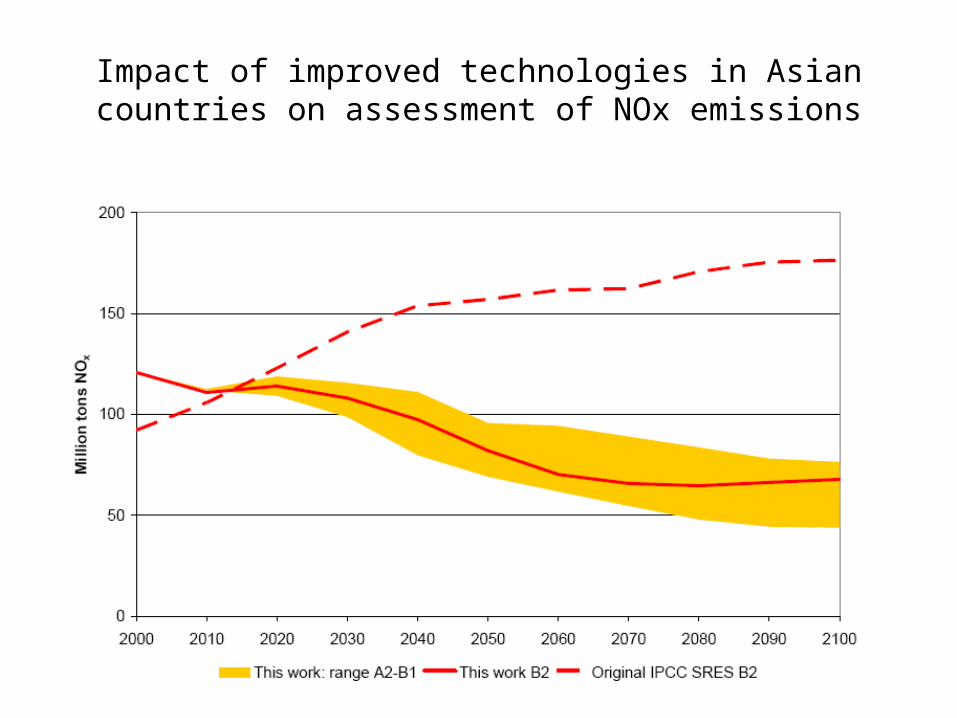
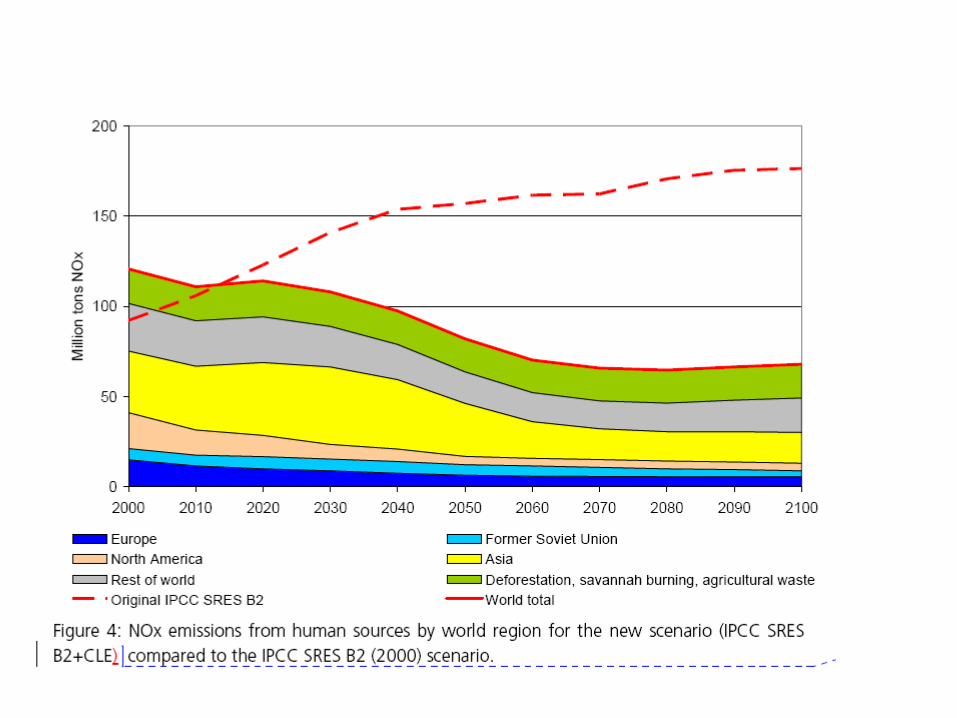
Impact of improved technologies in Asian countries on assessment of NOx emissions
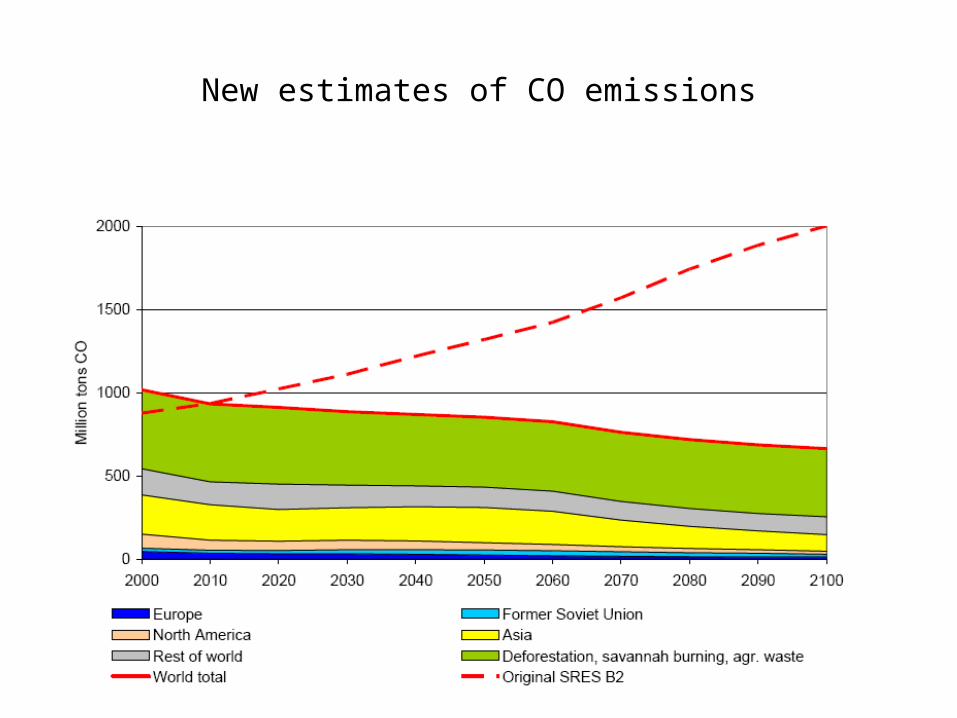
New estimates of CO emissions
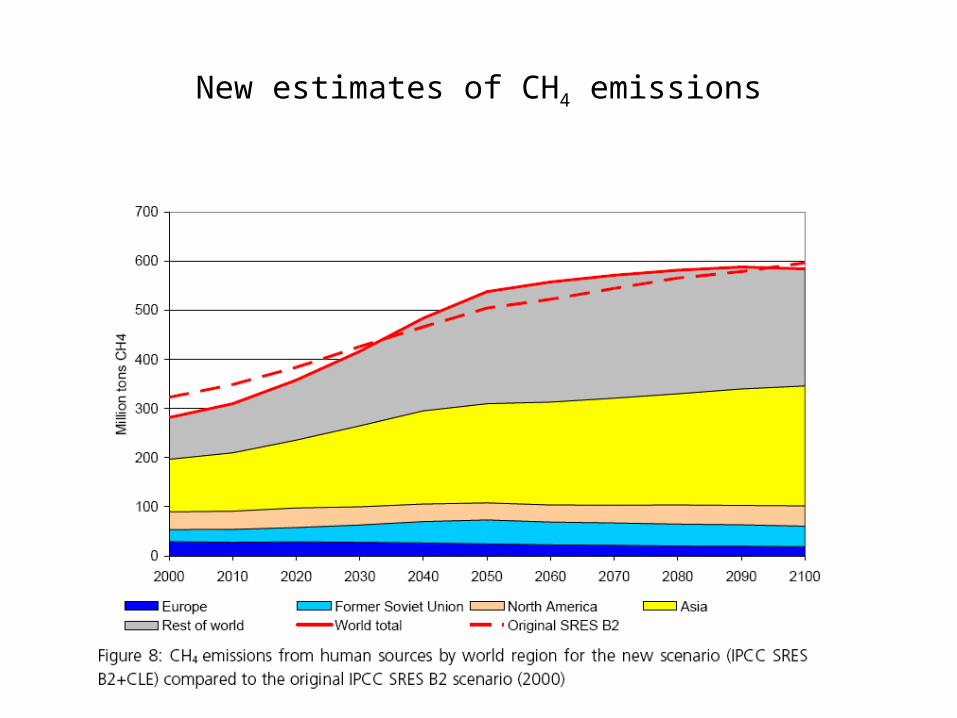
New estimates of CH4 emissions
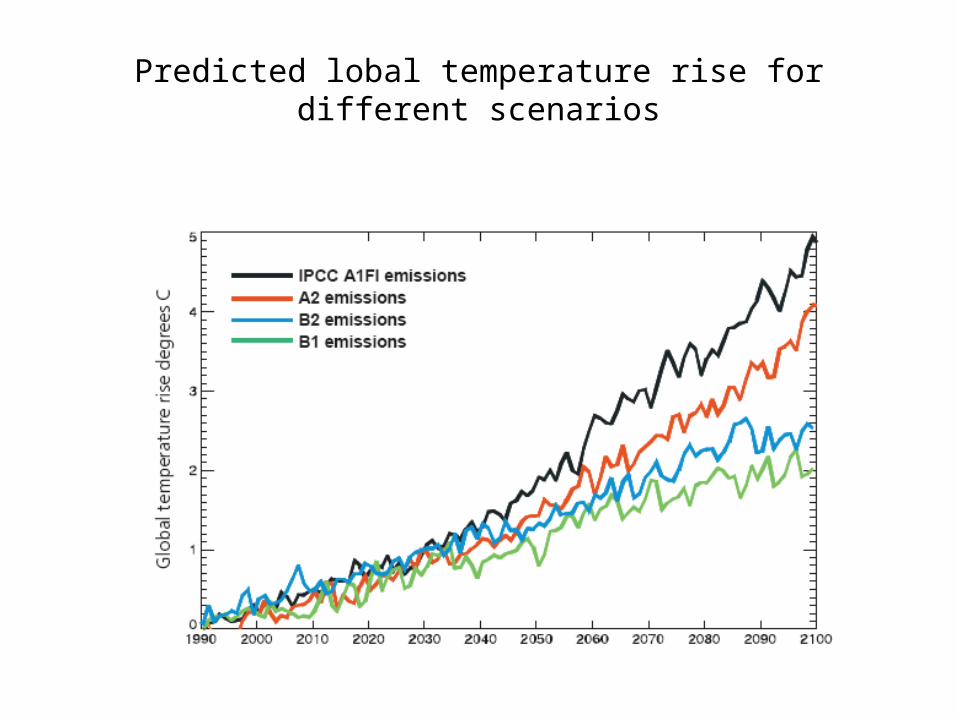
Predicted lobal temperature rise for different scenarios
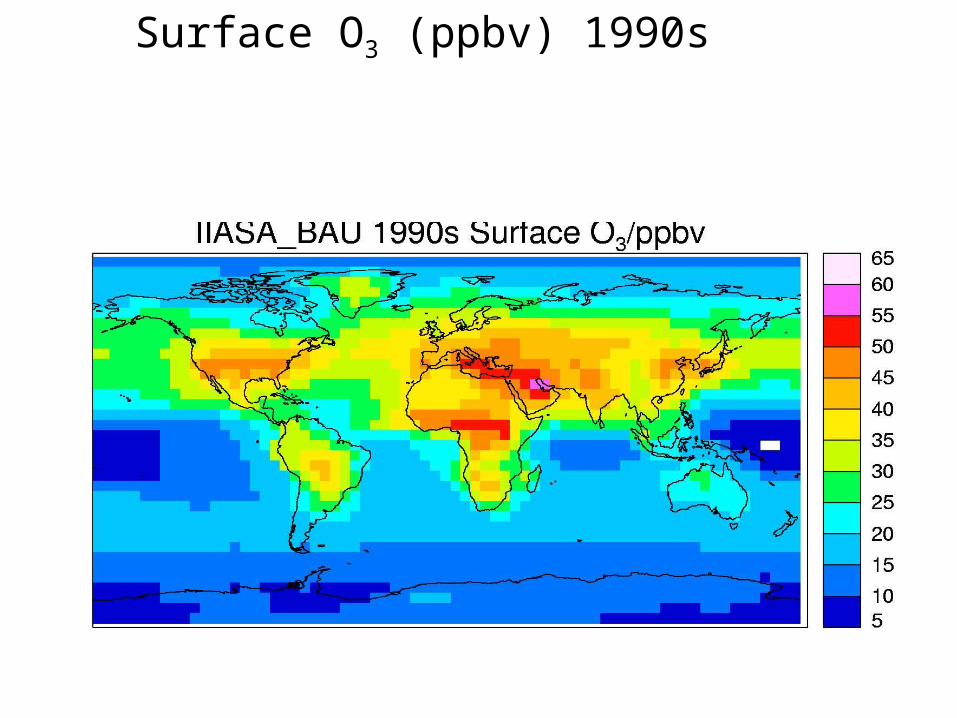
Surface O3 (ppbv) 1990s
BAU
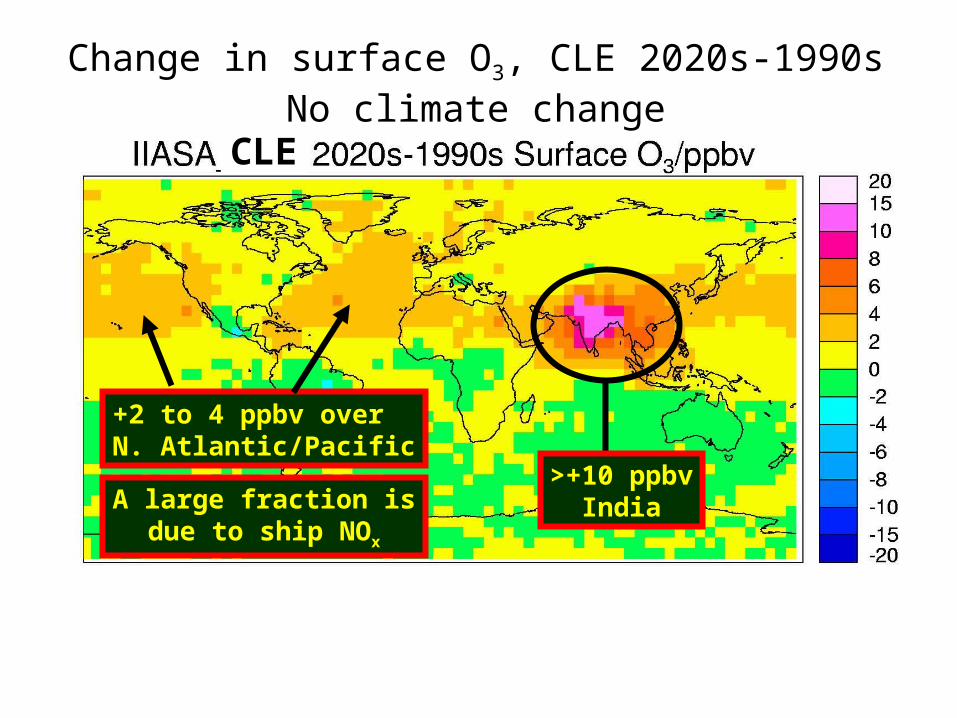
Change in surface O3, CLE 2020s-1990sNo climate change
>+10 ppbvIndia
+2 to 4 ppbv overN. Atlantic/Pacific
A large fraction isdue to ship NOx
CLE
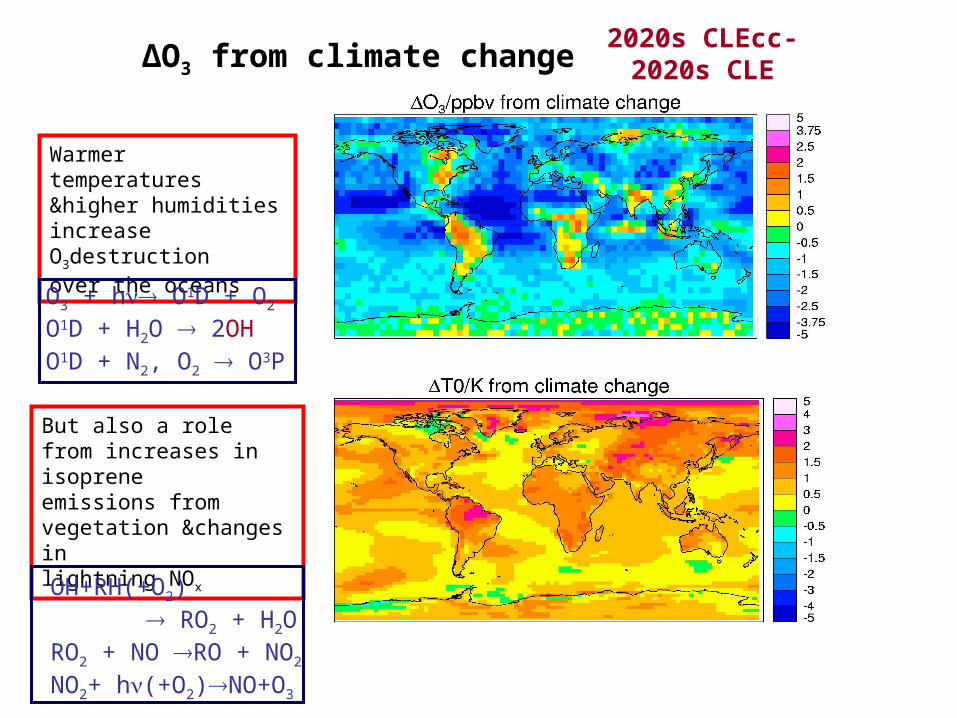
ΔO3 from climate change
Warmer temperatures &higher humiditiesincrease O3destruction over the oceans
But also a role from increases in isoprene emissions from vegetation &changes inlightning NOx
2020s CLEcc-2020s CLE
O3 + h O1D + O2
O1D + H2O 2OHO1D + N2, O2 O3P
OH+RH(+O2) RO2 + H2O
RO2 + NO RO + NO2
NO2+ h(+O2)NO+O3
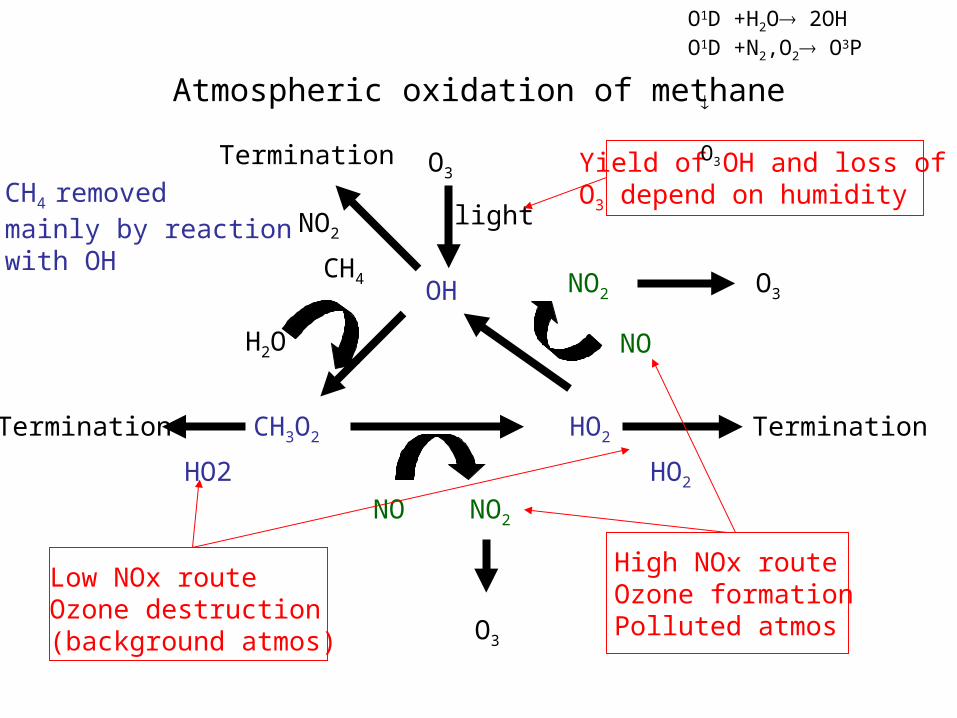
Atmospheric oxidation of methane
OH
CH3O2 HO2
CH4
H2O
NO NO2
O3
HO2
Termination
O3
light
HO2
Termination
NO
NO2 O3
NO2
TerminationCH4 removed mainly by reactionwith OH
Yield of OH and loss of O3 depend on humidity
Low NOx routeOzone destruction(background atmos)
High NOx routeOzone formationPolluted atmos
O1D +H2O 2OHO1D +N2,O2 O3P
O3
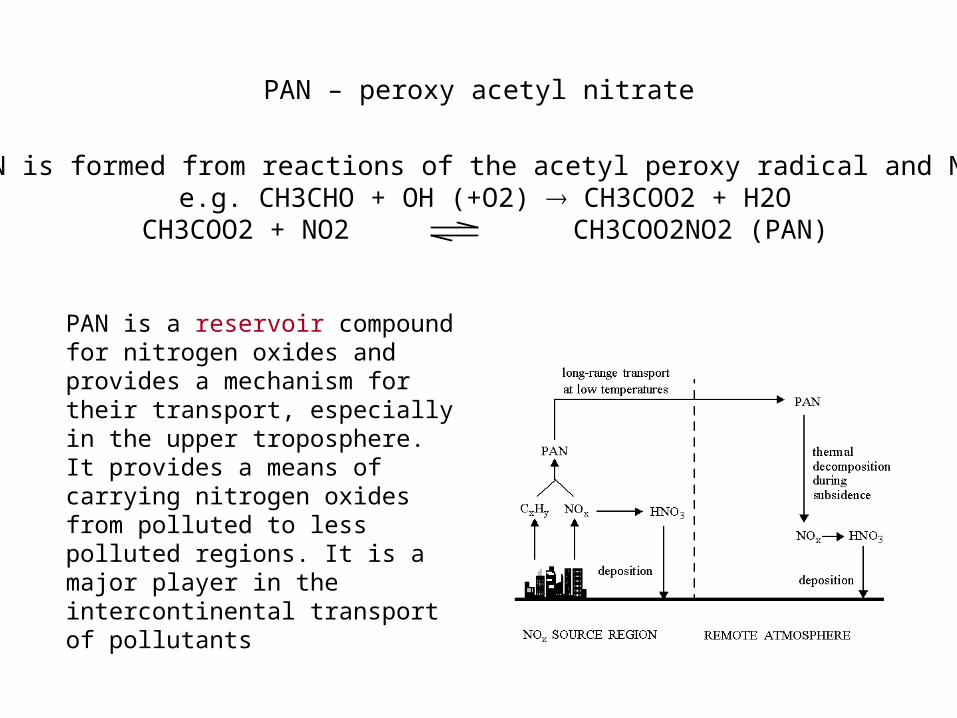
PAN – peroxy acetyl nitrate
PAN is a reservoir compound for nitrogen oxides and provides a mechanism for their transport, especially in the upper troposphere. It provides a means of carrying nitrogen oxides from polluted to less polluted regions. It is a major player in the intercontinental transport of pollutants
PAN is formed from reactions of the acetyl peroxy radical and NO2:e.g. CH3CHO + OH (+O2) CH3COO2 + H2OCH3COO2 + NO2 CH3COO2NO2 (PAN)
Impact of climate change on air quality - ozone
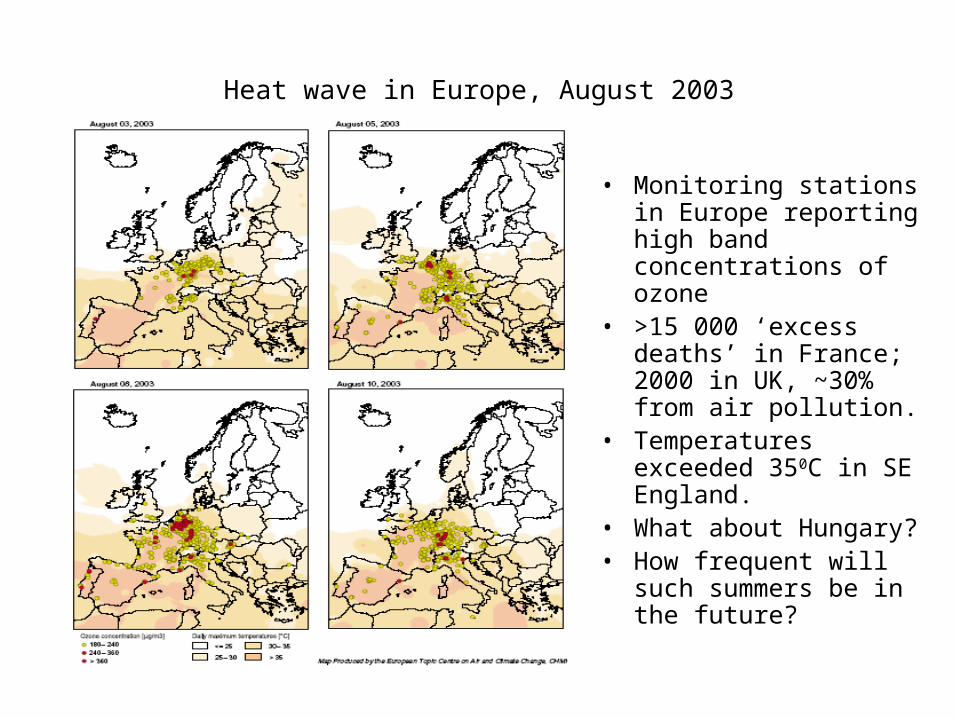
Heat wave in Europe, August 2003
• Monitoring stations in Europe reporting high band concentrations of ozone
• >15 000 ‘excess deaths’ in France; 2000 in UK, ~30% from air pollution.
• Temperatures exceeded 350C in SE England.
• What about Hungary?• How frequent will
such summers be in the future?
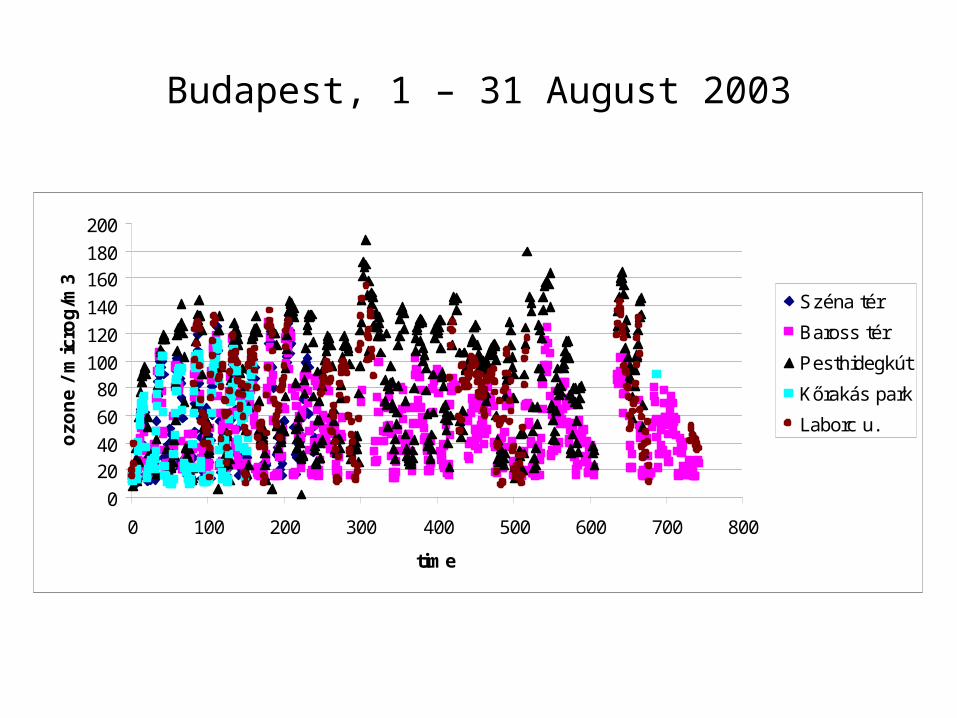
Budapest, 1 – 31 August 2003
0
2040
60
80100
120
140
160180
200
0 100 200 300 400 500 600 700 800
time
ozo
ne
/ m
icro
g/m
3
Széna tér
Baross tér
Pesthidegkút
Kőrakás park
Laborc u.
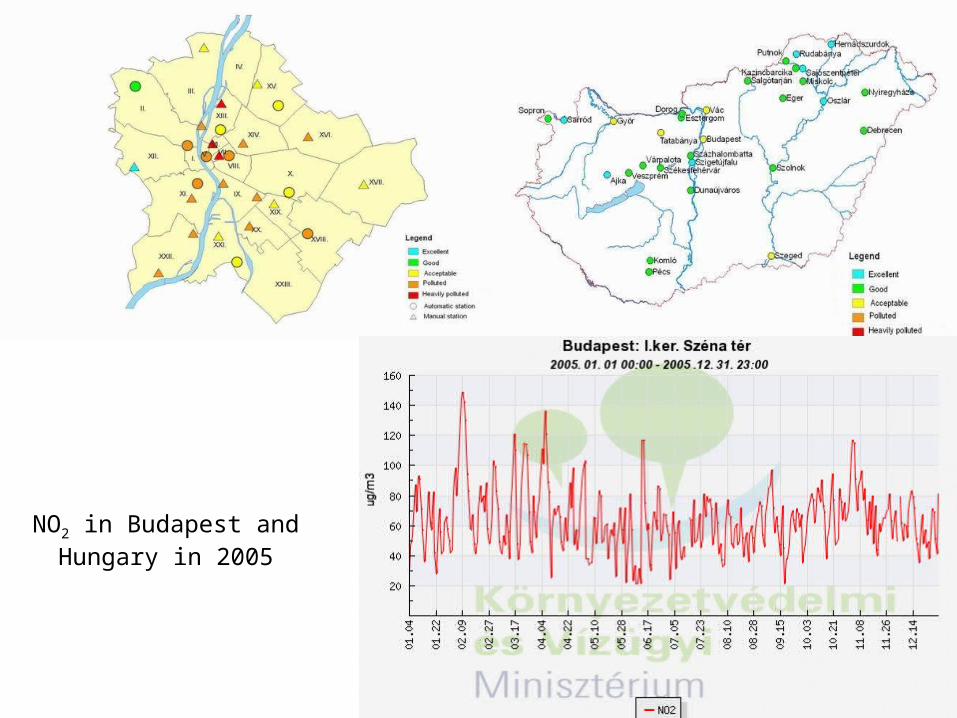
NO2 in Budapest and Hungary in 2005
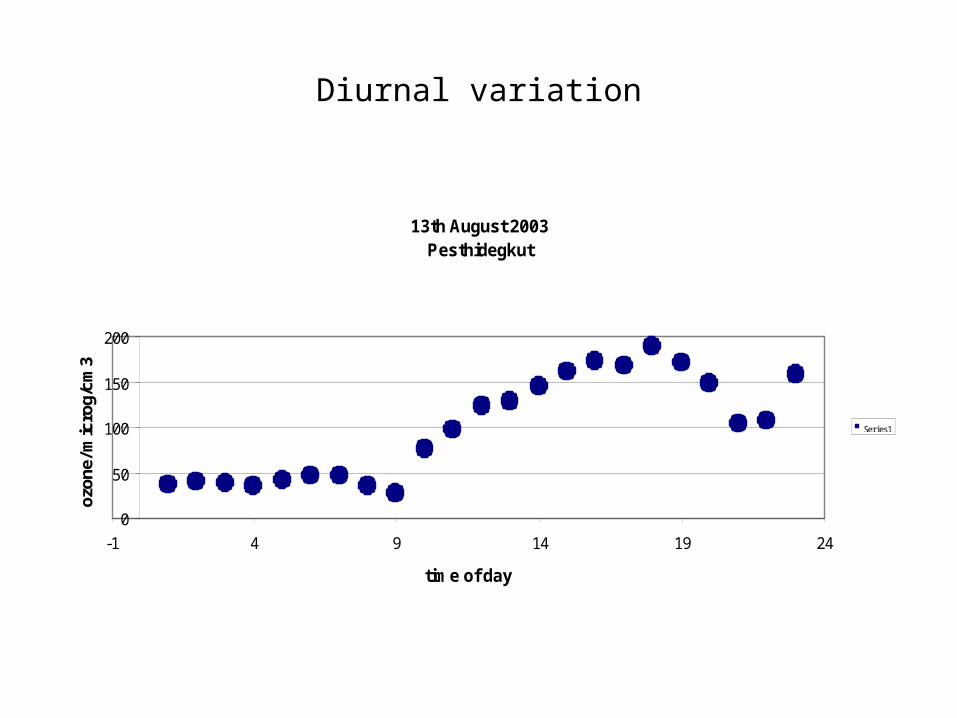
Diurnal variation
13th August 2003Pesthidegkut
0
50
100
150
200
-1 4 9 14 19 24
time of day
ozon
e/ m
icro
g/cm
3
Series1
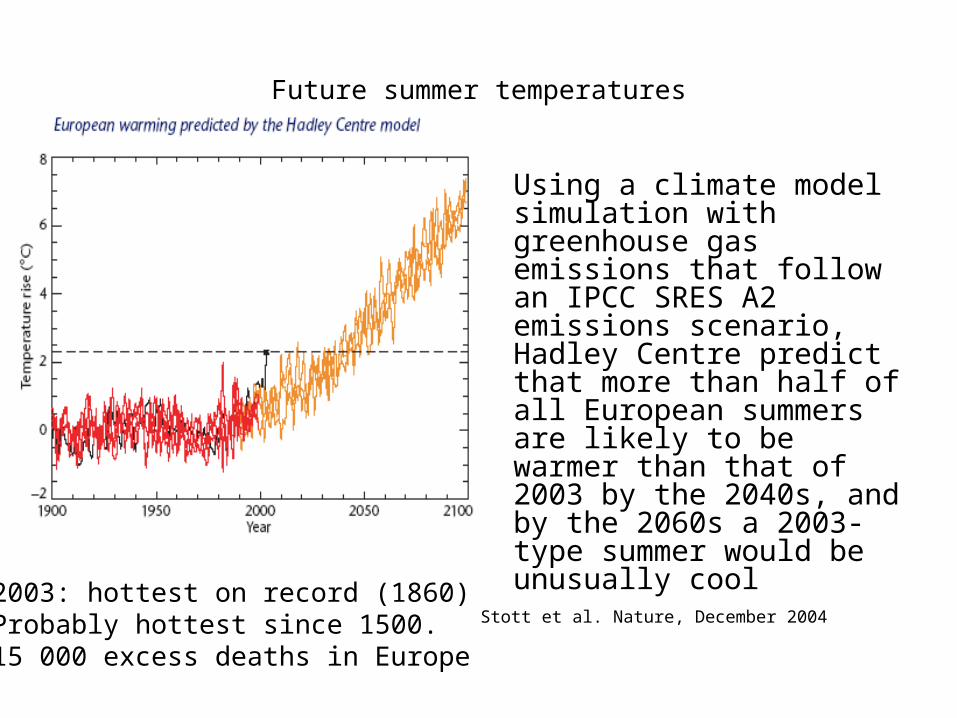
Future summer temperatures
Using a climate model simulation with greenhouse gas emissions that follow an IPCC SRES A2 emissions scenario, Hadley Centre predict that more than half of all European summers are likely to be warmer than that of 2003 by the 2040s, and by the 2060s a 2003-type summer would be unusually cool
Stott et al. Nature, December 20042003: hottest on record (1860)Probably hottest since 1500.15 000 excess deaths in Europe
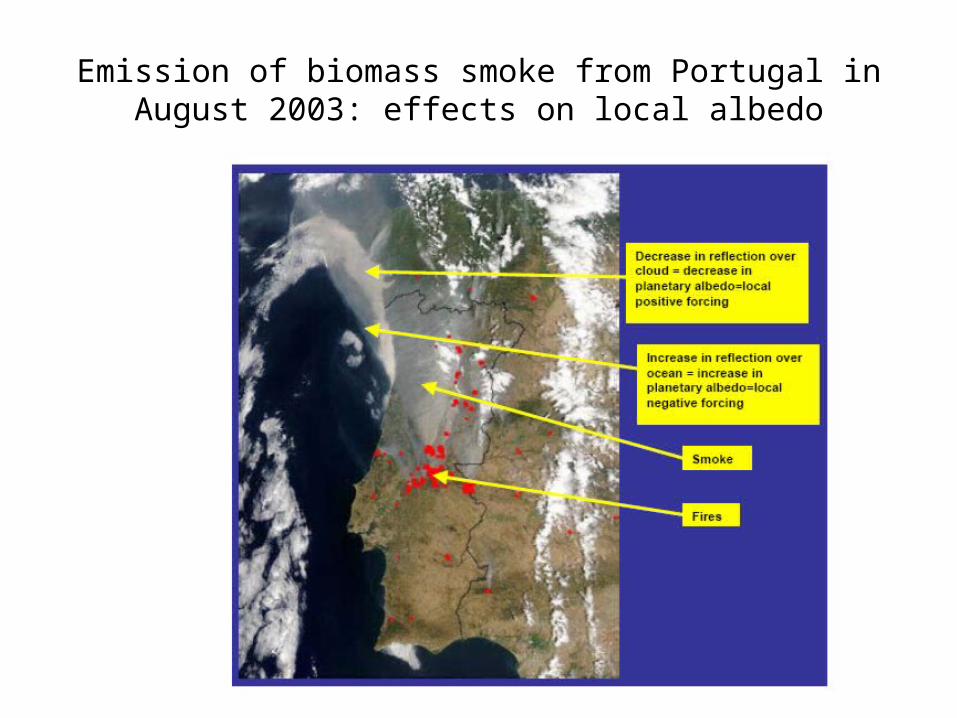
Emission of biomass smoke from Portugal in August 2003: effects on local albedo