atlas of hematology and analysis of peripheral … of hematology and analysis of peripheral blood...
TRANSCRIPT

81e-1CHAPTER 81e
Atlas of Hematology and Analysis of Peripheral Blood Sm
ears
Copyright © 2015 McGraw-Hill Education. All rights reserved.
Atlas of Hematology and Analysis of Peripheral Blood SmearsDan L. Longo
Some of the relevant findings in peripheral blood, enlarged lymph nodes, and bone marrow are illustrated in this chapter. Systematic his-tologic examination of the bone marrow and lymph nodes is beyond the scope of a general medicine textbook. However, every internist should know how to examine a peripheral blood smear.
The examination of a peripheral blood smear is one of the most informative exercises a physician can perform. Although advances in automated technology have made the examination of a peripheral blood smear by a physician seem less important, the technology is not a completely satisfactory replacement for a blood smear interpretation by a trained medical professional who also knows the patient’s clinical history, family history, social history, and physical findings. It is useful to ask the laboratory to generate a Wright’s-stained peripheral blood smear and examine it.
The best place to examine blood cell morphology is the feathered edge of the blood smear where red cells lie in a single layer, side by side, just barely touching one another but not overlapping. The author’s approach is to look at the smallest cellular elements, the platelets, first and work his way up in size to red cells and then white cells.
Using an oil immersion lens that magnifies the cells 100-fold, one counts the platelets in five to six fields, averages the number per field, and multiplies by 20,000 to get a rough estimate of the platelet count. The platelets are usually 1–2 μm in diameter and have a blue granulated appearance. There is usually 1 platelet for every 20 or so red cells. Of course, the automated counter is much more accurate, but gross disparities between the automated and manual counts should be assessed. Large platelets may be a sign of rapid platelet turnover, as young platelets are often larger than old ones; alternatively, certain rare inherited syndromes can produce large platelets. Platelet clumping vis-ible on the smear can be associated with falsely low automated platelet counts. Similarly, neutrophil fragmentation can be a source of falsely elevated automated platelet counts.
Next one examines the red blood cells. One can gauge their size by comparing the red cell to the nucleus of a small lymphocyte. Both are normally about 8 μm wide. Red cells that are smaller than the small lymphocyte nucleus may be microcytic; those larger than the small lymphocyte nucleus may be macrocytic. Macrocytic cells also tend to be more oval than spherical in shape and are sometimes called mac-roovalocytes. The automated mean corpuscular volume (MCV) can assist in making a classification. However, some patients may have both iron and vitamin B12 deficiency, which will produce an MCV in the normal range but wide variation in red cell size. When the red cells vary greatly in size, anisocytosis is said to be present. When the red cells vary greatly in shape, poikilocytosis is said to be present. The elec-tronic cell counter provides an independent assessment of variability in red cell size. It measures the range of red cell volumes and reports the results as “red cell distribution width” (RDW). This value is cal-culated from the MCV; thus, cell width is not being measured but cell volume is. The term is derived from the curve displaying the frequency of cells at each volume, also called the distribution. The width of the red cell volume distribution curve is what determines the RDW. The RDW is calculated as follows: RDW = (standard deviation of MCV ÷ mean MCV) × 100. In the presence of morphologic anisocytosis, RDW (normally 11–14%) increases to 15–18%. The RDW is useful in at least two clinical settings. In patients with microcytic anemia, the differential diagnosis is generally between iron deficiency and thalas-semia. In thalassemia, the small red cells are generally of uniform size with a normal small RDW. In iron deficiency, the size variability and the RDW are large. In addition, a large RDW can suggest a dimorphic anemia when a chronic atrophic gastritis can produce both vitamin B12 malabsorption to produce macrocytic anemia and blood loss to pro-duce iron deficiency. In such settings, RDW is also large. An elevated
RDW also has been reported as a risk factor for all-cause mortality in population-based studies (Patel KV et al: Arch Intern Med 169:515, 2009), a finding that is unexplained currently.
After red cell size is assessed, one examines the hemoglobin content of the cells. They are either normal in color (normochromic) or pale in color (hypochromic). They are never “hyperchromic.” If more than the normal amount of hemoglobin is made, the cells get larger—they do not become darker. In addition to hemoglobin content, the red cells are examined for inclusions. Red cell inclusions are the following:
1. Basophilic stippling—diffuse fine or coarse blue dots in the red cell usually representing RNA residue—especially common in lead poisoning
2. Howell-Jolly bodies—dense blue circular inclusions that repre-sent nuclear remnants—their presence implies defective splenic function
3. Nuclei—red cells may be released or pushed out of the marrow pre-maturely before nuclear extrusion—often implies a myelophthisic process or a vigorous narrow response to anemia, usually hemolytic anemia
4. Parasites—red cell parasites include malaria and babesia (Chap. 250e)
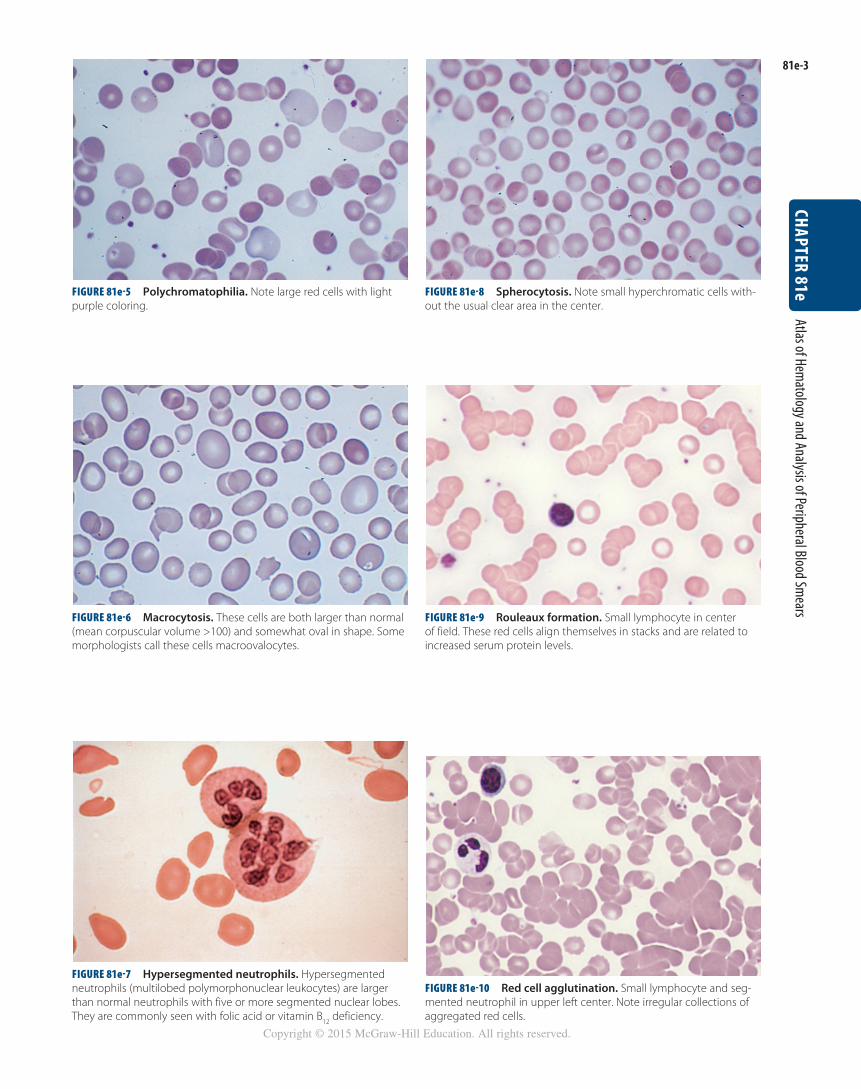
5. Polychromatophilia—the red cell cytoplasm has a bluish hue, reflecting the persistence of ribosomes still actively making hemo-globin in a young red cell
Vital stains are necessary to see precipitated hemoglobin called Heinz bodies.
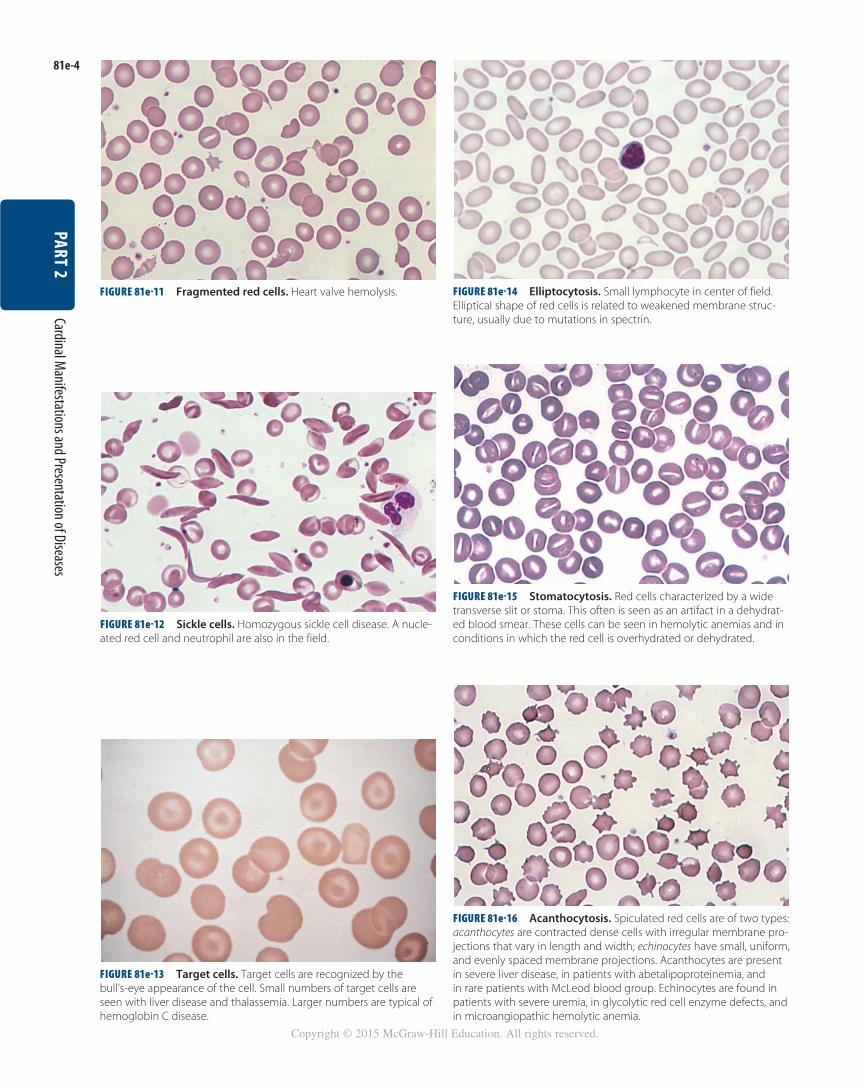
Red cells can take on a variety of different shapes. All abnormally shaped red cells are poikilocytes. Small red cells without the central pallor are spherocytes; they can be seen in hereditary spherocytosis, hemolytic anemias of other causes, and clostridial sepsis. Dacrocytes are teardrop-shaped cells that can be seen in hemolytic anemias, severe iron deficiency, thalassemias, myelofibrosis, and myelodysplastic syn-dromes. Schistocytes are helmet-shaped cells that reflect microangio-pathic hemolytic anemia or fragmentation on an artificial heart valve. Echinocytes are spiculated red cells with the spikes evenly spaced; they can represent an artifact of abnormal drying of the blood smear or reflect changes in stored blood. They also can be seen in renal failure and malnutrition and are often reversible. Acanthocytes are spiculated red cells with the spikes irregularly distributed. This process tends to be irreversible and reflects underlying renal disease, abetalipoprotein-emia, or splenectomy. Elliptocytes are elliptical-shaped red cells that can reflect an inherited defect in the red cell membrane, but they also are seen in iron deficiency, myelodysplastic syndromes, megaloblastic anemia, and thalassemias. Stomatocytes are red cells in which the area of central pallor takes on the morphology of a slit instead of the usual round shape. Stomatocytes can indicate an inherited red cell mem-brane defect and also can be seen in alcoholism. Target cells have an area of central pallor that contains a dense center, or bull’s-eye. These cells are seen classically in thalassemia, but they are also present in iron deficiency, cholestatic liver disease, and some hemoglobinopathies. They also can be generated artifactually by improper slide making.
One last feature of the red cells to assess before moving to the white blood cells is the distribution of the red cells on the smear. In most individuals, the cells lie side by side in a single layer. Some patients have red cell clumping (called agglutination) in which the red cells pile upon one another; it is seen in certain paraproteinemias and autoim-mune hemolytic anemias. Another abnormal distribution involves red cells lying in single cell rows on top of one another like stacks of coins. This is called rouleaux formation and reflects abnormal serum protein levels.
Finally, one examines the white blood cells. Three types of granu-locytes are usually present: neutrophils, eosinophils, and basophils, in decreasing frequency. Neutrophils are generally the most abundant white cell. They are round, are 10–14 μm wide, and contain a lobulated nucleus with two to five lobes connected by a thin chromatin thread. Bands are immature neutrophils that have not completed nuclear condensation and have a U-shaped nucleus. Bands reflect a left shift in neutrophil maturation in an effort to make more cells more rapidly.
81e

81e-2
PART 2Cardinal M
anifestations and Presentation of Diseases
Copyright © 2015 McGraw-Hill Education. All rights reserved.
Neutrophils can provide clues to a variety of conditions. Vacuolated neutrophils may be a sign of bacterial sepsis. The presence of 1- to 2-μm blue cytoplasmic inclusions, called Döhle bodies, can reflect infections, burns, or other inflammatory states. If the neutrophil granules are larger than normal and stain a darker blue, “toxic granula-tions” are said to be present, and they also suggest a systemic inflam-mation. The presence of neutrophils with more than five nuclear lobes suggests megaloblastic anemia. Large misshapen granules may reflect the inherited Chédiak-Higashi syndrome.
Eosinophils are slightly larger than neutrophils, have bilobed nuclei, and contain large red granules. Diseases of eosinophils are associated with too many of them rather than any morphologic or qualitative change. They normally total less than one-thirtieth the number of neu-trophils. Basophils are even rarer than eosinophils in the blood. They have large dark blue granules and may be increased as part of chronic myeloid leukemia.
Lymphocytes can be present in several morphologic forms. Most common in healthy individuals are small lymphocytes with a small dark nucleus and scarce cytoplasm. In the presence of viral infections, more of the lymphocytes are larger, about the size of neutrophils, with
abundant cytoplasm and a less condensed nuclear chromatin. These cells are called reactive lymphocytes. About 1% of lymphocytes are larger and contain blue granules in a light blue cytoplasm; they are called large granular lymphocytes. In chronic lymphoid leukemia, the small lymphocytes are increased in number, and many of them are rup-tured in making the blood smear, leaving a smudge of nuclear material without a surrounding cytoplasm or cell membrane; they are called smudge cells and are rare in the absence of chronic lymphoid leukemia.
Monocytes are the largest white blood cells, ranging from 15 to 22 μm in diameter. The nucleus can take on a variety of shapes but usually appears to be folded; the cytoplasm is gray.
Abnormal cells may appear in the blood. Most often the abnormal cells originate from neoplasms of bone marrow–derived cells, includ-ing lymphoid cells, myeloid cells, and occasionally red cells. More rarely, other types of tumors can get access to the bloodstream, and rare epithelial malignant cells may be identified. The chances of see-ing such abnormal cells is increased by examining blood smears made from buffy coats, the layer of cells that is visible on top of sedimenting red cells when blood is left in the test tube for an hour. Smears made from finger sticks may include rare endothelial cells.
Figure 81e-1 Normal peripheral blood smear. Small lymphocyte in center of field. Note that the diameter of the red blood cell is similar to the diameter of the small lymphocyte nucleus.
Figure 81e-2 Reticulocyte count preparation. This new methylene blue–stained blood smear shows large numbers of heavily stained reticulocytes (the cells containing the dark blue–staining RNA precipitates).
Figure 81e-3 Hypochromic microcytic anemia of iron deficiency. Small lymphocyte in field helps assess the red blood cell size.
Figure 81e-4 Iron deficiency anemia next to normal red blood cells. Microcytes (right panel) are smaller than normal red blood cells (cell diameter <7 μm) and may or may not be poorly hemoglobinized (hypochromic).
81e-3CHAPTER 81e
Atlas of Hematology and Analysis of Peripheral Blood Sm
ears
Copyright © 2015 McGraw-Hill Education. All rights reserved.
Figure 81e-6 Macrocytosis. These cells are both larger than normal (mean corpuscular volume >100) and somewhat oval in shape. Some morphologists call these cells macroovalocytes.
Figure 81e-5 Polychromatophilia. Note large red cells with light purple coloring.
Figure 81e-7 Hypersegmented neutrophils. Hypersegmented neutrophils (multilobed polymorphonuclear leukocytes) are larger than normal neutrophils with five or more segmented nuclear lobes. They are commonly seen with folic acid or vitamin B
12 deficiency.
Figure 81e-8 Spherocytosis. Note small hyperchromatic cells with-out the usual clear area in the center.
Figure 81e-9 Rouleaux formation. Small lymphocyte in center of field. These red cells align themselves in stacks and are related to increased serum protein levels.
Figure 81e-10 Red cell agglutination. Small lymphocyte and seg-mented neutrophil in upper left center. Note irregular collections of aggregated red cells.
81e-4
PART 2Cardinal M
anifestations and Presentation of Diseases
Copyright © 2015 McGraw-Hill Education. All rights reserved.
Figure 81e-16 Acanthocytosis. Spiculated red cells are of two types: acanthocytes are contracted dense cells with irregular membrane pro-jections that vary in length and width; echinocytes have small, uniform, and evenly spaced membrane projections. Acanthocytes are present in severe liver disease, in patients with abetalipoproteinemia, and in rare patients with McLeod blood group. Echinocytes are found in patients with severe uremia, in glycolytic red cell enzyme defects, and in microangiopathic hemolytic anemia.
Figure 81e-11 Fragmented red cells. Heart valve hemolysis.
Figure 81e-12 Sickle cells. Homozygous sickle cell disease. A nucle-ated red cell and neutrophil are also in the field.
Figure 81e-13 Target cells. Target cells are recognized by the bull’s-eye appearance of the cell. Small numbers of target cells are seen with liver disease and thalassemia. Larger numbers are typical of hemoglobin C disease.
Figure 81e-14 Elliptocytosis. Small lymphocyte in center of field. Elliptical shape of red cells is related to weakened membrane struc-ture, usually due to mutations in spectrin.
Figure 81e-15 Stomatocytosis. Red cells characterized by a wide transverse slit or stoma. This often is seen as an artifact in a dehydrat-ed blood smear. These cells can be seen in hemolytic anemias and in conditions in which the red cell is overhydrated or dehydrated.
81e-5CHAPTER 81e
Atlas of Hematology and Analysis of Peripheral Blood Sm
ears
Copyright © 2015 McGraw-Hill Education. All rights reserved.
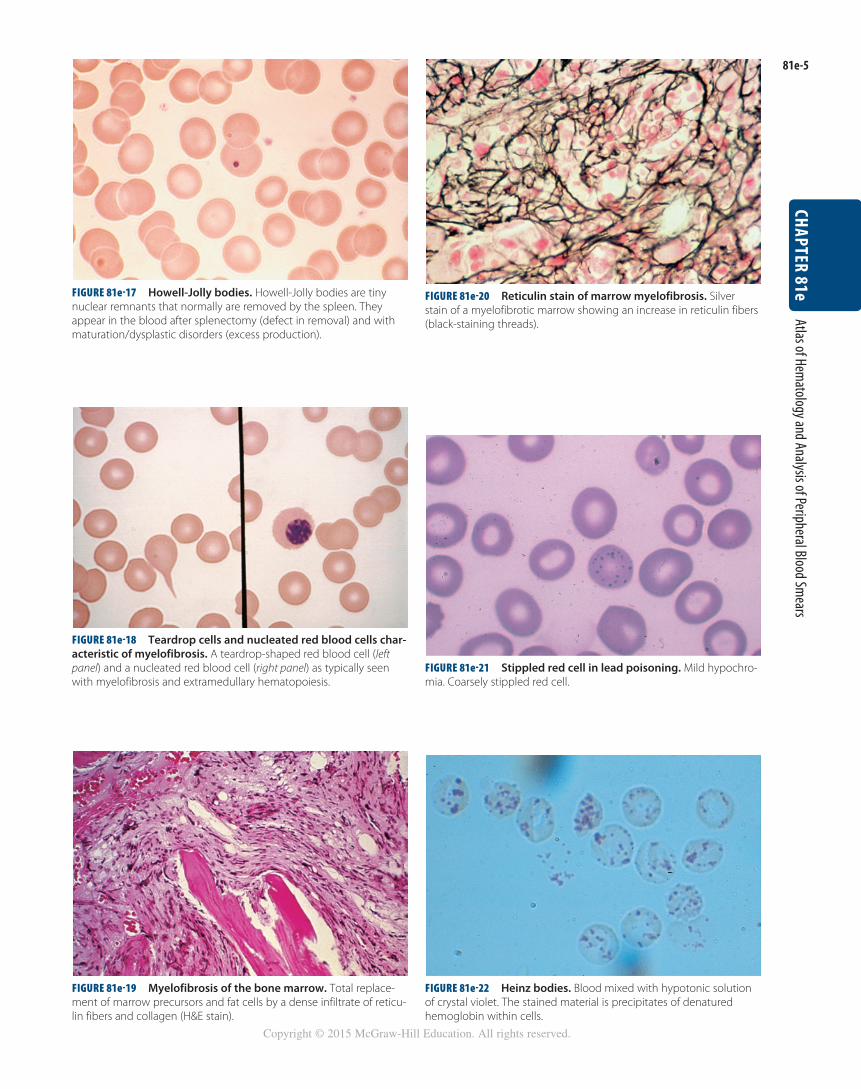
Figure 81e-17 Howell-Jolly bodies. Howell-Jolly bodies are tiny nuclear remnants that normally are removed by the spleen. They appear in the blood after splenectomy (defect in removal) and with maturation/dysplastic disorders (excess production).
Figure 81e-18 Teardrop cells and nucleated red blood cells char-acteristic of myelofibrosis. A teardrop-shaped red blood cell (left panel) and a nucleated red blood cell (right panel) as typically seen with myelofibrosis and extramedullary hematopoiesis.
Figure 81e-19 Myelofibrosis of the bone marrow. Total replace-ment of marrow precursors and fat cells by a dense infiltrate of reticu-lin fibers and collagen (H&E stain).
Figure 81e-20 Reticulin stain of marrow myelofibrosis. Silver stain of a myelofibrotic marrow showing an increase in reticulin fibers (black-staining threads).
Figure 81e-21 Stippled red cell in lead poisoning. Mild hypochro-mia. Coarsely stippled red cell.
Figure 81e-22 Heinz bodies. Blood mixed with hypotonic solution of crystal violet. The stained material is precipitates of denatured hemoglobin within cells.

81e-6
PART 2Cardinal M
anifestations and Presentation of Diseases
Copyright © 2015 McGraw-Hill Education. All rights reserved.
Figure 81e-24 Normal granulocytes. The normal granulocyte has a segmented nucleus with heavy, clumped chromatin; fine neutrophilic granules are dispersed throughout the cytoplasm.
Figure 81e-26 Normal eosinophils. The film was prepared from the buffy coat of the blood from a normal donor. E, eosinophil; L, lymphocyte; N, neutrophil.
Figure 81e-23 Giant platelets. Giant platelets, together with a marked increase in the platelet count, are seen in myeloproliferative disorders, especially primary thrombocythemia.
Figure 81e-25 Normal monocytes. The film was prepared from the buffy coat of the blood from a normal donor. L, lymphocyte; M, monocyte; N, neutrophil.
Figure 81e-27 Normal basophil. The film was prepared from the buffy coat of the blood from a normal donor. B, basophil; L, lymphocyte.
Figure 81e-28 Pelger-Hüet anomaly. In this benign disorder, the majority of granulocytes are bilobed. The nucleus frequently has a spectacle-like, or “pince-nez,” configuration.

81e-7CHAPTER 81e
Atlas of Hematology and Analysis of Peripheral Blood Sm
ears
Copyright © 2015 McGraw-Hill Education. All rights reserved.
Figure 81e-34 Lymphoma in the bone marrow. Nodular (follicular) lymphoma infiltrate in a marrow biopsy specimen. Note the character-istic paratrabecular location of the lymphoma cells.
Figure 81e-30 Chédiak-Higashi disease. Note giant granules in neutrophil.
Figure 81e-31 Normal bone marrow. Low-power view of normal adult marrow (hematoxylin and eosin [H&E] stain), showing a mix of fat cells (clear areas) and hematopoietic cells. The percentage of the space that consists of hematopoietic cells is referred to as marrow cellularity. In adults, normal marrow cellularity is 35–40%. If demands for increased marrow production occur, cellularity may increase to meet the demand. As people age, the marrow cellularity decreases and the marrow fat increases. Patients >70 years old may have a 20–30% marrow cellularity.
Figure 81e-32 Aplastic anemia bone marrow. Normal hematopoi-etic precursor cells are virtually absent, leaving behind fat cells, reticu-loendothelial cells, and the underlying sinusoidal structure.
Figure 81e-33 Metastatic cancer in the bone marrow. Marrow biopsy specimen infiltrated with metastatic breast cancer and reactive fibrosis (H&E stain).
Figure 81e-29 Döhle body. Neutrophil band with Döhle body. The neutrophil with a sausage-shaped nucleus in the center of the field is a band form. Döhle bodies are discrete, blue-staining nongranular areas found in the periphery of the cytoplasm of the neutrophil in infections and other toxic states. They represent aggregates of rough endoplasmic reticulum.

81e-8
PART 2Cardinal M
anifestations and Presentation of Diseases
Copyright © 2015 McGraw-Hill Education. All rights reserved.
A B
C D
Figure 81e-38 Prussian blue staining of marrow iron stores. Iron stores can be graded on a scale of 0 to 4+. A. A marrow with excess iron stores (>4+); B. normal stores (2–3+); C. minimal stores (1+); and D. absent iron stores (0).
Figure 81e-36 Myeloid hyperplasia of the marrow. Marrow aspi-rate specimen showing a myeloid/erythroid ratio of ≥3:1, suggesting either a loss of red blood cell precursors or an expansion of myeloid elements.
Figure 81e-37 Megaloblastic erythropoiesis. High-power view of megaloblastic red blood cell precursors from a patient with a macrocytic anemia. Maturation is delayed, with late normoblasts showing a more immature-appearing nucleus with a lattice-like pattern with normal cyto-plasmic maturation.
Figure 81e-35 Erythroid hyperplasia of the marrow. Marrow aspirate specimen with a myeloid/erythroid ratio (M/E ratio) of 1:1–2, typical for a patient with a hemolytic anemia or one recovering from blood loss.

81e-9CHAPTER 81e
Atlas of Hematology and Analysis of Peripheral Blood Sm
ears
Copyright © 2015 McGraw-Hill Education. All rights reserved.
Figure 81e-42 Acute erythroleukemia. Note giant dysmorphic erythroblasts; two are binucleate, and one is multinucleate.
Figure 81e-40 Acute myeloid leukemia. Leukemic myeloblast with an Auer rod. Note two to four large, prominent nucleoli in each cell.
Figure 81e-41 Acute promyelocytic leukemia. Note prominent cytoplasmic granules in the leukemia cells.
Figure 81e-39 Ringed sideroblast. An orthochromatic normoblast with a collar of blue granules (mitochondria encrusted with iron) sur-rounding the nucleus.
Figure 81e-43 Acute lymphoblastic leukemia.
Figure 81e-44 Burkitt’s leukemia, acute lymphoblastic leukemia.

81e-10
PART 2Cardinal M
anifestations and Presentation of Diseases
Copyright © 2015 McGraw-Hill Education. All rights reserved.
Figure 81e-45 Chronic myeloid leukemia in the peripheral blood.
Figure 81e-46 Chronic lymphoid leukemia in the peripheral blood.
Figure 81e-47 Sézary’s syndrome. Lymphocytes with frequently convoluted nuclei (Sézary cells) in a patient with advanced mycosis fungoides.
Figure 81e-48 Adult T cell leukemia. Peripheral blood smear show-ing leukemia cells with typical “flower-shaped” nucleus.
Figure 81e-49 Follicular lymphoma in a lymph node. The normal nodal architecture is effaced by nodular expansions of tumor cells. Nodules vary in size and contain predominantly small lymphocytes with cleaved nuclei along with variable numbers of larger cells with vesicular chromatin and prominent nucleoli.
Figure 81e-50 Diffuse large B cell lymphoma in a lymph node. The neoplastic cells are heterogeneous but predominantly large cells with vesicular chromatin and prominent nucleoli.

81e-11CHAPTER 81e
Atlas of Hematology and Analysis of Peripheral Blood Sm
ears
Copyright © 2015 McGraw-Hill Education. All rights reserved.
Figure 81e-51 Burkitt’s lymphoma in a lymph node. Burkitt’s lym-phoma with starry-sky appearance. The lighter areas are macrophages attempting to clear dead cells.
Figure 81e-52 Erythrophagocytosis accompanying aggressive lymphoma. The central macrophage is ingesting red cells, neutro-phils, and platelets. (Courtesy of Dr. Kiyomi Tsukimori, Kyushu University, Fukuoka, Japan.)
Figure 81e-53 Hodgkin’s disease. A Reed-Sternberg cell is present near the center of the field; a large cell with a bilobed nucleus and prominent nucleoli giving an “owl’s eyes” appearance. The majority of the cells are normal lymphocytes, neutrophils, and eosinophils that form a pleiomorphic cellular infiltrate.
Figure 81e-54 Lacunar cell; Reed-Sternberg cell variant in nodular sclerosing Hodgkin’s disease. High-power view of single mononuclear lacunar cell with retracted cytoplasm in a patient with nodular scleros-ing Hodgkin’s disease.
Figure 81e-56 Multiple myeloma.
Figure 81e-55 Normal plasma cell.

81e-12
PART 2Cardinal M
anifestations and Presentation of Diseases
Copyright © 2015 McGraw-Hill Education. All rights reserved.
AcknowledgmentFigures in this e-chapter were borrowed from Williams Hematology, 7th edition, M Lichtman et al (eds). New York, McGraw-Hill, 2005; Hematology in General Practice, 4th edition, RS Hillman, KA Ault, New York, McGraw-Hill, 2005.
Figure 81e-57 Serum color in hemoglobinemia. The distinctive red coloration of plasma (hemoglobinemia) in a spun blood sample in a patient with intravascular hemolysis.