assimilating immigrants the impact of an integration program · assimilating immigrants the impact...
TRANSCRIPT

Assimilating Immigrants
The Impact of an Integration Program
Matti Sarvimäki and Kari Hämäläinen
NORFACE MIGRATION Discussion Paper No. 2011-15
www.norface-migration.org
Assimilating Immigrants
The Impact of an Integration Program∗
Matti Sarvimäki Kari Hämäläinen
August 2010
Abstract
Immigration policy design is an important and controversial topic
in most developed countries. We inform this debate by evaluating
the e�ects of an integration program for immigrants to Finland. The
program consists of an individualized sequence of training and sub-
sidized employment. Non-compliance is sanctioned by reductions in
welfare bene�ts. Our empirical strategy exploits a discontinuity that
made participation obligatory in May 1999 only for those who had
entered the population register after May 1997. The results suggest
that the program strongly increased the employment and earnings of
immigrants and reduced their dependency on social bene�ts.
JEL Classi�cation: J61, J68, H53, I38
Keywords: Immigrants, assimilation, integration programs, regression-discontinuity∗We thank David Card, Mika Haapanen, Kristiina Huttunen, Guy Michaels, Steve
Pischke, Roope Uusitalo, Olof Åslund and seminar participants at HECER, IFAU, LSE,VATT, the Nordic Migration Workshop, the Society for Labor Economists, the SummerMeeting of Finnish Economists and Workshop on New Aspects of Active Labour MarketPolicies for helpful comments and discussions. Financial support from the NORFACEproject �Migration: Integration, Impact and Interaction� and the Academy of Finlandproject �Activation Policies and Basic Security� is gratefully acknowledged. Sarvimäkialso acknowledges �nancial support from the Jenny and Antti Wihuri Foundation and theYrjö Jahnsson Foundation. The National Institute for Health and Welfare kindly provideddata on social assistance. The usual disclaimer applies. Sarvimäki (corresponding author):Aalto University School of Economics, Government Institute for Economic Research andLondon School of Economics; matti.sarvimaki@hse.�. Hämäläinen: Government Institutefor Economic Research; kari.hamalainen@vatt.�.
1
1 Introduction
Immigrants perform worse in the labor market and collect more social ben-
e�ts than comparable natives. This empirical fact has made immigration a
central theme in many recent elections and pushed governments to reform
their immigration policies. Salient reforms include improved border con-
trols, changes to visa systems, stricter eligibility rules for public bene�ts and
the setting up of mandatory integration programs. The reforms have often
provoked considerable controversy. Yet, we know little about their impacts.
In this paper, we examine the e�ects of �integration plans� introduced in
Finland in the late 1990s. This program shares key features with integra-
tion measures also implemented in other European countries and in North
America.1 Most importantly, the integration plans consist of an individual-
ized sequence of training and subsidized employment, and non-compliance
is sanctioned by reductions in welfare bene�ts.
We focus on Finland due to the quality of the data and the research
design. Our longitudinal dataset is created by linking several administrative
registers at individual and family level. The research design is based on the
phase-in rules of a policy reform. The program was launched on May 1st,
1999, but only those who had entered the population register after May 1st,
1997 had an obligation to participate. This discontinuity allows us to iden-
tify the causal e�ect of the program under the assumption that immigrants
entering the population register just before and after the threshold date are
comparable. This identifying assumption seems plausible as the threshold
date was set more than a year after the a�ected immigrants had made their
entry decisions. Furthermore, our approach survives a battery of robustness
checks and falsi�cation exercises.
We �nd that the integration plans improved the labor market perfor-
mance of immigrants and reduced their welfare dependency. The point es-1The Finnish program closely resembles the Immigration Settlement and Adaption
Program (ISAP) in Canada (CIC, 2005). In Europe, comparable programs are presentin Austria, Belgium, Denmark, France, Germany, the Netherlands, Portugal, Spain andSweden (Carrera, 2006; Joppke, 2007). Integration programs are less common in theUnited States, but some training is provided by state and local governments and by non-governmental organizations (Schmidt, 2007).
2
timates suggest that the e�ects were large. To interpret these results, we
examine the size and characteristics of the �compliers� (those who were in-
duced to particiapte in the program due to the date rule) and the impact
of the reform on training and incentives. We �nd that roughly a third of
all immigrants were compliers and that the most disadvantaged groups were
disproportionally presented. A review of the pre- and post-reform legislation
suggests that the reform did not change the sanctioning of non-compliance.
Instead, the main change was in allowing immigrants to retain their unem-
ployment bene�ts while participating in training provided outside the Labor
Administration. These courses typically focus on language training. Further-
more, we also document a rise in the provision of courses speci�cally designed
for immigrants within the Labor Administration. Thus the reform appears
to have worked primarily through the building up of host-country-speci�c
human capital.
These �ndings add to the vast literature on the assimilation of immi-
grants. Previous work has shown that immigrants experience rapid earnings
and employment growth over time in the host country.2 However, only a
handful of studies have examined whether government policies can help in
this process. Åslund and Johansson (2006) document a positive association
between the introduction of �supported employment methods� in Swedish
municipalities and improvements in immigrant employment in these loca-
tions. Rosholm and Vejlin (2007) show that lowering public income transfers
to newly admitted refugees to Denmark had a small positive e�ect on their
job �nding rate. Cohen-Goldner and Eckstein (2008, 2010) conclude that
training programs substantially increased job-o�er rates and had a small
positive e�ect on wages among immigrants from the former Soviet Union to
Israel.3
2Studies documenting immigrants' labor market performance and use of social bene�tsin the United States include, but are not limited to, Chiswick (1978), Borjas (1985), Borjasand Trejo (1990), Borjas (1995), Borjas and Hilton (1996), Hu (2000), Lubotsky (2007).Sarvimäki (forthcoming) examines the economic performance of immigrants to Finland.See Borjas (1994) and Boeri et al. (2002) for surveys.
3Some studies have also examined the impact of other policies aimed at reducing im-migrants' dependency on public bene�ts. For instance, Borjas (1993) and Antecol et al.(2003) discuss the e�ectiveness of point system policies, and Borjas (2002) examines the
3

In comparison to the previous studies, our research design allows for a
causal interpretation under weak assumptions. In particular, we complement
the structural estimates by Cohen-Goldner and Eckstein (2008, 2010), which
suggest that returns to local human capital are very high. Furthermore, to
the best of our knowledge, we are the �rst to examine an explicit integration
program. Thus our results directly inform a policy debate that remains active
in many countries. In addition, these �ndings may be helpful for countries
that do not currently invest in integration programs, but might bene�t from
doing so.
The rest of this paper is organized as follows. The next section provides
background information on immigrants to Finland and details on the reform.
We discuss our empirical strategy in Section 3 and present the data in Section
4. Section 5 reports the results and robustness checks and discusses the
interpretation of the estimates. Section 6 concludes.
2 Background
2.1 Immigration to Finland
For most of its history, Finland has been characterized by emigration. Con-
sequently, immigrants have primarily been return migrants and their family
members. Genuine immigration only began in the early 1990s, after which
the immigrant population has grown �vefold. Given the low initial level,
however, their share of the population is still relatively low, being roughly
three per cent in 2009.
As in other Western countries, increasing immigration was accompanied
by a change in the composition of origin countries. In 1990, almost half of the
immigrants came from Western Europe. Today, the bulk of immigrants come
from the former Soviet Union and Asia. The trend of a declining proportion
of Western Europeans coincides with the experience of most other OECD
countries. However, the share of immigrants from the former Soviet Union is
unusually high in Finland. In addition, refugees�primarily from Iran, Iraq,
impact of the 1996 U.S. welfare reform on immigrant households.
4
Somalia and former Yugoslavia�make up roughly a sixth of the immigrant
population.
While statistics on the reasons for immigration are incomplete, it is
widely agreed that the proportion of economic migrants is low. This is
likely to explain the poor economic performance of immigrants in Finland.
Upon arrival, their employment rates are very low and hence they earn sub-
stantially less than comparable natives. While the gap decreases over time,
only the earnings of men from the OECD countries have converged to the
earnings of comparable natives within twenty years of arrival (Sarvimäki,
forthcoming). As everyone living in Finland on a permanent basis is eligible
for social bene�ts, low earnings lead to high average social bene�ts among
immigrant households.4
2.2 The Reform
This paper examines the impacts of a program that was introduced as a part
of the Act on the Integration of Immigrants and Reception of Asylum Seekers
(henceforth the Integration Act). The Integration Act came in force in May
1st, 1999 with the aim of promoting integration, equality and freedom of
choice by providing measures that help immigrants to acquire information
and skills needed in Finnish society. In practice, it introduced two reforms.
First, it set new rules for the division of responsibilities between the central
and local administrations (municipalities) and required the latter to prepare
municipality-level integration programs. The aim was to reallocate existing
resources more e�ciently, to train sta�, and to improve co-operation between
all local authorities involved in immigrant integration. This part of the
Integration Act is likely to a�ect all immigrants and its impacts are therefore
di�cult to evaluate.
The second part of the reform only a�ected some arrival cohorts. The In-
tegration Act introduced an obligation to draw-up individualized integration
4Eligibility for most Finnish social security is based on permanent residence. Themain exceptions are earnings-related unemployment bene�ts and pensions. Furthermore,eligibility for a student allowance requires that a non-citizen has migrated to Finland foranother purpose than to study.
5

plans for recently arrived non-working immigrants. These plans consist of a
sequence of language courses, other preparatory and/or vocational training,
career counseling, rehabilitation, work practice, and so forth. The aim is
to closely consider the individual characteristics of each immigrant and to
design a sequence of measures that is expected to best �t his or her needs.
Eligibility for an integration plan requires that the immigrant (a) is a
registered unemployed job-seeker or lives in a household that receives so-
cial assistance and (b) has entered the population register within the past
three years.5 When these criteria are ful�lled, an integration plan has to be
drawn-up within the �rst �ve months of a period of unemployment or social
assistance. The integration plan is prepared in a joint meeting between an
immigrant, a representative of a local employment o�ce and, if necessary,
an interpreter. During this meeting, a sequence of training and other mea-
sures is prepared and dates for monitoring visits are agreed. Particular care
is taken to ensure that the immigrant fully understands the measures he
or she is expected to participate in and knows how to gain access to them.
The integration plan is aborted if the immigrant �nds permanent, full-time
employment or becomes a full-time student. (Ministry of Labour, 2003)
Eligibility is combined with an obligation to participate. Refusal to par-
ticipate in the preparation process or failure to follow the plan is sanctioned
by a reduction in social bene�ts. These sanctions would typically reduce
the bene�ts by 20�40 percent from a baseline level of roughly 500 euros per
month.
Importantly, the obligation to participate only applies to those who en-
tered the population register after May 1st, 1997. Earlier cohorts have a
right, but not an obligation, to demand an integration plan. As we discuss
in more detail below, we will exploit this date rule to evaluate the impact
5Social assistance is the last resort of economic assistance in Finland. It is means-tested based on a household's assets, expenses and income. Immigrants have to registerto the population register in order to be issued a personal identity code. This creates astrong incentive to register soon upon arrival as the code is required, among other things,for applying for bene�ts, for the payment of wages and for opening a bank account.Furthermore, immigrants who intend to stay in Finland for over a year are required toregister.
6
of receiving an integration plan. Before turning to the empirical strategy,
however, we review the available information on how the reform changed the
assistance provided to immigrants.
2.3 Changes to Training and Incentives
Before the Integration Act, immigrants and natives were treated similarly in
terms of services provided by local employment agencies and eligibility for
social security (Government Proposal for the Integration Act, 1998). Thus
training o�ered to immigrants competed with that o�ered to natives. To re-
ceive unemployment bene�ts, an immigrant had to register in an employment
o�ce as a job seeker regardless of his or her language skills. Employment
agencies o�ered language courses as a part of labor market training, but the
supply of the courses did not meet the demand. Only half of the immigrants
received language courses soon after arrival. Furthermore, waiting periods
between courses could expand to several years due to the lack of resources.
The Integration Act changed the allocation and the supply of labor mar-
ket measures. Better information and planning were likely to allocate the
existing supply of training more e�ciently among immigrants. Furthermore,
the Integration Act introduced the concept of �comparable labor market
measures�. These are courses, training, work coaching and the like o�ered
outside the Labor Administration (e.g. in adult education centers and uni-
versities). Provided that the Labor Administration accepts the course, an
immigrant maintains the eligibility for social bene�ts during the participa-
tion period. Previously, participation in such training had to be �nanced
by student loans or student grants, which were not available for individual
courses.6 As a result, immigrant training outside the Labor Administration
was virtually nonexistent prior to the reform. The number of immigrants
participating in comparable measures took o� rapidly after the introduction
of the Integration Act.7
6We note that all unemployed persons who have worked for more than ten years inFinland have been allowed to educate themselves with the aid of the sum equivalent tounemployment bene�ts from 1998 onwards. However, the precondition of ten years ofFinnish work experience ruled out virtually all unemployed immigrants in the late 1990s.
7The data on comparable training are scarce and cannot be linked to our individual-
7
In contrast, there was no change in the sanctioning of non-compliance.
While the Integration Act made an explicit reference to sanctions, they were
based on the existing legislation governing unemployment bene�ts and social
assistance (Government Proposal for the Integration Act, 1998). Of course,
we cannot rule out that the reform could have increased awareness of sanc-
tions or monitoring. However, monitoring of the unemployed�regardless
of their immigrant status�was already present before the Integration Act.
Thus immigrants arriving shortly before and after May 1997 seem to have
faced the same threat of sanctions.
3 Empirical Strategy
Our empirical strategy is based on the phase-in rule of the reform that only
made participation obligatory for immigrants entering the population regis-
ter after May 1st, 1997. This rule creates a research design that resembles
the situation where immigrants had been randomized between treatment and
control groups. More precisely, we are able to uncover the causal e�ect of
the treatment, at least for a subpopulation of the immigrants, under two
identifying assumptions. First, those entering the register just before and
after May 1997 need to be comparable. Formally, potential outcomes given
the date of entry are assumed to be continuous at the threshold. We argue
that this is a plausible assumption given that immigrants arriving around
May 1997 made their entry decisions two years before the Integration Act
was introduced.8 Hence, they were not able to self-select into the treatment
or control group by choosing when to register. Furthermore, there were
no other policy reforms that would have a�ected potential outcomes at the
threshold. The second identifying assumption is local monotonicity. That
level data. Thus we cannot assess its role directly. However, the available sources suggestthat it is very popular. According to Ministry of Labour (2005), for example, the number ofparticipants in comparable training exceeds the number of participants in courses providedby the Labor Administration in the capital region of Helsinki (where the majority ofimmigrants are settled).
8The threshold date was published on May 8th, 1998 when the government introducedthe bill to the parliament. Next day, the leading Finnish newspaper, Helsingin Sanomat,
had a short article about the bill, but did not discuss this threshold date.
8

is, we need to assume that the probability of being treated did not decrease
for anyone who entered the population register after May 1st, 1997 rather
than before. It seems very unlikely that this assumption would be violated.
Given these assumptions, the causal e�ect of the treatment can be eval-
uated with the local Wald estimator
β =y+ − y−
p+ − p−(1)
where y+ = limz↓z0 E [yi|zi = z] is the limit of the outcome y in expectation
when approaching the threshold z0 from above and y− = limz↑z0 E [yi|zi = z]
is the limit from below (Hahn et al., 2001). In our application, the forcing
variable z is the date of entering the population register and the thresh-
old z0 is May 1st, 1997. Similarly p+ = limz↓z0 E [Di|zi = z] and p− =
limz↑z0 E [Di|zi = z] are the limits for the probability of being treated when
approaching the threshold from above and below.
There are two widely used approaches to estimate equation (1): the
local linear estimator discussed by Hahn et al. (2001) and the parametric
approach adopted by van der Klaauw (2002). We employ the latter due to
the relatively small sample size.9
Our baseline estimation equation is
yi = α+ βE [Di|zi, Xi] +Xiθ + k (zi) + ui (2)
where Di is an indicator variable for receiving an integration plan, Xi is a
vector of observed background characteristics, k (zi) is a function of the date
of entering the population register and ui summarizes unobserved factors
a�ecting the outcome. The probability of being treated is modeled as
E [Di|zi, Xi] = γ1 {zi > z0}+Xiψ + g (zi) (3)
9We have also experimented with local linear estimates. However, to obtain su�cientstatistical power to reveal even very large e�ects, the sample size requires us to use widebandwidths (up to several years on both sides of the threshold date). Clearly, using suchbandwidths cannot be considered as a truly nonparametric approach. In any case, thepoint estimates are stable across alternative bandwidths and similar to those reported inthis paper.
9

The key idea is that the underlying dependence between the date of
arrival and the outcome is controlled by the smooth term k (zi). In our
context, this dependence follows from the assimilation process: the labor
market performance of immigrants tends to improve as they spend more time
in the host country. Failing to take this into account would lead to biased
estimates. Similarly, as we discuss in more detail below, the likelihood of
being treated was greater among later cohorts than among those entering
the population register just after the threshold. This process is controlled
for by g (zi). If k (zi) and g (zi) are smooth over the range of arrival dates,
a discontinuous jump in E [Di|zi, Xi] allows for consistent estimation of the
causal e�ect of the treatment for the subpopulation of �compliers�.10 On
the other hand, conditioning for the background characteristics, Xi, is not
required for consistency, but may improve precision.
In practice, the relatively small sample size forces us to use a parsimo-
nious parameterization of k (zi) and g (zi), and this adds a third assumption
to our identi�cation strategy. Namely, we need to assume that the choice of
the functional form is reasonable. Since the true form of these functions is
unknown, we experiment with several alternative parameterizations. In all
speci�cations, we use the same functional form for k (zi) and g (zi), which
allows us to implement the estimation using a standard 2SLS procedure.
Since we observe the forcing variable only at the monthly level, we cluster
the standard errors at this level in order to adjust for the consequent group
structure in the error term (Lee and Card, 2008).
4 Data
We use individual-level panel data, created by linking information from the
population register, the tax register, the pension and bene�t registers, the
student register, the register of unemployed job-seekers and the register on
social assistance. The data were created by drawing a 15 percent random
10We discuss the de�nition and characteristics of the complier subpopulation in detailin Section 5.3.
10

sample of the new immigrants arriving in each year between 1990 and 2003.11
The data include annual observations for each individual until the end of the
year 2003, death or emigration. The data sources were combined by Statistics
Finland using personal identity codes.
For our baseline estimates, we restrict the estimation sample using the
following criteria. First, we include only male immigrants who �rst arrived
in Finland between January 1990 and April 1999. Second, we restrict the
sample to 25- to 60-year-old immigrants who were at least 16 years old at
the time of immigration. Third, we exclude those who were not potentially
eligible and those in the top 0.1 percent of the earnings or social bene�ts
distributions.12
Table 1 presents descriptive statistics for the resulting data. Columns
(1) to (5) report average characteristics in the year of arrival for di�erent
arrival cohorts. First, consider columns (4) and (5), which refer to cohorts
that arrived in Finland within two years from May 1997. The means suggest
that these cohorts were similar.13 When we extend the observation period,
some trends become evident. Family uni�cation became more common and
the local unemployment rate varied as Finland went through a severe reces-
sion in the early 1990s. It seems safe to assume that none of these changes
were caused by the anticipation of the immigration policy reform. Yet, im-
migrants arriving at di�erent phases of business cycle could di�er in their
characteristics. These changes are likely to be relatively smooth and thus
captured by the k (zi) and g (zi) functions discussed above. This assumption
11Statistics Finland restricted the sample size to 15 percent of the immigrant populationin order to ensure that individuals cannot be identi�ed from the data.
12We de�ne potentially eligible as those who either became a registered job seeker,received unemployment compensation or received social assistance during their �rst threeyears in Finland. This excludes 1,428 immigrants (a third of the full sample). Droppingthe top 0.1 percent of the earnings and bene�t distributions excludes 24 immigrants. InSection 5.2, we show that this sample selection rule improves the precision of the estimates,but does not a�ect the conclusions of the analysis.
13We have also regressed background characteristics on a dummy for arriving afterMay 1997 and several alternative speci�cations for the month of entering the populationregister. The estimates tend to be statistically insigni�cant and the point estimates aresensitive to the chosen speci�cation. Often, the sign of the estimates changes acrossspeci�cations.
11
is supported by the fact that the key results are virtually identical with and
without controlling for the observable characteristics. We return to columns
(6) and (7) in Section 5.3.
5 Results
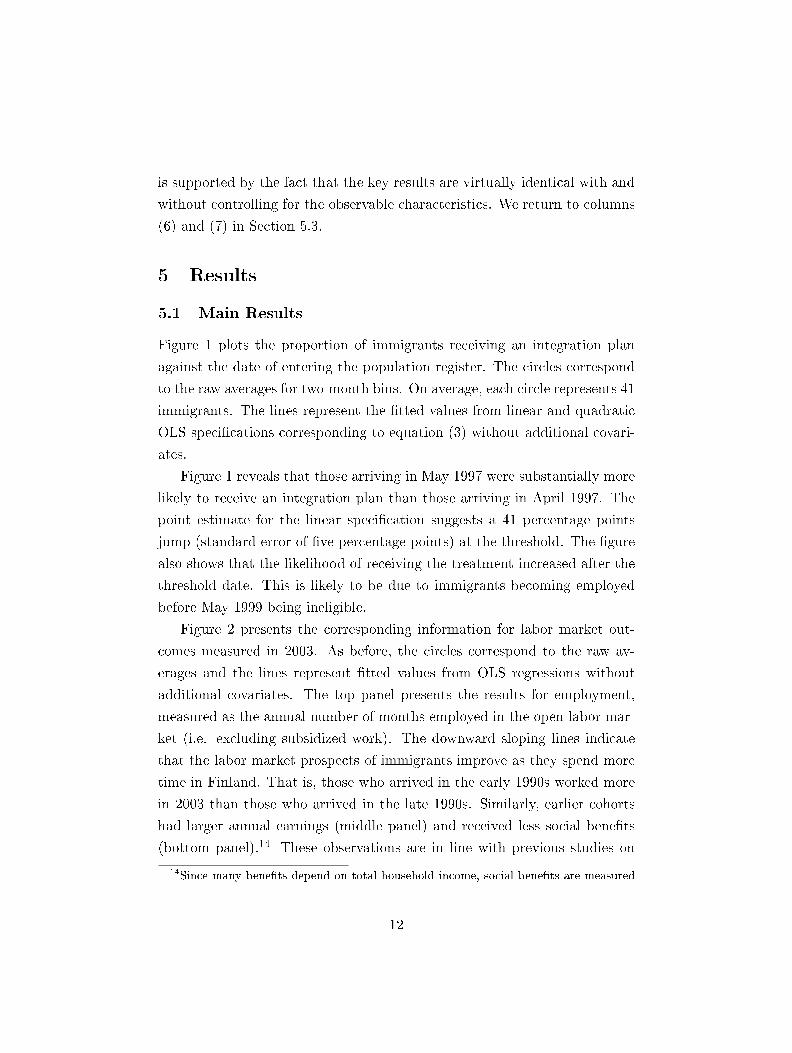
5.1 Main Results
Figure 1 plots the proportion of immigrants receiving an integration plan
against the date of entering the population register. The circles correspond
to the raw averages for two-month bins. On average, each circle represents 41
immigrants. The lines represent the �tted values from linear and quadratic
OLS speci�cations corresponding to equation (3) without additional covari-
ates.
Figure 1 reveals that those arriving in May 1997 were substantially more
likely to receive an integration plan than those arriving in April 1997. The
point estimate for the linear speci�cation suggests a 41 percentage points
jump (standard error of �ve percentage points) at the threshold. The �gure
also shows that the likelihood of receiving the treatment increased after the
threshold date. This is likely to be due to immigrants becoming employed
before May 1999 being ineligible.
Figure 2 presents the corresponding information for labor market out-
comes measured in 2003. As before, the circles correspond to the raw av-
erages and the lines represent �tted values from OLS regressions without
additional covariates. The top panel presents the results for employment,
measured as the annual number of months employed in the open labor mar-
ket (i.e. excluding subsidized work). The downward sloping lines indicate
that the labor market prospects of immigrants improve as they spend more
time in Finland. That is, those who arrived in the early 1990s worked more
in 2003 than those who arrived in the late 1990s. Similarly, earlier cohorts
had larger annual earnings (middle panel) and received less social bene�ts
(bottom panel).14 These observations are in line with previous studies on
14Since many bene�ts depend on total household income, social bene�ts are measured
12
the assimilation of immigrants in Finland and in other countries.
Figure 2 also suggests that those arriving in May 1997 performed better
in the labor market than those arriving in April 1997. These jumps corre-
spond to the numerator in equation (1) and can be interpreted as �intention-
to-treat� (ITT) or �reduced form� estimates of introducing the integration
plans. According to the point estimates using a linear speci�cation, the
policy change increased average employment by 1.5 months (standard error
0.6 months) and annual earnings by 3,197 euros (standard error 1,289 euros)
among the entire population present in the estimation sample. The improve-
ment in labor market performance is re�ected in a decrease in annual social
bene�ts, accounting for 1,323 euros (standard error 375 euros).
Table 2 reports similar estimates after controlling for demographic char-
acteristics, region of origin, legal status for a residence permit, local unem-
ployment rate, type of residence municipality, an indicator for living in the
Uusimaa region (where the capital, Helsinki, is located) and indicators for
the quarter of entering the population register. All background characteris-
tics are measured in the year of arrival. The results reported in columns (1),
(3) and (5) are similar to those obtained without control variables.
The regression-discontinuity estimates reported in the second column of
Table 2 suggest that integration plans increased employment by more than
four months in the years 2002 and 2003. In other words, according to the
point estimates, the entire employment growth from the year 2000 onwards
can be attributed to the integration program. The relative magnitude of
the estimates for annual earnings (column 4) and bene�ts (column 6) are
similar. We note that the estimates are quite imprecise, and one should not
therefore draw strong conclusions from the point estimates. Nevertheless,
the estimates are statistically highly signi�cant. Furthermore, as we discuss
in detail in Section 5.3, even the magnitudes of the point estimates may
not be implausible given the characteristics of the complier population and
the nature of the treatment. Before turning to the interpretation, however,
we report a set of robustness checks and discuss the internal validity of the
at the household level using the OECD equivalence scale. The scale assigns a value of 1to the �rst household member, 0.7 to other adults and 0.5 to each child.
13
results.
5.2 Robustness Checks
We start by examining whether the number of observations changes abruptly
at the May 1997 threshold. This exercise is motivated by the standard
concern about RD designs that individuals could manipulate the forcing
variable and thus a�ect their assignment into the treatment (McCrary, 2008).
In our context, such manipulation would mean that some immigrants had
entered the population register before May 1st 1997 in order to avoid the
obligation to receive an integration plan. Given that the cuto� date was
published in May 1998�and was unlikely to have become widely known
even then�this concern is unlikely to be valid. In fact, it is unlikely that
anyone knew about the forthcoming date rule in May 1997. This reasoning
is supported by Figure 3, which plots the number of immigrants entering the
population register over the study period. We �nd no evidence of a jump at
the May 1997 threshold.
Another way to scrutinize the baseline results is to introduce arbitrary
discontinuities in the data and to test for their signi�cance. To do this, we
create �placebo� thresholds for each possible arrival month between January
1993 and May 1997, and examine whether outcomes measured six years later
di�er between those arriving before and after the threshold. Figure 4 reports
the results. The only estimates that are similar to our real estimates are
found around the true threshold of May 1997. Note that we should expect
to see similar estimates for placebo thresholds close to May 1997, as they can
be considered as measuring the true threshold with a measurement error.
We next turn to the parameterization. We acknowledge that the con-
sistency of our baseline estimates requires the functional form of g (zi) and
k (zi) in equations (2) and (3) to be a reasonable proxy for the true under-
lying process. Since we do not know the functional forms of these processes,
we experiment with alternative speci�cations. Panel A of Table 3 reports
the main estimates when adding the number of polynomials to g (zi) and
k (zi). The point estimates are remarkably stable across these speci�cations.
14
However, more �exible functional forms lead to substantially less precise
estimates.
Another potential source of bias is selective outmigration. In principle,
our results could follow from the integration plans reducing the emigration
of immigrants at the upper end of the skill distribution (or increasing their
emigration at the lower end). However, given the large magnitude of the
estimates, these outmigration �ows would have to be large in order to explain
the results. Furthermore, the data suggest that the integration plans had no
e�ect on outmigration.15
Our �nal robustness check concerns the estimation sample. The baseline
results are obtained from a sample where we have excluded immigrants who
did not experience unemployment and did not receive social assistance dur-
ing their �rst three years in Finland. While this sample selection rule should
allow us to focus on the relevant population and thus improve the precision
of the estimates, it also raises possible concerns. For instance, the treat-
ment might have moved some immigrants to the 0.1 percent of the earnings
or social bene�ts distribution or the reform could have altered the in�ow
to unemployment or social assistance. Furthermore, our data record social
assistance paid to the immigrant and to his possible spouse, but we do not
observe social assistance paid to the parents. Thus, our sample selection rule
excludes all grown-up children who are eligible for an integration plan, but
who do not register as job seekers.
Panel B of Table 3 presents the estimates using the full sample. Since
we now also include immigrants who were not targeted by the integration
plans, the reduced form estimates are smaller. However, the RD estimates
should not be a�ected by the inclusion of the �never-takers�. In line with
this prediction, the RD estimates from the full sample are similar to those
from the restricted sample. None of the estimates presented in panel B
are statistically signi�cantly di�erent from those presented in panel A. If
15Regressing a dummy for leaving Finland by the end of 2003 on a dummy for en-tering the population register after May 1997 yields estimates of 0.002 (standard error0.035), −0.048 (standard error 0.053) and 0.033 (standard error 0.072) when using linear,quadratic and cubic speci�cations for zi, respectively.
15
anything, the point estimates suggest a larger impact on annual earnings,
while the point estimates for employment and social bene�ts are close to the
baseline estimates.
5.3 Interpretation
The robustness checks and the a priori plausibility of the research design
support the internal validity of the estimates. Therefore, we conclude that
the reform helped to integrate immigrants into the Finnish labor markets.
In order to draw more general lessons from this speci�c policy reform, we
next discuss the interpretation of the estimates in detail.
We start by noting that the RD estimates measure a local average treat-
ment e�ect (Imbens and Angrist, 1994; Hahn et al., 2001). That is, we
identify the mean e�ect among those entering the population register on
May 1st, 1997, who received an integration plan and would not have re-
ceived it had they arrived earlier. According to the �rst-stage estimates, this
subpopulation of compliers makes up roughly a third of the entire immigrant
population.16 Note that the immigrants who became employed within two
years of arriving in Finland are never-takers, as their entry date does not
a�ect their treatment status. In other words, the compliers remained un-
employed for at least two years after arrival, which implies that they are a
negatively selected subpopulation of immigrants.
To gain further insights, we relate the background characteristics of the
compliers to those of the entire immigrant population. Angrist and Pischke
(2009) show that
E [Di|zi ≥ z0, xi = 1]− E [Di|zi < z0, xi = 1]
E [Di|zi ≥ z0]− E [Di|zi < z0](4)
=P (xi = 1|Di,zi≥z0 > Di,zi<z0)
P (xi = 1)
16Regressing the treatment status on a dummy for entering the population register afterMay 1997 yields estimates of 0.30 (standard error 0.05), 0.35 (standard error 0.05) and0.33 (standard error 0.06) when using linear, quadratic and cubic speci�cations for zi,respectively.
16

where xi is a binary variable measuring a characteristic of immigrant i, zi is
the month when he entered the population register, z0 is May 1997,Di,zi<z0 is
the potential treatment status if the immigrant enters the population register
before the threshold date, and Di,zi≥z0 is the potential treatment status if he
enters after the threshold. In this notation, compliers are de�ned as those
who have Di,zi<z0 = 0 and Di,zi≥z0 = 1.
Column 6 of Table 1 reports estimates for equation (4).17 The results sug-
gest that the compliers were more likely to be refugees and family members,
to come from outside of the European Union, to have an immigrant spouse,
and to live outside the capital region of Uusimaa than other immigrants. In
short, the compliers tended to belong to groups that are the most likely to
lack the basic skills required in the Finnish labor market and who have the
least access to social networks that would help in �nding employment.
It seems reasonable to think that this subpopulation may have been
particularly responsive to the type of treatment we evaluate. The Finnish
reform changed the training provision from a system that did not recognize
the special needs of immigrants to a system where the importance of language
skills and other host-country-speci�c human capital was taken more seriously
(see Section 2.3 for details). After the reform, immigrants were helped to �nd
training that would �t their needs and were allowed to participate in suitable
courses even outside the Labor Administration. As a consequence, language
training and courses teaching basic facts about the Finnish society and the
labor markets are likely to have become much more available. This type of
training may be complementary to the human capital that immigrants have
acquired before migration. Furthermore, basic language skills and guidance
on how to seek work may be su�cient for �nding employment in many low-
skilled occupations.
Unfortunately, our ability to document this likely increase in training is
limited as we only have access to data for training provided by the Labor
Administration. Nevertheless, these data suggest that even within the La-
bor Administration, the reform shifted resources from general �preparatory
17For continuous variables we have used an indicator variable taking a value of one if xiis larger than the sample median and zero otherwise.
17
training��such as general job search training�to courses speci�cally de-
signed for immigrants (see panel D of Table 1). Furthermore, other sources
suggest that training outside the Labor Administration has been an impor-
tant source of immigrant training after the reform (see footnote 7). Taken
together, the available evidence suggests that the reform increased the pro-
vision of courses that aim to build up host-country-speci�c human capital.
Our �nal remark concerns the potential impact on incentives. While
sanctioning of non-compliance was not a�ected by the reform, we cannot rule
out that some immigrants might have disliked the integration plans and thus
avoided them by becoming employed before the program was implemented.
In this case, the group of immigrants a�ected by the treatment would be
larger than those who ended up being formally treated. Hence, we would
underestimate the denominator of equation (1) and the RD estimates would
be biased upwards. While we do not expect this to be of major importance,
a conservative interpretation is that the RD estimates are an upper bound
of the treatment e�ect. On the other hand, a very conservative lower bound
is obtained by assuming that everyone arriving after May 1997 was a�ected
by the policy change and thus the denominator of equation (1) would be
one. Consequently, the ITT estimate would provide a lower bound for the
treatment e�ect.
6 Conclusions
In this paper, we have evaluated the impact of an integration program on
labor market performance among male immigrants to Finland. Our empirical
strategy is based on a discontinuity that obliged non-working immigrants to
participate in the program only if they had entered the population register
after May 1st, 1997. This rule was made public in May 1998 and thus
could not have a�ected the entry decisions of immigrants at the threshold.
Standard checks for robustness support the internal validity of the results.
We �nd that receiving an integration plan substantially increased em-
ployment and annual earnings and reduced welfare dependency. The in-
tegration plans seem to have increased participation in courses aimed at
18

building up host-country-speci�c human capital. In contrast, sanctioning of
non-compliance was not a�ected by the reform.
19
References
Angrist, J. D. and J.-S. Pischke (2009): Mostly Harmless Econometrics:
An Empiricist's Companion, Princeton University Press.
Antecol, H., P. Kuhn, and S. Trejo (2003): �Immigration Policy and
the Skills of Immigrants to Australia, Canada, and the United States,�
Journal of Human Resources, 38, 192�218.
Åslund, O. and P. Johansson (2006): �Virtues of SIN. E�ects of an Im-
migrant Workplace Introduction Program,� IFAU Working Paper 2006:7.
Boeri, T., G. Hanson, and B. McCormick (2002): Immigration Policy
and the Welfare System, Oxford University Press.
Borjas, G. (1985): �Assimilation, Changes in Cohort Quality, and the
Earnings of Immigrants,� Journal of Labor Economics, 3, 463�489.
��� (1993): �Immigration Policy, National Origin, and Immigrant Skills:
A Comparison of Canada and the United States,� in Small Di�erences
That Matter: Labor Markets and Income Maintenance in Canada and the
United States, ed. by D. Card and R. Freeman, University Of Chicago
Press.
��� (1994): �The Economics of Immigration,� Journal of Economic Lit-
erature, 32, 1667�1717.
��� (1995): �Assimilation and Changes in Cohort Quality Revisited:
What Happened to Immigrant Earnings in the 1980s?� Journal of La-
bor Economics, 13, 201�245.
��� (2002): �Welfare Reform and Immigrant Participation in Welfare
Programs,� International Migration Review, 36, 1093�1123.
Borjas, G. and L. Hilton (1996): �Immigration and the Welfare State:
Immigrant Participation in Means-Tested Entitlement Programs,� Quar-
terly Journal of Economics, 111, 575�604.
20
Borjas, G. and S. Trejo (1990): �Immigrant Participation in the Welfare
System,� Industrial & Labor Relations Review, 44, 195.
Carrera, S. (2006): �A Comparison of Integration Programs in the EU:
Trends and Weaknesses,� Challenge Papers No. 1, Centre for European
Policy Studies, Brussels.
Chiswick, B. (1978): �The E�ect of Americanization on the Earnings of
Foreign-Born Men,� Journal of Political Economy, 86, 897�921.
CIC (2005): �Evaluation of the Immigration Settlement and Adaptation
Program (ISAP),� Citizenship and Immigration Canada.
Cohen-Goldner, S. and Z. Eckstein (2008): �Labor Mobility of Immi-
grants: Training, Experience, Language and Opportunities,� International
Economic Review, 49, 837�872.
��� (2010): �Estimating the Return to Training and Occupational Expe-
rience: The Case of Female Immigrants,� Journal of Econometrics, 156,
86�105.
Government Proposal for the Integration Act (1998): �HE
66/1998,� Parliament of Finland.
Hahn, J., P. Todd, and W. Klaauw (2001): �Identi�cation and Es-
timation of Treatment E�ects with a Regression-Discontinuity Design,�
Econometrica, 69, 201�209.
Hu, W. (2000): �Immigrant Earnings Assimilation: Estimates from Longi-
tudinal Data,� American Economic Review, 90, 368�372.
Imbens, G. and J. Angrist (1994): �Identi�cation and Estimation of
Local Average Treatment E�ects,� Econometrica, 62, 467�467.
Joppke, C. (2007): �Beyond National Models: Civic Integration Policies
for Immigrants in Western Europe,� West European Politics, 30, 1�22.
Lee, D. and D. Card (2008): �Regression Discontinuity Inference with
Speci�cation Error,� Journal of Econometrics, 142, 655�674.
21
Lubotsky, D. (2007): �Chutes or Ladders? A Longitudinal Analysis of
Immigrant Earnings,� Journal of Political Economy, 115, 820�867.
McCrary, J. (2008): �Manipulation of the Running Variable in the Re-
gression Discontinuity Design: a Density Test,� Journal of Econometrics,
142, 698�714.
Ministry of Labour (2003): �Government Report on Implementation
of the Integration Act,� Publication of the Labour Administration 317.
Helsinki: Ministry of Labor.
��� (2005): �Yhteistyössä kotouttamiskoulutusta toteuttamaan � Työ-
ja opetushallinnon työryhmän raportti [Implementing Integration Train-
ing Together � A Report of the Ministry of Labour and Ministry of Ed-
ucation],� Publication of Labor Administration 351. Helsinki: Ministry of
Labor.
Rosholm, M. and R. Vejlin (2007): �Reducing Income Transfers to
Refugee Immigrants: Does Starthelp Help You Start?� IZA Discussion
Paper No. 2720.
Sarvimäki, M. (forthcoming): �Assimilation to a Welfare State: Labor
Market Performance and Use of Social Bene�ts by Immigrants to Finland,�
Scandinavian Journal of Economics.
Schmidt, R. (2007): �Comparing Federal Government Immigrant Settle-
ment Policies in Canada and the United States,� American Review of
Canadian Studies, 37, 103�122.
van der Klaauw, W. (2002): �Estimating the E�ect of Financial Aid
O�ers on College Enrollment: a Regression-Discontinuity Approach,� In-
ternational Economic Review, 43, 1249�1287.
22
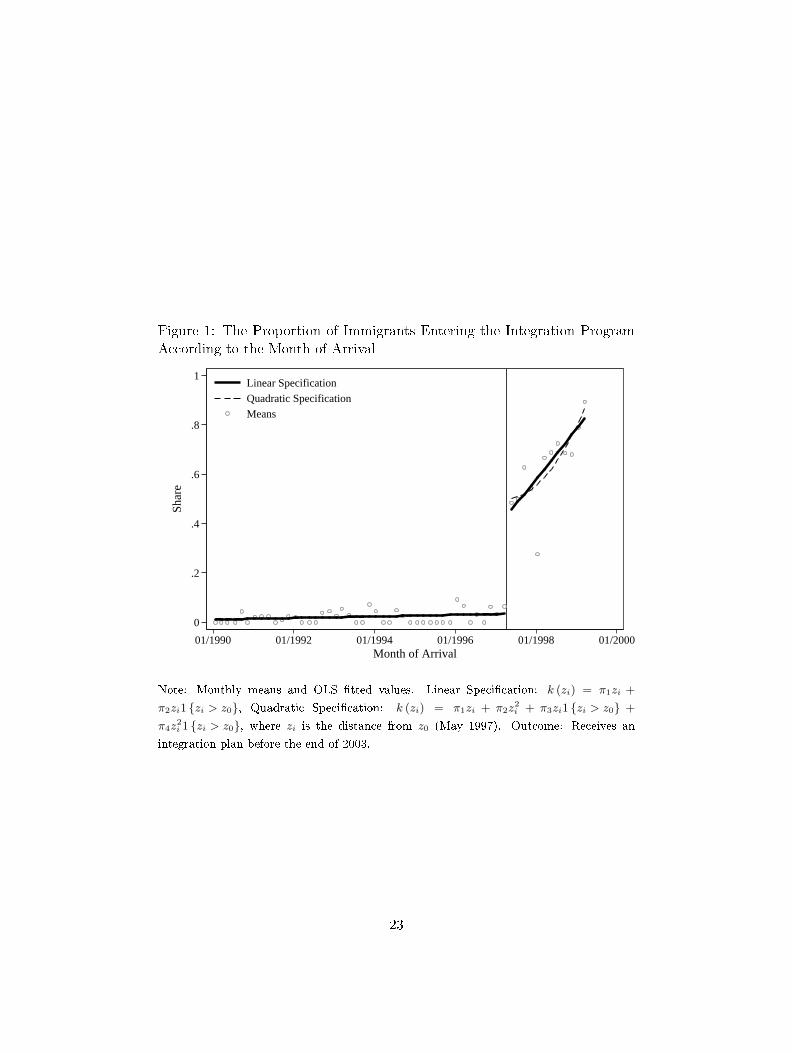
Figure 1: The Proportion of Immigrants Entering the Integration ProgramAccording to the Month of Arrival
0
.2
.4
.6
.8
1
Shar
e
01/1990 01/1992 01/1994 01/1996 01/1998 01/2000Month of Arrival
Linear Specification
Quadratic Specification
Means
Note: Monthly means and OLS �tted values. Linear Speci�cation: k (zi) = π1zi +
π2zi1 {zi > z0}, Quadratic Speci�cation: k (zi) = π1zi + π2z2i + π3zi1 {zi > z0} +
π4z2i 1 {zi > z0}, where zi is the distance from z0 (May 1997). Outcome: Receives an
integration plan before the end of 2003.
23
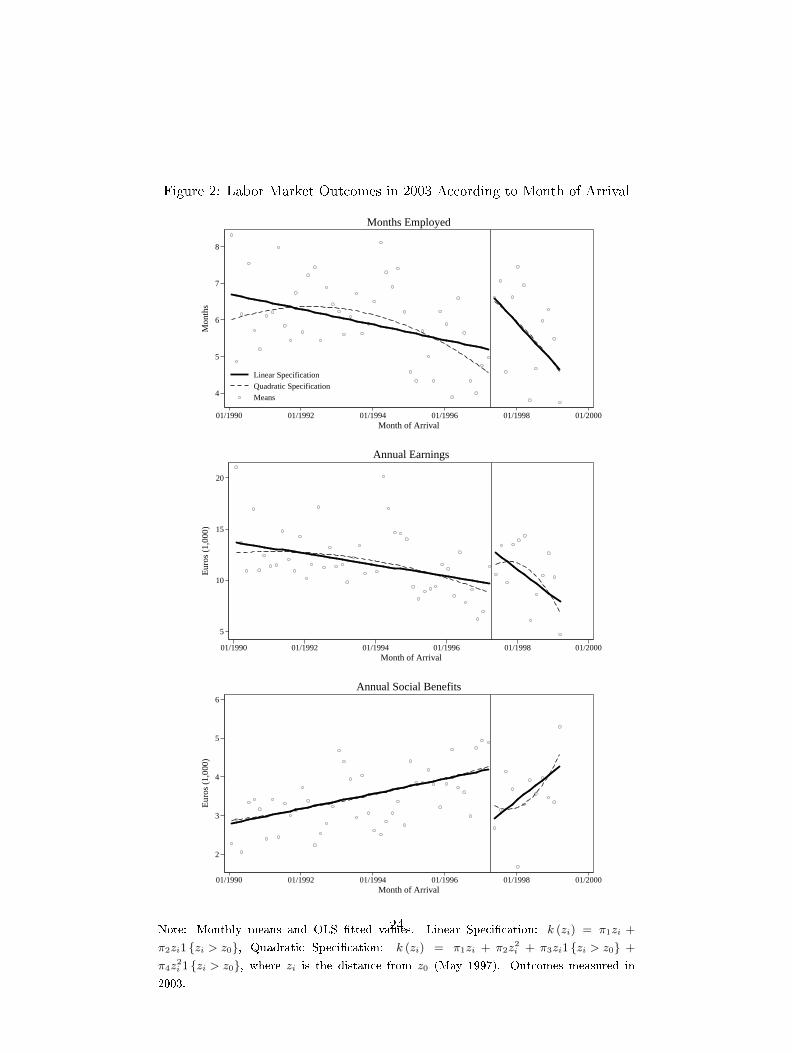
Figure 2: Labor Market Outcomes in 2003 According to Month of Arrival
4
5
6
7
8
Mon
ths
01/1990 01/1992 01/1994 01/1996 01/1998 01/2000Month of Arrival
Linear Specification
Quadratic Specification
Means
Months Employed
5
10
15
20
Eur
os (
1,00
0)
01/1990 01/1992 01/1994 01/1996 01/1998 01/2000Month of Arrival
Annual Earnings
2
3
4
5
6
Eur
os (
1,00
0)
01/1990 01/1992 01/1994 01/1996 01/1998 01/2000Month of Arrival
Annual Social Benefits
Note: Monthly means and OLS �tted values. Linear Speci�cation: k (zi) = π1zi +
π2zi1 {zi > z0}, Quadratic Speci�cation: k (zi) = π1zi + π2z2i + π3zi1 {zi > z0} +
π4z2i 1 {zi > z0}, where zi is the distance from z0 (May 1997). Outcomes measured in
2003.
24
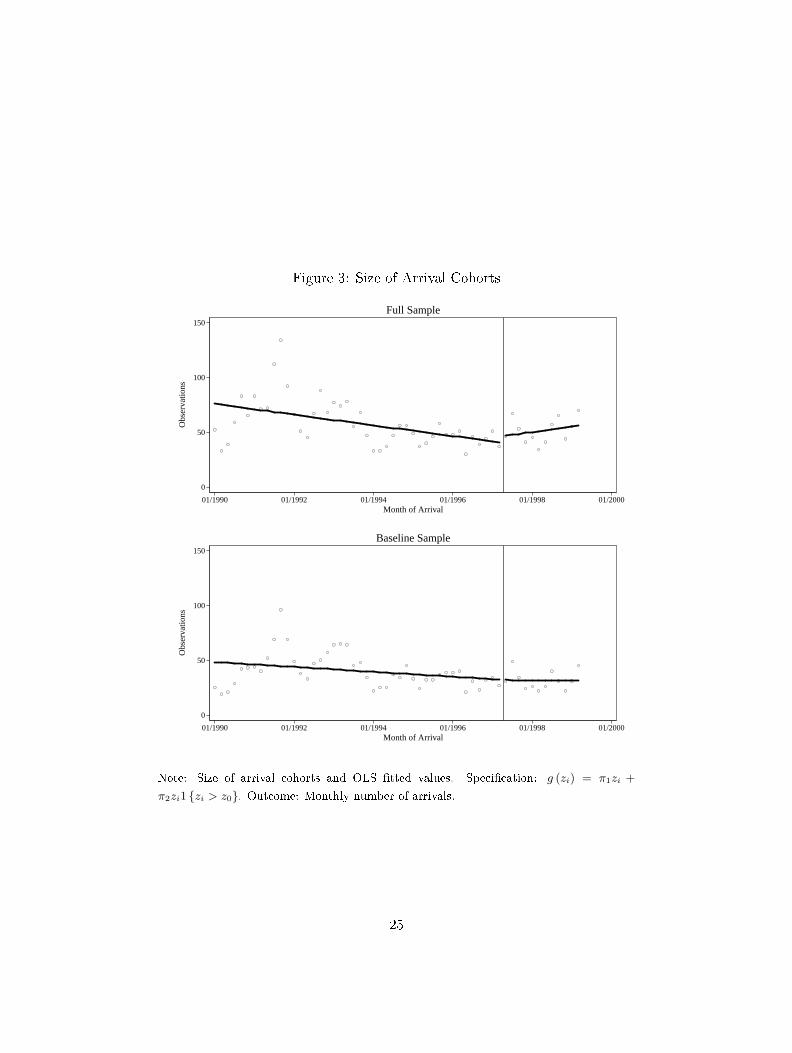
Figure 3: Size of Arrival Cohorts
0
50
100
150
Obs
erva
tions
01/1990 01/1992 01/1994 01/1996 01/1998 01/2000Month of Arrival
Full Sample
0
50
100
150
Obs
erva
tions
01/1990 01/1992 01/1994 01/1996 01/1998 01/2000Month of Arrival
Baseline Sample
Note: Size of arrival cohorts and OLS �tted values. Speci�cation: g (zi) = π1zi +
π2zi1 {zi > z0}. Outcome: Monthly number of arrivals.
25
Figure 4: Jumps at non-discontinuity points
−2
−1
0
1
2
3
01/1993 01/1994 01/1995 01/1996 01/1997
Months Employed
−4000
−2000
0
2000
4000
6000
01/1993 01/1994 01/1995 01/1996 01/1997
Annual Earnings
−2000
−1000
0
1000
01/1993 01/1994 01/1995 01/1996 01/1997
Social Benefits
Placebo Threshold Date
Note: Reduced form (OLS) estimates and 95% con�dence intervals of jumps at non-
discontinuity points. X-axis: Placebo threshold date. Outcome measured �ve years after
the year of the placebo threshold. The square marker corresponds to the estimate for the
real threshold of May, 1997.
26
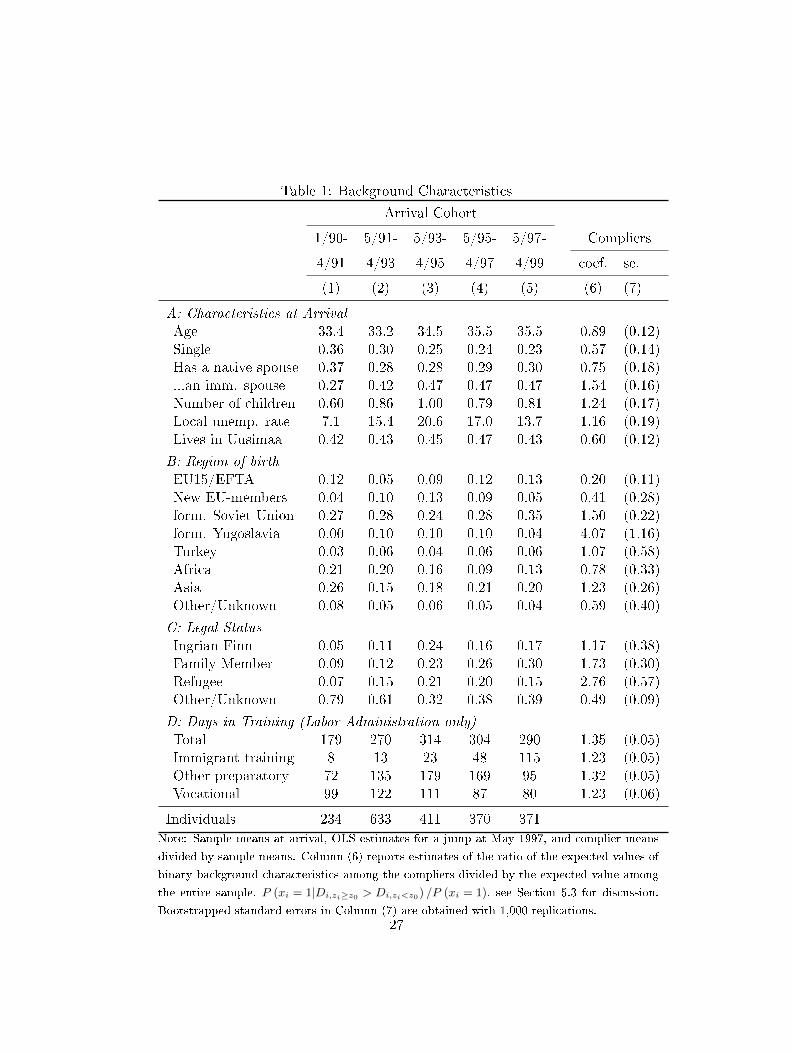
Table 1: Background Characteristics
Arrival Cohort
1/90- 5/91- 5/93- 5/95- 5/97- Compliers
4/91 4/93 4/95 4/97 4/99 coef. se.
(1) (2) (3) (4) (5) (6) (7)
A: Characteristics at Arrival
Age 33.4 33.2 34.5 35.5 35.5 0.89 (0.12)Single 0.36 0.30 0.25 0.24 0.23 0.57 (0.14)Has a native spouse 0.37 0.28 0.28 0.29 0.30 0.75 (0.18)...an imm. spouse 0.27 0.42 0.47 0.47 0.47 1.54 (0.16)Number of children 0.60 0.86 1.00 0.79 0.81 1.24 (0.17)Local unemp. rate 7.1 15.4 20.6 17.0 13.7 1.16 (0.19)Lives in Uusimaa 0.42 0.43 0.45 0.47 0.43 0.60 (0.12)
B: Region of birth
EU15/EFTA 0.12 0.05 0.09 0.12 0.13 0.20 (0.11)New EU-members 0.04 0.10 0.13 0.09 0.05 0.41 (0.28)form. Soviet Union 0.27 0.28 0.24 0.28 0.35 1.50 (0.22)form. Yugoslavia 0.00 0.10 0.10 0.10 0.04 4.07 (1.16)Turkey 0.03 0.06 0.04 0.06 0.06 1.07 (0.58)Africa 0.21 0.20 0.16 0.09 0.13 0.78 (0.33)Asia 0.26 0.15 0.18 0.21 0.20 1.23 (0.26)Other/Unknown 0.08 0.05 0.06 0.05 0.04 0.59 (0.40)
C: Legal Status
Ingrian Finn 0.05 0.11 0.24 0.16 0.17 1.17 (0.38)Family Member 0.09 0.12 0.23 0.26 0.30 1.73 (0.30)Refugee 0.07 0.15 0.21 0.20 0.15 2.76 (0.57)Other/Unknown 0.79 0.61 0.32 0.38 0.39 0.49 (0.09)
D: Days in Training (Labor Administration only)
Total 179 270 314 304 290 1.35 (0.05)Immigrant training 8 13 23 48 115 1.23 (0.05)Other preparatory 72 135 179 169 95 1.32 (0.05)Vocational 99 122 111 87 80 1.23 (0.06)
Individuals 234 633 411 370 371Note: Sample means at arrival, OLS estimates for a jump at May 1997, and complier means
divided by sample means. Column (6) reports estimates of the ratio of the expected values of
binary background characteristics among the compliers divided by the expected value among
the entire sample, P (xi = 1|Di,zi≥z0 > Di,zi<z0) /P (xi = 1), see Section 5.3 for discussion.
Bootstrapped standard errors in Column (7) are obtained with 1,000 replications.27
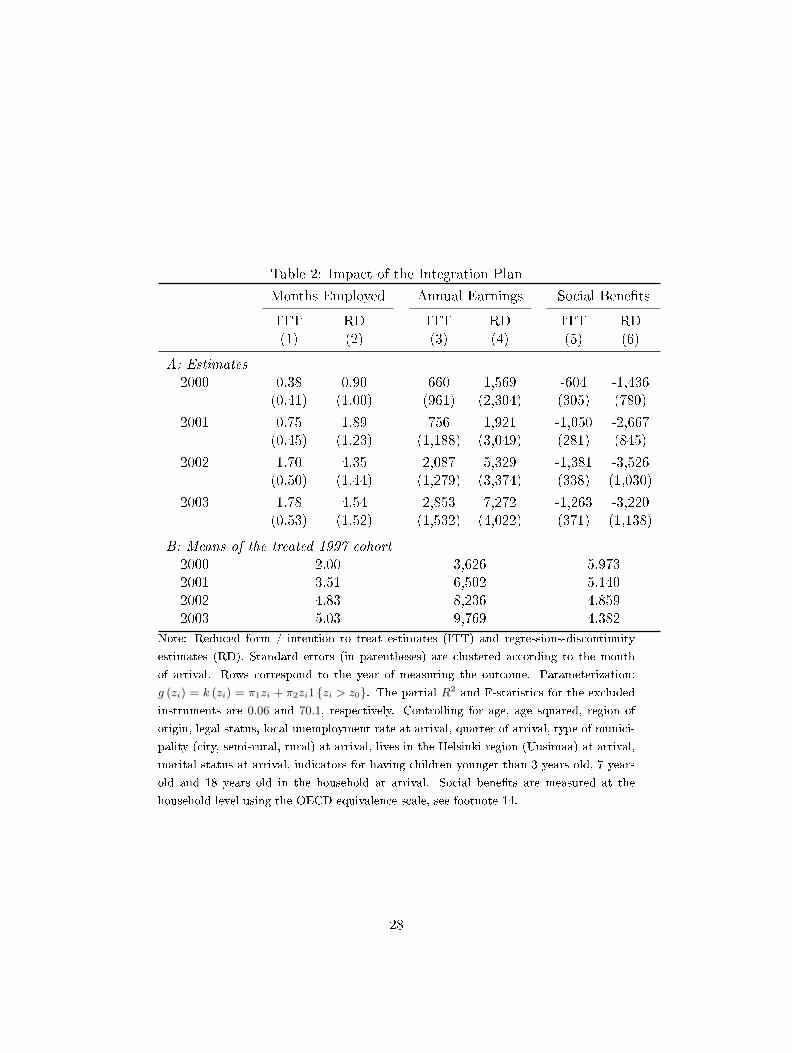
Table 2: Impact of the Integration Plan
Months Employed Annual Earnings Social Bene�ts
ITT RD ITT RD ITT RD(1) (2) (3) (4) (5) (6)
A: Estimates
2000 0.38 0.90 660 1,569 -604 -1,436(0.41) (1.00) (961) (2,304) (305) (780)
2001 0.75 1.89 756 1,921 -1,050 -2,667(0.45) (1.23) (1,188) (3,049) (281) (845)
2002 1.70 4.35 2,087 5,329 -1,381 -3,526(0.50) (1.44) (1,279) (3,374) (338) (1,030)
2003 1.78 4.54 2,853 7,272 -1,263 -3,220(0.53) (1.52) (1,532) (4,022) (371) (1,138)
B: Means of the treated 1997 cohort
2000 2.00 3,626 5,9732001 3.51 6,502 5,1402002 4.83 8,236 4,8592003 5.03 9,769 4,382
Note: Reduced form / intention to treat estimates (ITT) and regressions-discontinuity
estimates (RD). Standard errors (in parentheses) are clustered according to the month
of arrival. Rows correspond to the year of measuring the outcome. Parameterization:
g (zi) = k (zi) = π1zi + π2zi1 {zi > z0}. The partial R2 and F-statistics for the excluded
instruments are 0.06 and 70.1, respectively. Controlling for age, age squared, region of
origin, legal status, local unemployment rate at arrival, quarter of arrival, type of munici-
pality (city, semi-rural, rural) at arrival, lives in the Helsinki region (Uusimaa) at arrival,
marital status at arrival, indicators for having children younger than 3 years old, 7 years
old and 18 years old in the household at arrival. Social bene�ts are measured at the
household level using the OECD equivalence scale, see footnote 14.
28
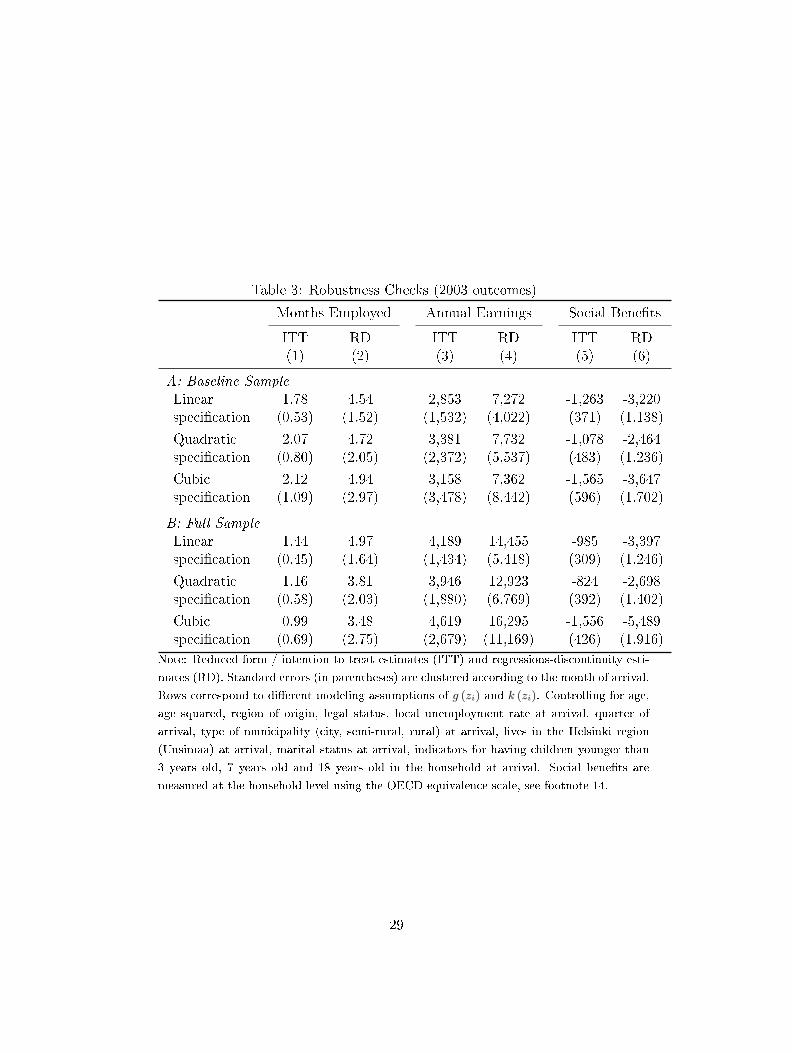
Table 3: Robustness Checks (2003 outcomes)
Months Employed Annual Earnings Social Bene�ts
ITT RD ITT RD ITT RD(1) (2) (3) (4) (5) (6)
A: Baseline Sample
Linear 1.78 4.54 2,853 7,272 -1,263 -3,220speci�cation (0.53) (1.52) (1,532) (4,022) (371) (1,138)
Quadratic 2.07 4.72 3,381 7,732 -1,078 -2,464speci�cation (0.80) (2.05) (2,372) (5,537) (483) (1,236)
Cubic 2.12 4.94 3,158 7,362 -1,565 -3,647speci�cation (1.09) (2.97) (3,478) (8,442) (596) (1,702)
B: Full Sample
Linear 1.44 4.97 4,189 14,455 -985 -3,397speci�cation (0.45) (1.64) (1,434) (5,418) (309) (1,246)
Quadratic 1.16 3.81 3,946 12,923 -824 -2,698speci�cation (0.58) (2.03) (1,880) (6,769) (392) (1,402)
Cubic 0.99 3.48 4,619 16,295 -1,556 -5,489speci�cation (0.69) (2.75) (2,679) (11,169) (426) (1,916)
Note: Reduced form / intention to treat estimates (ITT) and regressions-discontinuity esti-
mates (RD). Standard errors (in parentheses) are clustered according to the month of arrival.
Rows correspond to di�erent modeling assumptions of g (zi) and k (zi). Controlling for age,
age squared, region of origin, legal status, local unemployment rate at arrival, quarter of
arrival, type of municipality (city, semi-rural, rural) at arrival, lives in the Helsinki region
(Uusimaa) at arrival, marital status at arrival, indicators for having children younger than
3 years old, 7 years old and 18 years old in the household at arrival. Social bene�ts are
measured at the household level using the OECD equivalence scale, see footnote 14.
29