asset management literature review and potential ... · asset management literature review and ......
TRANSCRIPT

Technical Report Documentation Page
1. Report No. FHWA/TX-07/0-5534-1
2. Government Accession No.
3. Recipient's Catalog No. 5. Report Date September 2006 Published: April 2007
4. Title and Subtitle ASSET MANAGEMENT LITERATURE REVIEW AND POTENTIAL APPLICATIONS OF SIMULATION, OPTIMIZATION, AND DECISION ANALYSIS TECHNIQUES FOR RIGHT-OF-WAY AND TRANSPORTATION PLANNING AND PROGRAMMING
6. Performing Organization Code
7. Author(s) Paul E. Krugler, Carlos M. Chang-Albitres, Kirby W. Pickett, Roger E. Smith, Illya V. Hicks, Richard M. Feldman, Sergiy Butenko, Dong Hun Kang, and Seth D. Guikema
8. Performing Organization Report No. Report 0-5534-1
10. Work Unit No. (TRAIS)
9. Performing Organization Name and Address Texas Transportation Institute The Texas A&M University System College Station, Texas 77843-3135
11. Contract or Grant No. Project 0-5534 13. Type of Report and Period Covered Technical Report: September 2005 - August 2006
12. Sponsoring Agency Name and Address Texas Department of Transportation Research and Technology Implementation Office P.O. Box 5080 Austin, Texas 78763-5080
14. Sponsoring Agency Code
15. Supplementary Notes Project performed in cooperation with the Texas Department of Transportation and the Federal Highway Administration. Project Title: Asset Management—Texas Style URL: http://tti.tamu.edu/documents/0-5534-1.pdf 16. Abstract This report documents the work performed during phase one of Project 0-5534, “Asset Management—Texas Style.” The overall purpose of the research is to develop state-of-the-practice asset management methodologies for the Texas Department of Transportation (TxDOT). These methodologies will support current decision-making processes for allocating funds to the different asset categories managed by TxDOT. During the first year of this project, the specific research focus area was resource allocation decisions regarding advance acquisition of right-of-way and the construction of new highway capacity facilities. Simulation, optimization, and decision analysis methodologies were explored for examining the trade-offs between using funds for these two alternative purposes. 17. Key Words Asset Management, Simulation, Optimization, Decision Analysis, Right-of-Way, Transportation Planning and Programming
18. Distribution Statement No restrictions. This document is available to the public through NTIS: National Technical Information Service Springfield, Virginia 22161 http://www.ntis.gov
19. Security Classif.(of this report) Unclassified
20. Security Classif.(of this page) Unclassified
21. No. of Pages 126
22. Price
Form DOT F 1700.7 (8-72) Reproduction of completed page authorized


ASSET MANAGEMENT LITERATURE REVIEW AND POTENTIAL APPLICATIONS OF SIMULATION, OPTIMIZATION, AND
DECISION ANALYSIS TECHNIQUES FOR RIGHT-OF-WAY AND TRANSPORTATION PLANNING AND PROGRAMMING
by
Paul E. Krugler
Research Engineer Texas Transportation Institute
Carlos M. Chang-Albitres Associate Transportation Researcher
Texas Transportation Institute
Kirby W. Pickett Consultant
Roger E. Smith
Professor Department of Civil Engineering
Texas A&M University
Illya V. Hicks Assistant Professor
Department of Industrial and Systems Engineering
Texas A&M University
Richard M. Feldman Professor
Department of Industrial and Systems Engineering
Texas A&M University
Sergiy Butenko Assistant Professor
Department of Industrial and Systems Engineering
Texas A&M University
Dong Hun Kang Research Assistant
Texas Transportation Institute
Seth D. Guikema Assistant Professor
Department of Civil Engineering Texas A&M University
Report 0-5534-1 Project 0-5534
Project Title: Asset Management—Texas Style
Performed in cooperation with the Texas Department of Transportation
and the Federal Highway Administration
September 2006 Published: April 2007
TEXAS TRANSPORTATION INSTITUTE The Texas A&M University System College Station, Texas 77843-3135

v
DISCLAIMER
The contents of this report reflect the views of the authors, who are responsible for the
facts and the accuracy of the data presented herein. The contents do not necessarily reflect the
official view or policies of the Federal Highway Administration (FHWA) or the Texas
Department of Transportation (TxDOT). This report does not constitute a standard,
specification, or regulation. The engineer in charge was Paul E. Krugler, P.E. (Texas #43317).

vi
ACKNOWLEDGMENTS
This project is being conducted in cooperation with TxDOT and FHWA. The authors
wish to acknowledge the strong support of the project director, Ron Hagquist; the program
coordinator, Mary Owen; and the entire group of project advisors. Special thanks are extended
to John D. “JD” Ewald and Patrick Moon of the Right of Way Division, Wayne Wells of the
Transportation Planning and Programming Division, and Linda K. Olson of the Design Division
who met at length with the research team during the past year to convey current TxDOT
processes and methods pertinent to this project.

vii
TABLE OF CONTENTS
Page List of Figures .............................................................................................................................. viii List of Tables ................................................................................................................................. ix Chapter 1: Introduction .................................................................................................................. 1
Organization of the Report.......................................................................................................... 2 Chapter 2: Asset Management Literature Review.......................................................................... 5
Asset Management Concepts ..................................................................................................... 5 Top Asset Management References.......................................................................................... 14
Chapter 3: Conceptual Schematic Research Problem Overview.................................................. 23 Funding Allocation and Decision Making at TxDOT .............................................................. 23 Allocating Funds between Maintenance and New Road Capacity Construction ..................... 25 TPP and ROW from an Asset Management Perspective.......................................................... 29 Overview of the Right-of-Way Acquisition Process ................................................................ 31 Right-of-Way Acquisition, Early Purchase, and Cost Impacts................................................. 36
Chapter 4: Simulation ................................................................................................................... 41 Abstract ..................................................................................................................................... 41 Introduction............................................................................................................................... 41 Trade-Offs for Early Acquisition.............................................................................................. 46 A Summary of Simulation Modeling........................................................................................ 47 The Importance of Stochastic Modeling................................................................................... 49 Objectives for the Simulation Model........................................................................................ 50 Research Plan............................................................................................................................ 52 Modeling Approach .................................................................................................................. 55 Concluding Remarks................................................................................................................. 59
Chapter 5: Optimization................................................................................................................ 61 Abstract ..................................................................................................................................... 61 Introduction............................................................................................................................... 61 Data Collection and Processing ................................................................................................ 69 Mathematical Programming Models......................................................................................... 72 Expected Outputs and Extensions............................................................................................. 76
Chapter 6: Decision and Risk Analysis ........................................................................................ 79 Abstract ..................................................................................................................................... 79 Introduction............................................................................................................................... 79 Introduction to Decision Analysis ............................................................................................ 82 Past Uses of Decision Analysis................................................................................................. 90 Preliminary Objective Hierarchy .............................................................................................. 91 Identifying Promising Candidate Parcels for Early Acquisition Options................................. 94 Next Steps in the Development Process: Requirements and Limitations................................. 98 Implementing a Combined Right-Of-Way/Asset Management Method within the TxDOT Organizational Setting .............................................................................................................. 99 Concluding Remarks............................................................................................................... 101
Chapter 7: Conclusions and Recommendations ......................................................................... 103 References ................................................................................................................................. 107
viii
LIST OF FIGURES
Page Figure 2-1. Resource Allocation and Utilization Process in Asset Management
(AASHTO 2002). ......................................................................................................... 6 Figure 2-2. Example Types of Physical Assets (TTI 1995)............................................................ 7 Figure 2-3. Example Types of Activities (TTI 1995). .................................................................... 7 Figure 2-4. Example Types of Resources (TTI 1995). ................................................................... 8 Figure 2-5. Components of an Asset Management System (Smith 2005).................................... 10 Figure 3-1. Funding Allocation to Maintenance and New Road Capacity (Hagquist 2006)........ 26 Figure 3-2. Funding Allocation to New Road Capacity and Right-of-Way (Hagquist 2006)...... 27 Figure 3-3. The Cost of Delaying Right-of-Way Advance Purchase (after Hagquist 2006)........ 27 Figure 3-4. Opportunity Cost of Not Accelerating Construction Projects (after
Hagquist 2006). .......................................................................................................... 28 Figure 3-5. Optimal Strategy for Minimizing Cost over a Planning Horizon (after
Hagquist 2006). .......................................................................................................... 28 Figure 3-6. Right-of-Way Acquisition and the Project Development Process. ............................ 36 Figure 3-7. Schematic Diagram of Right-of-Way Parcel Acquisition.......................................... 37 Figure 3-8. Right-of-Way Acquisition Cost versus Time............................................................. 38 Figure 3-9. Risk versus Time during Right-of-Way Acquisition Process. ................................... 38 Figure 4-1. Comparison of Deterministic and Stochastic Project Scheduling.............................. 49 Figure 4-2. Schematic Diagram of Simulation-Based Decision-Support System. ....................... 51 Figure 4-3. Illustration of an Event and Activity Diagram........................................................... 57 Figure 5-1. Average Assessed Land Values (in Dollars per Acre) in the Study by Siethoff
(2000) ......................................................................................................................... 71 Figure 6-1. Overview of the Decision Analytic Asset Management Model from Guikema
and Milke (1999). ....................................................................................................... 83 Figure 6-2. Simple Example Objective Hierarchy........................................................................ 84 Figure 6-3. Example Decision Tree for a Fictitious Right-of-Way Option on a Single
Parcel. ......................................................................................................................... 89 Figure 6-4. Preliminary Objective Hierarchy for TxDOT Transportation Asset Management.... 93 Figure 6-5. Preliminary Approach for Integrating a Combined Asset Management/
Right-of-Way Model into the TxDOT Planning Framework................................... 100
ix
LIST OF TABLES
Page
Table 2-1. Top Literature References in Transportation Asset Management............................... 15 Table 2-2. Literature in Asset Management Practices at U.S. State Departments of
Transportation ............................................................................................................. 18 Table 2-3. Literature in Right-of-Way Asset Management .......................................................... 20 Table 3-1. Funding at a Glance (TxDOT 2003a).......................................................................... 24 Table 3-2. TPP and ROW in Asset Management ......................................................................... 30 Table 4-1. Selected Literature in Simulation ................................................................................ 44 Table 5-1. Selected Literature in Optimization............................................................................. 67 Table 6-1. Example Constructed Scale for the Objective “Maximize Construction Quality” ..... 84


Project 0-5534 September 2006 Report 0-5534-1
1
CHAPTER 1: INTRODUCTION
This report documents the work performed during phase one of Project 0-5534, “Asset
Management—Texas Style.” The overall purpose of the research is to develop state-of-the-
practice asset management methodologies for the Texas Department of Transportation (TxDOT).
These methodologies will support current decision-making processes for allocating funds to the
different asset categories managed by TxDOT. In the long-term, it is envisioned that the benefits
of developing and implementing an enhanced TxDOT asset management framework and practices
will be reflected in lower long-term costs and improved performance of TxDOT-managed
transportation facilities. It is also a goal for the state-of-the-practice asset management
methodologies to be developed to provide better means of communicating TxDOT’s funding
needs to the Texas Transportation Commission and Texas Legislature.
A comprehensive literature review on asset management practices was conducted at the
outset of this project. Also, key administrators and managers within TxDOT were interviewed to
gather additional valuable information. This information allowed the research team to gain a
more complete understanding of TxDOT’s goals and needs and thereby to become better
positioned to meet the research project objectives.
From these interviews our research team discovered that TxDOT upper management was
interested in focusing initial project efforts on selected asset management decisions made in the
Right of Way Division (ROW) and the Transportation Planning and Programming Division (TPP).
Hence, during the first year of this project, the specific focus area of the research was resource
allocation decisions regarding advance acquisition of right-of-way and the construction of new
highway capacity facilities. Simulation, optimization, and decision analysis methodologies were
explored for examining the trade-offs between using funds for these two alternative purposes.
Three small work groups were formed to explore these potential applications for business
methodologies. Credit needs to be given to the individual efforts of these research work groups.
Dr. Richard Feldman and Dr. Dong Hun Kang formed the simulation research group, Dr. Illya
Hicks and Dr. Sergiy Butenko formed the optimization research group, and Dr. Seth Guikema
provided the decision analysis study.

Project 0-5534 September 2006 Report 0-5534-1
2
Working simultaneously and somewhat independently, each group has proposed herein
an approach to provide an asset management solution for TxDOT in the phase one focus area.
The work of each group was overseen by research team management, but each work area was
free to develop potential solutions from their own perspective and area of expertise.
This somewhat unique work methodology is reflected in this report, as each of the three
approaches is presented in a separate chapter. Each approach presents a unique perspective and
should be read and considered independently. The primary advantage of this research approach is
that an expanded number of potential alternatives are provided for addressing the research
problem. At the end of the report, a summary of each potential approach is presented. Some
common activities are identified as the next steps envisioned for this project.
ORGANIZATION OF THE REPORT
This report includes the results of the asset management literature review, a conceptual
schematic overview of the specific problem and ideas to solve it, and detailed descriptions of
potential applications of simulation, optimization, and decision analysis techniques for use by
TxDOT in asset management decision-making processes.
The report is composed of seven chapters. This chapter provides an introduction of the
overall research. It describes project objectives and the nature of the research problem. It also
describes the work methodology followed during phase one of the research and describes the
organization of this report.
Chapter 2 presents a literature review of asset management concepts, asset management
practices in other states, and research efforts focused on right-of-way topics pertinent to early
right-of-way acquisition. The most beneficial information items in each of these three areas are
highlighted in this chapter.
Chapter 3 introduces the conceptual schematic overview that was used as an overall
vision upon which the proposed simulation, optimization, and decision analysis approaches were
developed.
Chapter 4 describes a simulation approach that can be used to assist TxDOT in making
early right-of-way acquisition decisions. An event-driven simulation technique is proposed.
Specific objectives of the early acquisition simulation tool and a list of the various project phases
and tasks needed for completing the development of the simulation approach are presented. The

Project 0-5534 September 2006 Report 0-5534-1
3
output of the proposed simulation model will be a projection of expected annual expenses
associated with the project plus best- and worst-case scenarios representing likely variations in
expenses due to random events.
Chapter 5 discusses optimization-based approaches to investigating resource allocation
options, particularly those related to right-of-way acquisition. A brief introduction to the area of
optimization and its major research directions and developments is provided. The chapter then
describes the data collection and processing procedures, at both district and division levels,
required for successful completion of this project using optimization approaches. Two
alternative optimization approaches for optimal resource allocation are proposed: the top-to-
bottom and the bottom-to-top approaches. The top-to-bottom approach uses two different types
of models. The first model is used to evaluate relative budget needs for early right-of-way
acquisition among districts. It supports decision making done by division personnel and agency
administrators. The second model will assist each district as the districts determine which
projects offer the best use of their allocated budgets for early right-of-way acquisition. On the
other hand, the bottom-to-top approach first applies the detail-involved model at the specific
project and district level, and then uses the results of this analysis to assist allocating the budget
for early right-of-way acquisition among districts.
Chapter 6 summarizes the usefulness of decision and risk analysis techniques for
transportation asset management. Decision analysis can be summarized as an approach for
supporting decisions when input is complex. The development of a hierarchy and utility
function as a methodology to assist in the decision-making process is proposed. The approach
proposed for decision analysis relies primarily on subjective knowledge captured from current
decision makers and practitioners.
Chapter 7 presents the conclusions and recommendations resulting from phase one
research tasks. It also includes a list of activities suggested as the next steps for the second phase
of this project. A list of references cited in this report follows.
Products 0-5534-P1 and 0-5534-P2 are included in this report. Product 0-5534-P1,
“Literature Review,” is Chapter 2, and Product 0-5534-P2, “Potential Optimization, Simulation,
and Decision Analysis Asset Management Applications in Phase One Focus Area,” is composed
of Chapters 4, 5, and 6.


Project 0-5534 September 2006 Report 0-5534-1
5
CHAPTER 2: ASSET MANAGEMENT LITERATURE REVIEW
The literature review included asset management concepts, current asset management
practices and philosophies of other state departments of transportation (DOTs) and the FHWA,
and research efforts focused on right-of-way acquisition. The purpose of this review was to
ensure that TxDOT and the research team will benefit from state-of-the-art concepts and
practices for asset management.
ASSET MANAGEMENT CONCEPTS 1
Asset management is an emerging effort to integrate finance, planning, engineering,
personnel, and information management to assist agencies in managing assets cost-effectively
(AASHTO 1997). In its broadest sense, asset management is defined as “a systematic process of
maintaining, upgrading, and operating assets, combining engineering principles with sound
business practice and economic rationale, and providing tools to facilitate a more organized and
flexible approach to making the decisions necessary to achieve the public’s expectations”
(OECD 2001). The main objective of asset management is to improve decision-making
processes for allocating funds among an agency’s assets so that the best return on investment is
obtained. To achieve this objective, asset management embraces all of the processes, tools, and
data required to manage assets effectively (Nemmers 2004). For this reason asset management is
also defined as “a process of resource allocation and utilization” (AASHTO 2002).
The framework needed to carry out this process effectively encompasses an agency’s
policy goals and objectives, performance measurements, planning and programming, program
delivery, and system monitoring and performance results, as shown in Figure 2-1.
1 The contents of this section have been partially extracted with consent of the author from the unpublished dissertation “Development of a Multi-Objective Strategic Management Approach Oriented to Improve Decisions for Pavement Management Practices in Local Agencies” by Carlos M. Chang-Albitres.

Project 0-5534 September 2006 Report 0-5534-1
6
Figure 2-1. Resource Allocation and Utilization Process in Asset Management
(AASHTO 2002).
Asset management decisions are based on policy goals and objectives. The agency
establishes policy goals and objectives to reflect the desired system condition and target level of
service. Performance measures are selected to express the desired system condition and target
level of service in an objective manner, and to allow tracking of progress toward desired goals.
Planning and programming are complex processes since the agency manages several
types of physical infrastructure facilities, including those illustrated in Figure 2-2. A structured
asset management system should provide information about the effects of investing different
levels of funding in each of these various types of facilities and the effects of investing more in
one type while investing less in another.

Project 0-5534 September 2006 Report 0-5534-1
7
Figure 2-2. Example Types of Physical Assets (TTI 1995).
The agency also decides how to allocate available resources among various types of
activities involved with each type of physical asset. Example activities are illustrated in
Figure 2-3.
Figure 2-3. Example Types of Activities (TTI 1995).

Project 0-5534 September 2006 Report 0-5534-1
8
A structured asset management system must provide information about both the short-
term and long-term impacts of allocating different amounts of resources among those activities.
Additionally, an agency manages many different types of resources, such as those shown in
Figure 2-4, and the structured asset management system should show the impact of limitations
on the different amounts of the various types of resources. These impacts should be expressed in
terms of performance measures.
Figure 2-4. Example Types of Resources (TTI 1995).
Programs developed during the planning stage are delivered and periodically evaluated
by the agency. Results from program delivery are monitored using performance measures to
quantify the asset management program’s effectiveness and to allow timely corrective actions as
needed.
Components of an Asset Management System
An asset management system undertakes several procedures, enhancing different
components, tools, and activities. Asset management systems provide decision makers with
tools for evaluating probable effects of alternative decisions. These tools develop decision-
support information from quantitative data regarding the agency’s resources, current condition of
physical assets, and estimations of their current value.

Project 0-5534 September 2006 Report 0-5534-1
9
According to the Federal Highway Administration (FHWA), to effectively support the
asset management process, an asset management system should include (FHWA 1999):
• strategic goals;
• inventory of assets;
• valuation of assets;
• quantitative condition and performance measures;
• measures of how well strategic goals are being met;
• usage information;
• performance-prediction capabilities;
• relational databases to integrate individual management systems;
• consideration of qualitative issues;
• links to the budget process;
• engineering and economic analysis tools;
• useful outputs, effectively presented; and
• continuous feedback procedures.
These asset management elements can be grouped into five major building blocks: basic
information, performance measures, needs analysis, program analysis, and program delivery.
Figure 2-5 shows in detail the individual components of each building block, providing a
comprehensive view of an asset management system.
Goals, objectives, and policies as well as inventory data are considered in the basic
information block. Condition assessment and desired levels of service are components of the
performance measures block. Performance modeling and prediction along with action and
funding analysis constitute the needs analysis block. Alternative analysis and program
optimization are in the program analysis block. Program development and program
implementation belong to the program delivery block. Finally, performance monitoring and
feedback complete the cycle of the asset management process.

Project 0-5534 September 2006 Report 0-5534-1
10
Figure 2-5. Components of an Asset Management System (Smith 2005).
Basic Starting Information
Goals, Objectives &
Policies
Inventory Data
Performance Measures
Condition Assessment
Desired Levels of Service
Needs Analysis
PerformanceModeling & Prediction
Action & Funding Analysis
Program Analysis
Alternative Analysis
Program Optimization
Program Delivery
Program Development
Program Implementation
Available Funds
Performance Monitoring
Feedback
Project 0-5534 September 2006 Report 0-5534-1
11
Goals, Objectives, and Policies
Asset management is a goal-driven management process. To manage assets effectively,
the decision-making process must be aligned with the agency’s goals, objectives, and policies.
Goals are expressed in terms of objectives to be met over the planning horizon. Policies are
developed to provide the necessary framework to support achieving target objectives. Policies
regarding engineering standards, economic development, community interaction, political issues,
administration rules, and the agency’s organizational structure influence asset management
components.
Data Inventory
The asset inventory contains information about physical location, characteristics, usage,
work history, work planned, costs, resources, and any other information considered relevant by
the agency. Additional information provided by asset management systems may include financial
reports about the agency’s assets, showing both the current economic value and future asset
value estimates. Decisions regarding the type and amount of data to be collected are made based
on the agency’s needs for decision support and available resources.
Condition Assessment
Knowledge of current condition is needed to assess the asset network current scenario.
Condition assessment is expressed in terms of performance measures selected by the agency.
These performance measures should be the ones used by the agency to establish objectives.
Condition indices, percentage of the network system rated in good condition, and remaining life
of the asset network are some examples of performance measures used for physical assets.
Desired Level of Service
Performance measures are also used to establish the desired level of service for the asset
network. Establishing level of service goals for the planning horizon allows the development of
strategies to achieve those goals.

Project 0-5534 September 2006 Report 0-5534-1
12
Performance Modeling
Performance models are used to predict future scenarios for the asset network. Projecting
the asset network condition over the planning horizon serves to identify future funding needs.
Appropriate selection of performance models is essential to effective asset management. The
selection of performance models is based on the types of assets being managed and the data
available in the agency’s data inventory to support the models.
Action and Funding Analysis
Actions considered in the strategy require funding. Funding analysis involves forecasting
the impact of investment strategies on the asset network. This impact is assessed by analyzing
changes in performance measures used by the agency.
Alternative Analysis Methodologies
Program analysis implies studying different alternatives that may be feasible for
implementation. Analytical tools are developed to assist agencies in evaluating the implications
of different investment scenarios and work plan strategies. “What if” analyses are usually
performed to assess the impact of alternative management decisions. This type of analysis is
difficult, if not impossible, without the assistance of analytical tools. Analytical tools to assist
evaluating alternative decisions may involve simulation, life-cycle costing, benefit/cost analysis,
database query, optimization, risk analysis, and other methodologies. Decision-support tools to
assist an agency’s personnel in identifying needs and comparing investment alternatives are
essential in the asset management process.
Program Optimization
The available budget is allocated among a subset of projects requiring funds. Decisions
are made about how to allocate limited funds to new construction, rehabilitation, maintenance,
and rehabilitation projects. The aim is to optimize the use of funds invested by selecting the best
overall group of projects from among all of these funding categories.
Program Development
Project-selection criteria should be established to assist in the selection of the best group
of projects. Having criteria for project selection implies having methods of identifying both

Project 0-5534 September 2006 Report 0-5534-1
13
short- and long-term effects expected from projects. Methods of prioritizing work activities and
selecting projects are based on economic techniques, but social and political factors should also
be considered in the criteria.
Program Implementation
The implementation program must address every aspect of the management process.
Procedures for goal review, policy review, data collection, data storage, data access, condition
assessment, budget development, construction, maintenance, monitoring, and feedback should be
considered in the implementation program. The implementation program should involve all
management levels that participate in the decision-making process. The implementation of an
asset management approach in the programming and budgeting cycle requires continuous
encouragement from upper management as well as commitment from all personnel involved. In
practice, an asset management approach can only succeed if it can support the agency
management process efficiently. The effectiveness of an asset management approach should be
reflected in savings to the agency. However, these benefits can only be achieved if the agency
ensures that the asset management system is properly used at all management levels.
Performance Monitoring
Monitoring the asset performance over the planning horizon serves to assess whether the
desired level of service is being accomplished or not. Performance monitoring requires tracking
performance over time, which allows the agency to detect changes in the asset condition and to
take necessary corrective actions if needed. The desired level of service targeted by the agency
may also be adjusted based on results from implementation.
Feedback
Feedback is an essential activity to maximize the agency’s benefits from an asset
management system. The asset management system should be capable of incorporating lessons
learned from monitoring the ongoing process. Goals, objectives, and the agency’s policies may
be adjusted based on feedback from implementation. However, great care should be taken before
modifying core components of the system. Frequent modifications can damage its credibility.
Major modifications to the system, including changes in database requirements, prediction
models, economic analysis techniques, and reporting tools, deserve careful evaluation. Minor

Project 0-5534 September 2006 Report 0-5534-1
14
changes that simplify the flow of information in the process are preferred. Particularly preferred
are those changes that provide better means of accomplishing the agency’s objectives without
disturbing ongoing activities.
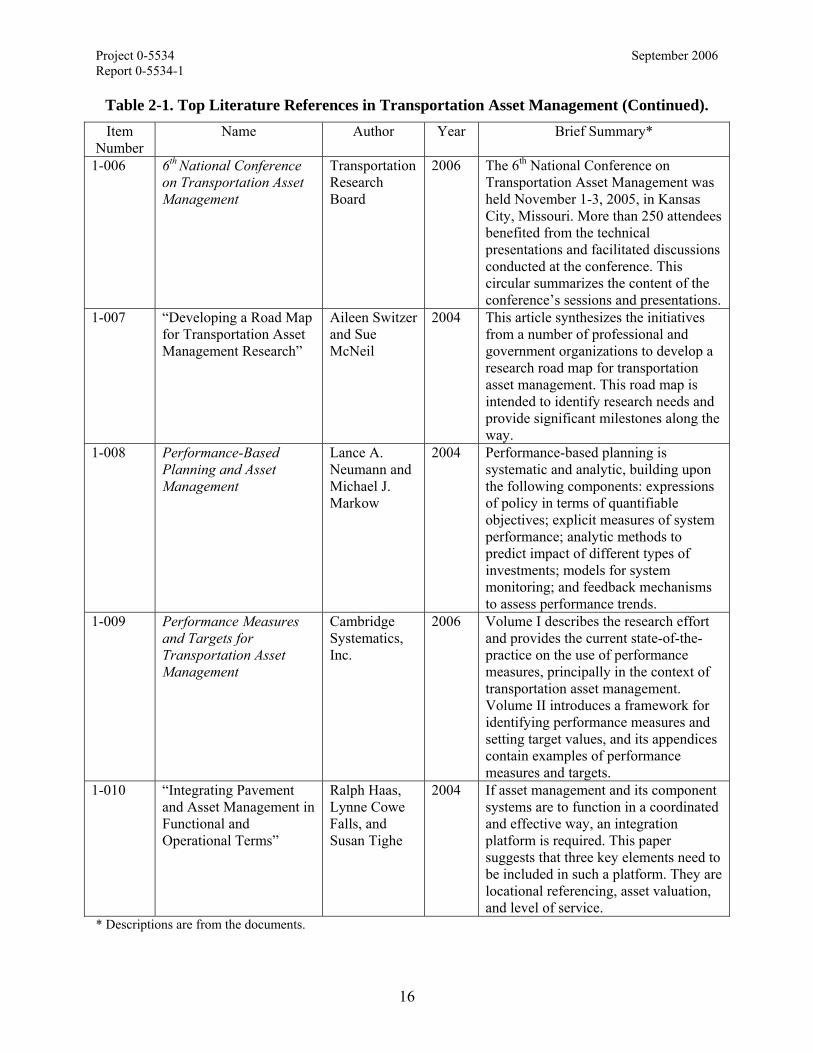
TOP ASSET MANAGEMENT REFERENCES
Top asset management references were identified during the literature review. Selected
top reference items are presented in Table 2-1. In our judgment the items listed in Table 2-1
reflect the current state-of-the-art in asset management. Core principles, concepts, applications,
tools, and practices presented in this selection set the framework for the development and
implementation of asset management.
Table 2-2 lists reference items that present the asset management experience in several
states in the United States. The document on top of the list describes the funding allocation and
project-selection process followed by the Texas Department of Transportation. Specific
experiences in asset management practices conducted in New York, Michigan, Pennsylvania,
Virginia, and Colorado in coordination with the Federal Highway Administration Office of Asset
Management are summarized.
Few research efforts were found that focused on the application of asset management
principles in the right-of-way field. The items found in this area are shown in Table 2-3. TxDOT
right-of-way manuals and previous research conducted for TxDOT were considered the primary
references. In addition to these items, a research report published in 2005 by the Minnesota
Department of Transportation addresses the question of whether there are financial benefits to
acquiring transportation right-of-way far in advance of when the improvement will be done.

Project 0-5534 September 2006 Report 0-5534-1
15
Table 2-1. Top Literature References in Transportation Asset Management. Item
Number Name Author Year Brief Summary*
1-001 AASHTO Transportation
Asset Management Guide Cambridge Systematics, Inc.
2002 This American Association of State Highway and Transportation Officials (AASHTO) guide provides state departments of transportation (DOTs) and other transportation agencies guidance on implementing asset management concepts and principles within their business processes. At its core, asset management deals with an agency’s decisions in resource allocation and utilization in managing its system of transportation infrastructure.
1-002 FHWA Asset Management Primer
U.S. Department of Transportation
1999 This document explains the basics of asset management: What is asset management? Why do we need asset management? An overview of current practices in asset management and a vision into the future for improving the process are presented.
1-003 FHWA “Asset Management Position Paper: White Paper”
Cambridge Systematics, Inc.
2004 This document describes asset management concepts and core principles. White papers for each major area in the asset management program are presented, including infrastructure, planning, operations, safety, environment, right-of-way, and federal lands.
1-004 Analytical Tools for Asset Management
Cambridge Systematics, Inc.
2006 This report presents new analytical tools to support asset management. Emphasis is given to tools needed to assist agencies in trade-off decisions for resource allocation.
1-005 Best Practices for Linking Strategic Goals to Resource Allocation and Implementation Decisions Using Elements of a Transportation Asset Management Program
Midwest Regional University Transportation Center
2004 This report assembles a set of tools, based on the experiences and best practices in a diverse set of states, for linking strategic goals to resource allocation. Based on detailed documentation of the practices in five states—Florida, Maryland, Michigan, Montana, and Pennsylvania—a synthesis of best practice of strategic planning, asset management, and the linkage between the two was developed.
* Descriptions are from the documents.
Project 0-5534 September 2006 Report 0-5534-1
16
Table 2-1. Top Literature References in Transportation Asset Management (Continued). Item
Number Name Author Year Brief Summary*
1-006 6th National Conference
on Transportation Asset Management
Transportation Research Board
2006 The 6th National Conference on Transportation Asset Management was held November 1-3, 2005, in Kansas City, Missouri. More than 250 attendees benefited from the technical presentations and facilitated discussions conducted at the conference. This circular summarizes the content of the conference’s sessions and presentations.
1-007 “Developing a Road Map for Transportation Asset Management Research”
Aileen Switzer and Sue McNeil
2004 This article synthesizes the initiatives from a number of professional and government organizations to develop a research road map for transportation asset management. This road map is intended to identify research needs and provide significant milestones along the way.
1-008 Performance-Based Planning and Asset Management
Lance A. Neumann and Michael J. Markow
2004 Performance-based planning is systematic and analytic, building upon the following components: expressions of policy in terms of quantifiable objectives; explicit measures of system performance; analytic methods to predict impact of different types of investments; models for system monitoring; and feedback mechanisms to assess performance trends.
1-009 Performance Measures and Targets for Transportation Asset Management
Cambridge Systematics, Inc.
2006 Volume I describes the research effort and provides the current state-of-the-practice on the use of performance measures, principally in the context of transportation asset management. Volume II introduces a framework for identifying performance measures and setting target values, and its appendices contain examples of performance measures and targets.
1-010 “Integrating Pavement and Asset Management in Functional and Operational Terms”
Ralph Haas, Lynne Cowe Falls, and Susan Tighe
2004 If asset management and its component systems are to function in a coordinated and effective way, an integration platform is required. This paper suggests that three key elements need to be included in such a platform. They are locational referencing, asset valuation, and level of service.
* Descriptions are from the documents.

Project 0-5534 September 2006 Report 0-5534-1
17
Table 2-1. Top Literature References in Transportation Asset Management (Continued).
* Descriptions are from the documents.
Item Number
Name Author Year Brief Summary*
1-011 Transportation Asset Management in Australia, Canada, England, and New Zealand
David Geiger et al.
2005 FHWA, AASHTO, and the National Cooperative Highway Research Program (NCHRP) sponsored a scanning tour to observe asset management experiences, techniques, and processes in the four countries. In this study, the U.S. team observed that asset management as an organizational culture and decision-making process is critical to transportation programs facing significant capital renewal and preservation needs and that successful programs require top-level commitment.

Project 0-5534 September 2006 Report 0-5534-1
18
Table 2-2. Literature in Asset Management Practices at U.S. State Departments of Transportation.
Item Number
Name Author Year Brief Summary*
2-001
Project Selection Process
Texas Department of Transportation
2003 This document explains the funding allocation and project-selection process followed by the Texas Department of Transportation. Five steps are considered in the project-selection process: identify needs, consider funding, planning, project development, and construction.
2-002 Economics in Asset Management— The New York Experience
FHWA 2003 This case study shows the effort of the New York Department of Transportation (NYDOT) to implement asset management. NYDOT has developed a prototype Transportation Asset Management (TAM) trade-off model that employs economic trade-off analysis to compare the dollar value of customer benefits to investment costs among competing investment candidates. The model ranks the candidate projects by rate of return.
2-003 Data Integration— The Pennsylvania Experience
FHWA 2004 The Pennsylvania Department of Transportation (PENNDOT) is simultaneously implementing top-down and bottom-up approaches to data integration. The central component of this process is a series of projects to update the department’s highway, bridge, and maintenance management practices, and the legacy systems that support them. PENNDOT’s approach to data integration combines strategic business process improvements with information technology (IT) enhancement.
* Descriptions are from the documents.

Project 0-5534 September 2006 Report 0-5534-1
19
Table 2-2. Literature in Asset Management Practices at U.S. State Departments of Transportation (Continued).
Item Number
Name Author Year Brief Summary*
2-004 Data Integration— The Michigan Experience
FHWA 2003 In 1991, the Intermodal Surface Transportation Efficiency Act (ISTEA) provided the impetus for a comprehensive redesign of the Michigan Department of Transportation’s (MDOT) business practices within an asset management framework, with data management as a key requirement for the decision-making process. To support the decision-making process, MDOT began its data integration effort by building the Transportation Management System (TMS), migrating key planning, programming, and project-delivery data from a mainframe to a user-friendly environment.
2-005 Data Integration— The Virginia Experience
FHWA 2004 The Virginia Department of Transportation (VDOT) initiated the development of infrastructure decision-support systems and a large data collection program, referred to as the Inventory and Condition Assessment System (ICAS). VDOT’s new data integration strategy has enabled it to make significant progress in the development of decision-support tools and the integration of asset management data without waiting for the details of the final asset management system. In 2003, VDOT completed the needs-based budget request module for the asset management system.
2-006 Data Integration— The Colorado Experience
FHWA 2004 Since 2000, the Colorado Department of Transportation (CDOT) has undertaken several important initiatives designed to improve transportation planning, decision making, and resource allocation. CDOT approached the issue of data integration to support asset management from both the policy and information technology perspectives. CDOT established a strong policy framework to support asset management and data integration.
* Descriptions are from the documents.

Project 0-5534 September 2006 Report 0-5534-1
20
Table 2-3. Literature in Right-of-Way Asset Management. Item
Number Name Author Year Brief Summary*
3-001
ROW Manual: Volume 1—ROW Procedures Preliminary to Release
TxDOT 2005 This eight-volume manual is intended to provide guidance in the acquisition of right-of-way for transportation projects. The manual represents the current information and operating practices for acquisition of right-of-way for transportation projects, property management relating to right-of-way, and the highway beautification program. Volume 1 consists of the four chapters: “Project Development Overview,” “Contractual Agreements,” “Acquisition Coordination,” and “Surveying, Maps, and Parcels.”
3-002
ROW Manual: Volume 2—Right of Way Acquisition
TxDOT 2006 Volume 2 of the ROW Manual addresses the requirements and the procedures for right-of-way acquisition in detail. Administrative requirements before and after the project releases, types of project releases, and advance acquisition of right-of-way are described in the manual.
3-003 The Financial Benefits of Early Acquisition of Transportation Right of Way
Minnesota Department of Transportation
2005 This report addresses the question of whether there are financial benefits to acquiring transportation right-of-way far in advance of when the improvement will be done. The first part of the analysis is very general, comparing rates of price increase for different types of properties to the opportunity costs of holding land, over a long historical period. The second part of the analysis focuses on Minnesota and examines property price increases by county over shorter, more recent, time periods.
* Descriptions are from the documents.

Project 0-5534 September 2006 Report 0-5534-1
21
Table 2-3. Literature in Right-of-Way Asset Management (Continued). Item
Number Name Author Year Brief Summary*
3-004 Right-of-Way Costs and
Property Values: Estimating the Costs of Texas Takings and Commercial Property Sales Data
Center for Transportation Research, The University of Texas
2004 Right-of-way cost estimation models are proposed using acquisition data from Texas corridors and separate databases of full-parcel commercial sales transactions for Texas’ largest regions. A budget estimation tool developed in Excel was one of the products of this research.
3-005 The Costs of Right of Way Acquisition: Methods and Models for Estimation
Jared D. Heiner and Kara M. Kockelman
2004 This paper presents a literature review of related right-of-way acquisition and property valuation. It describes the appraisal process and the influence of federal law on acquisition practices. It provides hedonic-price models for estimation of costs associated with taking property using recent acquisition data from several Texas corridors and full-parcel commercial sales transactions in Texas’ largest regions.
* Descriptions are from the documents.


Project 0-5534 September 2006 Report 0-5534-1
23
CHAPTER 3: CONCEPTUAL SCHEMATIC RESEARCH PROBLEM OVERVIEW
A conceptual schematic overview as an overall vision for addressing the research
problem is presented in this chapter. This overall vision was used as a preliminary framework
upon which the simulation, optimization, and decision analysis approaches were crafted. Most
of the thoughts presented in this chapter were provided by Ron Hagquist, TxDOT project
director for this project. Many other valuable ideas came from interviews with TxDOT
administrators and managers and from documentation in the focus research area. All this
information allowed assembling the conceptual schematic overview. Our research team would
not have been able to develop the simulation, optimization, and decision analysis approaches
presented in the next chapters of this report without direction and close guidance from TxDOT.
TxDOT upper management provided the overall direction for the project. Guidance from
meetings with the Transportation Planning and Programming Division and Right of Way
Division allowed establishing the ultimate goal for this project, which is examining the trade-offs
between using funds for advance purchase of right-of-way and using those funds for accelerating
completion of new or additional-capacity projects.
FUNDING ALLOCATION AND DECISION MAKING AT TXDOT
Texas is currently faced with the need to fund many more transportation projects than the
available funding will cover, a situation for which no end appears to be in sight. So it is essential
that TxDOT maximize the effectiveness of the various funding sources available to them. One
of the prime considerations has been, and remains, to make certain that all federal funding
allocated to Texas is utilized. TxDOT has always been able to accomplish this goal. With the
ever-increasing needs in transportation, it becomes equally important to make the most
advantageous use of other funding sources: state and local funds, along with tolls and bonds.
TxDOT funding categories are presented in the document “Project Selection Process”
(TxDOT 2003a) published by TxDOT. There are 12 funding categories, as shown in Table 3-1.
The project-selection process in each category and sources of funding are summarized in this
table.

Project 0-5534 September 2006 Report 0-5534-1
24
Table 3-1. Funding at a Glance (TxDOT 2003a).
Funding Category Starting Point Project Selection Usual Funding
Preventive Maintenance and
Rehabilitation
TxDOT District Projects selected by districts.
Federal 90 percent, State 10 percent; or Federal 80 percent, State 20 percent; or State 100 percent
Mai
ntai
n It
Structures Replacement and
Rehabilitation
TxDOT District
Commission approves projects statewide on a cost-benefit basis using the Texas Eligible Bridge Selection System (TEBSS).
Federal 80 percent, State 20 percent; or Federal 80 percent, State 10 percent, Local 10 percent; or State 100 percent
Metropolitan Area Corridor Projects
TxDOT District
Commission approves projects in corridors. Projects scheduled by consensus of districts.
Federal 80 percent, State 20 percent; or State 100 percent
Urban Area Corridor Projects
TxDOT District
Commission approves projects in corridors. Projects scheduled by consensus of districts.
Federal 80 percent, State 20 percent; or State 100 percent
Statewide Connectivity
Corridor Projects
TxDOT District
Commission approves projects in corridors. Projects scheduled by consensus of districts.
Federal 80 percent, State 20 percent; or State 100 percent
Congestion Mitigation and Air
Quality Improvement
Metropolitan Planning
Organization (MPO)
Projects selected by MPOs in consultation with TxDOT and the Texas Commission on Environmental Air Quality and funded by districts. Commission allocates money based on population percentages within areas failing to meet air quality standards.
Federal 80 percent, State 20 percent; or Federal 80 percent, Local 20 percent
Metropolitan Mobility/
Rehabilitation MPO
Projects selected by MPOs in consultation with TxDOT and funded by district’s Allocation Program. Commission allocates money based on population.
Federal 80 percent, State 20 percent; or Federal 80 percent, Local 20 percent; or State 100 percent
Safety Federal Hazard
Elimination Program and Federal Railroad
Safety Signal Program
TxDOT District
Projects selected statewide by federally mandated safety indices and prioritized listing. Commission allocates funds to districts.
Federal 90 percent, State 10 percent; or State 100 percent
Transportation Enhancements
TxDOT District
Local entities make recommendations, and a TxDOT committee reviews them. Projects selected and approved by commission on a per-project basis.
Federal 80 percent, State 20 percent; or Federal 80 percent, Local 20 percent
Bui
ld It
Miscellaneous State Park Roads, Railroad Grade
Crossings Replanking, Railroad Signal Maintenance,
and Construction Landscaping
TxDOT District, Texas
Parks and Wildlife Dept.,
Other (Federal
Allocation)
Projects selected statewide by Traffic Operations Division or Texas Parks and Wildlife Department. Local projects selected by districts. Commission allocates funds to districts or approves participation in federal programs with allocation formulas.
State 100 percent; or Federal 80 percent, State 20 percent; or Federal 100 percent

Project 0-5534 September 2006 Report 0-5534-1
25
Table 3-1. Funding at a Glance (TxDOT 2003a) (Continued).
Funding Category Starting Point Project Selection Usual Funding
District Discretionary TxDOT District
Projects selected by districts. Commission allocates money through Allocation Program.
Federal 80 percent, State 20 percent; or Federal 80 percent, Local 20 percent; or State 100 percent B
uild
It
Strategic Priority Commission Commission selects these projects on a project-specific basis.
Federal 80 percent, State 20 percent; or State 100 percent
Since funding is limited, from whatever sources, determining best use of the funding
results in “trade-offs” among the different aspects of TxDOT’s objectives. For example, if funds
are used to purchase right-of-way, funds available for construction projects or other areas of
operation would be reduced by that amount, and vice versa. With new legislation allowing
TxDOT to purchase options on future right-of-way purchases, and the possibility of obtaining
legislation that could allow advance right-of-way purchases, it becomes especially important that
the amount of funding utilized for right-of-way be optimized. The benefit of early right-of-way
acquisition is avoidance of escalating costs. Project planning and letting schedule predictability
would also be considerably improved where early acquisition is most appropriate. On the other
hand, the benefits of accelerating project completion are (1) avoiding highway construction cost
increases and (2) earlier delivery of transportation benefits to travelers.
ALLOCATING FUNDS BETWEEN MAINTENANCE AND NEW ROAD CAPACITY
CONSTRUCTION
The initial trade-off of allocating funds between maintenance and new road capacity
construction projects is illustrated in Figure 3-1.

Project 0-5534 September 2006 Report 0-5534-1
26
Figure 3-1. Funding Allocation to Maintenance and New Road Capacity (Hagquist 2006).
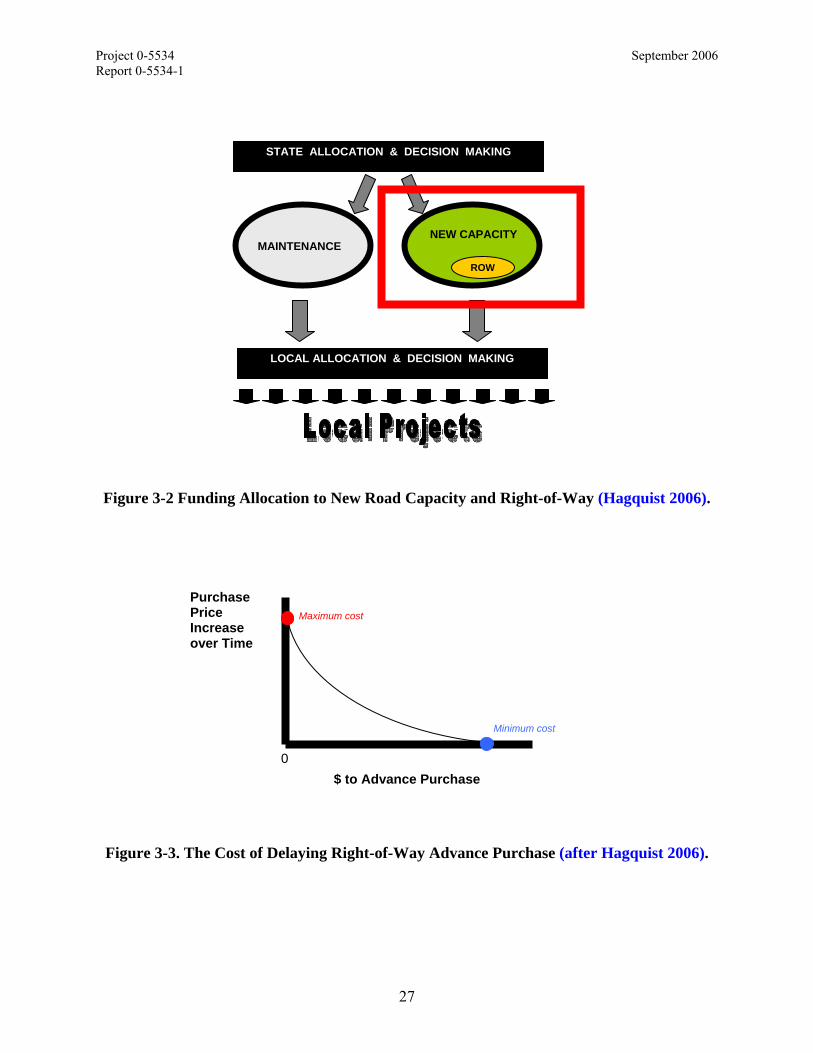
The specific area of focus of this research is the new road capacity and right-of-way as
shown in Figure 3-2. Specifically, the challenge is to find if there is an optimal strategy for
advance purchase of right-of-way, with the aim that this strategy would minimize the combined
costs of right-of-way purchase and delay of new or additional capacity projects. The potential
cost impact of delaying right-of-way advance purchase is shown in Figure 3-3. The opportunity
cost of not accelerating construction projects is illustrated in Figure 3-4.
MAINTENANCE NEW CAPACITY
LOCAL ALLOCATION & DECISION MAKING
STATE ALLOCATION & DECISION MAKING
ROW
Project 0-5534 September 2006 Report 0-5534-1
27
Figure 3-2 Funding Allocation to New Road Capacity and Right-of-Way (Hagquist 2006).
Figure 3-3. The Cost of Delaying Right-of-Way Advance Purchase (after Hagquist 2006).
NEW CAPACITY
LOCAL ALLOCATION & DECISION MAKING
STATE ALLOCATION & DECISION MAKING
ROW
MAINTENANCE
Purchase Price Increase over Time
$ to Advance Purchase
Maximum cost
Minimum cost
0

Project 0-5534 September 2006 Report 0-5534-1
28
Figure 3-4. Opportunity Cost of Not Accelerating Construction Projects
(after Hagquist 2006).
It may be feasible that by combining these two situations for a fixed budget, an optimal
strategy for minimizing cost over a planning horizon can be found, as illustrated in Figure 3-5.
Figure 3-5. Optimal Strategy for Minimizing Cost over a Planning Horizon
(after Hagquist 2006).
Value to TxDOT And Travelers
$ to Project Acceleration
0 100
Maximum value
Sum of right-of-way Inflation and Project Delay Opportunity
0 $ to Project Acceleration
Maximum $ to projects; Minimum project delay; Maximum ROW Maximum $ to advance ROW
100 $ to Advance Right-of-Way
Least total cost strategy

Project 0-5534 September 2006 Report 0-5534-1
29
Challenges in Solving the Funding Allocation Problem
The ideas presented in the previous section of this chapter give us a conceptual schematic
overview of the funding allocation problem between right-of-way acquisition and new
construction capacity. In the real world the problem is more complex and poses a great
challenge. The complexity of the problem is due to different aspects. Some of the aspects to be
considered in formulating a practical approach to address this challenge include:
• the interrelationship between right-of-way and project construction,
• the highly complex sequence of decisions and events in the right-of-way acquisition
process, and
• the possibility of buying and exercising right-of-way purchase options.
This challenge may be approached in several ways using techniques from simulation,
optimization theory, or decision analysis, or some combination of these.
The following sections of this chapter contain a summary of an asset management
perspective for transportation planning and programming and right-of-way; an overview of the
right-of-way acquisition process; and additional thoughts on right-of-way acquisition, early
purchase, and cost impacts. These sections set the framework for understanding the complexity
of the research problem being addressed.
TPP AND ROW FROM AN ASSET MANAGEMENT PERSPECTIVE
In order to provide an asset management perspective to the Transportation Planning and
Programming Division and the Right of Way Division, information regarding goals and
objectives, performance measures, options and trade-offs, required information, current analysis
methods, and implementation processes and practices are summarized in Table 3-2. The source
of reference for this information is “FHWA Asset Management Position Paper: White Paper”
(FHWA 2004).

Project 0-5534 September 2006 Report 0-5534-1
30
Table 3-2. TPP and ROW in Asset Management.
Transportation Planning and Programming Division Right of Way Division
Goals and Objectives
• cost-effectiveness • preservation of the existing system • mobility increase • accessibility increase • safety and security improvement • congestion relief • economic development • environmental protection
• cost-effectiveness of providing right-of-way for projects
• timeliness of providing right-of-way for projects
• minimizing cost of right-of-way acquisition
• minimizing risk of right-of-way acquisition
• compliance with federal and state law • cost-effectiveness of property
management while ensuring safety and environmental protection
• managing access to highway facilities Performance Measures
• level of service • travel time reliability • percentage of roadway lane-miles in good
or excellent condition • percentage of bridges that are structurally
sound • percentage of bridges on arterials without
weight restrictions • deferred maintenance expense • incident rates • incident response time • emissions • wetland acreage • community cohesion • life-cycle costs • user costs
• percentage of parcels acquired through negotiation
• length of property acquisition process and lead time required to close
• percentage of right-of-way costs spent on litigation
• percentage of construction costs associated with right-of-way acquisition
• average time needed to relocate residents
• average time needed to relocate businesses
• average payments • customer satisfaction surveys
Options and Trade-Offs
• among preservation, operations, and capacity expansion expenditures
• between passenger and freight mobility • among modal and intermodal options • among different geographic areas or
functional systems • balancing safety, mobility, environmental,
and equity objectives
• corridor location and alignments • timing of property acquisition and
disposal • incorporation of right-of-way activities
within design-build contracts • access management provisions • corridor management preservation
techniques • property management options and
practices Required Information
• socioeconomic data, including growth projections
• current traffic volumes and trip patterns • transportation supply characteristics • facility inventory, condition, and
performance • crash data • congestion/travel time • environmental data • vehicle fleet characteristics
• complete, accurate, and current information on property holdings
• real property and relocation costs by parcel, project type, and location
• time requirements for different project phases by project type and location
• environmental characteristics of parcels and mitigation needed
• success and risk factors assessment from past experience

Project 0-5534 September 2006 Report 0-5534-1
31
Table 3-2. TPP and ROW in Asset Management (Continued).
Transportation Planning and Programming Division Right of Way Division
Current Analysis Methods
• travel demand modeling and traffic simulation
• infrastructure management methods • strategy impact assessment • benefit-cost analysis • air quality modeling
• scheduling • property acquisition cost estimation • revenue estimation • land valuation • geographic information systems (GIS)
analysis Implementation Processes and Practices
• long-range plan development and updates • corridor and regional planning • performance measurement and
monitoring • transportation improvement program
development • linkages among planning, programming,
and budgeting
• analysis of corridor development, preservation options, and joint development opportunities in long-range planning
• estimation and updates of right-of-way needs, costs, and mitigation requirements
• planning and scheduling of right-of-way acquisition to allow sufficient time for completion before construction
• operations and maintenance of right-of-way
OVERVIEW OF THE RIGHT-OF-WAY ACQUISITION PROCESS
Right-of-way acquisition is an essential part of the project development process. When a
project is initiated, it goes through various steps before the beginning of actual construction.
General steps in the project development process consist of planning and programming,
preliminary design, environmental clearance, right-of-way acquisition, and construction. Project
development is a time-consuming process and varies typically from 3 to 10 years. Among the
project development procedures, environmental clearance and right-of-way acquisition take up a
significant portion of the total time before construction.
The right-of-way acquisition process can be divided into five general phases (TxDOT
2006c):
• Planning: This phase involves environmental studies and public involvement as well as
location and design studies. A new highway may require extensive environmental
studies, while a minor improvement on an existing road may only require a relatively
brief study.
• Appraisal: This phase deals with appraiser qualifications, appraisal requirements,
property evaluations, report formats, review responsibilities, etc.

Project 0-5534 September 2006 Report 0-5534-1
32
• Negotiation: This phase deals with local public agencies’ (LPAs) offers to acquire the
required property, prompt payment for such property, serve notices to vacate, assure
retention of improvements, etc. If the negotiations fail, the process moves into eminent
domain via condemnation proceedings.
• Property management: This phase deals with disposition of improvements acquired in the
purchase of right-of-way and methods for accomplishing the clearing of right-of-way.
• Relocation: This phase deals with making provisions for the fair and equitable treatment
of persons displaced as a result of federal or federally assisted and state programs in order
that such persons shall not suffer disproportionate injuries as a result of programs
designed for the benefit of the public as a whole.
Right-of-Way Procedures prior to Release
A summary of right-of-way procedures prior to release is included in this section. The
understanding of these procedures is important to propose a realistic approach for successfully
addressing the challenge posed in the research problem. The source of information for this
summary is the TxDOT ROW Manual (TxDOT 2006c).
Funding
Funding involves a sequence of consecutive steps from the time the right-of-way acreage
is being considered for acquisition until it is determined if there are enough funds to proceed
with the acquisition. The procedure to secure funding requires three steps as follows:
1. Determine right-of-way acreage needed.
2. Determine the approximate cost of acquiring needed right-of-way.
3. Determine the availability of funding at the local, state, and federal levels.
Planning and Sequence of Project Development
The planning of project development phase starts with actions preliminary to the right-of-
way acquisition process and ends with a contractual agreement. The sequence of project
development is described in the following steps:
Project 0-5534 September 2006 Report 0-5534-1
33
1. Actions preliminary to the right-of-way acquisition process: Right-of-way acquisition
requirements and information for obtaining Priority 1 authorization are discussed in the
TxDOT Project Development Process Manual (TxDOT 2003b). There is a targeted
percentage of right-of-way acquisition that should be complete for priority status, but the
percentage may vary depending on the size of the right-of-way project. To verify that a
project can be constructed as a Priority 1 status project, evaluate the project’s amount of
right-of-way acquired to date. This evaluation minimizes the possibility of right-of-way
acquisition delaying a letting and demonstrates the importance of involving ROW staff in
project development. Initial right-of-way acquisition is authorized when Priority 2
authorization is obtained. Priority 2 status is required for right-of-way acquisition
authorization. Long Range Project (LRP) status is obtained as the last and lowest level of
project development.
2. Sequence of right-of-way project development:
• Preliminary requirements (authorization must be deferred until these preliminary
requirements are complete):
a. The commission approves the program.
b. The schematics are approved.
c. Public involvement requirements are met (public hearing).
d. Environmental clearance is given.
e. Full release from the ROW and issuance of the General Expenditure occurs.
• The district is responsible to plan project development to completion:
a. Establish early coordination with utilities and railroads.
b. Acquire right-of-way.
c. Relocate displaced persons or businesses.
d. Remove improvements.
e. Coordinate required utility adjustments.
f. When negotiation is unsuccessful, eminent domain (ED) proceedings occur.
3. Project development meetings: The two meetings required for most projects are the
Preliminary Design Conference and the Design Conference. Each of these meetings
should allow sharing information and discussing right-of-way issues.

Project 0-5534 September 2006 Report 0-5534-1
34
4. Contractual agreement with LPAs: The Transportation Code, §203.051, authorizes
TxDOT to acquire whatever interest in any property that is needed for highway right-of-
way purposes. Usually, TxDOT will enter into an agreement with an LPA that
established responsibilities of each agency in the acquisition process. The Transportation
Code, §224.002, (TxDOT 2006c) states that an LPA must acquire highway right-of-way
as requested by TxDOT. The statutory authority allowing LPAs to contract with TxDOT
for acquiring needed right-of-way is found in the Transportation Code, §224.005. Terms
and conditions of any agreement entered into, by, and between TxDOT and an LPA are
determined between the parties. The Transportation Code, §224.005, provides that
TxDOT must reimburse an LPA not less than 90 percent of the cost of the right-of-way.
Right-of-Way Acquisition A description of types of project releases in right-of-way acquisition, advance acquisition
of right-of-way, and requirements and approval for advance acquisition by state legislators is
presented in this section.
Types of Project Releases
The types of project releases are:
• advance acquisition,
• limited release for utility investigation,
• limited release for appraisal work only,
• partial lease,
• full lease,
• limited release for relocation assistance only,
• limited release for utility work only, and
• release for preliminary engineering.
Advance Acquisition of Right-of-Way
Advance acquisition is defined as right-of-way acquisition that occurs before normal
release for acquiring right-of-way is given on a transportation project. Examples of advance
acquisition include the following:

Project 0-5534 September 2006 Report 0-5534-1
35
• Hardship acquisition is early acquisition of a parcel on a right-of-way project at the
property owner’s request to alleviate particular hardship to the owner. This does not
include hardship due solely to an inability to sell the property.
• Protective buying is early parcel acquisition to prevent imminent parcel development that
would materially increase right-of-way costs or tend to limit the choice of highway
alternatives. The parcel must be needed for a proposed transportation project.
• Donation is the acquisition of land for right-of-way purposes for no consideration, and
such acquisition must be in accordance with the provisions of Right of Way Donations
and Exchanges and Additional Requirements for Submissions for Advance Acquisition
through Donation.
General Requirements for Advance Acquisition by the State
There are general requirements to be met for advance acquisition by the state. The
general requirements for advance acquisition of right-of-way are:
• the status of environmental impact statement development;
• justification for the preferred alignment;
• the estimated date for normal right-of-way acquisition authorization;
• an appropriate segment of the schematic or right-of-way map, or a sketch of the parcel
involved; and
• the date on which TxDOT made a public announcement of the preferred location or the
status of the public hearing if federal funds are involved.
Other Types of Requirements for Advance Acquisition by the State
Some other types of requirements for advance acquisition of right-of-way by the state
are:
• requirements for hardship acquisition submissions,
• requirements for protective buying submissions, and
• requirements for submissions for advance acquisition through donation.
Approval of Advance Acquisition by the State
Federal regulations and TxDOT policy and procedure necessitate these requirements.
However, fulfilling these requirements is not merely a matter of documentation. District

Project 0-5534 September 2006 Report 0-5534-1
36
personnel must possess personal knowledge of the situation in all advance acquisition cases to
complete submissions properly and to answer possible additional questions. Advance acquisition
must be approved by FHWA if federal funds are involved.
When advance acquisition is approved, ROW will issue a formal release, relating to the
specific advance acquisition parcel(s), to the district. The district may then proceed with the
advance acquisition.
RIGHT-OF-WAY ACQUISITION, EARLY PURCHASE, AND COST IMPACTS
The right-of-way acquisition process typically begins after environmental clearance is
obtained. The required parcels are identified, appraised, negotiated, and purchased from the
owners. The right-of-way acquisition could take place between point A and point B as shown in
Figure 3-6.
Figure 3-6. Right-of-Way Acquisition and the Project Development Process.
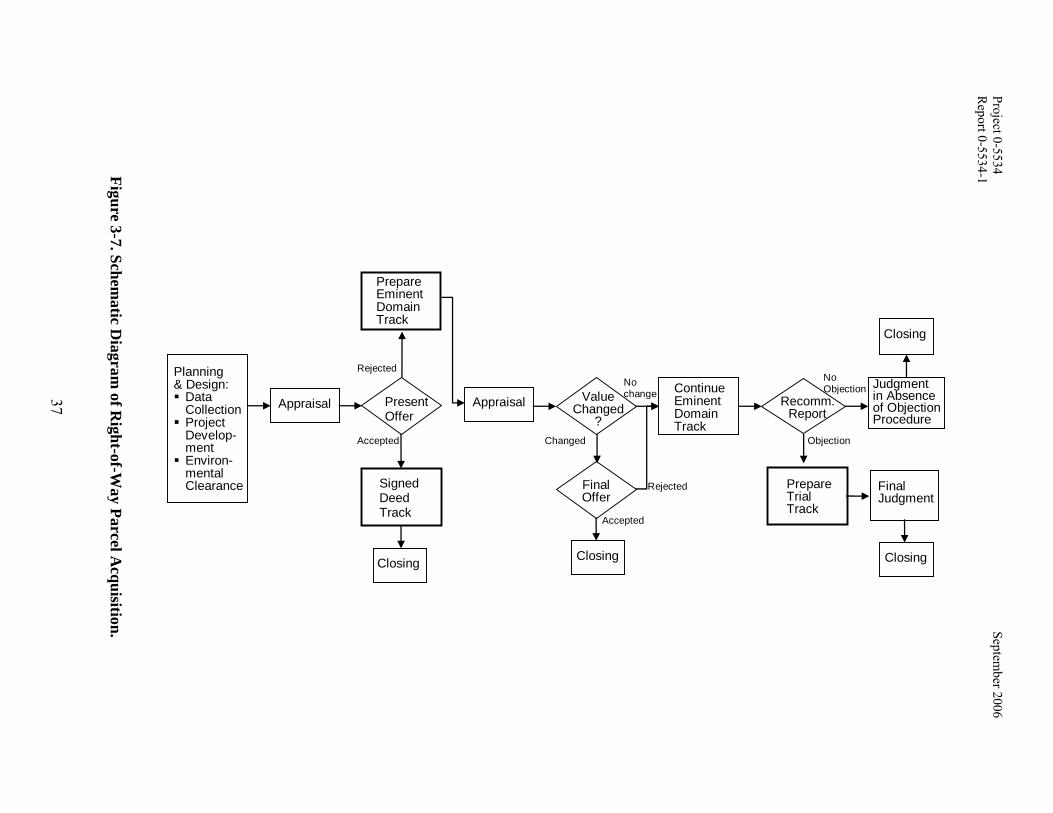
Generalization of the whole right-of-way acquisition process is difficult because the
acquisition process itself is a case-based specific process with many factors and conditions
involved. A schematic diagram of the right-of-way parcel acquisition process is shown in
Figure 3-7.
Planning and Programming
Preliminary Design
Environmental Studies
Right-of-Way
Plan, Specification & Estimate Development
Letting
Time A B
Utility Adjustments
Project Initiation
Construction
(0.5-1 yr.)
(0.2-1 yr.)
(0.5-2 yr.)
(0.5-2 yr.)
(0.5-2 yr.)
Construction
Project 0-5534
September 2006
R
eport 0-5534-1
37
Figure 3-7. Schematic D
iagram of R
ight-of-Way Parcel A
cquisition.
Planning & Design: Data Collection
Project Develop-ment
Environ-mental Clearance
Appraisal Present Offer
Signed Deed Track
Prepare Eminent Domain Track
Appraisal ValueChanged
?
FinalOffer
Continue Eminent Domain Track
Closing
Recomm.Report
PrepareTrial Track
Closing
FinalJudgment
Closing
Judgmentin Absence of Objection Procedure
Closing
Rejected
Accepted Changed
No change
Accepted
Rejected
Objection
No Objection
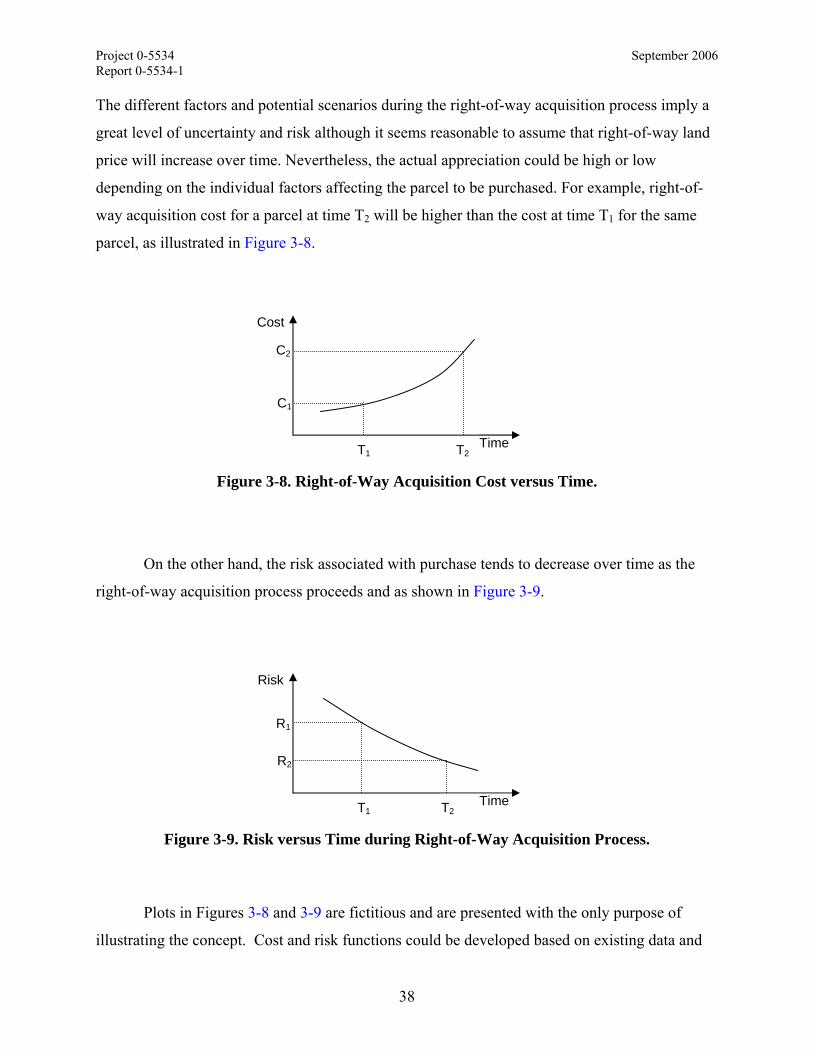
Project 0-5534 September 2006 Report 0-5534-1
38
The different factors and potential scenarios during the right-of-way acquisition process imply a
great level of uncertainty and risk although it seems reasonable to assume that right-of-way land
price will increase over time. Nevertheless, the actual appreciation could be high or low
depending on the individual factors affecting the parcel to be purchased. For example, right-of-
way acquisition cost for a parcel at time T2 will be higher than the cost at time T1 for the same
parcel, as illustrated in Figure 3-8.
Figure 3-8. Right-of-Way Acquisition Cost versus Time.
On the other hand, the risk associated with purchase tends to decrease over time as the
right-of-way acquisition process proceeds and as shown in Figure 3-9.
Figure 3-9. Risk versus Time during Right-of-Way Acquisition Process.
Plots in Figures 3-8 and 3-9 are fictitious and are presented with the only purpose of
illustrating the concept. Cost and risk functions could be developed based on existing data and
Time
Cost
T1 T2
C1
C2
Time
Risk
T1 T2
R2
R1

Project 0-5534 September 2006 Report 0-5534-1
39
expert opinion. These functions could be used in simulation, optimization, or decision analysis
techniques. A simulation model could be built to generate possible outcomes from given
conditions considering cost and time spent over the right-of-way acquisition process.
Optimization techniques can be used to find optimal combinations of projects which minimize
total right-of-way cost while satisfying relevant constraints imposed by individual projects.
Decision analysis techniques can incorporate risk assessment through the right-of-way
acquisition process.
The following chapters present the approaches developed from each management science
perspective. Each approach proposed in this report is considered unique and has been
independently developed by small research groups. The content in the chapters represents the
vision of each research group to face the challenge described in this chapter. It is recommended
that the reader interpret the approaches independently. Comments regarding future steps based
on the proposed approaches are presented in the final chapter of the report.


Project 0-5534 September 2006 Report 0-5534-1
41
CHAPTER 4: SIMULATION
Dr. Richard M. Feldman and Dr. Dong Hun Kang are the authors of this chapter.
Dr. Feldman and Dr. Kang explore the potential application of simulation techniques to address
the right-of-way early acquisition question at TxDOT. Comments from the research team
management about the simulation approach are presented in Chapter 7: Conclusions and
Recommendations.
ABSTRACT
The purpose of this chapter is to present our research plan for developing a simulation
tool that can be used to aid in the early right-of-way acquisition decision. Simulation is a
programming technique used for incorporating stochastic behavior into a system model. This
chapter contains a short description of the concepts behind event-driven simulations, gives the
specific objectives of the early acquisition simulation tool, lists the various project phases and
tasks needed for completing the development of the simulation, and provides an illustration
demonstrating that a deterministic model of a stochastic system can produce inaccurate results.
The model to be developed here will be a simulation of the Plan Authority and Develop
Authority phases of a TxDOT project. The output from the model will be potential actions
relating to early right-of-way acquisitions and a projection of expected annual costs for the
project plus their tail probabilities (20 percentile and 80 percentile points).
INTRODUCTION
The decisions involved in acquiring right-of-way are a key feature to good asset
management, since asset management deals with the efficient allocation of funds for planning,
building, and maintaining the state’s transportation assets. For purposes of this chapter, right-of-
way acquisition will be considered within the context of a single project. We shall present here a
methodology for developing a tool that can be used for the optimal acquisition of the required
right-of-way necessary for the successful completion of a given transportation project.
The project development process is divided into four phases: Feasibility Study, Plan
Authority, Develop Authority, and Contract Authority. For purposes of this research effort, early

Project 0-5534 September 2006 Report 0-5534-1
42
acquisition of right-of-way is defined to be any effort to purchase right-of-way during the Plan
Authority phase of project development. In addition, early acquisition is defined to be either the
actual purchase of right-of-way (not currently possible) or the purchase of an option to buy right-
of-way within a proposed project corridor. Although the immediate purchase of property
without the use of an option to buy during the early acquisition phase is not currently permitted,
our methodology for determining an optimal right-of-way strategy should include this possibility
so that if the legislature permits direct early acquisition in the future, the tool will not become
immediately obsolete. Thus, our proposed methodology should produce a useful decision tool
whether or not options to buy are the only vehicle possible for early right-of-way acquisition.
There are two uses at the district level for our proposed early acquisition tool. The first
(and primary) use is during the Feasibility Study phase while proposed budgets are being
developed. Since right-of-way costs often account for 10–15 percent of a project’s budget,
savings for right-of-way can be significant and could be used either for other projects or to speed
the completion time of the current project. Thus, we suggest that determining the optimal
acquisition strategy during the initial planning phase of a project will help in the best use of
available funds. The second use of our tool is to help determine optimal use of project funds
when apparent (and unexpected) opportunities for early acquisition occur during the project
development phase. Because project development is a multi-year process, new information
regarding a potential sale or planned property improvement may be obtained that was not present
during project initiation. With new information will come the need to determine how best (most
economically) to use the new data. At the state level, the simulation tool that we are proposing
to build can be used for identifying and quantifying the general conditions under which the early
acquisition of right-of-way is beneficial.
Literature Review
A simulation is a technique to model physical or logical behavior of a system of interest
and evaluate the possible outcomes under various scenarios. Since simulation models often
possess high validity, which indicates the ability to reflect the real system, it sometimes is the
only option to model complex systems. They are also suitable to embrace stochastic variables
with enormous flexibility of probability distributions. However, simulation experiments are not

Project 0-5534 September 2006 Report 0-5534-1
43
guaranteed to generate optimal solutions and need statistical analysis to estimate the results from
the actual system.
Due to the complex nature of transportation engineering problems and simulation’s
ability to handle a wide variety of conditions in modeling, simulation is one of the popular
techniques in transportation research, from traffic demand modeling (Antoniou 1997) to
transportation infrastructure construction (Turkiyyah et al. 2005). In order to deal with complex
and uncertain conditions, many researchers adopt simulation methods in bridge management
systems (BMS) and pavement management systems (PMS), which could be considered
subsystems of transportation asset management systems (Hudson et al. 1987, Amekudzi 1999,
Amekudzi and McNeil 2000).
Sometimes simulation, as a leading or a supporting tool in decision-support systems,
works with other decision-supporting techniques such as optimization and decision analysis.
Even though simulation is very versatile in many cases, it cannot guarantee optimal solutions. In
order to overcome this drawback, simulation models sometimes include optimization techniques
as submodules to search optimal or near-optimal solutions during its computer experiments
(Hegazy and Kassab 2003, AbouRizk and Shi 1994). In contrast, some researchers have used the
simulation, as a supporting tool, to generate the most plausible scenarios from the problem
domain of large size and then solve the downsized problems by using optimization techniques
(Worzel et al. 1994, Consiglio and Zenios 1999, Seshadri et al. 1999).
To the best of the authors’ knowledge, there is very little research in simulation areas
directly related to the current research project of transportation asset management. Zhao et al.
(2004) developed a multistage stochastic model for decision making in highway development,
operation, expansion, and rehabilitation. In their model they considered underlying uncertainties
from traffic demand, land price, and highway service quality and used the Monte Carlo
simulation and least-squares regression as a solution algorithm. Table 4-1 shows the selected
literature of simulation in relation to the current transportation asset management project.

Project 0-5534 September 2006 Report 0-5534-1
44
Table 4-1. Selected Literature in Simulation.
* Descriptions are from the documents.
Item Number
Name Author Year Brief Summary*
4-001
Capturing Data and Model Uncertainties in Highway Performance Estimation
Adjo Amekudzi and Sue McNeil
2000 Analyzing data and analysis model uncertainties is one logical approach for addressing the information quality of infrastructure decision-support systems. This paper develops a computer simulation approach to explore the effects of data and model uncertainties on highway performance estimation. The results of the analysis illustrate that there are comparable data-induced and model-induced changes in both the expected value and the variability of highway performance estimates.
4-002
Uncertainty Analysis of National Highway Performance Measures in the Context of Evolving Analysis Models and Data
Adjo Amekudzi
1999 This research develops a simulation-based approach for uncertainty analysis of highway performance measures while addressing the impact of evolving analysis models and data within the highway DSS. The approach is applied to analyze changes, and associated risks, in the performance of a portion of the nation’s highway system.
4-003 A Method for Strategic Asset-Liability Management with an Application to the Federal Home Loan Bank of New York
S. Seshadri, A. Khanna, F. Harche, and R. Wyle
1999 They present a methodology to assist in the process of asset-liability selection in a stochastic interest rate environment. In their approach a quadratic optimizer is imbedded in a simulation model and used to generate patterns of dividends, market value, and duration of capital for randomly generated interest rate scenarios. The approach can be used to formulate, test, and refine asset-liability strategies.
4-004 Development of an Asset Management Strategy for a Network Utility Company: Lessons from a Dynamic Business Simulation Approach
Ivo Wenzler 2005 This paper suggests a dynamic business simulation—modeling and simulation approach based on system dynamics—to support development of asset management strategies at a couple of network utility companies. It uses a case study approach of a network utility company in the Netherlands to describe asset management dynamic business simulation (AMDBS) and its development process.

Project 0-5534 September 2006 Report 0-5534-1
45
Table 4-1. Selected Literature in Simulation (Continued). Item
Number Name Author Year Brief Summary*
4-005 Highway Development Decision-Making under Uncertainty: A Real Options Approach
Tong Zhao, Satheesh K. Sundararajan, and Chung-Li Tseng
2004 This paper presents a multistage stochastic model for decision making in highway development, operation, expansion, and rehabilitation. The model accounts for the evolution of three uncertainties, namely traffic demand, land price, and highway deterioration, as well as their interdependence. Real options in both development and operation phases of a highway are also incorporated in the model. A solution algorithm based on the Monte Carlo simulation and least-squares regression is developed.
4-006 Designing Portfolios of Financial Products via Integrated Simulation and Optimization Models
Andrea Consiglio and Stavro A. Zenios
1999 They analyze the problem of debt issuance through the sale of innovative financial products. They formulate a hierarchical optimization model. Input data for the models are obtained from Monte Carlo simulation procedures that generate scenarios of holding period returns of the designed products. The upper-level optimization program is multimodal, and a tabu search procedure is developed for its solution.
4-007 Integrated Simulation and Optimization Models for Tracking of Fixed-Income Securities
Kenneth J. Worzel, Christian Vassiadou-Seniou, and Stavros A. Zenois
1994 The paper develops an integrated simulation and optimization approach for tracking fixed-income indices. In an implementation of the model at Metropolitan Life Insurance Company, they introduce a simulation model for generating scenarios of holding period of returns of the securities in the index. Then they develop optimization models to select a portfolio that tracks the index. The models penalize downside deviations of the portfolio return from the index.
* Descriptions are from the documents.
Project 0-5534 September 2006 Report 0-5534-1
46
TRADE-OFFS FOR EARLY ACQUISITION
Since environmental clearance has not been obtained, early acquisition decisions must be
made with respect to parcels of land that may or may not be within the final project corridor.
Thus, in the following, we consider all parcels of land that have a potential to be within the final
corridor and that satisfy at least one of the following conditions: (1) the land is for sale by the
current owner, (2) it is expected that the land will be for sale before the environmental clearance
is obtained, (3) improvement activities have begun on the land by the current owner, and (4) it
appears likely that improvement activities will begin on the land before the environmental
clearance occurs. Before proceeding with our discussion, a further description is necessary with
respect to improvement activities since this is the most common reason why early acquisition
should be considered. When property is acquired, the state must pay the owner a fair market
value of the land plus any damages to the remainder of the land, if any, plus relocation costs of
people and utilities. Thus, improvements to land that occur during the early acquisition period
not only increase the value of the land itself but could significantly increase the cost of damages
to the remainder and relocation costs. The main question of interest is whether or not the
expected improvements are significant enough to justify early acquisition.
Right-of-way must either be acquired early or on time (on time refers to the acquisition
after the environmental clearance is obtained, i.e., during the Develop Authority phase of the
project). In what follows, a listing of the costs associated with early acquisition and on-time
acquisition is given. However, once a decision has been made to pursue early acquisition for a
parcel of land, it does not necessarily follow that the parcel will be purchased through early
acquisition. In other words, a decision may be made to pursue early acquisition, but the land
owner and the state cannot come to a mutually agreeable contract; thus, the effort for early
acquisition yields time and effort but no land. Our goal is to build a simulation model of the
project development process that includes all major stochastic events. The purpose of the
simulation model is to minimize the expected value of the total discounted project cost and to
predict best- and worst-case scenarios of project costs based on the stochastic inputs. In order to
minimize costs, we must understand the various cost trade-offs.
The major costs associated with early right-of-way acquisition are: (1) the market value
of the parcel at time of purchase, (2) damage costs to the remainder if applicable, (3) the cost of
the option to buy if an option to buy was used, and (4) the cost associated with having property
Project 0-5534 September 2006 Report 0-5534-1
47
not used by the project in the case that the early acquisition involved a parcel of land not
contained within the final approved alignment. Item 4 may be intentional or not. For example, if
there are several choices in the final alignment of the project, it is possible that multiple parcels
could be purchased early, knowing that only one from the set will be required for the project. Or
it is possible that a parcel is purchased with the expectation that it will be used, but during the
environmental clearance process the alignment is changed from what was expected. Thus, our
model must include the probability of changes in project alignment during the environmental
clearance process.
The major costs associated with on-time acquisition are: (1) the market value of the
parcel at the time of purchase, (2) damage costs to the remainder if applicable, (3) additional
costs due to legal proceedings if condemnation proceedings are necessary, and (4) delay costs
associated with not having a parcel of land in a timely fashion. When early acquisition is
considered because the owner has placed the parcel on the open market, then the second, third,
and fourth potential costs for on-time acquisition are avoided. When early acquisition is
considered because of known or expected property improvement, then the first two costs
associated with on-time acquisition are likely to be significantly higher, and thus the probability
associated with incurring the third and fourth costs is also significantly increased.
In addition to the above costs, there are also time constraints that must be modeled. This
includes not only the normal project time constraints, but also the constraint in being able to
pursue a limited number of parcels through early acquisition. As discussed below in the
“Research Plan” section, the goal of the activity analysis tasks of our research is to identity the
costs and time constraints relevant to a project, and the data analysis and economic analysis tasks
are designed to provide estimates for those values.
A SUMMARY OF SIMULATION MODELING
Simulation is a modeling approach for stochastic (i.e., probabilistic) systems. The goal of
a simulation model is to build a computer-based representation of a system in such a way that
each run of the simulation program reproduces a statistical experiment of system output. For
example, suppose we would like to simulate a highway project that includes building a 5-mile
stretch of highway, and part of the model includes the completion time of the 5-mile section.
Although 18 months is the estimated duration time for this part of the project, looking at
Project 0-5534 September 2006 Report 0-5534-1
48
historical records of similar projects, it is observed that 10 percent of the time the completion
took 16 months, 20 percent of the time it took 17 months, 40 percent of the time it took
18 months, 20 percent of the time it took 19 months, and 10 percent of the time it took 20
months. When modeling this project, the computer would generate a single random number to
represent completion time so that if the simulation was executed 100 times, the random number
would be such that the value of 16 would occur approximately 10 times, the value of 17 would
occur approximately 20 times, etc.
Let us expand on this example. Work on the 5-mile section will begin at the start of
January and so is expected to finish at the start of July the following year. After the 5-mile
section is finished, the second phase begins. If the 5-mile section finishes in May, the next phase
will take either 5 or 6 months with certain probabilities. If the 5-mile portion finishes in June,
the next section will be completed in 5, 6, or 7 months with certain probabilities. And so on until
we have the case that if the 5-mile section finishes in August, the next section would take 6, 7, or
8 months. In other words, the length of time to complete the second section depends on the time
of year so that there are statistical dependencies within the model. Thus, it has now become a
little more complicated to determine the expected finish time for the entire project because of
these dependencies. By generating two random numbers to represent the completion times for
the two phases, the simulation model could be run 100 times and an expected completion time
for the entire project determined. Or, sometimes equally important, the simulation could be run
100 times to determine the probability that the completion time will be longer than some
predetermined threshold value. (These are called tail probabilities, which represent the
probability of a project taking “too long” to complete.)
Of course, even for the second example, it would not be difficult to determine both the
theoretical expected value and the theoretical tail probabilities. However, in a realistic project
with many different sources of randomness and with complex statistical dependencies, it is
impossible to determine theoretical expected values; thus, simulation becomes an invaluable
modeling tool to determine system characteristics. By generating 100 different scenarios (i.e.,
100 separate statistical experiments) and their associated costs, it becomes possible to estimate
an expected value for project costs by taking an arithmetic average of the 100 realizations and, in
addition, give some sense of the possible variations in project costs by looking at 80 percentile
and 20 percentile extremes.

Project 0-5534 September 2006 Report 0-5534-1
49
THE IMPORTANCE OF STOCHASTIC MODELING
It is quite common to model processes using average values, thus creating deterministic
approximations of models of processes that are inherently stochastic. Before proceeding with
our research plan, it will be helpful to emphasize the importance of including statistical
variations within a model since deterministic representations of stochastic processes can easily
yield incorrect decisions.
To illustrate the importance of stochastic modeling, we consider a simplified example of
project planning. Consider a project that includes three tasks. Tasks 1 and 2 are carried out
simultaneously, task 3 starts as soon as both task 1 and 2 are completed, and our interest is in
predicting the start time for task 3. Assume task 1, with equal probabilities, takes either 2 or
4 months to complete and task 2 always takes 3 months. If we use averages, each task takes
3 months to complete, and thus the average start time for task 3 would be 3 months. However,
when you consider the randomness of task 1, a different average commencement time for task 3
is obtained by the following reasoning. Fifty percent of the time, task 1 takes 2 months, which
implies that the start time for task 3 is 3 months due to the length of time to complete task 2.
Fifty percent of the time, task 1 takes 4 months to complete, which implies that the start time for
task 3 is 4 months. The average of those two values yields an expected start time for task 3 of
3.5 months (thus an error of 14 percent). (See Figure 4-1 for a schematic illustrating these
concepts.)
Figure 4-1. Comparison of Deterministic and Stochastic Project Scheduling.
Task 2
Task 1
1 2 3 4
Task 3
Task 3
Month
Task 2
Task 1
1 2 3 4
Task 3
Month
(a) Deterministic model using averages (b) Stochastic model considering randomness

Project 0-5534 September 2006 Report 0-5534-1
50
Inaccuracies from deterministic approximations are further exacerbated when costs are
nonlinear. Assume that the cost of the project is roughly proportional to the square of the time at
which task 3 starts. The deterministic approximation would yield a cost of 9 units, whereas the
actual average is a cost of 12.5 units (namely, the average of 9 and 16). Thus, the average cost
estimate from the deterministic approximation yields an error of almost 39 percent.
The two common goals of a model are to predict expected values and to estimate tail
probabilities. Obviously, a deterministic model is incapable of estimating tail probabilities, and
the simple example above shows that even with only slight variations, the accurate prediction of
expected values requires a stochastic model.
OBJECTIVES FOR THE SIMULATION MODEL
Our objective is to develop a computer-based stochastic model for project costs and
completion times that will contain a decision-support submodel for optimizing the early
acquisition of right-of-way (see Figure 4-2 for a schematic diagram illustrating the logic flow for
a simulation-based decision-support system). This stochastic model will be a simulation of the
project with the intent that it can be used during both the Feasibility Study phase of project
development and the Plan Authority phase of project development. The simulation could be
used tactically at the district level during the Feasibility Study phase to help in estimating total
project costs and suggesting which parcels of land should be targeted for early acquisition. It
could also be used during the Plan Authority phase to help in making early acquisition decisions
when additional information regarding potential right-of-way land becomes available. It would
also be possible to use the simulation strategically at the state level to provide guidelines for
potential savings in project costs associated with early right-of-way acquisition and the possible
effect of shifting funds from one phase of the project to additional early acquisition efforts.

Project 0-5534 September 2006 Report 0-5534-1
51
Figure 4-2. Schematic Diagram of Simulation-Based Decision-Support System.
In a slightly simplified view of simulations, there are two types: Monte Carlo
simulations and event-driven simulations. A Monte Carlo simulation refers to a model in which
random variates are created to reproduce a statistical experiment in which time is not a factor.
Models developed to represent a stochastic process involving time often use an approach called
event-driven simulations. The “event-driven” part of the simulation refers to the mechanism by
which the simulated clock is handled. There are other types of mechanisms for maintaining the
simulated clock, but for the purposes of this project, it is the event-driven simulation that we
shall use. (See Feldman and Valdez-Flores [1996] for a brief description of event-driven
simulations.)
The deliverable from this project will be an event-driven simulation of project
development that includes a decision submodel together with a branch-and-bound or other
combinatorial type algorithm to assist in the right-of-way early acquisition decision. The output
of the model will be a projection of expected annual expenses associated with the project plus
best- and worst-case scenarios representing likely variations in expenses due to random events.
(Best- and worst-case scenarios refer to the tail probabilities of cost expenditures associated with
the 20 percentile and 80 percentile points.) The model should also be able to predict the
expected completion times for the major milestones of a project. Because the Construct
Authority phase cannot begin until right-of-way has been purchased and early acquisition is not
feasible until the project enters the Plan Authority phase, the simulation model will include only
the Plan Authority and the Develop Authority phases.
Simulation Model
Decision Submodel
Asset Management Decision-Support System
Inputs Total Project Costs Project Completion Times

Project 0-5534 September 2006 Report 0-5534-1
52
RESEARCH PLAN
There will be four major phases to this project, with each phase containing multiple
activities. These phases are (1) “as-is” model development for projects with no early acquisition,
(2) “to-be” model development that includes early acquisition options, (3) integration of the
decision-support and optimization submodels for use within the simulation, and
(4) verification/validation. In what follows, we look at each of these phases separately.
“As-Is” Model Development
Before the early acquisition of right-of-way can be considered beneficial, it is essential to
understand and accurately estimate costs incurred and time requirements associated with a
project that does not include any early right-of-way acquisitions. The steps to be carried out
during the “as-is” development phase are (1) development of the model framework, (2) activity
analysis, (3) data analysis, (4) economic analysis, (5) model integration, and (6) model
verification/validation.
One of the issues that must be decided before development of the model framework can
begin is to choose a programming platform. There are several excellent simulation language
packages available for model development, such as Arena by Rockwell Software, Inc.; ProModel
by ProModel Corporation; Witness by Lanner Group, Inc.; etc. There are at least two advantages
commonly attributed to the use of one of these specialized simulation languages. First,
simulation models are quicker to develop if a simulation package is used instead of a
programming language. Second, simulation is more accessible to researchers since good
programming skills are not required for the use of these simulation packages. However, there
are also two major disadvantages. First, a model developed in a commercial simulation language
is not very portable (i.e., cannot be easily moved to computers without the purchase of the
software package). Second, the language is not very flexible for building unusual features into
the model. A third disadvantage which may or may not be relevant is that a model built using a
general-purpose language will run faster than a model built with a simulation language. For
these reasons, our suggestion is to use VB.NET, which will allow extremely flexible models
including the ability to integrate decision-support and optimization routines. In addition,
Windows®-based models can be developed to include menus, dialog boxes, etc., and programs
Project 0-5534 September 2006 Report 0-5534-1
53
built using VB.NET can be executed from any computer running Microsoft Windows XP® and
can be ported to a web-based system.
This research will begin with the first two steps (development of the model framework
and activity analysis) followed by the next two steps (data analysis and economic analysis). That
is, we will immediately begin with developing the “as-is” model framework and at the same time
start the activity analysis. The TxDOT activities carried out during Plan Authority can be
categorized into four types: planning and programming, preliminary design, environmental, and
right-of-way and utilities. The activities carried out during Develop Authority are categorized
into either right-of-way and utilities or planning, specification, and estimation development.
During the activity analysis step, each activity under these categories must be analyzed to
determine time span, cost factors, and precedent relationships. The identification and description
of the activities are accomplished through in-depth discussions between personnel from the
research team and TxDOT personnel. At this time unknown factors will be clearly identified.
Values for the unknown factors will be estimated during the data analysis step. The impact of
the cost factors on the budget process and their potential for inflation and appreciation (i.e.,
increase in land value due to improvement activities by the owners) will be identified and
described during the economic analysis step. Thus, a key function of activity analysis is to
identify actions to be taken during the data analysis and economic analysis steps. The model
integration step will use the information from the analysis steps to “tune” the model so that it
reflects reality. The model verification/validation step refers to the verification function where
the researcher seeks to ensure proper model development and then demonstrates the model to
TxDOT personnel for their feedback during model validation. Although we list these steps
linearly, there is actually feedback from the verification/validation step to the model integration
step where we would expect significant changes in the model after it is demonstrated to TxDOT
personnel.
A major function of the economic analysis step that will require a significant amount of
research is to assign possible appreciation factors to parcels of land that are likely to be improved
by the land owner. The purpose of the simulation is to predict completion times and cost factors
for a project several years in advance of scheduled project completion. For right-of-way
acquisition, each parcel of land that may potentially be needed must be identified. Estimates for
the cost of the land based on one or more likely scenarios that the land owner may begin land

Project 0-5534 September 2006 Report 0-5534-1
54
improvement before the Develop Authority phase of the project development process is reached
must be made. These should not be deterministic values; a range of possible values should be
estimated together with estimated probabilities. In addition, the likelihood that delays in land
acquisition due to the necessity of using condemnation to acquire the property must be estimated.
Although these are clearly random factors, some effort will be spent in identifying the
appropriate probability laws to use for best describing this process.
“To-Be” Model Development
The steps for the “to-be” development phase are the same as in the previous phase except
that the focus will be on describing, in probabilistic terms, the various possible scenarios for
early acquisition. In this phase, it will be assumed that the decision to attempt an early
acquisition of right-of-way is fixed. In other words, part of the input to this model will be the
decision for each parcel of land concerning whether or not to pursue early acquisition. The data
will also include probabilities associated with a parcel of land actually being used for the right-
of-way, probabilities associated with the early acquisition effort being successful, and
probabilities associated with differing improvement scenarios by the land owner. It is likely that
this will be the most difficult and time-consuming task of this research effort. As described
previously, there are four key costs associated with the early right-of-way acquisition, namely
market value of land subject to early acquisition, damage costs, cost of the option to buy, and
cost of purchased property not being used. To further complicate the analysis, these costs are not
constant with respect to time; however, without some estimate of these costs, it will be
impossible to determine the trade-off between early purchase and on-time purchase. We expect
to use both the personal experiences of TxDOT personnel as well as the investigation of
historical records to provide estimates for these costs. Sensitivity studies will also be performed
to determine acceptable bounds for these costs.
Another aspect of the model that will be important is the ability to update information
and easily rerun the model for improved predictions. Our vision is that this model will be used
during the Feasibility Study phase of project development to obtain projections for project costs
and time constraints. However, it is likely that during the Plan Authority phase of project
development new information regarding the potential for land improvement will become known.
Project 0-5534 September 2006 Report 0-5534-1
55
At that time, the model will be used again to determine the effect of a changed early acquisition
decision in light of the new information.
Integration of the Decision-Support and Optimization Submodels
The purpose of the simulation model is to give accurate estimates of stochastic events and
assist in decision making. Thus, a decision-support module would be required as part of the
software system. This decision-support module will incorporate the research efforts described in
the chapters dealing with optimization and with decision and risk analysis.
Verification/Validation
Program verification is the step whereby the software is checked to ensure that it was
programmed accurately (namely, if the model calls for addition, terms were actually added and
not accidentally subtracted). The major step in program verification is tedious but not difficult.
It involves developing some scenarios that are worked out by hand and duplicated with the
program.
Model validation is more difficult. Validation is the step in which the model is checked
to ensure that it conforms to reality. Although validation is difficult, it is extremely important
because without it, there is no real justification for using the software. The principal method of
validating software is to demonstrate the software system to knowledgeable personnel to obtain
feedback and confidence in the various assumptions that are part of the modeling effort. Thus,
after each major step in development is complete, a demonstration will be made to TxDOT
experts for their feedback.
It is important to test each piece of the model as it is developed and also to test the fully
integrated model. This is the reason that verification/validation is listed under each step of the
research plan in addition to being a separate step itself.
MODELING APPROACH
The most difficult and time-consuming steps in this research will be the data analysis and
economic analysis for the various activities that are identified during the activity analysis step of
“as-is” model development and “to-be” model development, and these tasks are discussed in
more detail in other sections of the report. The simulation tool will involve four key features:

Project 0-5534 September 2006 Report 0-5534-1
56
(1) a graphical interface to allow easy input of project data, (2) an Access® database input system
containing the results of the data analysis and economic analysis efforts, (3) a simulation model
designed to produce statistical estimates for annual costs and completion times, and (4) a
graphical interface to view and help interpret the simulation results. The graphical interfaces
will be Windows-based systems familiar to most personal computer (PC) users. Their specific
features cannot be determined ahead of time and will be designed during the model framework
development steps; however, the general process of designing a user interface has been described
by Pressman (2001) and is usually a very time-consuming part of software development.
Pressman describes the process of developing the user interface as:
1. user, task, and environment analysis and modeling;
2. interface design;
3. interface construction (implementation); and
4. interface validation.
The development process implies that each of these tasks will occur more than
once, with each pass requiring additional elaboration of requirements and the resultant
design. In most cases, the construction activity involves prototyping and usability
analysis—the only practical way to validate what has been designed (Pressman 2001).
In this section, we shall describe in slightly more detail the modeling approach mentioned
in the “Objectives for the Simulation Model” section; namely, we explain the application of an
event-driven simulation to the development of the simulation we envision for helping with the
early acquisition decision. Two definitions are important: an activity is something that occurs
over a (possibly random) time period and that has the potential to influence project costs and/or
project completion time, and an event is the completion time of an activity or something that
causes a state of the system to change. There are both project activities and events as well as
external activities and events. For example, a project activity might be the development of
compliance and planning requirements, and an event might be the completion of the compliance
and planning requirements. An external activity might be improvement tasks being undertaken
by a private land owner. An activity always creates an event by its completion, but an event may
occur that is not tied to an activity. For example, notification that a land owner would like to sell
property under the hardship provision for early acquisition would be an event not related to the
completion of an activity. Most project activities are initiated by the completion of other
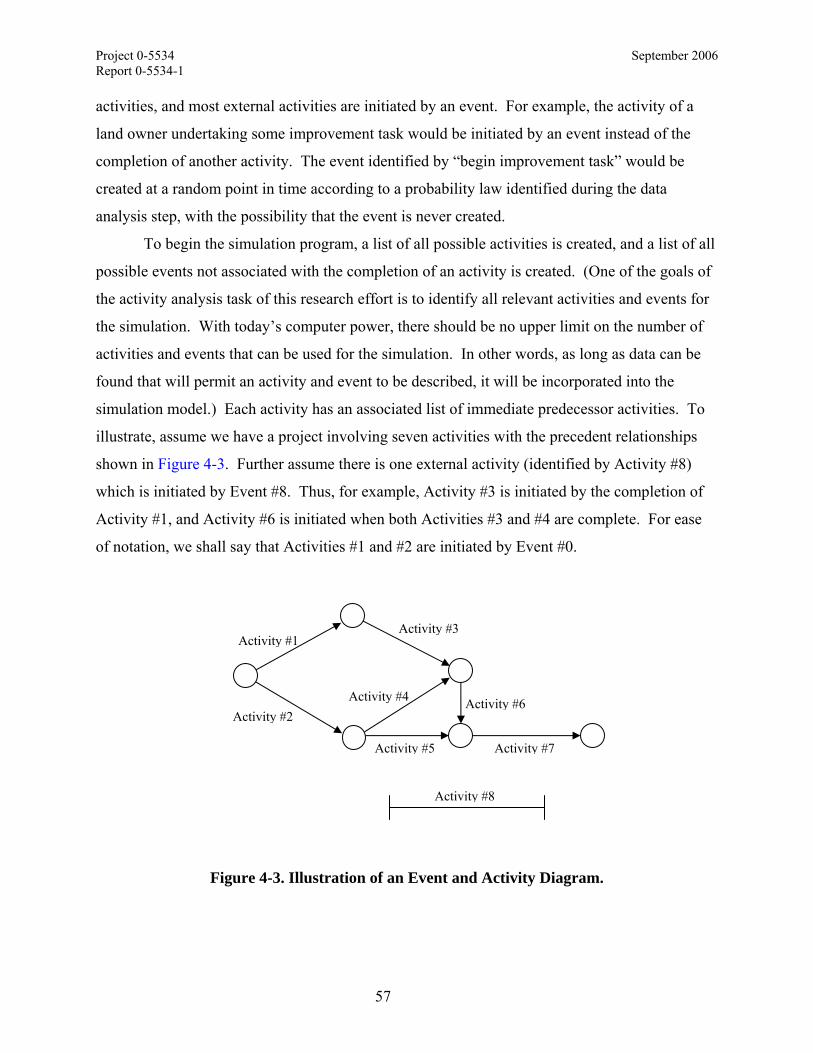
Project 0-5534 September 2006 Report 0-5534-1
57
activities, and most external activities are initiated by an event. For example, the activity of a
land owner undertaking some improvement task would be initiated by an event instead of the
completion of another activity. The event identified by “begin improvement task” would be
created at a random point in time according to a probability law identified during the data
analysis step, with the possibility that the event is never created.
To begin the simulation program, a list of all possible activities is created, and a list of all
possible events not associated with the completion of an activity is created. (One of the goals of
the activity analysis task of this research effort is to identify all relevant activities and events for
the simulation. With today’s computer power, there should be no upper limit on the number of
activities and events that can be used for the simulation. In other words, as long as data can be
found that will permit an activity and event to be described, it will be incorporated into the
simulation model.) Each activity has an associated list of immediate predecessor activities. To
illustrate, assume we have a project involving seven activities with the precedent relationships
shown in Figure 4-3. Further assume there is one external activity (identified by Activity #8)
which is initiated by Event #8. Thus, for example, Activity #3 is initiated by the completion of
Activity #1, and Activity #6 is initiated when both Activities #3 and #4 are complete. For ease
of notation, we shall say that Activities #1 and #2 are initiated by Event #0.
Figure 4-3. Illustration of an Event and Activity Diagram.
Activity #1
Activity #4
Activity #3
Activity #2 Activity #6
Activity #7Activity #5
Activity #8

Project 0-5534 September 2006 Report 0-5534-1
58
A simulation maintains a simulation clock indicating the day, month, and year within the
simulation and a calendar list of future events, which is a list of all known future events plus the
time at which the events are scheduled to occur. Simulation initiation places Event #0 on the
future events calendar plus any potential external events that may occur and do not depend on
another event or activity. Events are then removed one at a time from the calendar list, and the
simulation clock is advanced. Random variates are generated according to the event being
removed from the list, and future events are created and placed on the calendar. To illustrate
from the above diagram, Event #0 is placed on the calendar and scheduled to be removed at
time 0. A random variate is generated representing the time Event #8 will occur, and then
Event #8 is placed on the future events calendar. When the simulation starts, Event #0 is
removed, and it initiates the creation of two random variates representing the duration of time to
be taken by Activities #1 and #2. At this point, the two events representing the completion times
of Activities #1 and #2 will be placed on the future events calendar and are scheduled to be
removed at their randomly created times. Any cost factors are updated based on the two
activities. The next event to be removed from the future events calendar will be the event with
the minimum scheduled time of removal from the three events (Events #8, #1, and #2) now on
the calendar. When the next event is removed, the simulation clock is advanced to the time of
removal, an activity is started if possible, costs are updated, new random variates are generated,
and new events are placed on the future events calendar.
To continue this illustration, assume we randomly generated a time indicating that
Event #8 is scheduled to occur after 8 months, Activity #1 is scheduled to last 5 months, and
Activity #2 is scheduled to last 4 months. Thus, Event #2 (i.e., the completion of Activity #2) is
next removed from the future events calendar, and the clock is advanced 4 months. Event #2
signals the initiation of Activities #4 and #5, so random variates are generated representing their
duration. Notice that if the factors influencing the length of the activity depend upon the time of
year, then the time of year is easily taken into account because an activity’s duration time is not
generated until it is known (in a statistical sense) when activity starts. Once the durations of the
two activities are randomly generated, those completion time events are placed on the future
events calendar. The next event is then removed from the future events calendar, and the clock
is again updated. In this fashion, the simulation clock continues to advance until project
completion.

Project 0-5534 September 2006 Report 0-5534-1
59
Because it is events that control the simulation clock, this type of simulation is called an
event-driven simulation. Using this approach, we expect to design a program that can be used to
predict the costs and the timings associated with TxDOT projects with and without the early
acquisition of right-of-way.
CONCLUDING REMARKS
Because of the presence of multiple sources of stochastic variations in project
development, it is essential that simulation be included in any tool whose purpose is to predict
project costs. The task of developing a simulation useful for predicting project costs and aiding
in the early right-of-way acquisition decision is made difficult by the presence of a significant
number of unknown time and cost factors relevant to early acquisition. It will be the goal of the
activity analysis, data analysis, and economic analysis tasks to identity and estimate these
factors. Although there is no (or very little) history from which to draw reliable estimates since
early acquisition has not been used in Texas (ignoring the little-used emergency cases), we do
expect to obtain “ballpark” estimates that can be used in our initial modeling efforts. Then as
more experience is gained, these estimates can be improved.
It is our expectation that the completed simulation tool as described in this chapter will be
useful at both the district and state levels. At the district level, it will enhance project planning.
At the state level, it will enhance policy making by allowing the improved analysis of
implementing potential early right-of-way acquisition strategies.


Project 0-5534 September 2006 Report 0-5534-1
61
CHAPTER 5: OPTIMIZATION
Dr. Illya V. Hicks and Dr. Sergiy Butenko are the authors of this chapter. Dr. Hicks and
Dr. Butenko explore the potential application of optimization techniques to address the right-of-
way early acquisition question at TxDOT. Comments from the research team management about
the optimization approach are presented in Chapter 7: Conclusions and Recommendations.
ABSTRACT
This chapter discusses optimization-based approaches to resource allocation problems
arising in TxDOT practice, in particular related to right-of-way acquisition. It first gives a brief
introduction to the area of optimization and its major research directions and developments. It
then describes the data collection and processing procedures, at both district and division levels,
required for successful completion of the proposed project. Two alternative optimization
approaches for optimal resource allocation are proposed: the top-to-bottom and the bottom-to-top
approaches. The first approach uses two different types of models to first allocate the budget
between districts at the division level, and then solve a smaller-scale resource allocation problem
for each district to select specific projects. The second approach uses the same detail-involved
model designed for districts at the division level to allocate the budget between projects within
the division and then uses the results to allocate the resources between districts. Finally, expected
outputs and extensions of the proposed work are outlined.
INTRODUCTION
Optimization has been expanding in all directions at an astonishing rate during the last
few decades. New algorithmic and theoretical techniques have been developed, the diffusion into
other disciplines has proceeded at a rapid pace, and our knowledge of all aspects of the field has
grown even more profound (Floudas and Pardalos 2002, Pardalos and Resende 2002). At the
same time, one of the most striking trends in optimization is the constantly increasing emphasis
on the interdisciplinary nature of the field. Optimization today is a basic research tool in all areas
of engineering, medicine, and the sciences. The decision-making tools based on optimization

Project 0-5534 September 2006 Report 0-5534-1
62
procedures are successfully applied in a wide range of practical problems arising in virtually any
sphere of human activity.
Resource allocation problems are among classical applications of optimization
techniques. However, the complexity of real-world problems associated with resource allocation
in transportation infrastructure limits the applicability of classical methods, making one seek
novel approaches. While there are a number of research papers describing applications of various
mathematical programming methodologies to resource allocation problems, they cannot be
applied directly to the decision-making situations arising in TxDOT practice. On the other hand,
the rich body of literature on the subject provides indisputable evidence of the effectiveness of
optimization techniques in solving resource allocation problems in general. Indeed, recent
progress in algorithmic techniques coupled with improvements of computer hardware have led to
the development of software packages capable of handling instances of optimization problems of
unprecedented scales. Given these developments and the variety of factors involved in resource
allocation problems faced by TxDOT, proper mathematical models become the key to success in
dealing with these problems. In this regard, one needs to find a good balance between the amount
of detail included in the model and the complexity of the resulting model. Typically, the
mathematical models that better describe the system (e.g., stochastic mixed integer nonlinear
programming) are much more involved computationally than simple models such as linear
programming. However, sometimes even very basic models approximating the system of interest
provide reasonable results. Thus, extensive experimentation and sensitivity analysis are often
used to determine the proper models.
Depending on the nature of the problem, different techniques can be used to formulate
and solve a typical optimization problem. Linear programming deals with optimization
problems, in which the objective and constraints can be formulated using only functions that are
linear with respect to the decision variables. In nonlinear optimization, one deals with optimizing
a nonlinear function over a feasible domain described by a set of, in general, nonlinear functions.
The pioneering works on the gradient projection method by J. B. Rosen (Rosen 1960, 1961)
generated a great deal of research enthusiasm in the area of nonlinear programming, resulting in
a number of new techniques for solving large-scale problems. This research resulted in several
powerful nonlinear optimization software packages, including MINOS (Murtagh and Saunders
1983) and Lancelot (Conn et al. 1992).

Project 0-5534 September 2006 Report 0-5534-1
63
In many practically important situations in linear as well as nonlinear programming, all or
a fraction of the variables are restricted to be integer, yielding integer or mixed integer
programming problems. These problems are in general computationally intractable, and it is
unlikely that a universal “fast” (polynomial-time) algorithm will be developed for integer
programming. Linear and integer programming can be considered special cases of a broad
optimization area called combinatorial optimization. In fact, most of combinatorial optimization
problems can be formulated as integer programs. The most powerful integer programming
solvers used by modern optimization packages such as CPLEX (ILOG 2001) and Xpress (Dash
Optimization 2001) usually combine branch-and-bound algorithms with cutting plane methods,
efficient preprocessing schemes including fast heuristics, and sophisticated decomposition
techniques.
In many optimization problems arising in resource allocation, as well as other
applications, the input data, such as demand or cost, are stochastic. In addition to the difficulties
encountered in deterministic optimization problems, the stochastic problems introduce the
additional challenge of dealing with uncertainties. To handle such problems, one needs to utilize
probabilistic methods alongside optimization techniques. This led to the development of a new
area called stochastic programming (Prekopa 1995), whose objective is to provide tools to help
design and control stochastic systems with the goal of optimizing their performance.
Due to the large size of most practical optimization problems, especially of the stochastic
ones, the so-called decomposition methods were introduced. Decomposition techniques (Lasdon
1970) are used to subdivide a large-scale problem into subproblems of lower dimension, which
are easier to solve than the original problem. The optimal solution of the large problem is then
found using the optimal solution of the subproblems. These techniques are usually applicable if
the problem at hand has some special structural properties. For example, the Dantzig-Wolfe
decomposition method (Dantzig and Wolfe 1960) applies to linear programs with block diagonal
or block angular constraint matrices. Another popular technique used to solve large-scale linear
programs of special structure is Benders decomposition (Benders 1962). One of the advantages
of the decomposition approaches is that they can be easily parallelized and implemented in
distributed computing environments.
The advances in parallel computing, including hardware, software, and algorithms,
increase the limits of the sizes of problems that can be solved (Migdalas et al. 1997). In many

Project 0-5534 September 2006 Report 0-5534-1
64
cases, a parallel version of an algorithm allows for a reduction of the running time by several
orders of magnitude compared to the sequential version. Recently, distributed computing
environments were used to solve several extremely hard instances of some combinatorial
optimization problems, for instance a 13,509-city instance of the traveling salesman problem
(Applegate et al. 1998) and an instance of the quadratic assignment problem of dimension 30
(Anstreicher et al. 2002). The increasing importance of parallel processing in optimization is
reflected in the fact that modern commercial optimization software packages tend to incorporate
parallelized versions of certain algorithms.
As a result of ongoing enhancement of the optimization methodology and of
improvement of available computational facilities, the scale of the problems solvable to
optimality is continuously rising. However, many large-scale optimization problems encountered
in practice cannot be solved using traditional optimization techniques. A variety of new
computational approaches, called heuristics, have been proposed for finding good suboptimal
solutions to difficult optimization problems. A heuristic in optimization is any method that finds
an “acceptable’’ feasible solution. Many classical heuristics are based on local search
procedures, which iteratively move to a better solution (if such solution exists) in a neighborhood
of the current solution. A procedure of this type usually terminates when the first local optimum
is obtained. Randomization and restarting approaches used to overcome poor-quality local
solutions are often ineffective. More general strategies known as metaheuristics usually combine
some heuristic approaches and direct them towards solutions of better quality than those found
by local search heuristics. Heuristics and metaheuristics play a key role in the solution of large,
difficult, applied optimization problems. Sometimes in searching for efficient heuristics people
turn to nature, which seems to always find the best solutions. In recent decades, new types of
optimization algorithms have been developed and successfully tested, which essentially attempt
to imitate certain natural processes. The natural phenomena observed in annealing processes,
nervous systems, and natural evolution were adopted by optimizers and led to the design of
simulated annealing (Kirkpatrick et al. 1983), neural networks (Hopfield 1982), and evolutionary
computation (Holland 1975) methods in the area of optimization. The ant colony optimization
method is based on the behavior of natural ant colonies. Other popular metaheuristics include
greedy randomized adaptive search procedures (GRASP) (Feo and Resende 1995) and tabu
search (Glover and Laguna 1997). Some of the previous research (e.g., Siethoff et al. 2002)
Project 0-5534 September 2006 Report 0-5534-1
65
attempted to address the question of whether right-of-way should be acquired early. The authors
of this report believe that there is no definitive answer to this question in general, and rather the
question should be addressed on a case-by-case basis. Optimization models and techniques
discussed in this chapter provide a valuable tool in this regard. The following sections of this
chapter present how these techniques may be applied to help TxDOT answer this question.
Literature in Relation to Transportation Asset Management
Efficient allocation of resources is a critical component of successful transportation asset
management practice. Many optimization techniques have played an important role as a
decision-support system in various areas of resource allocation problems. Notably, research into
optimal fund (or budget) allocation has been actively pursued for general project management
(Hegazy 1999), for multidistrict highway agencies (Chan et al. 2003), for purchasing buses
(Khasnabis et al. 2003), and for infrastructure projects (Gabriel et al. 2006).
Pavement management systems and bridge management systems have been well-
established areas of transportation infrastructure management during the early stage of asset
management. Due to the increase of traffic demand, capital budgeting problems in highway
maintenance have drawn the attention of many researchers. Since optimization is a mathematical
approach which minimizes cost or maximizes benefit while satisfying pre-given constraints, it is
adopted for many transportation problems including the capital budgeting problem. Armstrong
and Cook (1979) developed a model for a single-year planning period. In the model the objective
was to maximize the total benefit from the highway subject to fixed budget constraints. Later it
was expanded to consider multiple planning years by using a financial planning model and a goal
programming approach (Cook 1984). In contrast to maximizing benefit, another approach is to
seek a solution minimizing total costs. Davis and Van Dine (1988) developed a computer model
to minimize user costs subject to budget and production capacity for optimizing maintenance and
reconstruction activities. They used linear programming formulation as an optimization
technique. More recently, advanced computing power allows optimization techniques to solve
more realistic and sophisticated PMS problems, which is a part of a larger decision-support
system. Ferreira et al. (2002) formulated a mixed integer optimization model for network-level
PMSs. They used genetic-algorithm heuristics to solve the optimization problem, minimizing the
expected total discounted costs of pavement maintenance and rehabilitation actions over a
Project 0-5534 September 2006 Report 0-5534-1
66
planning period. Wang et al. (2003) also used genetic-algorithm heuristics to solve the zero-one
integer programming formulation of PMSs.
Often transportation projects have to be evaluated in accordance with multiple criteria,
such as benefits and drawbacks of different stakeholders such as the general public, DOTs,
districts, counties, and MPOs. Furthermore, such projects have to deal with a wide range of
assets, such as pavements, bridges, roadsides, and right-of-way with uncertainty implications.
Even though tradition optimization deals with single-objective deterministic systems, there are
also many attempts to solve problems with multiple objectives and/or uncertainty. Two different
approaches are generally used for solving multiple-objective decision-making problems. First, in
some cases, multiple objectives can be aggregated into a single-objective function. Multiple
objectives are ranked according to the preference of the decision maker, and suitable weights are
assigned to the objectives. Since the resulting formulation is usually a nonlinear and
combinatorial optimization problem, heuristic solution techniques are used. One of the widely
used heuristic methods in transportation and infrastructure engineering fields is the application of
genetic algorithms (Hegazy 1999, Chan et al. 2003). Hsieh and Liu (1997) proposed a three-
stage approach of initial portfolio construction, portfolio finalization, and final portfolio and plan
determination to solve a zero-one, nonlinear, multiple-objective knapsack selection problem.
An alternative way of solving multiple-objective problems is to consider the individual
objectives simultaneously in the mathematical formulation. Goal programming can be used in
instances where the preset service level should be achieved in multiple-objective situations.
Cook (1984) applied goal programming to the capital budgeting problem in the area of highway
maintenance.
Management of transportation assets inevitably involves various uncertainties such as
deterioration of pavement and bridges, unexpected change of fund and project schedule,
fluctuating traffic demands over time and locations, etc. In order to deal with the uncertainties,
probabilistic optimization models are developed by many researchers. Some of them used state
transition probability to consider pavement condition changes (Davis and Van Dine 1988,
Ferreira et al. 2002). Others (Gabriel et al. 2006) used probabilistic constraints related to the
available budget for determining an efficient budget allocation for a portfolio of infrastructure
projects. Table 5-1 shows the selected literature of optimization in relation to transportation asset
management.

Project 0-5534 September 2006 Report 0-5534-1
67
Table 5-1. Selected Literature in Optimization.
* Descriptions are from the documents.
Item Number
Name Author Year Brief Summary*
5-001 Contingency Planning in Project Selection Using Multiobjective Optimization and Chance Constraints
Steve A. Gabriel, Javier F. Ordónez, and José A. Faria
2006 This paper presents a multiobjective optimization model for determining an efficient budget allocation for a portfolio of infrastructure projects. The model takes into account both the cost and the priority rank of each project while considering probabilistic constraints related to the available budget. A zero-one multiobjective optimization problem with chance constraints is developed and solved.
5-002 Probabilistic Segment-Linked Pavement Management Optimization Model
A. Ferreira, A. Antunes, and L. Picado-Santos
2002 An optimization model to be used within network-level PMSs is presented, together with a genetic-algorithm heuristic to solve the model. The objective of the model is to minimize the expected total discounted costs of pavement maintenance and rehabilitation actions over a given planning time span, while keeping the network within given quality standards.
5-003 Optimization of Resource Allocation and Leveling Using Genetic Algorithms
Tarek Hegazy
1999 This paper proposes resource allocation and leveling heuristics, and the genetic-algorithms (GAs) technique is used to consider both aspects simultaneously. In the improved heuristics, random priorities are introduced into selected tasks, and their impact on the schedule is monitored. The GA procedure then searches for an optimum set of tasks’ priorities with shorter project duration and better-leveled resources.
5-004 Robust Optimization of Large-Scale Systems
John M. Mulvey, Robert J. Vanderbei, and Stravros A. Zenios
1995 Mathematical programming models with noisy, erroneous, or incomplete data are common in operations research applications. In this paper they characterize the desirable properties of a solution to models, when the problem data are described by a set of scenarios for their value, instead of using point estimates. They develop a robust optimization model that explicitly incorporates the conflicting objectives of solution and model robustness.

Project 0-5534 September 2006 Report 0-5534-1
68
Table 5-1. Selected Literature in Optimization (Continued).
* Descriptions are from the documents.
Item Number
Name Author Year Brief Summary*
5-005 Linear Programming Model for Pavement Management
C. F. Davis and C. Van Dine
1988 This model uses a probabilistic linear programming formulation for optimizing maintenance and reconstruction activities. The objective function is to minimize user costs; the constraints are the budget, production capacity, and the recursive relation, which carries the optimization over the planning period.
5-006 Goal Programming and Financial Planning Models for Highway Rehabilitation
W. D. Cook 1984 This publication deals with the capital budgeting problem of highway maintenance. A two-phase approach is suggested. In phase 1 a financial planning model is used to determine appropriate budget levels. In phase 2 a goal programming model for achieving desired levels of service is given.
5-007 Multiattribute Decision Making by Sequential Resource Allocation
Peter A. Morris and Shmuel S. Oren
1980 This paper proposes an approach for addressing decision problems in which the outcomes are multidimensional and possibly interdependent. The method is based on decomposing the problem into a sequence of simpler decision problems. The solution to each subproblem is elicited from the decision maker by converting it to a simple resource allocation task that may be solved by inspection. The approach is illustrated in the context of a financial planning problem.
5-008 Optimal Resource Allocation for the Purchase of New Buses and the Rebuilding of Existing Buses as a Part of a Transit Asset Management Strategy for State DOTs
Snehamay Khasnabis, Joseph Bartus, and Richard Darin Ellis
2003 The authors present an asset management strategy that allocates capital dollars for the dual purpose of purchasing new buses and rebuilding existing buses within the constraints of a fixed budget, and distributes funds among the agencies in an equitable manner. The proposed procedure includes two optimization models. Model 1 attempts to maximize the weighted fleet life of all the buses. Model 2 is to maximize the remaining life (RL) of the entire peer group of buses.

Project 0-5534 September 2006 Report 0-5534-1
69
Table 5-1. Selected Literature in Optimization (Continued).
* Descriptions are from the documents.
DATA COLLECTION AND PROCESSING
In order to ascertain a realistic and sufficient mathematical model for the decision of
when to purchase right-of-way within the project development process at the district level and
the partitioning of funds for both existing projects and right-of-way for the districts at the
division level, the research team will have to have access to a plethora of relevant data. This
section details some of the specified data required and the mathematical methods used to analyze
the data. Since the research team is looking at the resource allocation problem for TxDOT from
both a district and division perspective, this is reflected in the following subsections.
District-Level Data
The following paragraphs detail the necessary and sufficient data needed to utilize
optimization techniques for districts to determine the distribution of funds between existing
projects and right-of-way. Since a number of factors (mentioned later) have a bigger influence
Item Number
Name Author Year Brief Summary*
5-009 Optimal Fund-Allocation Analysis for Multidistrict Highway Agencies
Weng Tat Chan, T. F. Fwa, and J. Y. Tan
2003 This paper employs the genetic-algorithm optimization technique to allocate the total funds available to the district or regional agencies in order to best achieve specified central and regional agencies’ goals subject to operational and resource constraints. The fund allocation problem considers the overall objective of the central agency together with a goal specified by each district or regional agency.
5-010 Multi-period Optimization of PMS
Jaewook Yoo
2004 A multi-dimensional zero-one knapsack model is formulated to schedule timely and cost-effective maintenance, rehabilitation, and reconstruction activities for each pavement section in a highway network and allocate the funding levels through a finite multiperiod horizon within the constraints of budget, activity frequency, and pavement quality. Dynamic programming and the branch-and-bound method are combined as a hybrid algorithm to solve the problem.

Project 0-5534 September 2006 Report 0-5534-1
70
on the optimization model at this particular level, we will examine these factors and possibly
incorporate them into the optimization model using regression analysis.
First, the research team will need access to historical right-of-way purchases (county,
city, and state purchases) of a timeframe of about the last 10 years in addition to the appraised
values of the land at the time of the acquisition. This information on purchase should be readily
available from TxDOT, while the property value information can be obtained from the historical
records of the Texas State Comptroller’s Office. It would also be interesting to know this
information in the context of when the right-of-ways were purchased in relation to the project
development process. This valuable information will give the research team enough historical
perspective of right-of-way purchase as well as examine the historical difference between actual
appraisal value and purchased amount.
Further, the aforementioned information is not inclusive of other expenses involved in
right-of-way acquisition, which include, but are not limited to, inflation rates and legal costs
(eminent domain versus non-eminent domain).
Siethoff et al. (2002) examined commercial property responses to a major highway
expansion in Austin, Texas, by analyzing parcel-level real estate assessment data over an 18-year
period. To illustrate the data used in the study of Siethoff et al. (2002), Figure 5-1 plots average
assessed land values per acre for each year in the study period (1982–1999).
This figure clearly shows that property assessments significantly increased in 1986, when
TxDOT began to acquire the additional right-of-way needed for the expanded facility. Property
values declined for several years after the right-of-way acquisition, remained flat during the mid-
1990s, and then increased again. The authors suggest that the observed variation in the land
value can be partially explained by the general trends in Austin’s land market during the study
period, which included a speculative bubble in the early 1980s. However, the empirical results of
their study suggested that the following factors also play key roles in property valuation:
• parcel acreages;
• improvement type and size;
• freeway proximity;
• parcel location at key network points (e.g., corner parcels); and
• timing of construction and completion.

Project 0-5534 September 2006 Report 0-5534-1
71
Figure 5-1. Average Assessed Land Values (in Dollars per Acre) in the Study by Siethoff (2000).
Based on the results of this study, we can conclude that a right-of-way acquisition and the
consequent construction project may have a considerable impact on land value in surrounding
areas, thus impacting the costs of future right-of-way acquisitions in these areas. Therefore, the
sequence in which the right-of-way acquisition and related construction projects occur in nearby
areas is a crucial consideration, which has been ignored in previous research. This issue can be
addressed by the mathematical programming models proposed in the next section.
Division-Level Data
The amount of needed data for the division-level optimization models and the difficulty
of achieving that data are far less than in the previous district-level case. Most of the information
is readily available and is currently used for the selection of projects anyway (TxDOT 2006d).
The following criteria could be used as a weighted average for producing objective coefficients
for variables related to existing projects and right-of-ways:
1. total vehicle miles traveled,
2. population,
3. lane miles,
Right-of-Way Acquired
0 50000
100000 150000 200000 250000 300000 350000 400000 450000 500000
1982 1984 1986 1988 1990 1992 1994 1996 1998
Year
Ave
rage
Lan
d Va
lue
per A
cre,
$
Project 0-5534 September 2006 Report 0-5534-1
72
4. truck vehicle miles traveled,
5. percentage of population below the federal poverty level,
6. fatal and incapacitating crashes, and
7. past success of existing projects and right-of-ways.
Note that an incapacitating crash is one with severe injuries that would prevent the
injured from a continuation of normal activities. In addition, criteria 1 to 6 are currently utilized
by TxDOT to select projects under category 2, metropolitan area corridor projects, and
category 3, urban area corridor projects, while criterion 7 is a new proposed measure to be
implemented in selecting projects. Also, there are numerous ways to measure criterion 7. One
way is the historical difference between actual appraised value of land parcels and purchased
amounts for the right-of-way case for each district. This historical perspective can be viewed
from a 1-year, 5-year, or 10-year period. A similar measure for the existing projects would be
the historical difference between proposed budgeted value and actual cost of past projects. With
criterion 7, TxDOT can incorporate a weighting favorable to districts who historically utilized
budgeted money more effectively. Also, the aforementioned seven criteria can be modified to
conform to other goals and objectives of TxDOT through engagement from TxDOT personnel.
MATHEMATICAL PROGRAMMING MODELS
This section discusses several mathematical programming approaches that can be used to
determine optimal strategies for right-of-way acquisition. The particular approaches discussed
include mixed integer linear programming (MILP), mixed integer nonlinear programming
(MINLP), and stochastic dynamic programming (SDP). Each of the proposed methods has its
own advantages and disadvantages as a modeling tool and in terms of computational tractability,
and in general the choice of a method depends on the nature and scale of data available for a
particular problem.
We will use mathematical programming models to allocate a limited budget between
districts at the division level, and to allocate the funds assigned to a given district between the
projects of interest for this district. We will consider at least two alternative approaches for this
purpose:
1. Top-to-bottom approach: (a) First use a division-level model to allocate the available
resources between the districts. (b) For each district, given the district’s budget found in
Project 0-5534 September 2006 Report 0-5534-1
73
step a, use a district-level model to allocate it between the projects of interest for the
district.
2. Bottom-to-top approach: (a) Use a district-level model for the whole division to
determine the allocation between the projects of interest within the division. (b) Allocate
the funds between districts according to the budgets required to complete the projects
included in the solution obtained in step a. In order to balance the distribution of funds
between the districts, the upper and lower bounds on the percentage of the division
budget allocated to each district may be included in the model.
The top-to-bottom approach involves two conceptually different models for allocating
funds at division and district levels, while the bottom-to-top approach uses the same model at
both levels. The main advantage of the first approach is that allocation of funds between the
districts results in smaller-scale optimization problems that need to be solved for each district.
This approach is also closer to the mode in which TxDOT currently operates. On the other hand,
the bottom-to-top approach is expected to result in one very large-scale optimization problem,
instead of a number of smaller ones, since the model would incorporate detailed information
about each project considered for funding in the division. While this approach is “more fair” in
the sense that it treats all projects within the division as equal, the large scale of the resulting
model may be too difficult to overcome because exact methods and heuristic approaches would
need to be used to find suboptimal solutions. Another potential disadvantage of the second
approach is the possibility that the (sub)optimal solution may suggest a very non-uniform
allocation of funds between districts. We still believe that the bottom-to-top approach should also
be considered, and the obtained results could be used to validate the results of the top-to-bottom
approach.
The next two subsections provide more detail on district-level and division-level models
for right-of-way acquisition.
District-Level Models
The district-level models deal with allocation of a given budget among a set of right-of-
way projects of interest. These models will be used in both top-to-bottom and bottom-to-top
approaches outlined above. In order to apply these models, we will need detailed data concerning
the factors that play key roles in property valuation for all potential right-of-way sites, as
described in the “Data Collection and Processing” section. Note that the proposed mathematical

Project 0-5534 September 2006 Report 0-5534-1
74
programming models are quite flexible and can be used not only for determining an optimal
allocation of a given budget but also for estimating the right-of-way budget needs over a given
time horizon.
For example, consider a simple integer nonlinear model for the following hypothetical
situation. Assume that there are two nearby right-of-way sites to be purchased and there is a
construction project planned for each site. The plan is to complete both construction projects
within the next T years. Denote by C1t and C2t the estimated cost of site 1 and 2, respectively,
which have been computed independently for the two sites using estimation methods described
in the “Data Collection and Processing” section. We will call these values base prices. However,
as it was illustrated in the previous section, the acquisition of right-of-way and construction
development on one of the sites will impact the price of the other site. This impact can be
expressed numerically using the techniques described in the “Mathematical Programming
Models” section. Denote by Cijtrp the additional cost (may be positive or negative) of site i at
time t resulting from acquiring right-of-way on site j at year r and starting the construction on
site j at year p, where i,j=1,2; t=1,…,T; r=1,…,t; p=r,…,T. For simplicity, we assume that it
takes a constant time to complete the project, so no index representing the completion time is
needed. Denote by Xit and Yit the binary variables associated with the decision to purchase right-
of-way on site i at time t and to start the construction project on site i at time t, respectively. In
other words, Xit=1 if the right-of-way on site i is purchased at time t and Xit=0 otherwise.
Similarly, Yit=1 if the construction on site i starts at time t and Yit=0 otherwise. Then the total
additional price Cijt of site i at time t resulting from the impact of site j can be expressed as
Cijt= ∑(r=1..t)∑(p=r..T)Cijtrp XjrYjp.
If we denote by P1t and P2t the estimated cost of completing the planned construction on sites 1
and 2, respectively, assuming that the construction is started at time t, then the objective of
minimizing the total cost of right-of-way acquisition and construction completion can be written
as
Minimize ∑(t=1..T)((C1t +C12t) X1t + (C2t +C21t) X2t+P1t Y1t + P2t Y2t).
The requirements that the right-of-way must be purchased exactly once for each site are given by
∑(t=1..T)X1t =1 and ∑(t=1..T)Y1t =1,
∑(t=1..T)X2t =1 and ∑(t=1..T)Y2t =1,
Project 0-5534 September 2006 Report 0-5534-1
75
while the requirement that the right-of-way must be purchased before the construction begins can
be expressed by the following constraints:
Y1t ≤ 1+ ∑(u=1..t)X1u - ∑(u=t+1..T)X1u and Y2t ≤ 1+ ∑(u=1..t)X2u - ∑(u=t+1..T)X2u.
Finally, all decision variables are binary:
X1t, Y1t, X2t,Y2t are in {0,1}.
Note that Cijt is a nonlinear function of the decision variables; therefore, the above model is an
integer nonlinear program. However, the objective function of this program can be linearized to
yield an integer linear program, which can be solved to optimality using state-of-the-art
optimization software packages, such as CPLEX from ILOG or XPRESS from Dash
Optimization. However, due to the well-documented computational intractability of integer
programming, it is not realistic to expect to find an optimal solution for large-scale problems,
such as the ones that will most likely arise in a bottom-to-top approach, where the division is
treated as a district. Heuristic or metaheuristic approaches mentioned in the “Introduction”
section can be used to find a nearly optimal solution in these cases.
Note that the mathematical program described above can be easily modified to model a
practically more common situation when the budget estimates are known in advance and one is
looking for an optimal allocation of the funds available. Indeed, in this case we would need to
change the equality constraints above to ≤ constraints to reflect the fact that not all projects of
interest may be completed as planned due to budget limitations. In addition, the linear budget
constraints limiting the costs encountered each year would need to be included in the model.
Division-Level Models
The mathematical programming models for the division level are not as complicated as
the models for the district level because the number of variables in the models is limited
(25 districts). Hence, depending on the objective function derived from the seven criteria
mentioned previously, the resulting model(s) will be a linear programming (LP), nonlinear
programming (NLP), or a stochastic dynamic programming (SDP) model. LP is easy to solve but
provides only a very rough approximation of the problem of interest, while NLP and SDP
models better describe the problem but are much more involved computationally. These models
will be based upon the variables corresponding to the districts and the type of funding (right-of-
way or existing projects), and there will be real variables relating to the amount of percentage of

Project 0-5534 September 2006 Report 0-5534-1
76
the budget for the district and the type of funding (i.e., x1R = 0.85 means that 85 percent of the
budget for right-of-way will go to district one). In addition, an accurate division-level model(s)
will result from close interaction with division-level personnel to incorporate intricacies that are
not always detailed in guideline documents such as the minimum or maximum percentage of
allocated money per district. The research team can also use the SMP (TxDOT 2006d) for a
tentative guideline for these percentages. The models will incorporate making budget decisions
for a fixed number of years instead of just one year and often result in knapsack-type problems,
which can be effectively solved using dynamic programming (DP). Hence, we feel strongly that
these models for the decision at the division level can be solved to optimality a bit more easily
than at the district level. The true complexity of solving these models at the division level will
lie in the techniques to derive meaningful objective functions based upon the aforementioned
seven criteria from the “Division-Level Data” section.
EXPECTED OUTPUTS AND EXTENSIONS
The approaches proposed in this chapter allow formulating the resource allocation
problems of interest as mathematical programs, which can be solved, exactly or approximately,
using commercial or specially developed optimization software packages. The generated
solutions will help TxDOT in making decisions concerning right-of-way acquisitions in the
following ways:
• Given the planning time horizon and the right-of-way sites to be acquired, the solution
will prescribe the optimal time for right-of-way acquisition and the beginning of
construction. This information can be used to estimate the right-of-way budget needs at
the district level and to allocate funds among districts at the division level.
• If estimates of the district’s right-of-way budget are given (or computed using step a in
the top-to-bottom approach), then the proposed district-level models can be used to
optimally allocate the available budget among specific right-of-way projects of interest.
On the other hand, the provided optimal or suboptimal solutions for models without
budget constraints can be used in budget planning decisions for the considered time
horizon.

Project 0-5534 September 2006 Report 0-5534-1
77
• The stochastic programming approach addresses the uncertainty in real-life data and can
be used to derive the scenario-based solutions, in which at each time moment the
decisions are made based on outcomes of random factors up to the given moment.
• The proposed optimization models can be easily modified to incorporate the dynamic
nature of data. As new information regarding the sites of interest for right-of-way
becomes available, the corresponding estimates of coefficients used in the proposed
mathematical programs can be easily updated, and more realistic solutions can be found.
• The sensitivity analysis of the proposed models will be performed by varying the input
parameters and recording and analyzing the corresponding solutions obtained.
• A software package will be developed that will allow a user to input the required data and
automatically obtain a set of feasible decisions to choose from.
Some other important issues of interest which we would like to investigate (and which
may go beyond this project) include representing the transportation infrastructure of the state of
Texas as a giant dynamic network, investigating the structural properties of this network from a
graph-theoretic viewpoint, and using optimization techniques to prescribe the future changes to
this network, which would result in improvements in desirable structural properties. We believe
that this approach would be most beneficial in the long run since it would help with short-term
decisions that would bring the transportation infrastructure a step closer to the “perfect” future
network. This is in contrast to “common sense” practice, where one is interested in making
“locally optimal” decisions without considering the long-term implications. In particular, we
believe that the long-term goal considerations should be included in valuation methods used to
estimate the dollar value of a project considered for investment.


Project 0-5534 September 2006 Report 0-5534-1
79
CHAPTER 6: DECISION AND RISK ANALYSIS
Dr. Seth D. Guikema is the author of this chapter. Dr. Guikema explores the potential
application of decision and risk analysis techniques to address the right-of-way early acquisition
question at TxDOT. Comments from the research team management about the decision and risk
analysis approach are presented in Chapter 7: Conclusions and Recommendations.
ABSTRACT
The goal of transportation asset management is to optimize the value of a given set of
transportation assets in order to maximize the value of these assets to the public. This implies the
need for a clear, logical objective function that truly represents the values, goals, and objectives
of TxDOT managers acting on behalf of the public of Texas. Decision analysis, and in particular
utility theory, provides a rigorous basis for developing such an objective function. At the same
time, TxDOT is beginning to explore the possibility of using options to purchase right-of-way in
advance of when right-of-way would traditionally be purchased for a given project. Having a
method to screen the large number of potential parcel purchases to identify those most at risk for
price increase could help to maximize the value of advance-purchase options for TxDOT. This
chapter gives an overview of decision analysis and utility theory and proposes methods for
creating (1) a utility function that would represent TxDOT objectives as a basis for asset
management optimization and (2) a method for screening a large number of parcels along a
potential right-of-way to identify those that are most at risk for price inflation and thus may make
good targets for short-period advance purchase options.
INTRODUCTION
Transportation asset management is a systematic process for managing the construction,
maintenance, operation, safety, and other aspects of elements of transportation systems
(Obermann et al. 2002). The traditional definition of transportation asset management includes a
broad set of activities from construction engineering and pavement management to managing
environmental impacts of transportation systems, and TxDOT is broadening this scope. TxDOT
is expanding transportation asset management to include right-of-way procurement. In particular,
Project 0-5534 September 2006 Report 0-5534-1
80
TxDOT is interested in using short-period options2 as a way to procure selected parcels of land
early in the project development process. While only three short-period options have been sold to
date, the intention of TxDOT is to use these options after the preliminary design phase of the
project has been completed but prior to completion of environmental clearance for the project.
This is in contrast to typical right-of-way acquisition which can begin only after the final
alignment for a roadway is selected as part of the National Environmental Policy Act (NEPA)
environmental clearance process.
The use of short-period options gives TxDOT a flexible and potentially powerful tool for
right-of-way acquisition that it otherwise would not have. Under previous federal and state law,
right-of-way could be acquired prior to the completion of the NEPA environmental clearance
process only in the case of a protective purchase, a hardship purchase, or a donation as defined
under federal and state laws and regulations (e.g., 23 CFR 710 and Section 202.112 of the Texas
Transportation Code). These special cases dealt with only a limited number of parcels and
carried stringent legal requirements limiting their use. Recent changes in the Texas
Transportation Code have relaxed these rules to allow TxDOT to sign options of unspecified
duration for parcels prior to the completion of the NEPA environmental review process. These
options may allow TxDOT to purchase land in advance of finalizing the roadway alignment,
potentially allowing them to purchase parcels at a significantly reduced total cost, including the
parcel costs, relocation costs, etc.
While the recent legal allowance of the use of options has given TxDOT a powerful new
tool in planning transportation improvements, the potential use of options raises several difficult
questions. Some of these are:
• Does the use of options help TxDOT achieve its organizational objectives, and if so how
can this be quantified to enable advance right-of-way acquisition to be balanced against
work with more easily measured benefits such as enhancing mobility on existing roads
and increasing the frequency of bridge and roadway maintenance?
• How can TxDOT best target its advance right-of-way purchase efforts to find and
purchase those parcels of land that will yield the most benefit for TxDOT given that any
2 Specifically, TxDOT is exploring the use of options in which they procure a 6-month window within which they can exercise the option to purchase a parcel of land at a price determined through a legally binding pricing process agreed upon with the buyer of the option at the time the option is sold.

Project 0-5534 September 2006 Report 0-5534-1
81
individual project may involve hundreds or thousands of parcels, each with unique
characteristics and development potential?
• How can the value of a short-period option such as those currently being contemplated by
TxDOT best be determined given the uncertainty in future acquisition price and the
possibility that the option will not be exercised?
• How can the uncertainty and risks involved in early short-period options be assessed and
managed to maximize the value of this new tool for TxDOT?
Decision analysis is the study of rational decision making, and risk analysis focuses on
the assessment and management of undesirable, uncertain outcomes. Together, these tools
provide methods that can be used to address the questions posed above within the larger
framework of transportation asset management for TxDOT. When combined with optimization
and simulation techniques, decision analysis and risk analysis can provide an integrated approach
for incorporating right-of-way acquisition into transportation asset management, effectively
broadening transportation asset management to include early-phase project planning.
This chapter summarizes the usefulness of decision and risk analysis for transportation
asset management. First, decision analysis is summarized as an approach for supporting difficult
decisions, and past uses of decision analysis in transportation asset management systems are
reviewed. Next, a preliminary objective hierarchy3 for TxDOT goals and objectives is developed
based on publicly available documents and preliminary meetings with TxDOT personnel. This is
followed with a general framework for integrating risk analysis with GIS to aid in both valuing
options and searching for parcels that may be appropriate targets for short-period, advance right-
of-way acquisition options. An overarching framework for combining simulation, optimization,
and decision analysis for transportation asset management within the TxDOT organizational and
institutional structures is then suggested. Throughout this chapter, hurdles that would need to be
overcome in order to implement the suggested tools and techniques in practice are highlighted,
and future work is proposed.
3 An objective hierarchy is a formal construct from decision analysis that summarizes a decision maker’s objectives and goals in a logic diagram and yields methods for quantifying the achievement of these goals and objectives in a given situation. Objective hierarchies will be discussed extensively later in this chapter.

Project 0-5534 September 2006 Report 0-5534-1
82
INTRODUCTION TO DECISION ANALYSIS
Decision analysis is an established, axiomatic approach to decision making that has found
use in a number of fields such as asset management (e.g., Colombrita et al. 2004, Gharaibeh et
al. 2006), environmental management (e.g., O’Banion 1980; Guikema and Milke 1999, 2003;
Massman et al. 1991), and risk analysis for complex systems (e.g., Frohwein and Lambert 2000;
Frohwein et al. 2000; Dillon et al. 2003, 2005; Paté-Cornell et al. 2004). It is based on the work
of von Neumann and Morgenstern (1947) as further developed by Savage (1972) and Howard
(1968) among others. Decision analysis is based on choosing the alternative that maximizes the
decision maker’s expected utility based on a subjective view of probability where utility is a
formal measure of how well an individual’s goals are met in a given situation. It incorporates
both the probabilities of the different outcomes and the values of those outcomes to the decision
maker.
Guikema and Milke (1999) developed a decision analysis process for helping public
agencies choose projects to fund in a given year when faced with a limited budget and significant
uncertainty about project outcomes. While this was done in the context of environmental
management rather than transportation asset management, the process is general enough to
provide a starting point for developing a decision analytic transportation asset management
process. The approach developed by Guikema and Milke (1999) will be used as the basis for
providing background on decision analysis, and the specifics of their approach will be discussed
later in this chapter.
The decision analytic asset management approach developed by Guikema and Milke
consists of four interrelated components as shown in Figure 6-1. The objective model consists of
framing the decision and developing an objective hierarchy, a formal tool for modeling the goals
and objectives of decision makers. The uncertainty model involves estimating the probabilities of
different outcomes related to differing levels of goal achievement, and this model is closely
related to the use of simulation models for uncertainty assessment. These simulation models are
discussed in another chapter of this report. The utility model is a quantitative model that
measures how well the different outcomes achieve the goals and objectives of the decision maker
on the basis of the objective hierarchy from the objective model. Finally, the choice model
involves using the other three models together with tools such as optimization and sensitivity
analysis to arrive at a suggested set of activities to fund in a given year and see how sensitive the
suggested set of activities is to changes in the model and model assumptions. Optimization

Project 0-5534 September 2006 Report 0-5534-1
83
methods are discussed extensively in chapter 5 of this report. The focus of this chapter is on the
objective and utility models, and, to a lesser degree, the uncertainty model.
Figure 6-1. Overview of the Decision Analytic Asset Management Model from Guikema
and Milke (1999).
Objective models are built around an objective hierarchy. This is a method for
graphically structuring a decision maker’s objectives to support the assessment of a utility
function (e.g., Keeny 1992). An objective hierarchy starts at the top with the decision maker’s
overarching goal in the situation. In the highly simplified hierarchy shown in Figure 6-2, this
overarching goal is to maximize the value of the transportation system to the public. This overall
goal is then broken down into a number of objectives. Achievement of these objectives leads to
achievement of the overall goal. These objectives then must, together, cover all of the aspects of
the problem that comprise the overarching goal. These objectives can be broken down into a
number of lower-level objectives. The aim in using objective hierarchies is to decompose an
overarching goal that would be very difficult to directly measure into increasingly detailed
objectives until a level is reached at which these objectives can be measured. These measures
may be direction measures (e.g., time spent waiting in traffic), or they may be indirect measures
Model
Uncertainty Model
Utility
Optimization Model
Sensitivity Model
Choice Model
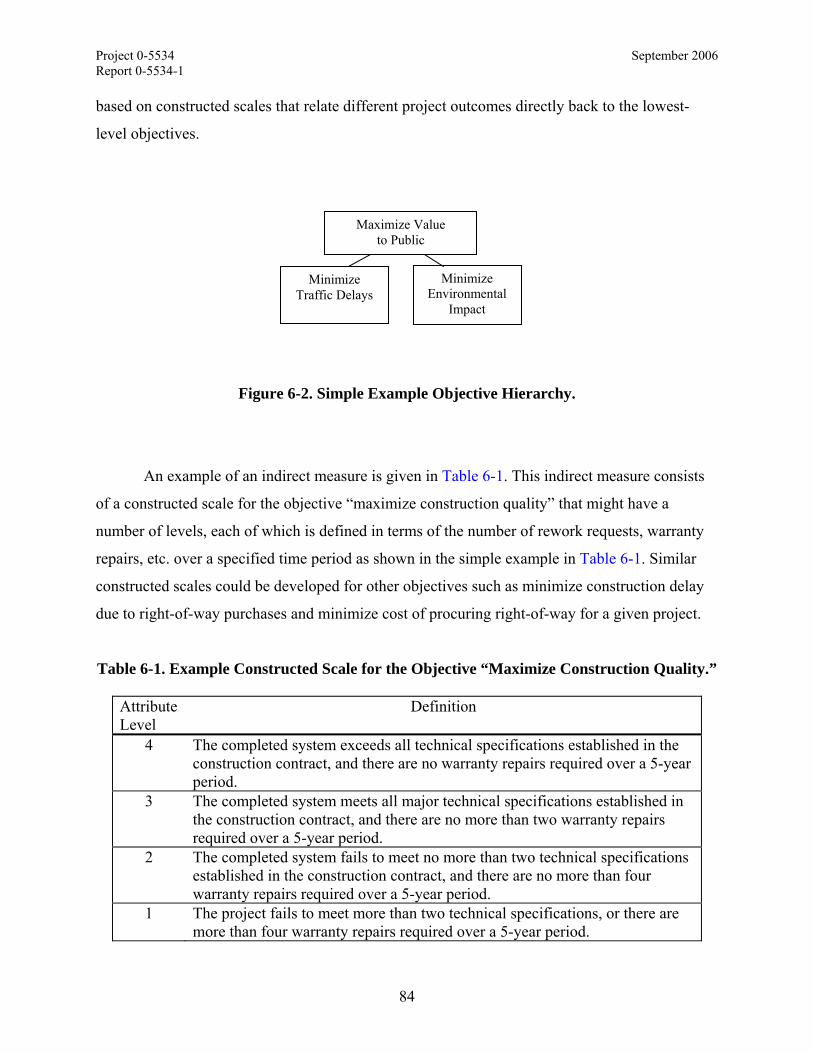
Project 0-5534 September 2006 Report 0-5534-1
84
based on constructed scales that relate different project outcomes directly back to the lowest-
level objectives.
Figure 6-2. Simple Example Objective Hierarchy.
An example of an indirect measure is given in Table 6-1. This indirect measure consists
of a constructed scale for the objective “maximize construction quality” that might have a
number of levels, each of which is defined in terms of the number of rework requests, warranty
repairs, etc. over a specified time period as shown in the simple example in Table 6-1. Similar
constructed scales could be developed for other objectives such as minimize construction delay
due to right-of-way purchases and minimize cost of procuring right-of-way for a given project.
Table 6-1. Example Constructed Scale for the Objective “Maximize Construction Quality.”
Attribute Level
Definition
4 The completed system exceeds all technical specifications established in the construction contract, and there are no warranty repairs required over a 5-year period.
3 The completed system meets all major technical specifications established in the construction contract, and there are no more than two warranty repairs required over a 5-year period.
2 The completed system fails to meet no more than two technical specifications established in the construction contract, and there are no more than four warranty repairs required over a 5-year period.
1 The project fails to meet more than two technical specifications, or there are more than four warranty repairs required over a 5-year period.
Maximize Value to Public
Minimize Traffic Delays
Minimize Environmental
Impact

Project 0-5534 September 2006 Report 0-5534-1
85
While the terms used in the example constructed scale (e.g., “major technical
specification”) would need to be clearly defined, the hypothetical example illustrates the main
point. Constructed scales provide a basis for measuring how well “soft” objectives are met in a
repeatable, defensible manner.
Objective hierarchies can be developed based on a two-step process used by Guikema
and Milke (1999) and Guikema (1999). In the first step, a preliminary objective hierarchy is
composed based on available documentation of an organization’s strategic plan and directions. In
the second step, a series of meetings is held with the organization’s designated decision maker in
order to refine the objective hierarchy based on the decision maker’s feedback. The process is
usually iterative, with multiple meetings required to revise the objective hierarchy until it
accurately reflects the goals and objectives of the organization. Only the first step of this process
has been carried out and reported in this report.
After the objective hierarchy has been developed, the next step is to compose a utility
function, a mathematical formula that measures how well each possible outcome achieves the
overarching objective. This process begins by developing single-attribute utility functions that
measure how well a given outcome achieves a single low-level objective from the objective
hierarchy. The direct measure or constructed scale levels are converted to a utility, generally
scaled to lie between 0 and 1. Constructed scales provide an ordinal scoring of outcomes. An
outcome with a score of 4 is better than an outcome with a score of 2 but not necessarily twice as
good. A utility function converts this to a cardinal scale in which the utility difference between
two outcomes is proportional to the decision maker’s strength of preference for these outcomes.
For example, an outcome with a utility of 0.8 is preferred twice as much as an outcome with a
utility of 0.4.
Developing a single-attribute utility function involves interviewing the decision maker
and asking a series of trade-off questions. For example, suppose that a single-attribute utility
function is going to be assessed for the hypothetical attribute levels in Table 6-1. A score of 4 is
assigned a single-attribute utility of 1, and a score of 1 is assigned a single-attribute utility of 0 to
standardize the utility function. Then the decision maker is asked to choose between a series of
lotteries in which they can receive Y (for example a score of 2) for sure or be faced with a lottery
that would yield a score of 4 with probability p and a score of 1 with probability 1-p. The
probability p is then varied until the decision maker is indifferent between receiving the lottery

Project 0-5534 September 2006 Report 0-5534-1
86
or the sure score. The utility of score Y is then given by (Keeney 1992, Keeney and Raiffa
1976):
( ) ( ) ( )( ) * score of 4 1 * score of 4(1) (1 )(0)
u Y p u p up pp
= + −
= + −=
(6-1)
where u(Y) is the utility of outcome Y. This approach converts attribute scores into utilities. It
can also be used with direct measures where discrete values of the direct measure are substituted
in place of the scores in Equation 6-1 and intermediate utilities are found by interpolating based
on the assessed values. Additional details of implementing this single-attribute assessment
process in the context of environmental asset management can be found in Guikema and Milke
(1999).
After the single-attribute utility functions have been assessed, the next step is to combine
these single-attribute utility functions into a single preference measure through an overall utility
function. There are a number of forms this function can take, but a common form is the additive
utility function shown in Equation 6-2:
( ) ( )i j iji j
U X k p u x=∑ ∑ (6-2)
where xij is the outcome (attribute score or direct measure) on attribute i for level j for alternative
X, pj is the probability of the jth attribute level being realized for alternative X4, and ki is the
weighting factor for attribute i. These weighting factors link all of the single-attribute utility
functions together, and they represent the relative preferences among achievement of the
different objectives. Formal methods exist for assessing these weights on the basis of lottery
trade-offs similar to those used for assessing utility functions. However, a common
approximation is to have the decision maker assign 100 “points” to the different attributes in
proportion to how much he or she cares about achieving those attributes. Then the assigned
points are renormalized such that the sum of the k’s is 1. It should be stressed that while the
additive form used from the multi-attribute utility function in Equation 6-2 is widely used, it is
not always appropriate. It assumes that additive independence holds (Keeney and Raiffa 1976).
This means that the decision maker’s preference for the levels of achievement of any one
attribute do not depend on the levels of the other attributes. If this assumption does not hold, then
4 Note that p would be a continuous probability density function if attribute i was an attribute measured with a continuous direct measure such as time or money.
Project 0-5534 September 2006 Report 0-5534-1
87
more complicated multiplicative utility functions are needed. The appropriateness of the additive
form must be checked before it is used. If the additive form is found to be inappropriate, the
objective hierarchy can sometimes be restructured to make the lower-level objectives satisfy
additive independence (the approach used by Guikema and Milke [1999]), or a different form of
utility function can be used. Keeney and Raiffa (1976) and Keeney (1992) give details about how
to check for additive independence as well as information about the alternate forms of multi-
attribute utility functions.
Constructing an objective hierarchy and assessing utility functions will:
1. provide a basis for broadening the objectives considered in TxDOT asset management
beyond purely technical and economic considerations to incorporate the wider goals that
TxDOT has in serving the public of Texas, and
2. provide valuable input to optimization models in the form of a quantitative measure of
how well different projects and alternatives achieve TxDOT goals and objectives.
Another important aspect of decision analysis that is relevant to the problem of
incorporating right-of-way purchase into transportation asset management is the valuation of
options. Decision analysis may be able to help provide a basis for this valuation problem.
Working from the decision analytic perspective, Howard (1996) defined the value of an
option as the amount a decision maker would pay for that option that would make him or her
indifferent between having the option and not having it. This definition of option value is closely
related to the value of information problems in decision analysis (see Clemen and Reilly
[2001]).The value of information gained about the realization of a relevant random variable such
as the cost of a parcel of land is defined as the maximum amount that the decision maker should
be willing to pay for that information—the amount that makes him or her indifferent between
having that information at that cost and not having the information. Similar to the calculation of
the value of information, the value of an option can be calculated in the general case by
repeatedly adding a small cost increment to the option cost until the revised cost of the option
makes other alternatives preferable. The total cost increment at which the decision maker
switches from preferring the option to preferring another alternative is the value of the option to
the decision maker.
The definition of the value of option given by Howard (1996) is not dependent on the
availability of financial instruments to be compared with the option in question as traditional
definitions of real options values are (e.g., Trigeorgis 1997). This makes the decision analytic

Project 0-5534 September 2006 Report 0-5534-1
88
definition of the value of an option particularly appealing in right-of-way valuation. Rarely
would enough detailed financial information be available to allow short-period right-of-way
options to be directly compared to the options present in such a situation. Smith and McCardle
(1999) and Smith and Nau (1995) used a similar approach in valuing options from a decision
analytic point of view.
One final aspect of decision analysis that is important is the tools used for representing
decisions—decision trees and influence diagrams. These tools provide convenient methods for
communicating with decision makers in a clear manner. For small problems they can also be
used directly to suggest good alternatives, but for large problems they need to be coupled with
optimization methods.
A decision tree is a graphical representation of a problem in which a rectangle represents
a decision, branches leaving a rectangle represent alternatives, a circle represents an uncertainty,
and the branches leaving an uncertainty represent possible realizations of the uncertainty. An
example decision tree representing a fictitious decision of whether or not to offer an advance-
purchase option on a single parcel in a potential corridor is given in Figure 6-3. In this example,
TxDOT first makes a decision about whether or not to offer a short-period option to the property
owner. If they do not, they are faced with an uncertain purchase price at a later date. For
simplicity, Figure 6-3 shows this price as being either “high” (200 units) or “low” (100 units)
with the high cost being more likely with a probability of 0.75. If the short-period option is
offered at an assumed cost of 25 units, TxDOT is uncertain whether or not the owner will accept
the option. This is represented by the “Owner Accepts” uncertainty node where a probability of
acceptance of 0.30 has been assumed. If the owner does not accept the option, then TxDOT
again faces the uncertain cost of the later purchase price. If the owner accepts the option, TxDOT
then must decide whether or not to exercise the option at the end of its exercise period. If they do
not exercise the option, they are faced with the uncertain future cost of the parcel. In Figure 6-3,
this future cost is again assumed to have a probability of 0.75 of being “high.” If TxDOT
exercises the option, the immediate purchase price may still be uncertain due to the appraisal and
purchasing process used for these options5. However, it is assumed in Figure 6-3 that this
purchase price is more likely to be in the “low” category than if the option had not been used.
5 J. D. Ewald from TxDOT ROW explained that for the small number of 3-month options signed so far, the option contract establishes the process by which the purchase price of a parcel will be established, not the purchase price itself. This means that there would still be uncertainty in the purchase price when TxDOT decides to exercise the option.

Project 0-5534 September 2006 Report 0-5534-1
89
It should be stressed that the decision tree shown in Figure 6-3 is a fictitious example
meant to illustrate the decision tree as a tool. A real right-of-way option decision would involve
more uncertainties (e.g., forecasts of price changes over time and possibilities of different final
alignments) as well as more decisions (e.g., a recursive negotiation process with the land owner).
In spite of these simplifications, Figure 6-3 does suggest that a decision tree may be a useful tool
for (1) analyzing relatively small decisions and (2) communicating the structure of large decision
situations to decision makers.
75.0% 0200 225
FALSE Price0 200
25.0% 0100 125
30.0% Exercise Option ?25 165
40.0% 0.12200 225
TRUE Price0 165
60.0% 0.18100 125
TRUE Owner Accepts?0 172
75.0% 0.53200 200
70.0% Purchase Price Later0 175
25.0% 0.18100 100
Propose Option to Owner?172
75.0% 0200 200
FALSE Purchase Price Later0 175
25.0% 0100 100
Advanced Right-of-Way
Yes - propose
No - do not propose
Yes
No
"High"
"Low "
No
Yes
"High"
"Low "
"High"
"Low "
"High"
"Low "
Figure 6-3. Example Decision Tree for a Fictitious Right-of-Way Option on a Single Parcel.
Decision analysis provides a method for incorporating broad decision maker values into
transportation asset management and right-of-way decisions. It does this through a structured
approach for quantifying how well different alternatives achieve a decision maker’s goals and

Project 0-5534 September 2006 Report 0-5534-1
90
objectives and relating this quantification to aspects of the alternatives. The next few sections
will briefly summarize past uses of decision analysis in transportation asset management,
develop a preliminary objective hierarchy for TxDOT transportation asset management, suggest
an outline for a probabilistic tool to help decision makers search for parcels that might be good
candidates for advance-purchase options, and discuss how decision analysis, optimization, and
simulation can be linked together in a coherent tool within the TxDOT organizational
framework.
PAST USES OF DECISION ANALYSIS
As discussed in the literature review chapter, transportation asset management systems
incorporating multiple types of assets have been developed. Examples include an asset
management system incorporating pavement, bridges, transit vehicles and shelters, bike paths,
sidewalks, and traffic signals developed for a small city in Vermont (Sadek et al. 2003) and an
asset management system specifically for bike paths in Illinois (Charaibeh et al. 1998). The past
small-scale yet multi-asset applications provide a good starting point for developing a TxDOT
asset management system, and some of the past work in transportation asset management has
made use of decision analysis in various ways. The literature review chapter has discussed the
transportation asset management work related to decision analysis. This section focuses on one
aspect of decision analysis that has not been rigorously included in transportation asset
management that, if it were included, could be of substantial benefit.
One of the main limitations in past applications of decision analysis to transportation
asset management is that past work has dealt with a narrow set of goals rather than a broad set of
goals that would encompass the full spectrum of topics that an agency like TxDOT considers in
transportation asset management. For example, Dicdican et al. (2004) developed a transportation
asset management system but considered only objectives related to maintenance cost and service
life. Curtis and Molnar (1997) developed an asset management system but included objectives
related only to infrastructure condition over time. While Gharaibeh et al. (2006) used multi-
attribute utility theory to consider multiple objectives, these were related specifically to
infrastructure condition and accident rates. Similarly, Colombrita et al. (2004) focused on
conditioned-based objectives. Dewan and Smith (2005) did explicitly recognize the importance
of considering a broader set of agency objectives beyond monetary and condition-based values.

Project 0-5534 September 2006 Report 0-5534-1
91
However, Dewan and Smith (2005) concluded that estimating the monetary value of a road
network to society at large is unreliable because of the complexity of the problem. Decision
analysis provides a method to move beyond monetary valuations and consider a broad set of
objectives through the development of an objective hierarchy and associated utility function.
PRELIMINARY OBJECTIVE HIERARCHY
As discussed previously, an objective hierarchy is a formal, graphical representation of a
decision maker’s goals and objectives that provides a basis for quantifying the achievement of
these goals and objectives through a utility function. This utility function provides a sound
objective function for use in optimization routines for transportation asset management. This
section presents a preliminary objective hierarchy that was developed on the basis of available
TxDOT planning documents such as the Unified Transportation Program Statewide Mobility
Plan (TxDOT 2006a), the Statewide Transportation Improvement Program for 2006–2008
(TxDOT 2006b), the TxDOT Right of Way Manual (TxDOT 2006c), and the TxDOT Statewide
Preservation Program (SPP): Summary of Categories (TxDOT 2005).
The Unified Transportation Program (UTP) provided the starting point for developing a
preliminary objective hierarchy for TxDOT transportation asset management. The UTP lists
TxDOT’s goals as:
1. Ensure that people and goods move efficiently (“reliable mobility”).
2. Reduce roadway fatalities (“improve safety”).
3. Maintain and improve existing roads and bridges (“responsible system preservation”).
4. Complete projects faster (“streamlined project delivery”).
5. Attract and retain business and industry (“economic vitality”).
While this list of goals provides a starting point, the list of funding categories and the
summary of what is included in these categories in the Statewide Preservation Program (TxDOT
2005) was used to ascertain the degree to which these five goals are apparent in the rationale for
choosing projects. Goals 1 and 2—mobility and safety, respectively—clearly play a leading role
in choosing projects to fund. Maintenance (goal 3) also plays a role, though it often appears to be
justified by appealing to improving longer-term mobility, part of goal 1. While goal 4,
completing projects faster, is certainly important, it does not appear to play a role in selecting
projects to fund. Rather, it likely plays a role in determining how projects are managed, and it
may be a driving factor behind the desire to procure right-of-way earlier in the project
Project 0-5534 September 2006 Report 0-5534-1
92
development process. Finally, goal 5, enhancing economic vitality, does not appear to play a
direct role in project-selection decisions once projects have been proposed. While the stated
TxDOT goals may guide the overall choices of TxDOT, transportation asset management and
right-of-way management are more specific areas of concern that deal in more detail with a
subset of the goals. This suggests that an objective hierarchy for TxDOT transportation asset
management will have a slightly different focus than the stated goals of TxDOT. In particular,
the current TxDOT funding categories do not directly include the stated goal of completing
projects faster. At the same time, the funding categories suggest that improving environmental
quality and aesthetics is an important goal, but this goal is not captured in the stated TxDOT
goals. There is a mismatch between TxDOT’s stated goals and their current funding categories.
This further emphasizes the need for a clear, well-developed objective hierarchy and utility
function to use as the basis for optimizing TxDOT asset value.
Figure 6-4 shows the preliminary objective hierarchy for TxDOT transportation asset
management. It should be emphasized that this is a preliminary objective hierarchy based only
on available TxDOT planning documents. Creating a final hierarchy would require interaction
with TxDOT decision makers in order to refine and modify the hierarchy shown in Figure 6-4.
The overall goal, shown at the top of the hierarchy in the dark gray box, has been inferred from
TxDOT planning documents, and it will need to be revised through interaction with TxDOT
decision makers. The next level of objectives is shown in the lighter gray boxes. These
correspond to a combination of TxDOT’s stated goals together with funding categories that
appear, at least initially, to correspond to goals not included in TxDOT’s stated overall goals.
Most of these objectives are then further decomposed to get to the level of individual funding
categories6. As discussed above, this objective hierarchy should be revised, perhaps
substantially, through discussions with TxDOT decision makers.
After the objective hierarchy has been refined, the next step would be to develop a utility
function that relates the outcomes of individual projects to the achievement of TxDOT goals as
stated in the final objective hierarchy. The methods for composing these utility functions were
discussed above; an approach similar to that used by Guikema and Milke (1999) would provide a
good starting point. Once the overall multi-attribute utility function has been assessed, it would
provide a rigorous objective function for use with optimization methods in choosing a set of
projects to fund and right-of-way parcels to acquire in a given time period.

Project 0-5534 September 2006 Report 0-5534-1
93
Figure 6-4. Preliminary Objective Hierarchy for TxDOT Transportation Asset
Management.
6 The numbers is parenthesis in Figure 6-4 correspond to specific TxDOT funding categories.
Improve the quality of life in Texas by providing a safe, efficient, and
environmentally sensitive transportation system.
Provide reliable mobility.
Improve travel safety.
Maintain system efficiently.
Improve environmental
quality and aesthetics.
Provide districts with flexibility to meet local needs. (11)
Meet strategic needs of the
state and nation. (12)
Improve mobility in urban areas.
(2, 3)
Improve statewide
connectivity. (4)
Improve mobility in and
around state parks. (10)
Improve accessibility of
sidewalks to wheelchairs. (10)
Maintain current roads. (1)
Maintain/replace current bridges.
(6)
Improve safety trouble spots. (8)
Improve railroad crossing safety.
(8)
Build/upgrade rest areas. (8)
Minimize violation of ambient air
quality standards. (5)
Improve landscape. (6)

Project 0-5534 September 2006 Report 0-5534-1
94
IDENTIFYING PROMISING CANDIDATE PARCELS FOR EARLY ACQUISITION
OPTIONS
One of the key difficulties in incorporating early right-of-way acquisition into
transportation asset management systems is being able to effectively identify which parcels are
most suitable targets for short-period right-of-way options and how much options for these
parcels might be worth on the basis of limited available information about the large number of
parcels potentially involved in a given project. This problem can be viewed as a problem of
inference under uncertainty. TxDOT must discern which parcels are most at risk for cost
escalation, where “cost” is broadly defined, in order to proactively pursue advance-purchase
options. However, this must be done under considerable uncertainty without a great deal of
parcel-specific information. One potential approach for dealing with this difficult problem is to
combine a Bayesian generalized linear model (GLM), a type of regression model, with a GIS to
automate the search for potentially attractive parcels early in a project’s life cycle and predict the
price increase of different parcels. After giving an overview of these modeling methods, this
section proposed a process that could be used to develop a Bayesian GLM, a technique used in
risk analysis (e.g., Guikema et al. 2006), coupled with a GIS to aid the search for attractive
parcels for early purchase options.
GLMs (e.g., Cameron and Trivedi 1998) provide a unifying family of models that is
widely used for regression analysis. These models can describe both normal and non-normal
responses. Important examples include binary, multinomial, and Poisson data. Over the years,
GLMs have expanded much in scope and usage, and are currently applied to a very broad range
of problems, which include analysis of multi-category data, non-Gaussian data, and discrete time
survival data. This class of models is attractive as an aid in identifying attractive parcels for early
acquisition. If the potential for a parcel to increase in price can be categorized based on past data
and experience, then a multinomial GLM can potentially be used to estimate the probability that
any given parcel in future projects will be in each class of price escalation risk on the basis of a
number of explanatory variables. Due to limitations likely inherent in the available data, linear
regression and related models are unlikely to give adequate performance for predicting the future
costs of parcels. A category-based price prediction could provide sufficient information for
TxDOT decision making while simultaneously yielding more accurate price predictions than
many other types of regression models.
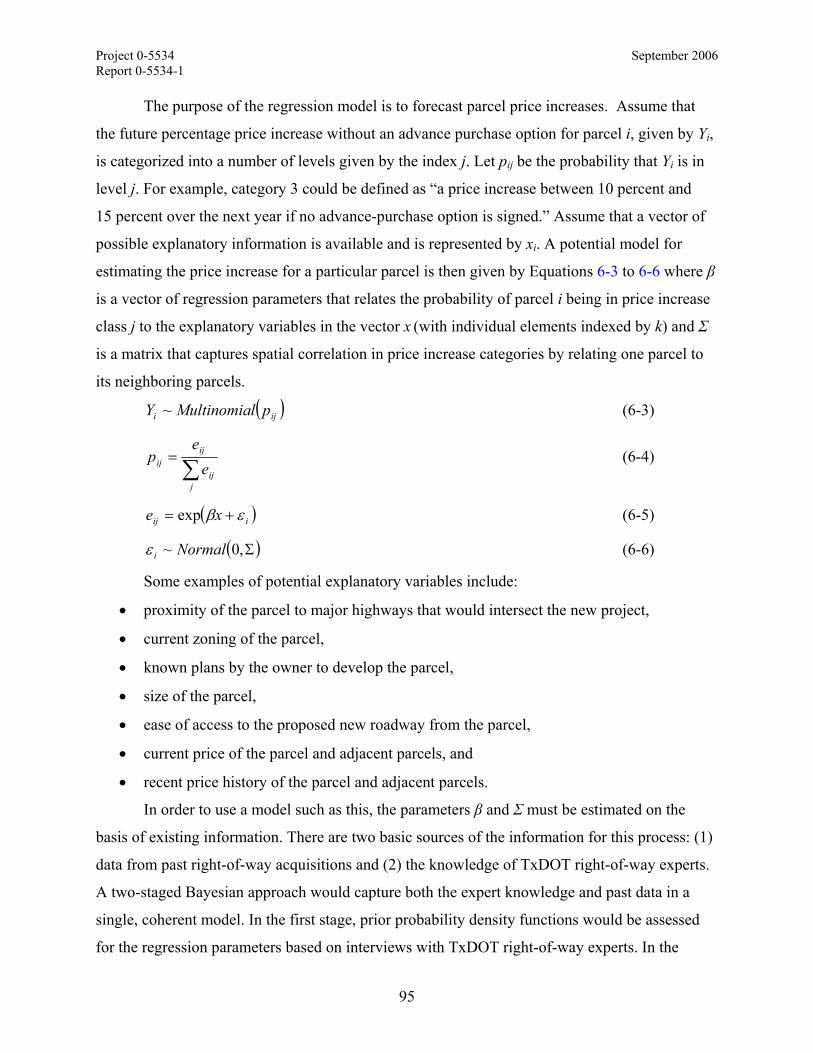
Project 0-5534 September 2006 Report 0-5534-1
95
The purpose of the regression model is to forecast parcel price increases. Assume that
the future percentage price increase without an advance purchase option for parcel i, given by Yi,
is categorized into a number of levels given by the index j. Let pij be the probability that Yi is in
level j. For example, category 3 could be defined as “a price increase between 10 percent and
15 percent over the next year if no advance-purchase option is signed.” Assume that a vector of
possible explanatory information is available and is represented by xi. A potential model for
estimating the price increase for a particular parcel is then given by Equations 6-3 to 6-6 where β
is a vector of regression parameters that relates the probability of parcel i being in price increase
class j to the explanatory variables in the vector x (with individual elements indexed by k) and Σ
is a matrix that captures spatial correlation in price increase categories by relating one parcel to
its neighboring parcels.
( )iji plMultinomiaY ~ (6-3)
∑=
jij
ijij e
ep (6-4)
( )iij xe εβ += exp (6-5)
( )Σ,0~ Normaliε (6-6)
Some examples of potential explanatory variables include:
• proximity of the parcel to major highways that would intersect the new project,
• current zoning of the parcel,
• known plans by the owner to develop the parcel,
• size of the parcel,
• ease of access to the proposed new roadway from the parcel,
• current price of the parcel and adjacent parcels, and
• recent price history of the parcel and adjacent parcels.
In order to use a model such as this, the parameters β and Σ must be estimated on the
basis of existing information. There are two basic sources of the information for this process: (1)
data from past right-of-way acquisitions and (2) the knowledge of TxDOT right-of-way experts.
A two-staged Bayesian approach would capture both the expert knowledge and past data in a
single, coherent model. In the first stage, prior probability density functions would be assessed
for the regression parameters based on interviews with TxDOT right-of-way experts. In the

Project 0-5534 September 2006 Report 0-5534-1
96
second stage, available information about past TxDOT right-of-way acquisitions would be used
to update these priors to arrive at the final suggested model. This final model could then be
updated over time as more information becomes available from future right-of-way purchases.
Bayesian methods model uncertainty by including hard data and expert knowledge in a
single, coherent model on the basis of a theoretically rigorous approach. Bayesian methods start
with a probability density function, the “prior,” which represents the analyst’s a priori
knowledge about the situation (e.g., Apostolakis 1990, Howard 1965, Lee 2004, Gelman et al.
1995). This prior is then updated with a probability density function that represents the
likelihood of obtaining the observed data given the initial beliefs. Mathematically, Bayesian
updating is done through Bayes’ theorem, given in Equation 6-7 where the observed data are
represented by d, a is the random variable of interest in the problem, and f(z) is the probability
density function (PDF) for random variable z.
( ) ( ) ( )( )
( ) ( )( ) ( )∫
=×
=
xAad
Aadda
dxxfxdf
afadfdatatheofyprobabilittotal
priorlikelihooddaf|
|
||
|| (6-7)
Expert knowledge and imprecise data can be directly incorporated into a Bayesian
analysis through the use of informative prior distributions for model parameters. Guikema and
Paté-Cornell (2004, 2005) and Guikema (2005, 2006) provide examples of developing, testing,
and using informative priors based on imprecise data and expert knowledge. One of the primary
methods for formulating informative priors is through the maximum entropy method.
Entropy, defined in Equation 6-8 for a given probability density function f(x), can be used
as a measure of the amount of uncertainty contained in a probability distribution (Jaynes 1963,
Katz 1967, Shannon 1948, Smith 2001).
( ) ( )logS f x f x dx∞
−∞= −∫ (6-8)
In assessing a probability density function based on a set of information, maximizing the entropy
yields the density function that is consistent with the available data while maximizing the
variability in the data. This minimizes unwarranted assumptions of accuracy based on the
available data (Jaynes 1963, Shore and Johnson 1980). This approach has been applied in areas
as diverse as image fusion (Tapiador and Casanova 2002) and composing priors for risk analysis
(Guikema 2006). In order to use this approach, an expert’s knowledge of low-order moments of
a distribution (e.g., the mean marginal impact of parcel proximity to a new highway on parcel
price increase class) is assessed. These moments are then used as constraints in an entropy

Project 0-5534 September 2006 Report 0-5534-1
97
maximization problem to determine the prior distributions for the regression parameters. These
priors are then used as starting points to be updated based on hard data from past TxDOT parcel
acquisitions.
The general steps needed for developing the parcel price risk Bayesian GLM are:
1. Classify parcel price increases into a relatively small number of categories that are
meaningful to TxDOT. For example, categories could be based on percentage price
increase over a given time window (e.g., 1 year).
2. Determine the set of characteristics that influence how much the price of a parcel
increases after it has been determined that the parcel lies in a possible right-of-way.
These characteristics would be used as the x values in the model above. This step would
be done through consultation with TxDOT right-of-way experts and with the private real
estate agents that TxDOT has employed for past right-of-way purchases.
3. Assess the relative mean impacts of the different characteristics on price increase with the
right-of-way experts and realtors. This would be done through formal probability
assessment techniques in either one-on-one or group interviews.
4. Create informative priors for the regression parameters. The assessments in step 3 would
be in the form of marginal impacts, implying that the assessments deal with ki xY ∂∂ .
These assessments would be used as constraints on the entropy maximization problem in
this form.
5. Collect available information about past right-of-way acquisition from TxDOT. This
information would need to include the amount by which the prices of different parcels
increased over a known amount of time together with information about the parcel
characteristics deemed important in step 2.
6. Update the model from step 4 with the data through Bayesian updating to create the final
model. This updating would likely be done through Markov chain Monte Carlo (MCMC)
methods. As additional information becomes available in the future, this model can be
further updated to reflect all available information.
Once the statistical model has been developed, it can be made operational by using it
within a GIS environment to aid the search for parcels where early acquisition efforts can be
most profitably concentrated. This would be done by using the GIS to (1) determine
characteristics of parcels that would then be used as input to the statistical model and (2) display
the results of the analysis with a color-coded map highlighting the areas most at risk for price

Project 0-5534 September 2006 Report 0-5534-1
98
increase. More specifically, a small grid (e.g., 1 km × 1 km) could be overlaid on the state of
Texas. A series of GIS layers could then be created on top of this grid, including, for example,
the current Texas transportation system, cities, population density, current land values (if
available), ecological zones, rainfall, and any other variables deemed important as determinants
of parcel price increase risk. When potential corridors are proposed for a new project, these
could be overlaid on the base map. This map could then be used to generate the values of the
covariates (the x variable) for the statistical model. The statistical model could then be used to
calculate the probabilities that parcels in each of the grid cells are in each of the possible price
increase classes. Those grid cells with high probabilities of large price increases would be
highlighted on the map in red, with a color scale decreasing to green for those grid cells with low
probabilities of large price increases. This map could then be used to help guide more detailed
exploration of particular parcels for early acquisition.
NEXT STEPS IN THE DEVELOPMENT PROCESS: REQUIREMENTS AND
LIMITATIONS
The next steps in the process of developing an objective hierarchy, utility function, and
advance right-of-way screening methodology would involve significant interaction with TxDOT
managers. This is particularly true of the objective hierarchy and utility function development
process. The objective hierarchy and utility function can capture the objectives and goals of only
those people that the research team interviews and interacts with during the development
process. If the hierarchy and utility function are to be representative of broad, overarching
TxDOT goals rather than the more detailed goals of particular groups, the research team will
need to interact with senior TxDOT managers and work with them to develop the objective
hierarchy and utility.
The interactions needed for the development of an advance right-of-way screening
method will involve a much different group of people—TxDOT right-of-way experts and the
private realtors employed by TxDOT in right-of-way acquisition. The goal would be to base the
model on their substantial expert knowledge, updated with data from right-of-way acquisitions.
This would capture both the expertise within TxDOT and the hard data from past right-of-way
acquisition activities that are available within TxDOT.

Project 0-5534 September 2006 Report 0-5534-1
99
IMPLEMENTING A COMBINED RIGHT-OF-WAY/ASSET MANAGEMENT
METHOD WITHIN THE TXDOT ORGANIZATIONAL SETTING
Implementing an asset management system based on decision analysis, optimization, and
simulation and integrating advance-purchase right-of-way acquisition into this system will
require that the method work within the TxDOT organizational setting and take into account the
constraints that this imposes on the process. TxDOT is a multi-level organization with
25 districts, each of which has some budgeting autonomy within certain classes of funding. This
suggests the need for a hierarchical model similar to that developed by Guikema and Milke
(1999).
The funding situation within TxDOT also imposes constraints on the use of a combined
asset management/right-of-way purchase system. TxDOT funding is divided into 12 categories
of funds. Exchanges can be made between some of these categories of funds, while the amounts
to be spent in other categories are fixed by federal and state rules, regulations, and fiscal policies.
Asset management also occurs over different time scales, especially if advance-purchase right-
of-way is to be included in the model. Districts make letting plans on a yearly basis, while right-
of-way budgeting decisions may be made years in advance of letting. The funding situation
suggests that not only should the models be used in a hierarchy setting, they should be used at
different times within the process on the basis of different budgets.
One possible approach for implementing a combined asset management/right-of-way
purchase system for balancing (1) right-of-way purchase, (2) mobility projects, and (3) district
discretionary projects within the TxDOT planning framework in shown in Figure 6-5.

Project 0-5534 September 2006 Report 0-5534-1
100
Figure 6-5. Preliminary Approach for Integrating a Combined Asset Management/
Right-of-Way Model into the TxDOT Planning Framework.
The process suggested in Figure 6-5 would start at the point labeled A with the leadership
of TxDOT formulating an objective hierarchy and utility function for a given planning period.
This is a similar idea to the funding criteria currently used by TxDOT in the Unified
Transportation Program Statewide Preservation Program, except that the objective hierarchy
would cover a broader range of considerations as outlined previously in this chapter. This utility
function would then be given to the districts and to other authorities that would be proposing
work. Metropolitan, urban, and non-urban planning authorities are shown in Figure 6-5, but this
category would be broadened as needed. At the points labeled B and C in Figure 6-5, these
groups would use the utility function to solve a suboptimization problem that would yield their
desired work as a function of a range of possible budgets. This information would then be passed
back to the state level. The state-level office would then use their utility function together with
the suggested work and right-of-way purchases to determine appropriate budgets and approved
mobility projects for each of the 12 categories where there is flexibility in the funding levels for
TxDOT State Office
Right-of-way budget Letting budget District discretionary
Districts Metropolitan, Urban, and Non-urban Authorities
Desired right-of-way purchases Desired letting schedule Suggested mobility projects
Desired letting schedule Suggested mobility projects
Districts Metropolitan, Urban, and Non-urban Authorities
Mobility projects approved Letting/construction budget
Right-of-way budget
TxDOT State Office
Statement of TxDOT objective hierarchy and utility function for
(1) asset management and (2) right-of-way
A
C B
D E
A
Project 0-5534 September 2006 Report 0-5534-1
101
each of the districts and planning authorities. These budgets would then be handed down to the
districts and planning authorities at the points labeled D and E. The usual process of updating the
letting schedule and modifying budgets as needed based on project progress would then be
followed. It is primarily at the points labeled D and E, the points at which large mobility projects
are in the early planning phases, that the right-of-way screening model would be used.
The multi-level process suggested in Figure 6-5 is a rough starting point. The actual
TxDOT budgeting process is considerably more complex than this, especially when the less
flexible classes of funding are considered. However, the process suggested in Figure 6-5 is a
starting point that could be adjusted through interaction with TxDOT decision makers to better
fit within the TxDOT organizational framework. Regardless of the final form, using a multi-level
process such as the one suggested in Figure 6-5 would have the benefit of keeping the decision
making decentralized while allowing the state office to control both the budget and the objectives
used at the local level in suggesting work. This would allow work to be suggested by those most
familiar with local needs and conditions while simultaneously allowing TxDOT leadership to set
the overall direction and objectives used in a statewide asset management system.
CONCLUDING REMARKS
Decision analysis provides a method for incorporating broad decision maker values into
transportation asset management and right-of-way decisions. It incorporates a structured
approach for quantifying how well different alternatives achieve a decision maker’s goals and
objectives and relating this quantification to aspects of the alternatives. Decision analysis and
risk analysis together with Bayesian probability modeling can provide a basis for aiding the
search for attractive early purchase parcels and the process of deciding on prices for individual
early purchase options. This chapter has suggested a few ways in which decision and risk
analysis can be used within the TxDOT asset management/right-of-way process. The main
conclusions from this chapter are:
1. TxDOT’s full set of objectives must be used as the basis for asset management or
TxDOT will not truly maximize the value of Texas transportation assets.
2. Decision analysis can help capture the full range of objectives in a quantitative utility
function, but the process of doing this will require a significant investment of time from
senior TxDOT personnel.

Project 0-5534 September 2006 Report 0-5534-1
102
3. Proactive pursuit of appropriate advance purchase options for targeted parcels may help
TxDOT achieve its objectives at a lower cost, and past data can be combined with expert
knowledge to help target parcels for acquisition for a given project.
A number of future steps that would be needed to fully develop these ideas have been
outlined. The development of the utility function could proceed in parallel with the development
of the optimization model discussed in other chapters, with the two being combined after they
have been developed. The right-of-way screening method is perhaps best developed in a phased
method with data and expert knowledge gathered during the first year and the technical model
developed during the second year. Fully utilizing the ability of decision analysis to broaden the
scope of objectives considered in asset management, together with the capacity for reasoning
under uncertainty provided by risk analysis and Bayesian probability, can significantly
strengthen both asset management and right-of-way purchasing within TxDOT.

Project 0-5534 September 2006 Report 0-5534-1
103
CHAPTER 7: CONCLUSIONS AND RECOMMENDATIONS
TxDOT is currently facing greater funding allocation challenges than ever before. More
efficient methods and tools could greatly assist TxDOT in not only allocating available funds as
wisely as possible, but also in justifying additional funding requests, in measuring the results of
their investment decisions, and in communicating the results to the Texas Transportation
Commission, the Texas Legislature, and ultimately the public.
Due to the complexity of the decision-making process and the diversity of the assets
among which to allocate the funds, this management challenge is seen as an ongoing and long-
term effort. The best way to address this comprehensive challenge is to initially study a pair of
specific asset components and focus on improving decision-assisting tools in that smaller
funding allocation arena. Application of modern management science techniques provides the
best opportunity to significantly improve decision-making assistance.
In this project the research focus areas selected by TxDOT’s upper management as a pilot
study arena are early acquisition of right-of-way and additional capacity construction projects.
These two areas, and especially the right-of-way area, are ripe for immediate attention. Potential
benefits from advantageous early right-of-way acquisitions are believed to be quite substantial in
terms of both tax dollar savings and construction project predictability.
Minimizing the cost of right-of-way acquisition and speeding construction completion
time are without doubt target objectives of TxDOT. Various methodologies can potentially be
used to achieve these objectives. For that reason, three independent approaches were developed,
each using differing perspectives and management science techniques. Simulation, optimization,
and decision analysis techniques were each investigated as potential methods. Although each
approach is unique, there are some common aspects in each, in particular in the core information
needed to build the models that each proposes. A short summary and comments regarding each
of the three approaches follow.
Simulation is a powerful programming technique used for incorporating stochastic
behavior into a system model. The complex factors and interrelated variables involved with
TxDOT funding allocation certainly can be characterized as stochastic. The development of a
simulation tool that can be used to aid in the early right-of-way acquisition decision is proposed
for this project. Event-driven simulations are chosen as the core technique for the model

Project 0-5534 September 2006 Report 0-5534-1
104
supporting this tool. Four major phases are considered during the model development, with each
phase containing multiple activities. These phases are (1) “as-is” model development for
projects with no early acquisition, which is modeling the current process; (2) “to-be” model
development that includes early acquisition options, which is modeling the new process;
(3) potential integration of the decision-support and optimization submodels for use within the
simulation; and (4) verification/validation. The output from the model will be recommendations
relating to early right-of-way acquisitions and a projection of expected annual costs for the
project plus their tail probabilities. The deliverable from the simulation approach will be an
event-driven simulation of project development that includes a decision submodel together with
a branch-and-bound or other combinatorial type algorithm to assist in the right-of-way early
acquisition decision. It is expected that the completed simulation tool will be useful at both the
district and state level. At the district level, it will enhance individual project planning. At the
state level, it will enhance policy making by allowing improved analysis of potential early right-
of-way acquisition strategies and the exploration of potential project cost savings associated with
statewide expansion of early right-of-way acquisition.
From an optimization perspective, two strong approaches for optimal resource allocation
are proposed: the top-to-bottom and the bottom-to-top approaches. The top-to-bottom approach
uses two different types of models to first allocate the early right-of-way allocation budget
between districts at the TPP and ROW level, and then to solve a smaller-scale resource allocation
problem when each district selects right-of-way approaches for specific projects. The bottom-to-
top approach first applies decision-making support tools at the project and district levels, and
then supports decision making regarding early right-of-way acquisition budget allocation among
the districts. Both optimization approaches allow formulating the research problem as
mathematical programs, which can be solved, exactly or approximately, using optimization
techniques. The solution provided by these techniques can prescribe the optimal time for right-
of-way acquisition and the most likely date for project letting considering the planning time
horizon and right-of-way sites under analysis. This information can be used to estimate right-of-
way budget needs at the district level and to allocate funds among districts at the division level.
A sensitivity analysis can be performed using optimization tools by varying the input parameters
and recording and analyzing the corresponding solutions obtained.

Project 0-5534 September 2006 Report 0-5534-1
105
From a decision analysis perspective, methods and tools used for analyzing the problem
are part of the study of the rational decision-making process. Decision analysis combined with
optimization and simulation techniques can provide a solid integrated approach. Risk analysis
can also be incorporated into this approach in order to explore the assessment and management
of undesirable, uncertain outcomes. More specifically, the construction of an objective hierarchy
to fully capture interrelationships in the decision-making process and the development of utility
functions to better incorporate knowledge and expertise are proposed in this approach. From this
perspective, this structured approach will permit quantifying how well different alternatives
achieve a decision maker’s goals and objectives and relate this quantification to aspects of the
alternatives. As an alternative to the simulation and optimization approaches already explained,
Bayesian probability modeling combined with decision analysis and risk analysis techniques is
suggested for aiding the search for attractive early purchase parcels and the process of estimating
costs for individual early purchase options.
Each of the three approaches has been carefully studied and discussed by research team
management. The conclusions and recommendations of this analysis are:
1. The decision-making support tools proposed herein using simulation, optimization, and
decision analysis methodologies are believed to offer considerable benefits to TxDOT in
TPP, ROW, and the districts.
2. Considerable amounts of historical right-of-way acquisition information will be required
for the development of right-of-way acquisition analysis tool(s). Most of the right-of-
way data that will be needed are believed to be available in the Right-of-Way Information
System (ROWIS).
3. It is suggested that future project work pursue one of the proposed approaches as a “core
approach” to a comprehensive asset management enhancement for TxDOT. Later, if it is
feasible, applicable pieces of the other two approaches could be incorporated into the
core approach where they would offer the most benefit. This plan for the second phase of
the project offers the best opportunity to complete development of the selected tool
within the given project resources and budget.
4. It is recommended that the selection of the core approach be made by TxDOT based on
the content of this report and one or more Project Monitoring Committee (PMC)
meetings with the research team, during which additional desirable facets may be
established as well as heretofore unseen challenges identified. This cooperative analysis

Project 0-5534 September 2006 Report 0-5534-1
106
is the first task in phase two of this project. A detailed work plan for subsequent tasks
will then be prepared and presented to best address additional phase two TxDOT goals.

Project 0-5534 September 2006 Report 0-5534-1
107
REFERENCES
AASHTO. 21st Century Asset Management. American Association of State Highway and
Transportation Officials, Washington, D.C., 1997.
AASHTO. Transportation Asset Management Guide. American Association of State Highway
and Transportation Officials, Washington, D.C., 2002.
AbouRizk, S., and J. Shi. “Automated Construction-Simulation Optimization.” Journal of
Construction Engineering and Management, Vol. 120, No. 2, 1994, pp. 374–385.
Amekudzi, A. Uncertainty Analysis of National Highway Performance Measures in the Context
of Evolving Analysis Models and Data. Doctoral Dissertation, Carnegie Mellon
University, Pittsburgh, PA, 1999.
Amekudzi, A., and S. McNeil. “Capturing Data and Model Uncertainties in Highway
Performance Estimation.” Journal of Transportation Engineering, Vol. 126, No. 6, 2000,
pp. 455–463.
Antoniou, C. Demand Simulation for Dynamic Traffic Assignment. Master’s thesis, Department
of Civil and Environmental Engineering, Massachusetts Institute of Technology,
Cambridge, MA, 1997.
Anstreicher, K., N. Brixius, J.-P. Goux, and J. Linderoth. “Solving Large Quadratic Assignment
Problems on Computational Grids.” Mathematical Programming, Series B, Vol. 91,
2002, pp. 563–588.
Apostolakis, G. “The Concept of Probability in Safety Assessments of Technology Systems.”
Science, Vol. 250, No. 7, December 1990.
Applegate, D., R. Bixby, V. Chvátal, and W. Cook. “On the Solution of Traveling Salesman
Problems.” Doc. Math. J. DMV, Extra ICM III, 1998, pp. 645–656.
Armstrong, R. D., and W. D. Cook. “Capital Budgeting Problems in Pavement Maintenance.”
International Journal of Urban Systems, 4, 1979, pp. 175–181.
Benders, J. F. “Partitioning Procedures for Solving Mixed Variables Programming Problems.”
Numerische Mathematik, 4, 1962, pp. 238–252.
Cameron, A. C., and P. K. Trivedi. Regression Analysis of Count Data. Econometric Society
Monographs No. 30, Cambridge University Press, Cambridge, United Kingdom, 1998.

Project 0-5534 September 2006 Report 0-5534-1
108
Chan, W. T., T. F. Fwa, and J. Y. Tan. “Optimal Fund-Allocation Analysis for Multidistrict
Highway Agencies.” Journal of Infrastructure Systems, Vol. 9, No. 4, 2003, pp. 167–175.
Charaibeh, N., C. Wilson, M. Darter, and G. Jones. “Development of a Bike Path Management
System for the University of Illinois at Urbana-Champaign.” Transportation Research
Record, No. 1636, 1998, pp. 56–63.
Clemen, R. T., and T. Reilly. Making Hard Decisions. Duxbury, Pacific Grove, California, 2001.
Colombrita, R., M. G. Augeri, A. L. Certo, S. Greco, B. Matarazzo, and G. Lagana. Development
of a Multi-Criteria Decision Support System for Budget Allocation in Highway
Maintenance Activities. Proceedings, Societa Italiana Infrastuctture Viarie, Piazza della
Calza, Oct. 27–29, 2004.
Conn, A. R., N. I. M. Gould, and Ph. L. Toint. LANCELOT: A FORTRAN Package for Large-
Scale Nonlinear Optimization (Release A). Springer-Verlag, Secaucus, NJ, 1992.
Consiglio, A., and S. A. Zenios. “Designing Portfolios of Financial Products via Integrated
Simulation and Optimization Models.” Operations Research, Vol. 47, No. 2, 1999,
pp. 195–208.
Cook, W. D. “Goal Programming and Financial Planning Models for Highway Rehabilitation.”
Journal of Operations Research Society, Vol. 35, No. 3, 1984, pp. 217–223.
Curtis, F. A., and G. S. Molnar. “A Municipal Infrastructure Management Systems Model.”
Canadian Journal of Civil Engineering, Vol. 24, 1997, pp. 1040–1049.
Dantzig, D. B., and P. Wolfe. “The Decomposition Principle for Linear Programs.” Operations
Research, 8, 1960, pp. 101-111.
Dash Optimization. Xpress. 2001. Data accessed at http://www.dashoptimization.com.
Davis, C. F., and P. Van Dine. “Linear Programming Model for Pavement Management.”
Transportation Research Record, No. 1200, 1988, pp. 71–75.
Dewan, S. A., and R. E. Smith. “Valuing Pavement Network Assets and Use of Values as
Decision Supports.” Journal of Infrastructure Systems, Vol. 11, No. 4, 2005, pp. 202–
210.
Dicdican, R. Y., Y. Y. Haimes, and J. H. Lambert. Risk-Based Asset Management Methodology
for Highway Infrastructure Systems. Publication VTRC 04-CR11, Virginia
Transportation Research Council, Charlottesville, Virginia, 2004.

Project 0-5534 September 2006 Report 0-5534-1
109
Dillon, R. L., M. E. Paté-Cornell, and S. D. Guikema. “Programmatic Risk Analysis for Critical
Engineering Systems under Tight Resource Constraints: Applying APRAM.” Operations
Research, Vol. 51, No. 3, 2003, pp. 354–370.
Dillon, R. L., M. E. Paté-Cornell, and S. D. Guikema. “Optimal Use of Budget Reserves to
Minimize Technical and Management Failure Risks during Complex Project
Development.” IEEE Transactions on Engineering Management, Vol. 52, No. 3, 2005,
pp. 382–395.
Feldman, R. M., and C. Valdez-Flores. Applied Probability and Stochastic Processes. PWS
Publishing Company, Saint Paul, Minnesota, 1996.
Feo, T. A., and M. G. C. Resende. “Greedy Randomized Adaptive Search Procedures.” Journal
of Global Optimization, 6, 1995, pp. 109–133.
Ferreira, A., A. Antunes, and L. Picado-Santos. “Probabilistic Segment-Linked Pavement
Management Optimization Model.” Journal of Transportation Engineering, Vol. 128,
No. 6, 2002, pp. 568–577.
FHWA. Asset Management Primer. FHWA-IF-00-010, U.S. Department of Transportation,
Federal Highway Administration, Office of Asset Management, Washington, D.C., 1999.
FHWA. “Asset Management Position Paper: White Paper.” U.S. Department of Transportation,
Federal Highway Administration, Office of Asset Management, Washington, D.C., 2004.
Data accessed at http://www.fhwa.dot.gov/infrastructure/asstmgmt/positionpaper.htm.
Floudas, C., and P. M. Pardalos (editors). Encyclopedia of Optimization (in six volumes). Kluwer
Academic Publishers, Norwell, MA, 2002.
Frohwein, H. I., and J. H. Lambert. “Risk of Extreme Events in Multiobjective Decision Trees:
Part 1: Severe Events.” Risk Analysis, Vol. 20, No. 1, 2000, pp. 113–123.
Frohwein, H. I., Y. Y. Haimes, and J. H. Lambert. “Risk of Extreme Events in Multiobjective
Decision Trees: Part 2: Rare Events.” Risk Analysis, Vol. 20, No. 1, 2000, pp. 125–134.
Gabriel, S. A., J. F. Ordónez, and J. A. Faria. “Contingency Planning in Project Selection Using
Multiobjective Optimization and Chance Constraints.” Journal of Infrastructure Systems,
Vol. 12, No. 2, 2006, pp. 112–120.
Gelman, A., J. B. Carlin, H. S. Stern, and D. B. Rubin. Bayesian Data Analysis. Chapman &
Hall, Boca Raton, Florida, 1995.
Project 0-5534 September 2006 Report 0-5534-1
110
Gharaibeh, N., Y. Chiu, and P. Gurian. “Decision Methodology for Allocating Funds across
Transportation Infrastructure Assets.” Journal of Infrastructure Systems, Vol. 12, No. 1,
2006, pp. 1–9.
Glover, F., and M. Laguna. Tabu Search. Kluwer Academic Publishers, Boston, MA, 1997.
Guikema, S. D. Multiple-Criteria Decision Analysis for Program Planning with Application to
the New Zealand Department of Conservation. Master’s of Engineering Thesis, Civil
Engineering, University of Canterbury, Christchurch, New Zealand, 1999.
Guikema, S. D. “A Comparison of Reliability Estimation Methods for Binary Systems.”
Reliability Engineering and System Safety, Vol. 87, No. 3, 2005, pp. 365–376.
Guikema, S. D. “Formulating Informative, Data-Based Priors for Failure Probability Estimation
in Reliability Analysis.” Reliability Engineering & System Safety, 2006 (in press, pre-
print available electronically at dx.doi.org/10.1016/j.ress.2006.01.002).
Guikema, S. D., and M. Milke. “Quantitative Decision Tools for Conservation Program
Planning: Practice, Theory, and Potential.” Environmental Conservation, Vol. 26, No. 3,
1999, pp. 179–189.
Guikema, S. D., and M. W. Milke. “Sensitivity Analysis for Multi-attribute Project Selection
Problems.” Civil Engineering and Environmental Systems, Vol. 20, No. 3, 2003, pp. 143–
162.
Guikema, S. D., and M. E. Paté-Cornell. “Bayesian Analysis for Launch Vehicle Reliability.”
Journal of Spacecraft and Rockets, Vol. 41, No. 1, 2004, pp. 93–102.
Guikema, S. D., and M. E. Paté-Cornell. “Probability of Infancy Problems for Space Launch
Vehicles.” Reliability Engineering and System Safety, Vol. 87, No. 3, 2005, pp. 303–314.
Guikema, S. D., R. A. Davidson, and H. Liu. “Statistical Models of the Effects of Tree Trimming
on Power System Outages.” IEEE Transactions on Power Delivery, Vol. 21, No. 3, 2006,
pp. 1549–1557.
Hagquist, R. F. Asset Management Texas Style. Technical Notes prepared for TxDOT
Project 0-5534, Texas Department of Transportation, Austin, Texas, May 2006.
Hegazy, T. “Optimization of Resource Allocation and Leveling Using Genetic Algorithm.”
Journal of Construction Engineering and Management, Vol. 125, No. 3, 1999, pp. 167–
175.

Project 0-5534 September 2006 Report 0-5534-1
111
Hegazy, T., and M. Kassab. “Resource Optimization Using combined Simulation and Genetic
Algorithms.” Journal of Construction Engineering and Management, Vol. 129, No. 6,
2003, pp. 698–705.
Holland, J. H. Adaption in Natural and Artificial Systems. University of Michigan Press, Ann
Arbor, MI., 1975.
Hopfield, J. J. “Neural Networks and Physical Systems with Emergent Collective Computational
Abilities.” Proceedings of the National Academy of Sciences, 79, 1982, pp. 2554–2558.
Howard, R. A. “Bayesian Decision Models for Systems Engineering.” IEEE Transactions on
Systems Science and Cybernetics, Vol. SSC-1, No. 1, 1965, pp. 36–41.
Howard, R. A. “Foundations of Decision Analysis.” IEEE Transactions on Systems Science and
Cybernetics, Vol. SSC4, No. 3, 1968, pp. 211–219.
Howard, R. A. “Options.” In Wise Choices: Decisions, Games, and Negotiations, R. Zeckhauser,
R. Keeney, and J. Sebenuis (editors), Harvard Business School Press, Cambridge,
Massachusetts, 1996, pp. 81-101.
Hsieh, T-Y., and H-L. Liu. “Multistage Heuristic Approach for Solving Infrastructure Investment
Decision Problems.” Journal of Infrastructure Systems, Vol. 3, No. 4, 1997, pp. 134–142.
Hudson, S. W., R. F. Carmichael, L. O. Moser, W. R. Hudson, and W. J. Wilkes. “Bridge
Management Systems.” NCHRP Report 300, Project 12-28(2), Transportation Research
Board, National Research Council, Washington, D.C., December 1987.
ILOG. ILOG CPLEX, 2001. Data Accessed at http://www.ilog.com/products/cplex.
Jaynes, E. T. “Information Theory and Statistical Mechanics.” In Statistical Physics, K. Ford
(editor), Benjamin, New York, 1963, pp. 181–218.
Katz, A. Principles of Statistical Mechanics: The Information Theory Approach. W. H. Freeman
and Company, San Francisco, 1967.
Keeney, R. L. Value-Focused Thinking: A Path to Creative Decision Making. Harvard
University Press, Cambridge, Massachusetts, 1992.
Keeney, R. L. “Modeling Values for Telecommunications Management.” IEEE Transactions on
Engineering Management, Vol. 48. No. 3, 2001, pp. 370–379.
Keeney, R. L., and H. Raiffa. Decisions with Multiple Objectives: Preferences and Value Trade-
Offs. Wiley, New York, 1976.
Khasnabis, S., J. Bartus, and R. D. Ellis. Optimal Resource Allocation for the Purchase of New
Buses and the Rebuilding of Existing Buses as a Part of a Transit Asset Management

Project 0-5534 September 2006 Report 0-5534-1
112
Strategy for State DOTs. Publication MRUTC 02-01, U.S. Department of Transportation,
Washington, D.C., 2003.
Kirkpatrick, S., C. D. Gellat Jr., and M. P. Vecchi. “Optimization by Simulated Annealing.”
Science, 220, 1983, pp. 671–680.
Lasdon, L. S. Optimization Theory for Large Systems. MacMillan, New York, NY,1970.
Lee, P. M. Bayesian Statistics: An Introduction, 3rd Edition. Hodder Arnold, London, 2004.
Massman, J., R. A. Freeze, L. Smith, T. Sperling, and B. James. “Hydrogeological Decision-
Analysis 2. Applications to Groundwater Contamination.” Ground Water, Vol. 29, No. 4,
1991, pp. 536–548.
Migdalas, A., P. M. Pardalos, and S. Storøy (editors). Parallel Computing in Optimization.
Kluwer Academic Publishers, Norwell, MA, 1997.
Morris, P. A., and S. S. Oren. “Multiattribute Decision Making by Sequential Resource
Allocation.” Operations Research, Vol. 28, No. 1, 1980, pp. 233–252.
Mulvey, J. M., R. J. Vanderbei, and S. A. Zenios. “Robust Optimization of Large-Scale
Systems.” Operations Research, Vol. 43, No. 2, 1995, pp. 264–281.
Murtagh, B. A., and M. A. Saunders. MINOS 5.0 User’s Guide. Technical Report 83-20R,
Systems Optimization Laboratory, Stanford University, Stanford, California, 1983.
Nemmers, C. “Transportation Asset Management.” Public Roads Magazine. Data accessed at
www.tfhrc.gov/pubrds/july97/tam.htm.
O’Banion, K. “Use of Value Functions in Environmental Decisions.” Environmental
Management, Vol. 4, 1980, pp. 3–6.
Obermann, B., J. Bittner, E. Wittwer, and J. Russell. Synthesis of National Efforts in
Transportation Asset Management. Midwestern Regional University Transportation
Center, University of Wisconsin, Madison, Wisconsin, 2002.
OECD. Asset Management for the Road Sector. Organization for Economic Co-Operation and
Development, Paris, 2001.
Pardalos, P. M., and M. G. C. Resende (editors). Handbook of Applied Optimization. Oxford
University Press, New York, NY, 2002.
Paté-Cornell, M. E., R. L. Dillon, and S. D. Guikema. “On the Limitations of Redundancies in
the Improvement of System Reliability.” Risk Analysis, Vol. 24, No. 6, 2004, pp. 1423–
1436.
Prekopa, A. Stochastic Programming. Kluwer Academic Publishers, Netherlands, 1995.

Project 0-5534 September 2006 Report 0-5534-1
113
Pressman, R. S. Software Engineering: A Practitioner’s Approach, 5th edition. McGraw-Hill,
Boston, 2001.
Rosen, J. B. “The Gradient Projection Method for Nonlinear Programming. Part I. Linear
Constraints.” J. Soc. Ind. Appl. Math., 8, 1960, pp. 181–217.
Rosen, J. B. “The Gradient Projection Method for Nonlinear Programming. Part II. Non-linear
Constraints.” J. Soc. Ind. Appl. Math., 9, 1961, pp. 514-532.
Sadek, A. W., A. Kvasnak, and J. Segale. “Integrated Infrastructure Management Systems: Small
Urban Area’s Experience.” Journal of Infrastructure Systems, Vol. 9, No. 3, 2003,
pp. 98–106.
Santos, C., X. Zhu, and H. Crowder. A Mathematical Optimization Approach for Resource
Allocation in Large Scale Data Centers. Research Report HPL-2002-64 (R.1), HP
Laboratories, Palo Alto, California, December 12, 2002.
http://www.hpl.hp.com/techreports/2002/HPL-2002-64R1.pdf.
Savage, L. J. The Foundations of Statistics, 2nd Ed. Dover, New York, 1972.
Seshadri, S., A. Khanna, F. Harche, and R. Wyle. “A Method for Strategic Asset-Liability
Management with an Application to the Federal Home Loan Bank of New York.”
Operations Research, Vol. 47, No. 3, 1999, pp. 345–360.
Shannon, C. E. “A Mathematical Theory of Communication.” Bell Systems Technology Journal,
Vol. 27, 1948, pp. 379–423, and 623–656.
Shore, J., and R. Johnson. “Axiomatic Derivation of the Principle of Maximum Entropy and the
Principle of Minimum Cross-Entropy.” IEEE Transactions on Information Theory,
Vol. 26, No. 1, 1980, pp. 26–37.
Siethoff, T., B. Kockelman, and K. Kockelman. “Property Values and Highway Expansions:
Timing, Size, Location, and Use Effects.” Transportation Research Record, No. 1812,
2002, pp. 191-200.
Smith, J. D. H. “Some Observations on the Concepts of Information Theoretic Entropy and
Randomness.” Entropy, Vol. 3, 2001, pp. 1–11.
Smith, J. E., and K. F. McCardle. “Options in the Real World: Lessons Learned in Evaluating
Oil and Gas Investments.” Operations Research, Jan./Feb. 1999, pp. 1–15.
Smith, J. E., and R. F. Nau. “Valuing Risky Projects: Option Pricing Theory and Decision
Analysis.” Management Science, Vol. 41, 1995, pp. 795–816.

Project 0-5534 September 2006 Report 0-5534-1
114
Smith, R. “Asset Management—Texas Style: Asset Management Concepts.” Presentation
prepared for the Texas Department of Transportation, Texas Transportation Institute, The
Texas A&M University System, College Station, Texas, 2005.
Tapiador, F. J., and J. L. Casanova. “An algorithm for the fusion of images based on Jaynes’
maximum entropy method,” International Journal of Remote Sensing, Vol. 23, No. 4,
2002, pp. 777–785.
Trigeorgis, L. Real Options. MIT Press, Cambridge, Massachusetts, 1997.
TTI. “Asset Management—Texas Style.” Proposal prepared for the Texas Department of
Transportation, Texas Transportation Institute, The Texas A&M University System,
College Station, Texas, 1995.
Turkiyyah, G. M., J. P. Mahoney, and D. Batchelor. Virtual Training Tools for Transportation
Infrastructure Construction. Technical Report, University of Washington, Seattle, WA,
2005.
TxDOT. “Project Selection Process.” Texas Department of Transportation, Austin, Texas, 2003a.
Data accessed at ftp://ftp.dot.state.tx.us/pub/txdot-info/tpp/txdotprojectselection.pdf.
TxDOT. “Project Development Process Manual.” Texas Department of Transportation, Austin,
Texas, 2003b.
Data Accessed at ftp://ftp.dot.state.tx.us/pub/txdot-info/gsd/manuals/pdp.pdf.
TxDOT. Statewide Preservation Program (SPP): Summary of Categories. Texas Department of
Transportation, Transportation Planning and Programming Division, Austin, Texas,
January 2005.
TxDOT. Unified Transportation Program: Statewide Mobility Program Plan. Texas Department
of Transportation, Austin, Texas, 2006a.
TxDOT. Statewide Transportation Improvement Program for Fiscal Years 2006–2008. Texas
Department of Transportation, Austin, Texas, 2006b.
TxDOT. Right of Way Manual, Volume 2: Right of Way Acquisition. Texas Department of
Transportation, Austin, Texas, 2006c.
TxDOT. 2006 Statewide Mobility Program (SMP). Texas Department of Transportation, Austin,
TX, 2006d.
Von Neumann, J., and O. Morgenstern. Theory of Games and Economic Behavior. Princeton
University Press, Princeton, New Jersey, 1947.
Project 0-5534 September 2006 Report 0-5534-1
115
Wang, K.C.P., C. Nunn, C. Mackey, W. Gong, D. Wilson, M. Evans, and J. Daleiden. Network
Level Crack Survey with the Automated Real-Time Distress Analyzer. Transportation
Research Board, TRB, Washington, DC, 2003.
Wenzler, I. “Development of an Asset Management Strategy for a Network Utility Company:
Lessons from a Dynamic Business Simulation Approach.” Simulation & Gaming,
Vol. 36, No. 1, 2005, pp. 75–90.
Worzel, K. J., C. Vassiadou-Seniou, and S. A. Zenois. “Integrated Simulation and Optimization
Models for Tracking of Fixed-Income Securities.” Operations Research, Vol. 42, No. 2,
1994, pp. 223–233.
Yoo, J. Multi-Period Optimization of Pavement Management Systems. Doctoral Dissertation,
Texas A&M University, College Station, Texas, 2004.
Zhao, T., S. K. Sundararajan, and C. Tseng. “Highway Development Decision-Making under
Uncertainty: A Real Options Approach.” Journal of Infrastructure Systems, Vol. 10,
No. 1, 2004, pp. 23–32.
