asset allocation, cost of investing and performance … · • unlisted real estate – the...
TRANSCRIPT

1 CEM Benchmarking Inc.
Alexander D. Beath, PhD and Chris Flynn, CFA CEM Benchmarking Inc. 372 Bay Street, Suite 1000 Toronto, ON, M5H 2W9 www.cembenchmarking.com
September 2018
ASSET ALLOCATION, COST OF INVESTING AND PERFORMANCE OF EUROPEAN DB PENSION FUNDS: THE IMPACT OF REAL ESTATE This paper examines the historical allocation, returns, risk, and cost of investing in real estate relative to other major asset classes for large European institutional investor portfolios spanning 2005-2016.

CEM Benchmarking Inc. 2
Table of Contents 1 Executive Summary ............................................................................................................................................... 3
The CEM database ..................................................................................................................................................... 3 Asset allocation .......................................................................................................................................................... 3 Lagged reporting of unlisted asset class returns ....................................................................................................... 4 Returns: Real estate vs. other asset classes .............................................................................................................. 4 Risk: Real estate vs. other asset classes .................................................................................................................... 4 Unbiased correlations between asset classes ........................................................................................................... 5 Listed and unlisted real estate in portfolios .............................................................................................................. 5
2 The CEM database ................................................................................................................................................ 6 CEM data used in this study ......................................................................................................................... 6 Assets under management .......................................................................................................................... 6 Total-fund returns as reported to CEM Benchmarking ................................................................................ 8 Asset class aggregation .............................................................................................................................. 10
2.4.1 Public equity .......................................................................................................................................... 10 2.4.2 Private equity ......................................................................................................................................... 11 2.4.3 Fixed income .......................................................................................................................................... 11 2.4.4 Hedge funds ........................................................................................................................................... 11 2.4.5 Listed real estate .................................................................................................................................... 12 2.4.6 Unlisted real estate ................................................................................................................................ 12 2.4.7 Unlisted infrastructure ........................................................................................................................... 12 2.4.8 Other ...................................................................................................................................................... 13
3 Asset allocation ................................................................................................................................................... 13 Allocations to primary asset classes: public equity and fixed income ....................................................... 15 Allocations to real estate ........................................................................................................................... 15 Allocation to alternate asset classes .......................................................................................................... 17
4 Aggregate asset class data: Biased and unbiased data sets ............................................................................... 17 Biased aggregate asset class performance statistics by region and by year .............................................. 17 Lag from private equity, unlisted real estate, and unlisted infrastructure ................................................ 21 Unbiased aggregate asset class performance statistics by region and by year ......................................... 23 Comparison between as-reported and standardized aggregate asset class data ...................................... 24
4.4.1 Average return comparisons: as-reported vs. standardized data ......................................................... 27 4.4.2 Volatility comparisons: as-reported vs. standardized data ................................................................... 27 4.4.3 Correlation comparisons: as-reported vs. standardized data................................................................ 28
5 Unbiased listed and unlisted real estate in institutional portfolios .................................................................... 28 Arithmetic average gross and net returns ................................................................................................. 31 Cost ............................................................................................................................................................ 32 Geometric average net returns, benchmark returns and net value added ............................................... 32 Risk ............................................................................................................................................................. 33 Sharpe ratios .............................................................................................................................................. 34 Leverage and liquidity premiums ............................................................................................................... 34 Correlations ................................................................................................................................................ 35 Benchmarks ................................................................................................................................................ 36
6 Listed and unlisted real estate performance relative to total fund performance .............................................. 40 7 Concluding statement ......................................................................................................................................... 41 8 About CEM Benchmarking .................................................................................................................................. 41 9 Citations .............................................................................................................................................................. 41 Appendix A: Standardizing illiquid asset returns ......................................................................................................... 41 Appendix B: Currency conversion ................................................................................................................................ 44
3 CEM Benchmarking Inc.
Asset allocation, cost of investing and performance of European DB pension funds: The impact of listed real estate
Alexander D. Beath1, PhD and Chris Flynn, CFA CEM Benchmarking Inc. 372 Bay Street, Suite 1000, Toronto, ON, M5H 2W9 www.cembenchmarking.com
1 Executive Summary
Real estate is a significant element in the portfolios of large European institutional investors, with allocations making up as much as 10 percent of the average portfolio. The purported benefits of the inclusion of real estate in institutional investor portfolios are well known; the asset class should provide diversity to the traditional equity/fixed income blends which continue to provide the backbone of nearly all portfolios. Where real estate is one diversifying element, hedge funds, private equity, and infrastructure are also advertised as being able to provide diversity to portfolios. How has real estate performed relative to other asset classes?
CEM Benchmarking is in a unique position to provide insight into the historical record on investment allocations, returns and risk of large European institutional investors. With a robust set of large European funds that spans 12 years – a full investment cycle – real estate performance can be compared to other asset classes across different periods on an apples-to-apples basis.
The CEM database
• Over €2 trillion of 2016 assets under management (AUM) included in this study, representing approximately 36 percent of European pension assets.
• 12-years of data span 2005-2016 represents a full investment cycle.
• Three region samples include Dutch funds, U.K. funds, and other Euro area funds.
• Eight aggregate asset classes are included: public equity, private equity, fixed income, hedge funds, listed real estate, unlisted real estate, unlisted infrastructure, and “other”.
Asset allocation
• Public equity and fixed income – Public equity and fixed income are the major components of European institutional investor portfolios. The
1 To contact the authors please send correspondence to: [email protected]
Exhibit 1. CEM Benchmarking Quick Facts
1000+ Unique funds
20+ Countries
25+ Years of data
$10 trillion+ assets in (USD)
250+ asset class/implementation styles

CEM Benchmarking Inc. 4
combined average allocation to the two traditional aggregate asset classes is over 85 percent for Dutch funds, nearly 90 percent for other Euro area funds, and over 80 percent for other Euro area funds.
• Listed and unlisted real estate – Real estate is the primary diversifier in European institutional investor portfolios. Dutch funds allocate 8 percent to real estate on average, split 25/75 between listed and unlisted real estate. U.K and Other Euro area funds allocate just over 5 percent to real estate on average, nearly all of it unlisted.
• Trends – Dutch funds are de-risking, reducing allocations to equities and real estate while increasing allocations to fixed income. U.K. funds are doing the opposite, increasing allocation to equity and real estate while lowering allocation to fixed income. Other Euro area funds are comparatively stable.
Lagged reporting of unlisted asset class returns
• Asset class returns for private equity, unlisted real estate, and unlisted infrastructure as recorded by funds are not comparable to listed asset class returns. The reason is lagged reporting.
• For all three asset classes, the average lag is nearly one calendar year.
• However, wide variation exists, and funds either report data relatively early (i.e., one to two quarters out of date) or relatively late (i.e., one year plus one to two quarters out of date).
• Because of the dispersion in reporting lag, average annual returns from unlisted asset classes appear significantly smoothed (i.e., less volatile than they are). Smoothed returns from unlisted asset classes is purely mathematical artifact, and not something a fund can achieve.
Returns: Real estate vs. other asset classes
• Gross of investment costs, private equity was the best performing asset class, but also the most expensive with investment costs of 452 basis points (Dutch funds), 382 basis points (other Euro area funds), and 415 basis points (U.K. funds). Net of investment costs, private equity returns remained the highest of all asset classes (with one exception).
• Listed real estate – the arithmetic average net return for Dutch funds (2005-2016) was the second highest at 9.32 percent, comparable to private equity at 10.78 percent. For other Euro area funds over the shorter sample period 2008-2016 it was considerably lower at 5.59 percent compared to 11.55 percent for private equity. For U.K. funds where only 2010-2016 data is available for all asset classes, listed real estate had the highest net return of 10.93 percent, nearly equal to public and private equity at 10.76 and 10.86 respectively.
• Unlisted real estate – the arithmetic average net return for Dutch funds (2005-2016) was tied for the second lowest at 2.89 percent, identical to hedge funds. For other Euro area funds (2008-2016) unlisted real estate returns were third highest at 7.41 percent, higher than for listed real estate. For U.K. funds (2010-2016) unlisted real estate was half listed real estate, 5.77 percent versus 10.93 percent respectively.
• Direct comparisons between listed and unlisted real estate in each region group / sample period did not show evidence of a liquidity premium for unlisted real estate.
Risk: Real estate vs. other asset classes
• Before standardizing returns of unlisted asset classes for lagged reporting, the most volatile asset classes are public equity and listed real estate. However, this conclusion rests on accepting smoothed returns of unlisted asset classes which, as stated, is a mathematical / accounting artifact of lagged reporting of performance data.
• After standardizing returns of unlisted asset classes, the two most volatile asset classes are private equity and unlisted real estate.
• Smoothing reduces unlisted real estate volatilities by more than 100 percent for Dutch funds, and by 70 percent for other Euro area and U.K. funds.
• For the longest sample period where listed and unlisted real estate appear (Dutch funds, 2005-2016), listed and unlisted real estate have comparable annualized volatilities (22.85 percent and 23.55 percent

5 CEM Benchmarking Inc.
respectively). In other region / time samples, unlisted real estate is more volatile than listed real estate, largely due to the asset class having more idiosyncratic risk.
• Sharpe ratios for all asset classes are consistent across Dutch and other Euro area funds with the exception of hedge funds (data has not converged) and unlisted infrastructure (insufficient data). Relative order is (from highest Sharpe ratio to lowest): 1. Fixed income, 2. private equity, 3/4. public equity/listed real estate (a statistical tie), 5. unlisted real estate, 6. “other”.
Unbiased correlations between asset classes
• After standardizing returns of unlisted asset classes for lagged reporting, listed and unlisted real estate are seen to be highly correlated to each other for Dutch funds (correlation of 88 percent), but less so for other Euro area funds (correlation of 58 percent), and not at all U.K. funds (correlation of negative 9 percent). The low correlation for other Euro area funds likely reflects differences in listed and unlisted real estate portfolio construction. By contrast, for U.K. funds the low correlation likely results from shared management of listed and unlisted real estate portfolios, resulting in lagged reporting of listed real estate returns as well.
• Unlisted real estate is however highly correlated to listed real estate proxies in all regions, with average correlations of 85 percent (Dutch funds), 84 percent (other Euro area funds), and 92 percent U.K. funds. Similarly, high correlation is observed for private equity as well. In this respect, listed real estate is an excellent proxy for unlisted real estate, and public equity an excellent proxy for private equity.
• Real estate (listed and unlisted) is less correlated than equity (public and private) and hedge funds to other asset classes but is more correlated to other asset classes that fixed income.
Listed and unlisted real estate in portfolios
• The primary effect of unlisted real estate and other unlisted assets on total fund returns is to artificially supress volatility. By standardizing unlisted asset class returns, we estimate that the volatility of total fund returns is suppressed by anywhere from seven percent (other Euro Area funds) to 16 percent (Dutch funds).

CEM Benchmarking Inc. 6
2 The CEM database
CEM Benchmarking has been collecting portfolio data from a global set of large institutional asset managers since 1992. The database includes statistics such as holdings, policy weights, returns, and benchmarks for nearly 100 asset classes2 and for four plus investment styles3. CEM Benchmarking also collects detailed investment costs – both internal and external investment costs – which provide the primary motivation for funds to participate in the CEM Benchmarking service. Consequently, since performance is not the motivation for working with CEM Benchmarking, the database is free of performance bias [1].
The database has grown in both size and geographical diversity over time. Starting with participation from 164 Defined Benefit (DB) funds from the U.S. and Canada in 1992, the database now has Global coverage and includes over 500 unique funds from over 20 countries. Participants include DB funds, Defined Contribution (DC) funds, sovereign wealth funds, social safety net and pension buffer funds, and other institutional asset managers.
Growth in the complexity of the information included in the database has mirrored the growth in investment complexity at institutional money managers – for example, data on hedge funds has only been collected since 2000 since prior to that year virtually no institutional manager invested in this asset class whereas nearly half of all funds do today. Exhibit 1 summarizes a few interesting facts regarding the database.
CEM data used in this study
Of the 20+ countries that provide data to CEM Benchmarking, only the subset of European funds is relevant towards understanding how European funds have invested in real estate. And while an even sampling across all of Europe would be ideal for this study, differences in culture and regulation of pension systems across countries motivate participation with CEM by some more than others.
Traditionally, funds from the Netherlands (abbreviated here as “Dutch funds”) have seen the greatest participation with CEM, with funds from the United Kingdom (abbreviated here as “U.K. funds”) seeing increasing participation. Other European countries that benchmark with CEM and are included in this study are funds from Denmark, Finland, the Republic of Ireland, Norway, Sweden, Switzerland and France (abbreviated here as “other Euro area funds”). And while not all funds included in this study are traditional DB pension funds, nearly all manage DB pension assets related to a DB pension liability; for the funds included for 2016, 92 percent are DB pension funds, 4 percent are buffer funds for DB pension systems, 3 percent are asset managers for DB pensions, and 1 percent are sovereign wealth funds.
Assets under management
Statistical details regarding asset under management (AUM) and fund counts by region are provided in Table 1. We have chosen to break the sample into three European subsets corresponding to Dutch funds, U.K. funds, and other Euro area funds as described above. AUM for Dutch funds are provided in Euro (€), while AUM for U.K. funds are provided in Sterling (£). For other Euro Area funds, AUM data not provided in Euro (e.g., SEK) have been converted into Euro using OECD purchasing power of parity conversion to minimize AUM volatility caused by exchange rate volatility. The total AUM of the funds included in this study at the end 2016 is €2.5 trillion, which represents 36 percent of the total AUM of the top 1000 funds in Europe [2].
2 Asset class examples include: large cap. U.S. stock, EAFE fixed income, hedge funds, LBO private equity, unlisted real estate etc. 3 Investment styles for public market assets include: internal active, internal passive, external active, and external passive. Investment styles for private markets include: internal direct, operating subsidiary, co-investment, LP and external direct and fund of funds. Not all investment styles are applicable to all asset classes.
7 CEM Benchmarking Inc.
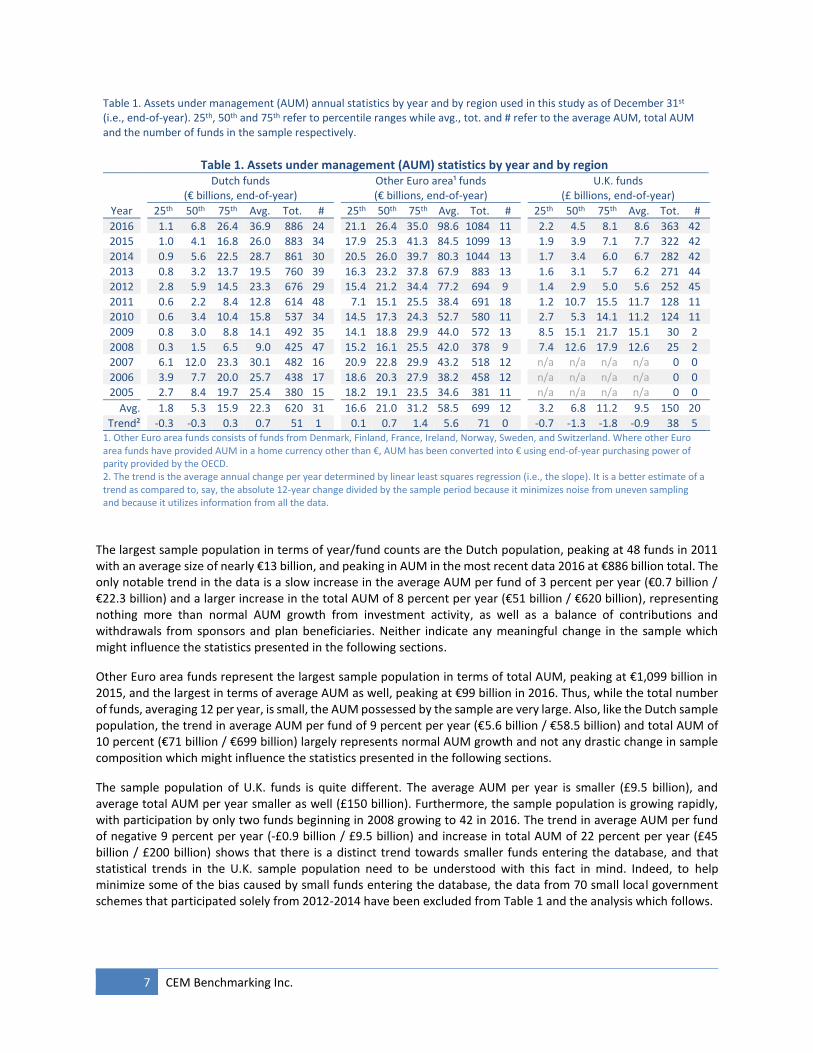
The largest sample population in terms of year/fund counts are the Dutch population, peaking at 48 funds in 2011 with an average size of nearly €13 billion, and peaking in AUM in the most recent data 2016 at €886 billion total. The only notable trend in the data is a slow increase in the average AUM per fund of 3 percent per year (€0.7 billion / €22.3 billion) and a larger increase in the total AUM of 8 percent per year (€51 billion / €620 billion), representing nothing more than normal AUM growth from investment activity, as well as a balance of contributions and withdrawals from sponsors and plan beneficiaries. Neither indicate any meaningful change in the sample which might influence the statistics presented in the following sections.
Other Euro area funds represent the largest sample population in terms of total AUM, peaking at €1,099 billion in 2015, and the largest in terms of average AUM as well, peaking at €99 billion in 2016. Thus, while the total number of funds, averaging 12 per year, is small, the AUM possessed by the sample are very large. Also, like the Dutch sample population, the trend in average AUM per fund of 9 percent per year (€5.6 billion / €58.5 billion) and total AUM of 10 percent (€71 billion / €699 billion) largely represents normal AUM growth and not any drastic change in sample composition which might influence the statistics presented in the following sections.
The sample population of U.K. funds is quite different. The average AUM per year is smaller (£9.5 billion), and average total AUM per year smaller as well (£150 billion). Furthermore, the sample population is growing rapidly, with participation by only two funds beginning in 2008 growing to 42 in 2016. The trend in average AUM per fund of negative 9 percent per year (-£0.9 billion / £9.5 billion) and increase in total AUM of 22 percent per year (£45 billion / £200 billion) shows that there is a distinct trend towards smaller funds entering the database, and that statistical trends in the U.K. sample population need to be understood with this fact in mind. Indeed, to help minimize some of the bias caused by small funds entering the database, the data from 70 small local government schemes that participated solely from 2012-2014 have been excluded from Table 1 and the analysis which follows.
Table 1. Assets under management (AUM) annual statistics by year and by region used in this study as of December 31st (i.e., end-of-year). 25th, 50th and 75th refer to percentile ranges while avg., tot. and # refer to the average AUM, total AUM and the number of funds in the sample respectively.
Table 1. Assets under management (AUM) statistics by year and by region
Dutch funds
(€ billions, end-of-year)
Other Euro area¹ funds (€ billions, end-of-year)
U.K. funds
(£ billions, end-of-year)
Year 25th 50th 75th Avg. Tot. # 25th 50th 75th Avg. Tot. # 25th 50th 75th Avg. Tot. #
2016 1.1 6.8 26.4 36.9 886 24 21.1 26.4 35.0 98.6 1084 11 2.2 4.5 8.1 8.6 363 42
2015 1.0 4.1 16.8 26.0 883 34 17.9 25.3 41.3 84.5 1099 13 1.9 3.9 7.1 7.7 322 42
2014 0.9 5.6 22.5 28.7 861 30 20.5 26.0 39.7 80.3 1044 13 1.7 3.4 6.0 6.7 282 42
2013 0.8 3.2 13.7 19.5 760 39 16.3 23.2 37.8 67.9 883 13 1.6 3.1 5.7 6.2 271 44
2012 2.8 5.9 14.5 23.3 676 29 15.4 21.2 34.4 77.2 694 9 1.4 2.9 5.0 5.6 252 45
2011 0.6 2.2 8.4 12.8 614 48 7.1 15.1 25.5 38.4 691 18 1.2 10.7 15.5 11.7 128 11
2010 0.6 3.4 10.4 15.8 537 34 14.5 17.3 24.3 52.7 580 11 2.7 5.3 14.1 11.2 124 11
2009 0.8 3.0 8.8 14.1 492 35 14.1 18.8 29.9 44.0 572 13 8.5 15.1 21.7 15.1 30 2
2008 0.3 1.5 6.5 9.0 425 47 15.2 16.1 25.5 42.0 378 9 7.4 12.6 17.9 12.6 25 2
2007 6.1 12.0 23.3 30.1 482 16 20.9 22.8 29.9 43.2 518 12 n/a n/a n/a n/a 0 0
2006 3.9 7.7 20.0 25.7 438 17 18.6 20.3 27.9 38.2 458 12 n/a n/a n/a n/a 0 0
2005 2.7 8.4 19.7 25.4 380 15 18.2 19.1 23.5 34.6 381 11 n/a n/a n/a n/a 0 0
Avg. 1.8 5.3 15.9 22.3 620 31 16.6 21.0 31.2 58.5 699 12 3.2 6.8 11.2 9.5 150 20
Trend² -0.3 -0.3 0.3 0.7 51 1 0.1 0.7 1.4 5.6 71 0 -0.7 -1.3 -1.8 -0.9 38 5 1. Other Euro area funds consists of funds from Denmark, Finland, France, Ireland, Norway, Sweden, and Switzerland. Where other Euro area funds have provided AUM in a home currency other than €, AUM has been converted into € using end-of-year purchasing power of parity provided by the OECD. 2. The trend is the average annual change per year determined by linear least squares regression (i.e., the slope). It is a better estimate of a trend as compared to, say, the absolute 12-year change divided by the sample period because it minimizes noise from uneven sampling and because it utilizes information from all the data.
CEM Benchmarking Inc. 8
Total-fund returns as reported to CEM Benchmarking
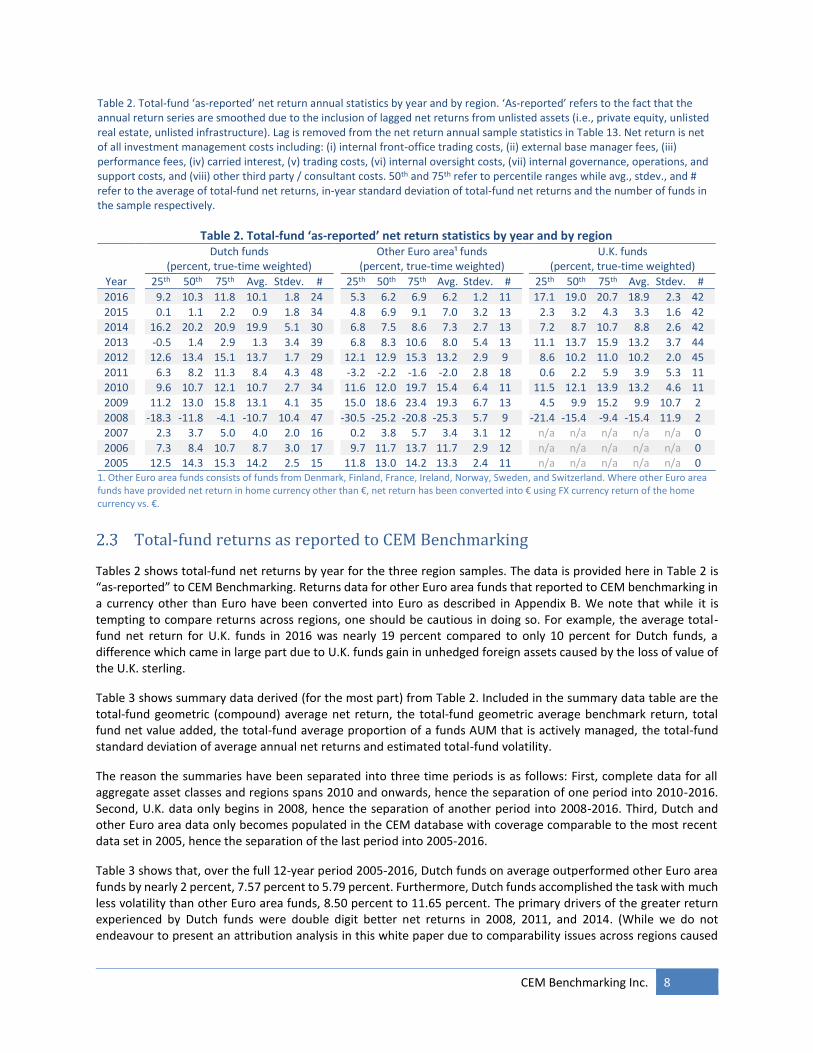
Tables 2 shows total-fund net returns by year for the three region samples. The data is provided here in Table 2 is “as-reported” to CEM Benchmarking. Returns data for other Euro area funds that reported to CEM benchmarking in a currency other than Euro have been converted into Euro as described in Appendix B. We note that while it is tempting to compare returns across regions, one should be cautious in doing so. For example, the average total-fund net return for U.K. funds in 2016 was nearly 19 percent compared to only 10 percent for Dutch funds, a difference which came in large part due to U.K. funds gain in unhedged foreign assets caused by the loss of value of the U.K. sterling.
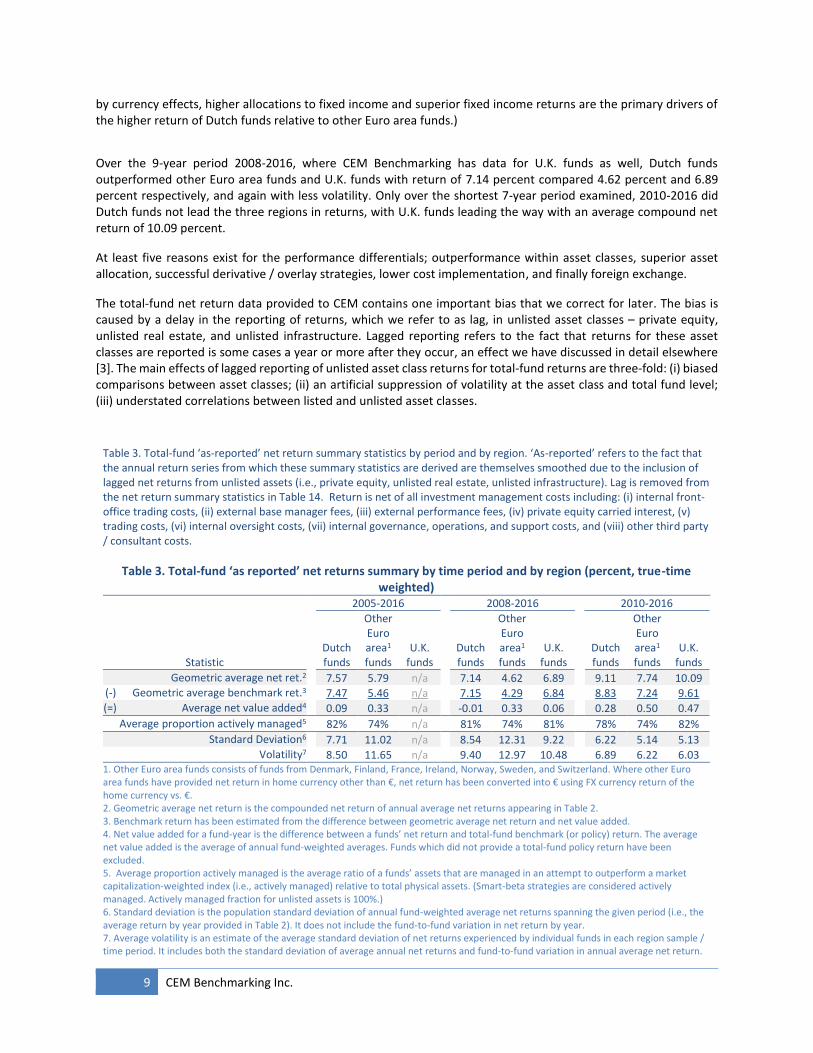
Table 3 shows summary data derived (for the most part) from Table 2. Included in the summary data table are the total-fund geometric (compound) average net return, the total-fund geometric average benchmark return, total fund net value added, the total-fund average proportion of a funds AUM that is actively managed, the total-fund standard deviation of average annual net returns and estimated total-fund volatility.
The reason the summaries have been separated into three time periods is as follows: First, complete data for all aggregate asset classes and regions spans 2010 and onwards, hence the separation of one period into 2010-2016. Second, U.K. data only begins in 2008, hence the separation of another period into 2008-2016. Third, Dutch and other Euro area data only becomes populated in the CEM database with coverage comparable to the most recent data set in 2005, hence the separation of the last period into 2005-2016.
Table 3 shows that, over the full 12-year period 2005-2016, Dutch funds on average outperformed other Euro area funds by nearly 2 percent, 7.57 percent to 5.79 percent. Furthermore, Dutch funds accomplished the task with much less volatility than other Euro area funds, 8.50 percent to 11.65 percent. The primary drivers of the greater return experienced by Dutch funds were double digit better net returns in 2008, 2011, and 2014. (While we do not endeavour to present an attribution analysis in this white paper due to comparability issues across regions caused
Table 2. Total-fund ‘as-reported’ net return annual statistics by year and by region. ‘As-reported’ refers to the fact that the annual return series are smoothed due to the inclusion of lagged net returns from unlisted assets (i.e., private equity, unlisted real estate, unlisted infrastructure). Lag is removed from the net return annual sample statistics in Table 13. Net return is net of all investment management costs including: (i) internal front-office trading costs, (ii) external base manager fees, (iii) performance fees, (iv) carried interest, (v) trading costs, (vi) internal oversight costs, (vii) internal governance, operations, and support costs, and (viii) other third party / consultant costs. 50th and 75th refer to percentile ranges while avg., stdev., and # refer to the average of total-fund net returns, in-year standard deviation of total-fund net returns and the number of funds in the sample respectively.
Table 2. Total-fund ‘as-reported’ net return statistics by year and by region
Dutch funds
(percent, true-time weighted)
Other Euro area¹ funds (percent, true-time weighted)
U.K. funds
(percent, true-time weighted)
Year 25th 50th 75th Avg. Stdev. # 25th 50th 75th Avg. Stdev. # 25th 50th 75th Avg. Stdev. #
2016 9.2 10.3 11.8 10.1 1.8 24 5.3 6.2 6.9 6.2 1.2 11 17.1 19.0 20.7 18.9 2.3 42
2015 0.1 1.1 2.2 0.9 1.8 34 4.8 6.9 9.1 7.0 3.2 13 2.3 3.2 4.3 3.3 1.6 42
2014 16.2 20.2 20.9 19.9 5.1 30 6.8 7.5 8.6 7.3 2.7 13 7.2 8.7 10.7 8.8 2.6 42
2013 -0.5 1.4 2.9 1.3 3.4 39 6.8 8.3 10.6 8.0 5.4 13 11.1 13.7 15.9 13.2 3.7 44
2012 12.6 13.4 15.1 13.7 1.7 29 12.1 12.9 15.3 13.2 2.9 9 8.6 10.2 11.0 10.2 2.0 45
2011 6.3 8.2 11.3 8.4 4.3 48 -3.2 -2.2 -1.6 -2.0 2.8 18 0.6 2.2 5.9 3.9 5.3 11
2010 9.6 10.7 12.1 10.7 2.7 34 11.6 12.0 19.7 15.4 6.4 11 11.5 12.1 13.9 13.2 4.6 11
2009 11.2 13.0 15.8 13.1 4.1 35 15.0 18.6 23.4 19.3 6.7 13 4.5 9.9 15.2 9.9 10.7 2
2008 -18.3 -11.8 -4.1 -10.7 10.4 47 -30.5 -25.2 -20.8 -25.3 5.7 9 -21.4 -15.4 -9.4 -15.4 11.9 2
2007 2.3 3.7 5.0 4.0 2.0 16 0.2 3.8 5.7 3.4 3.1 12 n/a n/a n/a n/a n/a 0
2006 7.3 8.4 10.7 8.7 3.0 17 9.7 11.7 13.7 11.7 2.9 12 n/a n/a n/a n/a n/a 0
2005 12.5 14.3 15.3 14.2 2.5 15 11.8 13.0 14.2 13.3 2.4 11 n/a n/a n/a n/a n/a 0 1. Other Euro area funds consists of funds from Denmark, Finland, France, Ireland, Norway, Sweden, and Switzerland. Where other Euro area funds have provided net return in home currency other than €, net return has been converted into € using FX currency return of the home currency vs. €.
9 CEM Benchmarking Inc.
by currency effects, higher allocations to fixed income and superior fixed income returns are the primary drivers of the higher return of Dutch funds relative to other Euro area funds.)
Over the 9-year period 2008-2016, where CEM Benchmarking has data for U.K. funds as well, Dutch funds outperformed other Euro area funds and U.K. funds with return of 7.14 percent compared 4.62 percent and 6.89 percent respectively, and again with less volatility. Only over the shortest 7-year period examined, 2010-2016 did Dutch funds not lead the three regions in returns, with U.K. funds leading the way with an average compound net return of 10.09 percent.
At least five reasons exist for the performance differentials; outperformance within asset classes, superior asset allocation, successful derivative / overlay strategies, lower cost implementation, and finally foreign exchange.
The total-fund net return data provided to CEM contains one important bias that we correct for later. The bias is caused by a delay in the reporting of returns, which we refer to as lag, in unlisted asset classes – private equity, unlisted real estate, and unlisted infrastructure. Lagged reporting refers to the fact that returns for these asset classes are reported is some cases a year or more after they occur, an effect we have discussed in detail elsewhere [3]. The main effects of lagged reporting of unlisted asset class returns for total-fund returns are three-fold: (i) biased comparisons between asset classes; (ii) an artificial suppression of volatility at the asset class and total fund level; (iii) understated correlations between listed and unlisted asset classes.
Table 3. Total-fund ‘as-reported’ net return summary statistics by period and by region. ‘As-reported’ refers to the fact that the annual return series from which these summary statistics are derived are themselves smoothed due to the inclusion of lagged net returns from unlisted assets (i.e., private equity, unlisted real estate, unlisted infrastructure). Lag is removed from the net return summary statistics in Table 14. Return is net of all investment management costs including: (i) internal front-office trading costs, (ii) external base manager fees, (iii) external performance fees, (iv) private equity carried interest, (v) trading costs, (vi) internal oversight costs, (vii) internal governance, operations, and support costs, and (viii) other third party / consultant costs.
Table 3. Total-fund ‘as reported’ net returns summary by time period and by region (percent, true-time weighted)
2005-2016 2008-2016 2010-2016
Statistic
Dutch funds
Other Euro area1 funds
U.K. funds
Dutch funds
Other Euro area1 funds
U.K. funds
Dutch funds
Other Euro area1 funds
U.K. funds
Geometric average net ret.2 7.57 5.79 n/a 7.14 4.62 6.89 9.11 7.74 10.09 (-) Geometric average benchmark ret.3 7.47 5.46 n/a 7.15 4.29 6.84 8.83 7.24 9.61 (=) Average net value added4 0.09 0.33 n/a -0.01 0.33 0.06 0.28 0.50 0.47
Average proportion actively managed5 82% 74% n/a 81% 74% 81% 78% 74% 82%
Standard Deviation6 7.71 11.02 n/a 8.54 12.31 9.22 6.22 5.14 5.13 Volatility7 8.50 11.65 n/a 9.40 12.97 10.48 6.89 6.22 6.03
1. Other Euro area funds consists of funds from Denmark, Finland, France, Ireland, Norway, Sweden, and Switzerland. Where other Euro area funds have provided net return in home currency other than €, net return has been converted into € using FX currency return of the home currency vs. €. 2. Geometric average net return is the compounded net return of annual average net returns appearing in Table 2. 3. Benchmark return has been estimated from the difference between geometric average net return and net value added. 4. Net value added for a fund-year is the difference between a funds’ net return and total-fund benchmark (or policy) return. The average net value added is the average of annual fund-weighted averages. Funds which did not provide a total-fund policy return have been excluded. 5. Average proportion actively managed is the average ratio of a funds’ assets that are managed in an attempt to outperform a market capitalization-weighted index (i.e., actively managed) relative to total physical assets. (Smart-beta strategies are considered actively managed. Actively managed fraction for unlisted assets is 100%.) 6. Standard deviation is the population standard deviation of annual fund-weighted average net returns spanning the given period (i.e., the average return by year provided in Table 2). It does not include the fund-to-fund variation in net return by year. 7. Average volatility is an estimate of the average standard deviation of net returns experienced by individual funds in each region sample / time period. It includes both the standard deviation of average annual net returns and fund-to-fund variation in annual average net return.

CEM Benchmarking Inc. 10
Asset class aggregation
Of the 250+ asset class / implementation style combinations within the CEM database, data presented here has been aggregated into a manageable eight aggregate asset classes. In doing so, we have first aggregated all asset classes by implementation style. The major effect of this aggregation is to make the investment costs presented later a blend of low-cost implementation (i.e., internal passive, external passive, internal active) and high-cost implementation (i.e., external active).
The eight aggregate asset classes are:
1. public equity, 2. private equity, 3. fixed income, 4. hedge funds, 5. listed real estate, 6. unlisted real estate, 7. unlisted infrastructure, 8. other.
Total holdings by aggregate asset class for each region by year appear in Table 4. Detailed statistics and discussion of allocation to each of the aggregate asset classes for each region by year appear in Section 3. Discussion of the comparability between listed and unlisted aggregate asset classes are provided in Section 4. Comparisons of listed and unlisted real estate aggregate asset class performance, risk, and correlations to other aggregate asset classes across regions time periods are provided in 5. Here in Section 2 we offer instead simple, high-level descriptions of the aggregate asset classes used in this study.
2.4.1 Public equity
Public equity (i.e., stock) data is provided to CEM Benchmarking in several different regional asset classes (e.g., U.S., Canada, European, EAFE4, etc.), on occasion by market capitalization weight (i.e., large, mid, and small cap), and separated into four difference investment management styles: internal active (i.e., stock managed at a fund by an internal investment team with the aim of beating a market cap weighted index), internal passive (i.e., stock managed at a fund by an internal investment team with the aim of replicating a market cap weighted index), external active (i.e., stock managed outside the fund by an external investment team with the aim of replicating a market cap weighted index), and external passive (i.e., stock managed outside of the fund by an external investment team with the aim of replicating a market cap weighted index). The separation by investment management style is motivated by differences in investment cost which are critical for investment cost benchmarking.
The aggregation of all public equity into one asset class is motivated by our prior studies which demonstrated that, over long-time horizons, large cap, small cap, and foreign stock behave similarly enough that presenting them separately is not warranted (i.e., the differences within public equity are far smaller than the differences between aggregate public equity and other asset classes). For example, the correlations between subsets of public equity on an annual basis are of the order of 90 percent, and so little information is lost with this aggregation. (See appendix A of Reference [3].)
Public equity allocation for Dutch funds is distributed among the following CEM public equity asset classes: 27 percent global5, 26 percent European, 22 percent U.S. and 15 percent emerging markets with the remainder spread across other public equity asset classes. For other Euro area funds the public equity distribution is: 36 percent European, 29 percent global and 14 percent U.S. with the remainder spread across other public equity asset classes. For U.K. funds the public equity distribution is: 30 percent U.K., 37 percent global, 10 percent U.S., 8 percent EAFE
4 The category EAFE comprise developed nations in Europe, Asia and the Far East. 5 Global equity is typically benchmarked by a global index composed of approximately 50 percent U.S. equity.

11 CEM Benchmarking Inc.
and 7 percent Asia-Pacific with the remainder spread across other public equity asset classes. We note that since CEM benchmarking does not have a Dutch equity asset class, it is not possible to aggregate data consistently among the three geographic groups as “domestic” and “foreign”. Euro / non-Euro is equally problematic since EAFE make up a sizable portion of public equity assets.
2.4.2 Private equity
Private equity data is provided to CEM Benchmarking in four asset classes: leveraged buy out (LBO), venture capital (VC), diversified, and other. Each type is further subdivided into internal (i.e., private equity managed within a fund by an internal investment team), limited partnership (i.e., private equity managed in a limited partnership structure), fund-of-fund (funds of limited partnership private equity investments), and co-investment (co-investing alongside an existing general partner within an existing limited partnership). The breakdown by investment style is motivated by differences in cost structure relevant to investment cost benchmarking. There is no regional segregation of the data, and no passive investment implementation style.
Most of the private equity date provided to CEM Benchmarking by clients is diversified private equity, and so the data is provided in aggregate form already. Diversified private equity allocation as a fraction of all private equity is 83 percent for Dutch funds, 67 percent for other Euro area funds, and 90 percent for U.K. funds.
2.4.3 Fixed income
Fixed income data is provided to CEM Benchmarking in several different regional asset classes (e.g., U.S., Canada, European, EAFE, etc.), on occasion by debt type (e.g., government bonds, corporate bonds, high yield, etc.), and separated into four difference investment management styles: internal active (i.e., fixed income managed at a fund by an internal investment team with the aim of beating a benchmark index), internal passive (i.e., fixed income managed at a fund by an internal investment team with the aim of replicating a benchmark index), external active (i.e., fixed income managed outside the fund by an external investment team with the aim of beating a benchmark index), and external passive (i.e., fixed income managed outside of the fund by an external investment team with the aim of replicating a benchmark index). The separation by investment management style is motivated by differences in investment cost which are critical for investment cost benchmarking.
The fixed income aggregate asset class is, in comparison to other asset classes, the most diverse. In it we aggregate the following CEM fixed income asset classes: U.S., EAFE, Euro, U.K., Asia Pacific, emerging, global, inflation indexed, high yield, mortgages, private debt, cash, and “other”. For each of the three European regions included in this study, only a fraction of these asset classes is ever populated, and those that are populated are not common among the three regions (except for the global fixed income asset class which is an aggregate asset class itself akin to the fixed income aggregation used in this study). Because of this, disaggregation is not warranted since there is little use having more fixed income asset classes that cannot be directly compared across regions.
Fixed income allocation for Dutch funds is distributed among the following CEM fixed income asset classes: 52 percent Euro, 16 percent global, and approximately 5 percent each for emerging, inflation indexed, high yield, mortgages and cash with the remainder spread across other fixed income asset classes. For other Euro area funds the fixed income distribution is: 38 percent Euro, 27 percent global, and approximately 10 percent to “other” and cash with the remainder spread across other public equity asset classes. For U.K. funds the fixed income distribution is: 32 percent U.K., 31 percent global, 15 percent inflation indexed, and 16 percent cash with the remainder spread across other fixed income asset classes.
2.4.4 Hedge funds
Hedge fund data is provided to CEM Benchmarking either as external direct hedge fund investments or as external fund-of-fund investments. Disaggregation by hedge fund style or region is not provided, and there is no passive investment implementation style.
CEM Benchmarking Inc. 12
In addition to external direct and fund-of-fund hedge funds in the hedge fund aggregate asset class we further include funded tactical asset allocation (TAA) investments. This aggregation of TAA with hedge funds is typical of CEM studies and is motivated by the of high degree of correlation between TAA returns and hedge fund returns.
TAA portfolios, however, display greater volatility than hedge funds. However, TAA contribution to the aggregate hedge funds asset class volatility is minimal because TAA makes up only a small fraction of each funds contribution to the hedge funds aggregate asset class. For example, for Dutch funds TAA allocations represent only 16 percent of the total aggregate hedge funds allocation, while for other Euro area funds and U.K. funds the allocations to TAA represent 14 percent of the total aggregate hedge funds allocation.
2.4.5 Listed real estate
The listed real estate aggregate asset class is comprised of publicly traded real estate companies and listed equity real estate investment trusts (REITs). Assets reported to CEM Benchmarking as listed real estate are typically listed real estate investments managed as a portfolio separate from public equity. Thus, many funds do not report separately all listed real estate holdings since listed real estate managed within public equity portfolios are reported to CEM as public equity holdings. From an analysis of public equity benchmark descriptions provided to CEM Benchmarking in 2016, we estimate public equity holdings to contain 3.5 percent listed real estate in the Dutch sample, 5.5 percent in the other Euro area sample, and 3 percent in the U.K. sample.
The listed real estate aggregate asset class aggregates together the following types of listed real estate: internal active, internal passive, external active, and external passive. The separation into the four categories based on investment style is motivated by the differences in investment cost. There is no separation of the data by region or property sector.
2.4.6 Unlisted real estate
Unlisted real estate asset data is provided to CEM Benchmarking either as: internal (i.e., unlisted real estate managed within a fund by an internal investment team), external direct (i.e., perpetual core real estate with investment decisions made by an external manager), limited partnership (i.e., private equity real estate managed in a limited partnership structure – typically opportunistic or value add real estate), fund-of-fund (a fund of LP real estate investments), co-investment (co-investing alongside an existing general partner within an existing limited partnership), or wholly owned operating subsidiary (real estate portfolio companies owned wholly by the fund). The breakdown by investment style is motivated by differences in cost structure relevant to investment cost benchmarking. There is no regional or property type separation of the data, and no passive investment implementation style. As such, all unlisted real estate data has been aggregated into a single asset class.
Unlisted real estate allocation for Dutch funds is distributed among the following CEM unlisted real estate asset classes: 57 percent direct, 18 percent LP, 13 percent internal, and 11 percent fund of fund. For other Euro area funds the unlisted real estate distribution (by contrast) is: 42 percent internal, 26 percent operating subsidiary, 21 percent LP, 7 percent direct and 4 percent fund of fund. For U.K. funds the unlisted real estate distribution (again by contrast) is: 45 percent direct, 32 percent fund of fund, 17 percent internal and 7 percent LP. Clearly, larger funds representative of the other Euro area region sample had more internal and operating subsidiary unlisted real estate whereas smaller funds representative of the U.K. region sample use more fund-of-fund unlisted real estate.
2.4.7 Unlisted infrastructure
Unlisted infrastructure asset data is provided to CEM Benchmarking either as: internal (i.e., unlisted infrastructure managed within a fund by an internal investment team), external direct (i.e., perpetual core infrastructure with investment decisions made by an external manager), limited partnership (i.e., private equity infrastructure managed in a limited partnership structure – typically opportunistic or value add real estate), fund-of-fund (a fund of LP real estate investments), or co-investment (co-investing alongside an existing general partner within an existing limited partnership). The breakdown by investment style is motivated by differences in cost structure relevant to investment

13 CEM Benchmarking Inc.
cost benchmarking. There is no regional or property type separation of the data, and no passive investment implementation style. As such, all infrastructure data has been aggregated into a single asset class.
Unlisted infrastructure allocation for Dutch funds is distributed among the following CEM unlisted infrastructure asset classes: 49 percent direct, 26 percent LP, 19 percent fund of fund, and 6 percent internal. For other Euro area funds the unlisted infrastructure distribution (by contrast) is: 79 percent LP, 13 percent direct, and 7 percent internal. For U.K. funds the unlisted infrastructure distribution (again by contrast) is: 60 percent LP, 32 percent direct, 4 percent fund of fund, and 4 percent internal. Unlike unlisted real estate, internal management of unlisted infrastructure has been historically low for even the large funds in the other Euro area sample. However, internal management of unlisted infrastructure for these funds is growing rapidly, making up nearly 30 percent of all allocation in 2016.
2.4.8 Other
The catchall “other” contains two well defined but relatively unpopulated asset classes, commodities and natural resources, as well as the true CEM catchall “other real assets”. The latter contains hard-to- benchmark assets such as art which typically lack: (i) cap weighted indices required to benchmark returns, and (ii) comparable peer data to benchmark investment costs, hence the exclusion from other well-defined asset classes.
Other allocation for Dutch funds is distributed among the following CEM other asset classes: 81 percent commodities, 17 percent “other real assets”, and 2 percent natural resources. For other Euro area funds the distribution is: 46 percent commodities, 35 percent natural resources, and 19 percent “other real assets”. For U.K. funds the distribution is 51 percent commodities, 26 percent natural resources, and 23 percent “other real assets”. Due to the relatively low allocation to the aggregate other, the year-to-year allocation to each of the parts – commodities, timberland, and other real assets – tends to be highly variable.
3 Asset allocation
Table 5A shows the average asset allocation6 for each of the eight aggregate asset classes by year and by sample region. Included in the data are summary statistics covering the full sample period 2005-2016 (2008-2016 for the U.K. region only). Summary statistics include: (i) the average of the annual fund-weighted averages over the sample period which allows for a comparison of how funds within and across regions have allocated their AUM to each asset class (ii) the trend in the annual averages which indicates at an absolute level whether allocations are increasing, decreasing, or remaining constant, and (iii) the trend in the annual averages divided by the average of the annual averages which indicates at a relative level whether allocations are increasing, decreasing, or remaining constant.
Table 5B shows the standard deviation of asset allocation for each of the eight aggregate asset classes by year and by Euro area region. Like in Table 5A, we have included in the data are summary statistics covering the full sample period 2005-2016 (2008-2016 for the U.K. region only). Summary statistics include: (i) the average standard deviation over the sample period which allows for a comparison of the diversity of the allocations of funds AUM to each asset class (ii) the trend in the standard deviation which indicates at an absolute level whether diversity in allocations are increasing, decreasing, or remaining constant, and (iii) the trend divided by the average which indicates at a relative level whether diversity of allocations are increasing, decreasing, or remaining constant.
6 The asset allocation for a specific aggregate asset class/fund/year is the years total average holdings for that specific asset class divided by the sum of the average holdings of all eight aggregate asset classes. The average asset allocation for a specific aggregate asset class/region/year is the fund-weighted average over all funds in that specific year/region. Note that: (i) average holdings are used instead of end-of-year holdings, and (ii) net asset value of derivatives and overlays are excluded.

CEM Benchmarking Inc. 14
Tab
le 4
. Th
e to
tal a
ggre
gate
ass
et
clas
s A
UM
by
year
an
d b
y re
gio
n. T
ota
l agg
rega
te a
sset
cla
ss A
UM
rep
rese
nt
the
aver
age
ove
r ea
ch y
ear,
an
d n
ot
year
-en
d. A
s su
ch, t
he
tota
l AU
M im
plie
d b
y su
mm
ing
the
dis
pla
yed
agg
rega
te a
sse
t cl
ass
AU
M o
ver
aggr
egat
es
by
year
an
d b
y re
gio
n d
iffe
rs s
ligh
tly
fro
m t
hat
pro
vid
ed
in T
able
1.
Tab
le 4
. AU
M b
y ag
gre
gate
ass
et
clas
s, b
y ye
ar a
nd
by
regi
on
Du
tch
fu
nd
s (€
bill
ion
s, in
-yea
r av
erag
e)
O
ther
Eu
ro a
rea¹
fu
nd
s (€
bill
ion
s, in
-yea
r av
erag
e)
U
.K. f
un
ds
(£ b
illio
ns,
in-y
ear
aver
age)
Year
Pu
blic
eq
uit
y P
riva
te
equ
ity
Fixe
d
inco
me
Hed
ge
fun
ds
List
ed
real
es
tate
Un
- lis
ted
re
al
esta
te
Un
- lis
ted
in
fra.
O
ther
P
ub
lic
equ
ity
Pri
vate
eq
uit
y Fi
xed
in
com
e H
edge
fu
nd
s
List
ed
real
es
tate
Un
- lis
ted
re
al
esta
te
Un
- lis
ted
in
fra.
O
ther
P
ub
lic
equ
ity
Pri
vate
eq
uit
y Fi
xed
in
com
e H
edge
fu
nd
s
List
ed
real
es
tate
Un
- lis
ted
re
al
esta
te
Un
- lis
ted
in
fra.
O
ther
20
16
2
62
.6
36
.9
38
4.9
2
3.2
3
8.8
4
3.8
1
6.1
2
8.0
56
5.6
1
1.1
3
79
.1
17
.5
0.6
4
1.7
2
.5
2.2
16
0.9
2
2.3
9
5.4
1
4.6
0
.5
25
.7
10
.3
1.9
20
15
2
85
.7
36
.0
39
1.9
2
8.6
3
9.8
4
6.1
1
4.7
2
8.2
61
5.2
1
0.8
4
10
.9
14
.8
0.5
4
2.6
1
.9
2.0
14
0.3
1
8.9
9
7.6
1
3.4
0
.3
23
.5
8.3
1
.7
20
14
2
58
.9
33
.3
35
5.9
2
7.4
3
1.1
4
0.3
1
1.0
2
7.2
53
3.2
1
1.3
3
79
.4
14
.1
0.6
3
2.5
1
.7
2.4
13
5.6
1
6.6
6
9.4
1
4.6
0
.2
20
.8
5.9
1
.9
20
13
2
28
.2
32
.8
34
0.3
2
7.5
2
9.3
4
1.3
1
0.4
2
9.7
46
6.8
8
.5
32
4.3
8
.1
0.1
2
2.9
0
.9
2.4
12
6.3
1
6.6
7
0.7
1
4.2
0
.2
19
.9
4.4
2
.2
20
12
1
89
.2
29
.6
28
2.6
2
5.5
2
5.0
3
8.6
9
.1
26
.3
3
60
.2
4.6
2
66
.7
2.0
0
.1
11
.6
0.3
0
.9
1
17
.7
15
.7
67
.5
12
.7
0.2
1
8.6
3
.8
2.2
20
11
1
76
.5
27
.8
26
8.3
2
3.7
2
3.2
3
3.6
7
.3
22
.6
3
38
.1
10
.3
28
4.3
7
.8
0.7
2
1.1
0
.2
1.6
53
.9
8.4
4
2.0
8
.8
0.0
1
0.7
1
.8
1.4
20
10
1
59
.3
23
.4
23
7.2
2
6.4
2
1.5
2
9.4
5
.3
18
.9
2
95
.1
4.4
2
21
.7
1.7
0
.3
9.0
0
.1
1.1
58
.6
8.1
2
8.7
7
.2
0.1
1
0.7
1
.5
1.6
20
09
1
35
.2
17
.4
23
0.5
2
2.4
1
6.9
2
9.5
4
.7
15
.5
2
37
.6
6.0
2
25
.8
5.5
0
.3
15
.0
0.3
1
.7
1
8.0
1
.5
5.0
0
.4
0.0
1
.7
0.7
0
.1
20
08
1
50
.8
17
.3
24
2.6
2
2.6
1
9.5
3
3.6
4
.2
11
.0
2
04
.6
2.6
1
95
.3
1.1
0
.0
7.2
0
.1
0.4
18
.4
1.7
5
.9
0.3
0
.0
1.8
0
.8
0.1
20
07
1
84
.4
15
.3
19
1.1
1
5.3
2
2.8
2
9.8
1
.4
10
.3
2
26
.8
3.6
2
40
.4
4.1
0
.6
12
.7
0.0
0
.4
n
/a
n/a
n
/a
n/a
n
/a
n/a
n
/a
n/a
20
06
1
67
.9
13
.0
16
8.8
8
.2
24
.1
22
.9
0.0
1
1.8
19
2.3
2
.7
20
9.5
2
.4
0.2
1
0.9
0
.0
0.3
n/a
n
/a
n/a
n
/a
n/a
n
/a
n/a
n
/a
20
05
1
36
.1
10
.7
15
1.8
4
.1
19
.2
19
.8
0.0
9
.3
1
50
.1
1.4
1
73
.7
0.9
0
.0
8.9
0
.0
0.2
n/a
n
/a
n/a
n
/a
n/a
n
/a
n/a
n
/a
Ave
rage
1
94
.6
24
.5
27
0.5
2
1.2
2
5.9
3
4.1
7
.0
19
.9
3
48
.8
6.4
2
75
.9
6.7
0
.3
19
.7
0.7
1
.3
9
2.2
1
2.2
5
3.6
9
.6
0.2
1
4.8
4
.2
1.5
Tren
d2
12
.4
2.6
2
2.4
1
.8
1.7
2
.2
1.5
2
.1
4
2.8
0
.9
20
.5
1.4
0
.0
3.0
0
.2
0.2
19
.4
2.7
1
2.4
1
.9
0.1
3
.2
1.2
0
.2
Tren
d/a
vg.
0
.1
0.1
0
.1
0.1
0
.1
0.1
0
.2
0.1
0.1
0
.1
0.1
0
.2
0.1
0
.2
0.3
0
.2
0
.2
0.2
0
.2
0.2
0
.3
0.2
0
.3
0.1
1. O
ther
Eu
ro a
rea
fun
ds
con
sist
s o
f fu
nd
s fr
om
Den
mar
k, F
inla
nd
, Fra
nce
, Ire
lan
d, N
orw
ay, S
wed
en, a
nd
Sw
itze
rlan
d. W
her
e o
ther
Eu
ro a
rea
fun
ds
hav
e p
rovi
ded
net
re
turn
in h
om
e cu
rren
cy
oth
er t
han
€, n
et r
etu
rn h
as b
een
co
nve
rted
into
€ u
sin
g FX
cu
rren
cy r
etu
rn o
f th
e h
om
e cu
rren
cy v
s. €
. 2
. Th
e tr
end
is t
he
aver
age
ann
ual
ch
ange
per
yea
r d
ete
rmin
ed b
y lin
ear
leas
t sq
uar
es r
egre
ssio
n (
i.e.,
th
e sl
op
e).
It is
a b
ett
er e
stim
ate
of
a tr
end
as
com
par
ed t
o, s
ay, t
he
abso
lute
12
-yea
r ch
ange
div
ided
by
the
sam
ple
per
iod
bec
ause
it m
inim
izes
no
ise
fro
m u
nev
en s
amp
ling
and
bec
ause
it u
tiliz
es in
form
atio
n f
rom
all
the
dat
a.

15 CEM Benchmarking Inc.
Allocations to primary asset classes: public equity and fixed income
As shown in Table 5A, Dutch funds distinguish themselves by having the largest allocation to fixed income, averaging over 54 percent over the sample period, followed by public equity at 32 percent. Allocations to fixed income have been increasing by +1.6 percent per year while allocations to public equity have been decreasing by -1.3 percent per year, nearly offsetting.
Other Euro area funds by contrast have more equitable allocations to public equity and fixed income, averaging 45 and 44 percent respectively. Both allocations are decreasing, but more so for public equity which is decreasing at three times the rate, -0.9 percent per year vs. -0.3 percent per year respectively.
U.K. funds by contrast has much more equity exposure at 50 percent and much less fixed income exposure at 32 percent. Furthermore, U.K. funds are trending towards more equity, +3.0 percent per year, and less fixed income, -3.7 percent per year. However, this trend is probably overstated since smaller U.K. funds have higher representation in the database in more recent years, and smaller funds tilt more towards high equity / low fixed income allocations.
The difference here between Dutch and U.K. funds are consistent with relative funded status of the constituent funds7. Dutch funds are notable in their high funded status, with funding ratios typically in excess of 100%. U.K. funds on the other hand are notable for their pension deficits, with funding ratios typically below 100%. The higher funded status of Dutch pension funds allows for de-risking – moving assets from higher return/higher risk assets like public equity and moving it into lower return/lower risk assets like fixed income. U.K. funds on the other hand require higher assumed rates of return to preserve their already low funded status, and thus add risk in order to achieve this greater expected or required rate of return.
Allocations to real estate
Listed real estate allocations for Dutch funds averages 1.9 percent, notably larger than for other Euro area funds, 0.2 percent, and for U.K. funds, 0.3 percent. Actual allocations to listed real estate will be somewhat higher because the allocations provided to CEM Benchmarking represent dedicated listed real estate investments only (i.e., investments in listed real estate via public equity mandates are excluded).
Listed real estate allocations are decreasing by -0.1 percent per year for Dutch funds in absolute terms, and by -7.9 percent per year in relative terms. Over the full sample period this translates into an almost halving of the allocation to unlisted real estate, from 3.1 percent to 1.7 percent. As will be shown in Section 5. this is particularly curious given that listed real estate was one of the best performing asset classes over the full sample period, and the best performing asset class over the latter half of the sample period.
By contrast, for other Euro area funds and U.K. funds listed real estate allocations are increasing. In absolute terms the allocation to listed real estate for other Euro area does not appear to be increasing at all, but that is only because
7 Funded ratio of a defined benefit pension plans is the ratio of its pension liability to its assets. The pension liability is measured
through an actuarial calculation that makes assumptions about salary escalation rates, inflation rates, and longevity, and expressed in present value through a discount rate (typically tied to an assumed rate of return). For Dutch funds the discount rate is famously modest (around 3.3 percent at the end of 2016) whereas in the U.K. discount rates have historically been much higher, although they are trending downwards. Funding ratios in excess of 100 percent indicate good health of a pension system since assets exist to pay pension promises whereas funded ratios below 100 percent indicate poor health. Information on Dutch funded status at the end of 2016 is available at: www.aon.com/netherlands/persberichten/2017/dekkingsgraad-pensioenfondsen-onveranderd-in-2016.jsp Information on the funded status of U.K. funds at the end of 2016 is available at: http://www.thepensionsregulator.gov.uk/docs/scheme-funding-2016.pdf

CEM Benchmarking Inc. 16
Tab
les
5A
an
d 5
B. A
ggre
gate
ass
et
clas
s al
loca
tio
n a
vera
ge (
A)
and
sta
nd
ard
dev
iati
on
(B
) b
y ye
ar a
nd
by
regi
on
. Ass
et a
lloca
tio
n p
er y
ear
is t
he
fun
d w
eigh
ted
ave
rage
.
Tab
le 5
A.
Ass
et
allo
cati
on
by
aggr
ega
te a
sse
t cl
ass,
by
year
an
d b
y re
gio
n –
ave
rage
Du
tch
fu
nd
s (p
erce
nt
of
tota
l)
O
ther
Eu
ro a
rea¹
fu
nd
s (p
erce
nt
of
tota
l)
U
.K. f
un
ds
(per
cen
t o
f to
tal)
Year
Pu
blic
eq
uit
y P
riva
te
equ
ity
Fixe
d
inco
me
Hed
ge
fun
ds
List
ed
real
es
tate
Un
- lis
ted
re
al
esta
te
Un
- lis
ted
in
fra.
O
ther
P
ub
lic
equ
ity
Pri
vate
eq
uit
y Fi
xed
in
com
e H
edge
fu
nd
s
List
ed
real
es
tate
Un
- lis
ted
re
al
esta
te
Un
- lis
ted
in
fra.
O
ther
P
ub
lic
equ
ity
Pri
vate
eq
uit
y Fi
xed
in
com
e H
edge
fu
nd
s
List
ed
real
es
tate
Un
- lis
ted
re
al
esta
te
Un
- lis
ted
in
fra.
O
ther
20
16
2
7.4
2
.3
61
.3
1.1
1
.7
4.1
1
.1
1.1
39
.9
3.7
4
0.8
6
.8
0.3
6
.5
1.0
0
.9
5
5.5
5
.1
24
.3
4.6
0
.5
7.1
2
.4
0.5
2
01
5
29
.4
2.0
5
8.4
1
.5
1.6
4
.6
1.0
1
.4
4
2.1
3
.3
43
.6
3.6
0
.2
6.0
0
.6
0.5
54
.5
5.3
2
5.1
4
.6
0.5
7
.4
2.2
0
.5
20
14
2
7.7
1
.9
60
.8
1.7
1
.1
4.7
0
.8
1.3
42
.5
3.3
4
2.6
3
.8
0.2
6
.1
0.6
0
.9
5
8.8
4
.9
22
.2
4.8
0
.4
7.0
1
.4
0.5
2
01
3
28
.5
2.0
5
8.2
1
.6
1.2
5
.5
0.7
2
.3
4
4.8
3
.6
42
.1
2.4
0
.1
5.6
0
.3
1.1
58
.6
5.1
2
2.7
4
.7
0.3
7
.0
1.2
0
.5
20
12
3
0.0
2
.6
53
.8
2.0
1
.2
7.1
0
.7
2.6
46
.9
4.0
4
1.2
1
.3
0.1
5
.3
0.2
0
.8
5
8.1
5
.0
23
.8
4.5
0
.3
6.7
1
.0
0.6
2
01
1
26
.6
1.8
6
0.8
1
.9
1.3
5
.0
0.6
2
.1
3
9.1
3
.9
46
.1
2.4
0
.3
7.6
0
.1
0.5
40
.9
4.9
3
9.1
7
.2
0.2
6
.0
1.2
0
.5
20
10
3
0.1
2
.4
54
.0
2.2
2
.3
6.1
0
.4
2.5
45
.6
2.8
4
5.6
0
.9
0.2
4
.3
0.1
0
.6
4
9.4
5
.2
31
.0
4.3
0
.1
8.6
0
.6
0.7
2
00
9
28
.8
2.0
5
5.5
2
.1
1.5
7
.4
0.5
2
.1
4
0.2
2
.6
49
.0
2.0
0
.2
5.2
0
.1
0.6
35
.1
3.0
5
1.2
5
.1
0.0
3
.9
1.4
0
.3
20
08
2
6.1
1
.5
57
.3
2.5
2
.0
8.5
0
.4
1.9
49
.9
1.5
4
3.9
0
.8
0.0
3
.4
0.1
0
.3
3
4.2
3
.1
51
.6
5.3
0
.0
4.0
1
.5
0.2
2
00
7
43
.0
1.8
4
1.6
2
.5
2.2
7
.2
0.1
1
.7
5
0.5
1
.4
42
.1
1.5
0
.3
4.1
0
.0
0.2
n/a
n
/a
n/a
n
/a
n/a
n
/a
n/a
n
/a
20
06
4
3.4
1
.8
42
.3
1.7
3
.1
6.4
0
.0
1.3
50
.9
1.1
4
2.8
0
.9
0.1
3
.9
0.0
0
.1
n
/a
n/a
n
/a
n/a
n
/a
n/a
n
/a
n/a
2
00
5
41
.1
1.6
4
5.5
1
.2
3.1
6
.4
0.0
1
.1
4
9.7
0
.6
45
.6
0.4
0
.0
3.6
0
.0
0.1
n/a
n
/a
n/a
n
/a
n/a
n
/a
n/a
n
/a
Ave
rage
3
1.8
2
.0
54
.1
1.8
1
.9
6.1
0
.5
1.8
45
.2
2.7
4
3.8
2
.2
0.2
5
.1
0.3
0
.6
4
9.5
4
.6
32
.3
5.0
0
.3
6.4
1
.4
0.5
Tr
end
2
-1.3
0
.1
1.6
0
.0
-0.1
-0
.3
0.1
0
.0
-0
.9
0.3
-0
.3
0.4
0
.0
0.3
0
.1
0.1
3.0
0
.2
-3.7
-0
.1
0.1
0
.3
0.1
0
.0
Tren
d/a
vg
-4.1
2
.7
3.0
-2
.3
-7.9
-4
.4
19
.0
0.0
-2.0
1
0.8
-0
.6
18
.7
8.3
5
.4
29
.1
14
.0
6
.1
5.3
-1
1.4
-2
.0
25
.9
5.3
8
.5
4.0
Tab
le 5
B. A
sse
t a
lloca
tio
n b
y ag
gre
gate
ass
et
clas
s, b
y ye
ar a
nd
by
regi
on
– s
tan
dar
d d
evia
tio
n
D
utc
h f
un
ds
(per
cen
t o
f to
tal)
Oth
er E
uro
are
a¹ f
un
ds
(per
cen
t o
f to
tal)
U.K
. fu
nd
s (p
erce
nt
of
tota
l)
Year
P
ub
lic
equ
ity
Pri
vate
eq
uit
y Fi
xed
in
com
e H
edge
fu
nd
s
List
ed
real
es
tate
Un
- lis
ted
re
al
esta
te
Un
- lis
ted
in
fra.
O
ther
P
ub
lic
equ
ity
Pri
vate
eq
uit
y Fi
xed
in
com
e H
edge
fu
nd
s
List
ed
real
es
tate
Un
- lis
ted
re
al
esta
te
Un
- lis
ted
in
fra.
O
ther
P
ub
lic
equ
ity
Pri
vate
eq
uit
y Fi
xed
in
com
e H
edge
fu
nd
s
List
ed
real
es
tate
Un
- lis
ted
re
al
esta
te
Un
- lis
ted
in
fra.
O
ther
20
16
9
.0
2.5
1
4.2
1
.9
2.3
3
.8
1.4
1
.7
1
4.8
2
.6
9.5
8
.2
0.6
3
.5
1.0
1
.7
1
9.7
4
.0
15
.8
6.5
2
.0
3.0
2
.5
1.1
2
01
5
8.5
2
.4
13
.0
2.7
2
.0
3.1
1
.2
1.9
11
.1
2.3
1
0.6
4
.7
0.5
3
.0
0.8
1
.0
1
9.4
4
.7
17
.3
5.7
2
.0
3.1
2
.6
1.0
2
01
4
8.6
2
.5
13
.9
2.4
1
.9
3.4
1
.1
1.9
11
.5
2.3
9
.8
4.4
0
.4
3.3
0
.6
1.3
15
.1
4.1
9
.6
5.4
1
.6
2.5
1
.9
0.9
2
01
3
10
.9
2.5
1
5.3
2
.0
1.9
3
.5
0.8
2
.2
1
1.0
3
.4
10
.5
3.2
0
.2
3.5
0
.5
1.7
14
.8
4.1
1
0.0
5
.2
1.5
2
.6
1.7
1
.0
20
12
8
.8
3.0
1
2.3
2
.3
2.1
3
.9
1.0
2
.4
9
.5
4.1
1
0.8
1
.4
0.3
3
.2
0.4
1
.5
1
5.7
4
.1
14
.4
5.2
1
.5
2.8
1
.5
1.1
2
01
1
10
.4
2.8
1
3.8
2
.0
2.2
4
.0
0.9
1
.9
1
3.5
2
.8
10
.8
3.5
0
.7
5.2
0
.2
1.0
15
.3
3.6
1
9.9
6
.1
0.7
4
.2
1.9
0
.9
20
10
9
.0
3.2
1
2.1
2
.7
3.5
4
.4
0.6
2
.1
1
3.3
2
.1
11
.6
0.9
0
.5
3.7
0
.2
0.8
18
.2
5.2
2
3.6
3
.3
0.4
7
.0
1.3
1
.1
20
09
8
.8
2.6
1
3.1
2
.4
2.0
4
.9
0.9
1
.7
1
4.9
1
.9
10
.8
3.0
0
.4
4.8
0
.3
1.0
35
.1
3.0
3
8.1
4
.3
0.0
2
.6
1.4
0
.3
20
08
9
.4
2.2
1
2.2
3
.0
3.2
7
.5
0.8
1
.7
1
0.8
1
.5
9.9
1
.0
0.1
3
.2
0.2
0
.5
3
4.2
3
.1
36
.8
4.9
0
.0
2.6
1
.5
0.2
2
00
7
8.8
2
.1
9.0
3
.0
2.7
4
.9
0.1
2
.2
1
1.0
1
.3
9.2
3
.0
0.8
3
.7
0.1
0
.4
n
/a
n/a
n
/a
n/a
n
/a
n/a
n
/a
n/a
2
00
6
7.7
2
.6
7.8
1
.4
2.8
5
.6
0.0
2
.0
1
2.5
1
.3
10
.7
1.9
0
.3
3.7
0
.1
0.3
n/a
n
/a
n/a
n
/a
n/a
n
/a
n/a
n
/a
20
05
8
.7
1.9
1
0.5
1
.7
3.1
6
.3
0.0
1
.7
1
5.4
0
.8
12
.7
0.8
0
.0
4.0
0
.0
0.2
n/a
n
/a
n/a
n
/a
n/a
n
/a
n/a
n
/a
Ave
rage
9
.0
2.5
1
2.3
2
.3
2.5
4
.6
0.7
2
.0
1
2.4
2
.2
10
.6
3.0
0
.4
3.7
0
.4
1.0
20
.8
4.0
2
0.6
5
.2
1.1
3
.4
1.8
0
.9
Tren
d2
0.1
0
.0
0.5
0
.0
-0.1
-0
.3
0.1
0
.0
-0
.1
0.2
-0
.1
0.4
0
.0
-0.1
0
.1
0.1
-1.9
0
.1
-3.1
0
.2
0.3
-0
.1
0.1
0
.1
Tren
d/a
vg
0.7
1
.3
3.9
0
.4
-4.1
-6
.3
16
.1
0.3
-0.9
8
.2
-1.0
1
4.6
5
.7
-1.6
2
2.1
1
3.3
-9.0
2
.8
-15
.0
4.6
2
6.7
-3
.7
7.5
1
0.3
1. O
ther
Eu
ro a
rea
fun
ds
con
sist
s o
f fu
nd
s fr
om
Den
mar
k, F
inla
nd
, Fra
nce
, Ire
lan
d, N
orw
ay, S
wed
en, a
nd
Sw
itze
rlan
d.
2. T
he
tren
d is
th
e av
erag
e an
nu
al c
han
ge p
er y
ear
det
erm
ined
by
linea
r le
ast
squ
ares
reg
ress
ion
(i.e
., t
he
slo
pe
). It
is a
be
tter
est
imat
e o
f a
tren
d a
s co
mp
ared
to
, say
, th
e ab
solu
te 1
2-y
ear
chan
ge d
ivid
ed b
y th
e sa
mp
le p
erio
d b
ecau
se it
min
imiz
es n
ois
e fr
om
un
even
sam
plin
g an
d b
ecau
se it
uti
lizes
info
rmat
ion
fro
m a
ll th
e d
ata.

17 CEM Benchmarking Inc.
the average allocation is small to begin with. In relative terms, listed real estate is increasing by +8.3 percent per year. In the U.K. listed real estate allocations are increasing as well. In absolute terms the allocation is increasing by +0.1 percent per year, while in relative terms it is increasing by a staggering +25.9 percent per year.
Unlisted real estate allocation for the three regions averages 6.1 percent, 5.1 percent, and 6.4 percent for Dutch, other Euro area, and U.K. funds respectively. Compared to listed real estate allocations, Dutch funds allocate more than 3x the AUM to unlisted real estate than to listed real estate. For other Euro area funds and U.K. funds the ratio is much larger at 30x and 25x. Interestingly, the situation is opposite that of private (i.e., unlisted) equity relative to public (i.e., listed) equity where the ratios are less than 0.1x.
The trend in unlisted real estate allocations mirrors that of listed real estate. Dutch funds are decreasing their allocation by -0.3 percent per year in absolute terms, and -4.4 percent per year in relative terms whereas both other Euro area funds and U.K. funds are increasing their allocation. In both cases the increase is relatively modest at +0.3 percent per year in absolute terms, and +5.3 and +5.4 percent per year in relative terms.
Allocation to alternate asset classes
Allocations to private equity, hedge funds and infrastructure tend to be modest for European pension funds in comparison to U.S. funds [3]. For Dutch funds and other Euro area funds, the average allocation to private equity and hedge funds are 2.0 and 2.7 percent, and the average allocation to infrastructure 0.5 and 0.3 percent respectively. In the U.K., the average allocation to each is aggregate asset class is approximately double, 4.6 percent, 5.0 percent, and 1.4 percent.
For all three alternate asset classes and all three regions, allocations to alternate asset classes is increasing with variable rapidity with two notable exceptions; hedge fund allocations for Dutch funds and U.K funds is declining moderately. In both cases the observed decline is likely the result of increased small fund participation rather than any general trend towards lower hedge fund usage despite CEM Benchmarking research that suggest hedge funds tend to be poor investments for most funds [4].
4 Aggregate asset class data: Biased and unbiased data sets
Biased aggregate asset class performance statistics by region and by year
Table 6A shows average annual returns8 net of all direct investment costs for the eight aggregate asset classes and three regions, by year, as reported to CEM Benchmarking. Table 6B shows the standard deviation of the same data (i.e., an aggregation dependant measure of idiosyncratic/implementation risk). Summary data derived for the most part from Table 6A and 6B for the eight aggregate asset classes, three regions, and for three time periods are provided in Table 7A (2005-2016), Table 7B (2008-2010), and Table 7C (2010-2016).
One very interesting feature of the raw data as provided to CEM Benchmarking, and one that has been discussed extensively by us elsewhere [3], is the fact that net returns for unlisted assets lag those of listed assets. By lag we mean that, for example, return data claimed to span calendar 2015 actually represents return data which spans June 30th 2013 to June 30th 2014, a lag of six months. The lag is caused by the fact that valuations of unlisted assets relies on appraisals, and appraisals occur infrequently.
8 Net return for each aggregate asset class are calculated for each fund from their holdings-weighted average net returns for each CEM Benchmarking asset class / implementation style included in each aggregate asset class. Average annual net returns for each aggregate asset class / year / region are then calculated from the equal-fund-weighted average of aggregate asset class net returns.
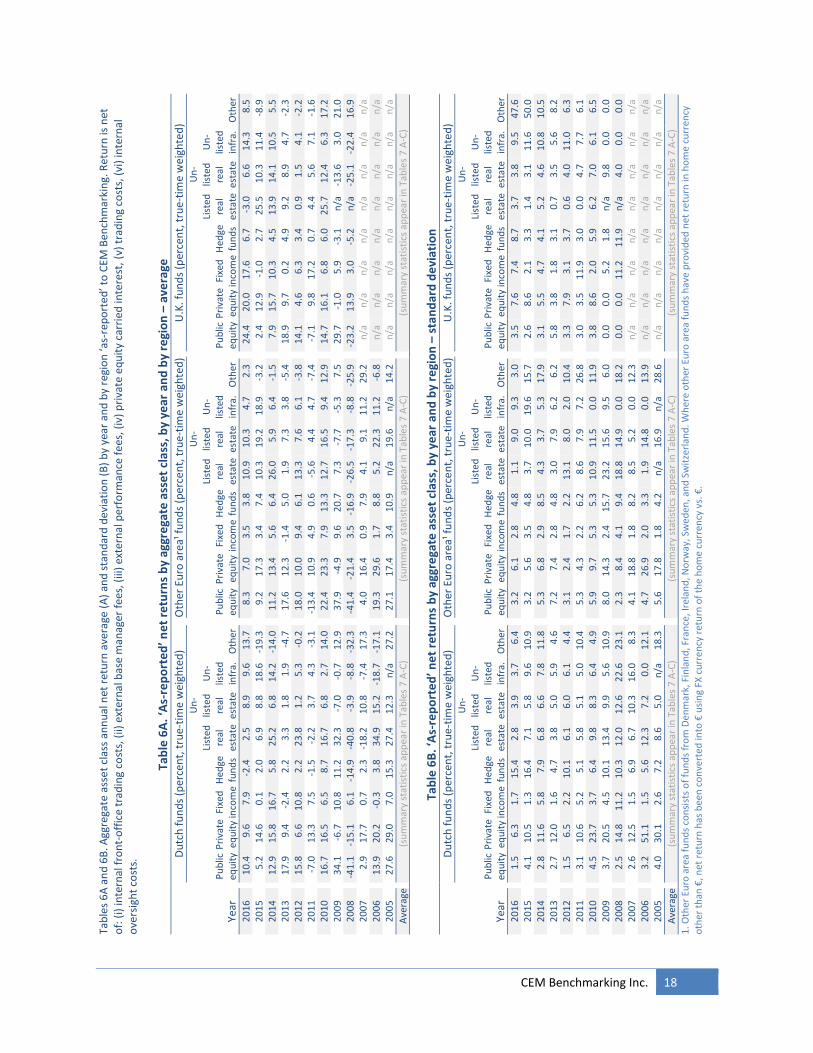
CEM Benchmarking Inc. 18
Tab
les
6A
an
d 6
B. A
ggre
gate
ass
et
clas
s an
nu
al n
et r
etu
rn a
vera
ge (
A)
and
sta
nd
ard
dev
iati
on
(B
) b
y ye
ar a
nd
by
regi
on
‘as-
rep
ort
ed
’ to
CEM
Ben
chm
arki
ng.
Ret
urn
is n
et
of:
(i)
inte
rnal
fro
nt-
off
ice
trad
ing
cost
s, (
ii) e
xter
nal
bas
e m
anag
er f
ees,
(iii
) ex
tern
al p
erfo
rman
ce f
ees
, (iv
) p
riva
te e
qu
ity
carr
ied
inte
rest
, (v
) tr
adin
g co
sts,
(vi
) in
tern
al
ove
rsig
ht
cost
s.
Tab
le 6
A.
‘As-
rep
ort
ed
’ ne
t re
turn
s b
y ag
gre
gate
ass
et
cla
ss, b
y ye
ar a
nd
by
regi
on
– a
vera
ge
Du
tch
fu
nd
s (p
erce
nt,
tru
e-ti
me
wei
ghte
d)
Oth
er E
uro
are
a¹ f
un
ds
(per
cen
t, t
rue-
tim
e w
eigh
ted
)
U.K
. fu
nd
s (p
erce
nt,
tru
e-ti
me
we
igh
ted
)
Year
P
ub
lic
equ
ity
Pri
vate
eq
uit
y Fi
xed
in
com
e H
edge
fu
nd
s
List
ed
real
es
tate
Un
- lis
ted
re
al
esta
te
Un
- lis
ted
in
fra.
O
ther
P
ub
lic
equ
ity
Pri
vate
eq
uit
y Fi
xed
in
com
e H
edge
fu
nd
s
List
ed
real
es
tate
Un
- lis
ted
re
al
esta
te
Un
- lis
ted
in
fra.
O
ther
P
ub
lic
equ
ity
Pri
vate
eq
uit
y Fi
xed
in
com
e H
edge
fu
nd
s
List
ed
real
es
tate
Un
- lis
ted
re
al
esta
te
Un
- lis
ted
in
fra.
O
ther
20
16
1
0.4
9
.6
7.9
-2
.4
2.5
8
.9
9.6
1
3.7
8.3
7
.0
3.5
3
.8
10
.9
10
.3
4.7
2
.3
2
4.4
2
0.0
1
7.6
6
.7
-3.0
6
.6
14
.3
8.5
2
01
5
5.2
1
4.6
0
.1
2.0
6
.9
8.8
1
8.6
-1
9.3
9.2
1
7.3
3
.4
7.4
1
0.3
1
9.2
1
8.9
-3
.2
2
.4
12
.9
-1.0
2
.7
25
.5
10
.3
11
.4
-8.9
2
01
4
12
.9
15
.8
16
.7
5.8
2
5.2
6
.8
14
.2
-14
.0
1
1.2
1
3.4
5
.6
6.4
2
6.0
5
.9
6.4
-1
.5
7
.9
15
.7
10
.3
4.5
1
3.9
1
4.1
1
0.5
5
.5
20
13
1
7.9
9
.4
-2.4
2
.2
3.3
1
.8
1.9
-4
.7
1
7.6
1
2.3
-1
.4
5.0
1
.9
7.3
3
.8
-5.4
18
.9
9.7
0
.2
4.9
9
.2
8.9
4
.7
-2.3
2
01
2
15
.8
6.6
1
0.8
2
.2
23
.8
1.2
5
.3
-0.2
18
.0
10
.0
9.4
6
.1
13
.3
7.6
6
.1
-3.8
14
.1
4.6
6
.3
3.4
0
.9
1.5
4
.1
-2.2
2
01
1
-7.0
1
3.3
7
.5
-1.5
-2
.2
3.7
4
.3
-3.1
-13
.4
10
.9
4.9
0
.6
-5.6
4
.4
4.7
-7
.4
-7
.1
9.8
1
7.2
0
.7
4.4
5
.6
7.1
-1
.6
20
10
1
6.7
1
6.5
6
.5
8.7
1
6.7
6
.8
2.7
1
4.0
22
.4
23
.3
7.9
1
3.3
1
2.7
1
6.5
9
.4
12
.9
1
4.7
1
6.1
6
.8
6.0
2
5.7
1
2.4
6
.3
17
.2
20
09
3
4.1
-6
.7
10
.8
11
.2
32
.3
-7.0
-0
.7
12
.9
3
7.9
-4
.9
9.6
2
0.7
7
.3
-7.7
-5
.3
7.5
29
.7
-1.0
5
.9
-3.1
n
/a
-13
.6
3.0
2
1.0
2
00
8
-41
.1
-15
.1
6.1
-1
4.9
-4
0.8
-3
.9
-8.8
-3
2.3
-41
.4
-21
.4
3.5
-1
6.9
-2
6.5
-1
7.3
-8
.8
-25
.9
-2
3.2
1
3.9
3
.0
-5.2
n
/a
-25
.1
-22
.4
16
.9
20
07
2
.9
17
.7
0.7
2
.3
-18
.2
10
.8
-7.4
1
7.3
4.0
1
6.4
0
.9
7.9
4
.1
9.1
1
1.2
2
9.2
n/a
n
/a
n/a
n
/a
n/a
n
/a
n/a
n
/a
20
06
1
3.9
2
0.2
-0
.3
3.8
3
4.9
1
5.2
-1
8.7
-1
7.1
19
.3
29
.6
1.7
8
.8
5.2
2
2.3
1
1.2
-6
.8
n
/a
n/a
n
/a
n/a
n
/a
n/a
n
/a
n/a
2
00
5
27
.6
29
.0
7.0
1
5.3
2
7.4
1
2.3
n
/a
27
.2
2
7.1
1
7.4
3
.4
10
.9
n/a
1
9.6
n
/a
14
.2
n
/a
n/a
n
/a
n/a
n
/a
n/a
n
/a
n/a
Ave
rage
(s
um
mar
y st
atis
tics
ap
pea
r in
Tab
les
7 A
-C)
(s
um
mar
y st
atis
tics
ap
pea
r in
Tab
les
7 A
-C)
(s
um
mar
y st
atis
tics
ap
pea
r in
Tab
les
7 A
-C)
Tab
le 6
B. ‘
As-
rep
ort
ed
’ ne
t re
turn
s b
y ag
gre
gate
ass
et
clas
s, b
y ye
ar a
nd
by
regi
on
– s
tan
dar
d d
evi
atio
n
D
utc
h f
un
ds
(per
cen
t, t
rue-
tim
e w
eigh
ted
) O
ther
Eu
ro a
rea¹
fu
nd
s (p
erce
nt,
tru
e-ti
me
wei
ghte
d)
U
.K. f
un
ds
(per
cen
t, t
rue-
tim
e w
eig
hte
d)
Year
P
ub
lic
equ
ity
Pri
vate
eq
uit
y Fi
xed
in
com
e H
edge
fu
nd
s
List
ed
real
es
tate
Un
- lis
ted
re
al
esta
te
Un
- lis
ted
in
fra.
O
ther
P
ub
lic
equ
ity
Pri
vate
eq
uit
y Fi
xed
in
com
e H
edge
fu
nd
s
List
ed
real
es
tate
Un
- lis
ted
re
al
esta
te
Un
- lis
ted
in
fra.
O
ther
P
ub
lic
equ
ity
Pri
vate
eq
uit
y Fi
xed
in
com
e H
edge
fu
nd
s
List
ed
real
es
tate
Un
- lis
ted
re
al
esta
te
Un
- lis
ted
in
fra.
O
ther
20
16
1
.5
6.3
1
.7
15
.4
2.8
3
.9
3.7
6
.4
3
.2
6.1
2
.8
4.8
1
.1
9.0
9
.3
3.0
3.5
7
.6
7.4
8
.7
3.7
3
.8
9.5
4
7.6
2
01
5
4.1
1
0.5
1
.3
16
.4
7.1
5
.8
9.6
1
0.9
3.2
5
.6
3.5
4
.8
3.7
1
0.0
1
9.6
1
5.7
2.6
8
.6
2.1
3
.3
1.4
3
.1
11
.6
50
.0
20
14
2
.8
11
.6
5.8
7
.9
6.8
6
.6
7.8
1
1.8
5.3
6
.8
2.9
8
.5
4.3
3
.7
5.3
1
7.9
3.1
5
.5
4.7
4
.1
5.2
4
.6
10
.8
10
.5
20
13
2
.7
12
.0
1.6
4
.7
3.8
5
.0
5.9
4
.6
7
.2
7.4
2
.8
4.8
3
.0
7.9
6
.2
6.2
5.8
3
.8
1.8
3
.1
0.7
3
.5
5.6
8
.2
20
12
1
.5
6.5
2
.2
10
.1
6.1
6
.0
6.1
4
.4
3
.1
2.4
1
.7
2.2
1
3.1
8
.0
2.0
1
0.4
3.3
7
.9
3.1
3
.7
0.6
4
.0
11
.0
6.3
2
01
1
3.1
1
0.6
5
.2
5.1
5
.8
5.1
5
.0
10
.4
5
.3
4.3
2
.2
6.2
8
.6
7.9
7
.2
26
.8
3
.0
3.5
1
1.9
3
.0
0.0
4
.7
7.7
6
.1
20
10
4
.5
23
.7
3.7
6
.4
9.8
8
.3
6.4
4
.9
5
.9
9.7
5
.3
5.3
1
0.9
1
1.5
0
.0
11
.9
3
.8
8.6
2
.0
5.9
6
.2
7.0
6
.1
6.5
2
00
9
3.7
2
0.5
4
.5
10
.1
13
.4
9.9
5
.6
10
.9
8
.0
14
.3
2.4
1
5.7
2
3.2
1
5.6
9
.5
6.0
0.0
0
.0
5.2
1
.8
n/a
9
.8
0.0
0
.0
20
08
2
.5
14
.8
11
.2
10
.3
12
.0
12
.6
22
.6
23
.1
2
.3
8.4
4
.1
9.4
1
8.8
1
4.9
0
.0
18
.2
0
.0
0.0
1
1.2
1
1.9
n
/a
4.0
0
.0
0.0
2
00
7
2.6
1
2.5
1
.5
6.9
6
.7
10
.3
16
.0
8.3
4.1
1
8.8
1
.8
8.2
8
.5
5.2
0
.0
12
.3
n
/a
n/a
n
/a
n/a
n
/a
n/a
n
/a
n/a
2
00
6
3.2
5
1.1
1
.5
5.6
1
2.3
7
.2
0.0
1
2.1
4.7
2
6.9
2
.0
3.3
1
.9
14
.8
0.0
1
3.9
n/a
n
/a
n/a
n
/a
n/a
n
/a
n/a
n
/a
20
05
4
.0
30
.1
2.6
7
.2
8.6
5
.0
n/a
1
8.3
5.6
1
7.8
1
.8
4.2
n
/a
16
.9
n/a
2
8.6
n/a
n
/a
n/a
n
/a
n/a
n
/a
n/a
n
/a
Ave
rage
(s
um
mar
y st
atis
tics
ap
pea
r in
Tab
les
7 A
-C)
(s
um
mar
y st
atis
tics
ap
pea
r in
Tab
les
7 A
-C)
(s
um
mar
y st
atis
tics
ap
pea
r in
Tab
les
7 A
-C)
1. O
ther
Eu
ro a
rea
fun
ds
con
sist
s o
f fu
nd
s fr
om
Den
mar
k, F
inla
nd
, Fra
nce
, Ire
lan
d, N
orw
ay, S
wed
en, a
nd
Sw
itze
rlan
d. W
her
e o
ther
Eu
ro a
rea
fun
ds
hav
e p
rovi
ded
net
re
turn
in h
om
e cu
rren
cy
oth
er t
han
€, n
et r
etu
rn h
as b
een
co
nve
rted
into
€ u
sin
g FX
cu
rren
cy r
etu
rn o
f th
e h
om
e cu
rren
cy v
s. €
.

19 CEM Benchmarking Inc.
Tab
les
7A
, 7B
an
d 7
C. A
ggre
gate
ass
et c
lass
net
ret
urn
su
mm
ary
stat
isti
cs b
y re
gio
n ‘a
s-re
po
rte
d’ t
o C
EM B
ench
mar
kin
g. 7
A s
ho
ws
the
per
iod
20
05
-20
16
. 7B
sh
ow
s th
e p
erio
d 2
00
8-
20
16
. 7C
sh
ow
s th
e p
erio
d 2
01
0-2
01
6. (
See
text
fo
r d
escr
ipti
on
of
reas
on
ing
be
hin
d p
eri
od
se
lect
ion
.) R
etu
rn is
net
of:
(i)
inte
rnal
fro
nt-
off
ice
trad
ing
cost
s, (
ii) e
xter
nal
bas
e m
anag
er f
ees,
(iii
) ex
tern
al p
erfo
rman
ce f
ees,
(iv
) p
riva
te e
qu
ity
carr
ied
inte
rest
, (v)
tra
din
g co
sts,
(vi
) in
tern
al o
vers
igh
t co
sts.
Sh
arp
e r
atio
s lis
ted
as
“in
com
par
able
” d
ue
to
arti
fici
ally
re
du
ced
un
liste
d a
sset
vo
lati
litie
s ca
use
d b
y la
gged
rep
ort
ing.
Tab
le 7
A.
‘As-
rep
ort
ed
’ ne
t re
turn
s su
mm
ary
stat
isti
cs b
y ag
gre
gate
ass
et
clas
s an
d b
y re
gio
n, 2
00
5-2
01
6
Du
tch
fu
nd
s (p
erce
nt,
tru
e-ti
me
we
igh
ted
)
Oth
er E
uro
are
a¹ f
un
ds
(per
cen
t, t
rue-
tim
e w
eig
hte
d)
U
.K. f
un
ds
(per
cen
t, t
rue-
tim
e w
eig
hte
d)
Stat
isti
c
Pu
blic
eq
uit
y P
riva
te
equ
ity
Fixe
d
inco
me
Hed
ge
fun
ds
List
ed
real
es
tate
Un
- lis
ted
re
al
esta
te
Un
- lis
ted
in
fra.
O
ther
Pu
blic
eq
uit
y P
riva
te
equ
ity
Fixe
d
inco
me
Hed
ge
fun
ds
List
ed
real
es
tate
Un
- lis
ted
re
al
esta
te
Un
- lis
ted
in
fra.
O
ther
Pu
blic
eq
uit
y P
riva
te
equ
ity
Fixe
d
inco
me
Hed
ge
fun
ds
List
ed
real
es
tate
Un
- lis
ted
re
al
esta
te
Un
- lis
ted
in
fra.
O
ther
Ari
thm
etic
avg
. gro
ss r
et.1
9
.16
15
.45
5.9
9 5
.50
9.6
0 6
.58
n/a
-0
.15
1
0.1
3 1
4.7
6 4
.41
8.7
3 n
/a
8.5
7 n
/a
1.6
3
n/a
n
/a
n/a
n
/a
n/a
n
/a
n/a
n
/a
(-)
A
vg. c
ost
2,3
,4
0.0
7 4
.54
0.0
6 2
.61
0.2
8 1
.14
n/a
0
.31
0
.12
3.8
2 0
.04
2.5
8 n
/a
0.4
6 n
/a
0.6
4
n/a
n
/a
n/a
n
/a
n/a
n
/a
n/a
n
/a
(=)
A
rith
met
ic a
vg. n
et r
et.
5
9.0
9 1
0.9
1 5
.94
2.8
9 9
.32
5.4
4 n
/a
-0.4
6
10
.01
10
.93
4.3
8 6
.16
n/a
8
.11
n/a
0
.99
n
/a
n/a
n
/a
n/a
n
/a
n/a
n
/a
n/a
Geo
met
ric
avg.
net
re
t.6
7.1
6 1
0.2
9 5
.81
2.6
3 6
.82
5.2
5 n
/a
-2.0
1
7.8
0 1
0.1
2 4
.33
5.7
9 n
/a
7.5
1 n
/a
0.1
2
n/a
n
/a
n/a
n
/a
n/a
n
/a
n/a
n
/a
(-)
Geo
. avg
. ben
chm
ark
ret.
7
6.8
6 9
.72
5.6
6 2
.15
6.2
3 5
.49
n/a
-2
.04
7
.45
9.2
2 4
.00
5.0
8 n
/a
7.3
1 n
/a
0.5
4
n/a
n
/a
n/a
n
/a
n/a
n
/a
n/a
n
/a
(=)
Ne
t va
lue
add
ed
0.3
0 0
.57
0.1
4 0
.47
0.5
8 -0
.25
n/a
0
.03
0
.36
0.9
0 0
.33
0.7
1 n
/a
0.2
0 n
/a
-0.4
2
n/a
n
/a
n/a
n
/a
n/a
n
/a
n/a
n
/a
Avg
. % a
ctiv
ely
man
aged
8
89
%
10
0%
7
7%
1
00
%
90
%
10
0%
n
/a
79
%
5
0%
1
00
%
95
%
10
0%
n
/a
10
0%
n
/a
64
%
n
/a
n/a
n
/a
n/a
n
/a
n/a
n
/a
n/a
Stan
dar
d d
evia
tio
n9
18
.28
11
.33
5.3
3 7
.25
21
.42
6.2
9 n
/a
17
.14
1
9.7
1 1
2.6
8 3
.20
8.4
9 n
/a
10
.99
n/a
1
3.2
2
n/a
n
/a
n/a
n
/a
n/a
n
/a
n/a
n
/a
Vo
lati
lity1
0
18
.53
20
.86
6.4
1 1
1.4
4 2
2.8
5 9
.51
n/a
2
0.1
1
20
.29
16
.61
4.2
4 1
0.6
6 n
/a
15
.16
n/a
1
9.4
3
n/a
n
/a
n/a
n
/a
n/a
n
/a
n/a
n
/a
Shar
pe
rati
o1
1
(in
com
par
able
)
(in
com
par
able
)
(in
com
par
able
)
Tab
le 7
B. ‘
As-
rep
ort
ed
’ ne
t re
turn
s su
mm
ary
stat
isti
cs b
y a
ggre
gate
ass
et
clas
s an
d b
y re
gio
n, 2
00
8-2
01
6
Du
tch
fu
nd
s
(per
cen
t, t
rue-
tim
e w
eig
hte
d)
O
ther
Eu
ro a
rea¹
fu
nd
s
(per
cen
t, t
rue-
tim
e w
eig
hte
d)
U
.K. f
un
ds
(p
erce
nt,
tru
e-ti
me
we
igh
ted
)
Stat
isti
c
Pu
blic
eq
uit
y P
riva
te
equ
ity
Fixe
d
inco
me
Hed
ge
fun
ds
List
ed
real
es
tate
Un
- lis
ted
re
al
esta
te
Un
- lis
ted
in
fra.
O
ther
Pu
blic
eq
uit
y P
riva
te
equ
ity
Fixe
d
inco
me
Hed
ge
fun
ds
List
ed
real
es
tate
Un
- lis
ted
re
al
esta
te
Un
- lis
ted
in
fra.
O
ther
Pu
blic
eq
uit
y P
riva
te
equ
ity
Fixe
d
inco
me
Hed
ge
fun
ds
List
ed
real
es
tate
Un
- lis
ted
re
al
esta
te
Un
- lis
ted
in
fra.
O
ther
Ari
thm
etic
avg
. gro
ss r
et.1
7
.27
11
.66
7.1
6 4
.09
7.8
1 4
.14
6.8
4 -3
.35
7
.87
11
.37
5.2
1 7
.72
5.8
3 5
.60
5.9
2 -2
.09
9
.19
15
.45
7.4
0 4
.56
n/a
2
.99
6.1
9 7
.02
(-)
A
vg. c
ost
2,3
,4
0.0
7 4
.54
0.0
6 2
.61
0.2
8 1
.14
1.5
9 0
.31
0
.12
3.8
2 0
.04
2.5
8 0
.24
0.4
6 1
.50
0.6
4
0.1
1 4
.15
0.0
5 2
.27
n/a
0
.69
1.8
7 1
.00
(=)
A
rith
met
ic a
vg. n
et r
et.
5
7.2
0 7
.12
7.1
0 1
.48
7.5
2 3
.00
5.2
5 -3
.66
7
.75
7.5
5 5
.17
5.1
4 5
.59
5.1
4 4
.43
-2.7
4
9.0
9 1
1.3
0 7
.35
2.2
9 n
/a
2.3
0 4
.32
6.0
2
Geo
met
ric
avg.
net
re
t.6
4.8
7 6
.58
6.9
6 1
.21
5.1
3 2
.86
4.9
7 -4
.94
5
.09
6.7
3 5
.12
4.6
8 4
.55
4.5
6 4
.15
-3.3
2
7.8
8 1
1.1
3 7
.17
2.2
1 n
/a
1.4
6 3
.76
5.5
5
(-)
Geo
. avg
. ben
chm
ark
ret.
7
4.6
2 6
.10
6.8
6 0
.91
4.9
4 3
.79
5.7
0 -5
.04
4
.71
6.1
5 4
.72
4.0
4 4
.97
4.7
8 5
.57
-2.5
5
7.1
2 1
1.9
9 6
.94
2.0
3 n
/a
2.6
5 4
.10
4.3
5
(=)
Ne
t va
lue
add
ed
0.2
5 0
.48
0.1
0 0
.30
0.1
9 -0
.92
-0.7
3 0
.10
0
.38
0.5
8 0
.40
0.6
4 -0
.42
-0.2
2 -1
.41
-0.7
7
0.7
6 -0
.86
0.2
2 0
.18
n/a
-1
.19
-0.3
5 1
.21
Avg
. % a
ctiv
ely
man
aged
8
90
%
10
0%
7
5%
1
00
%
88
%
10
0%
1
00
%
77
%
4
9%
1
00
%
95
%
10
0%
7
8%
1
00
%
10
0%
6
7%
66
%
10
0%
7
6%
1
00
%
n/a
1
00
%
10
0%
7
5%
Stan
dar
d d
evia
tio
n9
19
.93
10
.29
5.3
9 7
.13
20
.39
5.2
7 7
.67
15
.19
2
1.6
0 1
2.5
1 3
.28
9.5
6 1
3.9
5 1
0.7
2 7
.55
10
.24
1
5.5
0 6
.06
6.2
7 3
.86
n/a
1
2.3
8 1
0.0
8 9
.95
Vo
lati
lity1
0
20
.15
16
.53
6.8
0 1
1.9
6 2
1.7
4 8
.78
11
.14
18
.03
2
2.1
3 1
4.4
5 4
.50
11
.76
16
.95
14
.54
11
.33
16
.46
1
5.9
0 8
.89
8.3
2 6
.37
n/a
1
3.3
3 1
3.4
5 2
1.7
4
Shar
pe
rati
o1
1
(in
com
par
able
)
(in
com
par
able
)
(in
com
par
able
)

CEM Benchmarking Inc. 20
Tab
le 7
C. ‘
As-
rep
ort
ed
’ ne
t re
turn
s su
mm
ary
stat
isti
cs b
y a
ggre
gate
ass
et
clas
s an
d b
y re
gio
n, 2
01
0-2
01
6
Du
tch
fu
nd
s (p
erce
nt,
tru
e-ti
me
we
igh
ted
)
Oth
er E
uro
are
a¹ f
un
ds
(per
cen
t, t
rue-
tim
e w
eig
hte
d)
U
.K. f
un
ds
(per
cen
t, t
rue-
tim
e w
eig
hte
d)
Stat
isti
c
Pu
blic
eq
uit
y P
riva
te
equ
ity
Fixe
d
inco
me
Hed
ge
fun
ds
List
ed
real
es
tate
Un
- lis
ted
re
al
esta
te
Un
- lis
ted
in
fra.
O
ther
Pu
blic
eq
uit
y P
riva
te
equ
ity
Fixe
d
inco
me
Hed
ge
fun
ds
List
ed
real
es
tate
Un
- lis
ted
re
al
esta
te
Un
- lis
ted
in
fra.
O
ther
Pu
blic
eq
uit
y P
riva
te
equ
ity
Fixe
d
inco
me
Hed
ge
fun
ds
List
ed
real
es
tate
Un
- lis
ted
re
al
esta
te
Un
- lis
ted
in
fra.
O
ther
Ari
thm
etic
avg
. gro
ss r
et.1
1
0.3
3 1
6.8
0 6
.78
5.0
5 1
1.1
7 6
.56
9.6
9 -1
.62
1
0.5
9 1
7.2
8 4
.83
8.6
5 1
0.1
7 1
0.6
4 9
.20
-0.2
4
10
.86
16
.84
8.2
2 6
.40
11
.71
9.1
7 1
0.1
9 3
.32
(-)
A
vg. c
ost
2,3
,4
0.0
7 4
.54
0.0
6 2
.61
0.2
8 1
.14
1.5
9 0
.31
0
.12
3.8
2 0
.04
2.5
8 0
.24
0.4
6 1
.50
0.6
4
0.1
1 4
.15
0.0
5 2
.27
0.7
8 0
.69
1.8
7 1
.00
(=)
A
rith
met
ic a
vg. n
et r
et.
5
10
.26
12
.26
6.7
3 2
.43
10
.88
5.4
2 8
.10
-1.9
3
10
.47
13
.46
4.7
9 6
.07
9.9
3 1
0.1
8 7
.70
-0.8
9
10
.76
12
.69
8.1
7 4
.13
10
.93
8.4
8 8
.32
2.3
2
Geo
met
ric
avg.
net
re
t.6
9.9
4 1
2.2
1 6
.56
2.3
7 1
0.4
3 5
.38
7.9
4 -2
.63
9
.88
13
.35
4.7
4 6
.01
9.5
5 1
0.0
6 7
.60
-1.0
8
10
.31
12
.59
7.9
6 4
.11
10
.44
8.4
1 8
.27
2.0
1
(-)
Geo
. avg
. ben
chm
ark
ret.
7
9.5
4 1
2.8
4 6
.36
2.2
3 1
0.4
5 5
.85
7.6
9 -2
.57
9
.68
13
.30
4.3
3 5
.10
9.2
9 9
.46
8.1
1 -0
.40
9
.99
13
.45
7.6
1 2
.75
11
.90
8.6
9 8
.34
1.8
8
(=)
Ne
t va
lue
add
ed
0.4
0 -0
.63
0.2
0 0
.14
-0.0
3 -0
.47
0.2
5 -0
.06
0
.21
0.0
5 0
.40
0.9
1 0
.26
0.6
0 -0
.52
-0.6
7
0.3
2 -0
.86
0.3
4 1
.36
-1.4
6 -0
.28
-0.0
7 0
.14
Avg
. % a
ctiv
ely
man
aged
8
91
%
10
0%
7
1%
1
00
%
85
%
10
0%
1
00
%
73
%
4
9%
1
00
%
96
%
10
0%
8
1%
1
00
%
10
0%
7
0%
81
%
10
0%
7
4%
1
00
%
10
0%
1
00
%
10
0%
9
2%
Stan
dar
d d
evia
tio
n9
8.1
1 3
.46
5.9
3 3
.57
10
.14
2.9
6 5
.87
11
.71
1
0.8
5 4
.97
3.2
4 3
.59
9.1
3 5
.18
4.8
9 6
.28
9
.83
4.7
4 6
.85
1.8
9 1
0.5
5 3
.99
3.5
2 8
.02
Vo
lati
lity1
0
8.6
1 1
2.1
1 6
.68
10
.09
11
.81
6.5
3 8
.65
13
.97
1
1.8
5 7
.84
4.4
4 6
.34
11
.14
9.7
7 9
.61
14
.55
1
0.4
6 8
.06
8.3
1 4
.94
10
.96
5.9
1 9
.57
20
.93
Shar
pe
rati
o1
1
(in
com
par
able
)
(in
com
par
able
)
(in
com
par
able
)
1. A
rith
met
ic a
vera
ge (
i.e.,
sim
ple
ave
rage
) gr
oss
ret
urn
is t
he
arit
hm
etic
ave
rage
gro
ss r
etu
rn im
plie
d b
y th
e 3
-yea
r av
erag
e co
st a
nd
7-y
ear
arit
hm
etic
ave
rage
net
re
turn
. Fo
r u
nlis
ted
ass
ets,
th
e ar
ith
met
ic a
vera
ge g
ross
ret
urn
her
e is
larg
er t
han
th
e ar
ith
met
ic a
vera
ge g
ross
ret
urn
rep
ort
ed
to
CEM
ben
chm
arki
ng
bec
ause
of
un
rep
ort
ed p
erfo
rman
ce f
ees.
2
. Th
e av
erag
e in
vest
men
t co
st f
or
each
ass
et c
lass
incl
ud
e b
oth
low
co
st im
ple
men
tati
on
sty
les
(e.g
., in
dex
ed in
tern
ally
man
aged
pu
blic
eq
uit
y) a
nd
hig
h c
ost
imp
lem
enta
tio
n s
tyle
s (e
.g.,
fu
nd
-of-
fun
d
pri
vate
eq
uit
y). A
ctu
al c
ost
s fo
r an
y p
arti
cula
r fu
nd
can
ran
ge s
ub
stan
tial
ly f
rom
th
ose
sh
ow
n b
ased
up
on
ind
ivid
ual
imp
lem
enta
tio
n s
tyle
. 3
. In
vest
men
t co
sts
incl
ud
e in
tern
al c
ost
s, m
anag
er b
ase
fees
an
d p
erfo
rman
ce f
ees
for
exte
rnal
man
dat
es, c
arri
ed in
tere
st f
or
un
liste
d in
vest
men
ts, a
nd
un
der
lyin
g b
ase
fees
plu
s p
erfo
rman
ce f
ees
for
fun
d-o
f-fu
nd
un
liste
d in
vest
men
ts.
4. T
he
aver
age
esti
mat
ed in
vest
men
t co
st f
or
each
ass
et
clas
s is
cal
cula
ted
fro
m t
he
aver
age
of
the
med
ian
an
nu
al in
vest
men
t co
st s
pan
nin
g th
e la
st t
hre
e ye
ars
of
the
stu
dy,
20
14
-20
16.
Th
e m
edia
n is
u
sed
to
rem
ove
ou
tlie
rs in
un
liste
d a
sset
cla
sses
wh
ere
cost
s ca
n b
e ve
ry la
rge
rela
tive
to
th
e p
rop
ort
ion
of
asse
ts o
n a
net
ass
et
valu
e b
asis
. Th
e av
erag
e in
vest
men
t co
st is
on
ly c
alcu
late
d o
ver
the
pas
t th
ree
year
s b
ecau
se p
erfo
rman
ce f
ees
and
un
der
lyin
g fe
es f
or
un
liste
d a
sset
cla
sses
we
re n
ot
rep
ort
ed o
n a
co
nsi
sten
t b
asis
to
CEM
pri
or
to t
his
per
iod
. 5
. Ari
thm
etic
ave
rage
net
ret
urn
is t
he
sim
ple
ave
rage
of
the
an
nu
al f
un
d-a
vera
ge n
et r
etu
rns
app
eari
ng
in T
able
6A
. 6
. Geo
met
ric
aver
age
net
ret
urn
is t
he
com
po
un
d n
et r
etu
rn o
f th
e an
nu
al f
un
d-a
vera
ge n
et r
etu
rns
app
eari
ng
in T
able
6A
. Act
ual
an
nu
al n
et r
etu
rns
exp
erie
nce
d b
y fu
nd
s w
ill t
ypic
ally
be
sm
alle
r th
an
the
geo
met
ric
aver
age
net
ret
urn
rep
ort
ed h
ere
bec
ause
of
retu
rn d
rag
cau
sed
by
idio
syn
crat
ic r
isk
(i.e
., im
ple
men
tati
on
ris
k) c
ause
d b
y ac
tive
man
agem
ent.
7
. Geo
met
ric
aver
age
ben
chm
ark
retu
rn is
th
e av
erag
e co
mp
ou
nd
ret
urn
of
ben
chm
arks
imp
lied
by
the
geo
met
ric
ave
rage
net
re
turn
an
d t
he
net
val
ue
add
ed b
y ag
greg
ate
asse
t cl
ass
rep
ort
ed t
o C
EM
ben
chm
arki
ng;
it is
no
t n
eces
sari
ly t
he
actu
al g
eom
etri
c av
erag
e b
ench
mar
k re
turn
of
any
par
ticu
lar
inve
stib
le b
ench
mar
k.
8. A
vera
ge p
rop
ort
ion
act
ivel
y m
anag
ed is
th
e av
erag
e ra
tio
of
a fu
nd
’s a
sset
s th
at a
re a
ctiv
ely
man
aged
in a
n a
ctiv
e at
tem
pt
to o
utp
erfo
rm a
mar
ket
cap
ital
izat
ion
-wei
ghte
d in
dex
rel
ativ
e t
o t
ota
l ass
ets.
Sm
art-
bet
a st
rate
gies
are
co
nsi
der
ed a
ctiv
ely
man
aged
. Act
ivel
y m
anag
ed f
ract
ion
fo
r u
nlis
ted
ass
ets
is 1
00
%.
9. S
tan
dar
d d
evia
tio
n is
th
e p
op
ula
tio
n s
tan
dar
d d
evia
tio
n o
f th
e an
nu
al f
un
d-a
vera
ge n
et r
etu
rns
app
eari
ng
in T
able
6A
. Act
ual
sta
nd
ard
dev
iati
on
s o
f an
nu
al n
et r
etu
rns
exp
erie
nce
d b
y fu
nd
s w
ill
typ
ical
ly b
e la
rger
th
an t
hat
rep
ort
ed h
ere
bec
ause
of
idio
syn
crat
ic r
isk
(i.e
., im
ple
men
tati
on
ris
k) c
ause
d b
y ac
tive
man
agem
ent.
1
0. V
ola
tilit
y is
an
est
imat
e o
f th
e av
era
ge s
tan
dar
d d
evia
tio
n e
xper
ien
ced
by
actu
al f
un
ds
du
e to
yea
r-to
-yea
r fl
uct
uat
ion
s in
agg
rega
te a
sset
cla
ss n
et
retu
rns
(i.e
., s
tan
dar
d d
evia
tio
n)
and
in-y
ear
flu
ctu
atio
ns
in a
ggre
gate
ass
et c
lass
net
ret
urn
s fr
om
Tab
le 6
B (
i.e.,
idio
syn
crat
ic r
isk)
. 1
1. S
har
pe
rati
os
are
no
t sh
ow
n f
or
‘as-
rep
ort
ed’ d
ata
du
e to
inco
mp
arab
ility
bet
wee
n li
sted
an
d u
nlis
ted
ass
ets
. Th
e p
rim
ary
sou
rce
of
erro
r ar
e th
e m
assi
vely
un
der
stat
ed v
ola
tilit
ies
of
un
liste
d a
sset
cl
ass
retu
rns.
21 CEM Benchmarking Inc.
A simple demonstration of the lag can be seen in the sample of Dutch funds where the correlation between as-reported net returns for 2005-2016 in Table 6A for both listed and unlisted real estate is only 24 percent, consistent with no correlation for a set of 12 data points. However, the correlation between 2005-2015 listed real estate and 2006-2016 unlisted real estate is a remarkable 82 percent.
Two possible explanations exist for this feature in the data: First, listed real estate returns in one year might predict unlisted real estate returns in the subsequent year, a major arbitrage opportunity. Two, unlisted real estate returns might be reported approximately one year late (i.e., the reported returns lag the actual returns by approximately one year). Since the first possibility seems unlikely, and the second reasonably well excepted by now in the investment community, we conclude that unlisted asset returns are lagged.
The importance of removing the lag can be understood from considering scenarios where data has different beginning and end dates. For example, if the study period here were 2009 to 2016, listed real estate data would properly exclude the crash in listed real estate returns caused by the global financial crisis in 2008, whereas unlisted real estate would only recognize the crash of 2008 crash in 2009, causing an unfair and biased comparison between the two asset classes (or more properly, implementation styles). Unbiased comparisons between asset classes, aggregate or otherwise, thus require making the data contemporaneous; otherwise, conclusions drawn will reflect more on the chosen sample period than the nature of investments.
This is but one severe bias that is typically included in asset class performance comparisons in the absence of removing the lag form unlisted asset performance data. Two other severe biases that result from directly comparing reported aggregate asset class returns include:
1. Understated volatility. Since different funds have different lags built into their portfolios, averaging returns over different funds suppresses volatility. The effect is sometimes referred to as appraisal smoothing, and specialized techniques have been developed to remove it [citation required].
2. Understated correlations. If performance data is not contemporaneous, correlations between asset classes cannot be expected to be correct. Direct comparisons between listed and unlisted real estate, or listed and unlisted (i.e., private) equity, are often erroneously used to provided evidence that the unlisted version is superior for the diversification it provides. Most of this diversification however is artificial, caused by the comparison of marked-to-market returns to lagged appraisal-based returns.
For this reason, the data for private equity, unlisted real estate, and unlisted infrastructure appearing in Tables 5A and 5B and Tables 6A, 6B, and 6C should not be used for aggregate asset class performance comparisons (see Section 5). Instead, we provide them for comparison with Table 8A and 8B, and Tables 9A, 9B, and 9C where the appraisal lag has been accounted for and removed from unlisted assets – private equity, unlisted real estate, and unlisted infrastructure.
Lag from private equity, unlisted real estate, and unlisted infrastructure
The process of identifying and standardizing unlisted asset returns for lag has been discussed by us elsewhere. Details of the methodology provided there [3] are included here in Appendix A.
In brief, the lag in each portfolio is identified on a fund-by-fund basis by comparison to listed proxies. The component of the annual net return from one year that is identified as actually belonging to the net return from a prior year are shifted into that prior year. The process would preserve performance data averaged over the sample period if the annual returns where gap free and of infinite history. Of course, the data provided by funds to CEM includes gaps and have finite histories, so some changes to annual average occurs.
Histograms of the inferred lag in private equity, unlisted real estate, and unlisted infrastructure are shown in Figures 1A, 1B, and 1C. Our prior studies of lag in private equity and unlisted real estate net returns showed that the histogram of lag for U.S. DB pension funds peaked strongly between one and two quarters in the case of private equity, and between five and six quarters in the case of real estate [3].

CEM Benchmarking Inc. 22
Figures 1A, 1B, and 1C. Distribution of inferred lag in the ‘as-reported’ net returns of (A) private equity, (B) unlisted real estate, and (C) unlisted infrastructure. See Appendix A for a discussion of methodology.
Figure 1A. Distribution of inferred lag – private equity
Figure 1B. Distribution of inferred lag – unlisted real estate
Figure 1C. Distribution of inferred lag – unlisted infrastructure
0
5
10
15
20
Nu
mb
er o
f fu
nd
s NLDOther EuroU.K.
0
5
10
15
Nu
mb
er o
f fu
nd
s NLD
Other Euro
U.K.
0
5
10
15
20
Nu
mb
er o
f fu
nd
s NLD
Other Euro
U.K.

23 CEM Benchmarking Inc.
The inferred lag distribution for Dutch funds is very similar to that of the U.S., showing strong peaks between one and two quarters in the case of private equity (Figure 1A) and four and five quarters for unlisted real estate (Figure 1B). Other Euro area funds by contrast display inferred lag distributions for both private equity and unlisted real estate that peak between one and two quarters. For U.K funds, the comparison to the U.S. is reversed; private equity inferred lag peaks at five to six quarters, and for unlisted real estate peaks at two to three quarters. The inferred lag for unlisted infrastructure for Dutch funds, other U.K. fund speak at one to two quarters, and six to seven quarters respectively, while for other Euro area funds, not enough invest in unlisted infrastructure to develop a trend.
Unbiased aggregate asset class performance statistics by region and by year
Table 8A shows average annual returns net of all direct investment costs (details discussed below) for the eight aggregate asset classes and three regions, by year used in the remainder of this report. Table 8B shows the standard deviation of the same data (i.e., the idiosyncratic or implementation risk). Data appearing in Tables 8A and 8B is identical to Tables 6A and 6B except for private equity, unlisted real estate, and unlisted infrastructure which have all been standardized to remove reporting lag as described in Appendix A.
Tables 9A, 9B, and 9C display summary asset class performance data, derived for the most part from Tables 8A and 8B. The summary data is provided for the eight aggregate asset classes, for the three regions, and for three difference sampling periods: Table 9A shows the longest available period independent of whether data is available (2005-2016), and so excludes unlisted infrastructure for other Euro area funds and all data for U.K. funds; Table 6B shows the longest period over which all three regions have data for any asset class (2008-2016), and so which excludes one asset class/region combination U.K. listed real estate; Table 9C shows the longest period for which complete data sets are available for all asset classes and regions (2010-2016).
Summary data for each aggregate asset class / region / sample period shown includes:
1. Arithmetic average gross return: The arithmetic average net return grossed up for the estimated average cost.
2. Average cost: An estimate of the average cost9 experienced by a fund with the average management / implementation style of the region group.
3. Arithmetic average net return: The simple average of the average net returns by year shown in Table 8A. 4. Geometric average net return: The compound average of the average net returns by year shown in Table
8A. 5. Geometric average benchmark return: The geometric average net return grossed down for estimated net
value added. 6. Average net value added: The average difference between net return and benchmark return for the subset
of funds that provide both net return and benchmark returns. 7. Average percent actively managed: The average proportion of assets within an asset class measured by in-
year average holdings that is actively managed to outperform a market capitalization weighted benchmark index.
8. Standard deviation: The population standard deviation of the average net returns by year shown in Table 8A. Estimate excludes idiosyncratic risk due to in-year standard deviation of aggregate asset class net returns and may be considered a proxy for “market risk”.
9. Volatility: The estimated average volatility experienced by the average fund in each asset class. Estimate includes both the year-to-year standard deviation of annual net returns (i.e., “market risk”) and the in-year standard deviation of annual net returns (i.e., “idiosyncratic risk” or “implementation risk”, the average of each column in Table 8B).
9 Costs include: (i) for internal investment programs, internal front-office investment costs, and (ii) for external investment programs, manager base fees, manager performance fees including carried interest, underlying fees for fund-of-fund investments, and internal manager selection and monitoring costs. Where funds are unable to provide components of cost, CEM standard defaults have been utilized.

CEM Benchmarking Inc. 24
Tab
les
8A
an
d 8
B. A
ggre
gate
ass
et
clas
s an
nu
al n
et r
etu
rn a
vera
ge (
A)
and
sta
nd
ard
dev
iati
on
(B
) b
y ye
ar a
nd
by
regi
on
aft
er
‘sta
nd
ard
izat
ion
’ of
un
liste
d a
sset
s n
et r
etu
rns
for
lagg
ed r
ep
ort
ing
(see
Sec
tio
n 3
fo
r d
iscu
ssio
n).
Ret
urn
is n
et
of:
(i)
inte
rnal
fro
nt-
off
ice
trad
ing
cost
s, (
ii) e
xter
nal
bas
e m
anag
er f
ees
, (iii
) ex
tern
al p
erfo
rman
ce f
ee
s, (
iv)
pri
vate
eq
uit
y ca
rrie
d in
tere
st, (
v) t
rad
ing
cost
s, (
vi)
inte
rnal
ove
rsig
ht
cost
s.
Tab
le 8
A.
‘Sta
nd
ard
ize
d’ n
et
retu
rns
by
aggr
ega
te a
sse
t cl
ass
, by
year
an
d b
y re
gio
n –
ave
rage
Du
tch
fu
nd
s (p
erce
nt,
tru
e-ti
me
wei
ghte
d)
Oth
er E
uro
are
a¹ f
un
ds
(per
cen
t, t
rue-
tim
e w
eigh
ted
)
U.K
. fu
nd
s (p
erce
nt,
tru
e-ti
me
we
igh
ted
)
Year
Pu
blic
eq
uit
y P
riva
te
equ
ity
Fixe
d
inco
me
Hed
ge
fun
ds
List
ed
real
es
tate
Un
- lis
ted
re
al
esta
te
Un
- lis
ted
in
fra.
O
ther
P
ub
lic
equ
ity
Pri
vate
eq
uit
y Fi
xed
in
com
e H
edge
fu
nd
s
List
ed
real
es
tate
Un
- lis
ted
re
al
esta
te
Un
- lis
ted
in
fra.
O
ther
P
ub
lic
equ
ity
Pri
vate
eq
uit
y Fi
xed
in
com
e H
edge
fu
nd
s
List
ed
real
es
tate
Un
- lis
ted
re
al
esta
te
Un
- lis
ted
in
fra.
O
ther
20
16
1
0.4
1
3.9
7
.9
-2.4
2
.5
-7.9
1
7.5
1
3.7
8.3
1
5.5
3
.5
3.8
1
0.9
3
.9
14
.0
2.3
24
.4
-2.4
1
7.6
6
.7
-3.0
-1
.5
12
.7
8.5
2
01
5
5.2
1
0.1
0
.1
2.0
6
.9
0.9
4
.6
-19
.3
9
.2
12
.4
3.4
7
.4
10
.3
6.8
-6
.9
-3.2
2.4
1
9.8
-1
.0
2.7
2
5.5
2
.5
-2.5
-8
.9
20
14
1
2.9
0
.8
16
.7
5.8
2
5.2
1
4.8
1
9.7
-1
4.0
11
.2
2.5
5
.6
6.4
2
6.0
1
4.7
1
8.8
-1
.5
7
.9
-5.1
1
0.3
4
.5
13
.9
15
.9
21
.5
5.5
2
01
3
17
.9
20
.7
-2.4
2
.2
3.3
-2
.6
1.8
-4
.7
1
7.6
2
2.0
-1
.4
5.0
1
.9
2.6
2
.8
-5.4
18
.9
28
.9
0.2
4
.9
9.2
5
.7
4.6
-2
.3
20
12
1
5.8
2
1.4
1
0.8
2
.2
23
.8
25
.2
5.3
-0
.2
1
8.0
2
0.0
9
.4
6.1
1
3.3
2
6.5
1
6.8
-3
.8
1
4.1
3
1.6
6
.3
3.4
0
.9
25
.0
8.7
-2
.2
20
11
-7
.0
-12
.2
7.5
-1
.5
-2.2
-1
6.1
1
.5
-3.1
-13
.4
-11
.4
4.9
0
.6
-5.6
-9
.2
3.9
-7
.4
-7
.1
-21
.8
17
.2
0.7
4
.4
-9.3
-3
.1
-1.6
2
01
0
16
.7
16
.7
6.5
8
.7
16
.7
4.3
0
.7
14
.0
2
2.4
2
6.9
7
.9
13
.3
12
.7
5.1
-6
.3
12
.9
1
4.7
2
5.0
6
.8
6.0
2
5.7
2
.1
13
.4
17
.2
20
09
3
4.1
5
4.7
1
0.8
1
1.2
3
2.3
5
0.2
2
5.0
1
2.9
37
.9
47
.4
9.6
2
0.7
7
.3
48
.2
31
.3
7.5
29
.7
10
7.0
5
.9
-3.1
n
/a
43
.0
22
.5
21
.0
20
08
-4
1.1
-3
6.6
6
.1
-14
.9
-40
.8
-31
.8
-26
.1
-32
.3
-4
1.4
-3
1.4
3
.5
-16
.9
-26
.5
-31
.9
-24
.4
-25
.9
-2
3.2
-3
7.2
3
.0
-5.2
n
/a
-38
.7
-31
.4
16
.9
20
07
2
.9
-6.6
0
.7
2.3
-1
8.2
-2
8.3
-1
5.8
1
7.3
4.0
-6
.2
0.9
7
.9
4.1
-2
7.9
-1
.4
29
.2
n
/a
n/a
n
/a
n/a
n
/a
n/a
n
/a
n/a
2
00
6
13
.9
22
.4
-0.3
3
.8
34
.9
21
.3
-10
.8
-17
.1
1
9.3
3
2.3
1
.7
8.8
5
.2
30
.2
18
.5
-6.8
n/a
n
/a
n/a
n
/a
n/a
n
/a
n/a
n
/a
20
05
2
7.6
2
3.9
7
.0
15
.3
27
.4
4.7
n
/a
27
.2
2
7.1
1
5.0
3
.4
10
.9
n/a
1
1.0
n
/a
14
.2
n
/a
n/a
n
/a
n/a
n
/a
n/a
n
/a
n/a
Ave
rage
(s
um
mar
y st
atis
tics
ap
pea
r in
Tab
les
9 A
-C)
(s
um
mar
y st
atis
tics
ap
pea
r in
Tab
les
9 A
-C)
(s
um
mar
y st
atis
tics
ap
pea
r in
Tab
les
9 A
-C)
Tab
le 8
B. ‘
Stan
dar
diz
ed
’ ne
t re
turn
s b
y ag
gre
gate
ass
et
cla
ss, b
y ye
ar a
nd
by
regi
on
– s
tan
dar
d d
evi
atio
n
D
utc
h f
un
ds
(per
cen
t, t
rue-
tim
e w
eigh
ted
) O
ther
Eu
ro a
rea¹
fu
nd
s (p
erce
nt,
tru
e-ti
me
wei
ghte
d)
U
.K. f
un
ds
(per
cen
t, t
rue-
tim
e w
eig
hte
d)
Year
P
ub
lic
equ
ity
Pri
vate
eq
uit
y Fi
xed
in
com
e H
edge
fu
nd
s
List
ed
real
es
tate
Un
- lis
ted
re
al
esta
te
Un
- lis
ted
in
fra.
O
ther
P
ub
lic
equ
ity
Pri
vate
eq
uit
y Fi
xed
in
com
e H
edge
fu
nd
s
List
ed
real
es
tate
Un
- lis
ted
re
al
esta
te
Un
- lis
ted
in
fra.
O
ther
P
ub
lic
equ
ity
Pri
vate
eq
uit
y Fi
xed
in
com
e H
edge
fu
nd
s
List
ed
real
es
tate
Un
- lis
ted
re
al
esta
te
Un
- lis
ted
in
fra.
O
ther
20
16
1
.5
8.3
1
.7
15
.4
2.8
1
0.1
5
.1
6.4
3.2
9
.2
2.8
4
.8
1.1
1
1.4
5
.3
3.0
3.5
7
.7
7.4
8
.7
3.7
5
.1
10
.9
47
.6
20
15
4
.1
11
.5
1.3
1
6.4
7
.1
6.0
1
2.1
1
0.9
3.2
4
.9
3.5
4
.8
3.7
1
2.1
7
.2
15
.7
2
.6
9.3
2
.1
3.3
1
.4
3.8
8
.4
50
.0
20
14
2
.8
13
.4
5.8
7
.9
6.8
4
.4
5.4
1
1.8
5.3
1
0.1
2
.9
8.5
4
.3
3.5
7
.1
17
.9
3
.1
6.6
4
.7
4.1
5
.2
4.1
8
.5
10
.5
20
13
2
.7
15
.0
1.6
4
.7
3.8
6
.8
5.9
4
.6
7
.2
6.8
2
.8
4.8
3
.0
9.7
6
.5
6.2
5.8
6
.4
1.8
3
.1
0.7
4
.5
4.9
8
.2
20
12
1
.5
10
.0
2.2
1
0.1
6
.1
7.9
5
.9
4.4
3.1
9
.2
1.7
2
.2
13
.1
7.4
8
.1
10
.4
3
.3
8.8
3
.1
3.7
0
.6
6.8
8
.1
6.3
2
01
1
3.1
1
0.7
5
.2
5.1
5
.8
4.6
6
.7
10
.4
5
.3
11
.6
2.2
6
.2
8.6
1
3.6
0
.0
26
.8
3
.0
7.7
1
1.9
3
.0
0.0
6
.2
13
.3
6.1
2
01
0
4.5
2
1.4
3
.7
6.4
9
.8
11
.5
9.2
4
.9
5
.9
17
.9
5.3
5
.3
10
.9
17
.1
0.0
1
1.9
3.8
1
6.0
2
.0
5.9
6
.2
17
.0
3.6
6
.5
20
09
3
.7
14
.5
4.5
1
0.1
1
3.4
8
.9
14
.1
10
.9
8
.0
11
.1
2.4
1
5.7
2
3.2
2
2.5
7
.6
6.0
0.0
0
.0
5.2
1
.8
n/a
3
.5
0.0
0
.0
20
08
2
.5
15
.1
11
.2
10
.3
12
.0
11
.3
21
.6
23
.1
2
.3
7.5
4
.1
9.4
1
8.8
1
4.1
0
.0
18
.2
0
.0
0.0
1
1.2
1
1.9
n
/a
2.4
0
.0
0.0
2
00
7
2.6
1
0.8
1
.5
6.9
6
.7
10
.0
11
.3
8.3
4.1
1
0.0
1
.8
8.2
8
.5
14
.7
0.0
1
2.3
n/a
n
/a
n/a
n
/a
n/a
n
/a
n/a
n
/a
20
06
3
.2
37
.5
1.5
5
.6
12
.3
7.7
0
.0
12
.1
4
.7
26
.6
2.0
3
.3
1.9
1
3.9
0
.0
13
.9
n
/a
n/a
n
/a
n/a
n
/a
n/a
n
/a
n/a
2
00
5
4.0
3
0.5
2
.6
7.2
8
.6
5.8
n
/a
18
.3
5
.6
12
.9
1.8
4
.2
n/a
1
7.9
n
/a
28
.6
n
/a
n/a
n
/a
n/a
n
/a
n/a
n
/a
n/a
Ave
rage
(s
um
mar
y st
atis
tics
ap
pea
r in
Tab
les
9 A
-C)
(s
um
mar
y st
atis
tics
ap
pea
r in
Tab
les
9 A
-C)
(s
um
mar
y st
atis
tics
ap
pea
r in
Tab
les
9 A
-C)
1. O
ther
Eu
ro a
rea
fun
ds
con
sist
s o
f fu
nd
s fr
om
Den
mar
k, F
inla
nd
, Fra
nce
, Ire
lan
d, N
orw
ay, S
wed
en, a
nd
Sw
itze
rlan
d. W
her
e o
ther
Eu
ro a
rea
fun
ds
hav
e p
rovi
ded
net
re
turn
in h
om
e cu
rren
cy
oth
er t
han
€, n
et r
etu
rn h
as b
een
co
nve
rted
into
€ u
sin
g FX
cu
rren
cy r
etu
rn o
f th
e h
om
e cu
rren
cy v
s. €
.

25 CEM Benchmarking Inc.
Tab
les
9A
, 9B
an
d 9
C. A
ggre
gate
ass
et c
lass
net
ret
urn
su
mm
ary
stat
isti
cs b
y re
gio
n a
fte
r ‘s
tan
dar
diz
atio
n’ o
f u
nlis
ted
ass
ets
ne
t re
turn
s fo
r la
gge
d r
ep
ort
ing
(see
Sec
tio
n 3
fo
r d
iscu
ssio
n).
9A
sh
ow
s th
e p
erio
d 2
00
5-2
01
6. 9
B s
ho
ws
the
pe
rio
d 2
00
8-2
01
6. 9
C s
ho
ws
the
per
iod
20
10
-20
16
. (Se
e te
xt f
or
des
crip
tio
n o
f re
aso
nin
g b
ehin
d p
erio
d s
elec
tio
n.)
R
etu
rn is
net
of:
(i)
inte
rnal
fro
nt-
off
ice
trad
ing
cost
s, (
ii) e
xter
nal
bas
e m
anag
er f
ees,
(iii
) e
xter
nal
per
form
ance
fee
s, (
iv)
pri
vate
eq
uit
y ca
rrie
d in
tere
st,
(v)
trad
ing
cost
s, (
vi)
inte
rnal
ove
rsig
ht
cost
s. S
har
pe
rati
os
liste
d a
re n
ot
pro
vid
ed f
or
the
pe
rio
ds
20
08
-20
16
an
d 2
01
0-2
01
6 d
ue
to in
suff
icie
nt
his
tori
es o
f d
ata.
Tab
le 9
A.
‘Sta
nd
ard
ize
d’ n
et
retu
rns
sum
mar
y st
atis
tics
by
aggr
ega
te a
sse
t cl
ass
and
by
regi
on
, 20
05
-20
16
Du
tch
fu
nd
s (p
erce
nt,
tru
e-ti
me
we
igh
ted
)
Oth
er E
uro
are
a¹ f
un
ds
(per
cen
t, t
rue-
tim
e w
eig
hte
d)
U
.K. f
un
ds
(per
cen
t, t
rue-
tim
e w
eig
hte
d)
Stat
isti
c
Pu
blic
eq
uit
y P
riva
te
equ
ity
Fixe
d
inco
me
Hed
ge
fun
ds
List
ed
real
es
tate
Un
- lis
ted
re
al
esta
te
Un
- lis
ted
in
fra.
O
ther
Pu
blic
eq
uit
y P
riva
te
equ
ity
Fixe
d
inco
me
Hed
ge
fun
ds
List
ed
real
es
tate
Un
- lis
ted
re
al
esta
te
Un
- lis
ted
in
fra.
O
ther
Pu
blic
eq
uit
y P
riva
te
equ
ity
Fixe
d
inco
me
Hed
ge
fun
ds
List
ed
real
es
tate
Un
- lis
ted
re
al
esta
te
Un
- lis
ted
in
fra.
O
ther
Ari
thm
etic
avg
. gro
ss r
et.1
9
.16
15
.32
5.9
9 5
.50
9.6
0 4
.03
n/a
-0
.15
1
0.1
3 1
5.9
0 4
.41
8.7
3 n
/a
7.1
3 n
/a
1.6
3
n/a
n
/a
n/a
n
/a
n/a
n
/a
n/a
n
/a
(-)
A
vg. c
ost
2,3
,4
0.0
7 4
.54
0.0
6 2
.61
0.2
8 1
.14
n/a
0
.31
0
.12
3.8
2 0
.04
2.5
8 n
/a
0.4
6 n
/a
0.6
4
n/a
n
/a
n/a
n
/a
n/a
n
/a
n/a
n
/a
(=)
A
rith
met
ic a
vg. n
et r
et.
5
9.0
9 1
0.7
8 5
.94
2.8
9 9
.32
2.8
9 n
/a
-0.4
6
10
.01
12
.08
4.3
8 6
.16
n/a
6
.67
n/a
0
.99
n
/a
n/a
n
/a
n/a
n
/a
n/a
n
/a
n/a
Geo
met
ric
avg.
net
re
t.6
7.1
6 8
.43
5.8
1 2
.63
6.8
2 0
.50
n/a
-2
.01
7
.80
10
.06
4.3
3 5
.79
n/a
4
.30
n/a
0
.12
n
/a
n/a
n
/a
n/a
n
/a
n/a
n
/a
n/a
(-)
Geo
. avg
. ben
chm
ark
ret.
7
6.8
6 7
.86
5.6
6 2
.15
6.2
3 0
.75
n/a
-2
.04
7
.45
9.1
6 4
.00
5.0
8 n
/a
4.1
0 n
/a
0.5
4
n/a
n
/a
n/a
n
/a
n/a
n
/a
n/a
n
/a
(=)
Ne
t va
lue
add
ed
0.3
0 0
.57
0.1
4 0
.47
0.5
8 -0
.25
n/a
0
.03
0
.36
0.9
0 0
.33
0.7
1 n
/a
0.2
0 n
/a
-0.4
2
n/a
n
/a
n/a
n
/a
n/a
n
/a
n/a
n
/a
Avg
. % a
ctiv
ely
man
aged
8
89
%
10
0%
7
7%
1
00
%
90
%
10
0%
n
/a
79
%
5
0%
1
00
%
95
%
10
0%
n
/a
10
0%
n
/a
64
%
n
/a
n/a
n
/a
n/a
n
/a
n/a
n
/a
n/a
Stan
dar
d d
evia
tio
n9
18
.28
21
.73
5.3
3 7
.25
21
.42
22
.19
n/a
1
7.1
4
19
.71
20
.26
3.2
0 8
.49
n/a
2
1.8
3 n
/a
13
.22
n
/a
n/a
n
/a
n/a
n
/a
n/a
n
/a
n/a
Vo
lati
lity1
0
18
.53
27
.31
6.4
1 1
1.4
4 2
2.8
5 2
3.5
5 n
/a
20
.11
2
0.2
9 2
3.2
9 4
.24
10
.66
n/a
2
5.4
9 n
/a
19
.43
n
/a
n/a
n
/a
n/a
n
/a
n/a
n
/a
n/a
Shar
pe
rati
o1
1
0.2
8 0
.32
0.5
8 -0
.03
0.2
5 0
.03
n/a
-0
.31
0
.31
0.4
4 0
.53
0.3
8 n
/a
0.1
8 n
/a
-0.1
7
n/a
n
/a
n/a
n
/a
n/a
n
/a
n/a
n
/a
Tab
le 9
B. ‘
Stan
dar
diz
ed
’ ne
t re
turn
s su
mm
ary
stat
isti
cs b
y ag
gre
gate
ass
et
clas
s an
d b
y re
gio
n, 2
00
8-2
01
6
Du
tch
fu
nd
s
(per
cen
t, t
rue-
tim
e w
eig
hte
d)
O
ther
Eu
ro a
rea¹
fu
nd
s
(per
cen
t, t
rue-
tim
e w
eig
hte
d)
U
.K. f
un
ds
(p
erce
nt,
tru
e-ti
me
we
igh
ted
)
Stat
isti
c
Pu
blic
eq
uit
y P
riva
te
equ
ity
Fixe
d
inco
me
Hed
ge
fun
ds
List
ed
real
es
tate
Un
- lis
ted
re
al
esta
te
Un
- lis
ted
in
fra.
O
ther
Pu
blic
eq
uit
y P
riva
te
equ
ity
Fixe
d
inco
me
Hed
ge
fun
ds
List
ed
real
es
tate
Un
- lis
ted
re
al
esta
te
Un
- lis
ted
in
fra.
O
ther
Pu
blic
eq
uit
y P
riva
te
equ
ity
Fixe
d
inco
me
Hed
ge
fun
ds
List
ed
real
es
tate
Un
- lis
ted
re
al
esta
te
Un
- lis
ted
in
fra.
O
ther
Ari
thm
etic
avg
. gro
ss r
et.1
7
.27
14
.50
7.1
6 4
.09
7.8
1 5
.25
7.1
6 -3
.35
7
.87
15
.37
5.2
1 7
.72
5.8
3 7
.87
7.0
5 -2
.09
9
.19
20
.35
7.4
0 4
.56
n/a
5
.67
7.0
2 7
.02
(-)
A
vg. c
ost
2,3
,4
0.0
7 4
.54
0.0
6 2
.61
0.2
8 1
.14
1.5
9 0
.31
0
.12
3.8
2 0
.04
2.5
8 0
.24
0.4
6 1
.50
0.6
4
0.1
1 4
.15
0.0
5 2
.27
n/a
0
.69
1.8
7 1
.00
(=)
A
rith
met
ic a
vg. n
et r
et.
5
7.2
0 9
.96
7.1
0 1
.48
7.5
2 4
.12
5.5
7 -3
.66
7
.75
11
.55
5.1
7 5
.14
5.5
9 7
.41
5.5
5 -2
.74
9
.09
16
.20
7.3
5 2
.29
n/a
4
.97
5.1
5 6
.02
Geo
met
ric
avg.
net
re
t.6
4.8
7 7
.16
6.9
6 1
.21
5.1
3 1
.73
4.5
4 -4
.94
5
.09
9.2
4 5
.12
4.6
8 4
.55
5.2
9 4
.32
-3.3
2
7.8
8 1
0.1
8 7
.17
2.2
1 n
/a
2.5
6 3
.82
5.5
5
(-)
Geo
. avg
. ben
chm
ark
ret.
7
4.6
2 6
.68
6.8
6 0
.91
4.9
4 2
.65
5.2
7 -5
.04
4
.71
8.6
6 4
.72
4.0
4 4
.97
5.5
2 5
.74
-2.5
5
7.1
2 1
1.0
3 6
.94
2.0
3 n
/a
3.7
6 4
.17
4.3
5
(=)
Ne
t va
lue
add
ed
0.2
5 0
.48
0.1
0 0
.30
0.1
9 -0
.92
-0.7
3 0
.10
0
.38
0.5
8 0
.40
0.6
4 -0
.42
-0.2
2 -1
.41
-0.7
7
0.7
6 -0
.86
0.2
2 0
.18
n/a
-1
.19
-0.3
5 1
.21
Avg
. % a
ctiv
ely
man
aged
8
90
%
10
0%
7
5%
1
00
%
88
%
10
0%
1
00
%
77
%
4
9%
1
00
%
95
%
10
0%
7
8%
1
00
%
10
0%
6
7%
66
%
10
0%
7
6%
1
00
%
n/a
1
00
%
10
0%
7
5%
Stan
dar
d d
evia
tio
n9
19
.93
23
.68
5.3
9 7
.13
20
.39
22
.56
14
.04
15
.19
2
1.6
0 2
1.5
3 3
.28
9.5
6 1
3.9
5 2
0.9
4 1
5.7
5 1
0.2
4
15
.50
39
.20
6.2
7 3
.86
n/a
2
1.4
4 1
5.5
3 9
.95
Vo
lati
lity1
0
20
.15
27
.18
6.8
0 1
1.9
6 2
1.7
4 2
3.9
1 1
6.9
8 1
8.0
3
22
.13
23
.65
4.5
0 1
1.7
6 1
6.9
5 2
4.3
3 1
7.2
2 1
6.4
6
15
.90
40
.20
8.3
2 6
.37
n/a
2
2.2
5 1
7.5
8 2
1.7
4
Shar
pe
rati
o1
1
(in
suff
icie
nt
dat
a h
isto
ries
)
(in
suff
icie
nt
dat
a h
isto
ries
)
(in
suff
icie
nt
dat
a h
isto
ries
)

CEM Benchmarking Inc. 26
Ta
ble
9C
. ‘St
and
ard
ize
d’ n
et
retu
rns
sum
mar
y st
atis
tics
by
aggr
ega
te a
sse
t cl
ass
and
by
regi
on
, 20
10
-20
16
Du
tch
fu
nd
s (p
erce
nt,
tru
e-ti
me
we
igh
ted
)
Oth
er E
uro
are
a¹ f
un
ds
(per
cen
t, t
rue-
tim
e w
eig
hte
d)
U
.K. f
un
ds
(per
cen
t, t
rue-
tim
e w
eig
hte
d)
Stat
isti
c
Pu
blic
eq
uit
y P
riva
te
equ
ity
Fixe
d
inco
me
Hed
ge
fun
ds
List
ed
real
es
tate
Un
- lis
ted
re
al
esta
te
Un
- lis
ted
in
fra.
O
ther
Pu
blic
eq
uit
y P
riva
te
equ
ity
Fixe
d
inco
me
Hed
ge
fun
ds
List
ed
real
es
tate
Un
- lis
ted
re
al
esta
te
Un
- lis
ted
in
fra.
O
ther
Pu
blic
eq
uit
y P
riva
te
equ
ity
Fixe
d
inco
me
Hed
ge
fun
ds
List
ed
real
es
tate
Un
- lis
ted
re
al
esta
te
Un
- lis
ted
in
fra.
O
ther
Ari
thm
etic
avg
. gro
ss r
et.1
1
0.3
3 1
4.7
5 6
.78
5.0
5 1
1.1
7 3
.80
8.9
1 -1
.62
1
0.5
9 1
6.3
8 4
.83
8
.65
10
.17
7.6
6 7
.65
-0.2
4
10
.86
15
.00
8.2
2 6
.40
11
.71
6.4
7 9
.76
3.3
2
(-)
A
vg. c
ost
2,3
,4
0.0
7 4
.54
0.0
6 2
.61
0.2
8 1
.14
1.5
9 0
.31
0
.12
3.8
2 0
.04
2
.58
0.2
4 0
.46
1.5
0 0
.64
0
.11
4.1
5 0
.05
2.2
7 0
.78
0.6
9 1
.87
1.0
0
(=)
A
rith
met
ic a
vg. n
et r
et.
5
10
.26
10
.21
6.7
3 2
.43
10
.88
2.6
6 7
.32
-1.9
3
10
.47
12
.55
4.7
9
6.0
7 9
.93
7.2
1 6
.15
-0.8
9
10
.76
10
.86
8.1
7 4
.13
10
.93
5.7
7 7
.89
2.3
2
Geo
met
ric
avg.
net
re
t.6
9.9
4 9
.60
6.5
6 2
.37
10
.43
1.8
7 7
.07
-2.6
3
9.8
8 1
1.8
5 4
.74
6
.01
9.5
5 6
.72
5.7
0 -1
.08
1
0.3
1 9
.10
7.9
6 4
.11
10
.44
5.2
6 7
.58
2.0
1
(-)
Geo
. avg
. ben
chm
ark
ret.
7
9.5
4 1
0.2
2 6
.36
2.2
3 1
0.4
5 2
.34
6.8
2 -2
.57
9
.68
11
.80
4.3
3
5.1
0 9
.29
6.1
2 6
.21
-0.4
0
9.9
9 9
.96
7.6
1 2
.75
11
.90
5.5
4 7
.65
1.8
8
(=)
Ne
t va
lue
add
ed
0.4
0 -0
.63
0.2
0 0
.14
-0.0
3 -0
.47
0.2
5 -0
.06
0
.21
0.0
5 0
.40
0
.91
0.2
6 0
.60
-0.5
2 -0
.67
0
.32
-0.8
6 0
.34
1.3
6 -1
.46
-0.2
8 -0
.07
0.1
4
Avg
. % a
ctiv
ely
man
aged
8
91
%
10
0%
7
1%
1
00
%
85
%
10
0%
1
00
%
73
%
4
9%
1
00
%
96
%
10
0%
8
1%
1
00
%
10
0%
7
0%
81
%
10
0%
7
4%
1
00
%
10
0%
1
00
%
10
0%
9
2%
Stan
dar
d d
evia
tio
n9
8.1
1 1
1.2
4 5
.93
3.5
7 1
0.1
4 1
2.8
3 7
.33
11
.71
1
0.8
5 1
2.1
3 3
.24
3
.59
9.1
3 1
0.2
5 9
.83
6.2
8
9.8
3 1
9.0
5 6
.85
1.8
9 1
0.5
5 1
0.5
5 8
.27
8.0
2
Vo
lati
lity1
0
8.6
1 1
7.1
1 6
.68
10
.09
11
.81
14
.77
10
.26
13
.97
1
1.8
5 1
5.6
9 4
.44
6
.34
11
.14
14
.81
11
.96
14
.55
1
0.4
6 2
1.0
3 8
.31
4.9
4 1
0.9
6 1
2.5
5 1
1.6
8 2
0.9
3
Shar
pe
rati
o1
1
(in
suff
icie
nt
dat
a h
isto
ries
)
(in
suff
icie
nt
dat
a h
isto
ries
)
(in
suff
icie
nt
dat
a h
isto
ries
)
1. A
rith
met
ic a
vera
ge (
i.e.,
sim
ple
ave
rage
) gr
oss
ret
urn
is t
he
arit
hm
etic
ave
rage
gro
ss r
etu
rn im
plie
d b
y th
e 3
-yea
r av
erag
e co
st a
nd
7-y
ear
arit
hm
etic
ave
rage
net
re
turn
. Fo
r u
nlis
ted
ass
ets,
th
e ar
ith
met
ic a
vera
ge g
ross
ret
urn
her
e is
larg
er t
han
th
e ar
ith
met
ic a
vera
ge g
ross
ret
urn
rep
ort
ed
to
CEM
ben
chm
arki
ng
bec
ause
of
un
rep
ort
ed p
erfo
rman
ce f
ees.
2
. Th
e av
erag
e in
vest
men
t co
st f
or
each
ass
et c
lass
incl
ud
e b
oth
low
co
st im
ple
men
tati
on
sty
les
(e.g
., in
dex
ed in
tern
ally
man
aged
pu
blic
eq
uit
y) a
nd
hig
h c
ost
imp
lem
enta
tio
n s
tyle
s (e
.g.,
fu
nd
-of-
fun
d
pri
vate
eq
uit
y). A
ctu
al c
ost
s fo
r an
y p
arti
cula
r fu
nd
can
ran
ge s
ub
stan
tial
ly f
rom
th
ose
sh
ow
n b
ased
up
on
ind
ivid
ual
imp
lem
enta
tio
n s
tyle
. 3
. In
vest
men
t co
sts
incl
ud
e in
tern
al c
ost
s, m
anag
er b
ase
fees
an
d p
erfo
rman
ce f
ees
for
exte
rnal
man
dat
es, c
arri
ed in
tere
st f
or
un
liste
d in
vest
men
ts, a
nd
un
der
lyin
g b
ase
fees
plu
s p
erfo
rman
ce f
ees
for
fun
d-o
f-fu
nd
un
liste
d in
vest
men
ts.
4. T
he
aver
age
esti
mat
ed in
vest
men
t co
st f
or
each
ass
et
clas
s is
cal
cula
ted
fro
m t
he
aver
age
of
the
med
ian
an
nu
al in
vest
men
t co
st s
pan
nin
g th
e la
st t
hre
e ye
ars
of
the
stu
dy,
20
14
-20
16.
Th
e m
edia
n is
u
sed
to
rem
ove
ou
tlie
rs in
un
liste
d a
sset
cla
sses
wh
ere
cost
s ca
n b
e ve
ry la
rge
rela
tive
to
th
e p
rop
ort
ion
of
asse
ts o
n a
net
ass
et
valu
e b
asis
. Th
e av
erag
e in
vest
men
t co
st is
on
ly c
alcu
late
d o
ver
the
pas
t th
ree
year
s b
ecau
se p
erfo
rman
ce f
ees
and
un
der
lyin
g fe
es f
or
un
liste
d a
sset
cla
sses
we
re n
ot
rep
ort
ed o
n a
co
nsi
sten
t b
asis
to
CEM
pri
or
to t
his
per
iod
. 5
. Ari
thm
etic
ave
rage
net
ret
urn
is t
he
sim
ple
ave
rage
of
the
ann
ual
fu
nd
-ave
rage
net
ret
urn
s ap
pea
rin
g in
Tab
le 8
A.
6. G
eom
etri
c av
erag
e n
et r
etu
rn is
th
e av
erag
e co
mp
ou
nd
net
re
turn
of
the
ann
ual
fu
nd
-ave
rage
net
re
turn
s ap
pea
rin
g in
Tab
le 8
A. A
ctu
al a
nn
ual
ne
t re
turn
s ex
per
ien
ced
by
fun
ds
will
typ
ical
ly b
e sm
alle
r th
an t
he
geo
met
ric
aver
age
net
ret
urn
rep
ort
ed h
ere
bec
ause
of
retu
rn d
rag
cau
sed
by
idio
syn
crat
ic r
isk
(i.e
., im
ple
men
tati
on
ris
k) c
ause
d b
y ac
tive
man
agem
ent.
7
. Geo
met
ric
aver
age
ben
chm
ark
retu
rn is
th
e av
erag
e co
mp
ou
nd
ben
chm
ark
retu
rn im
plie
d b
y th
e ge
om
etri
c av
erag
e n
et r
etu
rn a
nd
th
e n
et v
alu
e a
dd
ed b
y ag
greg
ate
asse
t cl
ass
rep
ort
ed t
o C
EM
ben
chm
arki
ng;
it is
no
t n
eces
sari
ly t
he
actu
al g
eom
etri
c av
erag
e b
ench
mar
k re
turn
of
any
par
ticu
lar
inve
stib
le b
ench
mar
k.
8. A
vera
ge p
rop
ort
ion
act
ivel
y m
anag
ed is
th
e av
erag
e ra
tio
of
a fu
nd
’s a
sset
s th
at a
re a
ctiv
ely
man
aged
in a
n a
ctiv
e at
tem
pt
to o
utp
erfo
rm a
mar
ket
cap
ital
izat
ion
-wei
ghte
d in
dex
rel
ativ
e t
o t
ota
l ass
ets.
Sm
art-
bet
a st
rate
gies
are
co
nsi
der
ed a
ctiv
ely
man
aged
. Act
ivel
y m
anag
ed f
ract
ion
fo
r u
nlis
ted
ass
ets
is 1
00
%.
9. S
tan
dar
d d
evia
tio
n is
th
e p
op
ula
tio
n s
tan
dar
d d
evia
tio
n o
f th
e fu
nd
-ave
rage
net
ret
urn
s ap
pea
rin
g in
Tab
le 8
A. A
ctu
al s
tan
dar
d d
evia
tio
ns
of
ann
ual
net
ret
urn
s ex
per
ien
ced
by
fun
ds
will
typ
ical
ly b
e la
rger
th
an t
hat
rep
ort
ed h
ere
bec
ause
of
idio
syn
crat
ic r
isk
(i.e
., im
ple
men
tati
on
ris
k) c
ause
d b
y ac
tive
man
agem
ent.
1
0. V
ola
tilit
y is
an
est
imat
e o
f th
e av
era
ge s
tan
dar
d d
evia
tio
n e
xper
ien
ced
by
actu
al f
un
ds
du
e to
yea
r-to
-yea
r fl
uct
uat
ion
s in
agg
rega
te a
sset
cla
ss n
et
retu
rns
(i.e
., s
tan
dar
d d
evia
tio
n)
and
in-y
ear
flu
ctu
atio
ns
in a
ggre
gate
ass
et c
lass
net
ret
urn
s fr
om
Tab
le 8
B (
i.e.,
idio
syn
crat
ic r
isk)
. 1
1. S
har
pe
rati
o is
exc
ess
geo
met
ric
aver
age
net
ret
urn
re
lati
ve t
o r
isk-
free
ret
urn
s d
ivid
ed b
y ex
cess
vo
lati
lity
rela
tive
to
ris
k-fr
ee r
etu
rns.
Th
e ri
sk-f
ree
rate
use
d f
or
fun
ds
in t
he
U.K
. is
the
th
ree
-mo
nth
U
.K. m
on
ey m
arke
t ra
te a
nd
fo
r D
utc
h a
nd
oth
er E
uro
are
a Fu
nd
s th
e th
ee-m
on
th E
uro
inte
rban
k o
ffer
ed r
ate.
Sh
arp
e ra
tio
s ar
e n
ot
sho
wn
fo
r th
e p
eri
od
s 2
00
8-2
01
6 a
nd
20
10-
20
16
du
e to
insu
ffic
ien
t d
ata
his
tori
es.

27 CEM Benchmarking Inc.
Comparison between as-reported and standardized aggregate asset class data
The only differences in the data appearing in Tables 6 and 7 (i.e., “as-reported”) in comparison to their unbiased counterparts in Tables 8 and 9 (i.e., “standardized returns”) are for unlisted aggregate asset classes – private equity, unlisted real estate, and unlisted infrastructure – due to the removal of lag as described in Appendix A. Differences between the biased summaries (i.e., Tables 7 A-C) and unbiased summaries (Tables 9 A-C) are discussed in the remainder of this section. Readers only interested in discussion of unbiased summaries should feel free to progress to Section 5.
4.4.1 Average return comparisons: as-reported vs. standardized data
Private equity – arithmetic average net returns for Dutch funds decreased only marginally, from 10.91 percent to 10.78 percent (2005-2016) upon standardization; this is consistent with their being only one to two quarters of lag in the data, and so the adjustment of the data by only a few months over a 12-year history has only a minor effect on returns. Likewise, other Euro area private equity returns display only marginal changes as well, from 10.93 percent to 12.08 percent (2005-2016). U.K. private equity data on the other hand saw restatement of average return from 11.30 percent to an impressive 16.20 percent (2008-2016).
(We caution that the arithmetic net return of U.K. private equity over the 2008-2016 period, the largest annual average found in this study, is paired with the largest volatility as discussed in Section 5.4.2. Furthermore, because one cannot readily rebalance unlisted assets at marked-to-market prices, geometric net return is a more appropriate gauge of performance for them. Given that geometric return is short volatility, the large arithmetic average return of U.K. private equity over the 2008-2016 period is reduced by almost half from 16.20 percent to 10.18 percent due to compounding.)
Unlisted real estate – arithmetic average net returns over the longest available periods saw generally minor changes in value, being revised downward from 5.44 percent to 2.89 percent for Dutch funds (2005-2016) and from 8.11 percent to 6.67 percent for other Euro area funds (2005-2016) while being revised upward from 2.30 percent to 4.97 percent for U.K. funds (2008-2016) post-standardization.
Unlisted infrastructure – arithmetic average net returns all experienced small upwards revisions, from 5.25 percent to 5.57 percent for Dutch funds (2008-2015), from 4.43 percent to 5.55 percent for other Euro area funds (2008-2015), and form 4.32 percent to 5.15 percent for U.K. funds (2008-2015) post-standardization.
4.4.2 Volatility comparisons: as-reported vs. standardized data
The most notable changes that occurs in the data upon standardization of net returns for reporting lag is are large upward re-statements of volatilities. The converse effect, the suppression of volatility due to appraisals is sometimes referred to in the academic literature as appraisal smoothing. Advanced techniques [5] to de-smooth unlisted asset returns series exist, and we have employed these techniques to favorable effect in the past [6].
That said, we have found that de-smoothing the unlisted asset annual average net returns appearing in Table 6 are not warranted provided the inferred lag is removed from the individual fund level data on a fund-by-fund basis [3], as we do here. In this picture, smoothing is largely the result of different funds within a dataset having different lags whereas de-smoothing assumes a single lag for all funds [6] or no lag at all [5]. Thus, the smoothing of fund-averaged returns is caused by each fund’s year-to-year variation in returns that results from the same market events not being recorded contemporaneously which quite naturally leads to smoothed data. A side effect of this smoothing is that the “as reported” volatilities of fund-average unlisted asset class annual returns are not representative of what individual funds experience.
Private equity – as expected, volatilities all increase post-standardization of net returns for the longest histories available for each aggregate asset class/region combination. In the case of Dutch and other Euro area funds, private equity volatilities increased by about 1.5-fold, from 20.86 percent to 27.31 percent (2005-2016) and from 16.61 percent to 23.29 percent (2005-2016) respectively. For U.K funds the increase is far more dramatic, from (an obviously smoothed) 8.89 percent to 40.20 percent (2008-2016), driven largely by the 2009 rebound in post-
CEM Benchmarking Inc. 28
standardized private equity returns which saw a standardized net return in excess of 100 percent preceded by a post-standardized loss in 2008 of nearly -40 percent, comparable to the loss experienced in the U.K. small equity market. (Note the pre-standardized return for 2008 and 2009 of 13.9 percent and -1.0 percent for comparison are obviously smoothed and lagged.)
Unlisted real estate – volatilities increased by 2.5-fold for Dutch funds (2005-2016), from a highly smoothed and unrealistic 9.51 percent to a quite reasonable 23.55 percent, while for other Euro area funds it increased 1.7-fold from 15.16 percent to 25.49 percent (2005-2016). For U.K. funds unlisted real estate volatilities increased 1.7-fold as well, from 13.33 percent to 22.25 percent (2008-2016).
Unlisted infrastructure – volatilities increased by 1.5-fold for Dutch funds, from 11.14 percent to a 16.98 percent (2008-2016), while for other Euro area funds it increased 1.5-fold as well, from 11.33 percent to 17.22 percent (2008-2016). For U.K. funds unlisted infrastructure volatilities increased only 1.3-fold from 13.45 percent to 17.58 percent (2008-2016).
We emphasize once again that the increases in volatilities described here, the result of a transformation of the data which can be thought of as a kind of de-smoothing, is solely the result of lining up the ups and downs of individual fund unlisted asset return histories. By contrast, de-smoothing as traditionally used mathematically amplifies returns in an uncontrolled way via a somewhat arbitrary de-smoothing parameter [5,6].
4.4.3 Correlation comparisons: as-reported vs. standardized data
Correlations between as-reported aggregate asset class net returns for each region group are shown in Table 10 A-C while correlations between post-standardization aggregate asset class net returns for each region group are shown Tables 11 A-C. Here we focus attention to the changes in the data on passing from pre- to post-standardized net returns (i.e., correlations on going from Table 6A to Table 8A).
Private equity – correlation between as-reported private equity net returns (Tables 10 A-C) are notably low in all three regions and increase substantially post-standardization (Tables 11 A-C). As expected, correlations of private equity net returns to public equity net returns post-standardization are high for all regions; 0.93, 0.92 and 0.76 for Dutch, other Euro area, and U.K. funds respectively. Furthermore, correlation between public and post-standardized private equity net returns are the highest correlations of all for Dutch and other Euro area funds, and among the highest for U.K. funds.
Unlisted real estate – correlation between as-reported unlisted real estate net returns is low to all asset classes with the exceptions of private equity (Dutch and other Euro area funds) and unlisted infrastructure (other Euro area and U.K. funds). Post-standardization, correlations between unlisted real estate and other asset classes resemble those of listed real estate for Dutch and other Euro area funds. Post-standardized unlisted real estate returns for U.K. funds appear to correlate to other asset classes similarly as in the other two regions with the exception of listed real estate. As we will discuss in Section 5, this is likely because listed real estate in the U.K. is likely as lagged as unlisted real estate.
Unlisted infrastructure – correlation between as-reported unlisted infrastructure net returns is low to all asset classes for Dutch funds. By contrast, the correlations are high to private equity and unlisted real estate for other Euro area funds, and high to hedge funds and unlisted real estate for U.K. funds. Post-standardization of net returns, correlations rise dramatically. For Dutch funds, the increase in correlation between unlisted infrastructure and unlisted real estate seen elsewhere emerges showing the high degree of similarity between the two asset classes.
5 Unbiased listed and unlisted real estate in institutional portfolios
In this section we compare the standardized aggregate asset class summary data shown in Tables 9 A-C and standardized aggregate asset class correlation data appearing in Table 11 A-C with an emphasis on the listed and unlisted real estate aggregate asset classes.
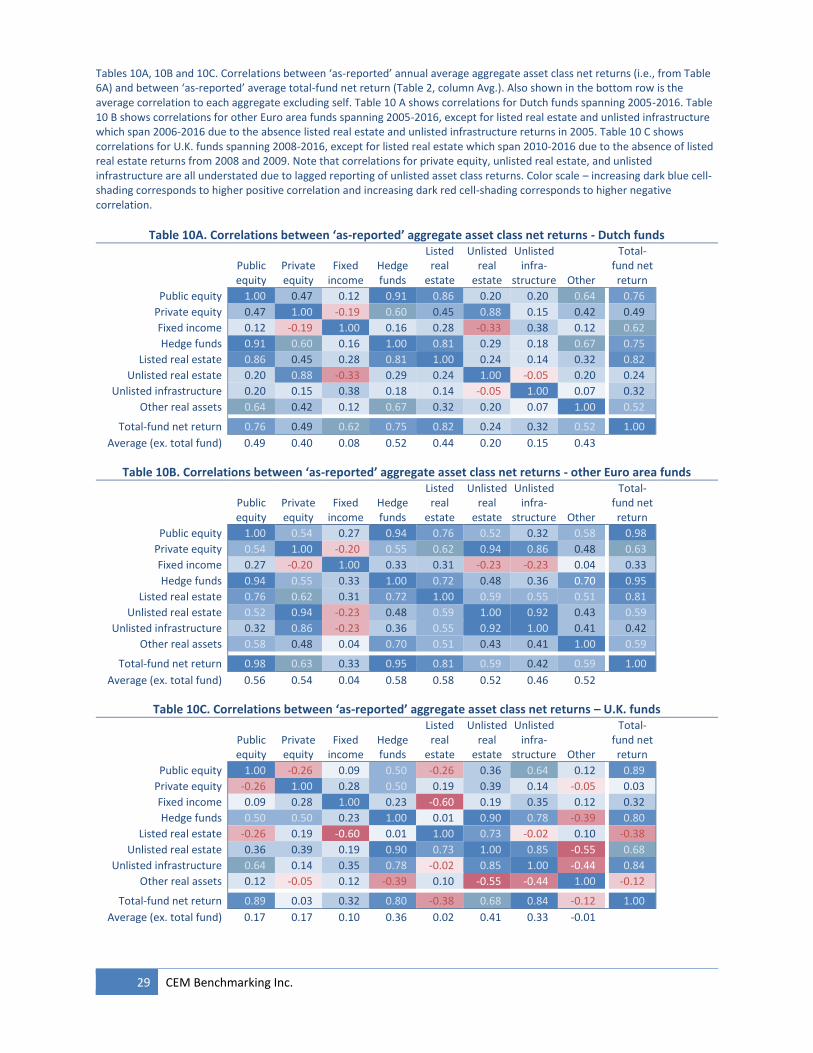
29 CEM Benchmarking Inc.
Tables 10A, 10B and 10C. Correlations between ‘as-reported’ annual average aggregate asset class net returns (i.e., from Table 6A) and between ‘as-reported’ average total-fund net return (Table 2, column Avg.). Also shown in the bottom row is the average correlation to each aggregate excluding self. Table 10 A shows correlations for Dutch funds spanning 2005-2016. Table 10 B shows correlations for other Euro area funds spanning 2005-2016, except for listed real estate and unlisted infrastructure which span 2006-2016 due to the absence listed real estate and unlisted infrastructure returns in 2005. Table 10 C shows correlations for U.K. funds spanning 2008-2016, except for listed real estate which span 2010-2016 due to the absence of listed real estate returns from 2008 and 2009. Note that correlations for private equity, unlisted real estate, and unlisted infrastructure are all understated due to lagged reporting of unlisted asset class returns. Color scale – increasing dark blue cell-shading corresponds to higher positive correlation and increasing dark red cell-shading corresponds to higher negative correlation.
Table 10A. Correlations between ‘as-reported’ aggregate asset class net returns - Dutch funds
Public equity
Private equity
Fixed income
Hedge funds
Listed real
estate
Unlisted real
estate
Unlisted infra-
structure Other
Total-fund net return
Public equity 1.00 0.47 0.12 0.91 0.86 0.20 0.20 0.64 0.76
Private equity 0.47 1.00 -0.19 0.60 0.45 0.88 0.15 0.42 0.49
Fixed income 0.12 -0.19 1.00 0.16 0.28 -0.33 0.38 0.12 0.62
Hedge funds 0.91 0.60 0.16 1.00 0.81 0.29 0.18 0.67 0.75
Listed real estate 0.86 0.45 0.28 0.81 1.00 0.24 0.14 0.32 0.82
Unlisted real estate 0.20 0.88 -0.33 0.29 0.24 1.00 -0.05 0.20 0.24
Unlisted infrastructure 0.20 0.15 0.38 0.18 0.14 -0.05 1.00 0.07 0.32
Other real assets 0.64 0.42 0.12 0.67 0.32 0.20 0.07 1.00 0.52
Total-fund net return 0.76 0.49 0.62 0.75 0.82 0.24 0.32 0.52 1.00
Average (ex. total fund) 0.49 0.40 0.08 0.52 0.44 0.20 0.15 0.43
Table 10B. Correlations between ‘as-reported’ aggregate asset class net returns - other Euro area funds
Public equity
Private equity
Fixed income
Hedge funds
Listed real
estate
Unlisted real
estate
Unlisted infra-
structure Other
Total-fund net return
Public equity 1.00 0.54 0.27 0.94 0.76 0.52 0.32 0.58 0.98
Private equity 0.54 1.00 -0.20 0.55 0.62 0.94 0.86 0.48 0.63
Fixed income 0.27 -0.20 1.00 0.33 0.31 -0.23 -0.23 0.04 0.33
Hedge funds 0.94 0.55 0.33 1.00 0.72 0.48 0.36 0.70 0.95
Listed real estate 0.76 0.62 0.31 0.72 1.00 0.59 0.55 0.51 0.81
Unlisted real estate 0.52 0.94 -0.23 0.48 0.59 1.00 0.92 0.43 0.59
Unlisted infrastructure 0.32 0.86 -0.23 0.36 0.55 0.92 1.00 0.41 0.42
Other real assets 0.58 0.48 0.04 0.70 0.51 0.43 0.41 1.00 0.59
Total-fund net return 0.98 0.63 0.33 0.95 0.81 0.59 0.42 0.59 1.00
Average (ex. total fund) 0.56 0.54 0.04 0.58 0.58 0.52 0.46 0.52
Table 10C. Correlations between ‘as-reported’ aggregate asset class net returns – U.K. funds
Public equity
Private equity
Fixed income
Hedge funds
Listed real
estate
Unlisted real
estate
Unlisted infra-
structure Other
Total-fund net return
Public equity 1.00 -0.26 0.09 0.50 -0.26 0.36 0.64 0.12 0.89
Private equity -0.26 1.00 0.28 0.50 0.19 0.39 0.14 -0.05 0.03
Fixed income 0.09 0.28 1.00 0.23 -0.60 0.19 0.35 0.12 0.32
Hedge funds 0.50 0.50 0.23 1.00 0.01 0.90 0.78 -0.39 0.80
Listed real estate -0.26 0.19 -0.60 0.01 1.00 0.73 -0.02 0.10 -0.38
Unlisted real estate 0.36 0.39 0.19 0.90 0.73 1.00 0.85 -0.55 0.68
Unlisted infrastructure 0.64 0.14 0.35 0.78 -0.02 0.85 1.00 -0.44 0.84
Other real assets 0.12 -0.05 0.12 -0.39 0.10 -0.55 -0.44 1.00 -0.12
Total-fund net return 0.89 0.03 0.32 0.80 -0.38 0.68 0.84 -0.12 1.00
Average (ex. total fund) 0.17 0.17 0.10 0.36 0.02 0.41 0.33 -0.01

CEM Benchmarking Inc. 30
Tables 11A, 11B and 11C. Correlations between ‘standardized’ annual average aggregate asset class net returns (i.e., from Table 8A) and between ‘as-reported’ average total-fund net return (Table 13, column Avg.). Also shown in the bottom row is the average correlation to each aggregate excluding self. Table 11A shows correlations for Dutch funds spanning 2005-2016. Table 11B shows correlations for other Euro area funds spanning 2005-2016, except for listed real estate and unlisted infrastructure which span 2006-2016 due to the absence listed real estate and unlisted infrastructure returns in 2005. Table 11C shows correlations for U.K. funds spanning 2008-2016, except for listed real estate which span 2010-2016 due to the absence of listed real estate returns from 2008 and 2009. Note that correlations for private equity, unlisted real estate, and unlisted infrastructure are greater than what funds report due to lagged reporting (compare with Tables 10A, 10B and 10C). Color scale – increasing dark blue cell-shading corresponds to higher positive correlation and increasing dark red cell-shading corresponds to higher negative correlation.
Table 11A. Correlations between standardized aggregate asset class net returns - Dutch funds
Public equity
Private equity
Fixed income
Hedge funds
Listed real
estate
Unlisted real
estate
Unlisted infra-
structure Other
Total-fund net return
Public equity 1.00 0.93 0.12 0.91 0.86 0.76 0.73 0.64 0.81
Private equity 0.93 1.00 0.06 0.77 0.83 0.86 0.67 0.50 0.70
Fixed income 0.12 0.06 1.00 0.16 0.28 0.37 0.56 0.12 0.62
Hedge funds 0.91 0.77 0.16 1.00 0.81 0.64 0.62 0.66 0.76
Listed real estate 0.86 0.83 0.28 0.81 1.00 0.88 0.66 0.31 0.88
Unlisted real estate 0.76 0.86 0.37 0.64 0.88 1.00 0.67 0.16 0.79
Unlisted infrastructure 0.73 0.67 0.56 0.62 0.66 0.67 1.00 0.40 0.81
Other real assets 0.64 0.51 0.12 0.67 0.32 0.16 0.40 1.00 0.49
Total-fund net return 0.81 0.70 0.62 0.76 0.88 0.79 0.81 0.49 1.00
Average (ex. total fund) 0.71 0.66 0.24 0.66 0.66 0.62 0.62 0.47
Table 11B. Correlations between standardized aggregate asset class net returns - other Euro area funds
Public equity
Private equity
Fixed income
Hedge funds
Listed real
estate
Unlisted real
estate
Unlisted infra-
structure Other
Total-fund net return
Public equity 1.00 0.92 0.27 0.94 0.76 0.80 0.74 0.58 0.99
Private equity 0.92 1.00 0.31 0.85 0.58 0.88 0.70 0.33 0.93
Fixed income 0.27 0.31 1.00 0.33 0.31 0.51 0.37 0.04 0.38
Hedge funds 0.94 0.85 0.33 1.00 0.72 0.72 0.68 0.70 0.95
Listed real estate 0.76 0.58 0.31 0.72 1.00 0.58 0.63 0.51 0.78
Unlisted real estate 0.80 0.88 0.51 0.72 0.58 1.00 0.84 0.07 0.85
Unlisted infrastructure 0.74 0.70 0.37 0.68 0.63 0.84 1.00 0.25 0.78
Other real assets 0.58 0.33 0.04 0.70 0.51 0.07 0.25 1.00 0.54
Total-fund net return 0.99 0.93 0.38 0.95 0.78 0.85 0.78 0.54 1.00
Average (ex. total fund) 0.72 0.65 0.30 0.71 0.58 0.63 0.60 0.43
Table 11C. Correlations between standardized aggregate asset class net returns – U.K. funds
Public equity
Private equity
Fixed income
Hedge funds
Listed real
estate
Unlisted real
estate
Unlisted infra-
structure Other
Total-fund net return
Public equity 1.00 0.76 0.09 0.50 -0.26 0.81 0.87 0.12 0.96
Private equity 0.76 1.00 -0.31 -0.05 0.32 0.86 0.63 0.24 0.63
Fixed income 0.09 -0.31 1.00 0.23 -0.60 -0.04 0.27 0.12 0.22
Hedge funds 0.50 -0.05 0.23 1.00 0.01 0.21 0.54 -0.39 0.67
Listed real estate -0.26 0.32 -0.60 0.01 1.00 -0.09 -0.04 0.10 -0.39
Unlisted real estate 0.81 0.86 -0.04 0.21 -0.09 1.00 0.86 0.01 0.78
Unlisted infrastructure 0.87 0.63 0.27 0.54 -0.04 0.86 1.00 0.08 0.90
Other real assets 0.12 0.24 0.12 -0.39 0.10 0.01 0.08 1.00 -0.06
Total-fund net return 0.96 0.63 0.22 0.67 -0.39 0.78 0.90 -0.06 1.00
Average (ex. total fund) 0.41 0.35 -0.03 0.15 -0.08 0.37 0.46 0.16

31 CEM Benchmarking Inc.
An important consideration when comparing the data across regions concerns the impact of currency return. For example, a U.K. fund and a Dutch fund could have the exact same investments and implementation in a foreign asset class but produce different returns in their home currencies because of differences in foreign exchange rates. As such, the returns of U.K. funds (returns reported in £), Dutch funds (returns reported in €), and other Euro area funds (generally reported €) should not be compared directly.
However, trends in return across regions can be a source of information. For example, that the arithmetic net return of listed real estate is higher than the comparable arithmetic net return of unlisted real estate across all regions and time periods apart from one (other Euro area funds, 2008-2016) is a clear pattern.
Arithmetic average gross and net returns
Arithmetic average return appearing in Tables 9A-C refers to the return calculated from the simple average of annual fund averaged returns appearing in Table 8A. The simple average return is always larger than the geometric average return since geometric average returns are short the standard deviation (which is always greater than zero). The interest in arithmetic averages over geometric averages is that the achieved return within an asset class will lie somewhere between the arithmetic average return and the geometric average return due to rebalancing.
The longest sample period of 2005-2016 contains both listed and unlisted real estate data only for the sample of Dutch funds. Here, listed real estate provided the second highest arithmetic average gross return at 9.60 percent and the second highest arithmetic net return as well of 9.32 percent. The best performing asset class was private equity. Unlisted real estate on the other hand had the second lowest arithmetic average gross return of 4.03 percent and tied for second lowest arithmetic average net return of 2.89 percent, tied with hedge funds but ahead of “other”. The difference in performance between listed and unlisted versions of real estate owe to differences in investments both by region and sector, differences in leverage, as well as the higher investment cost for unlisted real estate of 1.14 percent compared to that of listed real estate at only 0.28 percent, similar to the real estate investment costs in the U.S. [3].
The sample period 2008-2016 contains both listed and unlisted real estate data for the Dutch and other Euro area funds sample groups. The period is very interesting because it begins with the 2008 crash in asset prices following the global financial crisis. Over the sample period, listed real estate for Dutch funds once again displayed the second highest arithmetic average gross return, 7.81 percent, and the second highest arithmetic average net return, 7.52 percent, both behind private equity. Unlisted real estate again underperformed listed real estate, with gross and net arithmetic average returns of 5.25 percent and 4.12 percent, third lowest of the aggregate asset classes, and ahead of hedge funds and “other”.
For other Euro area funds in the sample period 2008-2016 the relationship between listed and unlisted real estate experienced by Dutch funds is reversed. Here, listed real estate displayed gross and net arithmetic average returns of 5.83 percent and 5.59 percent compared to 7.87 percent and 7.41 percent for unlisted real estate. On a net basis, this placed listed and unlisted real estate as the fourth and third best performing asset classes over the sample period for other Euro area funds. Interestingly, the cost of unlisted real estate for other Euro area funds was only 0.46 percent, much lower than in the Netherlands due to more internal and direct implementation. The difference in return can be attributed to the substantial rebound in unlisted real estate returns in 2009 that apparently did not occur in the realized listed real estate portfolios since, as we will discuss, the 2010-2016 sample period displays outperformance of listed vs. unlisted real estate.
For the 2010-2016 sample period, the pattern of results was similar to the longer 2005-2016 and 2008-2016 sample periods for Dutch funds with listed real estate having better returns than unlisted real estate. For both the Dutch and U.K. funds samples, listed real estate had the second highest arithmetic average gross returns behind private equity, but the highest arithmetic average net returns at 10.88 percent and 10.93 percent. Unlisted real estate for Dutch and U.K. funds was the third worst performing aggregate asset class at 2.66 percent and 5.77 percent, outperforming in both cases hedge funds and “other”.

CEM Benchmarking Inc. 32
Cost
The average investment cost by aggregate asset class presented in Table 9A-C is estimated from the most recent three years of fund data. The reason for estimating cost in this way is to maintain consistency across asset classes (only in the past three years have funds been providing CEM with accurate performance fees / carried interest in unlisted asset classes). The estimated investment cost includes: (i) internal front-office trading costs, (ii) external base manager fees, (iii) external performance fees, (iv) private equity carried interest, (v) trading costs, (vi) internal oversight costs.
The most expensive asset class by far is private equity at 4.52 percent for Dutch funds, 3.82 percent for other Euro area funds, and 4.15 percent for U.K. funds. Differences in private equity costs across regions are caused for the most part by differences in implementation style. For example, internally managed private equity costs roughly one tenth of what fund-of-fund private equity costs. The second most expensive asset class are hedge funds at 2.61 percent for Dutch funds, 2.58 percent for other Euro area funds, and 2.27 percent for U.K. funds. In both cases – private equity and hedge funds – investment costs comprise a significant proportion of the gross return.
Real estate by contrast is typically much less expensive. Listed real estate costs of 0.28 percent for Dutch funds and 0.24 percent for other Euro area funds are of similar magnitude than public equity and fixed income. In comparison, unlisted real estate costs of 1.14 percent for Dutch funds is closer to that of infrastructure. For other Euro area funds unlisted real estate costs are less, 0.46 percent. The lower unlisted real estate cost for other Euro area funds is due to a greater usage of lower cost internal management (42 percent vs. only 13 percent – see Section 2).
For U.K. funds listed real estate costs are close to that of unlisted real estate costs, 0.78 percent and 0.69 percent respectively. Indeed, the reported U.K. listed real estate cost (0.78 percent) is higher than expected given the experience of Dutch funds (0.28 percent), other Euro area funds (0.24 percent), and also U.S. funds (0.51 percent) [see Ref. 3]. The high reported cost of listed real estate for U.K. funds together with other details presented shortly (correlations, benchmarks) suggests that some intermixing of listed and unlisted real estate data occurs in the U.K.
Geometric average net returns, benchmark returns and net value added
Geometric average net return is the return an investor would achieve per asset class in the absence of rebalancing. It is the relevant parameter when determining net value added; the difference between the return of an aggregate asset class and an appropriately chosen benchmark. In addition to geometric average net returns, benchmark returns, and value added, we also show the average proportion of the asset class managed actively in an attempt to beat the benchmark. If passive investing were costless and had zero tracking error (i.e., had a net value added of zero), the net value added from active management would be the net value added of the aggregate asset class divided by the proportion of active management.
Over the full sample period 2005-2016, listed real estate returns for the sample of Dutch funds was the third best performing aggregate asset class in terms of geometric average net return at 6.82 percent. This compares to the arithmetic average net return of 9.32 percent. The gap between the two statistics is due to the high standard deviation of the aggregate asset classes returns discussed in the next sub-section. The geometric average net return for unlisted real estate drops was only 0.50 percent, second lowest among aggregate asset classes, ahead of “other”. The difference between the arithmetic and geometric net return for unlisted real estate is nearly identical to that of listed real estate due to the similar volatilities of the two aggregate asset classes.
Listed real estate showed the greatest net value added at 0.58 percent, a statistic which quantifies the ability of active managers to outperform their benchmark. This achievement is notable in that the net value added of private equity and hedge funds at 0.57 percent and 0.47 percent are chronically overstated due to issues with bad benchmark selection [4,7].
Over the sample period 2008-2016, listed and unlisted real estate for Dutch funds performed similarly as in the longer sample period; third highest at 5.13 percent for listed real estate and third worst at 1.73 percent for unlisted real estate. By contrast, for other Euro area funds the result was reversed with unlisted real estate outperforming unlisted real estate, but only by a slim margin of 5.29 percent versus 4.55 percent. That said, only private equity distinguished itself with a geometric net return of 8.75 percent with all other aggregate asset classes apart from

33 CEM Benchmarking Inc.
“other” displaying average geometric net returns between 5.29 percent (unlisted real estate) and 4.32 percent (unlisted infrastructure). The spread between these values is small enough that conclusions about relative performance are not statistically meaningful.
Over the sample period 2010-2016, listed real estate had the highest geometric average net return of all aggregate asset classes for both Dutch funds at 10.43 percent and for U.K. funds at 10.44 percent. In comparison, unlisted real estate had the second lowest geometric average net return for Dutch funds at 1.87 percent and for U.K. funds at 5.26 percent. For other Euro area funds listed real estate outperformed unlisted real estate unlike over the longer 2008-2016 period, having the third highest geometric average net return at 9.55 percent compared to unlisted real estate which had the fourth highest geometric average net return at 6.72 percent.
Interestingly, while listed real estate had the highest geometric average net return for U.K. funds over the 2010-2016 sample period, it also had the lowest net value added of any aggregate asset class over any sample period and for any region sample at -1.46 percent. This shows that a simple, low cost passive investment in listed real estate in the U.K. over 2010-2016 would have been an even better investment with a percent geometric average net return of 11.90 percent available.
Risk
Standard deviation in Tables 7 A-C and 9 A-C refer are the population standard deviations of fund averaged annual returns appearing in Tables 6A and 8A respectively. It does not represent the standard deviation or risk an individual fund would experience because the distributions of returns within an annual average can themselves be broad (see Tables 6B or 8B), especially in unlisted asset classes. We estimate the contribution to investor risk from idiosyncratic / implementation risk caused by active management by quadrature10 in the statistic shown at the bottom of Tables 7 A-C and 9 A-C called volatility. Volatility is the expected population standard deviation of aggregate asset class annual returns a typical fund included in the appropriate sample period / region would observe.
The most notable trend in the volatility data shown in Tables 9A-C, a trend which spans nearly all time period / region samples, is that private equity is the most volatile aggregate asset class and unlisted real estate the second most volatile. The only exceptions to this are the 2005-2016 sample period of other Euro area funds where the order is reversed, and the 2010-2016 sample period of U.K. funds where “other” was the second most volatile aggregate asset class.
The magnitudes of the volatilities are quite sensitive to sample period. Over the smaller sample periods the measures are unreliable predictors of long term volatilities. However, the relative magnitudes of aggregate asset class volatility within time periods appear well preserved; fixed income and hedge funds tend to be least volatile and private equity and unlisted real estate most volatile.
Listed real estate tends to be either the third most volatile aggregate asset class (2005-2016 and 2008-2016 sample periods of Dutch funds, or fourth most volatile (2008-2016, other Euro area funds) aggregate asset class. In the shortest sample period of 2010-2016 listed real estate ranges from fourth to sixth most volatile, but the measure is once again likely unreliable over such short-time spans.
We remark that the volatilities reported here for public equity and fixed income are somewhat lower than for the components of the aggregate asset classes. The reason is straightforward; since we have aggregated all public equity into one public equity aggregate and all fixed income into one fixed income asset class, diversification will have reduced the volatility of the aggregates relative to the components.
10 Quadrature refers to the summation of two standard deviations σ2 = σa
2 + σb2
. In our case, σa is the standard deviation of fund-averaged annual returns appearing in Tables 6A and Tables 8A, and σb is the annual average of the idiosyncratic / implementation risk appearing in Tables 6B and 8B.

CEM Benchmarking Inc. 34
Sharpe ratios
Sharpe ratios - the ratio between excess return over the risk-free rate and excess volatility over the risk-free rate - for the aggregate asset classes are shown in Tables 9 A only. Sharpe ratios represent one way of comparing returns on a risk adjusted basis.
Two comments are in order prior to discussing the data: First, Sharpe ratios are (notoriously) slow to converge to a stable result. 12-years of annual data, even over a very large sampling of portfolios, is insufficient to expect precise results. For this reason, we omit Sharpe ratios for the shorter time spans (they are calculable from the data by the curious reader from the data appearing in Table 8 A-B). Second, Sharpe ratios can be expected to be overstated for public equity and fixed income for the same reason as the volatility is understated for these two aggregate asset classes, namely volatility suppression through aggregation of what are actually more volatility asset classes.
Even with only 12 years of data, the Sharpe ratios for sample of Dutch funds and other Euro area funds are similar enough to give confidence in their values. For public equity, private equity fixed income, unlisted real estate and “other”, the values are all similar, of the same sign, and of the same order. Hedge fund Sharpe ratios do not appear to have converged at all, with a low value for the Dutch sample (-0.03) and a high value for other Euro area funds (0.38). Listed real estate has only a Dutch estimate (relatively high at 0.25), while unlisted infrastructure has no estimate over the longest sample period at all.
The highest Sharpe ratio is for fixed income, at 0.58 and 0.53 for the Dutch and other Euro area sample of funds respectively. The second highest Sharpe ratio is (somewhat surprisingly) private equity at 0.32 and 0.44 for the Dutch and other Euro area sample of funds respectively. Public equity is either the third or fourth highest at 0.28 and 0.31 for the Dutch and other Euro area sample of funds respectively, the difference in rank being a function of the uncertainty on hedge fund Sharpe ratios rather than the difference in Sharpe ratio in the two region samples (which are very close). Fourth highest is listed real estate at 0.25 (Dutch sample only), and fifth highest unlisted real estate at 0.25 and 0.18 for the Dutch and other Euro area sample of funds respectively. Finally, the “other” asset class shows negative Sharpe ratios of -0.31 and -0.17 for the Dutch and other Euro area sample of funds respectively.
Leverage and liquidity premiums
Comparisons of returns and risk across aggregate asset classes requires mention of leverage differences since leverage is a key driver of both return and volatility. While CEM does not have precise information on the leverage use within each asset class for each fund, our prior research [8] does provide us with estimates of asset class leverage for the larger funds included in the data sets presented here. Leverage estimates provided below include all forms of leverage11.
Liquidity premiums refer to the excess return expected from an asset (or asset class) due to a lack of liquidity. It is commonly held that private equity and unlisted real estate should contain liquidity premiums because the assets are not publicly traded like their listed counterparts. However, because of leverage differences, liquidity premiums can be difficult to observe. In what follows, we discuss to what extend liquidity premiums appear in the data given estimates of asset class leverage from as-yet unpublished work [8].
Public equity in comparison to private equity – public equity leverage ranges from approximately 1.25x to 1.55x. Public equity leverage is comprised of almost entirely portfolio company debt. DB pension funds rarely use synthetic leverage or borrowing to lever public equity beta on a net basis (i.e., levered bets such as long shorts typically offet beta exposures but retain levered alpha exposures). In comparison, private equity portfolio leverage ranges from 1.4x to 2.5x. Private equity leverage is comprised of portfolio company leverage as well as leverage applied by GPs in the form of borrowing against capital committed by LPs during the early investment phase of partnerships.
11 Estimated leverage ratios (or gearing ratios) presented here are calculated from the sum of equity + debt divided by equity. The ratios represent the multiplicative amount by which net de-levered returns are boosted due to borrowing. In order to obtain fair comparisons between listed and unlisted asset classes, we include estimates of portfolio company leverage in listed and unlisted asset classes. Included in our estimate is synthetic leverage generated from derivatives.
35 CEM Benchmarking Inc.
The difference in return between public and private equity can be largely attributed to differences in leverage. For example, the ratio of private equity net return to public equity net returns for Dutch funds (8.43 percent vs. 7.16 percent; geometric avg. net ret.; 2005-2016) of 1.2 is consistent with the ratios of private to public equity leverage. If anything, the low multiple indicates a negative liquidity premium (using 1.9x for private equity and 1.4 x for public equity yields an expected ratio of private to public equity return of 1.35x). For other Euro area fund, the ratio of private equity net return to public equity net return (10.06 percent vs. 7.80 percent; geometric avg. net ret.; 2005-2016 for Dutch funds) of 1.3 is also consistent with the estimated leverage ratios. Likewise, U.K. funds do not show any evidence for a liquidity premium with the ratio of private equity net return to public equity net return (10.18 percent vs. 7.88 percent; geometric avg. net ret.; 2008-2016 for Dutch funds) of 1.3 being quite consistent with the estimated leverage ratios.
Listed real estate in comparison to unlisted real estate – listed real estate leverage ranges from approximately 1.2x to 1.9x. Like public equity, leverage in listed real estate portfolios is almost entirely due to portfolio company debt. Unlisted real estate leverage is somewhat broader, ranging from approximately 1.1x to 2.0x. The broad range is due to differences among implementation styles with internally managed portfolios having less leverage than externally managed portfolios. Ultimately, leverage in listed real estate is not materially different than for unlisted real estate.
The difference in return between listed and unlisted real estate, unlike public and private equity, cannot easily be attributed to differences in leverage, since the ranges of leverage broad and the difference minimal. For example, for Dutch funds listed real estate returns were much larger than for unlisted real estate (6.82 percent vs. 0.50 percent; geometric avg. net ret., 2005-2016) consistent with a negative liquidity premium provided equal leverage. For other Euro area funds unlisted real estate slightly outperformed listed real estate (5.29 percent vs. 4.55 percent; geometric avg. net ret.; 2008-2016), but not by enough to be suggestive of a liquidity premium. For U.K. funds, like Dutch funds, listed real estate returns were much larger than for unlisted real estate (10.44 percent vs. 5.26 percent; geometric avg. net ret.; 2010-2016) which, given equal leverage, is suggestive of a negative liquidity premium.
Correlations
Correlations between aggregate asset classes are shown in Tables 11 A-C. For Dutch funds shown in Table 11A it is quite clear that listed and unlisted real estate behave very similarly. Correlations to each other are among the highest at 0.88, while the differences between the listed and unlisted real estate correlations to other aggregate asset classes are always less than 0.17 (hedge funds). For Dutch funds, real estate (both listed and unlisted) is seen to be highly correlated to several other asset classes; correlations to public and private equity are between 0.76 and 0.86, and correlations to hedge funds and unlisted infrastructure are between 0.64 and 0.81. Correlations to fixed income and “other” are low, between 0.16 and 0.37. The results are broadly consistent with results from our prior work in the U.S. [3].
For other Euro area funds shown in Table 11B, the correlation between listed and unlisted real estate is much lower, 0.58. One possible explanation for the lower correlation in comparison to that of the Dutch sample is that thin data from early years, 2007 and 2009 specifically, are distorting the actual correlation which is in fact much greater. Ignoring those two years the correlation is 0.78, much more in line with expectations from our experience here with Dutch funds and elsewhere [3]. Another possible explanation for the low correlation are differences in geographical and / or sector mix between listed and unlisted real estate. Either way, the analysis presented in Appendix A whereby lag is removed from unlisted real estate shows that correlations between unlisted real estate returns and listed real estate proxies are much higher, on average 84 percent.
Correlations between aggregate asset classes and listed real estate for other Euro area funds are somewhat smaller than for Dutch funds - the average of all correlations to listed real estate is 0.66 for Dutch funds compared to 0.58 for other Euro area funds. For unlisted real estate, the average correlation to other asset classes for Dutch and other Euro area funds is nearly identical, 0.62 and 0.63 respectively. Furthermore, the pattern of correlations is similar for other Euro area funds as it was for Dutch funds; correlation to public and private equity are between 0.74 and 0.87, and correlations to hedge funds and unlisted infrastructure are between 0.58 and 0.84. And again, correlations to fixed income and other real assets are low, between 0.07 and 0.51.

CEM Benchmarking Inc. 36
For U.K. funds shown in Table 11C, the pattern of correlations is different. Most notable in the data is that listed and unlisted real estate are no longer correlated at all, with the correlation between the two being -0.09. This is a severe drop from the as-reported correlation of 0.73.
In fact, this decrease in correlation upon standardization is the exact opposite of what we expect to happen – the expectation being an increase in correlation. The decrease in correlation upon standardization is consistent with the U.K. listed real estate data provided to CEM being lagged in a similar fashion as unlisted real estate. The result on the face of it is odd, since listed real estate returns should be available on a marked-to-market basis.
Whatever the case, the correlations to listed real estate for U.K. funds do not appear to be reliable. Indeed, as sown in Appendix A, correlations between unlisted real estate and listed real estate proxies are extremely high once lag is assumed to be present in the unlisted real estate returns data. For U.K. funds, the average correlation between each funds unlisted real estate returns and listed real estate proxies is 92 percent (the median is 95 percent) strongly indicative that the U.K. listed real estate correlations presented in Table 11C are not reliable. Instead, the unlisted real estate correlations should be considered better estimates of the actual listed real estate correlations to other asset classes. This inference is strongly supported by our prior results in the U.S. [3], and the results presented here for Dutch and other Euro area funds.
Benchmarks
The proportion of funds using different benchmark types by year and by sample region are shown in Table 12A for listed real estate and in Table 12B for unlisted real estate. For both aggregate asset classes, benchmarks were categorized either as:
1. Absolute return benchmarks – uninvestable aspirational benchmarks of a fixed percent, typically set near a funds expected or required rate of return such as 6 percent.
2. Interest rate / inflation rate + constant benchmarks – uninvestable aspirational benchmarks of a fixed percentage plus a floating interest or inflation rate. The two types are categorized together because of the similarity in expected volatility.
3. Fund or portfolio return – return of either the total fund or return of the portfolio, the later of which neutralized total fund value added from asset class returns.
4. Peer-based benchmarks – indices constructed from self-reported returns from unlisted real estate portfolios.
5. Public market-based benchmarks – indices constructed from exchange traded (typically real estate) equity.
The benchmarks have been organized in order of increasing expected volatility. Note that while portfolios of unlisted real estate may be more volatile then portfolios of listed real estate, peer-based benchmarks are expected to be less volatile then public market-based benchmarks because of the smoothing that is introduced upon averaging fund level data with different lag. More details of the benchmark types and examples for each are included in the footnotes to Tables 12A and 12B.
Listed real estate – for the Dutch sample of funds, benchmarks used for listed real estate are nearly always public market-based, typically constructed from regional blends of listed real estate benchmarks from providers such as Nareit, or EPRA12. For a handful of years spanning 2009-2011, some funds used peer-based benchmarks such as those provided by IPD, but otherwise there is no notable trend in the data. A comparison of listed real estate returns peer-based benchmark returns which are lagged and smoothed produces noise for the most part since the ups and downs of market cycles will not be contemporaneous. That said, since the standard for Dutch funds is to use public market-based benchmarks, the net value added for listed real estate provided in Tables 8A-C represents “alpha” (i.e., excess return relative to a risk neutral benchmark).
12 FTSE branded benchmarks, usage thereof, and data are excluded from CEM Benchmarking client reports at their request.
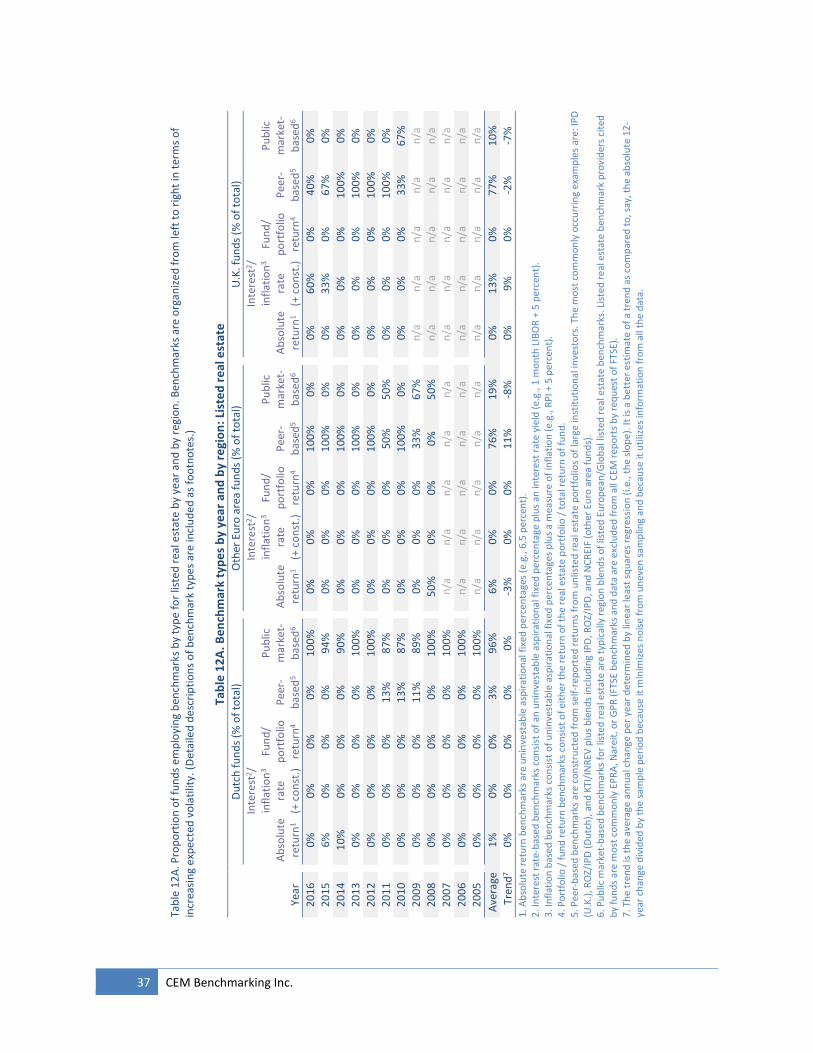
37 CEM Benchmarking Inc.
Ta
ble
12
A. P
rop
ort
ion
of
fun
ds
em
plo
yin
g b
ench
mar
ks b
y ty
pe
for
liste
d r
eal e
stat
e b
y ye
ar a
nd
by
regi
on
. B
ench
mar
ks a
re o
rgan
ize
d f
rom
left
to
rig
ht
in t
erm
s o
f in
crea
sin
g e
xpec
ted
vo
lati
lity.
(D
etai
led
de
scri
pti
on
s o
f b
ench
mar
k ty
pes
are
incl
ud
ed
as
foo
tno
tes.
)
Tab
le 1
2A
. Be
nch
mar
k ty
pe
s b
y ye
ar a
nd
by
regi
on
: Li
ste
d r
eal
est
ate
D
utc
h f
un
ds
(% o
f to
tal)
Oth
er E
uro
are
a fu
nd
s (%
of
tota
l)
U
.K. f
un
ds
(% o
f to
tal)
Year
A
bso
lute
re
turn
1
Inte
rest
2/
infl
atio
n3
rate
(+
co
nst
.)
Fun
d/
po
rtfo
lio
retu
rn4
Pee
r-
bas
ed5
Pu
blic
m
arke
t-
bas
ed6
A
bso
lute
re
turn
1
Inte
rest
2/
infl
atio
n3
rate
(+
co
nst
.)
Fun
d/
po
rtfo
lio
retu
rn4
Pee
r-
bas
ed5
Pu
blic
m
arke
t-
bas
ed6
A
bso
lute
re
turn
1
Inte
rest
2/
infl
atio
n3
rate
(+
co
nst
.)
Fun
d/
po
rtfo
lio
retu
rn4
Pee
r-
bas
ed5
Pu
blic
m
arke
t-
bas
ed6
20
16
0%
0
%
0%
0
%
10
0%
0%
0
%
0%
1
00
%
0%
0%
6
0%
0
%
40
%
0%
20
15
6%
0
%
0%
0
%
94
%
0
%
0%
0
%
10
0%
0
%
0
%
33
%
0%
6
7%
0
%
20
14
10
%
0%
0
%
0%
9
0%
0%
0
%
0%
1
00
%
0%
0%
0
%
0%
1
00
%
0%
20
13
0%
0
%
0%
0
%
10
0%
0%
0
%
0%
1
00
%
0%
0%
0
%
0%
1
00
%
0%
20
12
0%
0
%
0%
0
%
10
0%
0%
0
%
0%
1
00
%
0%
0%
0
%
0%
1
00
%
0%
20
11
0%
0
%
0%
1
3%
8
7%
0%
0
%
0%
5
0%
5
0%
0%
0
%
0%
1
00
%
0%
20
10
0%
0
%
0%
1
3%
8
7%
0%
0
%
0%
1
00
%
0%
0%
0
%
0%
3
3%
6
7%
20
09
0%
0
%
0%
1
1%
8
9%
0%
0
%
0%
3
3%
6
7%
n/a
n
/a
n/a
n
/a
n/a
20
08
0%
0
%
0%
0
%
10
0%
50
%
0%
0
%
0%
5
0%
n/a
n
/a
n/a
n
/a
n/a
20
07
0%
0
%
0%
0
%
10
0%
n/a
n
/a
n/a
n
/a
n/a
n/a
n
/a
n/a
n
/a
n/a
20
06
0%
0
%
0%
0
%
10
0%
n/a
n
/a
n/a
n
/a
n/a
n/a
n
/a
n/a
n
/a
n/a
20
05
0%
0
%
0%
0
%
10
0%
n/a
n
/a
n/a
n
/a
n/a
n/a
n
/a
n/a
n
/a
n/a
Ave
rage
1
%
0%
0
%
3%
9
6%
6%
0
%
0%
7
6%
1
9%
0%
1
3%
0
%
77
%
10
%
Tren
d7
0%
0
%
0%
0
%
0%
-3%
0
%
0%
1
1%
-8
%
0
%
9%
0
%
-2%
-7
%
1. A
bso
lute
ret
urn
ben
chm
arks
are
un
inve
stab
le a
spir
atio
nal
fix
ed p
erce
nta
ges
(e.g
., 6
.5 p
erce
nt)
. 2
. In
tere
st r
ate-
bas
ed b
ench
mar
ks c
on
sist
of
an u
nin
vest
able
asp
irat
ion
al f
ixed
per
cen
tage
plu
s an
inte
rest
rat
e yi
eld
(e.
g., 1
mo
nth
LIB
OR
+ 5
per
cen
t).
3. I
nfl
atio
n b
ased
ben
chm
arks
co
nsi
st o
f u
nin
vest
able
asp
irat
ion
al f
ixed
per
cen
tage
s p
lus
a m
easu
re o
f in
flat
ion
(e.
g., R
PI +
5 p
erce
nt)
. 4
. Po
rtfo
lio /
fu
nd
ret
urn
ben
chm
arks
co
nsi
st o
f ei
ther
th
e re
turn
of
the
real
est
ate
po
rtfo
lio /
to
tal r
etu
rn o
f fu
nd
. 5
. Pee
r-b
ased
ben
chm
arks
are
co
nst
ruct
ed f
rom
sel
f-re
po
rted
ret
urn
s fr
om
un
liste
d r
eal e
stat
e p
ort
folio
s o
f la
rge
inst
itu
tio
nal
inve
sto
rs. T
he
mo
st c
om
mo
nly
occ
urr
ing
exam
ple
s ar
e: IP
D
(U.K
.), R
OZ/
IPD
(D
utc
h),
an
d K
TI/I
NR
EV p
lus
ble
nd
s in
clu
din
g IP
D, R
OZ/
IPD
, an
d N
CR
EIF
(oth
er E
uro
are
a fu
nd
s).
6. P
ub
lic m
arke
t-b
ased
ben
chm
arks
fo
r lis
ted
rea
l est
ate
are
typ
ical
ly r
egio
n b
len
ds
of
liste
d E
uro
pea
n/G
lob
al li
sted
rea
l est
ate
ben
chm
arks
. Lis
ted
re
al e
stat
e b
ench
mar
k p
rovi
der
s ci
ted
b
y fu
nd
s ar
e m
ost
co
mm
on
ly E
PR
A, N
arei
t, o
r G
PR
(FT
SE b
ench
mar
ks a
nd
dat
a ar
e ex
clu
de
d f
rom
all
CEM
rep
ort
s b
y re
qu
est
of
FTSE
).
7. T
he
tren
d is
th
e av
erag
e an
nu
al c
han
ge p
er y
ear
det
erm
ined
by
linea
r le
ast
squ
ares
reg
ress
ion
(i.e
., t
he
slo
pe
). It
is a
be
tter
est
imat
e o
f a
tren
d a
s co
mp
ared
to
, say
, th
e ab
solu
te 1
2-
year
ch
ange
div
ided
by
the
sam
ple
pe
rio
d b
ecau
se it
min
imiz
es n
ois
e fr
om
un
even
sam
plin
g an
d b
ecau
se it
uti
lizes
info
rmat
ion
fro
m a
ll th
e d
ata.
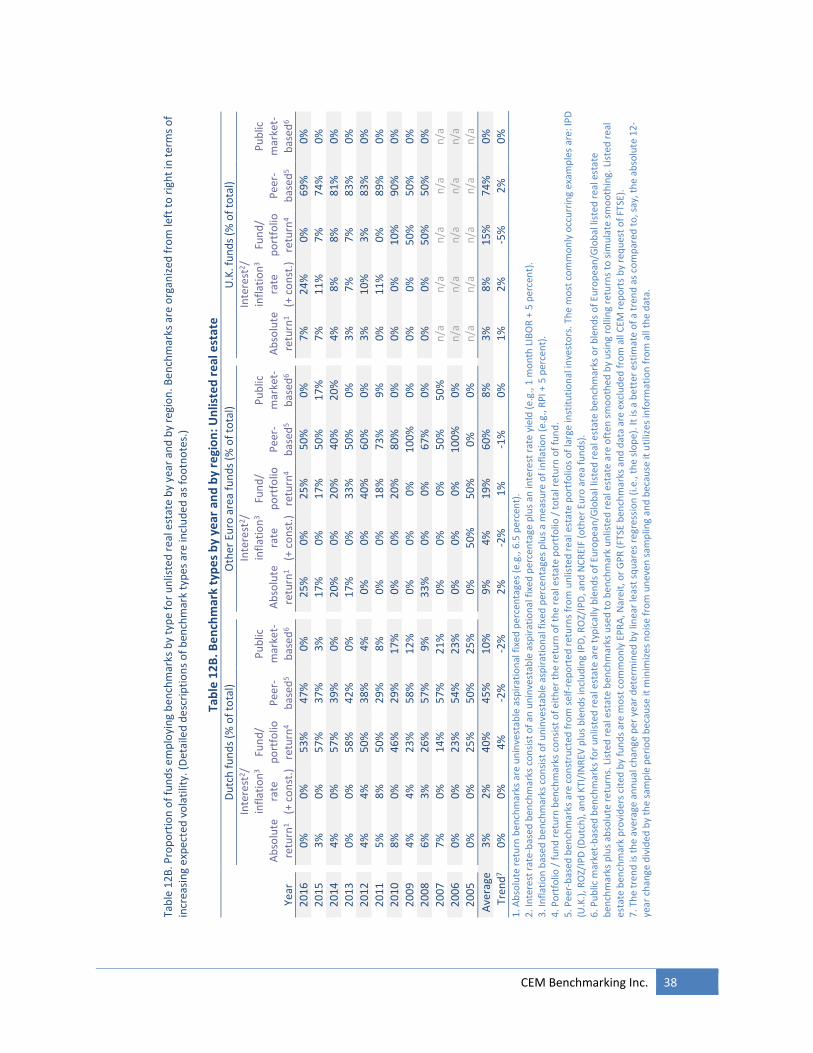
CEM Benchmarking Inc. 38
Ta
ble
12
B. P
rop
ort
ion
of
fun
ds
em
plo
yin
g b
ench
mar
ks b
y ty
pe
for
un
liste
d r
eal e
stat
e b
y ye
ar a
nd
by
regi
on
. B
en
chm
arks
are
org
aniz
ed f
rom
left
to
rig
ht
in t
erm
s o
f in
crea
sin
g e
xpec
ted
vo
lati
lity.
(D
etai
led
de
scri
pti
on
s o
f b
ench
mar
k ty
pes
are
incl
ud
ed
as
foo
tno
tes.
)
Tab
le 1
2B
. Be
nch
mar
k ty
pe
s b
y ye
ar a
nd
by
regi
on
: U
nlis
ted
re
al e
stat
e
Du
tch
fu
nd
s (%
of
tota
l)
O
ther
Eu
ro a
rea
fun
ds
(% o
f to
tal)
U.K
. fu
nd
s (%
of
tota
l)
Year
A
bso
lute
re
turn
1
Inte
rest
2/
infl
atio
n3
rate
(+
co
nst
.)
Fun
d/
po
rtfo
lio
retu
rn4
Pee
r-
bas
ed5
Pu
blic
m
arke
t-
bas
ed6
A
bso
lute
re
turn
1
Inte
rest
2/
infl
atio
n3
rate
(+
co
nst
.)
Fun
d/
po
rtfo
lio
retu
rn4
Pee
r-
bas
ed5
Pu
blic
m
arke
t-
bas
ed6
A
bso
lute
re
turn
1
Inte
rest
2/
infl
atio
n3
rate
(+
co
nst
.)
Fun
d/
po
rtfo
lio
retu
rn4
Pee
r-
bas
ed5
Pu
blic
m
arke
t-
bas
ed6
20
16
0%
0
%
53
%
47
%
0%
25
%
0%
2
5%
5
0%
0
%
7
%
24
%
0%
6
9%
0
%
20
15
3%
0
%
57
%
37
%
3%
17
%
0%
1
7%
5
0%
1
7%
7%
1
1%
7
%
74
%
0%
20
14
4%
0
%
57
%
39
%
0%
20
%
0%
2
0%
4
0%
2
0%
4%
8
%
8%
8
1%
0
%
20
13
0%
0
%
58
%
42
%
0%
17
%
0%
3
3%
5
0%
0
%
3
%
7%
7
%
83
%
0%
20
12
4%
4
%
50
%
38
%
4%
0%
0
%
40
%
60
%
0%
3%
1
0%
3
%
83
%
0%
20
11
5%
8
%
50
%
29
%
8%
0%
0
%
18
%
73
%
9%
0%
1
1%
0
%
89
%
0%
20
10
8%
0
%
46
%
29
%
17
%
0
%
0%
2
0%
8
0%
0
%
0
%
0%
1
0%
9
0%
0
%
20
09
4%
4
%
23
%
58
%
12
%
0
%
0%
0
%
10
0%
0
%
0
%
0%
5
0%
5
0%
0
%
20
08
6%
3
%
26
%
57
%
9%
33
%
0%
0
%
67
%
0%
0%
0
%
50
%
50
%
0%
20
07
7%
0
%
14
%
57
%
21
%
0
%
0%
0
%
50
%
50
%
n
/a
n/a
n
/a
n/a
n
/a
20
06
0%
0
%
23
%
54
%
23
%
0
%
0%
0
%
10
0%
0
%
n
/a
n/a
n
/a
n/a
n
/a
20
05
0%
0
%
25
%
50
%
25
%
0
%
50
%
50
%
0%
0
%
n
/a
n/a
n
/a
n/a
n
/a
Ave
rage
3
%
2%
4
0%
4
5%
1
0%
9%
4
%
19
%
60
%
8%
3%
8
%
15
%
74
%
0%
Tren
d7
0%
0
%
4%
-2
%
-2%
2%
-2
%
1%
-1
%
0%
1%
2
%
-5%
2
%
0%
1
. Ab
solu
te r
etu
rn b
ench
mar
ks a
re u
nin
vest
able
asp
irat
ion
al f
ixed
per
cen
tage
s (e
.g.,
6.5
per
cen
t).
2. I
nte
rest
rat
e-b
ased
ben
chm
arks
co
nsi
st o
f an
un
inve
stab
le a
spir
atio
nal
fix
ed p
erce
nta
ge p
lus
an in
tere
st r
ate
yiel
d (
e.g.
, 1 m
on
th L
IBO
R +
5 p
erce
nt)
. 3
. In
flat
ion
bas
ed b
ench
mar
ks c
on
sist
of
un
inve
stab
le a
spir
atio
nal
fix
ed p
erce
nta
ges
plu
s a
mea
sure
of
infl
atio
n (
e.g.
, RP
I + 5
per
cen
t).
4. P
ort
folio
/ f
un
d r
etu
rn b
ench
mar
ks c
on
sist
of
eith
er t
he
retu
rn o
f th
e re
al e
stat
e p
ort
folio
/ t
ota
l ret
urn
of
fun
d.
5. P
eer-
bas
ed b
ench
mar
ks a
re c
on
stru
cted
fro
m s
elf-
rep
ort
ed r
etu
rns
fro
m u
nlis
ted
rea
l est
ate
po
rtfo
lios
of
larg
e in
stit
uti
on
al in
vest
ors
. Th
e m
ost
co
mm
on
ly o
ccu
rrin
g ex
amp
les
are:
IPD
(U
.K.)
, RO
Z/IP
D (
Du
tch
), a
nd
KTI
/IN
REV
plu
s b
len
ds
incl
ud
ing
IPD
, RO
Z/IP
D, a
nd
NC
REI
F (o
ther
Eu
ro a
rea
fun
ds)
. 6
. Pu
blic
mar
ket-
bas
ed b
ench
mar
ks f
or
un
liste
d r
eal e
stat
e ar
e ty
pic
ally
ble
nd
s o
f Eu
rop
ean
/Glo
bal
list
ed r
eal e
stat
e b
ench
mar
ks o
r b
len
ds
of
Euro
pea
n/G
lob
al li
sted
rea
l est
ate
ben
chm
arks
plu
s ab
solu
te r
etu
rns.
Lis
ted
rea
l est
ate
ben
chm
arks
use
d t
o b
ench
mar
k u
nlis
ted
rea
l est
ate
are
oft
en s
mo
oth
ed b
y u
sin
g ro
llin
g re
turn
s to
sim
ula
te s
mo
oth
ing.
Lis
ted
rea
l es
tate
ben
chm
ark
pro
vid
ers
cit
ed b
y fu
nd
s ar
e m
ost
co
mm
on
ly E
PR
A, N
arei
t, o
r G
PR
(FT
SE b
ench
mar
ks a
nd
dat
a ar
e ex
clu
ded
fro
m a
ll C
EM r
epo
rts
by
req
ues
t o
f FT
SE).
7
. Th
e tr
end
is t
he
aver
age
ann
ual
ch
ange
per
yea
r d
ete
rmin
ed b
y lin
ear
leas
t sq
uar
es r
egre
ssio
n (
i.e.,
th
e sl
op
e).
It is
a b
ett
er e
stim
ate
of
a tr
end
as
com
par
ed t
o, s
ay, t
he
abso
lute
12
-ye
ar c
han
ge d
ivid
ed b
y th
e sa
mp
le p
eri
od
bec
ause
it m
inim
izes
no
ise
fro
m u
nev
en s
amp
ling
and
bec
ause
it u
tiliz
es in
form
atio
n f
rom
all
the
dat
a.

39 CEM Benchmarking Inc.
By contrast, the standard for other Euro area funds and for U.K. funds is to benchmark their listed real estate against peer-based benchmarks. Notably, the trend for other Euro area funds has been towards using peer-based benchmarks whereas U.K. funds have seen decreasing use of peer-based benchmarks and are instead increasingly seen to be using interest/inflation rate-based benchmarks. The choice to use peer-based real estate benchmarks to measure the performance of listed real estate may be motivated by a desire for funds to measuring their listed real estate returns against the benchmark returns of the majority of their real estate portfolios which, as shown in Section 4, is overwhelmingly of the unlisted variety.
Unlisted real estate – the distribution of benchmark types used by funds for unlisted real estate are far more varied in comparison to benchmarks types used by funds for listed real estate. Because of the differences in benchmarking philosophy, it is difficult to compare net value added across funds or regions. For example, the net value added by one unlisted real estate portfolio measured against an absolute return benchmark of 5 percent provides no information about skill, nor does a comparison against the return of the portfolio itself which produces a net value added of zero.
For Dutch funds, there is a clear split in benchmarking philosophy for unlisted real estate. Almost half of Dutch funds use their own fund and/or portfolio returns while almost another half use peer-based benchmarks to measure the performance of their unlisted real estate portfolios. In addition, there are clear trends in the data. On the one hand, fund and/or portfolio benchmarks are increasingly common, having doubled in usage over the sample period. Offsetting this is a decrease in use of peer-based benchmarks (although 2016 saw an uptick) and a near elimination in the usage of public market-based benchmarks.
For other Euro area funds and U.K. funds, peer-based benchmarks are most common by far. However, the use of peer-based benchmarks appears to be decreasing somewhat for other Euro area funds and increasing for U.K. funds.
We emphasize that when measuring performance of a portfolio against a benchmark, best practice is to choose a benchmark that is: (i) risk equivalent, (ii) hard to beat, (iii) highly correlated, and (iv) that represents a low-cost passive alternative. For this reason, absolute return benchmarks (no volatility) and interest rate / inflation rate benchmarks (virtually no volatility) make poor choices for a benchmark as they are not risk equivalent. Furthermore,
Table 13. Total-fund ‘standardized’ net return sample statistics by year and by region. ‘Standardized’ refers to the fact that fund level data have been standardized to remove the net return lag in unlisted asset classes that produces smoothed total-fund net return (i.e., ‘as-reported’ net returns’). Net return is net of all investment management costs including: (i) internal front-office trading costs, (ii) external base manager fees, (iii) performance fees, (iv) carried interest, (v) trading costs, (vi) internal oversight costs, (vii) internal governance, operations, and support costs, and (viii) other third party / consultant costs. 50th and 75th refer to percentile ranges while avg., stdev., and # refer to the average of total-fund net returns, in-year standard deviation of total-fund net returns and the number of funds in the sample respectively.
Table 13. Total-fund ‘standardized’ net return statistics by year and by region
Dutch funds
(percent, true-time weighted)
Other Euro area¹ funds (percent, true-time weighted)
U.K. funds
(percent, true-time weighted)
Year 25th 50th 75th Avg. Stdev. # 25th 50th 75th Avg. Stdev. # 25th 50th 75th Avg. Stdev. #
2016 7.9 9.8 11.1 9.5 1.9 24 5.2 6.5 7.0 6.3 1.3 11 15.7 16.5 19.2 17.3 3.0 42
2015 -0.5 0.3 1.1 0.2 1.7 34 3.8 5.6 8.3 5.9 3.1 13 1.3 2.3 4.1 2.7 1.9 42
2014 16.6 20.5 21.6 20.1 5.2 30 6.9 7.7 8.7 7.6 2.6 13 6.1 8.4 10.1 8.1 2.6 42
2013 -0.4 1.2 3.2 1.2 3.4 39 6.6 8.3 10.3 7.9 5.4 13 11.9 14.5 16.3 13.7 3.8 44
2012 14.8 15.5 17.3 15.9 2.1 29 12.5 16.0 16.6 14.7 2.9 9 11.8 13.1 14.7 13.2 2.1 45
2011 4.1 6.5 10.2 6.9 4.8 48 -7.1 -4.5 -2.4 -4.6 3.4 18 -2.8 0.4 4.7 1.3 6.3 11
2010 9.0 10.7 12.8 10.8 3.0 34 10.4 11.6 19.3 14.0 6.8 11 9.7 10.6 14.0 12.5 5.3 11
2009 16.5 19.3 22.3 18.9 5.8 35 19.0 25.5 26.3 23.9 5.4 13 7.7 15.3 22.9 15.3 15.2 2
2008 -20.7 -14.8 -6.2 -13.5 10.1 47 -30.7 -25.2 -23.4 -26.0 5.5 9 -24.8 -17.7 -10.7 -17.7 14.1 2
2007 -0.5 1.2 1.7 0.5 2.3 16 -0.9 0.1 2.4 1.4 3.3 12 n/a n/a n/a n/a n/a 0
2006 7.2 9.0 11.0 9.2 3.1 17 11.0 11.9 13.8 12.1 2.8 12 n/a n/a n/a n/a n/a 0
2005 11.9 13.8 15.1 13.7 2.5 15 10.7 12.9 14.1 12.9 2.7 11 n/a n/a n/a n/a n/a 0 1. Other Euro area funds consists of funds from Denmark, Finland, France, Ireland, Norway, Sweden, and Switzerland. Where other Euro area funds have provided net return in home currency other than €, net return has been converted into € using FX currency return of the home currency vs. €.

CEM Benchmarking Inc. 40
they are not highly correlated, and are uninvestable as well. Fund / portfolio benchmarks are not better since fund return is not highly correlated to real estate returns, and net value added against the portfolio is always zero thus providing no information about performance. Peer-based benchmarks are improvements but suffer from having less volatility due to smoothing, and for not representing an investable passive alternative.
As an alternative, public market-based benchmarks can be constructed rather easily from listed real estate indices, adjusted for sector and region biases, adjusted for leverage, and are easily lagged to match a specific real estate portfolio. The benefit is that such benchmarks can be risk matched to the portfolio being benchmarked and represent a low-cost investable alternative.
6 Listed and unlisted real estate performance relative to total fund performance
In Table 13 we show standardized, annual average total-fund returns by year for each of the three region groups. Here, returns for each fund are adjusted to reflect the differences between as-reported returns and standardized returns. Where we have been unable to estimate the lag in a funds private equity, unlisted real estate, or unlisted infrastructure portfolio because the return stream spans four or fewer years, the average lag for the region group and aggregate asset class has been used. The data is analogous to that shown in Table 2.
In Table 14 we show the summary returns for the three region groups and three sample periods, analogous to Table 3. The main difference Table 14 and Table 3 is not in the average returns, which show adjustments upon standardization of the order of 0.2 percent, but rather the standard deviations and volatilities which see increases
Table 14. Total-fund ‘standardized’ net return sample statistics by sample region and sample period used in this study. ‘Standardized’ refers to the fact that fund level data have been standardized to remove the net return lag in unlisted asset classes that produces smoothed total-fund net return (i.e., ‘as-reported’ net returns’). Return is net of all investment management costs including: (i) internal front-office trading costs, (ii) external base manager fees, (iii) external performance fees, (iv) private equity carried interest, (v) trading costs, (vi) internal oversight costs, (vii) internal governance, operations, and support costs, and (viii) other third party / consultant costs.
Table 14. Total-fund ‘standardized’ net returns summary by time period and by region (percent, true-time weighted)
2005-2016 2008-2016 2010-2016
Statistic
Dutch funds
Other Euro area1 funds
U.K. funds
Dutch funds
Other Euro area1 funds
U.K. funds
Dutch funds
Other Euro area1 funds
U.K. funds
Geometric average net ret.2 7.38 5.58 n/a 7.29 4.57 6.82 9.02 7.23 9.68
(-) Geometric average benchmark ret.3 7.29 5.25 n/a 7.30 4.24 6.76 8.74 6.73 9.20
(=) Average net value added4 0.09 0.33 n/a -0.01 0.33 0.06 0.28 0.50 0.47
Average proportion actively managed5 82% 74% n/a 81% 74% 81% 78% 74% 82%
Standard Deviation6 9.11 11.91 n/a 10.04 13.32 10.27 6.73 5.89 5.55
Volatility7 9.88 12.50 n/a 10.89 13.92 11.91 7.44 6.93 6.61 1. Other Euro area funds consists of funds from Denmark, Finland, France, Ireland, Norway, Sweden, and Switzerland. Where other Euro area funds have provided net return in home currency other than €, net return has been converted into € using FX currency return of the home currency vs. €. 2. Geometric average net return is the compounded net return of annual average net returns appearing in Table 2. 3. Benchmark return has been estimated from the difference between geometric average net return and net value added. 4. Net value added for a fund-year is the difference between a funds’ net return and total-fund benchmark (or policy) return. The average net value added is the average of annual fund-weighted averages. Funds which did not provide a total-fund policy return have been excluded. 5. Average proportion actively managed is the average ratio of a funds’ assets that are managed in an attempt to outperform a market capitalization-weighted index (i.e., actively managed) relative to total physical assets. (Smart-beta strategies are considered actively managed. Actively managed fraction for unlisted assets is 100%.) 6. Standard deviation is the population standard deviation of annual fund-weighted average net returns spanning the given period (i.e., the average return by year provided in Table 2). It does not include the fund-to-fund variation in net return by year. 7. Average volatility is an estimate of the average standard deviation of net returns experienced by individual funds in each region sample / time period. It includes both the standard deviation of average annual net returns and fund-to-fund variation in annual average net return.

41 CEM Benchmarking Inc.
of the order of 10 percent in magnitude relative to the as-reported values. This reveals one “benefit” of investing in unlisted assets; the ability to smooth annual returns and artificially reduce total-fund risk.
7 Concluding statement
CEM Benchmarking is not an investment consultancy and does not provide advice on how clients should invest. CEM makes no warranty about the accuracy of the data provided and is not responsible or liable for any investment decisions made on the basis of the data provided herein. CEM thanks EPRA, the European Public Real estate Association for the funding which made this research possible.
8 About CEM Benchmarking
CEM Benchmarking is a Toronto based provider of investment cost and performance benchmarking for large institutional investors including pension funds (defined benefit and defined contribution), sovereign wealth funds, buffer funds, and others. For information on benchmarking with CEM or other data inquiries please contact:
Mike Heale, Principal 372 Bay Street Suite 1000 Toronto, Canada, M5H 2W9 Telephone: +1 416-369-0468 [email protected]
9 Citations
[1] Bauer, R., Cremers, M. and Frehen, R.G.P., “Pension Fund Performance and Costs: Small is Beautiful”, April 30, 2010. Available at: http://ssrn.com/abstract=965388 or http://dx.doi.org/10.2139/ssrn.965388
[2] Estimated size of European pension market at the end of 2016 according to IPE survey. Available at: https://bit.ly/2sLaurC
[3] Beath, Alexander D. and Flynn, C., “Asset Allocation and Fund Performance of Defined Benefit Pension Funds in the United States; 1998-2014”, June 2014. Available at: https://bit.ly/2kP8bjw
[4] Heale, M., Beath, Alexander D. and Flynn, C., “Hedge Fund Reality Check 2018”, May 2018. Available at: https://bit.ly/2HrlPlO
[5] Geltner, D.M., “Smoothing in Appraisal-Based Returns, Journal of Real Estate Finance and Economics”, vol. 4 1991.
[6] Beath, Alexander D., “Asset Allocation and Fund Performance of Defined Benefit Pension Funds in the United States Between 1998-2011”, June 2014. Available at: http://tinyurl.com/hbkjz8x
[7] Beath, Alexander D., Flynn, C., MacIntosh, J., “How Implementation Style and Costs Affect Private Equity Performance”, Rotman International Journal of Pension Management, Spring 2014.
[8] Beath, Alexander D., MacIntosh, J., “Leverage use at large pension plans”, to be published, fall 2018.

CEM Benchmarking Inc. 42
Appendix A: Standardizing illiquid asset returns
Our standardization for reporting lags and smoothing of illiquid asset returns used in this paper is fundamentally different from the approach used in Refs. [5,6], and identical to that used in Ref. [3]. In both Refs. [5,6] a de-smoothing is applied to the data which has the effect of increasing the volatility of the asset class. The de-smoothing function assumes that the observed, smoothed, return is equal to a weighted sum of the actual (e.g., de-smoothed) return plus the prior periods smoothed return, the weighting being a property of the appraiser. De-smoothing is accomplished by extracting the actual return given the two observed returns given an estimate of the weighting (the so called “appraisal parameter”).
The primary difference between Ref. 6 and Ref. 5 was that we first accounted for the lag in the data prior to applying the de-smoothing. The lag in the data is readily apparent for unlisted real estate because of the fingerprint left by the financial crisis. There, listed equity REITs experienced a downturn in 2008 whereas unlisted real estate recorded the loss a year late in 2009 (see Figure 2A of Ref. [6], or note the correlation between as-reported listed and unlisted real estate for Dutch funds shown in Tables 6A here with one year lag). To remove the lag in the inaugural version of this series of papers we simply shifted the unlisted real estate data back by one year. This simple transformation has the effect of increasing the correlation between the two data series, listed equity REITs and unlisted real estate 10-fold, but has no effect on the volatility which remains smoothed. To remedy this we de-smoothed the data in an effort to recover lost volatility.
In the updated version Ref. [2] of Ref. [6] we exploited the fact that CEM Benchmarking has fund level return data. Like the original, we once again removed the lag in the unlisted real estate and private equity data. However, the key innovation is that the lag is removed instead on a fund-by-fund basis as opposed to the fund-averaged aggregate data as a whole. When the data is standardized to remove the lag at the fund level, we find that the fund-averaged aggregate data is effectively de-smoothed. This demonstrates that the source of the smoothing in the fund-averaged aggregate is differences in reporting lag.
In this paper we remove lag from unlisted assets identically as we did in Ref. [2], the only exception being that in addition to doing so for private equity and unlisted real estate we attempt to do so for unlisted infrastructure. However, the results for unlisted infrastructure are not as good as they are for the other two unlisted asset classes due to a lack of publicly available indices with comparable assets as held in unlisted infrastructure portfolios of large European institutional investors.
To determine the lag present in each funds’ unlisted asset return series (i.e., private equity, unlisted real estate and unlisted infrastructure) we compare the individual return series to a listed benchmark with varying lag. The listed benchmarks used to remove the lag in this paper are comprised of:
Dutch and other Euro area funds:
• Private equity: 100 percent equity, 0 percent debt. Equity component comprised of 50 percent Euro small cap., 40 percent U.S. small cap., 10 percent U.K. small cap,
• Unlisted real estate: 70 percent equity, 30 percent debt. Equity component comprised of 60 percent Euro area REITs, 20 percent U.K. REITs, and 20 percent U.S. REITs, debt component comprised of 60 percent Euro area BBB corporate bonds, 20 percent U.K. BBB corporate bonds, and 20 percent U.S. BBB corporate bonds.
• Unlisted infrastructure: 67 percent equity, 33 percent debt. Equity component comprised of 100 percent global infrastructure, debt component comprised of 33 percent Euro area BBB corporate bonds, 33 percent U.K. BBB corporate bonds, and 34 percent U.S. BBB corporate bonds.
U.K. funds:
• Private equity: 100 percent equity, 0 percent debt. Equity component comprised of 90 percent Euro small cap., 5 percent U.S. small cap., 5 percent U.K. small cap,

43 CEM Benchmarking Inc.
• Unlisted real estate: 70 percent equity, 30 percent debt. Equity component comprised of 40 percent Euro area REITs, 40 percent U.K. REITs, and 20 percent U.S. REITs, debt component comprised of 40 percent Euro area BBB corporate bonds, 40 percent U.K. BBB corporate bonds, and 20 percent U.S. BBB corporate bonds.
• Unlisted infrastructure: 67 percent equity, 33 percent debt. Equity component comprised of 100 percent global infrastructure, debt component comprised of 33 percent Euro area BBB corporate bonds, 33 percent U.K. BBB corporate bonds, and 34 percent U.S. BBB corporate bonds.
Components were selected based on two sets of information. First, CEM Benchmarking has survey information regarding leverage and the geographic composition of unlisted asset portfolios for several of the largest funds in each group gathered for prior research projects. This forms the basis for choosing the above compositions. Second, geographic composition was adjusted such that the average correlation was maximized. This adjustment led to the large Euro area weight for U.K. private equity relative to Dutch and other Euro area funds. If no dramatic change in average correlation was fund, no adjustment to the region weights were made.
Determining the lag for each fund is straightforward. For funds with five or more years of data, we calculate the correlation to the benchmark series for lags varying from zero to 520 trading days (approximately two calendar years. For most funds, the correlation exhibits a strong peak (see Appendix B of Ref. [3] for an example). We take the lag at peak correlation to be the best estimate of the lag.
Distributions of the maximum correlation for each aggregate asset class analogous to Figure 1 are shown in Figure 2. As seen in the data, the majority of funds display high correlation to the publicly listed benchmarks once lag is assumed in the data, especially for unlisted real estate.
The results are somewhat worse for unlisted infrastructure. For Dutch funds, average maximum correlations were 80 percent, 85 percent, and 63 percent for private equity, unlisted real estate and unlisted infrastructure respectively (medians are somewhat higher, 93 percent, 86 percent, and 67 percent). For other Euro area funds average maximum correlations were 81 percent, 84 percent, and 72 percent for private equity, unlisted real estate and unlisted infrastructure respectively (again, medians are somewhat higher at 82 percent, 86 percent, and 78 percent). For U.K funds average maximum correlations were notably higher, 83 percent, 92 percent, and 88 percent for private equity, unlisted real estate and unlisted infrastructure respectively (again, medians are somewhat higher, 86 percent, 95 percent, and 91 percent).
One conclusion from this analysis, and one that we have expressed elsewhere (see Ref. [3,6]), is that public equity is an excellent proxy for private equity, with expected correlations between the two in excess of 80 percent, and that listed real estate is an excellent proxy for unlisted real estate, with expected correlations around 85 and in some cases in excess of 90 percent). For infrastructure by contrast, only in the U.K. sample do we correlations in excess of 80 percent showing that access to infrastructure is less available publicly.
After determining the lag, we need to remove it from each fund’s unlisted asset return series. Our method is to first
note that the annual as-reported return in year 𝑦 with lag 𝑙, 𝑅𝑙,𝑦𝑟𝑒𝑝𝑜𝑟𝑡𝑒𝑑
, is a product of 𝑛 actual (unobserved) daily
returns 𝑟𝑡,𝑦𝑎𝑐𝑡𝑢𝑎𝑙 :
𝑅𝑙,𝑦𝑟𝑒𝑝𝑜𝑟𝑡𝑒𝑑
= ∏ (1 +
𝑛
𝑡=𝑛−𝑙+1
𝑟𝑡,𝑦−1𝑎𝑐𝑡𝑢𝑎𝑙) ∏(1 + 𝑟𝑡,𝑦
𝑎𝑐𝑡𝑢𝑎𝑙)
𝑛−𝑙
𝑡=1
− 1.
Defining 𝛼𝑙,𝑦 as the annual excess return over the lagged benchmark return we can re-write this as:
𝑅𝑙,𝑦𝑟𝑒𝑝𝑜𝑟𝑡𝑒𝑑
= ∏ (1 +
𝑛
𝑡=𝑛−𝑙+1
𝑟𝑡,𝑦−1𝑏𝑒𝑛𝑐ℎ𝑚𝑎𝑟𝑘) ∏(1 + 𝑟𝑡,𝑦
𝑏𝑒𝑛𝑐ℎ𝑚𝑎𝑟𝑘)
𝑛−𝑙
𝑡=1
− 1 + 𝛼𝑙,𝑦
where 𝑟𝑡,𝑦𝑏𝑒𝑛𝑐ℎ𝑚𝑎𝑟𝑘 is the (observed) daily benchmark return. To remove the lag, we need to make an assumption
about the lagged excess return. Our assumption is that the lagged excess return should be equal to the de-lagged excess return. This assumption plus the inferred lag determines our standardized de-lagged return as:

CEM Benchmarking Inc. 44
𝑅0,𝑦𝑑𝑒−𝑙𝑎𝑔𝑔𝑒𝑑
= (1 + 𝑅𝑙,𝑦𝑟𝑒𝑝𝑜𝑟𝑡𝑒𝑑
) (∏ (1 + 𝑟𝑡,𝑦
𝑏𝑒𝑛𝑐ℎ𝑚𝑎𝑟𝑘)𝑛𝑡=𝑛−𝑙+1
∏ (1 + 𝑟𝑡,𝑦−1𝑏𝑒𝑛𝑐ℎ𝑚𝑎𝑟𝑘)𝑛
𝑡=𝑛−𝑙+1
) − 1 + 𝛼𝑙,𝑦 (1 −∏ (1 + 𝑟𝑡,𝑦
𝑏𝑒𝑛𝑐ℎ𝑚𝑎𝑟𝑘)𝑛𝑡=𝑛−𝑙+1
∏ (1 + 𝑟𝑡,𝑦−1𝑏𝑒𝑛𝑐ℎ𝑚𝑎𝑟𝑘)𝑛
𝑡=𝑛−𝑙+1
)
The first term serves to remove trailing market return from the prior year 𝑦 − 1 while adding market return from the end of the actual year 𝑦. The last term ensures that the excess return is invariant under the transformation.
We note that all of the information about unlisted asset returns is contained in the set of excess return parameters 𝛼𝑙,𝑦. If the lagged unlisted asset returns are equal to the lagged benchmark returns (e.g., the set of
𝛼𝑙,𝑦 are all zero), then the de-lagged unlisted asset return is equal to the zero-lag benchmark return. If the lagged
unlisted asset returns deviate from the lagged benchmark return (e.g., the set of 𝛼𝑙,𝑦 are non-zero), the de-lagged
unlisted asset deviate from the zero-lag benchmark by the same amounts. The only effect of this transformation is to remove prior year market return and add current year market return.
Appendix B: Currency conversion
Currency conversion is used to transform AUM and net returns reported in currencies other than Euro for a subset of other Euro area funds. AUM conversion is accomplished using OECD purchasing power of parity conversion factors in order to eliminate fluctuations in AUM that might be caused by FX volatility.
Currency conversion for net returns is accomplished by assuming zero hedging and applying the currency return of the non-Euro currency to the reported net return in foreign currency. That is,
(1 + 𝑅€) = (1 + 𝑅𝑛𝑜𝑛 €)𝑥(1 + 𝑅𝑛𝑜𝑛 €→ €).
Here, 𝑅€is the converted net return in Euro, 𝑅𝑛𝑜𝑛−€ is the net return reported in non-Euro currency, and 𝑅𝑛𝑜𝑛−€→€ is the currency return of non-Euro currency relative to the Euro.

45 CEM Benchmarking Inc.
Figures 2A, 2B, and 2C. Distribution of correlations between ‘as-reported’ net returns and lagged public-market based benchmarks for (A) private equity, (B) unlisted real estate, and (C) unlisted infrastructure. See Appendix A for a discussion of methodology.
Figure 2A. Distribution of correlation – private equity
Figure 2B. Distribution of correlation – unlisted real estate
Figure 2C. Distribution of correlation – unlisted infrastructure
0
5
10
15
20
25
30N
um
ber
of
fun
ds
U.K.
NLD
Other Euro
0
5
10
15
20
25
30
35
40
Nu
mb
er o
f fu
nd
s
U.K.
NLD
Other Euro
0
2
4
6
8
10
12
14
Nu
mb
er o
f fu
nd
s
U.K.
NLD
Other Euro