assessment of summer 2000 wildfires - pacificbio.org · assessment of summer 2000 wildfires:...
TRANSCRIPT
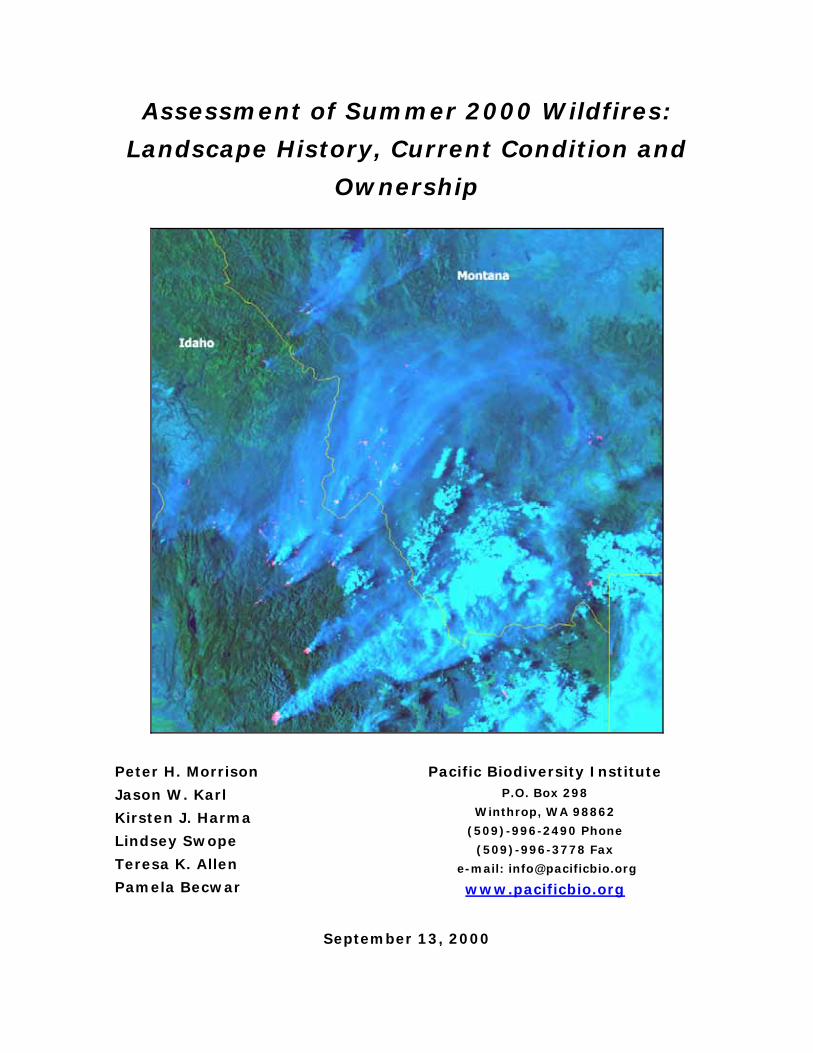
Assessment of Summer 2000 Wildfires:
Landscape History, Current Condition and
Ownership
Peter H. Morrison
Jason W. Karl
Kirsten J. Harma
Lindsey Swope
Teresa K. Allen
Pamela Becwar
Pacific Biodiversity Institute P.O. Box 298
Winthrop, WA 98862
(509)-996-2490 Phone
(509)-996-3778 Fax
e-mail: [email protected]
www.pacificbio.org
September 13, 2000
Executive Summary Pacific Biodiversity Institute undertook a rapid assessment of the national fire situation
during the summer 2000 fire season to shed some light on several questions of national interest: • What conditions contributed to the severe fire season this year? • Can anything be done to prevent similar situations in future years? • Would forest thinning and/or prescribed burning help prevent repeats of this fire season?
To investigate these questions, we undertook a two-part analysis of fires that have burned this summer in the western United States. First, we analyzed the extents of all fires burning in the western United States (from July 4 to August 22) in relation to historic fire trends, land ownership and management. In the second part of our assessment, we conducted a landscape-level analysis of eleven of the largest fires that have burned this summer to gain insight on the overall fire situation. The fires that we chose have also received the majority of the media attention directed at wildfires. Our choice of this set of wildfires was based on overall area burned, wildfire containment costs and availability of data. Our analysis relied on existing information compiled by public land and fire management agencies. These information sources are referenced throughout the report. The National Perspective
The current (August 30, 2000) nationwide wildfire-area total is approximately 6.6 million acres. When viewed in the perspective of the period from 1916 to 1999, the total acreage burned this year is still well below the average (13.9 million acres) for the last century. During the last 100 years, individual fires sometimes exceeded 3 million acres. In fact, some of the country burning today burned in the 3-million-acre Great Idaho fire of 1910 (sometimes referred to as the Big Burn of 1910).
While this year’s nationwide wildfire-burn-area total is not excessively high compared to the long-term average for the last century, fire activity does seem to be especially high in some regions (northern Rockies and Texas) and of greater severity than most firefighters have experienced in the recent past. La Niña and its influence on weather patterns this year resulted in a combination of dry fuels and dry, hot weather. This resulted in a situation where record-low fuel moistures have developed across much of the West. These weather conditions contributed to a wildland fire season that began early, became intense, and is expected to last unusually long.
Only 31% of the nationwide-burn area is on National Forest land (as of August 30, 2000). Overlay of burn area boundaries derived from AVHRR heat signatures with Wilderness, US Forest Service Inventoried Roadless Areas, and National Forest boundaries revealed that 62% of the fires in the Western United States (excluding Alaska and Hawaii) were burning in roaded
2
areas on National Forests or outside the National Forests on other ownerships during the period for which heat signatures were available. Nationwide, a large amount of the total fire acreage consists of grassland, shrub-steppe, chaparral, juniper woodlands, sagebrush or some other land cover types where forest thinning is not an option. Our initial estimate, as of August 30, 2000, is that only about 500,000 acres of the area burned this year (about 8% of the 6.6-million-acre nationwide burn total) consists of dry forests on National Forest land. There is growing consensus that in these dry forests, fire exclusion policies have created unnatural conditions that may have led to more severe wildfires. The remaining 92% of the area burned so far this year represent areas where federal forest thinning operations may either be entirely inappropriate (not federal ownership or non-forested land) or in forest types where there is much less consensus about the benefits of thinning operations. Valley/Skalkaho Fire Complex, Montana
The Valley/Skalkaho Fire Complex, in the Bitterroot National Forest, Montana, is the largest fire complex currently burning in the United States. These fires started in a roaded landscape managed for grazing and timber production and burned primarily through US Forest Service and Darby Lumber Company land. Eventually, the fires spread into US Forest Service Inventoried Roadless Areas and Wilderness. As of August 21, 2000, 74% of the burn was in roaded and developed areas. Many areas within the complex have previously burned in the past 120 years. A 3,900-acre area that did not burn in this year's fire burned two years ago (1998), and it is the only unburned area currently mapped within the fire complex perimeter. While the severity of the fire across the Valley/Skalkaho Complex has yet to be determined, it is possible that logging activity exacerbated the severity and spread of the fire. Kate’s Basin Fire, Wyoming
The Kate’s Basin Fire started on the Wind River Indian Reservation, southwest of Thermopolis, Wyoming and spread rapidly, covering 137,600. Kate’s Basin was the largest fire in Wyoming this year, and one of the largest in the nation. The fire burned in a non-forested environment and did not involve any federal land. Fire-exclusion policies may have contributed to a build-up of brush and fine fuels in this area, but efforts to thin federal forestland would have no effect on the outcome of this fire because there were few trees. When evaluating national fire statistics, it is important to note that fires like Kate’s Basin contributed substantial acreage to the nationwide total, even though no forest was burned.
3
Canyon Ferry Fire Complex, Montana The Canyon Ferry Fire Complex started in developed areas northeast of Helena, Montana
and spread through managed (previously logged) landscapes before burning into roadless areas. The first of the two main fires was human-caused, and the cause of the second fire is under investigation. The majority of the land burned by the fires (69%) was outside of Inventoried Roadless Areas. This fire is an example of a trend that has been noted in many studies, in which roaded and developed landscapes increase the potential for human-caused fires, and that wildfires often spread more quickly through actively managed landscapes. Although this fire burned nearly 44,000 acres, a substantial portion of the area (24,647 acres or 56%) is in non-federal ownership or in non-forested federal land. It is important to remember these facts when total fire areas are lumped together into a statewide or national total. Burgdorf Junction Fire, Idaho
On July 14, 2000, a fire started near the fire camp outside of the town of Burgdorf, Idaho and spread northward to cover an area of 49,947 acres. This fire has burned almost entirely in US Forest Service Inventoried Roadless Areas and Wilderness Areas. Most of the Burgdorf Junction fire area is very steep and posed a great obstacle for fire-suppression efforts. This steep and rugged terrain would also pose severe limitations on road building and any silvicultural operations, including forest-thinning programs. The costs of such operations would greatly exceed the benefits. The majority of the Burgdorf Junction fire has burned through subalpine forest types that typically experience low-frequency/high-severity fire regimes. Since widespread fire suppression began in 1911, many subalpine forests have not yet missed an entire fire cycle. Also, there have been many large and small fires in and near the current Burgdorf Junction Fire. For the Burgdorf Junction area to be burning at this time is entirely within the range of historic variability. Clear Creek Fire, Idaho
The Clear Creek Fire started in the Frank Church-River of No Return Wilderness and spread into US Forest Service Inventoried Roadless Areas in the Salmon-Challis National Forest. The fire has burned mostly in subalpine and montane forests and almost exclusively on US Forest Service land. The subalpine and montane forests of this area are more likely to have a lower-frequency and higher-intensity fire regime than the dry coniferous forests, which have been altered the most by fire exclusion. Less than 4% of the Clear Creek Fire area consists of dry coniferous forest. Developing road access to the unroaded portions of the fire area would be prohibitively expensive and cause extensive environmental degradation. The steep terrain and remoteness of the area, combined with the land-cover types present indicate that this is an area
4
where forest-thinning programs should be limited to areas near human habitation. More extensive thinning programs would have high costs and limited benefits.
Maloney Creek Fire, Idaho
The Maloney Creek Fire started during a dry lightning storm near the confluence of Maloney Creek and the Salmon River and covered 74,000 acres. The majority of the burn was on the Idaho Department of Fish and Game’s Craig Mountain Wildlife Management Area, and only a very small percentage burned on US Forest Service land. The burn was mostly in the steep grasslands and exposed basalt rock cliffs that characterize this area. US Forest Service ownership is limited to a narrow corridor bordering the Snake River that consists of non-forest land cover types. The Maloney Creek fire burned in an area that has a very active fire history. Federal programs to reduce fire risk by forest thinning would not have prevented this fire.
East Side Complex, Oregon Dry lightning ignited the East Side Fire Complex on the Wallowa-Whitman National Forest. The total area in the fire perimeters was 93,451 acres when the fires were contained. The fires burned primarily on grasslands, in steep, non-forested terrain within the Hell’s Canyon National Recreation area on the Wallowa-Whitman National Forest. Minimizing the impacts to winter range for cattle was one of the primary fire fighting objectives. The East Side Complex fires were among the largest in the nation this summer, and are an example of fires burning largely on non-forested and managed landscapes where federal programs to reduce forest fire risk would not be effective. Mule Dry Creek Fire, Washington
On August 23, 2000, lightning started the Mule Dry Creek Fire on the Yakama Indian Reservation. No National Forest land was involved. The dominant land cover burned in these fires was grasslands and sagebrush. The Mule Dry Creek fire is among the largest fires in terms of acreage in the summer of 2000 (77,000 acres). It is an example of a fire burning on roaded, non-forested, non-Forest Service land. Hanford / Two Forks / Command 24 Fire, Washington
A fatal automobile collision ignited a brush fire that grew to burn 190,000 acres of land near the Hanford Nuclear Reservation. The fire burned mostly a dry desert landscape consisting of sagebrush and grasslands. It was located mostly on the Hanford Nuclear Reservation. The Hanford Fire was one of the largest in the nation this summer, and received much media attention due to its proximity to the Hanford Nuclear Facility. However, it would be inaccurate
5
to call this a “forest fire” as none of the area burned was forested. The Hanford fire is an example of a human-caused fire in a roaded and non-forested area. Maudlow-Toston Fire, Montana
The Maudlow–Toston Fire, northeast of Belgrade, Montana, was started by accident when sparks from a rancher’s combine landed in a wheat field. The majority of the land burned is private land. Only 13% of the burn area is on National Forest ownership. The vegetation in the burn area is mainly grassland with some coniferous forest. This fire highlights the point that many fires (36% of the fires we studied) are human-caused. Federal programs to reduce the risk of forest fire would not have been effective in preventing this fire.
Jasper Fire, South Dakota
Arson is the suspected cause of the Jasper Fire, located 16 miles west of Custer, South Dakota. High temperatures and dry fuel conditions contributed to this fire’s rapid spread. The Jasper fire burned mostly on the Black Hills National Forest. The fire started in an area that has an extremely high road density and recent logging/thinning history. The Jasper Fire is an example of one of the summer of 2000’s large fires that swept through a heavily roaded and managed landscape. The area where the fire started consisted of a sparse forest crisscrossed by a multitude of skid trails and roads resulting from intensive logging activity. The fire burned very rapidly in this actively managed forest and in a few days burned over 83,500 acres. The Jasper Fire is evidence that catastrophic firestorms occur in very heavily managed forest landscapes. This is a case where it is highly unlikely that more logging and thinning would have prevented this fire from occurring.
Conclusions and Recommendations
There is great variability in historic fire regimes that coincides with the great diversity of vegetation types present on the landscape. The ecological effects of wildfire exclusion policies have also varied considerably with vegetation type and landscape condition. While it is tempting to try to develop simple solutions to the wildfire issue, it is likely that such solutions may not aid in resolving the complex issues surrounding wildfire and forest management. The wildfires analyzed in this report span a wide range of land-cover types, landscape history and wildfire behavior.
Many of the wildfires that have burned this year have either burned entirely in non-forested areas or have involved substantial acreage of non-forest or forests with sparse tree cover. In these areas, forest-thinning programs are inappropriate because tree density is already
6
low or there are no trees. In this study, we examined eight major fires that clearly illustrate this point.
This summer, wildfires are burning in areas that have a long history of human settlement and management, as well as remote wildlands where human use is sporadic and management influences have been limited. The results of our eleven case studies and our analysis of fires burning across the western United States clearly indicates that more intensely managed areas burn at least as readily as less intensely managed areas. The Jasper Fire and the Valley/Skalkaho Complex fires (as well as portions of many other fires) are clear evidence that catastrophic firestorms can sweep across areas that have a long history of logging, thinning, roadbuilding, grazing, and other intensive management activities. Our results are in agreement with several other studies that indicate that previously logged and roaded areas can pose a high fire risk.
People have progressively moved into areas that are highly flammable. Many people now live in or near the zone that is dominated by dry forests that have been greatly altered by both fire exclusion and past logging. Both of these management influences have created a situation in which we have the worst fire danger right where it endangers people the most. Part of the solution to this problem is increased use of prescribed fire in many western landscapes. Thinning of dense stands of small-diameter trees in strategic locations to create a defensible space around communities and rural homes that are surrounded by dry forests also holds the potential for reducing wildfire risk to our rural communities. Regular prescribed burning must follow any thinning program for effective wildfire risk reduction. Thinning programs applied to backcountry areas will have little or no benefit in terms of wildfire risk reduction.
Prescribed natural fire (i.e., letting naturally ignited fires burn with minimal intervention) is beginning to be allowed in some wilderness areas and allows an area to maintain its historic fire regime. This policy should be expanded to roadless areas so that those may maintain or regain historic fire regimes as well. In this manner, money and effort may be invested in fighting fires that occur in managed landscapes and near the rural-forest interface, while allowing the ecological integrity of the landscapes to be maintained. This year huge sums of money were spent fighting fires in backcountry that posed little risk to our society. Expanded use of prescribed natural fire would be warranted in similar situations in the future.
The perspective that has dominated the current wildfire discussion is that it is a disaster that so much area has burned. However, there is another perspective, which understands that wildfire is a critical process of a healthy, ecosystem. The wildfires that burned in most roadless and wilderness areas this year (and in past years) should certainly be viewed in this light. After the smoke clears and profuse wildflowers bloom in many burned areas, recognition will start to grow again that many of the wildfires may have enhanced the environment rather than harming it and certainly did no great harm to our society. Many species, including some that are threatened
7
or endangered, are dependent on fire occurrence to improve habitat conditions, recycle nutrients, and maintain diverse landscapes. The fact that many of our ecosystems will benefit from this year’s fire episode often is lost in all the heat and smoke of public and political discourse.
This does not imply that we should neglect the protection of our communities and forego attempts to reduce wildfire risks in appropriate places (as outlined above). We need to accept that fire is part of our landscape (whether we like it or not) and develop a sensible approach that focuses wildfire risk-reduction measures and fire-fighting efforts on a limited portion of the landscape near human settlements. A large burden of responsibility falls on the homeowner to design and maintain their property in a fashion that will withstand wildfire. This study also points to the fact that many wildfires do not involve forests. Prescribed burning and proper home design and maintenance are the only solutions to protecting homes from fire damage in situations where homes are surrounded by flammable grass and shrublands.
Acknowledgments We would like to thank the following individuals for their comments and discussion on
earlier drafts of this manuscript: Penelope Morgan, Ph.D., fire ecologist, University of Idaho; Tom Swetnam, Ph.D., fire historian and ecologist, University of Arizona; Michael Murray, Ph.D., ecologist, Oregon Natural Heritage Program; Jeff Yeo, Ph.D., consulting ecologist; and one anonymous reviewer. We are also grateful to the following individuals for comments and editing: George Bracksieck, Mitch Friedman, and Kieran Suckling. Support for this project was provided by: Center for Biodiversity, Defenders of Wildlife, Harter Foundation, Heritage Forest Campaign, Northwest Ecosystem Alliance and Pacific Rivers Council.
8
Table of Contents Executive Summary ........................................................................................................................ 2 Acknowledgments........................................................................................................................... 8 Table of Contents............................................................................................................................ 9 List of Tables ................................................................................................................................ 10 List of Figures ............................................................................................................................... 11 Introduction................................................................................................................................... 13 Methods......................................................................................................................................... 13 Results........................................................................................................................................... 15
The National Perspective .......................................................................................................... 15 Valley/Skalkaho Complex, Montana ........................................................................................ 19 Kate’s Basin Fire, Wyoming..................................................................................................... 27 Canyon Ferry Complex, Montana............................................................................................. 32 Burgdorf Junction Fire, Idaho................................................................................................... 37 Clear Creek Fire, Idaho............................................................................................................. 45 Maloney Creek, Idaho............................................................................................................... 50 East Side Complex, Oregon...................................................................................................... 54 Mule Dry Fire, Washington ...................................................................................................... 57 Hanford Fire, Washington ........................................................................................................ 59 Maudlow-Toston Complex, Montana....................................................................................... 62 Jasper Fire, Wyoming ............................................................................................................... 65
Discussion ..................................................................................................................................... 69 Conclusions................................................................................................................................... 73 References..................................................................................................................................... 74
9
List of Tables Table 1: Land Management Status of Summer 2000 Fire Areas in Western United States......... 18 Table 2: Land Cover Types For Fires Burning in Idaho, Montana and Wyoming....................... 18 Table 3: Valley/Skalkaho Complex Fire Statistics as of August 22, 2000................................... 19 Table 4: Land ownership in the Valley/Skalkaho Complex ......................................................... 21 Table 5: Land-cover types burned in the Valley/Skalkaho Complex ........................................... 21 Table 6: Kate’s Basin Fire Statistics as of August 22, 2000........................................................ 27 Table 7: Land ownership for the Kate’s Basin Fire..................................................................... 28 Table 8: Land cover types burned in the Kate’s Basin Fire......................................................... 29 Table 9: Canyon Ferry Complex fire Statistics as of August 22, 2000 ....................................... 32 Table 10: Land ownership in the Canyon Ferry Complex fires................................................... 33 Table 11: Land cover types burned in the Canyon Ferry Complex fires..................................... 36 Table 12: Burgdorf Junction Fire Statistics as of August 21, 2000 ............................................. 38 Table 13: Percentage of the Burgdorf Junction fire by ownership ............................................... 39 Table 14: Percentage of land cover for the Burgdorf Junction fire. ............................................. 40 Table 15: Clear Creek Fire Statistics as of August 22, 2000 ....................................................... 45 Table 16: Land ownership for the Clear Creek Fire .................................................................... 46 Table 17: Land cover types burned in the Clear Creek Fire ........................................................ 47 Table 18: Maloney Fire Statistics as of August 29, 2000 ............................................................. 50 Table 19: Land ownership for the Maloney Creek Fire................................................................ 51 Table 20: East Side Complex Fire Statistics as of September 5, 2000 ......................................... 55 Table 21: Mule Dry Creek Fire Statistics as of August 29, 2000 ................................................. 57 Table 22: Hanford Site Fire Statistics as of August 1, 2000........................................................ 60 Table 23: Maudlow – Toston Fire Statistics as of September 7, 2000 ......................................... 62 Table 24: Land Ownership the Maudlow-Toston Fire Area as of September 8, 2000................. 63 Table 25: Jasper Fire Statistics as of September 7, 2000.............................................................. 65
10

List of Figures Figure 1: Location of eleven fires studied. ................................................................................... 14 Figure 2: National wildfire area by year 1916-2000.................................................................... 16 Figure 3: Valley/Skalkaho Complex Fire Acreage by Date ......................................................... 20 Figure 4: Land Ownership in the Valley/Skalkaho Complex Fire ............................................... 22 Figure 5: Satellite view (1993, Landsat Thematic Mapper) of portion of area burned in the Valley
Complex fires showing roads, logging activity and some remaining uncut forests ............. 23 Figure 6: Percentage of Valley/Skalkaho Complex in Roaded and Roadless Areas.................... 23 Figure 7: Roadless and Wilderness areas in the Valley/Skalkaho Complex ................................ 25 Figure 8: Land cover types in the Valley/Skalkaho Complex ...................................................... 26 Figure 9: Kate’s Basin Fire Acreage by Date .............................................................................. 28 Figure 10: Kate’s Basin Land Ownership..................................................................................... 29 Figure 11. Kate’s Basin Land Cover............................................................................................. 30 Figure 12: Aerial photograph showing land cover in the eastern region of the area burned
subsequently by the Kate’s Basin Fire.................................................................................. 30 Figure 13: Aerial photograph showing land cover in the western portion of the area burned
subsequently by the Kate’s Basin Fire.................................................................................. 31 Figure 14: Landsat 5 satellite image of land cover in Kate's Basin Fire area............................... 31 Figure 15: Land ownership in the Canyon Ferry Complex .......................................................... 34 Figure 16: U.S. Forest Service Inventoried Roadless Areas in the Canyon Ferry Complex........ 35 Figure 18: Burgdorf Junction Fire Acreage by Date ................................................................... 38 Figure 19: Land management in Burgdorf Junction fire area....................................................... 39 Figure 20: Land cover types in the Burgdorf Junction fire area. .................................................. 41 Figure 21: Slope/steepness in the area of the Burgdorf Junction fire. .......................................... 42 Figure 22: Pertinent Fire History for the area surrounding the Burgdorf Junction fire. ............... 43 Figure 23: Burned area east of Burgdorf Junction Fire ................................................................ 43 Figure 24: Clear Creek Fire Acreage by Date ............................................................................. 46 Figure 25: Land management in the Clear Creek fire area........................................................... 47 Figure 26: Clear Creek Fire Complex General Land Cover ......................................................... 48 Figure 27: Clear Creek Fire Complex Slope Steepness................................................................ 49 Figure 28: Land ownership of the Maloney Creek burn area. ...................................................... 51 Figure 29: Land cover on the Maloney Creek burn area. ............................................................. 52 Figure 30: China Creek, a tributary of the Salmon River that was within the Maloney Creek burn
perimeter, is very similar to that of the entire burn............................................................... 52
11
Figure 31: Locations of previous fires recorded on the Maloney Creek Burn and surrounding area........................................................................................................................................ 53
Figure 32: The Wapshilla Ranch, maintained by Idaho Department of Fish and Game, was built off of the Salmon River on the southeast portion of the Maloney Creek burn in the early 1900’s as a home for sheep ranchers .................................................................................... 54
Figure 33: Fire Extent and Land Ownership................................................................................ 55 Figure 34: The NW end of the Eastside Complex, in the Cold Springs Creek area of the Jim
Creek Fire.............................................................................................................................. 56 Figure 35: Digital Orthophotograph of a portion of the Deep Creek fire, bounded to the north by
the Snake River ..................................................................................................................... 56 Figures 37: Fire in Shrub-Steppe .................................................................................................. 58 Figures 38: Fire in Shrub-Steppe .................................................................................................. 59 Figure 39: Ignition Point along Highway 24, looking south towards the Hanford Site ............... 60 Figure 40: Where the fire crossed Highway 240 .......................................................................... 61 Mountain in the background ......................................................................................................... 61 Figure 41: Infrared photograph of the Hanford Fire area before June 27..................................... 61 Figure 42: Infrared photograph of the Hanford Fire area after the burn....................................... 61 Figure 43: General Location of Maudlow-Toston Complex ........................................................ 63 Figure 44: Digital Orthophoto of area 9 kilometers northwest of Maudlow, Montana, in the
southern portion of the burn area, showing agricultural lands and grasslands with patches of coniferous forest.................................................................................................................... 64
Figure 45: Fire Ignition Point, August 24, 2000........................................................................... 65 Figure 46: Convection cloud of smoke from Jasper Fire.............................................................. 65 Figure 47: Land Ownership and Road Density............................................................................. 66 Figure 48: Digital Orthophoto of area to the north of Highway 16, near the ignition point......... 66 Figure 49: Jasper Fire area north of ignition point ....................................................................... 67 Figure 50: Unharmed trees in burned area.................................................................................... 68 Figure 51: Houses and outbuildings in burn area ......................................................................... 68
12
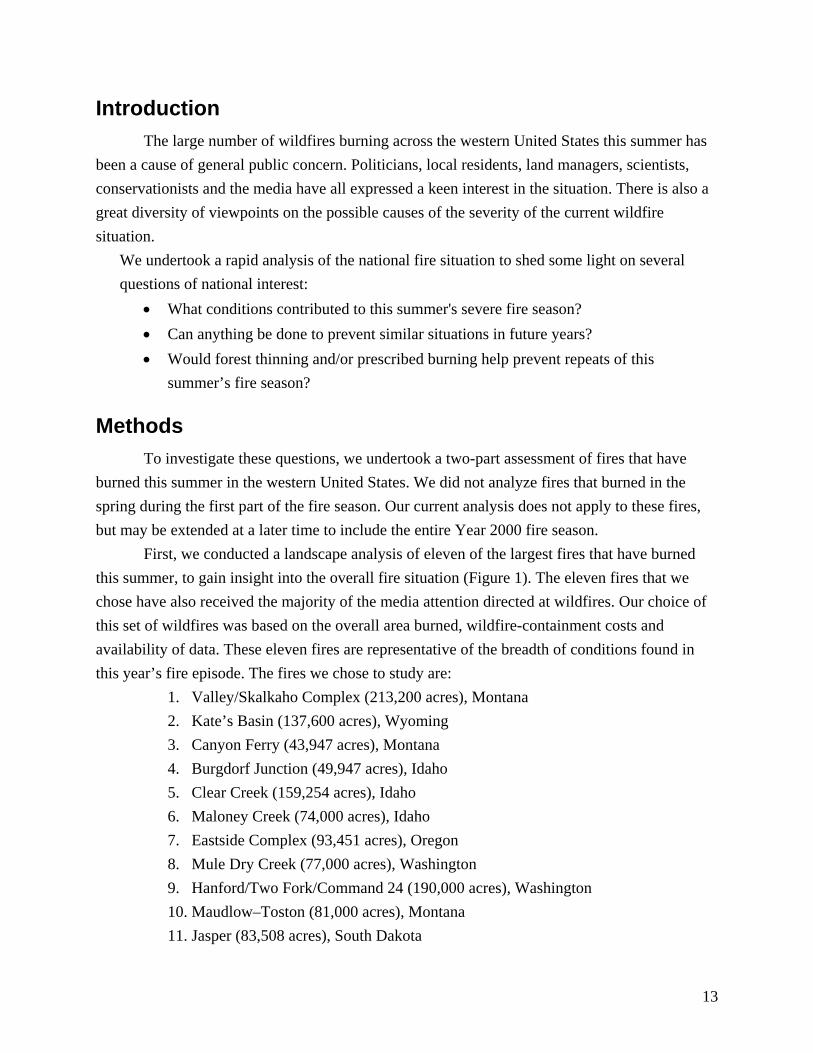
Introduction The large number of wildfires burning across the western United States this summer has
been a cause of general public concern. Politicians, local residents, land managers, scientists, conservationists and the media have all expressed a keen interest in the situation. There is also a great diversity of viewpoints on the possible causes of the severity of the current wildfire situation.
We undertook a rapid analysis of the national fire situation to shed some light on several questions of national interest:
• What conditions contributed to this summer's severe fire season? • Can anything be done to prevent similar situations in future years? • Would forest thinning and/or prescribed burning help prevent repeats of this
summer’s fire season?
Methods To investigate these questions, we undertook a two-part assessment of fires that have
burned this summer in the western United States. We did not analyze fires that burned in the spring during the first part of the fire season. Our current analysis does not apply to these fires, but may be extended at a later time to include the entire Year 2000 fire season.
First, we conducted a landscape analysis of eleven of the largest fires that have burned this summer, to gain insight into the overall fire situation (Figure 1). The eleven fires that we chose have also received the majority of the media attention directed at wildfires. Our choice of this set of wildfires was based on the overall area burned, wildfire-containment costs and availability of data. These eleven fires are representative of the breadth of conditions found in this year’s fire episode. The fires we chose to study are:
1. Valley/Skalkaho Complex (213,200 acres), Montana 2. Kate’s Basin (137,600 acres), Wyoming 3. Canyon Ferry (43,947 acres), Montana 4. Burgdorf Junction (49,947 acres), Idaho 5. Clear Creek (159,254 acres), Idaho 6. Maloney Creek (74,000 acres), Idaho 7. Eastside Complex (93,451 acres), Oregon 8. Mule Dry Creek (77,000 acres), Washington 9. Hanford/Two Fork/Command 24 (190,000 acres), Washington 10. Maudlow–Toston (81,000 acres), Montana 11. Jasper (83,508 acres), South Dakota
13
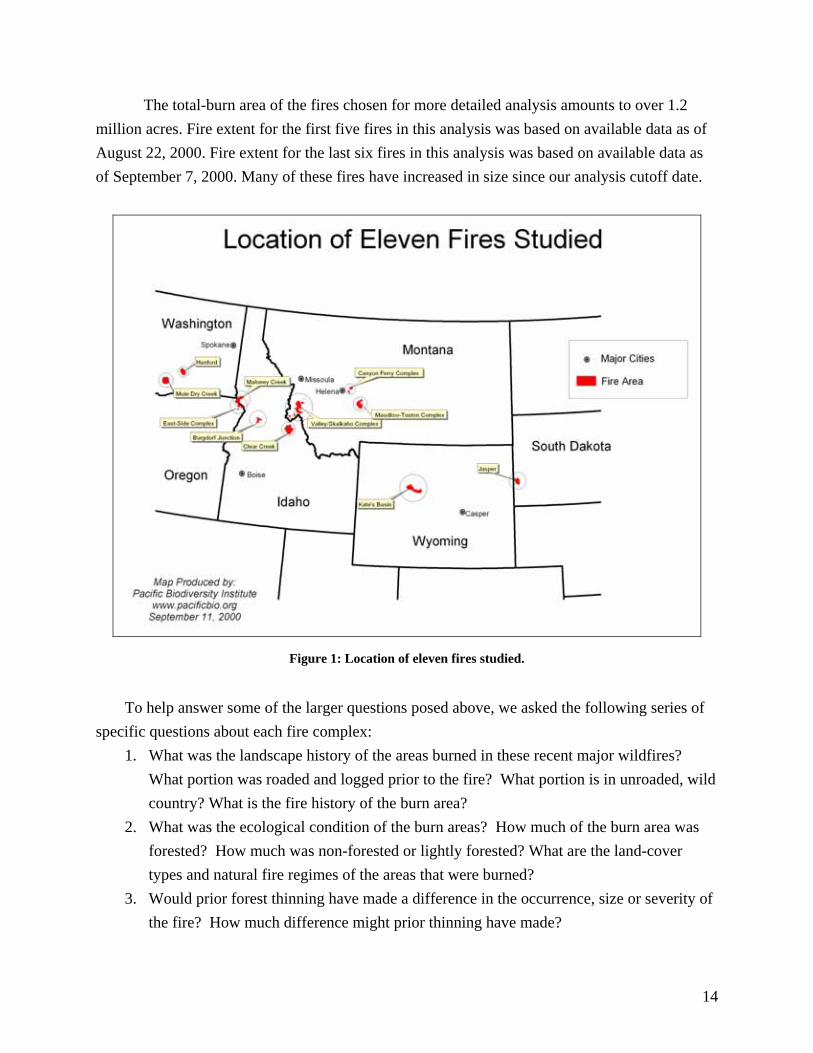
The total-burn area of the fires chosen for more detailed analysis amounts to over 1.2 million acres. Fire extent for the first five fires in this analysis was based on available data as of August 22, 2000. Fire extent for the last six fires in this analysis was based on available data as of September 7, 2000. Many of these fires have increased in size since our analysis cutoff date.
Figure 1: Location of eleven fires studied.
To help answer some of the larger questions posed above, we asked the following series of
specific questions about each fire complex: 1. What was the landscape history of the areas burned in these recent major wildfires?
What portion was roaded and logged prior to the fire? What portion is in unroaded, wild country? What is the fire history of the burn area?
2. What was the ecological condition of the burn areas? How much of the burn area was forested? How much was non-forested or lightly forested? What are the land-cover types and natural fire regimes of the areas that were burned?
3. Would prior forest thinning have made a difference in the occurrence, size or severity of the fire? How much difference might prior thinning have made?
14
In the second part of our assessment, we analyzed the extents of all fires burning in the western United States in relation to historic fire trends, land ownership and management history. In particular, we examined the following questions:
1. How does this year’s fire season compare to that of previous years, in terms of acreage burned and size of individual fires?
2. What is the ownership, management history, and landscape condition of the areas burning in the western United States?
We obtained documentation of daily fire activity for the western United States, for the period of July 4 to August 22, 2000, from the US Forest Service (ftp://gis.fs.fed.us). The fire-activity layers were derived each day from Advanced Very High Resolution Radiometer (AVHRR) satellite imagery. The AVHRR images (1 km resolution) were displayed on-screen, and heat signatures were visually interpreted by US Forest Service personnel. The resulting geographic information system (GIS) layers represent “hot-spots” (i.e., areas with higher than normal surface temperature) for that day. Since the GIS layers for each day depict only what was then hot, and not necessarily what had previously burned, we merged the daily fire-activity layers spanning the full time period, to create a layer of full-burn extents for the western United States. We then compared the fire extents to GIS layers of US Forest Service Ownership, Inventoried Roadless Areas and Wilderness Areas for the western United States (excluding Alaska and Hawaii). We also compared the fire extents to land cover maps developed by the Gap Analysis projects (See www.gap.uidaho.edu for more information) for Idaho, Montana, and Wyoming.
Our analysis relies on existing information compiled by public land and fire management agencies. These information sources are referenced throughout the report. We used GIS software (Arc/Info and ArcView) and image processing software (ERDAS) to study the fire areas and analyze the landscape history and condition of each fire. We also incorporated fire information from national and local fire-information sources and phone interviews with fire-information specialists.
Results
The National Perspective How does this year’s fire season compare to that of previous years, in terms of acreage burned and size of individual fires?
Until the fire season is over, it is premature to say that this year is the most extreme in the last 50 years. The current (September 11, 2000) nationwide wildfire-burn-area total is about 6.6 million acres. When viewed in the perspective of the period from 1916 through 1999, the total acreage burned this year is still well below the yearly average (13.9 million acres) for the last
15

century (Figure 2) (data from National Interagency Fire Center - www.nifc.gov). During the 1950s, the total wildfire-burn area for each of several years exceeded 10 million acres. In 1988 and 1963 the total exceeded 7 million acres. It is unlikely that the total this year will reach the yearly average for the last century or even start to approach the over 50 million acres which burned in each of 1930 and 1931.
While this year’s nationwide wildfire-burn-area total is not abnormal compared to the long-term average for the last century, fire activity does seem to be especially high in some regions (northern Rockies and Texas) and of greater severity than most fire-fighters have experience in the recent past. It is also worth noting that historical comparisons of nationwide-fire-burn area are problematic because of the lack of high quality statistics on burn area in the first half of the 20th century. Lumping together all wildfires burning in the disparate regions of the country masks important trends that may be seen at a regional level.
Extreme drought conditions and heat in many fire areas was an important factor influencing fire behavior and spread this season. “As a result of La Niña and its influence on weather patterns, a combination of dry fuels and dry, hot weather led to what some are declaring one of the most serious wildland fire seasons in U.S. history. The absence of the seasonal monsoons in the Southwest, the dry vegetation and record-low fuel moistures, and the persistently hot weather across much of the West, culminated in a wildland fire season that began early, became intense, and is expected to last unusually long” (National Interagency Fire Center analysis August, 2000 – http://www.nifc.gov).
National Wildfire Acreage By Year1916 to August 30, 2000
0
10,000,000
20,000,000
30,000,000
40,000,000
50,000,000
60,000,000
1916
1919
1922
1925
1928
1931
1934
1937
1940
1943
1946
1949
1952
1955
1958
1961
1964
1967
1970
1973
1976
1979
1982
1985
1988
1991
1994
1997
2000
Year
Are
a (a
cres
)
Figure 2: National wildfire area by year 1916-2000. Data from National Interagency Fire Center
16
During the last 100 years, individual fires sometimes exceeded 3 million acres. In fact, some of the country burning today burned in the 3-million-acre Great Idaho Fire of 1910 (sometimes referred to as the Big Burn of 1910). This fire is described as "a firestorm that savaged the towering forests of the Bitterroot Mountains with a force of near-atomic intensity. It killed at least 87 people, most of them firefighters trapped when hurricane-force winds swept the range on Aug. 20 and 21, turning scores of smaller blazes into a howling juggernaut of flame" (The Seattle Times, August 11, 2000). The Big Burn of 1910 happened before the 90 years of fire exclusion that is currently blamed for the greatly enhanced fire danger present in today's forests. This indicates that large fires have occurred in the historic past during extreme weather conditions - even in the period prior to the fire-exclusion era.
We do not discount the affect of many years of fire exclusion on our forests and rangelands. There certainly are areas where biomass has built up to levels that are beyond the historic range of variability. These fuel accumulations have caused more severe wildfire behavior in some areas. But it is far too simplistic to blame this year’s fire situation on fuel buildups resulting from past forest management activities or political decisions. Many factors are involved in this year’s fire situation, but extreme weather conditions appear to be the most proximate cause.
What is the ownership, landscape condition and management status of the areas burned by recent wildfires?
Most of the acreage that has burned this year is not on National Forest land. Only about 31% of the nationwide total is on National Forest land (as of August 30, 2000) (National Interagency Fire Center – http://www.nifc.gov).
We conducted a rapid assessment of the management status of burn areas, based on available information as described in the "Methods" section of this report. Our overlay of burn-area boundaries derived from AVHRR heat signatures with U.S. Forest Service GIS data on Inventoried Roadless and Wilderness Areas and National Forest boundaries revealed that, during the period for which heat signatures were available, 62% of the fires in the western United States (excluding Alaska and Hawaii) were burning in roaded areas on National Forests or outside the National Forests on other ownerships (Table 1). Only 16% of the fires were burning in U.S. Forest Service Inventoried Roadless Areas. Twenty-two percent of the fire area occurred in Wilderness.
The Wilderness and Roadless Areas have been affected by the fire-exclusion policies adopted by the federal government, but have not been subjected to intensive management or development. Roaded landscapes have been subjected to more intensive management and development. Twenty percent of the fires are occurring within these roaded and more intensely
17
managed National Forest lands. Much of the total burn area that is under other ownership is also more intensively managed landscape. These results indicate that more intensely managed areas burn at least as readily as less intensely managed areas.
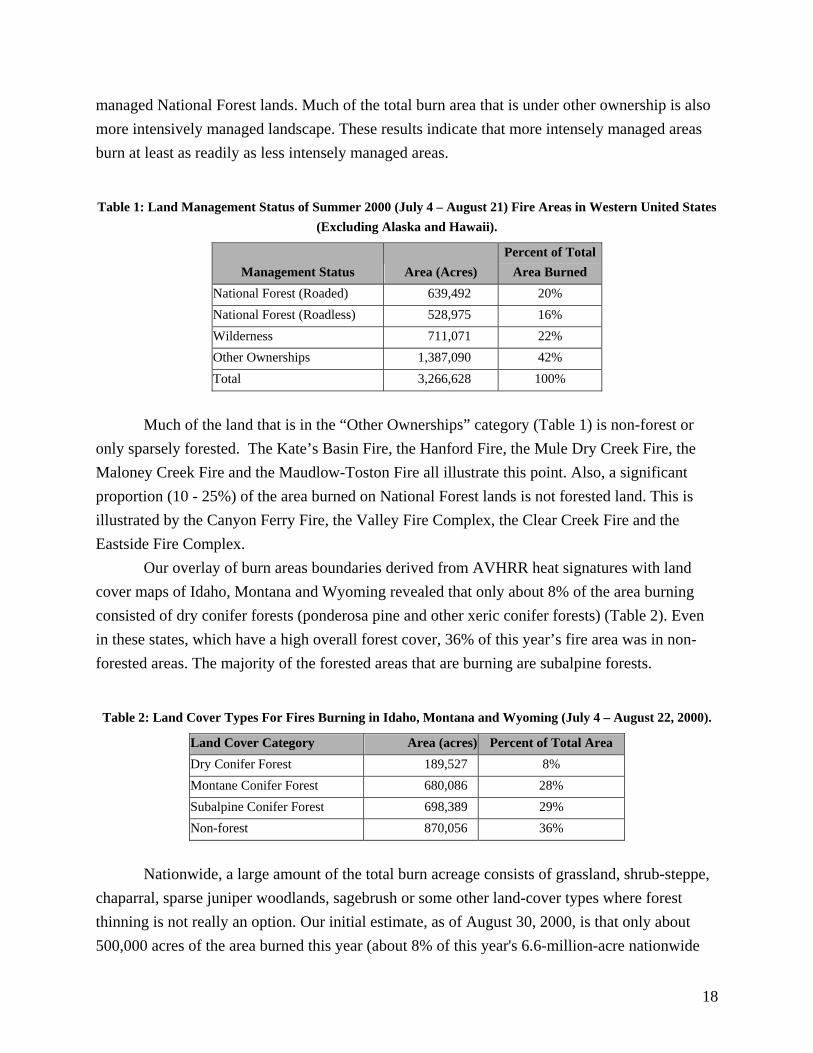
Table 1: Land Management Status of Summer 2000 (July 4 – August 21) Fire Areas in Western United States (Excluding Alaska and Hawaii).
Management Status Area (Acres) Percent of Total
Area Burned National Forest (Roaded) 639,492 20% National Forest (Roadless) 528,975 16% Wilderness 711,071 22% Other Ownerships 1,387,090 42% Total 3,266,628 100%
Much of the land that is in the “Other Ownerships” category (Table 1) is non-forest or
only sparsely forested. The Kate’s Basin Fire, the Hanford Fire, the Mule Dry Creek Fire, the Maloney Creek Fire and the Maudlow-Toston Fire all illustrate this point. Also, a significant proportion (10 - 25%) of the area burned on National Forest lands is not forested land. This is illustrated by the Canyon Ferry Fire, the Valley Fire Complex, the Clear Creek Fire and the Eastside Fire Complex.
Our overlay of burn areas boundaries derived from AVHRR heat signatures with land cover maps of Idaho, Montana and Wyoming revealed that only about 8% of the area burning consisted of dry conifer forests (ponderosa pine and other xeric conifer forests) (Table 2). Even in these states, which have a high overall forest cover, 36% of this year’s fire area was in non-forested areas. The majority of the forested areas that are burning are subalpine forests.
Table 2: Land Cover Types For Fires Burning in Idaho, Montana and Wyoming (July 4 – August 22, 2000).
Land Cover Category Area (acres) Percent of Total Area Dry Conifer Forest 189,527 8% Montane Conifer Forest 680,086 28% Subalpine Conifer Forest 698,389 29% Non-forest 870,056 36%
Nationwide, a large amount of the total burn acreage consists of grassland, shrub-steppe,
chaparral, sparse juniper woodlands, sagebrush or some other land-cover types where forest thinning is not really an option. Our initial estimate, as of August 30, 2000, is that only about 500,000 acres of the area burned this year (about 8% of this year's 6.6-million-acre nationwide
18
burn total) consists of dry forests on National Forest land. There is growing consensus that, in these dry forests, fire-exclusion policies have created unnatural conditions that may have led to more severe wildfires. Dense thickets of young trees in these dry forests would benefit the most from thinning operations. Judicious thinning from below (leaving the larger trees) may be effective in strategic locations to create a defensible space around communities and rural homes. Nearly all of the dry forest types in the western United States would also benefit from prescribed burning (Mutch 1994). The remaining 92% of the area burned so far this year represent areas where federal forest-thinning operations may either be entirely inappropriate (not federal ownership or non-forested land) or in forest types where there is much less consensus about the benefits of thinning operations. There may be some limited cases in these other forest types where thinning from below may be appropriate. Prescribed burning may be a viable option in many areas (Mutch 1994).
Valley/Skalkaho Complex, Montana
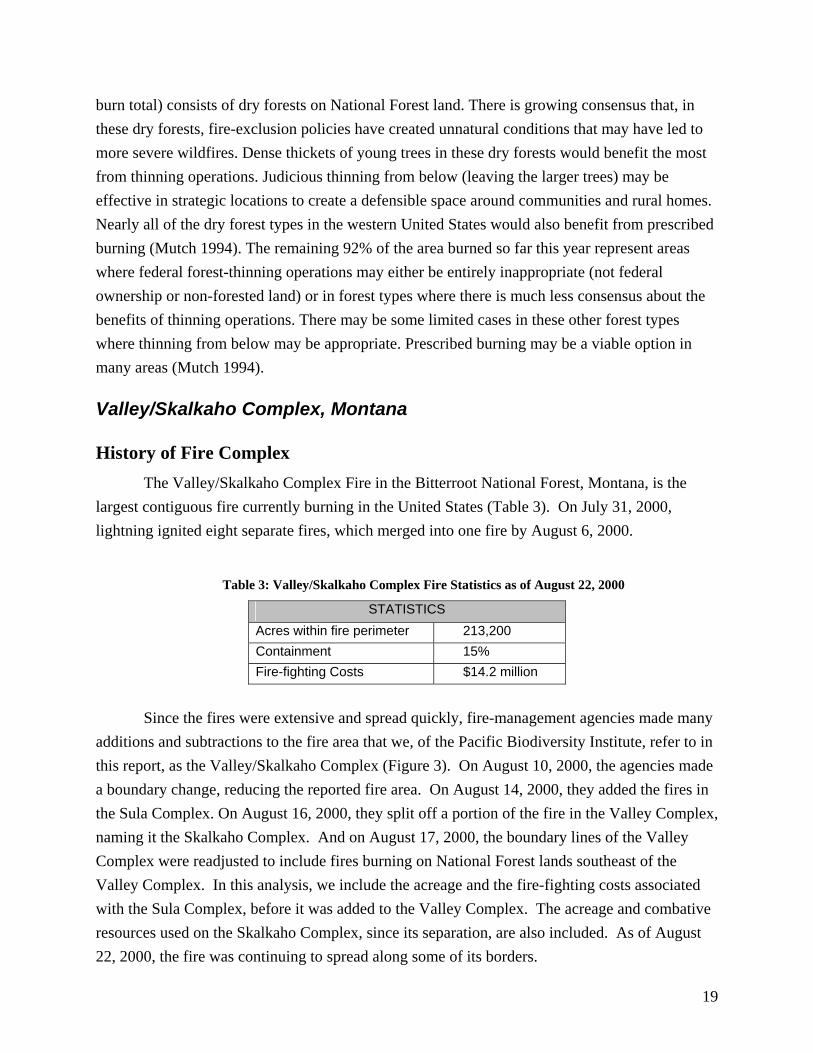
History of Fire Complex The Valley/Skalkaho Complex Fire in the Bitterroot National Forest, Montana, is the
largest contiguous fire currently burning in the United States (Table 3). On July 31, 2000, lightning ignited eight separate fires, which merged into one fire by August 6, 2000.
Table 3: Valley/Skalkaho Complex Fire Statistics as of August 22, 2000
STATISTICS Acres within fire perimeter 213,200 Containment 15% Fire-fighting Costs $14.2 million
Since the fires were extensive and spread quickly, fire-management agencies made many
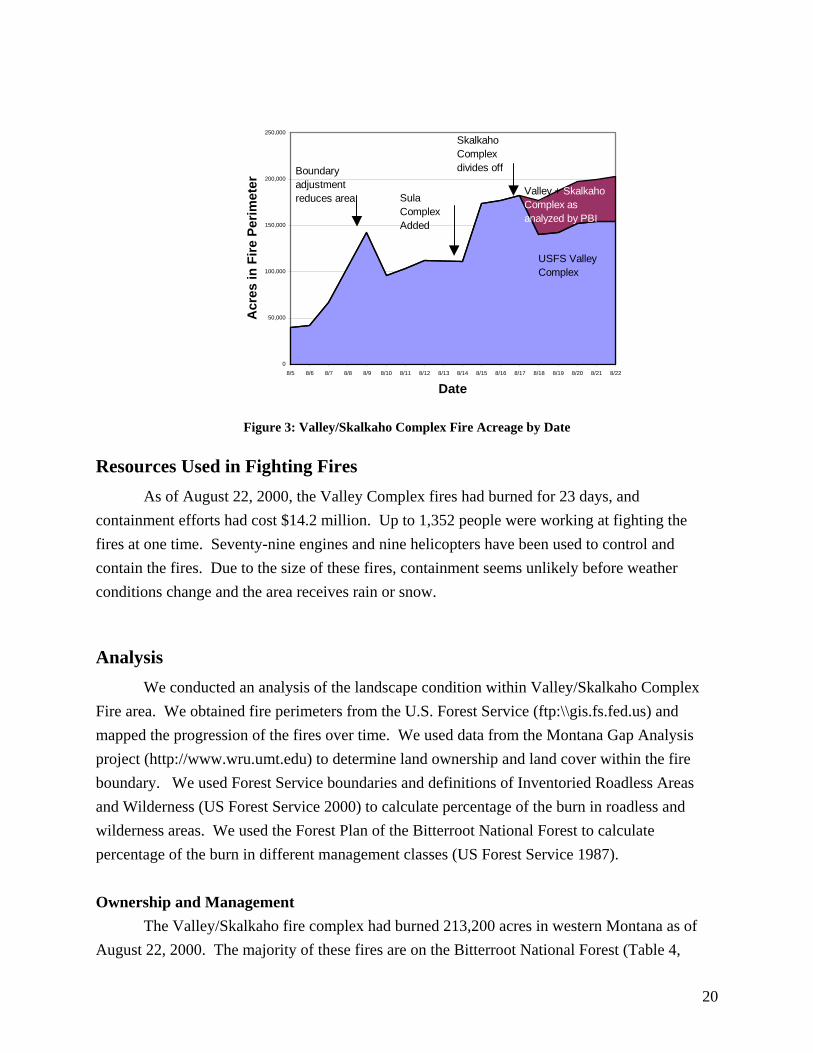
additions and subtractions to the fire area that we, of the Pacific Biodiversity Institute, refer to in this report, as the Valley/Skalkaho Complex (Figure 3). On August 10, 2000, the agencies made a boundary change, reducing the reported fire area. On August 14, 2000, they added the fires in the Sula Complex. On August 16, 2000, they split off a portion of the fire in the Valley Complex, naming it the Skalkaho Complex. And on August 17, 2000, the boundary lines of the Valley Complex were readjusted to include fires burning on National Forest lands southeast of the Valley Complex. In this analysis, we include the acreage and the fire-fighting costs associated with the Sula Complex, before it was added to the Valley Complex. The acreage and combative resources used on the Skalkaho Complex, since its separation, are also included. As of August 22, 2000, the fire was continuing to spread along some of its borders.
19
0
50,000
100,000
150,000
200,000
250,000
8/5 8/6 8/7 8/8 8/9 8/10 8/11 8/12 8/13 8/14 8/15 8/16 8/17 8/18 8/19 8/20 8/21 8/22
Date
Acr
es in
Fire
Per
imet
er
Boundary adjustment reduces area Sula
Complex Added
Skalkaho Complex divides off
USFS Valley Complex
Valley + Skalkaho Complex as analyzed by PBI
Figure 3: Valley/Skalkaho Complex Fire Acreage by Date
Resources Used in Fighting Fires As of August 22, 2000, the Valley Complex fires had burned for 23 days, and
containment efforts had cost $14.2 million. Up to 1,352 people were working at fighting the fires at one time. Seventy-nine engines and nine helicopters have been used to control and contain the fires. Due to the size of these fires, containment seems unlikely before weather conditions change and the area receives rain or snow.
Analysis We conducted an analysis of the landscape condition within Valley/Skalkaho Complex
Fire area. We obtained fire perimeters from the U.S. Forest Service (ftp:\\gis.fs.fed.us) and mapped the progression of the fires over time. We used data from the Montana Gap Analysis project (http://www.wru.umt.edu) to determine land ownership and land cover within the fire boundary. We used Forest Service boundaries and definitions of Inventoried Roadless Areas and Wilderness (US Forest Service 2000) to calculate percentage of the burn in roadless and wilderness areas. We used the Forest Plan of the Bitterroot National Forest to calculate percentage of the burn in different management classes (US Forest Service 1987). Ownership and Management
The Valley/Skalkaho fire complex had burned 213,200 acres in western Montana as of August 22, 2000. The majority of these fires are on the Bitterroot National Forest (Table 4,
20
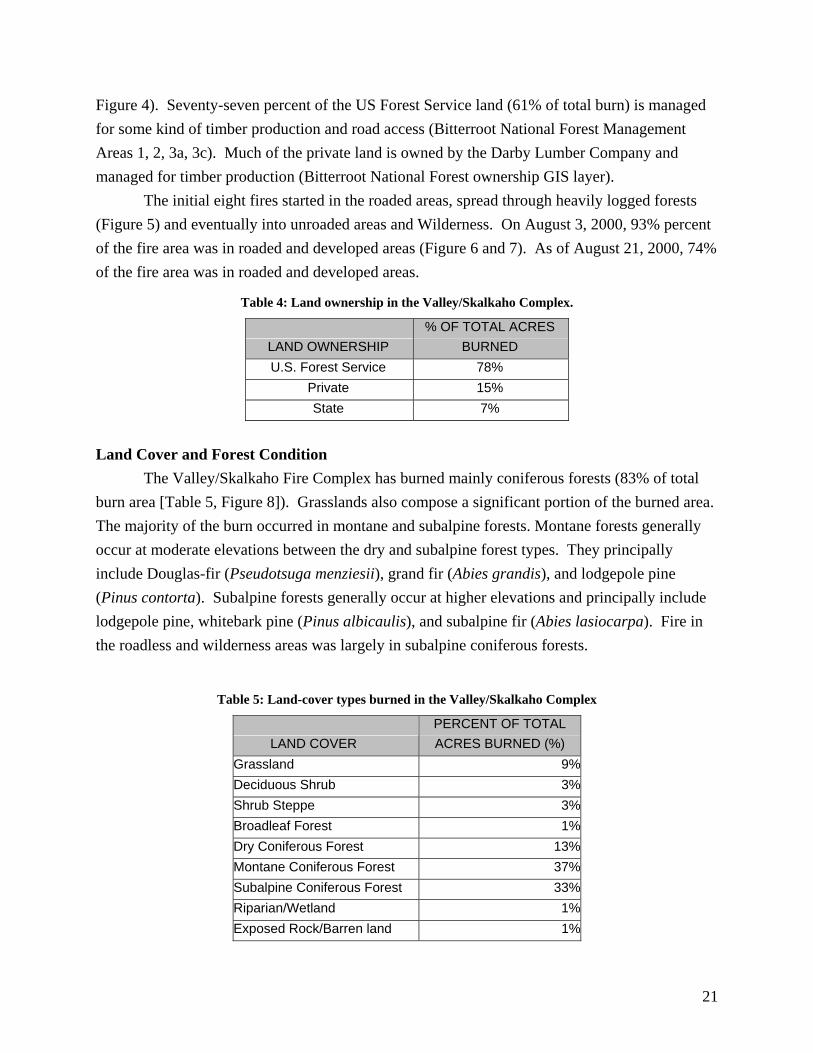
Figure 4). Seventy-seven percent of the US Forest Service land (61% of total burn) is managed for some kind of timber production and road access (Bitterroot National Forest Management Areas 1, 2, 3a, 3c). Much of the private land is owned by the Darby Lumber Company and managed for timber production (Bitterroot National Forest ownership GIS layer).
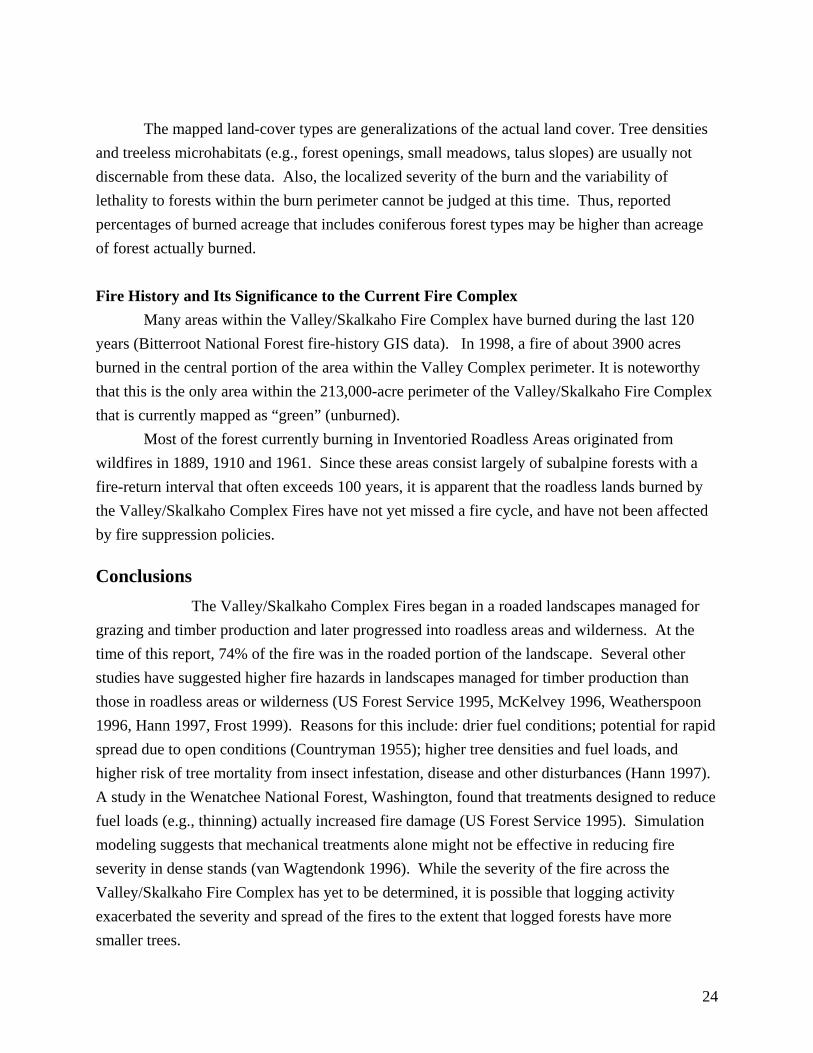
The initial eight fires started in the roaded areas, spread through heavily logged forests (Figure 5) and eventually into unroaded areas and Wilderness. On August 3, 2000, 93% percent of the fire area was in roaded and developed areas (Figure 6 and 7). As of August 21, 2000, 74% of the fire area was in roaded and developed areas.
Table 4: Land ownership in the Valley/Skalkaho Complex.
LAND OWNERSHIP % OF TOTAL ACRES
BURNED U.S. Forest Service 78%
Private 15% State 7%
Land Cover and Forest Condition
The Valley/Skalkaho Fire Complex has burned mainly coniferous forests (83% of total burn area [Table 5, Figure 8]). Grasslands also compose a significant portion of the burned area. The majority of the burn occurred in montane and subalpine forests. Montane forests generally occur at moderate elevations between the dry and subalpine forest types. They principally include Douglas-fir (Pseudotsuga menziesii), grand fir (Abies grandis), and lodgepole pine (Pinus contorta). Subalpine forests generally occur at higher elevations and principally include lodgepole pine, whitebark pine (Pinus albicaulis), and subalpine fir (Abies lasiocarpa). Fire in the roadless and wilderness areas was largely in subalpine coniferous forests.
Table 5: Land-cover types burned in the Valley/Skalkaho Complex
LAND COVER PERCENT OF TOTAL ACRES BURNED (%)
Grassland 9%Deciduous Shrub 3%Shrub Steppe 3%Broadleaf Forest 1%Dry Coniferous Forest 13%Montane Coniferous Forest 37%Subalpine Coniferous Forest 33%Riparian/Wetland 1%Exposed Rock/Barren land 1%
21
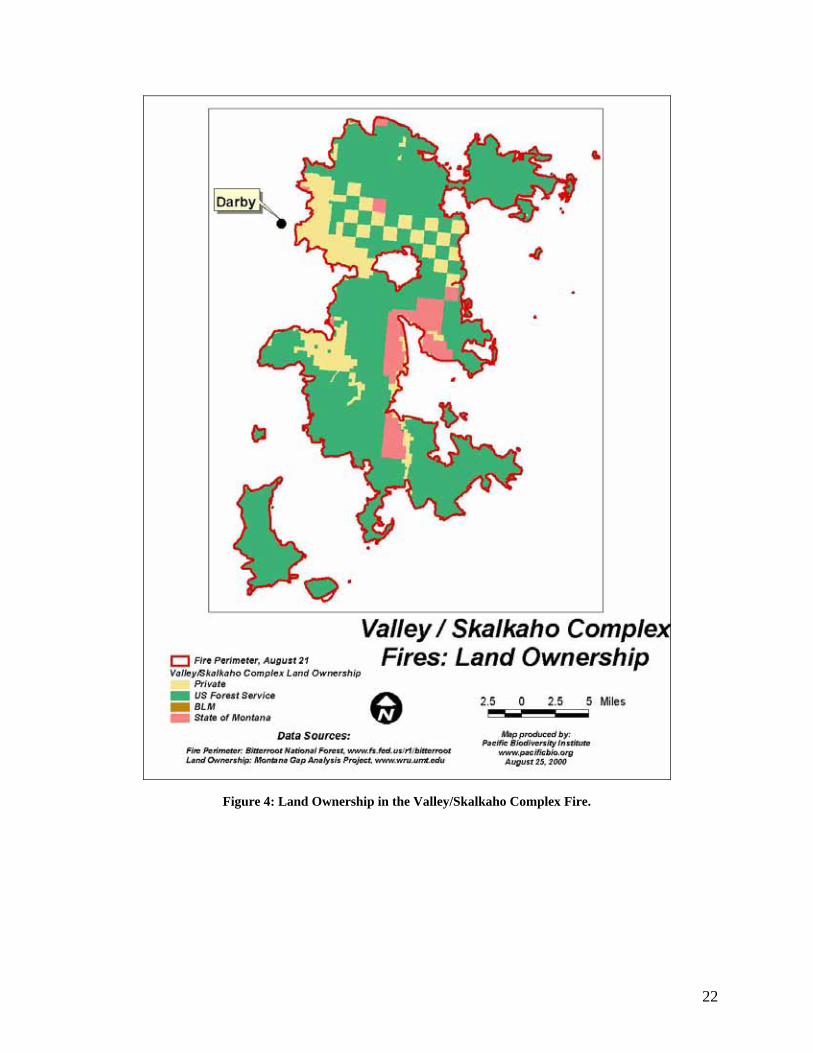
Figure 4: Land Ownership in the Valley/Skalkaho Complex Fire.
22
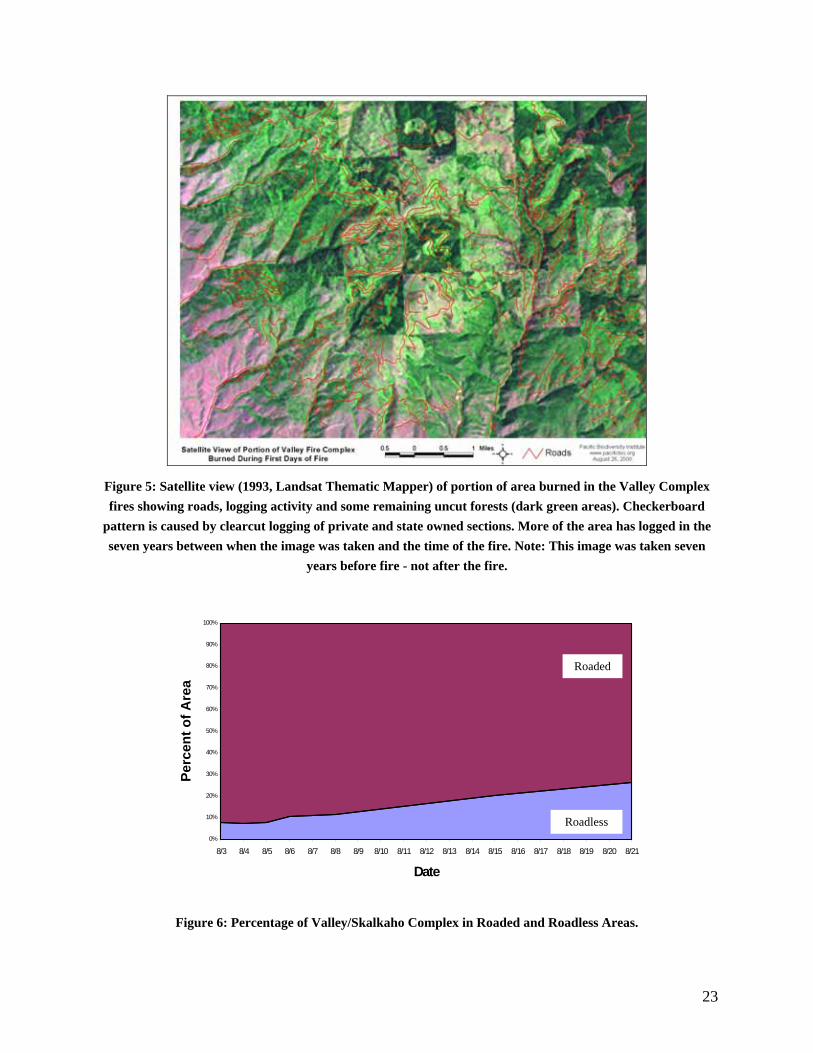
Figure 5: Satellite view (1993, Landsat Thematic Mapper) of portion of area burned in the Valley Complex fires showing roads, logging activity and some remaining uncut forests (dark green areas). Checkerboard
pattern is caused by clearcut logging of private and state owned sections. More of the area has logged in the seven years between when the image was taken and the time of the fire. Note: This image was taken seven
years before fire - not after the fire.
0%
10%
20%
30%
40%
50%
60%
70%
80%
90%
100%
8/3 8/4 8/5 8/6 8/7 8/8 8/9 8/10 8/11 8/12 8/13 8/14 8/15 8/16 8/17 8/18 8/19 8/20 8/21
Date
Perc
ent o
f Are
a
Roaded
Roadless
Figure 6: Percentage of Valley/Skalkaho Complex in Roaded and Roadless Areas.
23
The mapped land-cover types are generalizations of the actual land cover. Tree densities
and treeless microhabitats (e.g., forest openings, small meadows, talus slopes) are usually not discernable from these data. Also, the localized severity of the burn and the variability of lethality to forests within the burn perimeter cannot be judged at this time. Thus, reported percentages of burned acreage that includes coniferous forest types may be higher than acreage of forest actually burned. Fire History and Its Significance to the Current Fire Complex
Many areas within the Valley/Skalkaho Fire Complex have burned during the last 120 years (Bitterroot National Forest fire-history GIS data). In 1998, a fire of about 3900 acres burned in the central portion of the area within the Valley Complex perimeter. It is noteworthy that this is the only area within the 213,000-acre perimeter of the Valley/Skalkaho Fire Complex that is currently mapped as “green” (unburned).
Most of the forest currently burning in Inventoried Roadless Areas originated from wildfires in 1889, 1910 and 1961. Since these areas consist largely of subalpine forests with a fire-return interval that often exceeds 100 years, it is apparent that the roadless lands burned by the Valley/Skalkaho Complex Fires have not yet missed a fire cycle, and have not been affected by fire suppression policies.
Conclusions The Valley/Skalkaho Complex Fires began in a roaded landscapes managed for
grazing and timber production and later progressed into roadless areas and wilderness. At the time of this report, 74% of the fire was in the roaded portion of the landscape. Several other studies have suggested higher fire hazards in landscapes managed for timber production than those in roadless areas or wilderness (US Forest Service 1995, McKelvey 1996, Weatherspoon 1996, Hann 1997, Frost 1999). Reasons for this include: drier fuel conditions; potential for rapid spread due to open conditions (Countryman 1955); higher tree densities and fuel loads, and higher risk of tree mortality from insect infestation, disease and other disturbances (Hann 1997). A study in the Wenatchee National Forest, Washington, found that treatments designed to reduce fuel loads (e.g., thinning) actually increased fire damage (US Forest Service 1995). Simulation modeling suggests that mechanical treatments alone might not be effective in reducing fire severity in dense stands (van Wagtendonk 1996). While the severity of the fire across the Valley/Skalkaho Fire Complex has yet to be determined, it is possible that logging activity exacerbated the severity and spread of the fires to the extent that logged forests have more smaller trees.
24
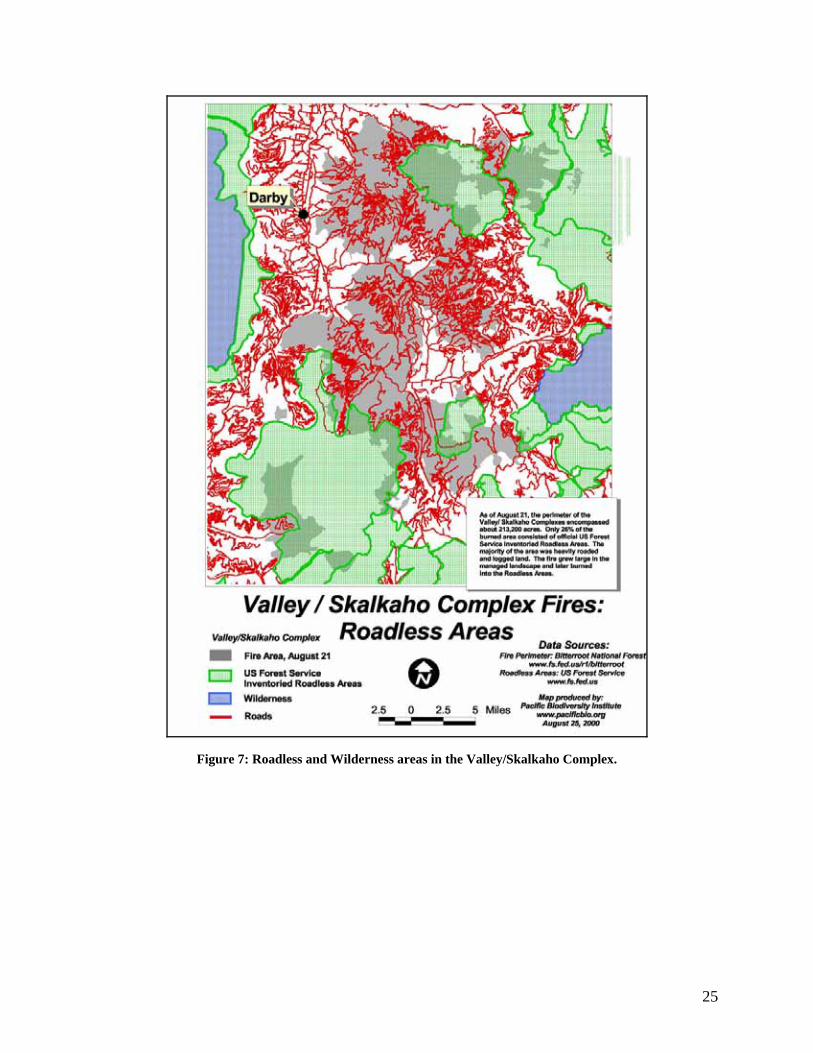
Figure 7: Roadless and Wilderness areas in the Valley/Skalkaho Complex.
25
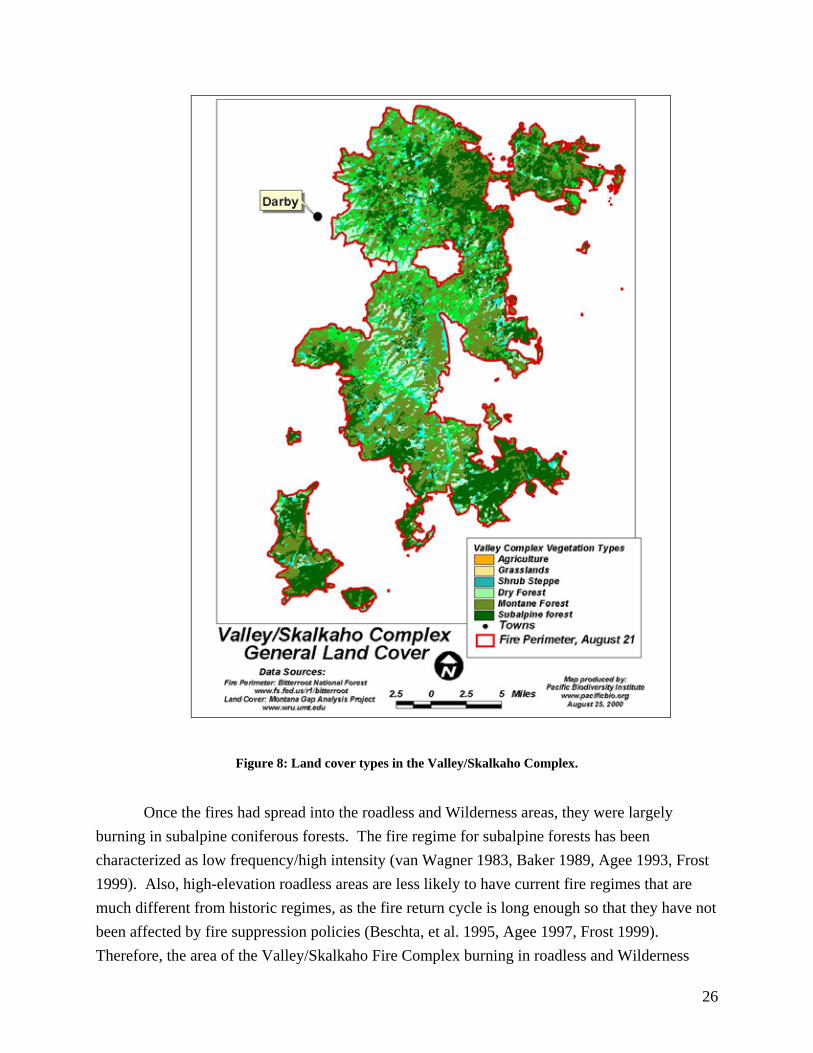
Figure 8: Land cover types in the Valley/Skalkaho Complex.
Once the fires had spread into the roadless and Wilderness areas, they were largely
burning in subalpine coniferous forests. The fire regime for subalpine forests has been characterized as low frequency/high intensity (van Wagner 1983, Baker 1989, Agee 1993, Frost 1999). Also, high-elevation roadless areas are less likely to have current fire regimes that are much different from historic regimes, as the fire return cycle is long enough so that they have not been affected by fire suppression policies (Beschta, et al. 1995, Agee 1997, Frost 1999). Therefore, the area of the Valley/Skalkaho Fire Complex burning in roadless and Wilderness
26
areas likely has fuel loading and vegetation density not atypical of historic conditions for that area. In fact, the fire-history data from the area indicate that the Valley/Skalkaho Fire Complex is well within the expected fire return cycle for these subalpine forests.
Information Sources General Fire Information
Bitterroot National Forest website (http://www.fs.fed.us/r1/bitterroot/fire) National Interagency Coordination Center website
(http://www.nifc.gov/news/sitrprt.html) Skalkaho Fire Information number: (406) 375-8847 Area Command: (406) 375-8803
GIS Data US Forest Service Anonymous FTP Server (ftp://gis.fs.fed.us) Montana Gap Analysis Project (http://www.wru.umt.edu) Bitterroot National Forest – Administrative Boundaries
Kate’s Basin Fire, Wyoming
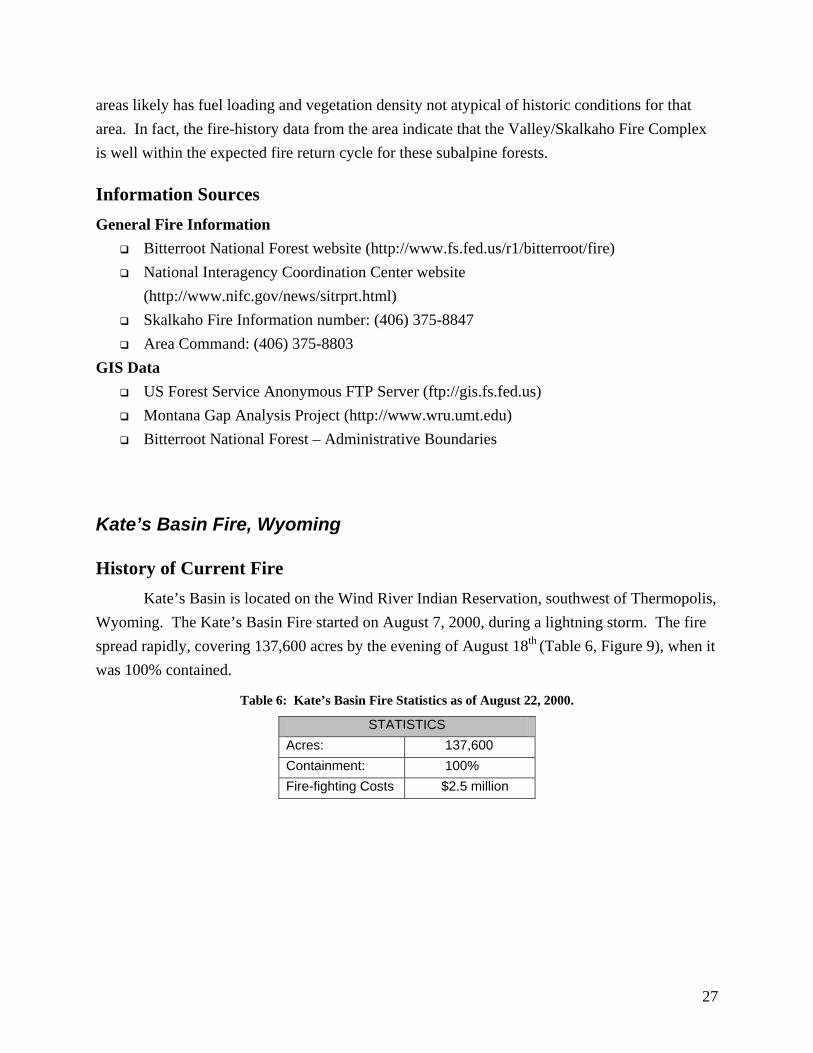
History of Current Fire Kate’s Basin is located on the Wind River Indian Reservation, southwest of Thermopolis, Wyoming. The Kate’s Basin Fire started on August 7, 2000, during a lightning storm. The fire spread rapidly, covering 137,600 acres by the evening of August 18th (Table 6, Figure 9), when it was 100% contained.
Table 6: Kate’s Basin Fire Statistics as of August 22, 2000.
STATISTICS Acres: 137,600 Containment: 100% Fire-fighting Costs $2.5 million
27
0
20,000
40,000
60,000
80,000
100,000
120,000
140,000
160,000
8/11 8/12 8/13 8/14 8/15 8/16 8/17 8/18
Date
Acr
es b
urne
d
Figure 9: Kate’s Basin Fire Acreage by Date
Resources Used in Fighting Fires The Kate’s Basin fire quickly grew to be one of the largest reported in the nation, but was fully contained within only 11 days. Approximately $2.5 million were spent to fight this fire. Fire fighters reported difficulty fighting the fire due to “very steep terrain” and “long access times to the fire lines” (http://www.katesbasin.com).
Analysis We conducted an analysis of the landscape condition of the Kate’s Basin Fire area. We
obtained fire perimeters from the U.S. Forest Service (ftp:\\gis.fs.fed.us) and used data from the Wyoming Gap Analysis project (www.sdve.uwyo.edu/wbn/gap.html) to determine the land ownership and land cover within the fire boundary. We also examined the burn area with Landsat multispectral scanner satellite imagery and high-resolution digital aerial photography. Ownership
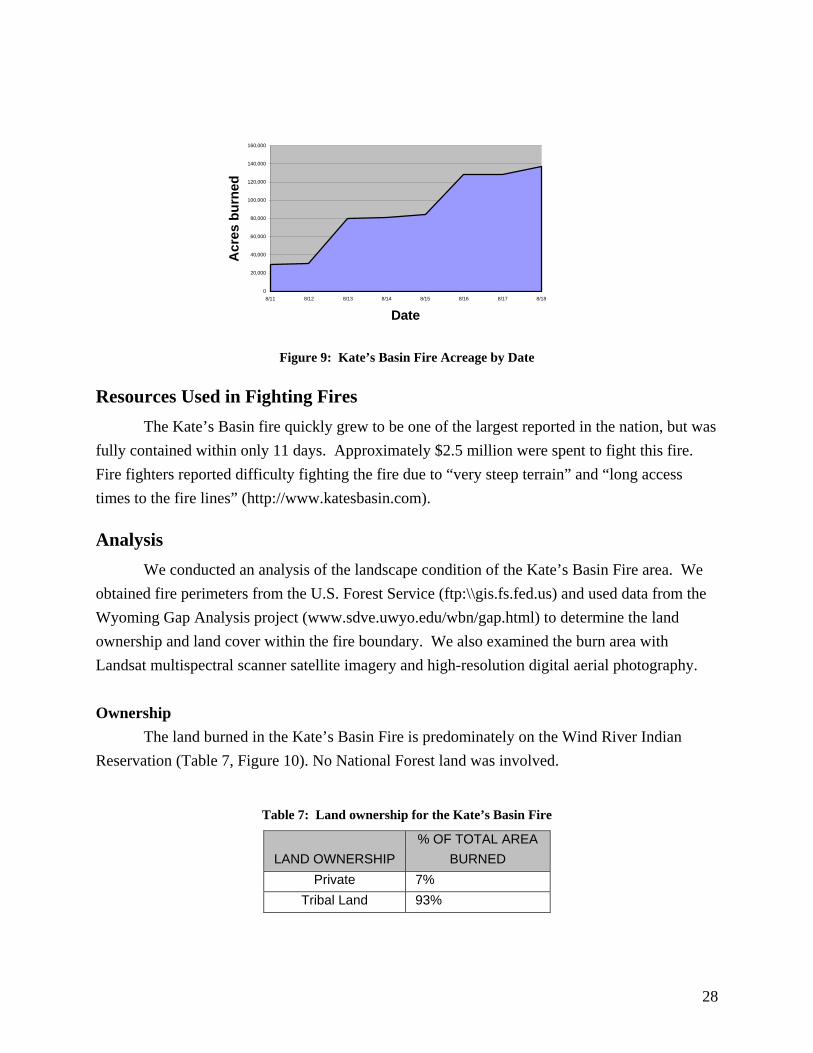
The land burned in the Kate’s Basin Fire is predominately on the Wind River Indian Reservation (Table 7, Figure 10). No National Forest land was involved.
Table 7: Land ownership for the Kate’s Basin Fire
LAND OWNERSHIP % OF TOTAL AREA
BURNED Private 7%
Tribal Land 93%
28
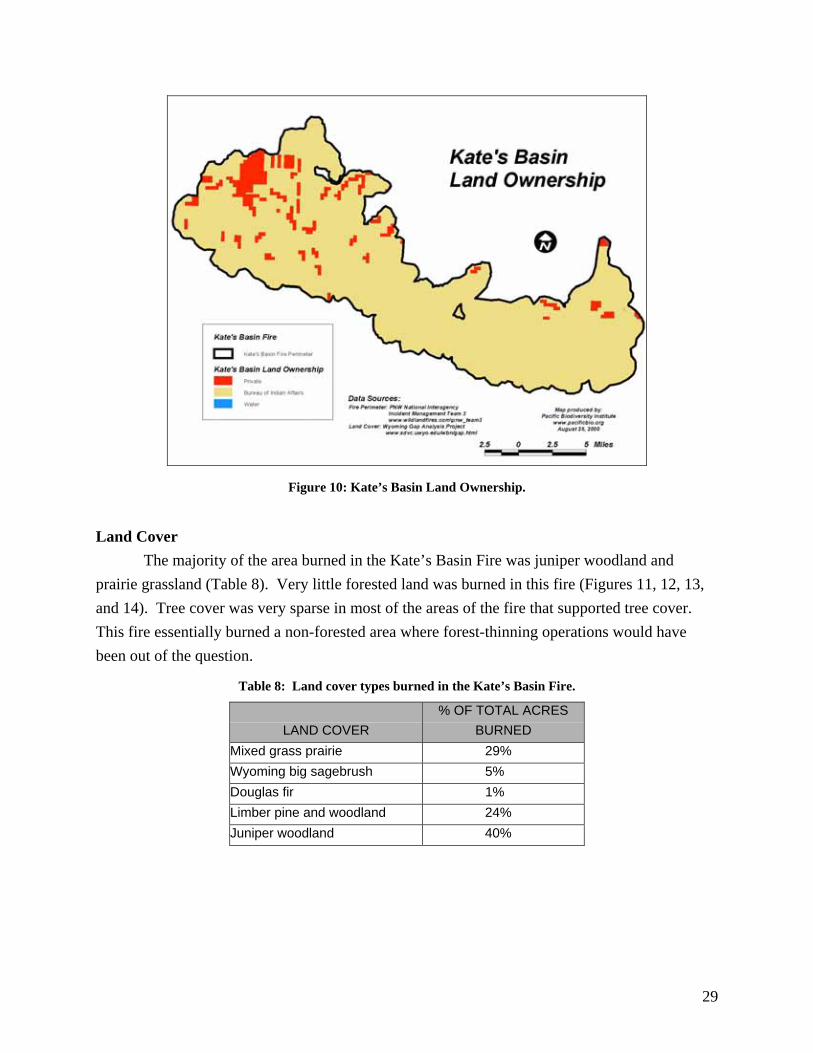
Figure 10: Kate’s Basin Land Ownership.
Land Cover
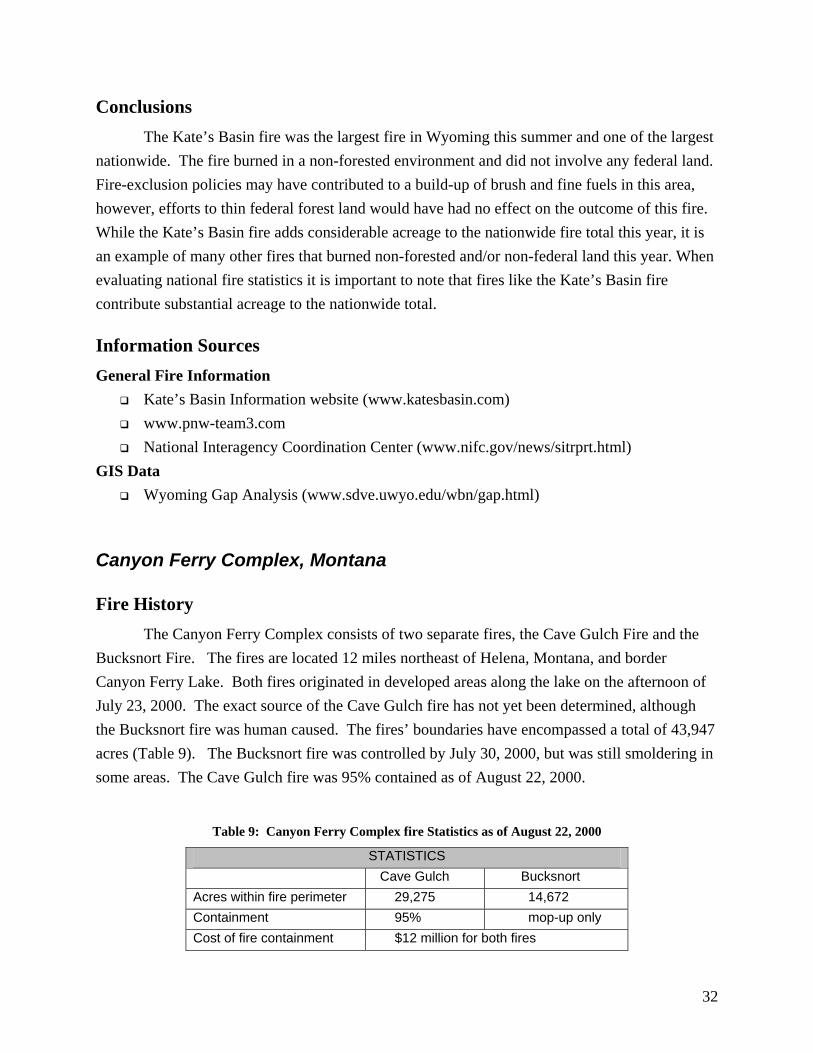
The majority of the area burned in the Kate’s Basin Fire was juniper woodland and prairie grassland (Table 8). Very little forested land was burned in this fire (Figures 11, 12, 13, and 14). Tree cover was very sparse in most of the areas of the fire that supported tree cover. This fire essentially burned a non-forested area where forest-thinning operations would have been out of the question.
Table 8: Land cover types burned in the Kate’s Basin Fire.
LAND COVER % OF TOTAL ACRES
BURNED Mixed grass prairie 29% Wyoming big sagebrush 5% Douglas fir 1% Limber pine and woodland 24% Juniper woodland 40%
29
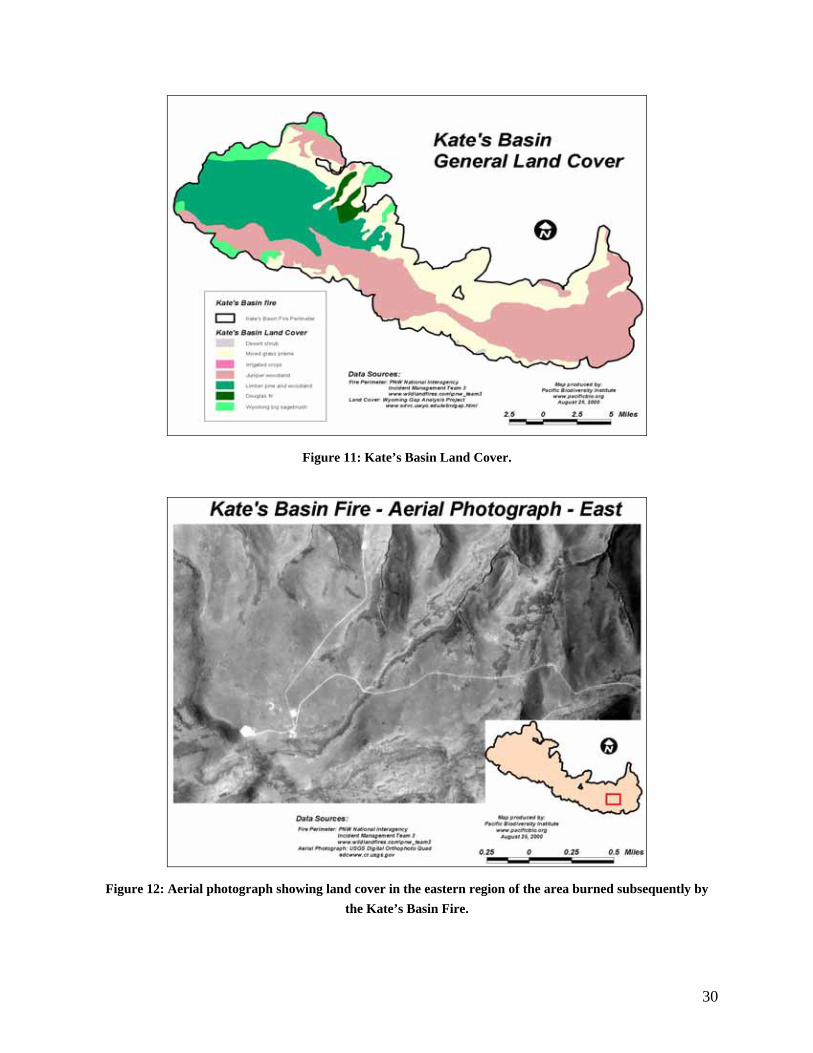
Figure 11: Kate’s Basin Land Cover.
Figure 12: Aerial photograph showing land cover in the eastern region of the area burned subsequently by
the Kate’s Basin Fire.
30
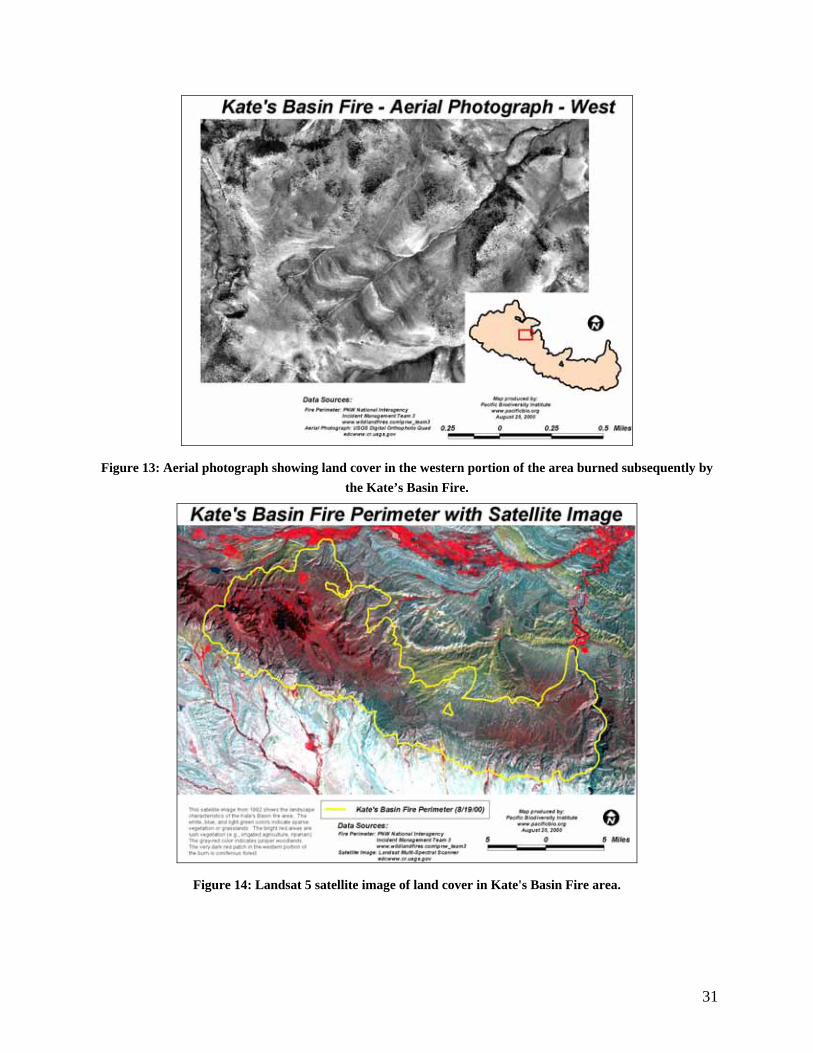
Figure 13: Aerial photograph showing land cover in the western portion of the area burned subsequently by
the Kate’s Basin Fire.
Figure 14: Landsat 5 satellite image of land cover in Kate's Basin Fire area.
31
Conclusions The Kate’s Basin fire was the largest fire in Wyoming this summer and one of the largest
nationwide. The fire burned in a non-forested environment and did not involve any federal land. Fire-exclusion policies may have contributed to a build-up of brush and fine fuels in this area, however, efforts to thin federal forest land would have had no effect on the outcome of this fire. While the Kate’s Basin fire adds considerable acreage to the nationwide fire total this year, it is an example of many other fires that burned non-forested and/or non-federal land this year. When evaluating national fire statistics it is important to note that fires like the Kate’s Basin fire contribute substantial acreage to the nationwide total.
Information Sources General Fire Information
Kate’s Basin Information website (www.katesbasin.com) www.pnw-team3.com National Interagency Coordination Center (www.nifc.gov/news/sitrprt.html)
GIS Data Wyoming Gap Analysis (www.sdve.uwyo.edu/wbn/gap.html)
Canyon Ferry Complex, Montana
Fire History The Canyon Ferry Complex consists of two separate fires, the Cave Gulch Fire and the
Bucksnort Fire. The fires are located 12 miles northeast of Helena, Montana, and border Canyon Ferry Lake. Both fires originated in developed areas along the lake on the afternoon of July 23, 2000. The exact source of the Cave Gulch fire has not yet been determined, although the Bucksnort fire was human caused. The fires’ boundaries have encompassed a total of 43,947 acres (Table 9). The Bucksnort fire was controlled by July 30, 2000, but was still smoldering in some areas. The Cave Gulch fire was 95% contained as of August 22, 2000.
Table 9: Canyon Ferry Complex fire Statistics as of August 22, 2000
STATISTICS Cave Gulch Bucksnort Acres within fire perimeter 29,275 14,672 Containment 95% mop-up only Cost of fire containment $12 million for both fires
32
Resources Used in Fighting Fires The Bucksnort fire was contained within seven days, and the Cave Gulch Fire was contained within 30 days. A total of $12 million has been spent to fight these fires, and over 1000 people have been employed in fire suppression. Those numbers will increase slightly as mop-up efforts continue.
Analysis We conducted an analysis of the landscape condition of the Clear Creek fire area. We
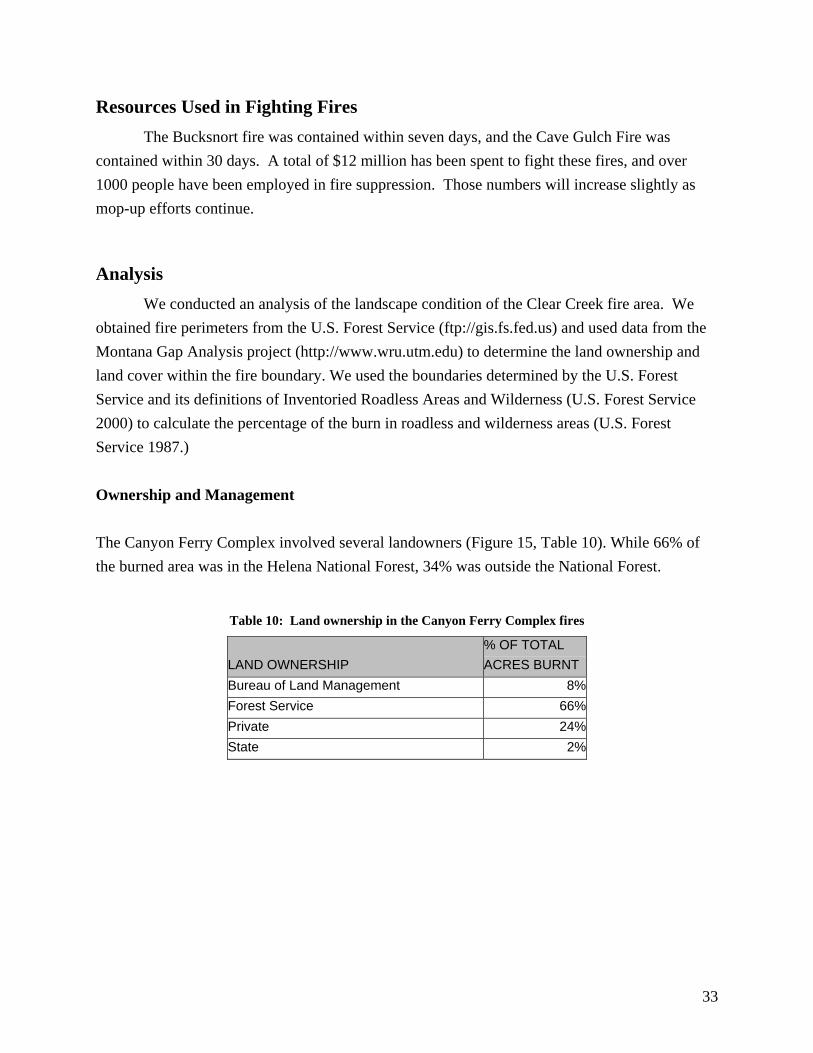
obtained fire perimeters from the U.S. Forest Service (ftp://gis.fs.fed.us) and used data from the Montana Gap Analysis project (http://www.wru.utm.edu) to determine the land ownership and land cover within the fire boundary. We used the boundaries determined by the U.S. Forest Service and its definitions of Inventoried Roadless Areas and Wilderness (U.S. Forest Service 2000) to calculate the percentage of the burn in roadless and wilderness areas (U.S. Forest Service 1987.) Ownership and Management The Canyon Ferry Complex involved several landowners (Figure 15, Table 10). While 66% of the burned area was in the Helena National Forest, 34% was outside the National Forest.
Table 10: Land ownership in the Canyon Ferry Complex fires
LAND OWNERSHIP % OF TOTAL ACRES BURNT
Bureau of Land Management 8% Forest Service 66% Private 24% State 2%
33
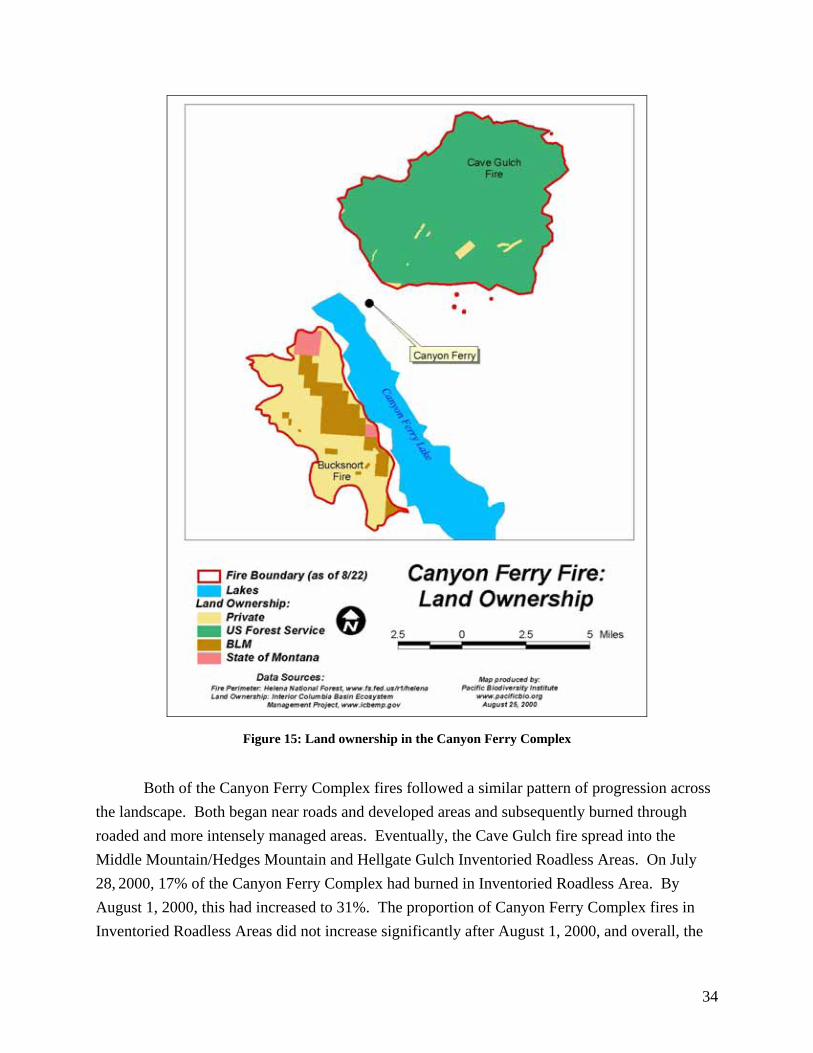
Figure 15: Land ownership in the Canyon Ferry Complex
Both of the Canyon Ferry Complex fires followed a similar pattern of progression across
the landscape. Both began near roads and developed areas and subsequently burned through roaded and more intensely managed areas. Eventually, the Cave Gulch fire spread into the Middle Mountain/Hedges Mountain and Hellgate Gulch Inventoried Roadless Areas. On July 28, 2000, 17% of the Canyon Ferry Complex had burned in Inventoried Roadless Area. By August 1, 2000, this had increased to 31%. The proportion of Canyon Ferry Complex fires in Inventoried Roadless Areas did not increase significantly after August 1, 2000, and overall, the
34
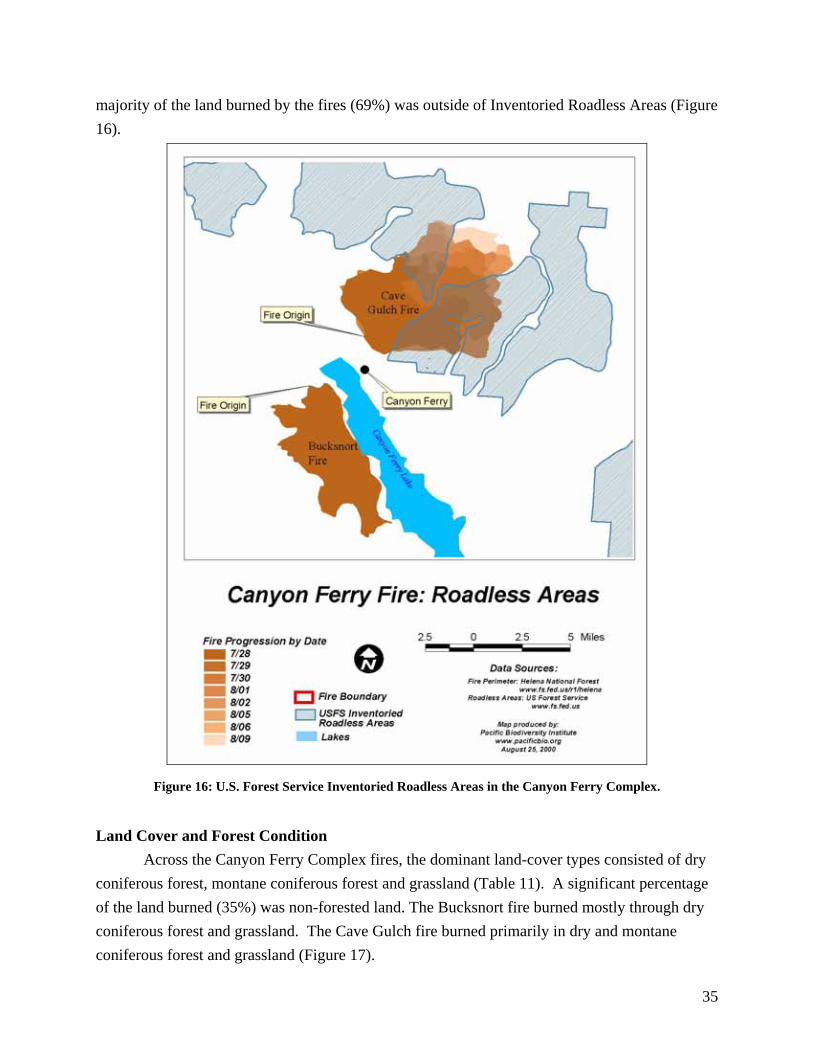
majority of the land burned by the fires (69%) was outside of Inventoried Roadless Areas (Figure 16).
Figure 16: U.S. Forest Service Inventoried Roadless Areas in the Canyon Ferry Complex.
Land Cover and Forest Condition
Across the Canyon Ferry Complex fires, the dominant land-cover types consisted of dry coniferous forest, montane coniferous forest and grassland (Table 11). A significant percentage of the land burned (35%) was non-forested land. The Bucksnort fire burned mostly through dry coniferous forest and grassland. The Cave Gulch fire burned primarily in dry and montane coniferous forest and grassland (Figure 17).
35
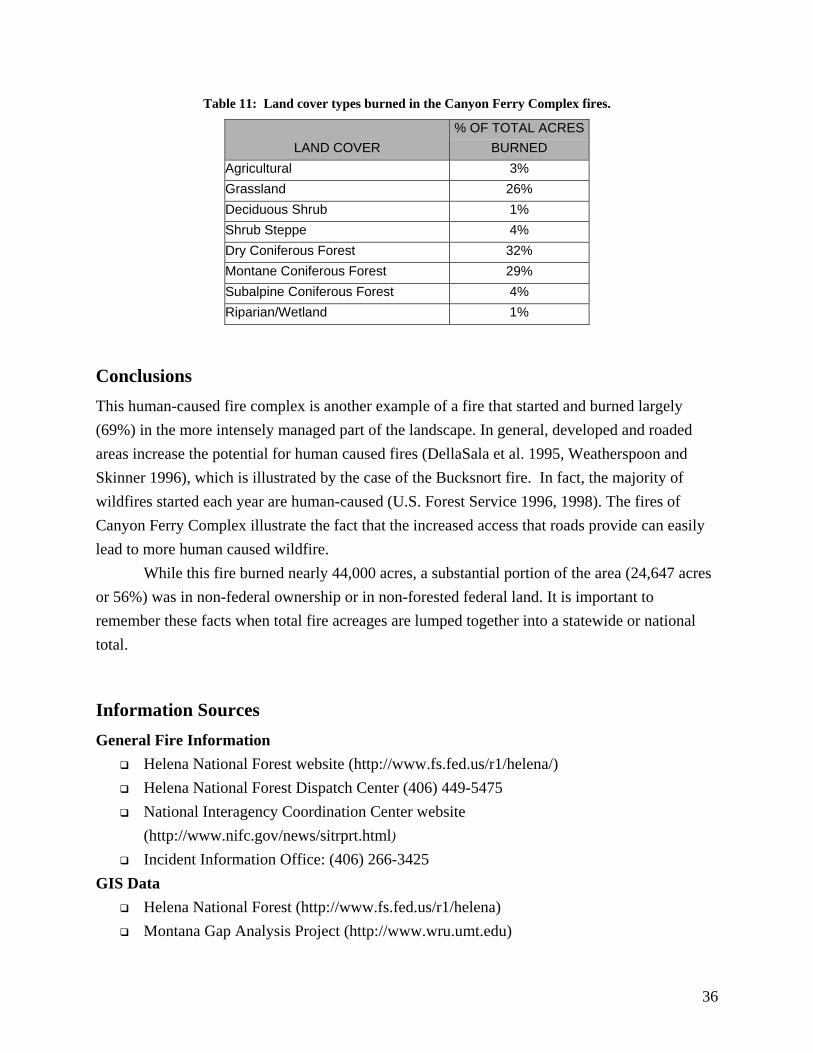
Table 11: Land cover types burned in the Canyon Ferry Complex fires.
LAND COVER % OF TOTAL ACRES
BURNED Agricultural 3% Grassland 26% Deciduous Shrub 1% Shrub Steppe 4% Dry Coniferous Forest 32% Montane Coniferous Forest 29% Subalpine Coniferous Forest 4% Riparian/Wetland 1%
Conclusions This human-caused fire complex is another example of a fire that started and burned largely (69%) in the more intensely managed part of the landscape. In general, developed and roaded areas increase the potential for human caused fires (DellaSala et al. 1995, Weatherspoon and Skinner 1996), which is illustrated by the case of the Bucksnort fire. In fact, the majority of wildfires started each year are human-caused (U.S. Forest Service 1996, 1998). The fires of Canyon Ferry Complex illustrate the fact that the increased access that roads provide can easily lead to more human caused wildfire. While this fire burned nearly 44,000 acres, a substantial portion of the area (24,647 acres or 56%) was in non-federal ownership or in non-forested federal land. It is important to remember these facts when total fire acreages are lumped together into a statewide or national total.
Information Sources General Fire Information
Helena National Forest website (http://www.fs.fed.us/r1/helena/) Helena National Forest Dispatch Center (406) 449-5475 National Interagency Coordination Center website
(http://www.nifc.gov/news/sitrprt.html) Incident Information Office: (406) 266-3425
GIS Data Helena National Forest (http://www.fs.fed.us/r1/helena) Montana Gap Analysis Project (http://www.wru.umt.edu)
36
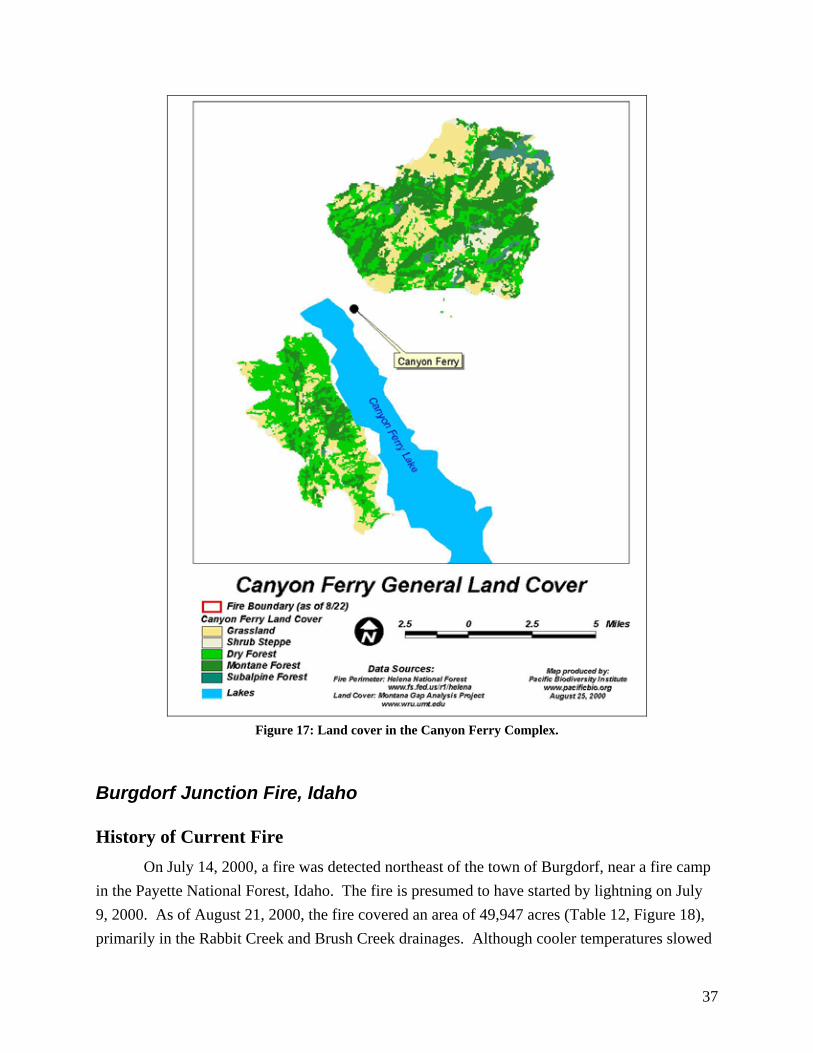
Figure 17: Land cover in the Canyon Ferry Complex.
Burgdorf Junction Fire, Idaho
History of Current Fire On July 14, 2000, a fire was detected northeast of the town of Burgdorf, near a fire camp
in the Payette National Forest, Idaho. The fire is presumed to have started by lightning on July 9, 2000. As of August 21, 2000, the fire covered an area of 49,947 acres (Table 12, Figure 18), primarily in the Rabbit Creek and Brush Creek drainages. Although cooler temperatures slowed
37
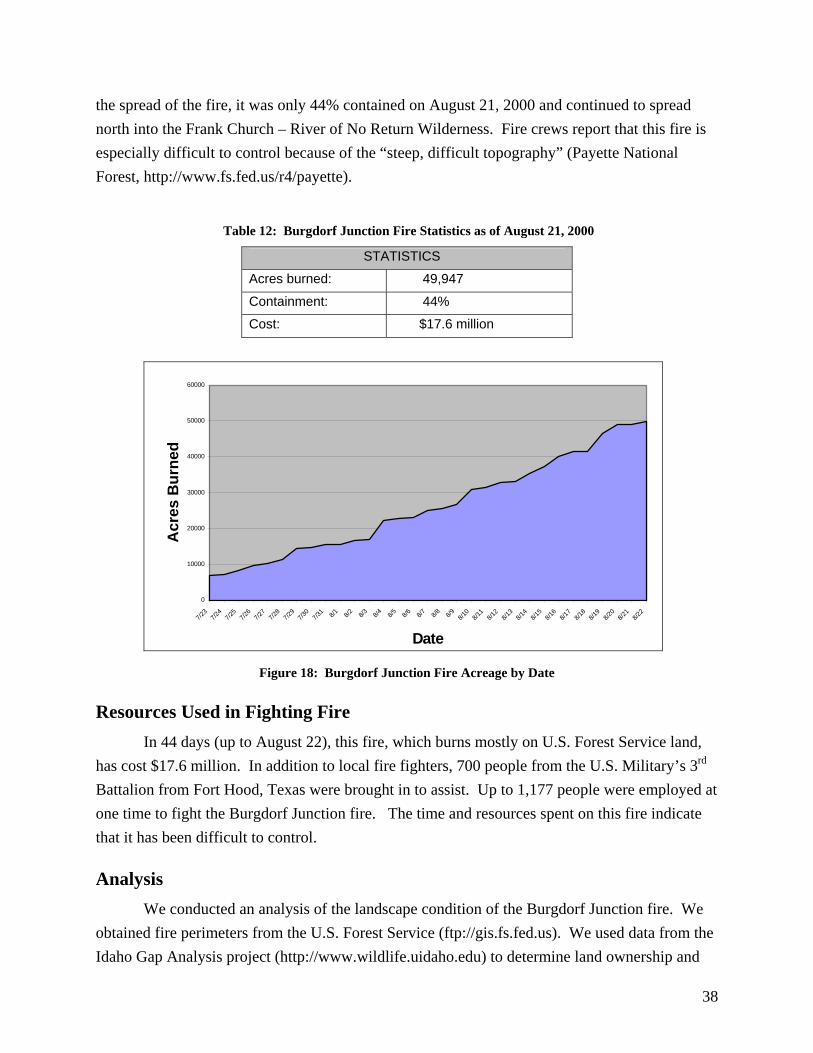
the spread of the fire, it was only 44% contained on August 21, 2000 and continued to spread north into the Frank Church – River of No Return Wilderness. Fire crews report that this fire is especially difficult to control because of the “steep, difficult topography” (Payette National Forest, http://www.fs.fed.us/r4/payette).
Table 12: Burgdorf Junction Fire Statistics as of August 21, 2000
STATISTICS
Acres burned: 49,947
Containment: 44%
Cost: $17.6 million
0
10000
20000
30000
40000
50000
60000
7/23
7/24
7/25
7/26
7/27
7/28
7/29
7/30
7/31 8/1 8/2 8/3 8/4 8/5 8/6 8/7 8/8 8/9 8/1
08/1
18/1
28/1
38/1
48/1
58/1
68/1
78/1
88/1
98/2
08/2
18/2
2
Date
Acr
es B
urne
d
Figure 18: Burgdorf Junction Fire Acreage by Date
Resources Used in Fighting Fire In 44 days (up to August 22), this fire, which burns mostly on U.S. Forest Service land,
has cost $17.6 million. In addition to local fire fighters, 700 people from the U.S. Military’s 3rd Battalion from Fort Hood, Texas were brought in to assist. Up to 1,177 people were employed at one time to fight the Burgdorf Junction fire. The time and resources spent on this fire indicate that it has been difficult to control.
Analysis We conducted an analysis of the landscape condition of the Burgdorf Junction fire. We
obtained fire perimeters from the U.S. Forest Service (ftp://gis.fs.fed.us). We used data from the Idaho Gap Analysis project (http://www.wildlife.uidaho.edu) to determine land ownership and
38
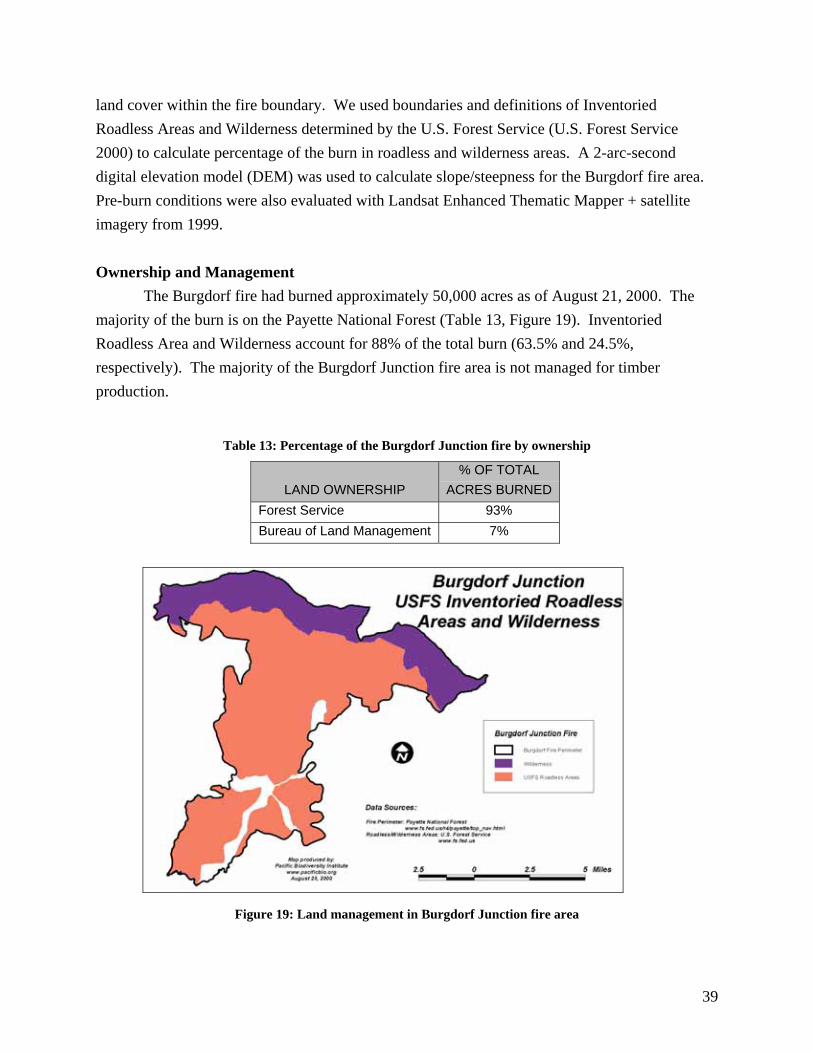
land cover within the fire boundary. We used boundaries and definitions of Inventoried Roadless Areas and Wilderness determined by the U.S. Forest Service (U.S. Forest Service 2000) to calculate percentage of the burn in roadless and wilderness areas. A 2-arc-second digital elevation model (DEM) was used to calculate slope/steepness for the Burgdorf fire area. Pre-burn conditions were also evaluated with Landsat Enhanced Thematic Mapper + satellite imagery from 1999. Ownership and Management The Burgdorf fire had burned approximately 50,000 acres as of August 21, 2000. The majority of the burn is on the Payette National Forest (Table 13, Figure 19). Inventoried Roadless Area and Wilderness account for 88% of the total burn (63.5% and 24.5%, respectively). The majority of the Burgdorf Junction fire area is not managed for timber production.
Table 13: Percentage of the Burgdorf Junction fire by ownership
LAND OWNERSHIP % OF TOTAL
ACRES BURNED Forest Service 93%
Bureau of Land Management 7%
Figure 19: Land management in Burgdorf Junction fire area
39
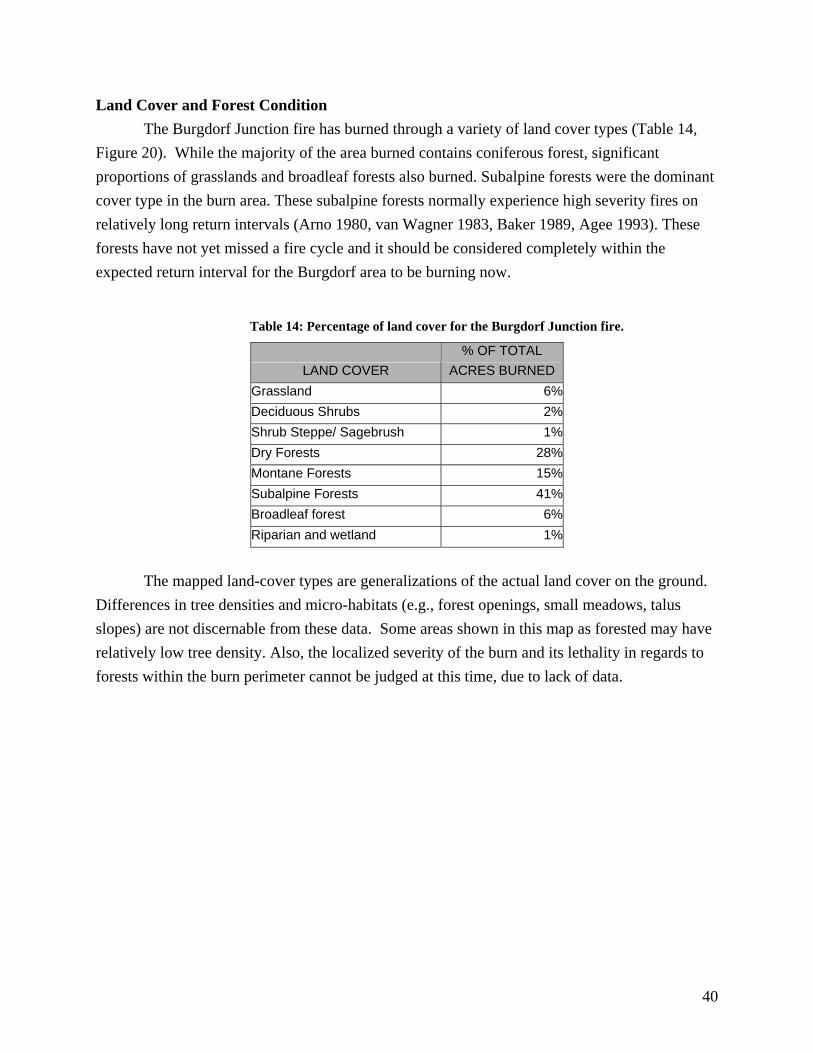
Land Cover and Forest Condition The Burgdorf Junction fire has burned through a variety of land cover types (Table 14,
Figure 20). While the majority of the area burned contains coniferous forest, significant proportions of grasslands and broadleaf forests also burned. Subalpine forests were the dominant cover type in the burn area. These subalpine forests normally experience high severity fires on relatively long return intervals (Arno 1980, van Wagner 1983, Baker 1989, Agee 1993). These forests have not yet missed a fire cycle and it should be considered completely within the expected return interval for the Burgdorf area to be burning now.
Table 14: Percentage of land cover for the Burgdorf Junction fire.
LAND COVER % OF TOTAL
ACRES BURNED Grassland 6%Deciduous Shrubs 2%Shrub Steppe/ Sagebrush 1%Dry Forests 28%Montane Forests 15%Subalpine Forests 41%Broadleaf forest 6%Riparian and wetland 1%
The mapped land-cover types are generalizations of the actual land cover on the ground.
Differences in tree densities and micro-habitats (e.g., forest openings, small meadows, talus slopes) are not discernable from these data. Some areas shown in this map as forested may have relatively low tree density. Also, the localized severity of the burn and its lethality in regards to forests within the burn perimeter cannot be judged at this time, due to lack of data.
40
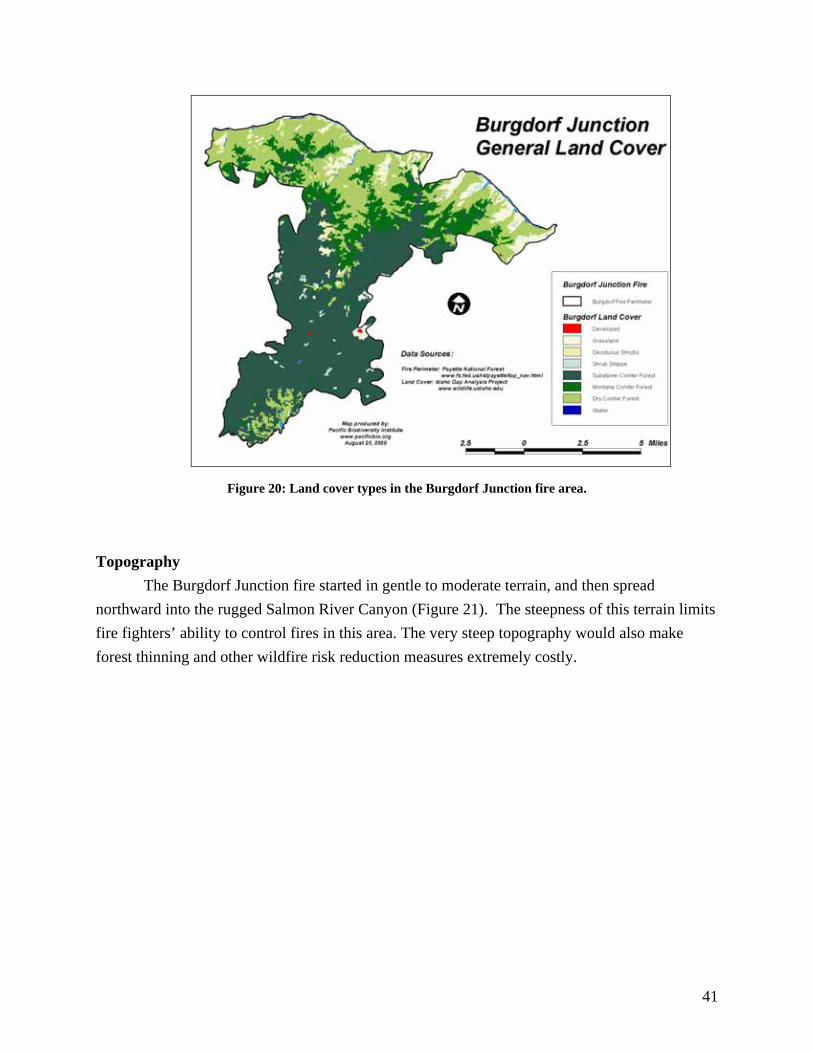
Figure 20: Land cover types in the Burgdorf Junction fire area.
Topography The Burgdorf Junction fire started in gentle to moderate terrain, and then spread northward into the rugged Salmon River Canyon (Figure 21). The steepness of this terrain limits fire fighters’ ability to control fires in this area. The very steep topography would also make forest thinning and other wildfire risk reduction measures extremely costly.
41
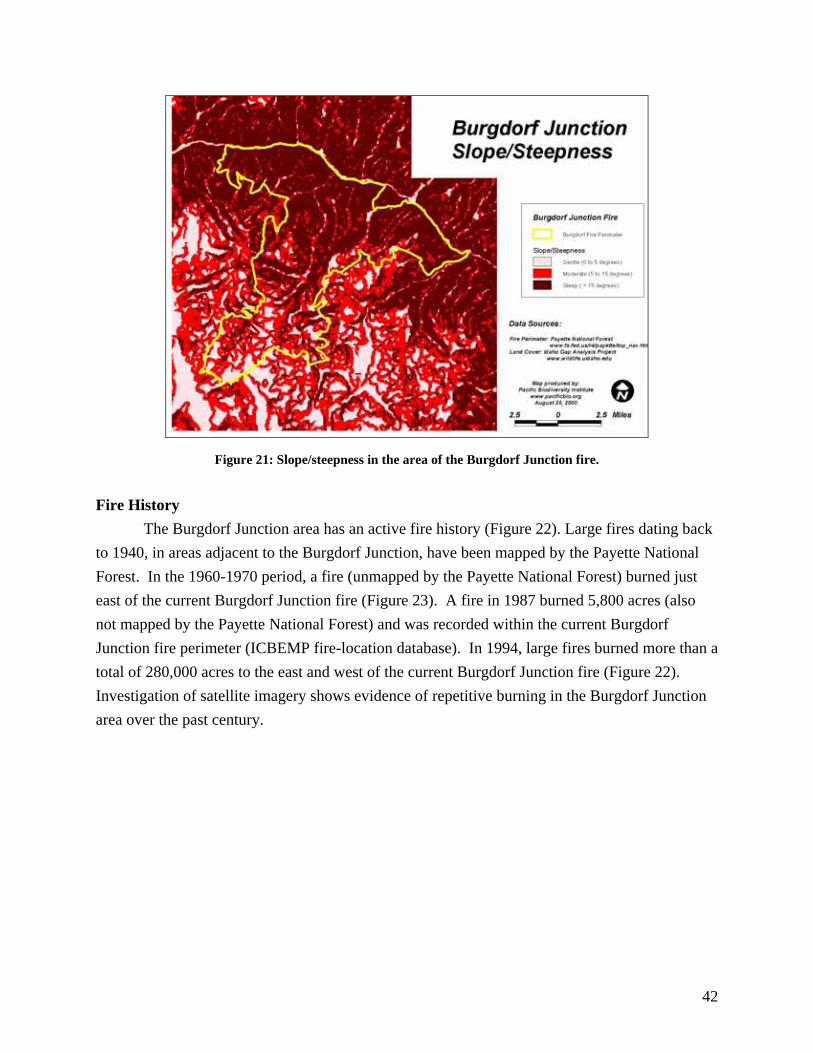
Figure 21: Slope/steepness in the area of the Burgdorf Junction fire.
Fire History The Burgdorf Junction area has an active fire history (Figure 22). Large fires dating back to 1940, in areas adjacent to the Burgdorf Junction, have been mapped by the Payette National Forest. In the 1960-1970 period, a fire (unmapped by the Payette National Forest) burned just east of the current Burgdorf Junction fire (Figure 23). A fire in 1987 burned 5,800 acres (also not mapped by the Payette National Forest) and was recorded within the current Burgdorf Junction fire perimeter (ICBEMP fire-location database). In 1994, large fires burned more than a total of 280,000 acres to the east and west of the current Burgdorf Junction fire (Figure 22). Investigation of satellite imagery shows evidence of repetitive burning in the Burgdorf Junction area over the past century.
42
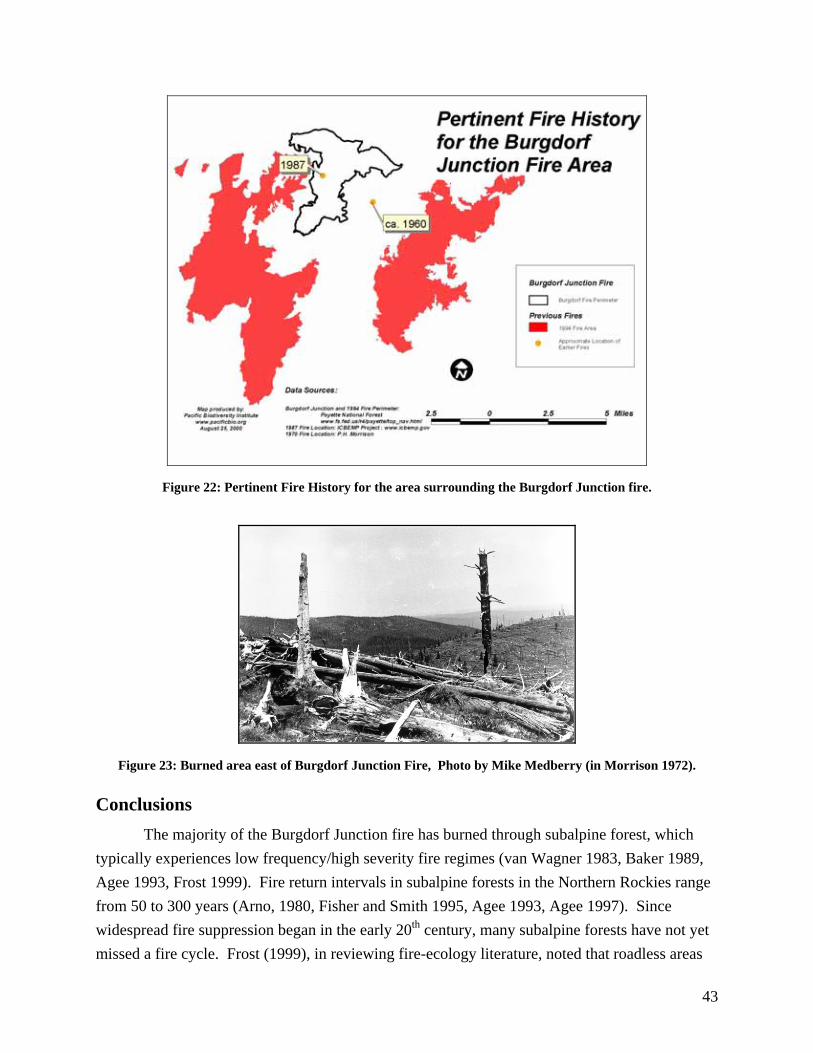
Figure 22: Pertinent Fire History for the area surrounding the Burgdorf Junction fire.
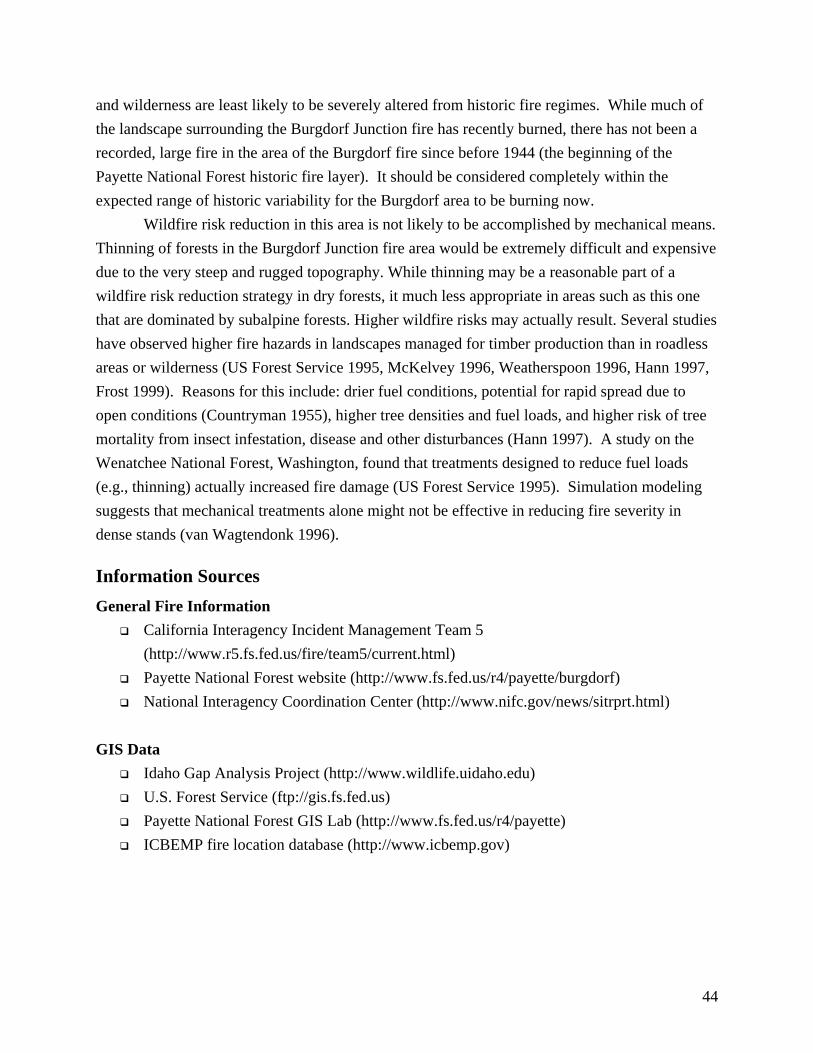
Figure 23: Burned area east of Burgdorf Junction Fire, Photo by Mike Medberry (in Morrison 1972).
Conclusions The majority of the Burgdorf Junction fire has burned through subalpine forest, which
typically experiences low frequency/high severity fire regimes (van Wagner 1983, Baker 1989, Agee 1993, Frost 1999). Fire return intervals in subalpine forests in the Northern Rockies range from 50 to 300 years (Arno, 1980, Fisher and Smith 1995, Agee 1993, Agee 1997). Since widespread fire suppression began in the early 20th century, many subalpine forests have not yet missed a fire cycle. Frost (1999), in reviewing fire-ecology literature, noted that roadless areas
43
and wilderness are least likely to be severely altered from historic fire regimes. While much of the landscape surrounding the Burgdorf Junction fire has recently burned, there has not been a recorded, large fire in the area of the Burgdorf fire since before 1944 (the beginning of the Payette National Forest historic fire layer). It should be considered completely within the expected range of historic variability for the Burgdorf area to be burning now.
Wildfire risk reduction in this area is not likely to be accomplished by mechanical means. Thinning of forests in the Burgdorf Junction fire area would be extremely difficult and expensive due to the very steep and rugged topography. While thinning may be a reasonable part of a wildfire risk reduction strategy in dry forests, it much less appropriate in areas such as this one that are dominated by subalpine forests. Higher wildfire risks may actually result. Several studies have observed higher fire hazards in landscapes managed for timber production than in roadless areas or wilderness (US Forest Service 1995, McKelvey 1996, Weatherspoon 1996, Hann 1997, Frost 1999). Reasons for this include: drier fuel conditions, potential for rapid spread due to open conditions (Countryman 1955), higher tree densities and fuel loads, and higher risk of tree mortality from insect infestation, disease and other disturbances (Hann 1997). A study on the Wenatchee National Forest, Washington, found that treatments designed to reduce fuel loads (e.g., thinning) actually increased fire damage (US Forest Service 1995). Simulation modeling suggests that mechanical treatments alone might not be effective in reducing fire severity in dense stands (van Wagtendonk 1996).
Information Sources General Fire Information
California Interagency Incident Management Team 5 (http://www.r5.fs.fed.us/fire/team5/current.html)
Payette National Forest website (http://www.fs.fed.us/r4/payette/burgdorf) National Interagency Coordination Center (http://www.nifc.gov/news/sitrprt.html)
GIS Data
Idaho Gap Analysis Project (http://www.wildlife.uidaho.edu) U.S. Forest Service (ftp://gis.fs.fed.us) Payette National Forest GIS Lab (http://www.fs.fed.us/r4/payette) ICBEMP fire location database (http://www.icbemp.gov)
44
Clear Creek Fire, Idaho
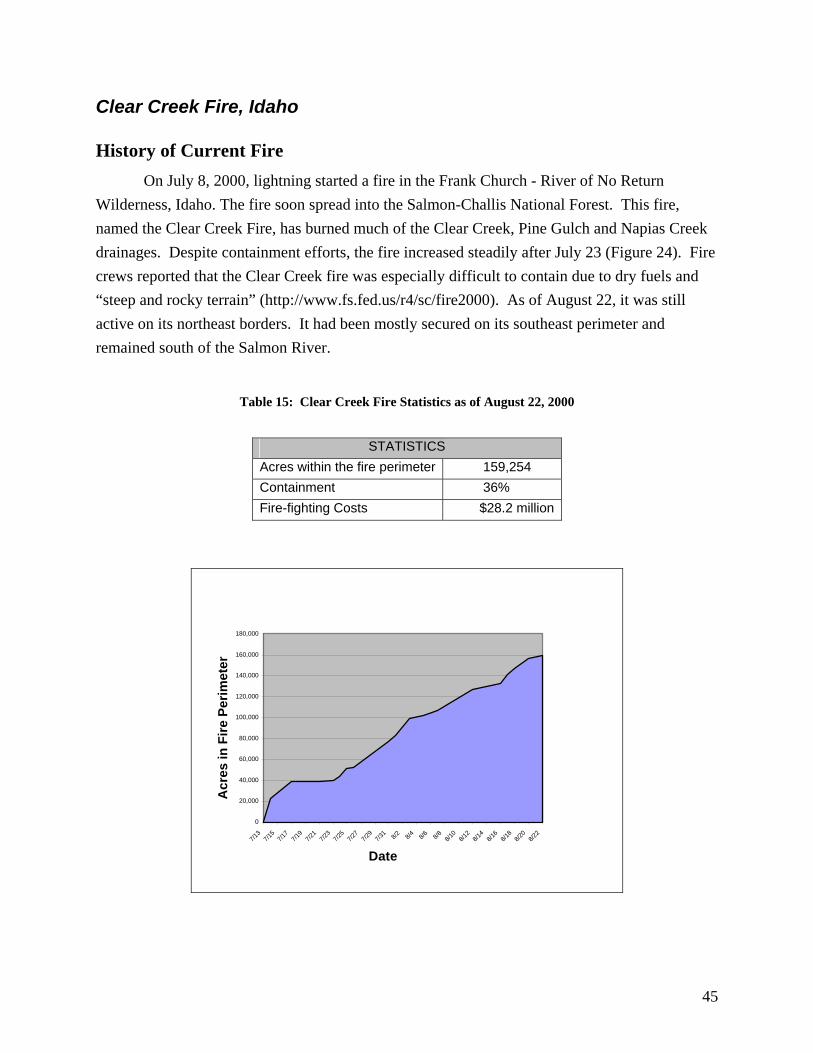
History of Current Fire On July 8, 2000, lightning started a fire in the Frank Church - River of No Return Wilderness, Idaho. The fire soon spread into the Salmon-Challis National Forest. This fire, named the Clear Creek Fire, has burned much of the Clear Creek, Pine Gulch and Napias Creek drainages. Despite containment efforts, the fire increased steadily after July 23 (Figure 24). Fire crews reported that the Clear Creek fire was especially difficult to contain due to dry fuels and “steep and rocky terrain” (http://www.fs.fed.us/r4/sc/fire2000). As of August 22, it was still active on its northeast borders. It had been mostly secured on its southeast perimeter and remained south of the Salmon River.
Table 15: Clear Creek Fire Statistics as of August 22, 2000
STATISTICS Acres within the fire perimeter 159,254 Containment 36% Fire-fighting Costs $28.2 million
0
20,000
40,000
60,000
80,000
100,000
120,000
140,000
160,000
180,000
7/13
7/15
7/17
7/19
7/21
7/23
7/25
7/27
7/29
7/31 8/2 8/4 8/6 8/8 8/1
08/1
28/1
48/1
68/1
88/2
08/2
2
Date
Acr
es in
Fire
Per
imet
er
45
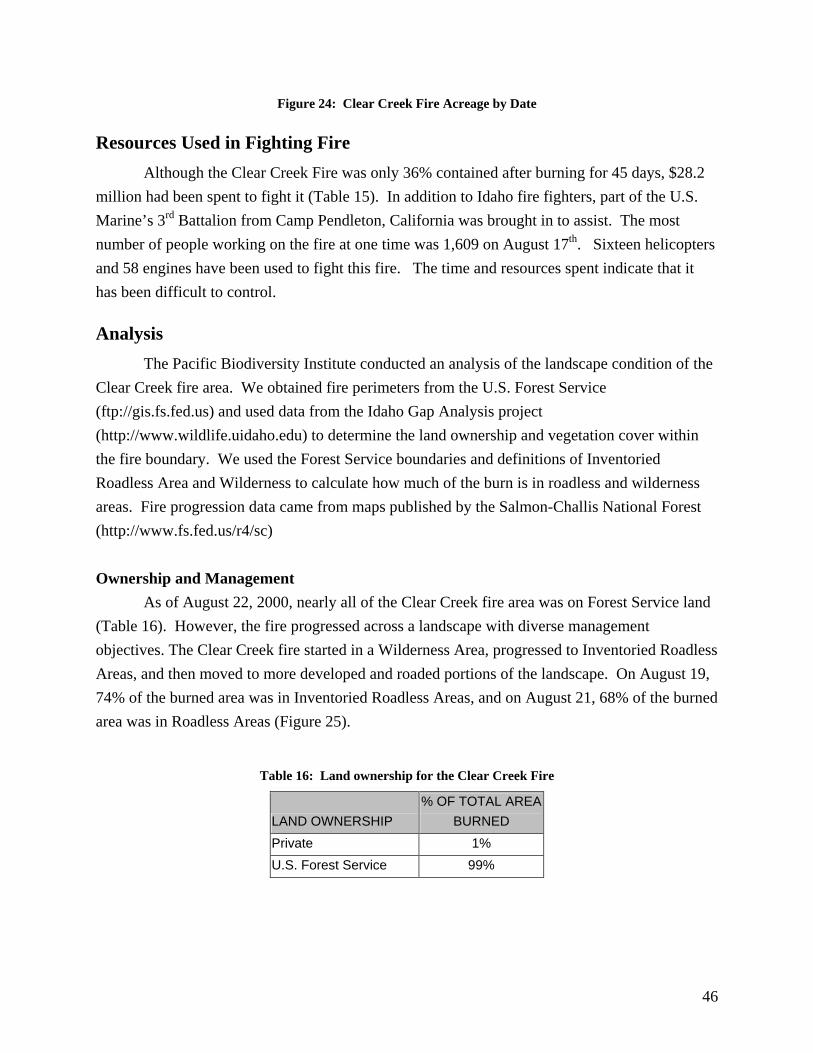
Figure 24: Clear Creek Fire Acreage by Date
Resources Used in Fighting Fire Although the Clear Creek Fire was only 36% contained after burning for 45 days, $28.2
million had been spent to fight it (Table 15). In addition to Idaho fire fighters, part of the U.S. Marine’s 3rd Battalion from Camp Pendleton, California was brought in to assist. The most number of people working on the fire at one time was 1,609 on August 17th. Sixteen helicopters and 58 engines have been used to fight this fire. The time and resources spent indicate that it has been difficult to control.
Analysis The Pacific Biodiversity Institute conducted an analysis of the landscape condition of the
Clear Creek fire area. We obtained fire perimeters from the U.S. Forest Service (ftp://gis.fs.fed.us) and used data from the Idaho Gap Analysis project (http://www.wildlife.uidaho.edu) to determine the land ownership and vegetation cover within the fire boundary. We used the Forest Service boundaries and definitions of Inventoried Roadless Area and Wilderness to calculate how much of the burn is in roadless and wilderness areas. Fire progression data came from maps published by the Salmon-Challis National Forest (http://www.fs.fed.us/r4/sc)
Ownership and Management
As of August 22, 2000, nearly all of the Clear Creek fire area was on Forest Service land (Table 16). However, the fire progressed across a landscape with diverse management objectives. The Clear Creek fire started in a Wilderness Area, progressed to Inventoried Roadless Areas, and then moved to more developed and roaded portions of the landscape. On August 19, 74% of the burned area was in Inventoried Roadless Areas, and on August 21, 68% of the burned area was in Roadless Areas (Figure 25).
Table 16: Land ownership for the Clear Creek Fire
LAND OWNERSHIP % OF TOTAL AREA
BURNED Private 1% U.S. Forest Service 99%
46
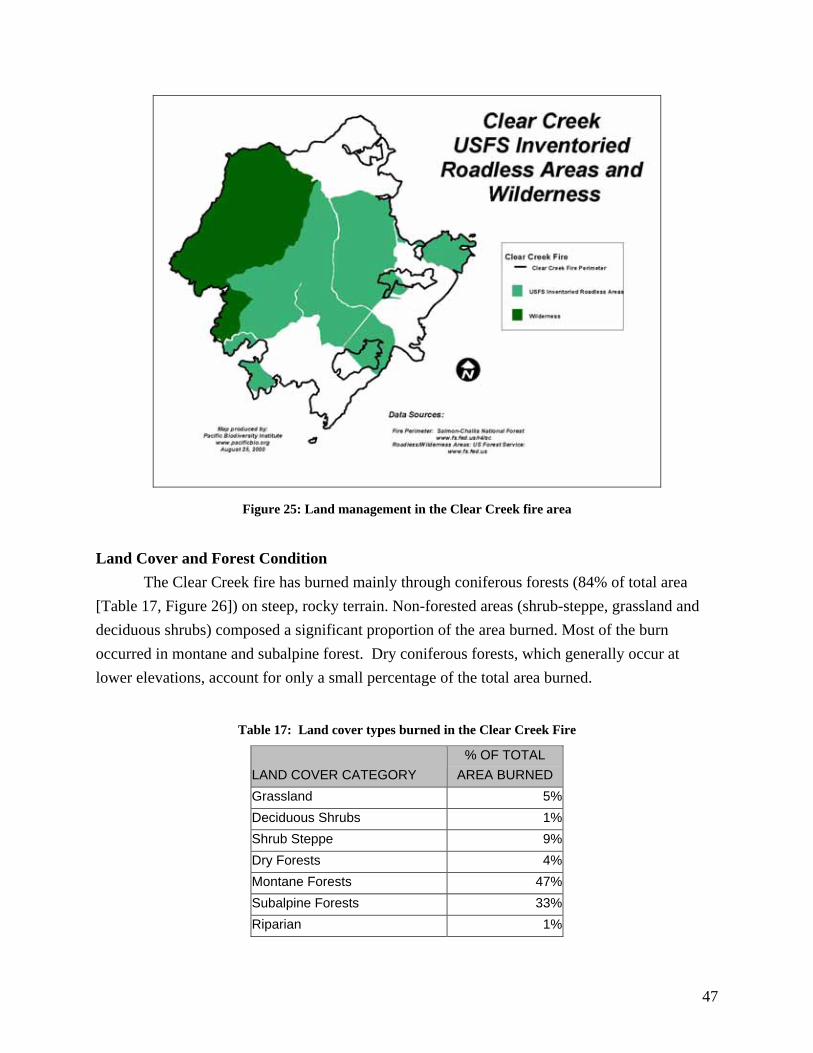
Figure 25: Land management in the Clear Creek fire area
Land Cover and Forest Condition
The Clear Creek fire has burned mainly through coniferous forests (84% of total area [Table 17, Figure 26]) on steep, rocky terrain. Non-forested areas (shrub-steppe, grassland and deciduous shrubs) composed a significant proportion of the area burned. Most of the burn occurred in montane and subalpine forest. Dry coniferous forests, which generally occur at lower elevations, account for only a small percentage of the total area burned.
Table 17: Land cover types burned in the Clear Creek Fire
LAND COVER CATEGORY % OF TOTAL
AREA BURNED Grassland 5%Deciduous Shrubs 1%Shrub Steppe 9%Dry Forests 4%Montane Forests 47%Subalpine Forests 33%Riparian 1%
47
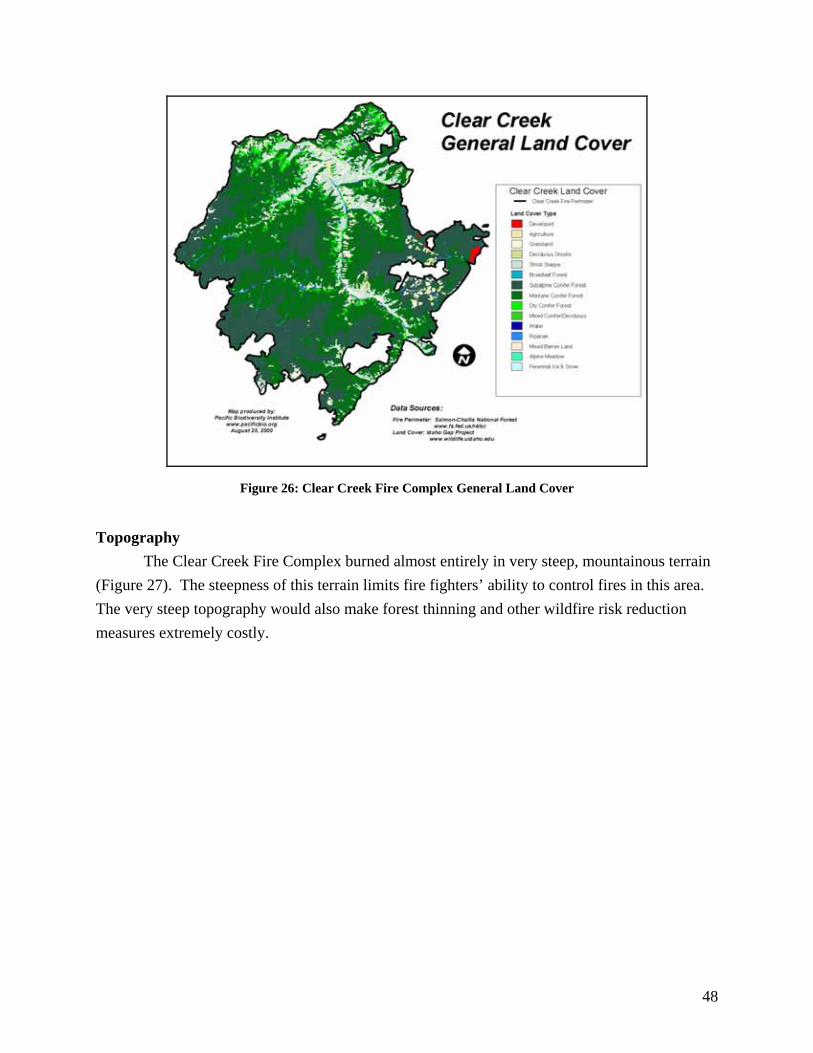
Figure 26: Clear Creek Fire Complex General Land Cover
Topography The Clear Creek Fire Complex burned almost entirely in very steep, mountainous terrain (Figure 27). The steepness of this terrain limits fire fighters’ ability to control fires in this area. The very steep topography would also make forest thinning and other wildfire risk reduction measures extremely costly.
48
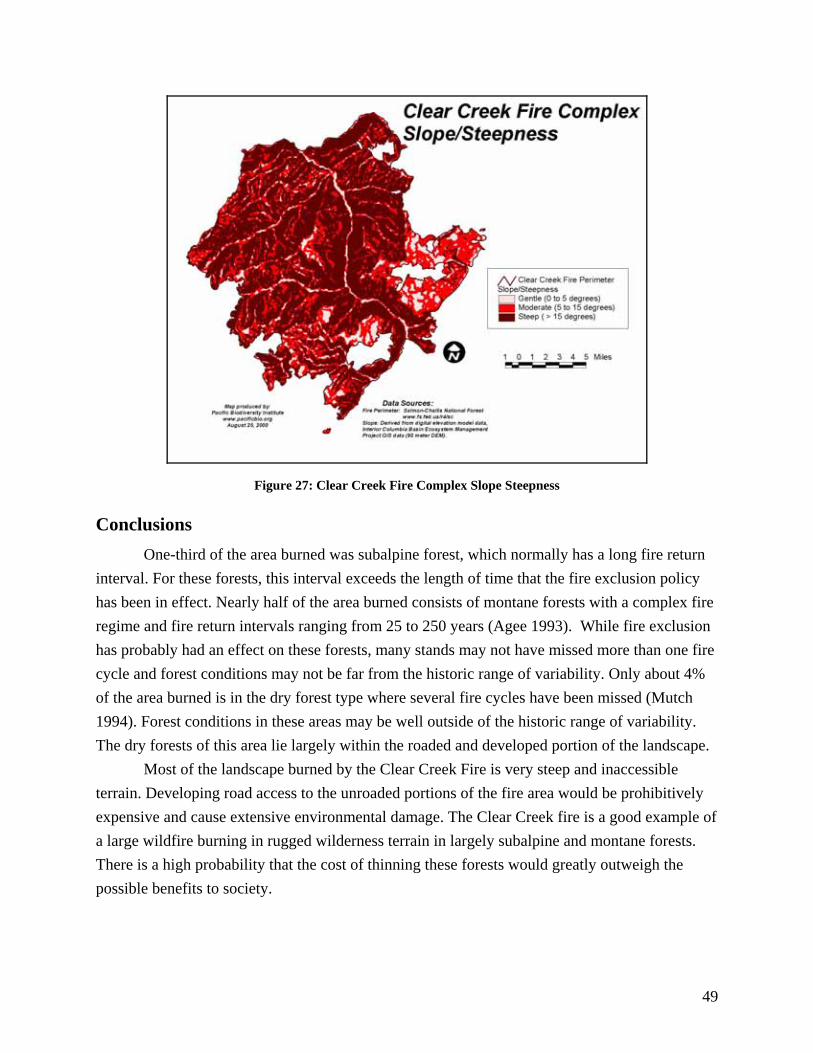
Figure 27: Clear Creek Fire Complex Slope Steepness
Conclusions One-third of the area burned was subalpine forest, which normally has a long fire return
interval. For these forests, this interval exceeds the length of time that the fire exclusion policy has been in effect. Nearly half of the area burned consists of montane forests with a complex fire regime and fire return intervals ranging from 25 to 250 years (Agee 1993). While fire exclusion has probably had an effect on these forests, many stands may not have missed more than one fire cycle and forest conditions may not be far from the historic range of variability. Only about 4% of the area burned is in the dry forest type where several fire cycles have been missed (Mutch 1994). Forest conditions in these areas may be well outside of the historic range of variability. The dry forests of this area lie largely within the roaded and developed portion of the landscape.
Most of the landscape burned by the Clear Creek Fire is very steep and inaccessible terrain. Developing road access to the unroaded portions of the fire area would be prohibitively expensive and cause extensive environmental damage. The Clear Creek fire is a good example of a large wildfire burning in rugged wilderness terrain in largely subalpine and montane forests. There is a high probability that the cost of thinning these forests would greatly outweigh the possible benefits to society.
49
Information Sources General Fire Information
Salmon-Challis National Forest (http://www.fs.fed.us/r4/sc/fire2000) National Interagency Coordination Center (http://www.nifc.gov/news/sitrprt.html)
GIS Data US Forest Service Anonymous FTP Server (ftp://gis.fs.fed.us) Idaho Gap Analysis (http://www.wildlife.uidaho.edu)
Maloney Creek, Idaho
History of the Current Fire The Maloney Creek Fire started during a dry lightning storm on August 10, 2000. The
fire area is 12 miles southwest of Craigmont, Idaho, near the confluence of Maloney Creek and the Salmon River. After burning for 19 days, it covered 74,000 acres. The Maloney Creek Fire was declared 100% contained by August 29, 2000. Fire suppression costs were $4.3 million (Table 18).
Table 18: Maloney Fire Statistics as of August 29, 2000
STATISTICS
Acres within fire perimeter 74,000 Containment 100% Fire-fighting Costs $4.3 Million Structures Lost 12
Analysis Ownership and Management
The Maloney Creek Fire occurred primarily on Idaho Department of Fish and Game and private lands (Table 19, Figure 28). The majority of the burn is on the Idaho Department of Fish and Game’s Craig Mountain Wildlife Management Area (WMA). This area was annexed into the existing Craig Mountain WMA in 1995 as mitigation lands for the construction of Dworshak Reservoir (Idaho Department of Fish and Game 1995). Because the Craig Mountain WMA is managed for the protection of wildlife, in particular game species, motorized vehicle access is
50
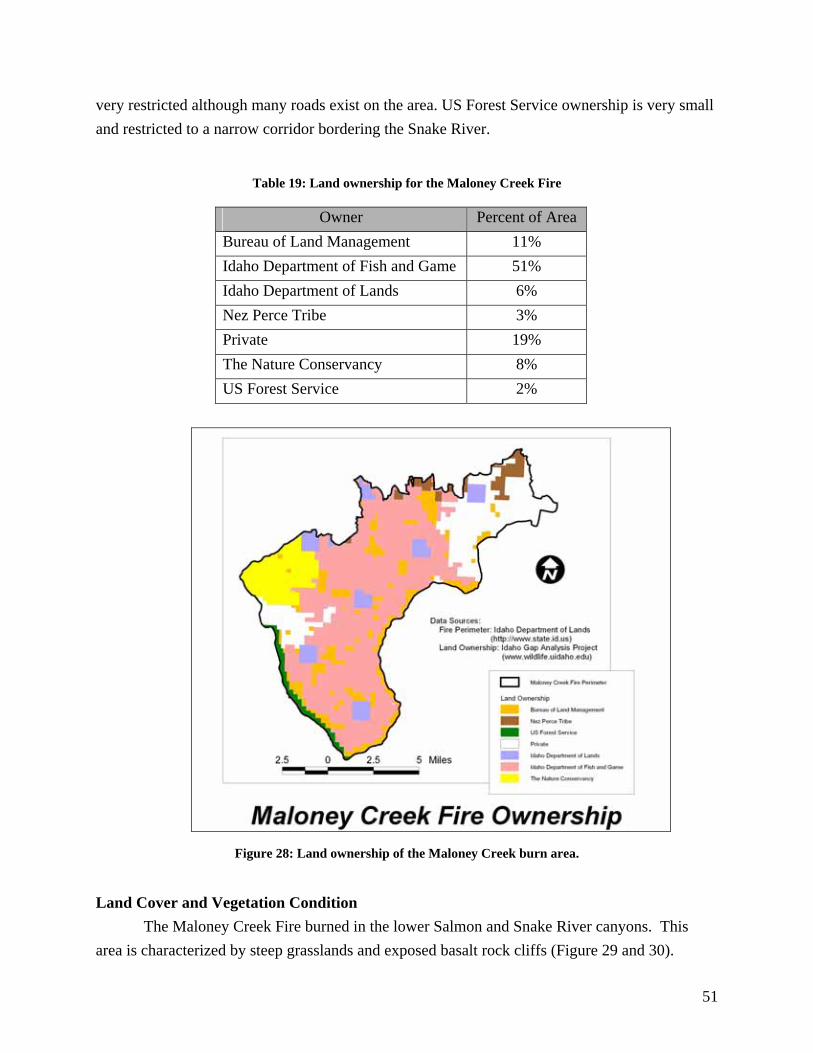
very restricted although many roads exist on the area. US Forest Service ownership is very small and restricted to a narrow corridor bordering the Snake River.
Table 19: Land ownership for the Maloney Creek Fire
Owner Percent of Area Bureau of Land Management 11% Idaho Department of Fish and Game 51% Idaho Department of Lands 6% Nez Perce Tribe 3% Private 19% The Nature Conservancy 8% US Forest Service 2%
Figure 28: Land ownership of the Maloney Creek burn area.
Land Cover and Vegetation Condition
The Maloney Creek Fire burned in the lower Salmon and Snake River canyons. This area is characterized by steep grasslands and exposed basalt rock cliffs (Figure 29 and 30).
51

Small stands of dry coniferous forest exist at higher elevations and on north-facing slopes that retain more moisture. Several large tributary streams (Maloney Creek, Eagle Creek, China Creek) flow into the Salmon River on the eastern side of the burn perimeter. Deciduous, riparian trees and shrubs border these streams.
Figure 29: Land cover on the Maloney Creek burn area.
Figure 30: China Creek, a tributary of the Salmon River that was within the Maloney Creek burn perimeter, is very similar to that of the entire burn. The land cover of the Maloney Creek burn is mostly grasslands and
exposed basalt rock (background) with small patches of coniferous forests in draws at the top of the canyon (foreground). Photo by Jason Karl.
52
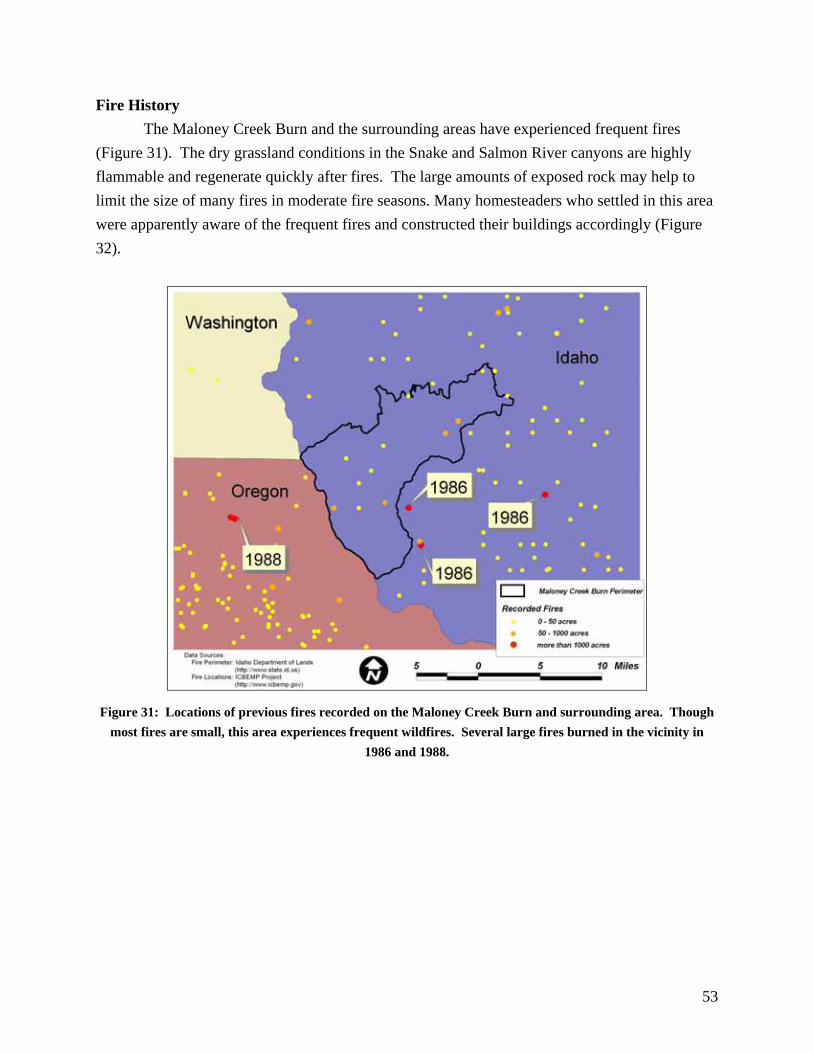
Fire History The Maloney Creek Burn and the surrounding areas have experienced frequent fires
(Figure 31). The dry grassland conditions in the Snake and Salmon River canyons are highly flammable and regenerate quickly after fires. The large amounts of exposed rock may help to limit the size of many fires in moderate fire seasons. Many homesteaders who settled in this area were apparently aware of the frequent fires and constructed their buildings accordingly (Figure 32).
Figure 31: Locations of previous fires recorded on the Maloney Creek Burn and surrounding area. Though
most fires are small, this area experiences frequent wildfires. Several large fires burned in the vicinity in 1986 and 1988.
53
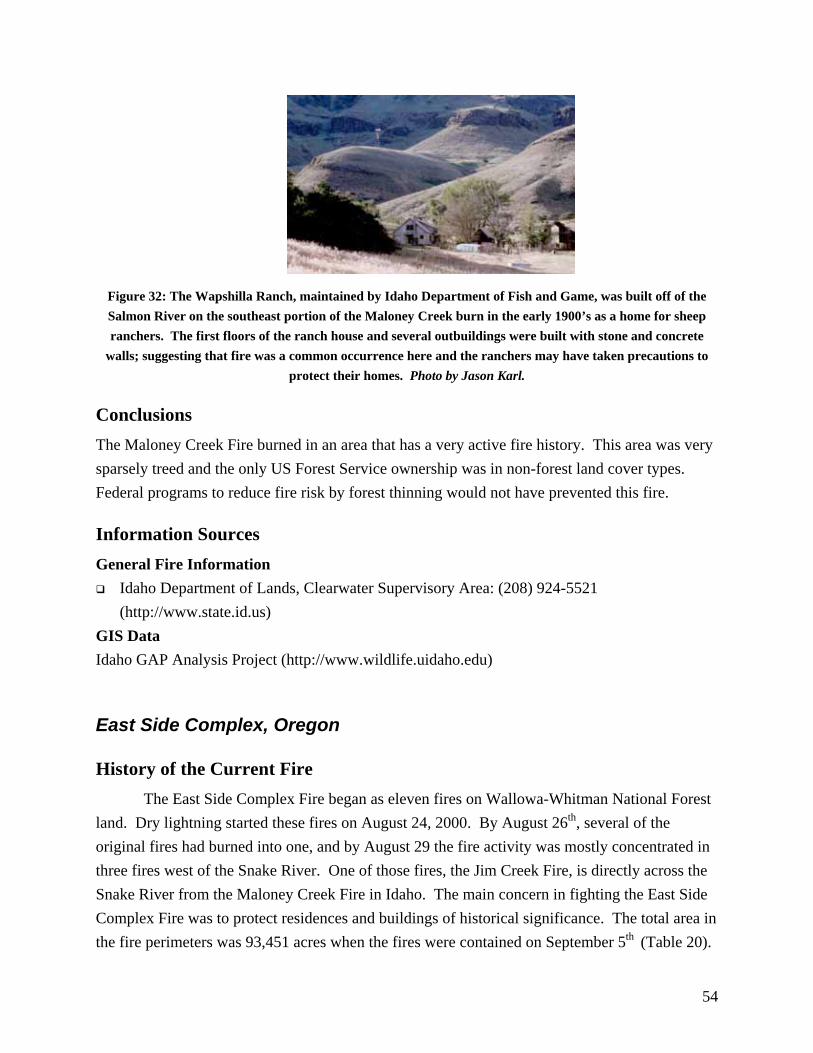
Figure 32: The Wapshilla Ranch, maintained by Idaho Department of Fish and Game, was built off of the Salmon River on the southeast portion of the Maloney Creek burn in the early 1900’s as a home for sheep ranchers. The first floors of the ranch house and several outbuildings were built with stone and concrete
walls; suggesting that fire was a common occurrence here and the ranchers may have taken precautions to protect their homes. Photo by Jason Karl.
Conclusions The Maloney Creek Fire burned in an area that has a very active fire history. This area was very sparsely treed and the only US Forest Service ownership was in non-forest land cover types. Federal programs to reduce fire risk by forest thinning would not have prevented this fire.
Information Sources General Fire Information
Idaho Department of Lands, Clearwater Supervisory Area: (208) 924-5521 (http://www.state.id.us)
GIS Data Idaho GAP Analysis Project (http://www.wildlife.uidaho.edu)
East Side Complex, Oregon
History of the Current Fire The East Side Complex Fire began as eleven fires on Wallowa-Whitman National Forest
land. Dry lightning started these fires on August 24, 2000. By August 26th, several of the original fires had burned into one, and by August 29 the fire activity was mostly concentrated in three fires west of the Snake River. One of those fires, the Jim Creek Fire, is directly across the Snake River from the Maloney Creek Fire in Idaho. The main concern in fighting the East Side Complex Fire was to protect residences and buildings of historical significance. The total area in the fire perimeters was 93,451 acres when the fires were contained on September 5th (Table 20).
54
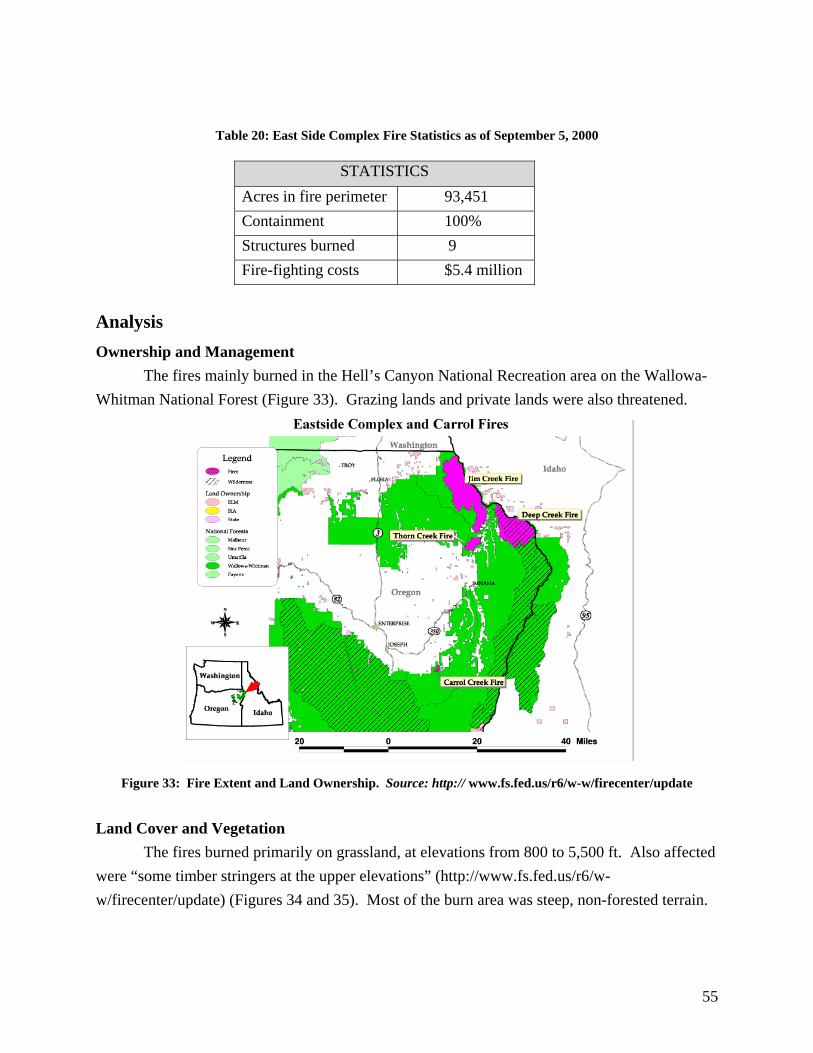
Table 20: East Side Complex Fire Statistics as of September 5, 2000
STATISTICS Acres in fire perimeter 93,451 Containment 100% Structures burned 9 Fire-fighting costs $5.4 million
Analysis Ownership and Management
The fires mainly burned in the Hell’s Canyon National Recreation area on the Wallowa-Whitman National Forest (Figure 33). Grazing lands and private lands were also threatened.
Figure 33: Fire Extent and Land Ownership. Source: http:// www.fs.fed.us/r6/w-w/firecenter/update
Land Cover and Vegetation The fires burned primarily on grassland, at elevations from 800 to 5,500 ft. Also affected
were “some timber stringers at the upper elevations” (http://www.fs.fed.us/r6/w-w/firecenter/update) (Figures 34 and 35). Most of the burn area was steep, non-forested terrain.
55
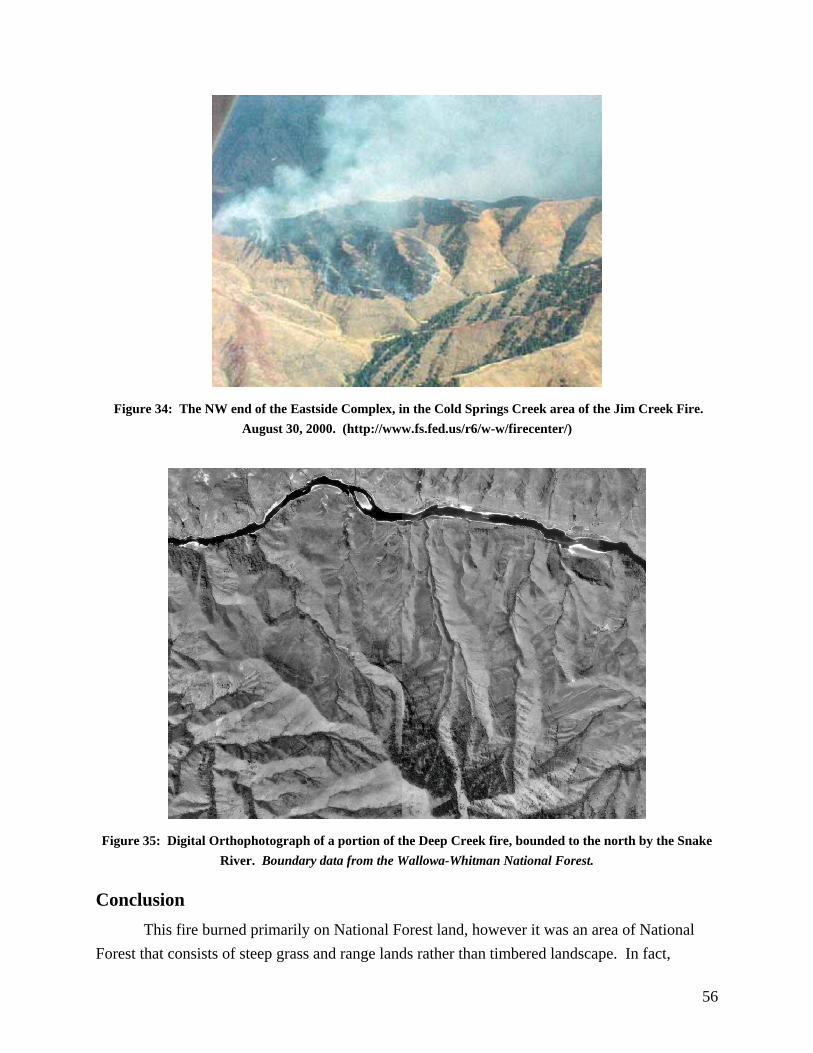
Figure 34: The NW end of the Eastside Complex, in the Cold Springs Creek area of the Jim Creek Fire.
August 30, 2000. (http://www.fs.fed.us/r6/w-w/firecenter/)
Figure 35: Digital Orthophotograph of a portion of the Deep Creek fire, bounded to the north by the Snake
River. Boundary data from the Wallowa-Whitman National Forest.
Conclusion This fire burned primarily on National Forest land, however it was an area of National
Forest that consists of steep grass and range lands rather than timbered landscape. In fact,
56
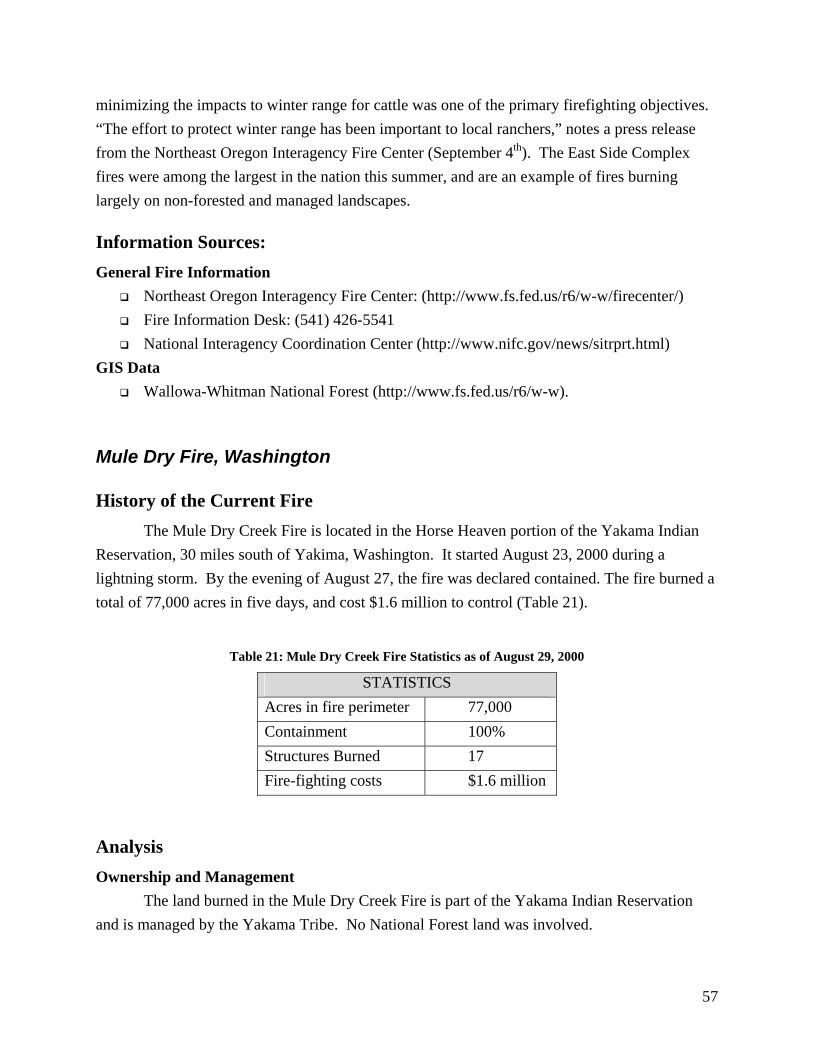
minimizing the impacts to winter range for cattle was one of the primary firefighting objectives. “The effort to protect winter range has been important to local ranchers,” notes a press release from the Northeast Oregon Interagency Fire Center (September 4th). The East Side Complex fires were among the largest in the nation this summer, and are an example of fires burning largely on non-forested and managed landscapes.
Information Sources: General Fire Information
Northeast Oregon Interagency Fire Center: (http://www.fs.fed.us/r6/w-w/firecenter/) Fire Information Desk: (541) 426-5541 National Interagency Coordination Center (http://www.nifc.gov/news/sitrprt.html)
GIS Data Wallowa-Whitman National Forest (http://www.fs.fed.us/r6/w-w).
Mule Dry Fire, Washington
History of the Current Fire The Mule Dry Creek Fire is located in the Horse Heaven portion of the Yakama Indian
Reservation, 30 miles south of Yakima, Washington. It started August 23, 2000 during a lightning storm. By the evening of August 27, the fire was declared contained. The fire burned a total of 77,000 acres in five days, and cost $1.6 million to control (Table 21).
Table 21: Mule Dry Creek Fire Statistics as of August 29, 2000
STATISTICS Acres in fire perimeter 77,000 Containment 100% Structures Burned 17 Fire-fighting costs $1.6 million
Analysis Ownership and Management The land burned in the Mule Dry Creek Fire is part of the Yakama Indian Reservation and is managed by the Yakama Tribe. No National Forest land was involved.
57
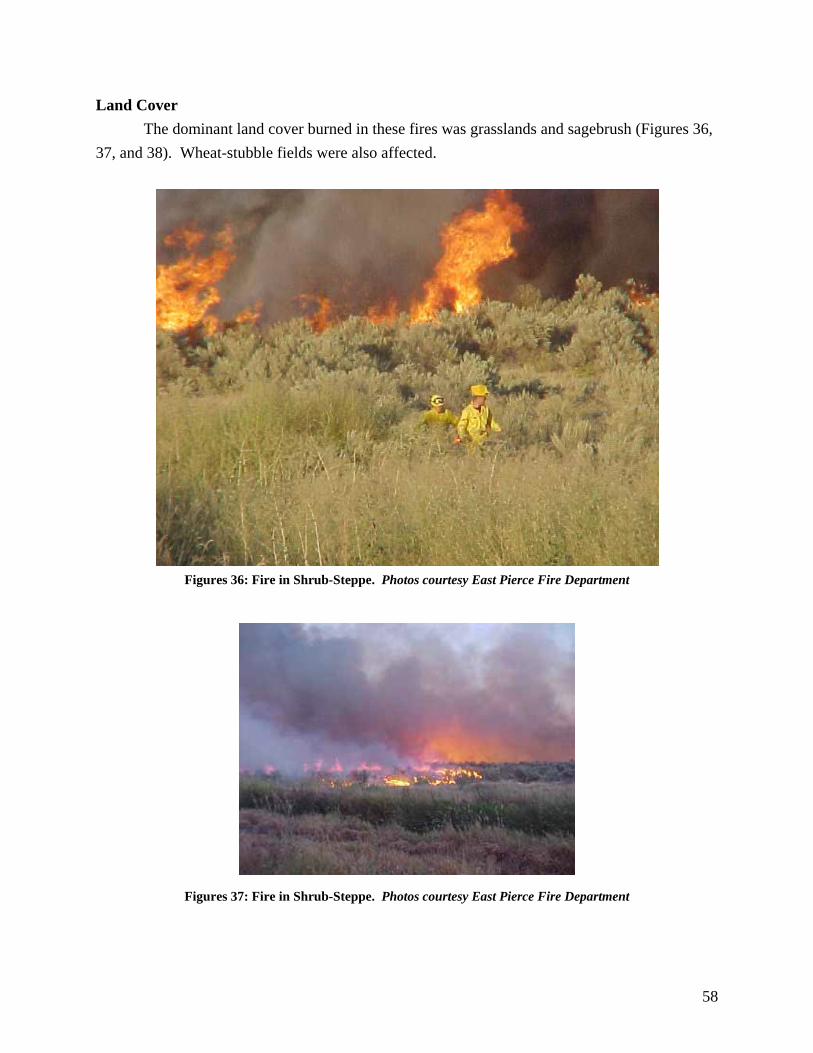
Land Cover The dominant land cover burned in these fires was grasslands and sagebrush (Figures 36,
37, and 38). Wheat-stubble fields were also affected.
Figures 36: Fire in Shrub-Steppe. Photos courtesy East Pierce Fire Department
Figures 37: Fire in Shrub-Steppe. Photos courtesy East Pierce Fire Department
58
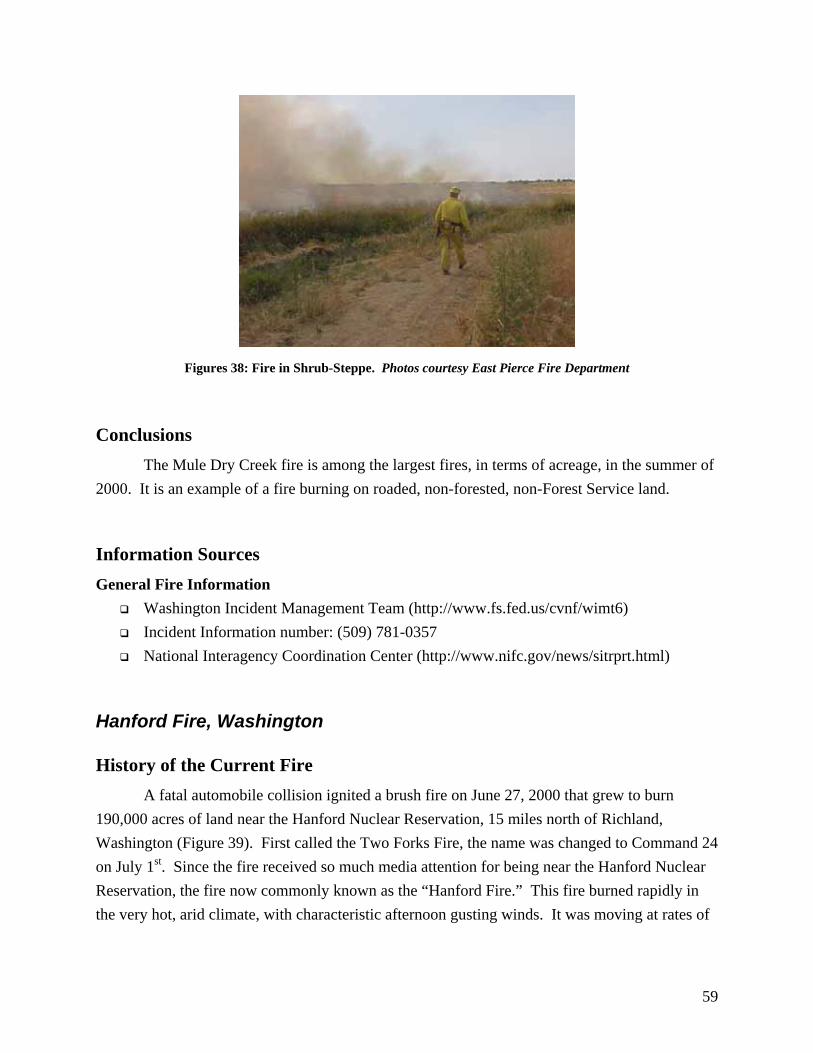
Figures 38: Fire in Shrub-Steppe. Photos courtesy East Pierce Fire Department
Conclusions The Mule Dry Creek fire is among the largest fires, in terms of acreage, in the summer of 2000. It is an example of a fire burning on roaded, non-forested, non-Forest Service land.
Information Sources General Fire Information
Washington Incident Management Team (http://www.fs.fed.us/cvnf/wimt6) Incident Information number: (509) 781-0357 National Interagency Coordination Center (http://www.nifc.gov/news/sitrprt.html)
Hanford Fire, Washington
History of the Current Fire A fatal automobile collision ignited a brush fire on June 27, 2000 that grew to burn
190,000 acres of land near the Hanford Nuclear Reservation, 15 miles north of Richland, Washington (Figure 39). First called the Two Forks Fire, the name was changed to Command 24 on July 1st. Since the fire received so much media attention for being near the Hanford Nuclear Reservation, the fire now commonly known as the “Hanford Fire.” This fire burned rapidly in the very hot, arid climate, with characteristic afternoon gusting winds. It was moving at rates of
59
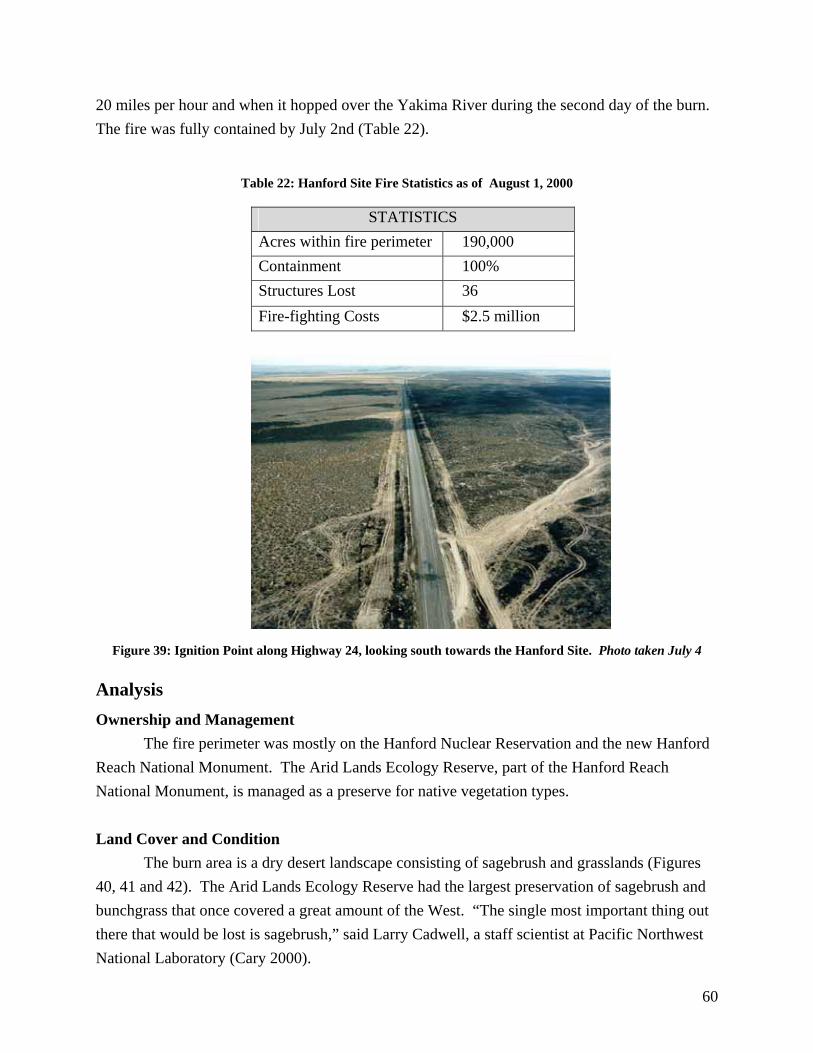
20 miles per hour and when it hopped over the Yakima River during the second day of the burn. The fire was fully contained by July 2nd (Table 22).
Table 22: Hanford Site Fire Statistics as of August 1, 2000
STATISTICS Acres within fire perimeter 190,000 Containment 100% Structures Lost 36 Fire-fighting Costs $2.5 million
Figure 39: Ignition Point along Highway 24, looking south towards the Hanford Site. Photo taken July 4
Analysis Ownership and Management The fire perimeter was mostly on the Hanford Nuclear Reservation and the new Hanford Reach National Monument. The Arid Lands Ecology Reserve, part of the Hanford Reach National Monument, is managed as a preserve for native vegetation types. Land Cover and Condition
The burn area is a dry desert landscape consisting of sagebrush and grasslands (Figures 40, 41 and 42). The Arid Lands Ecology Reserve had the largest preservation of sagebrush and bunchgrass that once covered a great amount of the West. “The single most important thing out there that would be lost is sagebrush,” said Larry Cadwell, a staff scientist at Pacific Northwest National Laboratory (Cary 2000).
60
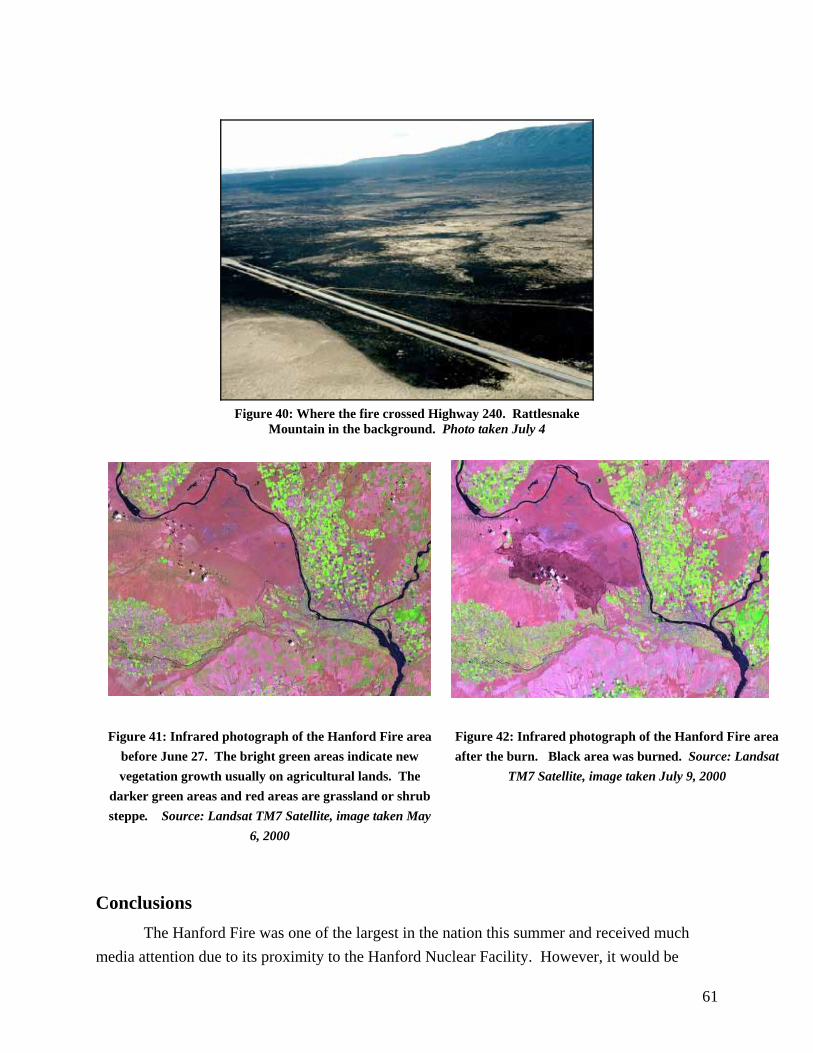
Figure 40: Where the fire crossed Highway 240. Rattlesnake
Mountain in the background. Photo taken July 4
Figure 41: Infrared photograph of the Hanford Fire area before June 27. The bright green areas indicate new vegetation growth usually on agricultural lands. The
darker green areas and red areas are grassland or shrub steppe. Source: Landsat TM7 Satellite, image taken May
6, 2000
Figure 42: Infrared photograph of the Hanford Fire area after the burn. Black area was burned. Source: Landsat
TM7 Satellite, image taken July 9, 2000
Conclusions The Hanford Fire was one of the largest in the nation this summer and received much media attention due to its proximity to the Hanford Nuclear Facility. However, it would be
61
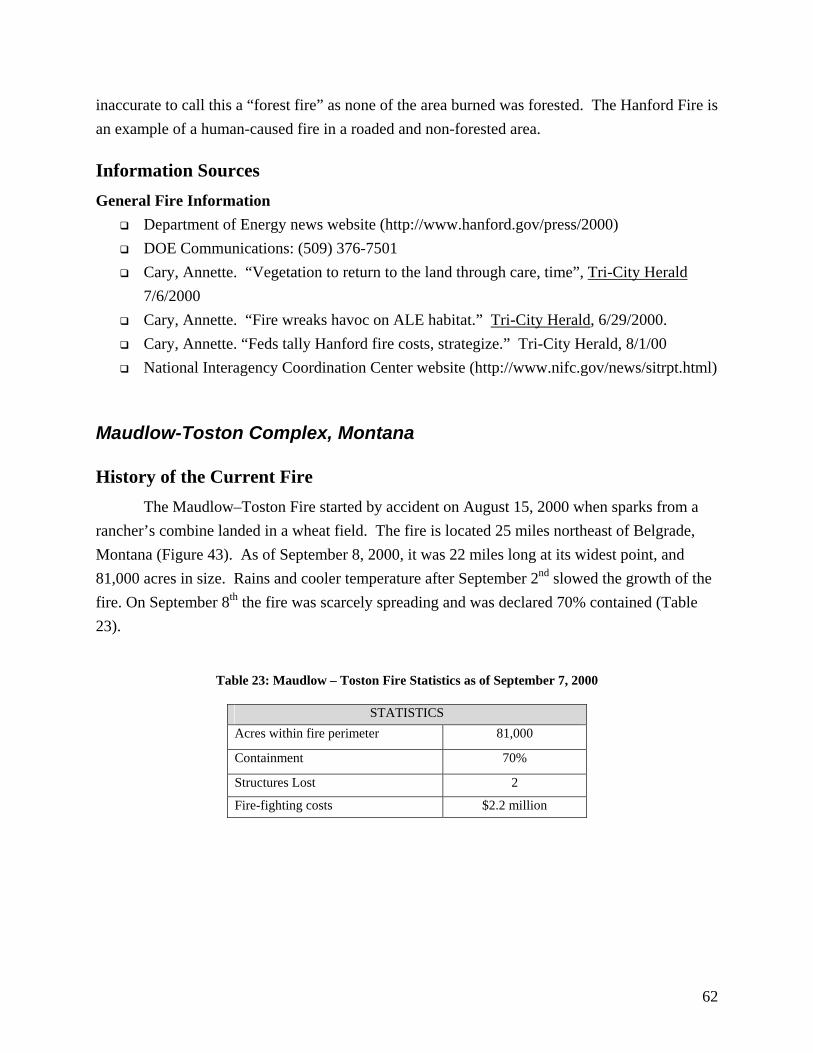
inaccurate to call this a “forest fire” as none of the area burned was forested. The Hanford Fire is an example of a human-caused fire in a roaded and non-forested area.
Information Sources General Fire Information
Department of Energy news website (http://www.hanford.gov/press/2000) DOE Communications: (509) 376-7501 Cary, Annette. “Vegetation to return to the land through care, time”, Tri-City Herald
7/6/2000 Cary, Annette. “Fire wreaks havoc on ALE habitat.” Tri-City Herald, 6/29/2000. Cary, Annette. “Feds tally Hanford fire costs, strategize.” Tri-City Herald, 8/1/00 National Interagency Coordination Center website (http://www.nifc.gov/news/sitrpt.html)
Maudlow-Toston Complex, Montana
History of the Current Fire The Maudlow–Toston Fire started by accident on August 15, 2000 when sparks from a
rancher’s combine landed in a wheat field. The fire is located 25 miles northeast of Belgrade, Montana (Figure 43). As of September 8, 2000, it was 22 miles long at its widest point, and 81,000 acres in size. Rains and cooler temperature after September 2nd slowed the growth of the fire. On September 8th the fire was scarcely spreading and was declared 70% contained (Table 23).
Table 23: Maudlow – Toston Fire Statistics as of September 7, 2000
STATISTICS Acres within fire perimeter 81,000
Containment 70%
Structures Lost 2
Fire-fighting costs $2.2 million
62
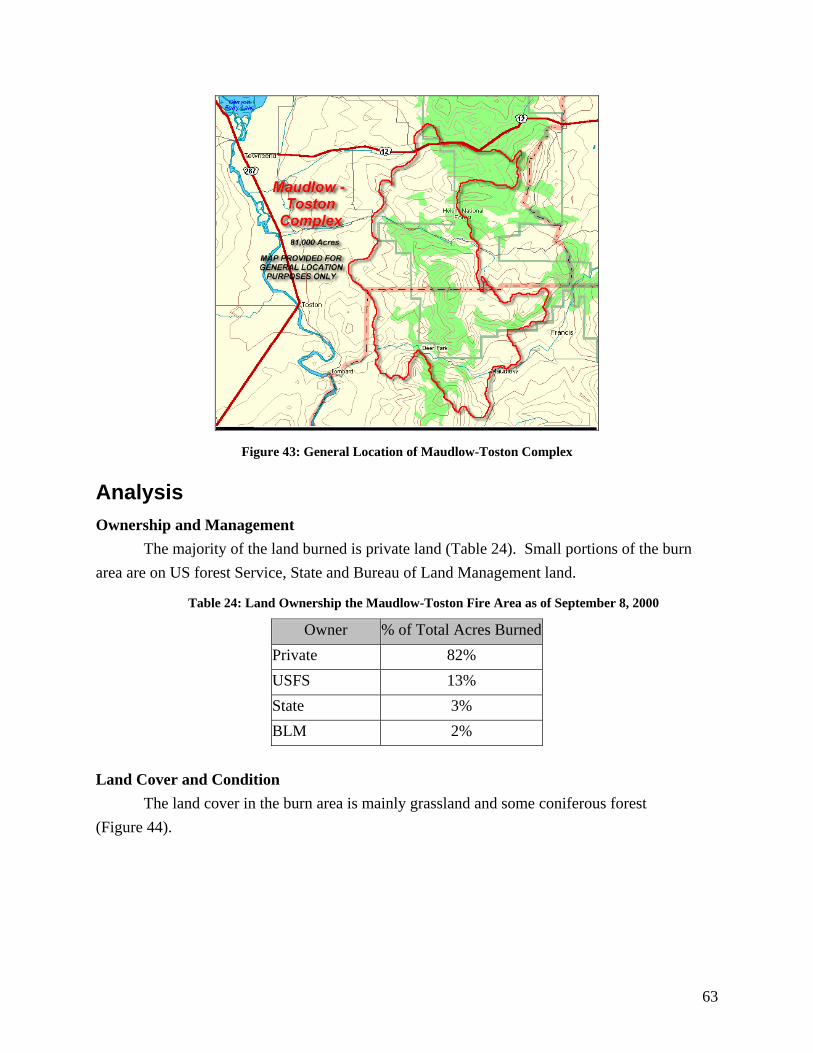
Figure 43: General Location of Maudlow-Toston Complex
Analysis Ownership and Management
The majority of the land burned is private land (Table 24). Small portions of the burn area are on US forest Service, State and Bureau of Land Management land.
Table 24: Land Ownership the Maudlow-Toston Fire Area as of September 8, 2000
Owner % of Total Acres BurnedPrivate 82% USFS 13% State 3% BLM 2%
Land Cover and Condition
The land cover in the burn area is mainly grassland and some coniferous forest (Figure 44).
63
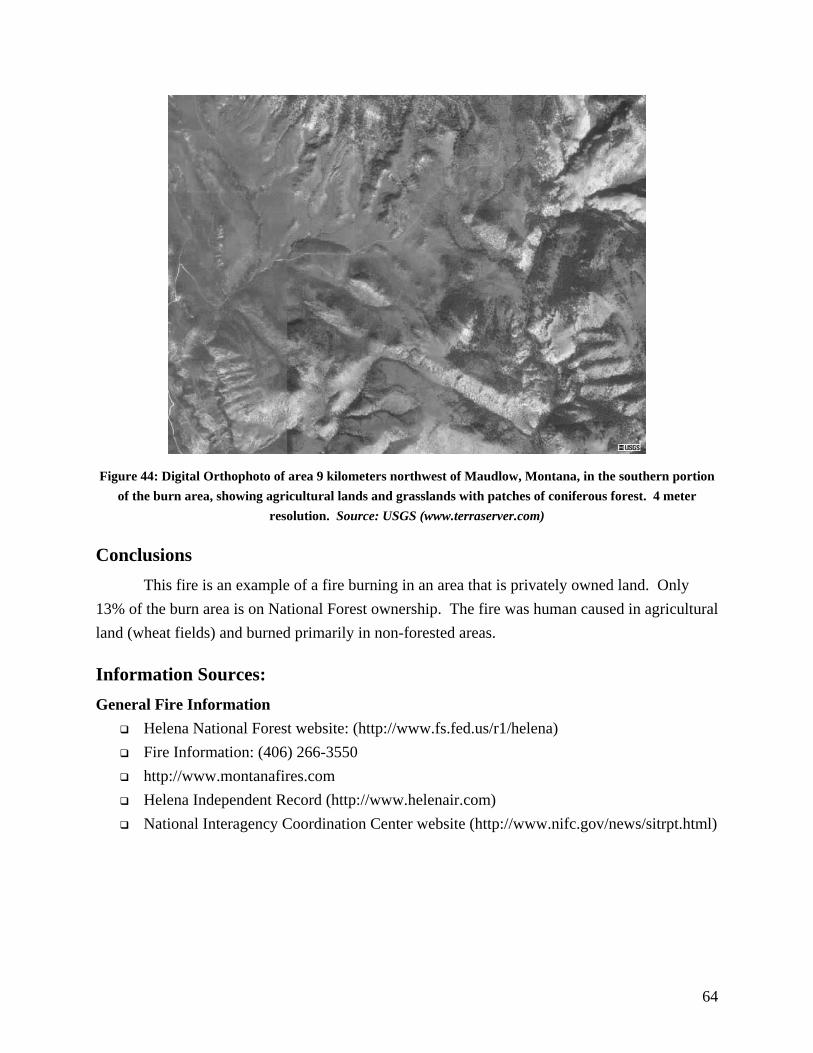
Figure 44: Digital Orthophoto of area 9 kilometers northwest of Maudlow, Montana, in the southern portion
of the burn area, showing agricultural lands and grasslands with patches of coniferous forest. 4 meter resolution. Source: USGS (www.terraserver.com)
Conclusions This fire is an example of a fire burning in an area that is privately owned land. Only 13% of the burn area is on National Forest ownership. The fire was human caused in agricultural land (wheat fields) and burned primarily in non-forested areas.
Information Sources: General Fire Information
Helena National Forest website: (http://www.fs.fed.us/r1/helena) Fire Information: (406) 266-3550 http://www.montanafires.com Helena Independent Record (http://www.helenair.com) National Interagency Coordination Center website (http://www.nifc.gov/news/sitrpt.html)
64
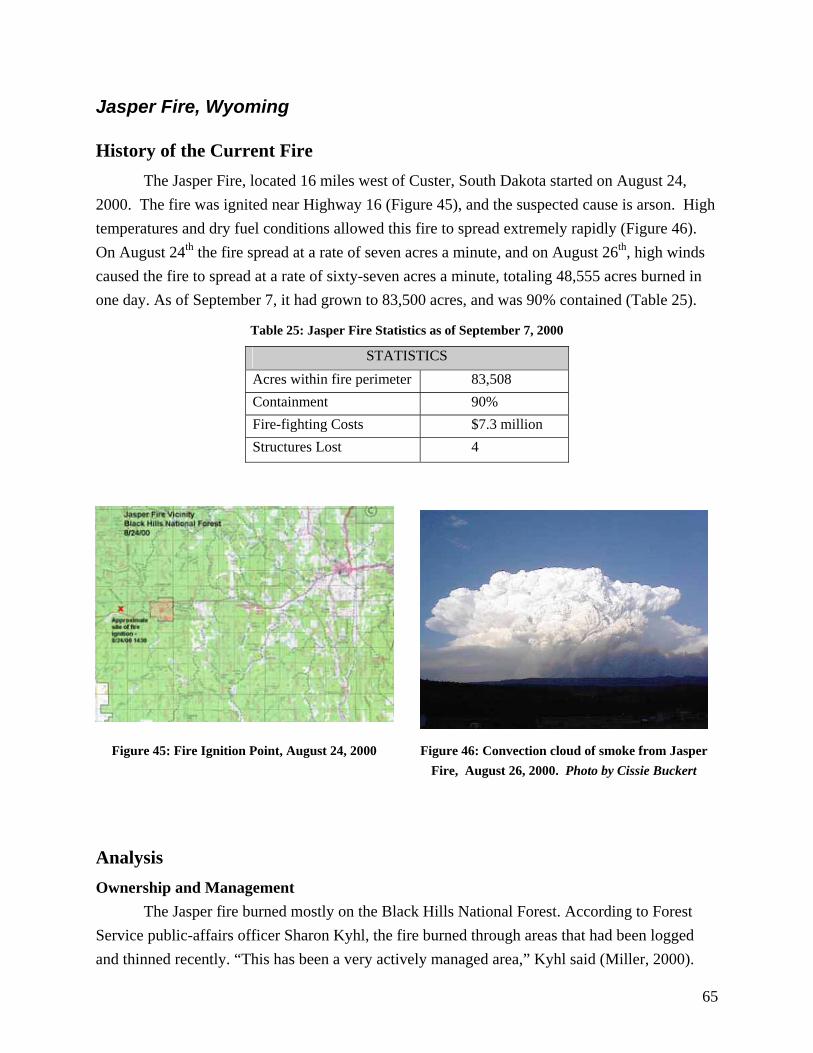
Jasper Fire, Wyoming
History of the Current Fire The Jasper Fire, located 16 miles west of Custer, South Dakota started on August 24,
2000. The fire was ignited near Highway 16 (Figure 45), and the suspected cause is arson. High temperatures and dry fuel conditions allowed this fire to spread extremely rapidly (Figure 46). On August 24th the fire spread at a rate of seven acres a minute, and on August 26th, high winds caused the fire to spread at a rate of sixty-seven acres a minute, totaling 48,555 acres burned in one day. As of September 7, it had grown to 83,500 acres, and was 90% contained (Table 25).
Table 25: Jasper Fire Statistics as of September 7, 2000
STATISTICS Acres within fire perimeter 83,508 Containment 90% Fire-fighting Costs $7.3 million Structures Lost 4
Figure 45: Fire Ignition Point, August 24, 2000 Figure 46: Convection cloud of smoke from Jasper
Fire, August 26, 2000. Photo by Cissie Buckert
Analysis Ownership and Management
The Jasper fire burned mostly on the Black Hills National Forest. According to Forest Service public-affairs officer Sharon Kyhl, the fire burned through areas that had been logged and thinned recently. “This has been a very actively managed area,” Kyhl said (Miller, 2000).
65
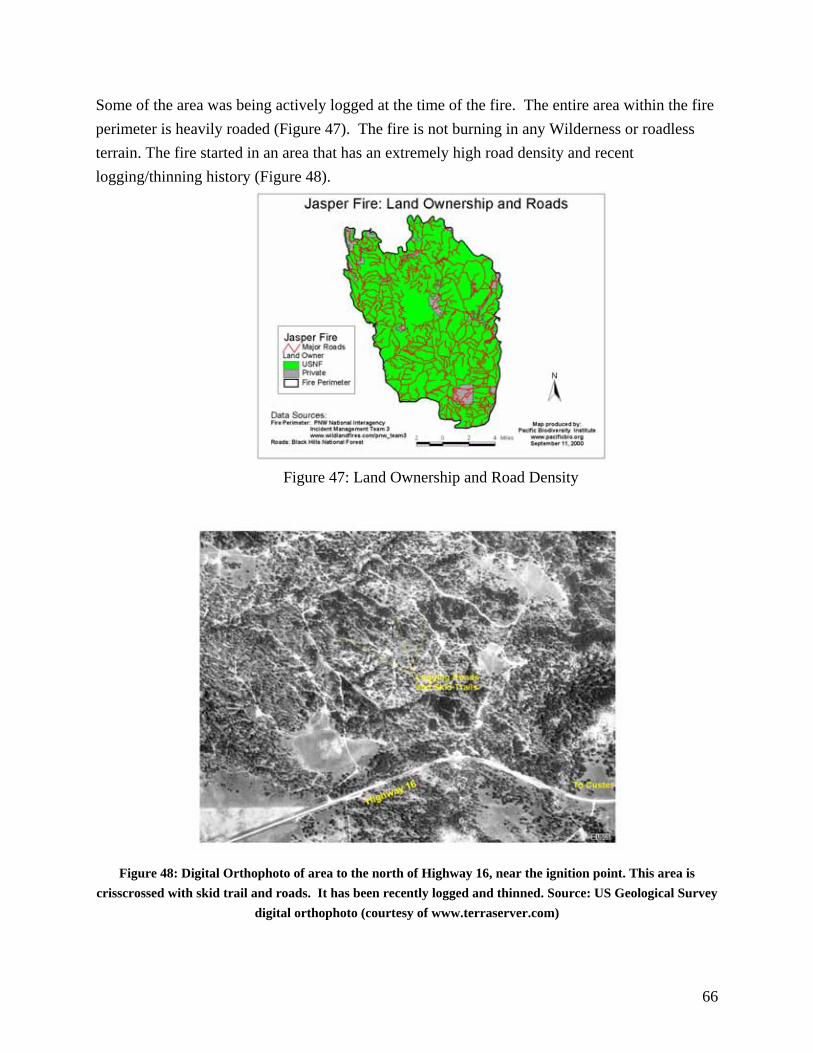
Some of the area was being actively logged at the time of the fire. The entire area within the fire perimeter is heavily roaded (Figure 47). The fire is not burning in any Wilderness or roadless terrain. The fire started in an area that has an extremely high road density and recent logging/thinning history (Figure 48).
Figure 47: Land Ownership and Road Density
Figure 48: Digital Orthophoto of area to the north of Highway 16, near the ignition point. This area is
crisscrossed with skid trail and roads. It has been recently logged and thinned. Source: US Geological Survey digital orthophoto (courtesy of www.terraserver.com)
66
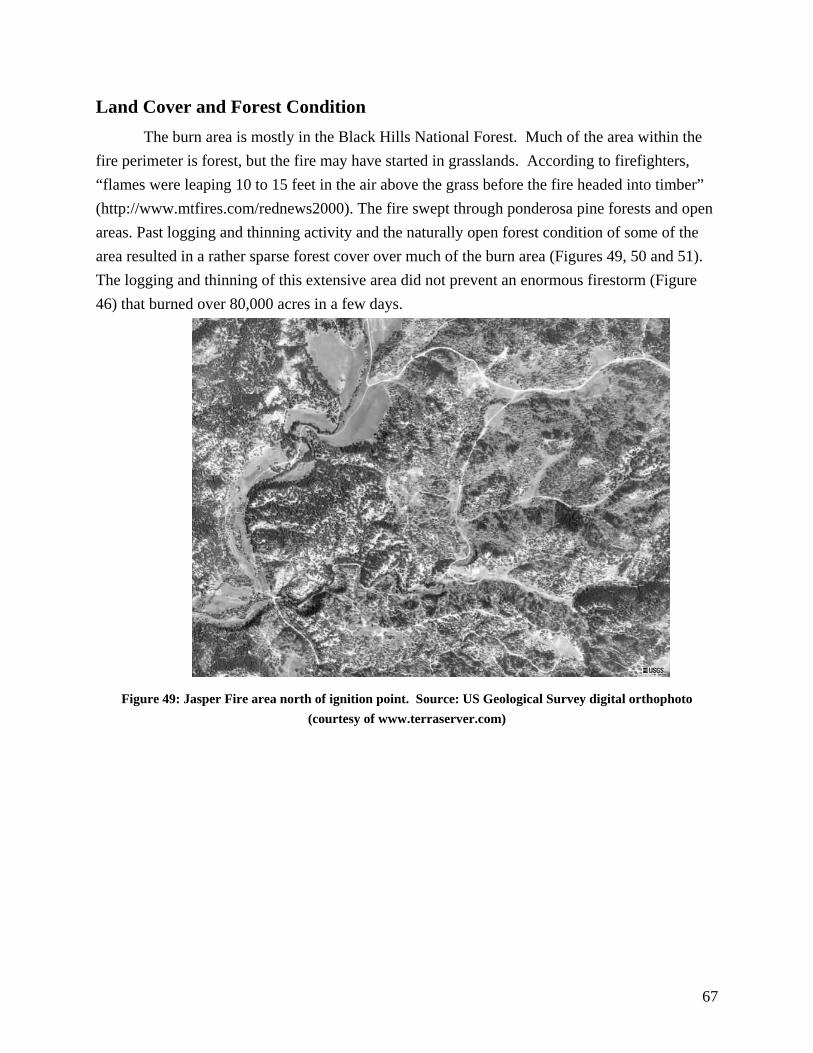
Land Cover and Forest Condition The burn area is mostly in the Black Hills National Forest. Much of the area within the
fire perimeter is forest, but the fire may have started in grasslands. According to firefighters, “flames were leaping 10 to 15 feet in the air above the grass before the fire headed into timber” (http://www.mtfires.com/rednews2000). The fire swept through ponderosa pine forests and open areas. Past logging and thinning activity and the naturally open forest condition of some of the area resulted in a rather sparse forest cover over much of the burn area (Figures 49, 50 and 51). The logging and thinning of this extensive area did not prevent an enormous firestorm (Figure 46) that burned over 80,000 acres in a few days.
Figure 49: Jasper Fire area north of ignition point. Source: US Geological Survey digital orthophoto
(courtesy of www.terraserver.com)
67
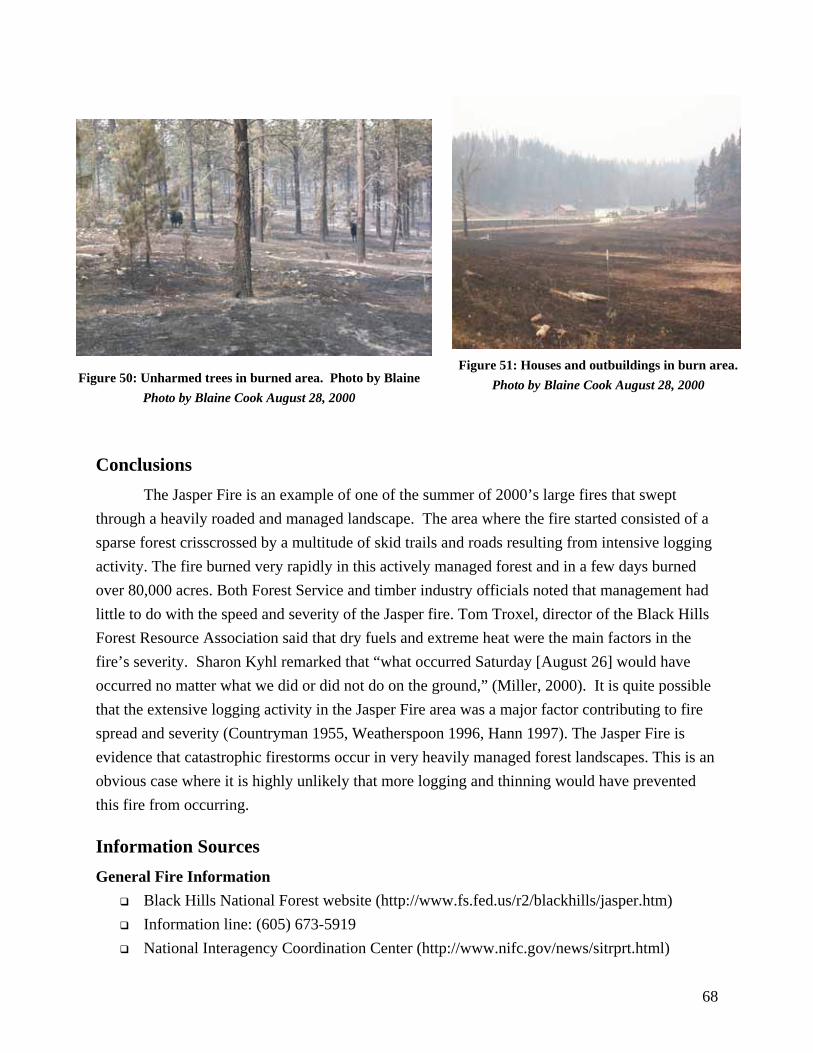
Figure 50: Unharmed trees in burned area. Photo by Blaine
Photo by Blaine Cook August 28, 2000
Figure 51: Houses and outbuildings in burn area. Photo by Blaine Cook August 28, 2000
Conclusions The Jasper Fire is an example of one of the summer of 2000’s large fires that swept
through a heavily roaded and managed landscape. The area where the fire started consisted of a sparse forest crisscrossed by a multitude of skid trails and roads resulting from intensive logging activity. The fire burned very rapidly in this actively managed forest and in a few days burned over 80,000 acres. Both Forest Service and timber industry officials noted that management had little to do with the speed and severity of the Jasper fire. Tom Troxel, director of the Black Hills Forest Resource Association said that dry fuels and extreme heat were the main factors in the fire’s severity. Sharon Kyhl remarked that “what occurred Saturday [August 26] would have occurred no matter what we did or did not do on the ground,” (Miller, 2000). It is quite possible that the extensive logging activity in the Jasper Fire area was a major factor contributing to fire spread and severity (Countryman 1955, Weatherspoon 1996, Hann 1997). The Jasper Fire is evidence that catastrophic firestorms occur in very heavily managed forest landscapes. This is an obvious case where it is highly unlikely that more logging and thinning would have prevented this fire from occurring.
Information Sources General Fire Information
Black Hills National Forest website (http://www.fs.fed.us/r2/blackhills/jasper.htm) Information line: (605) 673-5919 National Interagency Coordination Center (http://www.nifc.gov/news/sitrprt.html)
68
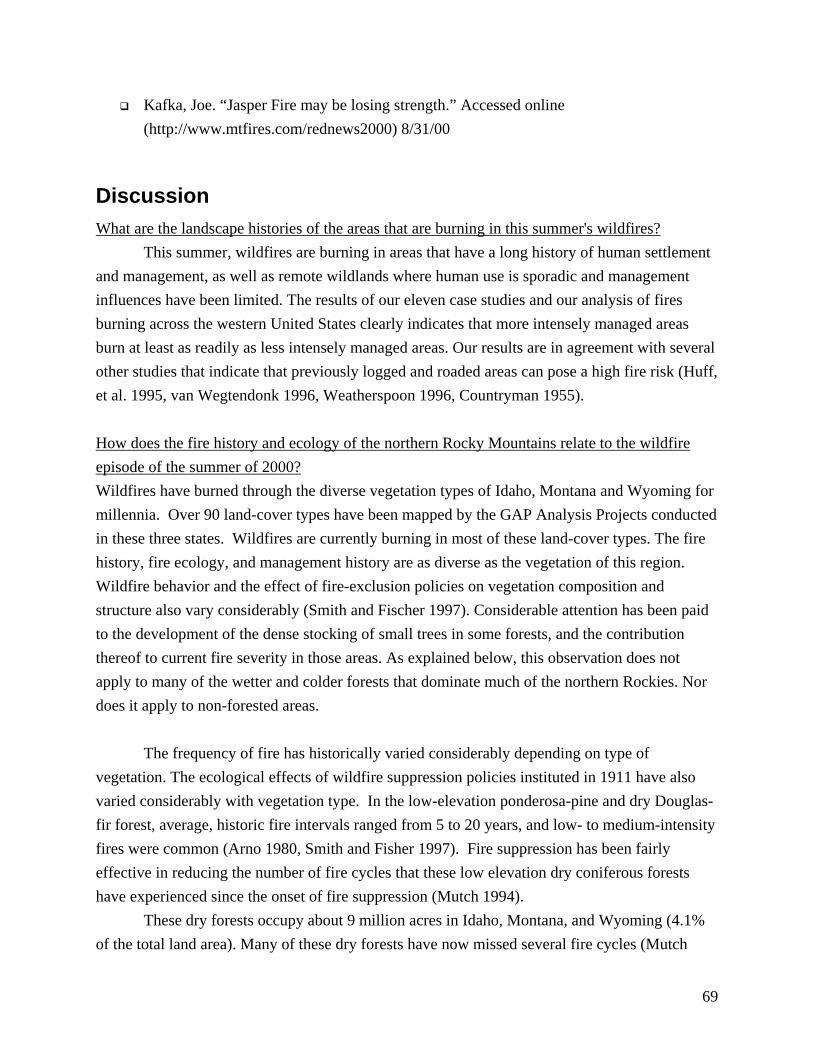
Kafka, Joe. “Jasper Fire may be losing strength.” Accessed online (http://www.mtfires.com/rednews2000) 8/31/00
Discussion What are the landscape histories of the areas that are burning in this summer's wildfires?
This summer, wildfires are burning in areas that have a long history of human settlement and management, as well as remote wildlands where human use is sporadic and management influences have been limited. The results of our eleven case studies and our analysis of fires burning across the western United States clearly indicates that more intensely managed areas burn at least as readily as less intensely managed areas. Our results are in agreement with several other studies that indicate that previously logged and roaded areas can pose a high fire risk (Huff, et al. 1995, van Wegtendonk 1996, Weatherspoon 1996, Countryman 1955). How does the fire history and ecology of the northern Rocky Mountains relate to the wildfire episode of the summer of 2000? Wildfires have burned through the diverse vegetation types of Idaho, Montana and Wyoming for millennia. Over 90 land-cover types have been mapped by the GAP Analysis Projects conducted in these three states. Wildfires are currently burning in most of these land-cover types. The fire history, fire ecology, and management history are as diverse as the vegetation of this region. Wildfire behavior and the effect of fire-exclusion policies on vegetation composition and structure also vary considerably (Smith and Fischer 1997). Considerable attention has been paid to the development of the dense stocking of small trees in some forests, and the contribution thereof to current fire severity in those areas. As explained below, this observation does not apply to many of the wetter and colder forests that dominate much of the northern Rockies. Nor does it apply to non-forested areas.
The frequency of fire has historically varied considerably depending on type of
vegetation. The ecological effects of wildfire suppression policies instituted in 1911 have also varied considerably with vegetation type. In the low-elevation ponderosa-pine and dry Douglas-fir forest, average, historic fire intervals ranged from 5 to 20 years, and low- to medium-intensity fires were common (Arno 1980, Smith and Fisher 1997). Fire suppression has been fairly effective in reducing the number of fire cycles that these low elevation dry coniferous forests have experienced since the onset of fire suppression (Mutch 1994).
These dry forests occupy about 9 million acres in Idaho, Montana, and Wyoming (4.1% of the total land area). Many of these dry forests have now missed several fire cycles (Mutch
69
1994). Due to their accessibility, the dry forests have also been extensively managed for timber production and livestock grazing. The ecological consequence of these management activities has been a fairly dramatic change in tree density and forest composition (Smith and Fischer 1997). These changes have often created stands of dense, small-diameter trees in areas that used to be dominated by widely spaced old-growth trees. In the dry forests, past management activities have clearly created a situation in which a greater concentration of fuel is present, and there is a higher probability of high-intensity fire, should a wildfire spread into the area. The change in forest composition and fuel loading in the dry forests has contributed to the severity of wildfires burning at lower elevations in the northern Rockies this summer.
In contrast to the dry forests, subalpine forests composed mainly of subalpine fir, lodgepole pine, Engelmann spruce and whitebark pine cover vast expanses of the northern Rockies landscape. Subalpine forests occupy about 22.7 million acres in Idaho, Montana and Wyoming (10.5% of the total land area). These forests are situated at higher elevations that are considerably wetter and colder than the dry forests discussed above. Many of the subalpine forest types burn infrequently though often at a much higher intensity than do the dry forests. A few subalpine forest types (e.g. whitebark pine) experience more frequent fire (Smith and Fisher 1997) but have a very limited in distribution (less than 18% of the subalpine forests in the northern Rockies). Many conifer species present in subalpine forests are killed by moderate-intensity fire (Bradley, et al. 1992). Lodgepole pine is a dominant species in the subalpine forests and often reproduces prolifically after its serotinous cones open following wildfire (Agee 1993). In the northern Rockies, historic fire-return intervals periods ranged from 50 to 300 years in these subalpine forests (Arno 1980, Smith and Fisher 1997, Agee 1990, Agee 1993). In many cases, historic fire-return intervals for the subalpine forests of this region are longer than the period of time in which the current fire-exclusion policies have been in effect. The subalpine forests, in general, have not missed fire cycles like the dry forests have. Fire exclusion due to wildfire-suppression activities has not yet measurably altered the structure and composition of the subalpine forests (Smith and Fisher 1997). Changes in forest composition and fuel loading have been substantially less than in dry forest types, and fires burning in subalpine forests this summer most likely have characteristics similar to fires that have burned in these areas for millennia.
In between the low-elevation dry forests and the subalpine forests is a mid-elevation zone of forests composed of Douglas-fir, grand fir, subalpine fir, lodgepole pine, red cedar, western hemlock, western larch and other species. These montane forests also occupy substantial parts of the northern Rockies. Montane forests occupy about 18.6 million acres in Idaho, Montana and Wyoming (8.6% of the total land area). The fire regimes and historic fire-return intervals for the montane forests of the northern Rockies vary considerably with location and forest type (Arno
70
1980, Bradley, et al. 1992, Smith and Fischer 1997). Historic mean fire-return intervals range from 25 to over 250 years in these stands (Arno 1980, Smith and Fisher 1997). The montane forests of this region have also been substantially affected by forest-management activities (primarily logging). The effects of fire exclusion and other past management have varied within the diverse montane forests of the northern Rockies. In some areas, the effects have been subtle and slow to develop, while in other areas fire exclusion has lead to the development of dense understory vegetation and changes in forest composition (Smith and Fisher 1997). Potential wildfire severity has been substantially altered in some montane forest stands and only subtly altered in other montane forest stands (Smith and Fisher 1997). Changes in forest composition and fuel loading in the montane forests have contributed to the severity of some wildfires burning at mid-elevations in the northern Rockies this summer. Do severe wildfires burn in areas that are not composed of dense forests resulting from fire exclusion and other land management activities?
In the western United States, many areas that are not forested or only sparsely forested can experience severe wildfires. Many of the wildfires that have burned this year have burned in non-forested areas or have involved substantial acreage of forests with sparse tree cover. In these areas, forest-thinning programs are inappropriate (because there are no trees) or would have little effect on fire behavior, because the tree density is already low. In this study, we examined eight recent major fires that clearly illustrate this point: the Kate’s Basin Fire, the Canyon Ferry Fire Complex, the Mule Dry Creek Fire, the Hanford Fire, the Eastside Fire Complex, the Jasper Fire, the Maudlow–Toston Fire, the Maloney Creek Fire. To a lesser degree, the other three major fires contain significant amounts of non-forested or sparsely forested terrain.
In the northern Rocky Mountains, there are many areas that regularly experience severe wildfires that are not in dense forested areas. For example, persistent seral shrubfields are widespread in the region. Smith and Fisher (1997) note, “large expanses of shrub-dominated slopes, where tree regeneration is sparse or lacking, characterize many areas in northern Idaho." Severe reburns are the main cause of these persistent shrubfields. Some shrubfields have a mean fire-return interval of about 31 years (Barrett 1982). Some of these shrubfields have persisted for 200 years or more (Barrett 1982). It is clear that persistent shrubfields are a product of wildfires burning in an environment where forest thinning would have little benefit. Could extensive thinning of forests have prevented the current fire situation?
Silvicultural thinning (i.e., logging of small-diameter trees to reduce tree densities and/or underbrush) has been posited as a possible treatment method for reducing wildfire risk. Thinning to reduce fuel load has received much media attention recently. It is controversial
71
among the scientific community and largely untested (Henjum, et al. 1994, DellaSala, et al. 1995, SNEP 1996). There have been few empirical studies looking at the effectiveness of thinning as a treatment for reducing wildfire hazard (Frost 1999). The studies that have been conducted have reported highly variable results. Some studies indicate that thinning treatments designed to reduce fire risk actually increase the risk and severity of the fires (Huff, et al. 1995, van Wegtendonk 1996, Weatherspoon 1996). Although these treatments may reduce the flammable biomass in the area, they also lead to drier forests and higher winds (Countryman 1955, Agee 1997). Additionally, silvicultural treatments, even when conducted carefully, can lead to the following adverse conditions (excerpted from Frost 1999):
• Damage to soil integrity through increased erosion, compaction, and loss of litter layer (Harvey, et al. 1994, Meurisse and Geist 1994).
• Increased mortality of residual trees due to pathogens and mechanical damage to boles and roots (Hagle and Schmitz 1993, Filip 1994)
• Creation of sediment that may eventually be delivered to streams (Beschta 1978, Grant and Wolff 1991)
• Increased levels of fine fuels and near-term fire hazard (Fahnestock 1968, Weatherspoon 1996, Wilson and Dell 1971, Huff, et al. 1995)
• Dependence on roads, which result in numerous adverse effects (Henjum, et al. 1994, Megahan, et al. 1994)
• Reduced habitat quality for sensitive species associated with cool, moist microsites or closed-canopy forests (FEMAT 1993, Thomas, et al. 1993).
Some fires are burning in US Forest Service Inventoried Roadless Areas or designated
Wilderness. Many forests in these areas have not been severely altered from their historic fire regimes (see discussion above on fire history and ecology). Many of these areas are difficult to access due to steep, rugged topography (e.g., Burgdorf Junction and Clear Creek Fires). Thus, the cost involved and the environmental disturbances of applying mechanical treatments over large roadless areas are not justified.
Thinning of small diameter trees in dense, young forests may be appropriate and result in reduction of wildfire risk to human communities in certain situations. The most appropriate place to apply forest thinning is in the dry forest types adjacent to human communities threatened by wildfires. In these areas, it may be appropriate to thin dense stands of young trees close to homes and community resources. Such thinning needs to be followed up by a program of regular prescribed burning to be effective. But widespread thinning of backcountry areas is likely to be extremely costly, cause extensive environmental damage and create little benefit to society. More
72
research is needed on the efficacy of thinning programs for wildfire risk reduction before there is conclusive evidence that they are effective. What kinds of large-scale management practices should be implemented to reduce wildfire risk? Where should these take place, if these should take place?
Large-scale management practices will be necessary to control the risk of wildfire in the interface between forested and rural landscapes. The effects of fire suppression and the potential for severe wildfire are greatest in such areas. While rural-forest interfaces occur in many different forest types, they are most common in dry and montane forests that have been most altered from their historic fire regimes by past management activities.
Many researchers and scientists agree that the best way to reduce wildfire risk in the rural-forest interface is through the reintroduction of fire to many natural ecosystems (Walstad, et al. 1990, Mutch 1994, USDA/USDI 1995, Arno 1996, Frost 1999). Prescribed fire appears to be the most effective means for controlling the rate of spread and severity of wildfire (van Wegtendonk 1996, Stephens 1998). Prescribed fire as a management tool has been increasingly used; however, more burning is necessary to restore many ecosystems to their historic fire regimes (Mutch 1994, UDSA/USDI 1995, Arno 1996, Wright and Bailey 1982). The success of prescribed fire lies in keeping the fire under control. In some instances, mechanical treatments (e.g., thinning) may be applied to reduce the fuel loads to a point at which prescribed can be used controllably (Mutch 1994).
Conclusions The most newsworthy aspect of this year's fires is the destruction of or proximity to
homes. For people living in the affected areas, it's a big fire year, despite the fact that the total burn acreage is still much lower than the yearly average for the last century. People have progressively moved into areas that are highly flammable. In the past, most of the big fires did not affect many homes. Today, the situation is compounded by the fact that many people now live in or near the zone that is dominated by dry forests. These dry forests have often been greatly altered by both fire exclusion and past logging. Both of these management influences have created a situation in which we have the worst fire danger right where it endangers people the most.
The solution to this problem is increased use of prescribed fire in many western landscapes. Care needs to be applied to assure that fires do remain within the prescription and that alien-plant invasions are not accelerated. An aggressive program of thinning of densely stocked, small-diameter trees, followed by regular prescribed burning in dry forests near inhabited areas holds the potential for reducing wildfire risk to our rural communities. Such
73
thinning programs need to be targeted at areas that will do people the most good, and not spread across the backcountry where little or no benefit to society will accrue.
Prescribed natural fire (i.e., letting naturally caused fires burn with minimal intervention) is beginning to be allowed in some wilderness areas (UDSA/USDI 1995) and allows an area to maintain its historic fire regime. This policy should be expanded to roadless areas so that those may maintain or regain historic fire regimes, as well. In this manner, money and effort may be invested in fighting fires that may occur in managed landscapes and near the rural-forest interface, while allowing the ecological integrity of the landscapes to be maintained. Thus, it may not be justifiable to spend $20.5 million for fighting the Burgdorf Junction Fire, a 60,000-acre fire that is 90% in roadless and wilderness areas (as of August 29, 2000), or $37.1 million for fighting the Clear Creek Fire, a 192,000-acre fire that is mostly in roadless and wilderness areas (as of August 29, 2000). These are the two largest expenditures for fighting individual fires, so far this year.
The perspective that has dominated the current wildfire discussion is that it is a disaster that so much area has burned. However, there is another perspective, which understands that wildfire is a critical process of a healthy, wild ecosystem. The wildfires that burned in most roadless and wilderness areas this year (and in past years) should certainly be viewed in this light. In several years, numerous studies will be done, documenting that many of the wildfires enhanced the environment (rather than harming it) and certainly did no harm to our society. The fact that many of our ecosystems will benefit from this year’s fire episode often is lost in all the heat and smoke of public and political discourse.
Our findings do not imply that we should neglect the protection of our communities and forego attempts to reduce wildfire risks in appropriate places (as outlined above). We need to accept that fire is part of our landscape (whether we like it or not) and develop a sensible approach that focuses wildfire risk reduction measures and fire-fighting efforts on a limited portion of the landscape near human settlements. A large burden of responsibility falls on the homeowner to design and maintain their property in a fashion that will withstand wildfire. Our study also points to the fact that many wildfires do not involve forests. Prescribed burning and proper home design and maintenance are the only solutions to protecting homes from fire damage in situations where homes are surrounded by flammable grass and shrublands.
References Agee, J.K. 1990. The historical role of fire in Pacific Northwest forests. Pp 25-38 In Walstad, J.
et al. (eds.). Natural and prescribed fire in Pacific Northwest forests. Oregon State University Press. Corvallis, OR.
74
Agee, J.K. 1993. Fire ecology of Pacific Northwest forests. Island Press, Washington, D.C. Agee, J.K. 1997. Severe fire weather: Too hot to handle? Northwest Science 71: 153-156. Arno, S.F. 1980. Forest fire history of the northern Rockies. Journal of Forestry 39:726-728. Arno, S.F. 1996. The seminal importance of fire in ecosystem management -- impetus for this
publication. in The Use of Fire in Forest Restoration. USDA Forest Service General Technical Report INT-GTR-341. Intermountain Research Station, Ogden, UT.
Baker, W.L. 1989. Effect of scale and spatial heterogeneity on fire-interval distributions.
Canadian Journal of Forest Research 19:700-706. Barrett, S.W. 1982. Fire’s influence on ecosystems of the Clearwater National Forest: Cook
mountain fire history inventory. USDA Forest Service, Clearwater National Forest, Orifino, ID.
Beschta, R.L. 1978. Long-term patterns of sediment production following road construction and logging in the Oregon Coast Range. Water Resources Research 14: 1011-1016. Bradley, A.F., W.C. Fischer, and N.V. Noste. 1992. Forest ecology of the forest habitat types of
eastern Idaho and western Wyoming. USDA Forest Service Gen. Tech. Rep. INT-290. Countryman, C.M. 1955. Old-growth conversion also converts fire climate. U.S. Forest Service
Fire Control Notes 17(4): 15-19. DellaSala, D.A., D.M. Olson and S.L. Crane. 1995. Ecosystem management and biodiversity
conservation: Applications to inland Pacific Northwest forests. Pp. 139-160 in: R.L. Everett and D.M. Baumgartner, eds. Symposium Proceedings: Ecosystem Management in Western Interior Forests. May 3-5, 1994, Spokane, WA. Washington State University Cooperative Extension, Pullman, WA.
75
Fahnestock, G.R. 1968. Fire hazard from pre-commercially thinning ponderosa pine. USDA Forest Service, Pacific Northwest Region Station, Research Paper 57. Portland, OR. 16 pp.
Filip, G.M. 1994. Forest health decline in central Oregon: A 13-year case study. Northwest
Science 68(4): 233-240. Forest Ecosystem Management Assessment Team (FEMAT). 1993. Forest Ecosystem
Management: An ecological, economic, and social assessment. Report of the Forest Ecosystem Management Assessment Team. July 1993. Portland, OR.
Frost, E. 1999. The scientific basis for managing fire and fuels in national-forest roadless areas.
World Wildlife Fund. CFR 64 No 201. Grant, G.E., and A.L. Wolff. 1991. Long-term patterns of sediment transport after timber
harvest, western Cascade Mountains, Oregon, USA. Pages 31-40 in Sediment and stream water quality in a changing environment: Trends and explanations. IAHS Publication 203. Proceedings of the Symposium, 11-24 August 1991, Vienna, Austria.
Hagle, S., and R. Schmitz. 1993. Managing root disease and bark beetles. Pages 209-228 in T.D.
Schowalter and G.M. Filip eds. Beetle-Pathogen Interactions in Conifer Forests. Academic Press, New York.
Hann W.J. 1997. Landscape dynamics of the Basin. Pp. 337-1,055 in Quigley, T.M., and S.J.
Arbelbide (eds.). An assessment of ecosystem components in the Interior Columbia Basin and portions of the Klamath and Great Basins: Volume II. USDA Forest Service Pacific Northwest Research Station General Technical Report PNW-GTR-405. Portland, OR.
Harvey, A.E., J.M. Geist, G.I. McDonald, M.F. Jurgensen, P.H. Cochran, D. Zabowski, and R.T.
Meurisse. 1994. Biotic and abiotic processes in Eastside ecosystems: the effects of management on soil properties, processes, and productivity. General Technical Report PNW-GTR-323, U.S. Forest Service, Pacific Northwest Research Station
76
Henjum, M.G., J.R. Karr, D.L. Bottom, D.A. Perry, J.C. Bednarz, S.G. Wright, S.A. Beckwitt, and E. Beckwitt. 1994. Interim protection for late-successional forests, fisheries, and watersheds: National forests east of the Cascades crest, Oregon and Washington. The Wildlife Society Technical Review 94-2, Bethesda, MD. 245 pp.
Huff, M.H., R.D. Ottmar, E. Alvarado, R.E. Vihnanek, J.F. Lehmkuhl, P.F. Hessburg, and R.L.
Everett. 1995. Historical and current landscapes in eastern Oregon and Washington. Part II: Linking vegetation characteristics to potential fire behavior and related smoke production. USDA Forest Service Pacific Northwest Forest and Range Experiment Station, PNW-GTR- 355. Portland, Oregon.
Idaho Department of Fish and Game. 1995. Craig Mountain Wildlife Mitigation Area
Management Plan. Biose, ID. McKelvey, K.S. 1996. An overview of fire in the Sierra Nevada. In Status of the Sierra Nevada:
Sierra Nevada Ecosystem Project Final Report to Congress: Volume II. Wildland Resources Center Report No. 37. University of California, Davis.
Megahan, W.F, L.L. Irwin, and L.L. LaCabe. 1994. Forest roads and forest health. Pages 97-99
in R.L. Everett, ed. Volume IV: Restoration of stressed sites, and processes. General Technical Report PNW-GTR-330, U.S. Forest Service, Pacific Northwest Research Station.
Meurisse, R.T. and J.M. Geist. 1994. Conserving soil resources. Pages 50-58 in R.L. Everett,
ed. Volume IV: Restoration of stressed sites, and processes. General Technical Report PNW-GTR-330, U.S. Forest Service, Pacific Northwest Research Station
Miller. S. 2000. Forest Service downplays fuel buildup in Jasper Fire. Rapid City Journal. Morrison, P.H. 1972. River of No Return Wilderness. Sierra Club, San Francisco, CA. Mutch, R.W. 1994. Fighting fire with prescribed fire – a return to ecosystem health. Journal of
Forestry 92(11): 31-33
77
Scott, J.M., Karl, J.W., Bomar, L.K., Wright, N.M., Strand, E., and P.D. Tanimoto. 2000. A gap analysis of Idaho. Idaho Cooperative Fish and Wildlife Research Unit, University of Idaho. Moscow, ID.
Smith and Fisher. 1997. Fire Ecology of the Forest Habitat Types of Northern Idaho. USDA
Forest Service General Technical Report INT-GTR-363, 142 p. Sierra Nevada Ecosystem Project (SNEP). 1996. Status of the Sierra Nevada: Sierra Nevada
Ecosystem Project, Final Report to Congress Volume I, Assessment summaries and management strategies. Wildland Resources Center Report No. 37. Center for Water and Wildland Resources. University of California, Davis, CA.
Stephens, S.L. 1998. Evaluation of the effects of silvicultural and fuels treatments on potential
fire behaviour in Sierra Nevada mixed-conifer forests. Forest Ecology and Management 105: 21-38.
Thomas, J.W. et al. 1993. Viability assessments and management considerations for species
associated with late-successional and old-growth forests of the Pacific Northwest. USDA Forest Service, Pacific Northwest Region. Portland, OR.
U.S. Deparment of Agriculture and U.S. Department of Interior (USDA/USDI). 1995. Federal
wildland fire management policy and program review: Final report. U.S. Department of Agriculture and U.S. Department of Interior, Washington, D.C.
US Forest Service. 1987. Forest Plan: Bitterroot National Forest. USDA Forest Service,
Northern Region. Hamilton, MT. US Forest Service. 1995. Initial review of silvicultural treatments and fire effects on Tyee fire.
USDA Forest Service, Wenatchee National Forest, Wenatchee, WA. U.S. Forest Service. 1996. National Forest Fire Report 1994. USDA Forest Service.
Washington, D.C. U.S. Forest Service. 1998. 1991-1997 Wildland fire statistics. Fire and Aviation Management.
USDA Forest Service. Washington, D.C.
78
79
US Forest Service. 2000. Forest Service Roadless Area Conservation Draft Environmental Impact Statement. USDA Forest Service, Washington D.C.
Van Wagner, C.E. 1983. Fire behavior in northern conifer forests and shrublands. Pp. 65-80 in
R.W. Wein and D.A. MacLean, eds. The role of fire in northern circumboreal ecosystems. John Wiley and Sons, Inc. New York, NY.
van Wagtendonk, J.W. 1996. Use of a deterministic fire growth model to test fuel treatments. in
Status of the Sierra Nevada: Sierra Nevada Ecosystem Project Final Report to Congress Volume II. Wildland Resources Center Report No. 37. Center for Water and Wildland Resources. University of California, Davis.
Walstad, J.D., S.R. Radosevich and D.V. Sandberg, eds. 1990. Natural and prescribed fire in
Pacific Northwest forests. Oregon State University Press, Corvallis, OR Weatherspoon, C.P. 1996. Fire-silviculture relationships in Sierra forests. In Status of the Sierra
Nevada: Sierra Nevada Ecosystem Project Final Report to Congress Volume II. Wildland Resources Center Report No. 37. Center for Water and Wildland Resources. University of California, Davis.
Weatherspoon, C.P. and C.N. Skinner. 1996. Landscape-level strategies for forest fuel
management. Pp. 1471-1492 in Status of the Sierra Nevada: Sierra Nevada Ecosystem Project Final Report to Congress Volume II. Wildland Resources Center Report No. 37. Center for Water and Wildland Resources. University of California, Davis.
Wilson, C.C. and J.D. Dell. 1971. The fuels buildup in American forests: A plan of action and
research. Journal of Forestry. August. Wright, H.A. and A.W. Bailey. 1982. Fire ecology: United States and southern Canada. John
Wiley, New York, NY.