assessment of particle number limits for petrol...
TRANSCRIPT

1
Report EUR 25592 EN
2 0 1 2
Athanasios Mamakos Christos Dardiotis Giorgio Martini
Assessment of particle number limits for petrol vehicles

2
European Commission Joint Research Centre Institute for Energy and Transport Contact information Giorgio Martini Address: Joint Research Centre, Via Enrico Fermi 2749, TP 441, 21027 Ispra (VA), Italy E-mail: [email protected] Tel.: +39 0332 78 9293 Fax: +39 0332 78 5236 http://iet.jrc.ec.europa.eu/ http://www.jrc.ec.europa.eu/ This publication is a Reference Report by the Joint Research Centre of the European Commission. Legal Notice Neither the European Commission nor any person acting on behalf of the Commission is responsible for the use which might be made of this publication. Europe Direct is a service to help you find answers to your questions about the European Union Freephone number (*): 00 800 6 7 8 9 10 11 (*) Certain mobile telephone operators do not allow access to 00 800 numbers or these calls may be billed.
A great deal of additional information on the European Union is available on the Internet. It can be accessed through the Europa server http://europa.eu/. JRC76849 EUR 25592 EN ISBN 978-92-79-27354-4 (pdf) ISBN 978-92-79-27355-1 (print) ISSN 1831-9424 (online) ISSN 1018-5593 (print) doi:10.2788/66109 Luxembourg: Publications Office of the European Union, 2012 © European Union, 2012 Reproduction is authorised provided the source is acknowledged. Printed in Italy


4
1 INTRODUCTION ................................................................................................................... 7
2 SCOPE AND OBJECTIVES OF THIS STUDY .................................................................... 7
3 LITERATURE REVIEW ........................................................................................................ 7
3.1 BACKGROUND .............................................................................................................. 7
3.2 PARTICULATE EMISSIONS OF SPARK IGNITED GASOLINE VEHICLES .......... 9
3.2.1 VEHICLE CLASSIFICATION .................................................................................. 9
3.2.2 PM EMISSIONS ......................................................................................................... 9
3.2.3 SOLID PARTICLE NUMBER EMISSIONS .......................................................... 10
3.2.4 PARTICLE SIZE ...................................................................................................... 11
3.2.5 TRANSIENT NATURE OF PARTICLE EMISSIONS ........................................... 13
3.2.6 SUB-AMBIENT TEST CONDITIONS ................................................................... 13
3.2.7 FUEL EFFECT ......................................................................................................... 13
3.2.8 AFTER-TREATMENT EFFECT ............................................................................. 14
3.2.9 CHEMICAL COMPOSITION ................................................................................. 14
4 EXPERIMENTAL METHODS ............................................................................................ 15
4.1 VEHICLE MATRIX ...................................................................................................... 15
4.2 TEST FUELS ................................................................................................................. 16
4.3 DRIVING CYCLES AND PROCEDURE .................................................................... 16
4.4 SAMPLING SYSTEMS AND CONDITIONS ............................................................. 19
4.4.1 PM SAMPLING ....................................................................................................... 20
4.4.2 PARTICLE NUMBER SAMPLING ........................................................................ 21
4.5 GASEOUS POLLUTANTS ........................................................................................... 21
5 RESULTS .............................................................................................................................. 22
5.1 BASELINE EMISSIONS .............................................................................................. 22
5.2 EFFECT OF TEST CYCLE ........................................................................................... 25
5.3 SUB-AMBIENT TEMPERATURE TESTS .................................................................. 28
6 CONCLUSIONS ................................................................................................................... 33
6.1 PORT FUEL INJECTION VEHICLES ......................................................................... 33
6.2 DIRECT INJECTION GASOLINE VEHICLES ........................................................... 34
7 DISCUSSION/OUTLOOK ................................................................................................... 34
8 LIST OF SPECIAL TERMS AND ABBREVIATIONS ...................................................... 37

5
AKNOWLEDGMENTS ............................................................................................................... 38
REFERENCES ............................................................................................................................. 39
ANNEX A: PM/PN ANALYTICAL DATA ................................................................................ 43


7
1 INTRODUCTION In December 2009 Directorate General (DG) Enterprise (ENTR) and the Joint Research Centre (JRC) signed an Administrative Arrangement to fix the terms of a project titled “Scientific/technical support to the preparation and implementation of light-duty vehicle emission legislation”.
The Commission Regulation (EC) No 692/2008 of 18 July 2008 [1] together with the Regulation (EC) No 715/2007 of the European Parliament and of the Council of 20 June 2007 [2] set the regulatory framework for type-approval of motor vehicles with respect to emissions from light passenger and commercial vehicles (Euro 5 and Euro 6). In particular these regulations set the emission standards and the related implementing measures, divided into three different steps, that will enter into force between 2009 (Euro 5) and 2014 (Euro 6). However, the above mentioned Regulations leave open some issues regarding the Euro 5b and the Euro 6 emissions standards to be addressed and defined before the entry into force of these pieces of legislation [3].
The services requested by the DG ENTR to JRC were detailed in a series of 12 tasks and a list of deliverables, among which this report.
2 SCOPE AND OBJECTIVES OF THIS STUDY Upon request of the DG-ENTR, the JRC has carried out a study to support a possible implementation of particle number emission limit for gasoline Euro 6 vehicles. The main objectives of this study were:
• Review the particle mass and number emissions of gasoline Port Fuel Injection (PFI) and Gasoline Direct Injection (G-DI) vehicles available in the literature.
• Measure particle mass and number emissions from a range of Euro 4 and Euro 5a gasoline vehicle/engine technologies, testing various vehicles at the JRC Vehicle Emissions Laboratory (VELA).
3 LITERATURE REVIEW
3.1 BACKGROUND Legislation limiting the pollutant emissions of new registered vehicles is well established in many regions of the world. One pollutant of special concern is Particulate Matter (PM), which is a complex physicochemical mixture of solid and volatile particles ranging in size from a few nanometers to up to around one micrometer in diameter. Historically, the PM emissions of automotive engines were regulated in terms of mass. Gasoline vehicles were not subjected to regulations due to their relatively low PM mass levels compared to their diesel counterparts.
However, the improvements in diesel technology brought by the progressively tighter emissions standards, and especially the introduction of high efficiency Diesel Particulate Filters (DPFs), resulted in a drastic reduction of diesel PM, raising concerns about the sensitivity of the gravimetric procedure [4]. Furthermore, there is a growing consensus amongst the health
8
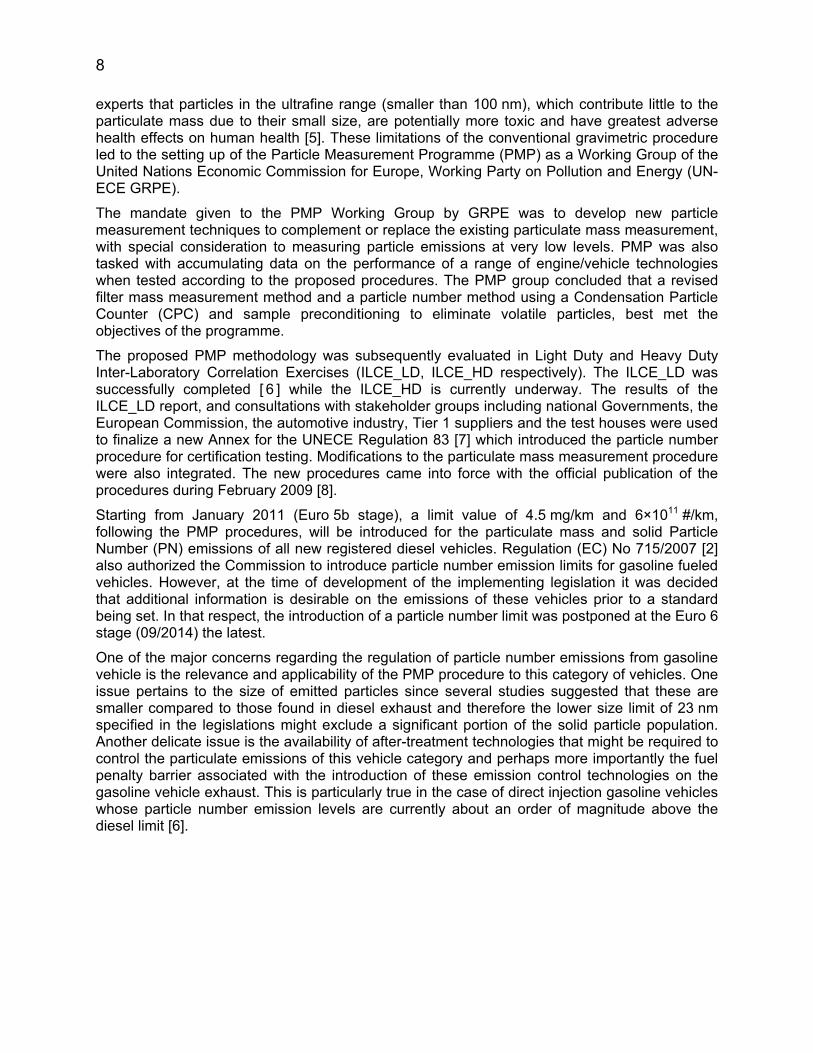
experts that particles in the ultrafine range (smaller than 100 nm), which contribute little to the particulate mass due to their small size, are potentially more toxic and have greatest adverse health effects on human health [5]. These limitations of the conventional gravimetric procedure led to the setting up of the Particle Measurement Programme (PMP) as a Working Group of the United Nations Economic Commission for Europe, Working Party on Pollution and Energy (UN-ECE GRPE).
The mandate given to the PMP Working Group by GRPE was to develop new particle measurement techniques to complement or replace the existing particulate mass measurement, with special consideration to measuring particle emissions at very low levels. PMP was also tasked with accumulating data on the performance of a range of engine/vehicle technologies when tested according to the proposed procedures. The PMP group concluded that a revised filter mass measurement method and a particle number method using a Condensation Particle Counter (CPC) and sample preconditioning to eliminate volatile particles, best met the objectives of the programme.
The proposed PMP methodology was subsequently evaluated in Light Duty and Heavy Duty Inter-Laboratory Correlation Exercises (ILCE_LD, ILCE_HD respectively). The ILCE_LD was successfully completed [ 6 ] while the ILCE_HD is currently underway. The results of the ILCE_LD report, and consultations with stakeholder groups including national Governments, the European Commission, the automotive industry, Tier 1 suppliers and the test houses were used to finalize a new Annex for the UNECE Regulation 83 [7] which introduced the particle number procedure for certification testing. Modifications to the particulate mass measurement procedure were also integrated. The new procedures came into force with the official publication of the procedures during February 2009 [8].
Starting from January 2011 (Euro 5b stage), a limit value of 4.5 mg/km and 6×10¹¹ #/km, following the PMP procedures, will be introduced for the particulate mass and solid Particle Number (PN) emissions of all new registered diesel vehicles. Regulation (EC) No 715/2007 [2] also authorized the Commission to introduce particle number emission limits for gasoline fueled vehicles. However, at the time of development of the implementing legislation it was decided that additional information is desirable on the emissions of these vehicles prior to a standard being set. In that respect, the introduction of a particle number limit was postponed at the Euro 6 stage (09/2014) the latest.
One of the major concerns regarding the regulation of particle number emissions from gasoline vehicle is the relevance and applicability of the PMP procedure to this category of vehicles. One issue pertains to the size of emitted particles since several studies suggested that these are smaller compared to those found in diesel exhaust and therefore the lower size limit of 23 nm specified in the legislations might exclude a significant portion of the solid particle population. Another delicate issue is the availability of after-treatment technologies that might be required to control the particulate emissions of this vehicle category and perhaps more importantly the fuel penalty barrier associated with the introduction of these emission control technologies on the gasoline vehicle exhaust. This is particularly true in the case of direct injection gasoline vehicles whose particle number emission levels are currently about an order of magnitude above the diesel limit [6].

9
3.2 PARTICULATE EMISSIONS OF SPARK IGNITED GASOLINE VEHICLES
3.2.1 VEHICLE CLASSIFICATION When it comes to particulate emission performance, the gasoline vehicles basically fall into two main categories: a) vehicles utilizing Port Fuel Injection (PFI) where the fuel is sprayed into the intake manifold and b) those directly injecting the fuel into the combustion chamber (G-DI). The direct injection technology emerged from the need to improve the thermodynamic efficiency (and thus reduce fuel consumption) and power output of spark ignited engines. The fuel economy advantage originates from a) the higher allowable compression ratios and improved volumetric efficiencies due to the additional charge cooling effect offered by directly injecting the fuel into the cylinder and b) the possibility to operate on lean combustion mixtures (stratified mode) which allows for unthottled operation (and thus reduced pumping losses) under low speed and load conditions [9]. The G-DI engines can operate under both lean or stoichiometric mode, even though there is no distinct dividing line between them since the principal difference lies in the fuel injection timing [10]. When the fuel is injected late in the compression stroke, a stratified charge develops that allows operation with overally lean mixtures. Early injection leads to a more homogeneously mixed charge resembling that of a conventional PFI engines.
There are two main variants of the G-DI technology available in the market. One operates always in stoichiometric mode (Stoichiometric G-DI), an approach that allows the use of a conventional three way catalyst for emission control, and a mixed mode G-DI (Lean G-DI) that under low load conditions operates on a stratified charge. One shortcoming of the lean G-DI engines is that due to the excess of oxygen in the exhaust, it is not possible to reduce Nitrogen Oxide (NOx) emissions in conventional three way catalytic converters. Vehicles equipped with lean G-DI engines utilize a Lean NOx Trap (LNT) to store the NOx emissions when the exhaust is oxygen rich and then converting the stored NOx to Nitrogen (N2) during intermitted short periods of controlled over-fueling [11].
3.2.2 PM EMISSIONS Figure 1 summarizes reported PM emissions from a range of spark-ignited gasoline vehicles tested under the legislated New European Driving Cycle (NEDC). Note that the vertical axis is in logarithmic scale. The PM emissions from all PFI vehicles lie well below the Euro 5 limit of 4.5 mg/km. The highest emitting vehicle was a relatively old Euro 1 car which has been operated in excess of 100000 km [14]. Still its emission levels were ~2 mg/km, i.e. more than two times below the Euro 5 limit. This suggests that the conventional PFI gasoline vehicles will not have difficulties complying with the forecoming regulations.
One the other hand, the G-DI vehicles exhibit systematically higher PM emissions. Seven out of the 13 vehicles, had PM emissions above 4.5 mg/km, with one of them reaching 14.6 mg/km. Interestingly, the PM emissions of all Euro 4 and Euro 5 vehicles, were below the Euro 5 limit, suggesting an improvement in the emission behaviour of latest technology G-DI vehicles.

10
Figure 1: Reported PM emissions of gasoline powered vehicles of different fuel injection strategies and emission standards over the NEDC. a: Andersson et al. 2001 [ 12 ], b: Mohr et al. 2003 [ 13 ], c: Ntziachristos et al. 2004 [14], d: Andersson et al. 2007 [6], e: Mohr et al. 2006 [15], f: Mikulic et al. 2010 [16].
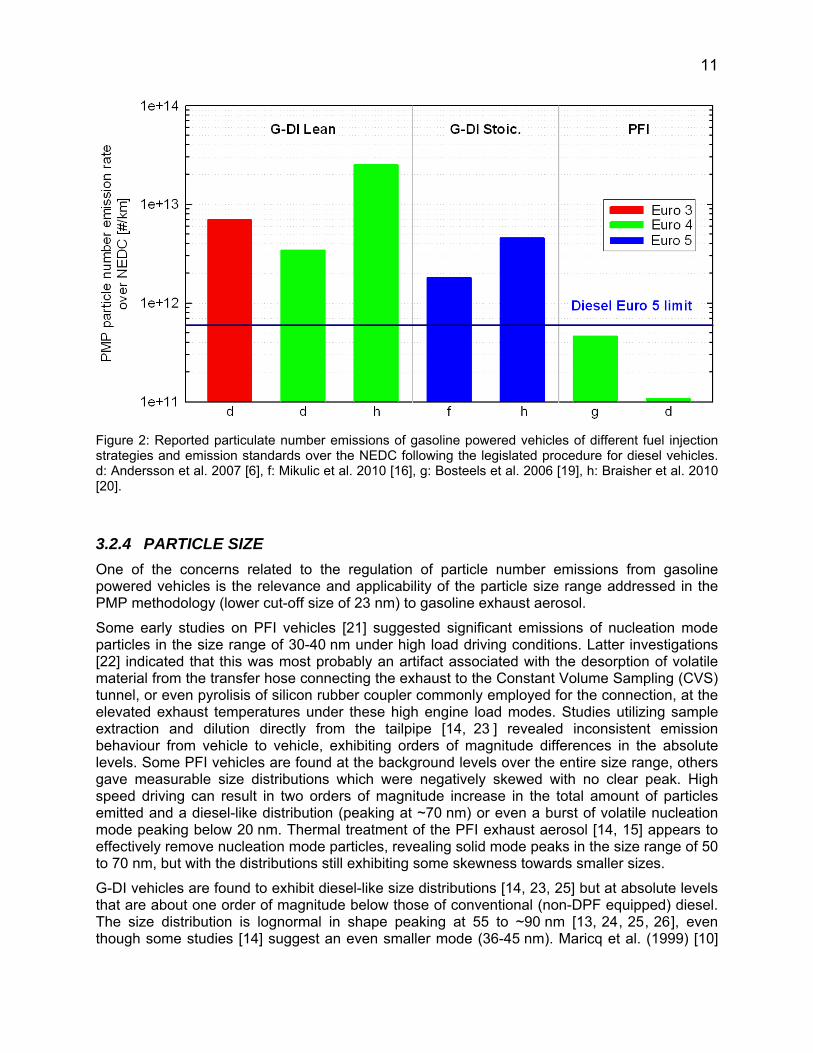
3.2.3 SOLID PARTICLE NUMBER EMISSIONS The different emission performance of the two vehicle categories is more evident when looking at the particle number emissions (Figure 2). Due to the well known sensitivity of the particle number emissions on the sampling methodology [17, 18], only the results obtained following the legislated procedure are shown, and this reduces significantly the dataset. Nevertheless, it is clear that G-DI vehicles emit at least an order of magnitude higher number of solid particles than conventional PFI vehicles do. Both PFI vehicles are found to lie below the Euro 5 diesel limit by some margin. The highest emitting PFI is found at 4.6×10¹¹ #/km and the lowest at 1.1×10¹¹ #/km.
Particle number emissions of all G-DI vehicles are well above the diesel Euro 5 threshold. Vehicles equipped with stratified charge engines are found to be in the 3.4×10¹² #/km to 2.5×10¹³ #/km range. The two latest technology vehicles operating on homogeneous charge emitted on average 1.8×10¹² #/km and 4.6×10¹² #/km, respectively. The tightening of the emission standards did not seem to have brought any clear benefit with respect to the particle number emissions of G-DI vehicles. In fact, the highest emitting stoichiometric G-DI vehicle was a state of the art Euro 5 prototype utilizing spray guided injection (Braisher et al. 2010 [20]).
11
Figure 2: Reported particulate number emissions of gasoline powered vehicles of different fuel injection strategies and emission standards over the NEDC following the legislated procedure for diesel vehicles. d: Andersson et al. 2007 [6], f: Mikulic et al. 2010 [16], g: Bosteels et al. 2006 [19], h: Braisher et al. 2010 [20].
3.2.4 PARTICLE SIZE One of the concerns related to the regulation of particle number emissions from gasoline powered vehicles is the relevance and applicability of the particle size range addressed in the PMP methodology (lower cut-off size of 23 nm) to gasoline exhaust aerosol.
Some early studies on PFI vehicles [21] suggested significant emissions of nucleation mode particles in the size range of 30-40 nm under high load driving conditions. Latter investigations [22] indicated that this was most probably an artifact associated with the desorption of volatile material from the transfer hose connecting the exhaust to the Constant Volume Sampling (CVS) tunnel, or even pyrolisis of silicon rubber coupler commonly employed for the connection, at the elevated exhaust temperatures under these high engine load modes. Studies utilizing sample extraction and dilution directly from the tailpipe [14, 23 ] revealed inconsistent emission behaviour from vehicle to vehicle, exhibiting orders of magnitude differences in the absolute levels. Some PFI vehicles are found at the background levels over the entire size range, others gave measurable size distributions which were negatively skewed with no clear peak. High speed driving can result in two orders of magnitude increase in the total amount of particles emitted and a diesel-like distribution (peaking at ~70 nm) or even a burst of volatile nucleation mode peaking below 20 nm. Thermal treatment of the PFI exhaust aerosol [14, 15] appears to effectively remove nucleation mode particles, revealing solid mode peaks in the size range of 50 to 70 nm, but with the distributions still exhibiting some skewness towards smaller sizes.
G-DI vehicles are found to exhibit diesel-like size distributions [14, 23, 25] but at absolute levels that are about one order of magnitude below those of conventional (non-DPF equipped) diesel. The size distribution is lognormal in shape peaking at 55 to ~90 nm [13, 24, 25, 26], even though some studies [14] suggest an even smaller mode (36-45 nm). Maricq et al. (1999) [10]

12
investigated the effect of engine operating conditions on the particle size distributions of a G-DI engine exhaust. They found a 10-fold to 40-fold increase in the particle number emissions when moving from homogeneous to stratified charge operation, by means of retarding fuel injection timing. This increase in particle numbers was also accompanied by an increase of the distribution mode from ~40 nm to more than 100 nm. Advancing spark timing could also result in a two-fold increase of particle numbers and up to 20 nm shift in the distribution peak. Engine load and speed had also an effect, though less pronounced, on both the total number and peak size.
For the purpose of particle number regulations, what is of importance is the contribution of particles smaller than 23 nm, a size range that is not considered in the PMP methodology. Some investigators have examined the number emissions of solid particles below 23 nm. Figure 3 summarizes reported results for solid particles larger than 7 nm over NEDC. Emission levels for G-DI vehicles are found to be in the same range with those reported following the PMP methodology (Figure 2). G-DI vehicles running on homogeneous mixtures emit between 1.2×10¹² #/km and 8.1×10¹² #/km while Lean G-DI between 2.6×10¹² #/km and 1.0×10¹³ #/km. It is difficult though to directly compare the results of these studies with those presented in Figure 2 given the large vehicle to vehicle variations. A recent study [27] employed a real time mobility spectrometer to investigate the contribution of solid particles smaller than 23 nm in the exhaust aerosol of a 2009 model stoichiometric G-DI vehicle when tested over the Federal Test Procedure (FTP) and US06 test cycles. The study concluded that 15 to 20% of the total emitted solid particles are smaller than 23 nm. This is smaller than what has been reported for Heavy Duty diesel engines equipped with DPF (15-85% [28], ~90% [29]).
Figure 3: Reported number emission rates of solid particles larger than 7 nm over NEDC for gasoline vehicles of different fuel injection systems and emission standards. b: Mohr et al. 2003 [13], e: Mohr et al. 2006 [15], i: Schreiber et al (2007) [30], figures correspond to the average value of 3 stoichiometric G-DI and 16 PFI gasolines, e*: figure corresponds to the average of 3 tests of a lean G-DI which operated in stoichiometric mode over the particular repetitions.

13
It is worth noting though that the average emission level of 17 recent technology PFI vehicles was found to be above 6×10¹¹ #/km. This is in line with the general observation that the distribution of PFI vehicles is shifted and skewed towards smaller sizes. Of course it needs to be emphasized that the 6×10¹¹ #/km limit is not directly transferable to this size range as it was derived for the control of particles larger than 23 nm.
3.2.5 TRANSIENT NATURE OF PARTICLE EMISSIONS Real time traces of particle emissions over test cycles reveal distinctly different patterns for G-DI and PFI gasoline vehicles. Particles in PFI vehicles are mainly produced during rich excursions of the air fuel ratio that occur during cold start and hard accelerations [15, 26, 31, 32], and drop to background levels over decelerations and steady speed cruising. In some cases [14] high speed driving can also result in an order of magnitude increase of the emitted number of particles. Dedicated investigations under steady state operation revealed an exponential dependence of particle number concentrations on the equivalence ratio [31, 33], but also on the engine load [34], at a much lesser extent though. Therefore, the large vehicle to vehicle variations observed in the particulate emissions of PFI vehicles might actually reflect different implementations of the engine control for improved drivability and cold start operation.
G-DI vehicles are found to exhibit diesel like behaviour [35], emitting high concentrations of particles over the whole test cycle. In the case of lean G-DI vehicles a significant increase in particle emission levels is observed whenever the engine switches to stratified mode [15,35]. 240 s operation in lean mode can lead to a threefold increase of the particle number emissions over the NEDC [15].
3.2.6 SUB-AMBIENT TEST CONDITIONS Some studies have also investigated the cold start emissions at low ambient temperatures [36, 37, 38, 39]. Particle emissions were found to increase with decreasing ambient temperature due to the prolonged warming up period. Once the engine warms up, particle emissions become relatively unaffected by ambient conditions. On absolute terms, sub-ambient temperature operation (as low as -20 °C) can result in a tenfold increase of PM [36] and solid particle number emissions [36, 37] from PFI vehicles. The particle emissions of G-DI vehicles are also found to increase at sub-ambient temperatures but to a somehow lesser extent (by 50% to 200% in terms of number [36, 37] and 500% in terms of mass [36]). A noteworthy observation is that cold start operation results in disproportionally higher production of solid particles [37] and elemental carbon [39] in the case of PFI vehicles. This is an issue that might need to be addressed in the regulation of the low temperature emissions of gasoline vehicles.
3.2.7 FUEL EFFECT Early studies investigating the influence of fuel properties on the particulate emissions of gasoline vehicles [21, 12, 40, 14] did not identify consistent fuel effects. The fuels employed in these studies were mainly designed around the fuel sulphur content, in an attempt to better understand sulphate emissions and their contribution to the emitted mass and number of particles. A recent study [27] examined the effect of fuel properties on the particulate emissions of a 2009 model stoichiometric G-DI vehicle. Use of an E10 gasoline – ethanol blend resulted in a 3-fold increase of PM and 1-fold increase of solid particle number emissions. Use of a
14
summer gasoline fuel, resulted in a decrease of particle emissions by up to 50% in terms of both mass and number. This is a very important finding requiring further investigation considering the mandate given for the introduction of ethanol-gasoline blends in the European market [41].
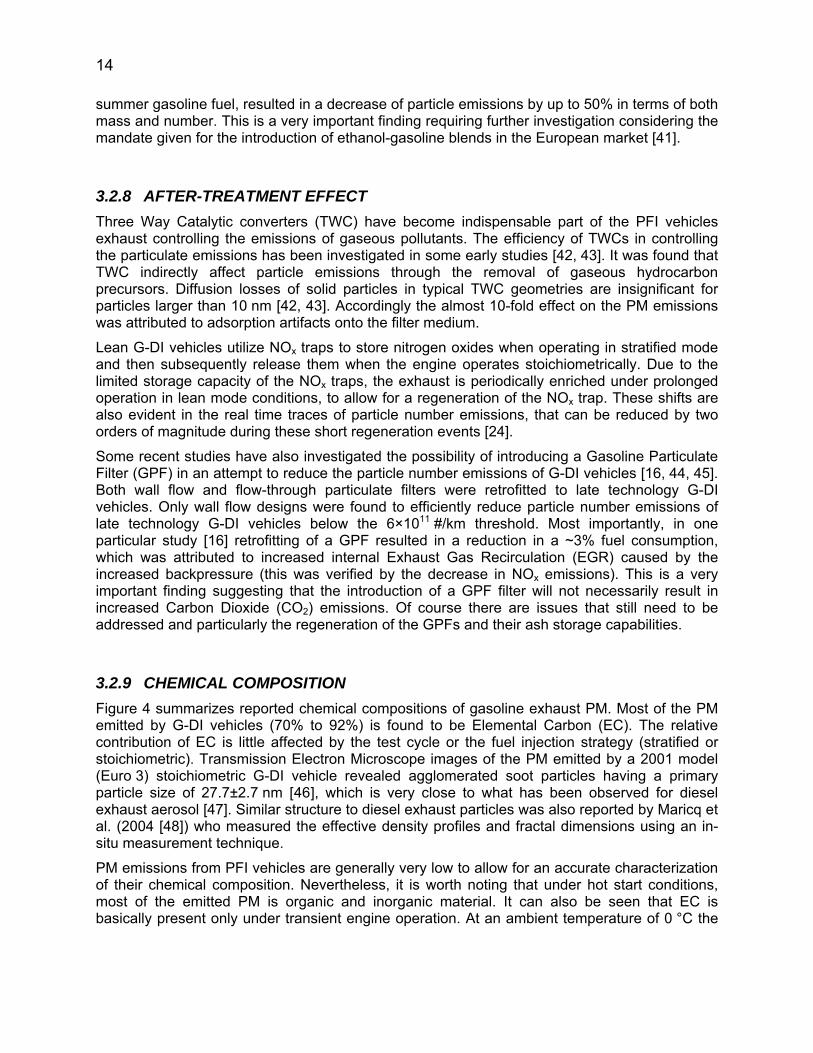
3.2.8 AFTER-TREATMENT EFFECT Three Way Catalytic converters (TWC) have become indispensable part of the PFI vehicles exhaust controlling the emissions of gaseous pollutants. The efficiency of TWCs in controlling the particulate emissions has been investigated in some early studies [42, 43]. It was found that TWC indirectly affect particle emissions through the removal of gaseous hydrocarbon precursors. Diffusion losses of solid particles in typical TWC geometries are insignificant for particles larger than 10 nm [42, 43]. Accordingly the almost 10-fold effect on the PM emissions was attributed to adsorption artifacts onto the filter medium.
Lean G-DI vehicles utilize NOx traps to store nitrogen oxides when operating in stratified mode and then subsequently release them when the engine operates stoichiometrically. Due to the limited storage capacity of the NOx traps, the exhaust is periodically enriched under prolonged operation in lean mode conditions, to allow for a regeneration of the NOx trap. These shifts are also evident in the real time traces of particle number emissions, that can be reduced by two orders of magnitude during these short regeneration events [24].
Some recent studies have also investigated the possibility of introducing a Gasoline Particulate Filter (GPF) in an attempt to reduce the particle number emissions of G-DI vehicles [16, 44, 45]. Both wall flow and flow-through particulate filters were retrofitted to late technology G-DI vehicles. Only wall flow designs were found to efficiently reduce particle number emissions of late technology G-DI vehicles below the 6×10¹¹ #/km threshold. Most importantly, in one particular study [16] retrofitting of a GPF resulted in a reduction in a ~3% fuel consumption, which was attributed to increased internal Exhaust Gas Recirculation (EGR) caused by the increased backpressure (this was verified by the decrease in NOx emissions). This is a very important finding suggesting that the introduction of a GPF filter will not necessarily result in increased Carbon Dioxide (CO2) emissions. Of course there are issues that still need to be addressed and particularly the regeneration of the GPFs and their ash storage capabilities.
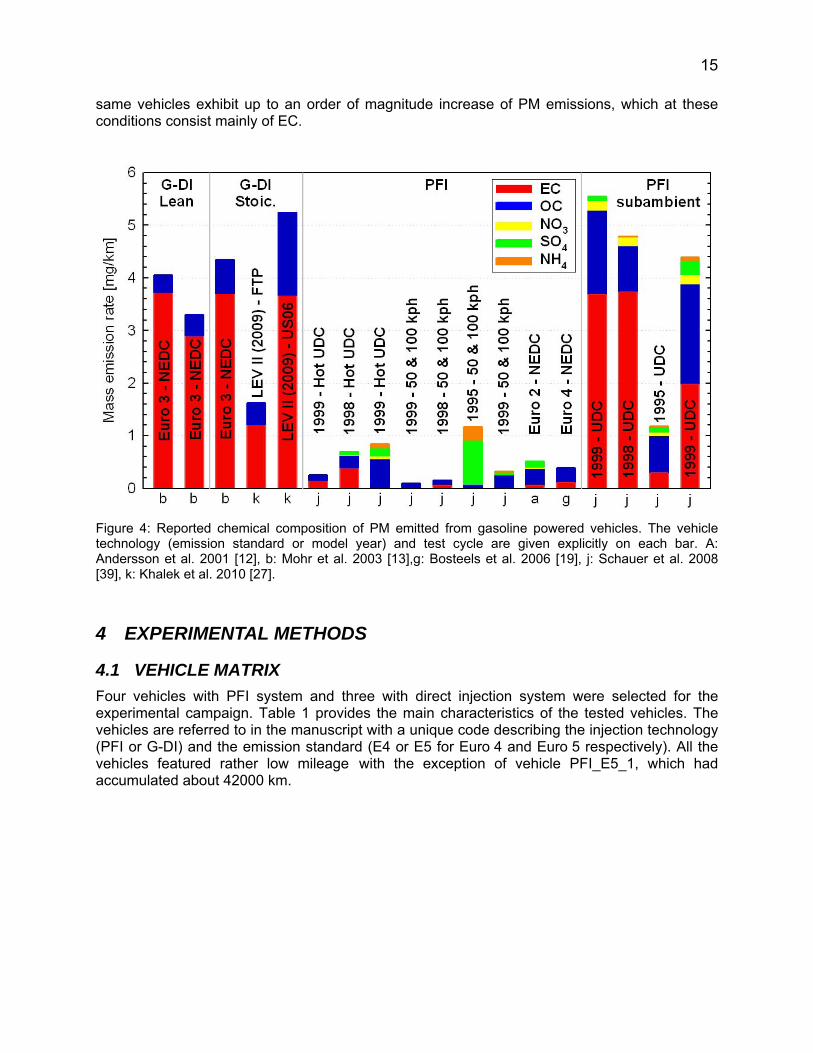
3.2.9 CHEMICAL COMPOSITION Figure 4 summarizes reported chemical compositions of gasoline exhaust PM. Most of the PM emitted by G-DI vehicles (70% to 92%) is found to be Elemental Carbon (EC). The relative contribution of EC is little affected by the test cycle or the fuel injection strategy (stratified or stoichiometric). Transmission Electron Microscope images of the PM emitted by a 2001 model (Euro 3) stoichiometric G-DI vehicle revealed agglomerated soot particles having a primary particle size of 27.7±2.7 nm [46], which is very close to what has been observed for diesel exhaust aerosol [47]. Similar structure to diesel exhaust particles was also reported by Maricq et al. (2004 [48]) who measured the effective density profiles and fractal dimensions using an in-situ measurement technique.
PM emissions from PFI vehicles are generally very low to allow for an accurate characterization of their chemical composition. Nevertheless, it is worth noting that under hot start conditions, most of the emitted PM is organic and inorganic material. It can also be seen that EC is basically present only under transient engine operation. At an ambient temperature of 0 °C the
15
same vehicles exhibit up to an order of magnitude increase of PM emissions, which at these conditions consist mainly of EC.
Figure 4: Reported chemical composition of PM emitted from gasoline powered vehicles. The vehicle technology (emission standard or model year) and test cycle are given explicitly on each bar. A: Andersson et al. 2001 [12], b: Mohr et al. 2003 [13],g: Bosteels et al. 2006 [19], j: Schauer et al. 2008 [39], k: Khalek et al. 2010 [27].
4 EXPERIMENTAL METHODS
4.1 VEHICLE MATRIX Four vehicles with PFI system and three with direct injection system were selected for the experimental campaign. Table 1 provides the main characteristics of the tested vehicles. The vehicles are referred to in the manuscript with a unique code describing the injection technology (PFI or G-DI) and the emission standard (E4 or E5 for Euro 4 and Euro 5 respectively). All the vehicles featured rather low mileage with the exception of vehicle PFI_E5_1, which had accumulated about 42000 km.

16
Table 1: Vehicle data and specifications.
Vehicle Emission standard
Fuel system Engine Manufacturer’s CO2
emission [g/km]
PFI_E4_1 4 PFI 1596 cc 85 kW 157
PFI_E4_2 4 PFI 1368 cc 88 kW 155
PFI_E5_1 5a PFI 1368 cc 57 kW 139
PFI_E5_2 5a PFI 1490 cc 82 kW 139
G-DI_E4_L 4 G-DI ln 1598 cc 85 kW 154
G-DI_E5_L 5a G-DI ln 1995 cc 105 kW 143
G-DI_E4_S 4 G-DI st 1598 cc 128 kW 166
4.2 TEST FUELS The vehicles were tested with market fuel meeting the specifications laid down in the Directive 2009/30/EC [41].
4.3 DRIVING CYCLES AND PROCEDURE
All the vehicles were tested using the standard New European Driving Cycle shown in Figure 5. This cycle has been used in Europe for certification of light-duty vehicles since 2000 and consists of the urban part, commonly indicated as Urban Driving Cycle (UDC or ECE), which includes four repetitions of the Elementary Urban Cycle, and the Extra-Urban Driving Cycle (EUDC).

17
New European Driving Cycle (NEDC)
0
20
40
60
80
100
120
140
0 200 400 600 800 1000 1200Time [s]
Spee
d [k
m/h
]
Urban Driving Cycle (UDC)Extra Urban Driving
Cycle (EUDC)
ElementaryUrban Cycle
Figure 5 – New European Driving Cycle (NEDC) and its two phases: Urban (UDC) and Extra-Urban (EUDC).
Some vehicles were also tested under the US06 supplemental federal test procedure [49], shown in Figure 6. The US06 cycle is a more aggressive test cycle that was employed to investigate the emission performance of the vehicles under steeper accelerations.

18
Figure 6: US06 driving cycle.
Some vehicles were also tested over NEDC at an ambient temperature of -7 °C. For these tests the dynamometer settings are adjusted for a 10% decrease of the coast-down time, meaning a corresponding increase of the resistance to progress, in accordance to the UNECE Regulation 83 [7]. The vehicles were soaked for at least 6 hours before each sub-ambient test. The ambient temperature during this soaking period was maintained at an average value of -7±3 °C.
In all the cases at least two repetitions of the test cycle were performed.
For the vehicles tested also under the US06 cycle, the measurement day consisted of a cold start NEDC followed by two consecutive US06 test cycles separated by a 80 s idling period. The US06 test sequence was performed with the engine hot. In order to reduce test to test variability all US06 tests started at the same oil temperature (76 °C).
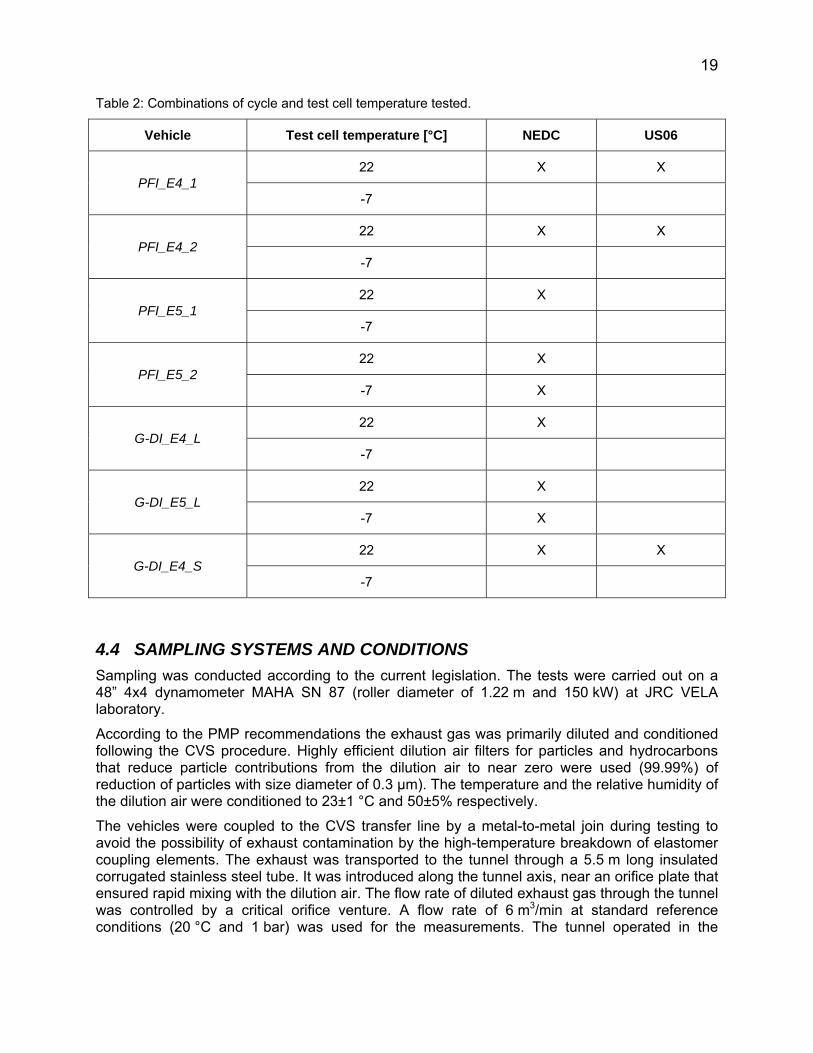
Table 2 summarizes the test matrix. At least two repetitions for each cycle and test cell temperature combination were performed.
19
Table 2: Combinations of cycle and test cell temperature tested.
Vehicle Test cell temperature [°C] NEDC US06
PFI_E4_1 22 X X
-7
PFI_E4_2 22 X X
-7
PFI_E5_1 22 X
-7
PFI_E5_2 22 X
-7 X
G-DI_E4_L 22 X
-7
G-DI_E5_L 22 X
-7 X
G-DI_E4_S 22 X X
-7
4.4 SAMPLING SYSTEMS AND CONDITIONS Sampling was conducted according to the current legislation. The tests were carried out on a 48” 4x4 dynamometer MAHA SN 87 (roller diameter of 1.22 m and 150 kW) at JRC VELA laboratory.
According to the PMP recommendations the exhaust gas was primarily diluted and conditioned following the CVS procedure. Highly efficient dilution air filters for particles and hydrocarbons that reduce particle contributions from the dilution air to near zero were used (99.99%) of reduction of particles with size diameter of 0.3 μm). The temperature and the relative humidity of the dilution air were conditioned to 23±1 °C and 50±5% respectively.
The vehicles were coupled to the CVS transfer line by a metal-to-metal join during testing to avoid the possibility of exhaust contamination by the high-temperature breakdown of elastomer coupling elements. The exhaust was transported to the tunnel through a 5.5 m long insulated corrugated stainless steel tube. It was introduced along the tunnel axis, near an orifice plate that ensured rapid mixing with the dilution air. The flow rate of diluted exhaust gas through the tunnel was controlled by a critical orifice venture. A flow rate of 6 m3/min at standard reference conditions (20 °C and 1 bar) was used for the measurements. The tunnel operated in the

20
turbulent flow regime (Re=27000). The residence time of the exhaust in the dilution tunnel was 2.6 s.
A schematic of the set up is shown in Figure 7. Two different probes, placed at the same cross-section of the tunnel and facing upstream the flow, were used for sampling. One probe was used for PM measurements and the other one for particle number. These probes were installed 10 tunnel diameters downstream of the mixing point to ensure complete mixing of the dilution air and the exhaust gas.
Figure 7: Experimental set up.
4.4.1 PM SAMPLING The mass measurement procedure was followed according to the current legislation. PM samples were drawn directly from the CVS at a constant flowrate of 50 lpm at normal conditions (0 °C and 1 bar) for all the measurements to improve repeatability.
The filter holder and transfer tubing were externally heated by direct surface heating to permit aerosol stabilization of >0.2 s prior to sampling and to ensure close control of the filter face temperature to 47 °C (±5 °C).
PM samples were collected on 47 mm Teflon-coated glass-fiber Pallflex® TX40H120-WW filters. One single 47 mm filter was used rather than primary and back-up filters to eliminate weighing errors and the volatile artifacts of the back-up filter. For the same reasons one filter was used for the entire NEDC rather than two filters for the urban (ECE) and extra-unban (EUDC) phases.
The filters were kept in a control temperature and humidity chamber (22±1 °C and 50±5% respectively), and they were weighted with a Mettler Toledo model UMX2 balance (sensitivity 10-7 g) before and after the measurement, allowing at least two hours for conditioning. Electrostatic change effects were minimized by the use of HAUG Type EN SL LC 017782100 neutralizer and grounded conductive surfaces. Each filter was weighted two times, and the average of the weightings was used in calculating mass changes.

21
4.4.2 PARTICLE NUMBER SAMPLING Aerosol samples for particle number measurement were drawn directly from the CVS. Three different PMP compliant Volatile Particle Removers (VPR) were employed in the testing. Two of them utilized an MD19-2E rotating disk dilutor (Matter Engineering AG) [50, 51, 52] for primary dilution operating on the 10 cavity disk, followed by an evaporating tube and a secondary simple air mixer diluter. The primary diluter and the primary dilution air were heated at 150 °C while the wall temperature of the evaporating tube was set at 300 °C (±1 °C). One of these systems (Nanomet#1) employed a TSI’s 3010D CPC while the other (Nanomet#2) used a TSI’s 3790 CPC. Some tests were also conducted with an AVL Particle Counter (APC) [53] utilizing a TSI’s 3790 CPC. The VPR system employed in the measurements of the different vehicles as well as the Particle Concentration Reduction Factors (PCRF) employed, are given in Table 3. This inconsistency introduced by the different calibration approaches can not potentially affect the conclusions of this study which are based on orders of magnitude differences.
Table 3: VPR settings employed at the tests of the different vehicles
Vehicle VPR system CPC model PCRF
PFI_E4_1 Nanomet 2 TSI’s 3790 200
PFI_E4_2 Nanomet 2 TSI’s 3790 200
PFI_E5_1 APC TSI’s 3790 100
PFI_E5_2 APC TSI’s 3790 100
G-DI_E4_L Nanomet 1 TSI’s 3010 440
G-DI_E5_L APC TSI’s 3790 2000
G-DI_E4_S Nanomet 2 TSI’s 3790 200
4.5 GASEOUS POLLUTANTS A Horiba MEXA-7400HTR-LE analyzer bench was employed for bag gaseous emission measurement (NOx, total Hydrocarbons (HC), Methane (CH4), Carbon Monoxide (CO) and CO2). In addition, second by second modal data analysis in the raw exhaust was performed (sampling rate: 1 Hz). The real time traces of Oxygen (O2), CO2, CO and HC provided the means for the lambda calculation.

22
5 RESULTS
5.1 BASELINE EMISSIONS This section presents the results obtained over the NEDC at ambient test cell temperature. The measured particle mass emissions are summarized in Figure 11. The error bars in this and the following figures correspond to ± one standard deviation.
The measured particle number emissions over the NEDC are summarized in Figure 8. All G-DI vehicles were found to emit more than 6×10¹¹ #/km. Higher emissions were observed from G-DI vehicles operating in lean mode, with the latest Euro 5 vehicle emitting as high as 1.5×10¹³ #/km. The stoichiometric G-DI gave lower emissions (1.3×10¹² #/km) but still five times above the Euro 5 diesel limit.
All PFI vehicles were found to be below the diesel Euro 5 limit. The emissions of two Euro 4 vehicles averaged both at ~3×10¹⁰ #/km but exhibited a large test to test variability with individual test results spanning over one and a half orders of magnitude (from 5.1×10⁹ #/km to 1.1×10¹¹ #/km). The latest technology PFI vehicle stands out giving repeatedly higher emissions averaging at 5.5×10¹¹ #/km, i.e. just below the diesel Euro 5 threshold.
Figure 8: Measured solid particle number emissions over NEDC.
The real time traces of particle number emissions give some insight on the formation mechanism. In the case of PFI vehicles (Figure 9), particles are mainly formed during short periods that coincide with vehicle acceleration. Elevated emissions are also observed over the first ~200 s of the cycle, during which more than 70% of the total emitted particles may be produced (PFI_E4_1). This cold start effect is also evident in the CO emissions, which however are effectively suppressed as soon as the catalyst is warmed up and its fully efficiency is reached.

23
In the case of the PFI_E5_1 vehicle, the cold start effect is not that pronounced. The intensity of the emission peaks occurring during accelerations eventually drops over time but not that steeply. It is not clear whether this is associated with the start-stop feature of the particular vehicle which switches the engine off during the idling periods of the NEDC cycle (evident in the calculated lambda traces).
Figure 9: Particle number emission rates of vehicles PFI_E5_1 and PFI_E4_1 over NEDC. Also shown are the vehicle speed, calculated lambda for PFI_E5_1 and CO emissions of PFI_E4_1.
The situation is different in the case of the G-DI vehicles. Particles are produced over the entire duration of the cycle and do not appear as spikes during acceleration. A cold start effect is also observed but not that pronounced as in the case of PFI vehicles. This is particularly true for the Lean G-DI vehicle whose particle emissions mostly depend on the air to fuel ratio. With the exception of the cold start phase and some short periods at high vehicle speed and vehicle acceleration, the particular vehicle operates in lean mode with a lambda as high as 3 (larger spikes are artifacts associated with the fuel cut-off during deceleration). During this 30% of the measurement time, including the cold start period, where the G-DI_E5_L vehicle operated in stoichiometric mode, it produced only ~8% of the total emitted particle number concentrations.

24
Figure 10: Particle number emission rates of vehicles G-DI_E4_S and G-DI_E5_L over NEDC. Also shown are the vehicle speed and calculated lambda traces for the G-DI_E5_L.
The PM emissions from all vehicles tested were found to be below the current Euro 5 limit applicable to G-DI vehicles. The gravimetric procedure was capable of discriminating the particulate emissions of the Euro 5 lean burn G-DI vehicle from those of the stoichiometric G-DI vehicles, but could not identify the high emitting Euro 5 PFI vehicle. Assuming a lognormal size distribution peaking at 60 nm with a geometric standard deviation of 1.75 [54] and using the effective density profile determined by Maricq et al. [48], one can estimate the mass of airborne particles counted with the PMP systems. These rough calculations suggest a mass emission rate of 0.7 mg/km (G-DI_E4_L), 2.8 mg/km (G-DI_E5_L) and 0.3 mg/km (G-DI_E4_S) mg/km for the three G-DI vehicles, 0.06 mg/km for the two Euro 4 PFI vehicles and 0.1 mg/km for the high emitting Euro 5 PFI one. These figures are lower than the measured PM emissions and this suggests that a significant portion of PM is volatile or adsorbed gaseous material [30, 43]. These rough calculations suggest that the PM methodology is not sensitive enough to accurately quantify the airborne particulate emissions of PFI vehicles and low emitting G-DI vehicles.

25
Figure 11: Measured PM emissions over NEDC.
5.2 EFFECT OF TEST CYCLE Some vehicles were tested over both the NEDC and the US06 driving cycles. Figure 12 summarizes the solid particle number emission results from these tests.
The test cycle appeared to have a significant effect on the emissions of the two PFI vehicles. Almost 33 times higher number concentrations were emitted over the US06 from the PFI_E4_1. The PFI_E4_2 vehicle also exhibited an almost 9-fold increase in particle number emissions over the US06. The effect of cycle was less pronounced in the case of the G-DI vehicle, which produced something like 35% more particles over the US06.
Figure 13 compares the real time traces of particle numbers emitted from the PFI_E4_1 vehicle over the NEDC and the US06. In both cycles, almost the entire particle population is produced during vehicle accelerations. In the case of the US06 however, these spikes can be almost two orders of magnitude higher (note the different scales in the two graphs). The higher the acceleration, the higher the concentration of produced particles.

26
Figure 12: Effect of test cycle on the solid particle number emissions of gasoline powered vehicles.

27
Figure 13: Particle number emission rates of PFI_E4_1 vehicle over NEDC and two consecutive US06. Also shown are the vehicle speed and vehicle acceleration.
Figure 14 summarizes the PM emissions of the three vehicles over the NEDC and the US06 driving cycles.
Testing over the US06 cycle resulted in a 7-fold increase in the PM emissions of the PFI_E4_1 vehicle and in an about 85% increase for the PFI_E4_2 one. PM emissions from the G-DI vehicle were practically unaffected.

28
Figure 14: Effect of test cycle on the PM emissions of gasoline powered vehicles.
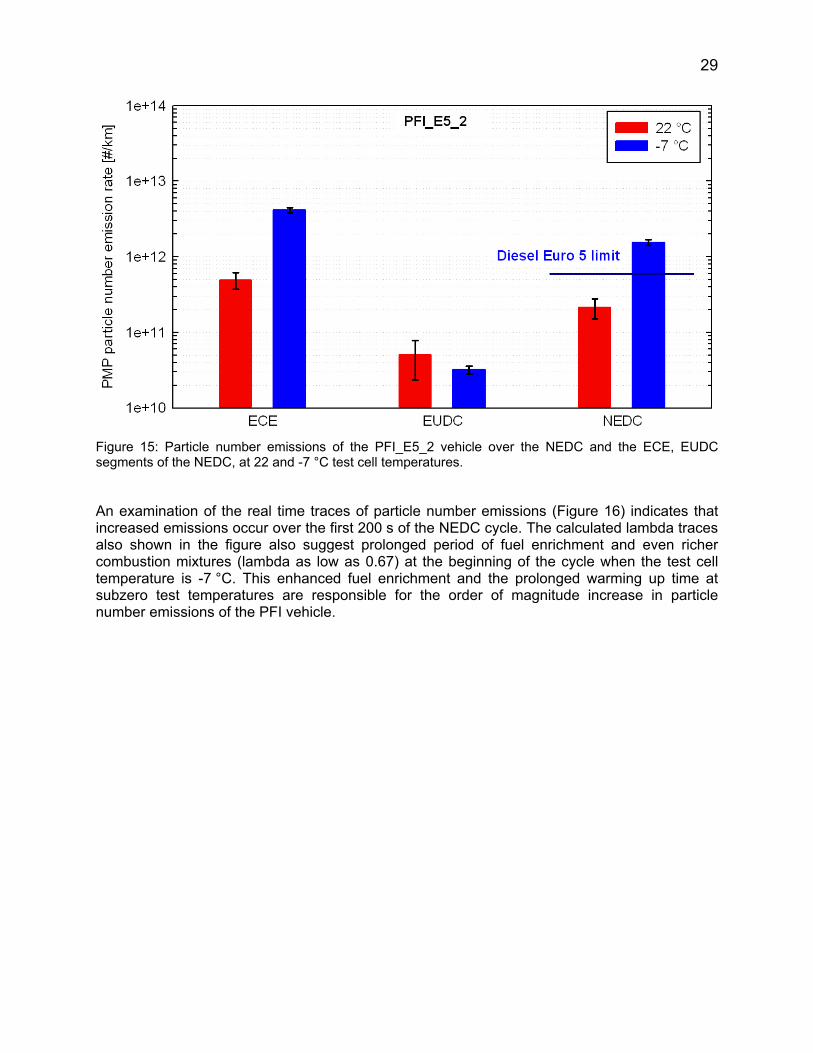
5.3 SUB-AMBIENT TEMPERATURE TESTS Two vehicles, one PFI (PFI_E5_2) and one lean burn G-DI (G-DI_E5_L), were tested both at ambient (22 °C) and at -7 °C test cell temperatures. Figure 15 compares the cycle average particle number emissions of the PFI_E5_2 vehicle at ambient and sub-ambient test cell temperatures over NEDC and the ECE and EUDC segments of the cycle.
The sub-ambient tests resulted in a 7-fold increase of the number of solid particles emitted from the PFI vehicle over the NEDC. This increase in emissions occurred over the ECE part of the cycle, where most of the particles are emitted. The particle number emission rate over the ECE segment averaged at 4.9×10¹¹ #/km at a test cell temperature of 22 °C and increased to 4.1×10¹² #/km at -7 °C. The emission performance over the EUDC segment of the NEDC was little affected, with the particle number concentrations being on average lower at subzero tests (3.2×10¹⁰ #/km compared to 5.1×10¹⁰ #/km).
29
Figure 15: Particle number emissions of the PFI_E5_2 vehicle over the NEDC and the ECE, EUDC segments of the NEDC, at 22 and -7 °C test cell temperatures.
An examination of the real time traces of particle number emissions (Figure 16) indicates that increased emissions occur over the first 200 s of the NEDC cycle. The calculated lambda traces also shown in the figure also suggest prolonged period of fuel enrichment and even richer combustion mixtures (lambda as low as 0.67) at the beginning of the cycle when the test cell temperature is -7 °C. This enhanced fuel enrichment and the prolonged warming up time at subzero test temperatures are responsible for the order of magnitude increase in particle number emissions of the PFI vehicle.

30
Figure 16: Real time lambda traces (upper panel) and particle number emissions (lower panel) of the PFI_E5_2 vehicle over NEDC under 22 °C and -7 °C test cell temperatures.
Figure 17 compares the cycle average particle number emissions of the lean burn G-DI vehicle at test cell temperatures of 22 °C and -7 °C over the NEDC as well as the ECE and EUDC segments of the NEDC. Particle number emissions are much less affected by the test cell temperature in the case of this G-DI vehicle. On average the particle number emissions increase by 14% (ECE) to 20% (EUDC) when the soak temperature decreases from 22 °C to -7 °C, with the differences found to lie within the variability of the results.

31
Figure 17: Particle number emissions of the G-DI_E5_L vehicle over the NEDC and the ECE, EUDC segments of the NEDC, at 22 and -7 °C test cell temperatures.
The real time traces of particle number emissions and lambda (Figure 18) give some additional insights into the effect of test cell temperature on the particulate emissions of this lean burn G-DI vehicle. At the start of the cycle the vehicle operates in stoichiometric mode to allow for a stable combustion during the warming up of the engine. Subzero tests result in a prolonged operation in stoichiometric mode at the beginning of the cycle (~280 s compared to ~150 s). Subzero tests result in increased emissions over this stoichiometric region of the cycle (by about 110%). However, the prolonged operation in stoichiometric mode at -7 °C counterbalances this increase, resulting in a net increase of only 14% over ECE.
Particle emissions over the EUDC part of the cycle mainly depend on the engine control and the different dynamometer settings as the vehicle is already warmed up. Different regions of stoichiometric and lean operation were observed from test to test even at the same test cell conditions. Overally, slightly higher particle number emissions were measured at -7 °C (1.1×10¹³ #/km to 1.4×10¹³ #/km compared to 1.0×10¹³ #/km and 1.1×10¹³ #/km at 22 °C).

32
Figure 18: Real time lambda traces (upper panel) and particle number emissions (lower panel) of the G-DI_E5_L vehicle over NEDC under 22 °C and -7 °C test cell temperatures.
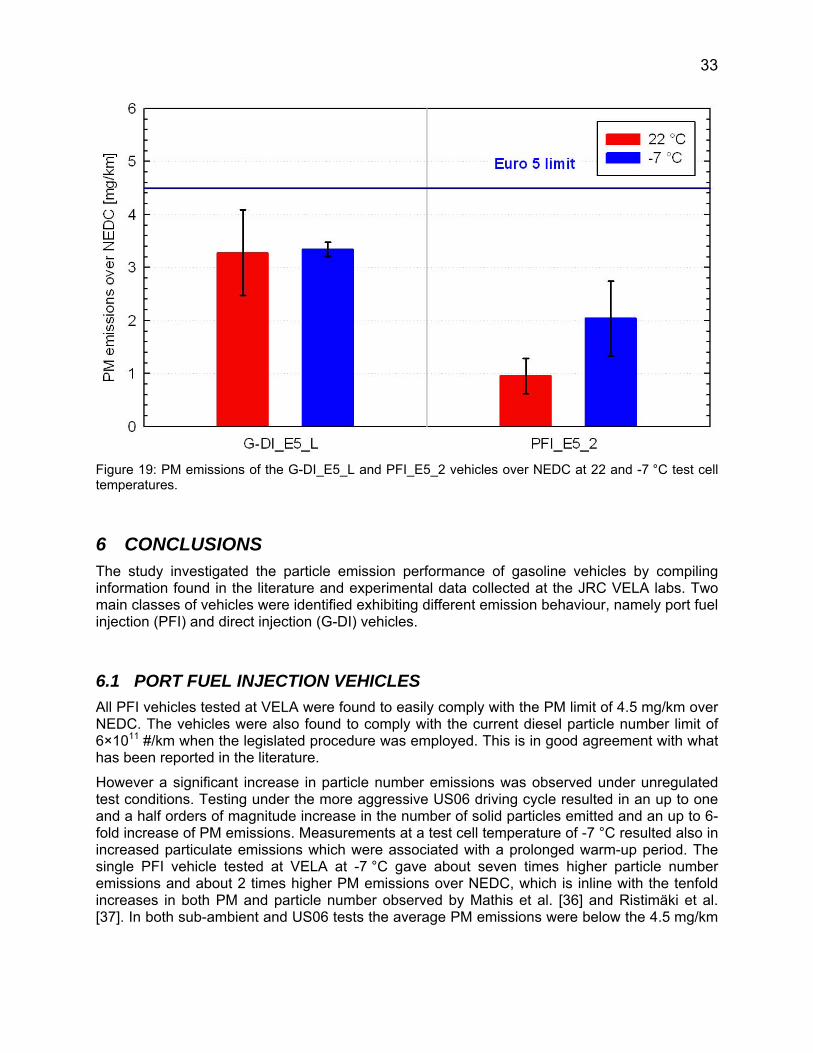
The PM results (Figure 19) are in good agreement with the particle number results, suggesting that sub-ambient testing has a minimal effect on the particle emissions from the lean burn G-DI vehicle but increases the PM emissions of the PFI vehicle. The relative increase of the PFI PM emissions over NEDC was 113% which is not that pronounced as the order of magnitude increase observed in the particle number emissions of the particular vehicle. No information is available on the fraction of PM emitted over the ECE and EUDC parts of the cycle as a single filter was employed for the whole NEDC.
33
Figure 19: PM emissions of the G-DI_E5_L and PFI_E5_2 vehicles over NEDC at 22 and -7 °C test cell temperatures.
6 CONCLUSIONS The study investigated the particle emission performance of gasoline vehicles by compiling information found in the literature and experimental data collected at the JRC VELA labs. Two main classes of vehicles were identified exhibiting different emission behaviour, namely port fuel injection (PFI) and direct injection (G-DI) vehicles.
6.1 PORT FUEL INJECTION VEHICLES All PFI vehicles tested at VELA were found to easily comply with the PM limit of 4.5 mg/km over NEDC. The vehicles were also found to comply with the current diesel particle number limit of 6×10¹¹ #/km when the legislated procedure was employed. This is in good agreement with what has been reported in the literature.
However a significant increase in particle number emissions was observed under unregulated test conditions. Testing under the more aggressive US06 driving cycle resulted in an up to one and a half orders of magnitude increase in the number of solid particles emitted and an up to 6-fold increase of PM emissions. Measurements at a test cell temperature of -7 °C resulted also in increased particulate emissions which were associated with a prolonged warm-up period. The single PFI vehicle tested at VELA at -7 °C gave about seven times higher particle number emissions and about 2 times higher PM emissions over NEDC, which is inline with the tenfold increases in both PM and particle number observed by Mathis et al. [36] and Ristimäki et al. [37]. In both sub-ambient and US06 tests the average PM emissions were below the 4.5 mg/km

34
threshold. The particle number emissions of most of the PFI vehicles however exceeded the limit of 6×10¹¹ #/km.
One particular concern pertaining to the PFI vehicles is the emission of sub 23 nm particles. Unfortunately no such information is available from the tests conducted so far at the VELA labs. A survey of the literature suggested disproportionally higher emissions at this size range [15] with the cycle average emissions over NEDC consistently exceeding the 6×10¹¹ #/km threshold when employing a CPC with a cut-off size at 7 nm [15, 30]. This is an issue that requires further investigation.
6.2 DIRECT INJECTION GASOLINE VEHICLES In total three G-DI vehicles were tested at VELA, two of them operating in mixed mode (lean burn G-DI) and one in stoichiometric mode. All three vehicles complied with the Euro 5 PM limit of 4.5 mg/km. However, the particle number emissions exceeded the diesel Euro 5 threshold of 6×10¹¹ #/km by some margin. The single stoichiometric G-DI vehicle tested gave the lowest particle number emissions that ranged between 9.6×10¹¹ #/km and 1.5×10¹² #/km. Particle number emissions from lean burn G-DIs could reach up to 1.5×10¹³ #/km. The results are in good agreement with what has been reported in the literature. To our knowledge there is no published data of commercial G-DI vehicles complying with the diesel Euro 5 particle number limit.
Interestingly, the driving cycle and test cell temperature had minimal effect on the particulate emissions (both PM and number) of the G-DI vehicles tested. This confirms the general observation that particle formation mechanism in G-DI vehicles resembles that in diesels [36].
A recent study has reported that the volatility of gasoline fuel had a significant effect on the particulate emissions of a 2009 model G-DI vehicle, raising some concerns regarding the use of gasoline ethanol blends. This is an issue that need to be experimentally investigated focusing on latest technology G-DI vehicles.
A survey of the relative literature suggests that particulate emissions from G-DI vehicles resemble those of their diesel counterparts in terms of size, structure and chemical composition. A limited number of studies have investigated the emission of particles smaller than 23 nm. The contribution of these nano-size particles to the total emitted number of solid particles was found to be similar to or even less than what has been reported for diesel engines. This issue needs to be considered in further dedicated studies.
7 DISCUSSION/OUTLOOK Direct injection gasoline vehicles are consistently found to emit very high number of particles, with the actual emission levels even approaching those of conventional diesels in some cases (i.e. G-DI_E5_L). Lean burn G-DI vehicles are generally higher particle emitters than G-DIs running on stoichiometric fuel mixtures. Still, the lowest emitting stoichiometric G-DI vehicle exceeded the diesel Euro 5 limit (6×10¹¹ #/km) by more than 100%.
If the diesel Euro 5 limit will be introduced to gasoline vehicles, the particle number emissions of G-DI vehicles must be reduced drastically. It is not clear whether this could be achieved by engine improvements or whether this will require the introduction of a Gasoline Particulate Filter (GPF). Some manufacturers have claimed that it will be possible to comply with the diesel Euro 5 limit without the need for aftertreatment systems [55], but there is no published data yet

35
supporting this argument. Some manufacturers [44] are already considering introduction of GPFs and some recent studies [16, 45] have successfully retrofitted GPFs in late technology G-DI vehicles. One interesting finding of these studies was that the introduction of the GPF does not necessarily result in increased CO2 emissions. The potential burden in fuel consumption introduced by these measures is of particular concern given the direction taken towards reducing greenhouse gases [56].
Recognizing the increased PM emissions of G-DI vehicles and the expected increased penetration of this vehicle category due to their CO2 reduction benefits, California’s Air Resource Board has recently proposed an amendment of the Low Emission Vehicle (LEV III) regulations that introduces an optional particle number limit following the PMP sampling methodology. However, the proposed limit is set at 3.7×10¹² #/km starting from 2014 with a provision to be further reduced at 1.9×10¹² #/km by 2017. The reasoning behind this relaxed limit lies in the need for equivalency of the number and mass limit given that the latter is introduced on a voluntarily basis. This synergy however has been questioned in a recent study [27], which suggested that the number limit at this level is still more stringent than the proposed ULEV III PM limits of 3.8 mg/km (2014) and 1.9 mg/km (2017).
Some additional testing is required to assess potential improvements in the particulate emissions from late technology G-DI vehicles but also the performance of available GPF systems. The tests should also investigate any potential effect of ethanol – gasoline blends on the particulate emissions of late technology G-DI vehicles. Finally, the contribution of sub 23 nm solid particles needs to be better quantified.
The situation is quite different in the case of PFI vehicles. It appears that this particular vehicle category can easily achieve the diesel Euro 5 limits both in terms of mass and number. However, there are concerns regarding the suitability of the legislated procedure for the assessment of the true particulate emissions of PFI vehicles. The particle number emissions of PFI vehicles are found to strongly depend on the driving behaviour. Increases of up to 1 ½ orders of magnitude were observed during the sharp accelerations of the US06 driving cycle. Accurate quantification of the particle emissions from PFI vehicles requires the use of a driving cycle representative of real world driving conditions. This highlights the importance of the work on the development of a harmonized driving cycle in the framework of the Worldwide harmonized Light vehicles Test Procedure (WLTP).
Large increases in the particle emissions of PFI vehicles were also observed at sub-ambient test temperatures. Testing at JRC of a Euro 5 PFI vehicle at -7 °C resulted in an 8-fold increase in the particle number emissions and a 2-fold increase of PM over the ECE segment of the NEDC. Similar increases in the particulate emissions of PFI vehicles have also been reported in the literature [36, 37, 39]. It is worth noting that these figures are comparable to the increases observed in the CO and HC emissions [57, 58] that are controlled in the regulations. In contrast to gaseous pollutants however, the increase in particle number emissions are mostly associated with the operation of the engine under richer conditions to avoid misfires and not with the low temperature of the catalytic converter. The latter was found to have minimal effect on the particulate emissions of PFI vehicles [42, 43].
One issue of perhaps more importance is the relevance of the PMP 23 nm cut-off size for PFI exhaust aerosol. Size distribution measurements presented in the literature suggest that PFI vehicles emit disproportionally higher concentrations of nanosized particles [14, 15]. Furthermore, application of the PMP methodology with a CPC having a smaller cut-off size [30] yielded particle number emission rates that were systematically above the 6×10¹¹ #/km limit. One particular concern is the emission of metal-oxide nanosized particles [59] that are expected to have increased toxicity [60, 61]. The formation mechanism of these particles is not clear yet

36
but it is postulated that these originate from oil additives and as such are formed in all internal combustion engines. Diesel Particulate Filters (DPF) were found to remove solid nanoparticles of these size range with an efficiency comparable to soot [62]. This is also expected to be the case for GPF systems envisaged for introduction to G-DI vehicles [45]. It is not clear yet whether and to what extent the manufacturers will introduce GPFs in G-DI vehicles, but there’s a high chance that PFI vehicles will be the only technology that will not incorporate an after-treatment system addressing particulate emissions and therefore effectively controlling metallic ash nanoparticles. Further investigation is required in order to better characterize the properties and chemical composition of PFI exhaust aerosol.
In order to assess the suitability of the PMP methodology for the control of the particle emissions from gasoline vehicles, it is necessary to better quantify the relative contribution of emitted sub-23 nm particles. A disproportionally higher emission of nanosized particles might require a shift of the lower cut-off size below 23 nm and accordingly an adjustment of the particle number limit. To address this issue, there is an urgent need for experimental data on the particle emission performance of late technology gasoline vehicles designed to comply with the upcoming Euro 6 regulations. Gasoline Particulate Filters are expected to play a key role and therefore need also to be evaluated in terms of applicability and efficiency (with a special focus on the sub-23 nm range).
37
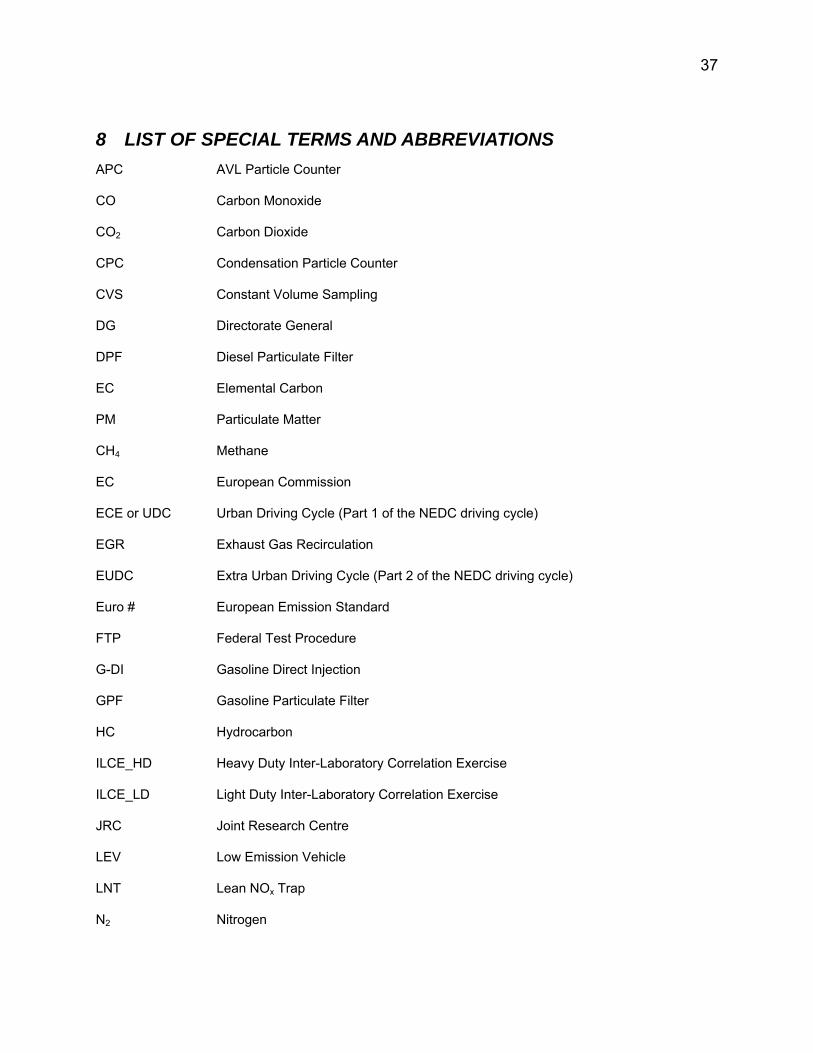
8 LIST OF SPECIAL TERMS AND ABBREVIATIONS APC AVL Particle Counter
CO Carbon Monoxide
CO2 Carbon Dioxide
CPC Condensation Particle Counter
CVS Constant Volume Sampling
DG Directorate General
DPF Diesel Particulate Filter
EC Elemental Carbon
PM Particulate Matter
CH4 Methane
EC European Commission
ECE or UDC Urban Driving Cycle (Part 1 of the NEDC driving cycle)
EGR Exhaust Gas Recirculation
EUDC Extra Urban Driving Cycle (Part 2 of the NEDC driving cycle)
Euro # European Emission Standard
FTP Federal Test Procedure
G-DI Gasoline Direct Injection
GPF Gasoline Particulate Filter
HC Hydrocarbon
ILCE_HD Heavy Duty Inter-Laboratory Correlation Exercise
ILCE_LD Light Duty Inter-Laboratory Correlation Exercise
JRC Joint Research Centre
LEV Low Emission Vehicle
LNT Lean NOx Trap
N2 Nitrogen
38
NEDC New European Driving Cycle
NOx Oxides of Nitrogen (NO & NO2)
O2 Oxygen
PCRF Particle Concentration Reduction Factor
PFI Port Fuel Injection
PMP Particle Measurement Programme
PN Particle Number
TWC Three Way Catalytic converter
UN-ECE GRPE United Nations Economic Commission for Europe Working Party on Pollution and Energy
VELA Vehicles Emission Laboratory
VPR Volatile Particle Removers
WLTP Worldwide harmonized Light vehicles Test Procedure
AKNOWLEDGMENTS The authors would like to acknowledge the VELA staff for their technical assistance, in particular U. Manfredi, G. Lanappe, R. Colombo, M. Sculati, F. Muehlberger, P. Le Lijour and M. Cadario.

39
REFERENCES
1 Commission Regulation (EC) No 692/2008, 18 July 2008, “Implementing and amending Regulation (EC) No 715/2007 of the European Parliament and of the Council on type-approval of motor vehicles with respect to emissions from light passenger and commercial vehicles (Euro 5 and Euro 6) and on access to vehicle repair and maintenance information”, Official Journal of the European Union, L 199, 1-136, 2008.
2 Regulation (EC) No 715/2007 of the European Parliament and of the Council of 20 June 2007, “On type approval of motor vehicles with respect to emissions from light passenger and commercial vehicles (Euro 5 and Euro 6) and on access to vehicle repair and maintenance information”, Official Journal of the European Union, L 171, 1-16, 2007.
3 Commission Notice 2008/C 182/08, “Communication on the application and future development of Community legislation concerning vehicle emissions from light-duty vehicles and access to repair and maintenance information (Euro 5 and 6)”, Official Journal of the European Union, C 182, 17-20, 2008.
4 Vouitsis E., Ntziachristos L. and Samaras Z. (2003). “Particulate matter mass measurements for low emitting diesel powered vehicles: what's next?” Progress in Energy and Combustion Science, 29: 635-672.
5 WHO (2005). “Air Quality Guidelines for Particulate Matter, Ozone, Nitrogen Dioxide and Sulfur Dioxide Global Update 2005”.World Health Organization Copenhagen, Denmark.
6 Andersson J., Giechaskiel B., Muňoz-Bueno R., Sandback E. And Dilara P. (2007). “Particle Measurement Programme (PMP) Light-Duty Inter-Laboratory Correlation Exercise (ILCE_LD) Final Report”. EUR 22775 EN, http://ies.jrc.ec.europa.eu/uploads/fileadmin/Documentation/Reports/Emissions_and_Health/EUR_2006-2007/EUR_22775_EN.pdf
7 United Nations – Economic Commission for Europe, Regulation No 83, Revision 4, 26 April 2011, “Uniform Provisions Concerning the Approval of Vehicles with Regard to the Emission of Pollutants According to Engine Fuel Requirements”, 2011.
8 Agreement concerning the adoption of uniform technical prescriptions for wheeled vehicles, equipment and part which can be fitted and/or be used on wheeled vehicles and the conditions for reciprocal recognition of approvals granted on the basis of these prescriptions. http://www.unece.org/trans/main/wp29/wp29regs/r083r3a2e.doc
9 Alkidas A. C. (2007). “Combustion Advancements in Gasoline Engines”. Energy Conversion & Technology, 48: 2751-2761.
10 Maricq M. M., Podsiadlik D. H., Brehob D. D. and Haghgooie M. (1999). “Particulate Emissions from a Direct-Injection Spark Ignition (DISI) Engine”. SAE Technical Paper 1999-01-1530.
11 Zhao F., Lai M.-C. and Harrington D. L. (1999) “Automotive Spark-Ignited Direct-Injection Gasoline Engines”. Progress in Energy and Combustion Science, 25: 437-562.
12 Andersson J. D., Wedekind B. G.A., Hall D., Stradling R. And Wilson G. (2001). “DETR/SMMT/CONCAWE Particulate Research Programme: Light Duty Results”. SAE Technical Paper 2001-01-3577.
13 Mohr M., Lehmann U. and Margaria G. (2003). “ACEA Programme on the Emissions of Fine Particulates from Passenger Cars (2). Part 1: Particle Characterisation of a Wide Range of Engine Technologies”. SAE Technical Paper 2003-01-1889.
14 Ntziachristos L., Mamakos A., Samaras Z., Mathis U., Mohr M., Thompson N., Strandling R., Forti L. and de Serves C. (2004). “Overview of the European “Particulates” Project on the Characterization of Exhaust Particulate Emissions for Road Vehicles: Results for Light Duty Vehicles”. SAE Technical Paper 2004-01-1985.

40
15 Mohr M., Forss A.-M. and Lehmann U. (2006). “Particle Emissions from Diesel Passenger Cars Equipped with a Particle Trap in Comparison to Other Technologies”. Environmental Science and Technology, 40: 2375-2383.
16 Mikulic I., Koelman H., Majkowski S. And Vosejpka P. (2010). “A Study about Particle Filter Application on a State-of-the-Art Homogeneous Turbocharged 2L DI Gasoline Engine”. Aachener Kolloquium Fahrzeug- und Motorentechnik 2010.
17 Lüders H., Krüger M., Stommel P. and Lüers B. (1998). “The Role of Sampling Conditions in Particle Size Distribution Measurements”. SAE Technical Paper 981374.
18 Swanson J. and Kittelson D. (2010). “Evaluation of thermal denuder and catalytic stripper methods for solid particle measurements”. Journal of Aerosol Science, 41: 1113-1122.
19 Bosteels D., Mas C. J., Karlsson H. and de Serves (2006). “‘Regulated’ and ‘Non Regulated’ Emissions from Modern European Passenger Cards”. SAE Technical Paper 2006-01-1516.
20 Braisher M., Stone R. and Price P. (2010). “Particle Number Emissions from a Range of European Vehicles”. SAE Technical Paper 2010-01-0786.
21 Hall D. E., Goodfellow C. L. Heinze P., Rickeard D. J., Nancekievill G., Martini G., Hevesi J., Rantanen L., Merino M. P., Morgan T. D. B. and Zemroch P. J. (1998). “A Study of the Size, Number and Mass Distribution of the Automotive Particulate Emissions from European Light Duty Vehicles”. SAE Technical Paper 982600.
22 Maricq M., Chase R. E., Podsiadlik D. H and Vogt R. (1999). “Vehicle Exhaust Particle Size Distributions: A Comparison of Tailpipe and Dilution Tunnel Measurements”. SAE Technical Paper 1999-01-1461.
23 Sogawa Y., Hattori H., Yanagisawa N., Hosoya M., Shoji T., Iwakiri Y., Yamashita T., Ikeda T., Tanaka S., Takahashi K., Suzuki T., Nakajima T. and Tonegawa Y. (2007). “Nano Particle Emission Evaluation of State of the Art Diesel Aftertreatment Technologies (DPF, urea-SCR and DOC), Gasoline Combustion Systems (Lean Burn / Stoichiometric DISI and MPI) and Fuel Qualities Effects (EtOH, ETBE, FAME, Aromatics and Distillation)”. SAE Technical Paper 2007-01-4083.
24 Graskow B. R., Kittelson D. B., Ahmadi M. R. and Morris J. E. 1999. “Exhaust Particulate Emissions from a Direct Injection Spark Ignition Engine”. SAE Technical Paper 1999-01-1145.
25 Hall D. E. and Dickens C. J. (1999). Measurement of the Number and Size Distribution of Particles Emitted from a Gasoline Direct Injection Vehicle. SAE Technical Paper 1999-01-3530.
26 Mohr M., Forss A.-M. and Steffen D. (2000). “Particulate Emissions of Gasoline Vehicles and Influence of the Sampling Procedure”. SAE Technical Paper 2000-01-1137.
27 Khalek I. A., Bougher T. abd Jetter J.J. (2010). “Particle Emissions from a 2009 Gasoline Direct Injection Engine Using Different Commercially Available Fuels.” SAE Technical Paper 2010-01-2117.
28 Giechaskiel B., Carriero M., Martini G. and Andersson J. (2009). “Heavy Duty Measurement Programme (PMP): Exploratory Work for the Definition of the Test Protocol”. SAE Technical Paper 2009-01-1767.
29 Johnson K. C., Durbin T. D., Jung H., Chaudhary A., Cocker III D.R., Herner J. D., Robertson W. H., Huai T., Ayala A. and Kittelson D. (2009). “Evaluation of the European PMP Methodologies during On-Road and Chassis Dynamometer Testing for DPF Equipped Heavy-Duty Diesel Vehicles”. Aerosol Science and Technology, 43: 962-969.
30 Schreiber D., Forss A.-M., Mohr M. and Dimopoulos P. (2007). “Particle Characterisation of Modern CNG, Gasoline and Diesel Passenger Cars”. SAE Technical Paper 2007-24-0123.
31 Maricq M., Podsiadlik D. H and Chase R. E. (1999). “Gasoline Vehicle Particle Size Distributions: Comparison of Steady State, FTP, and US06 Measurements”. Environmental Science and Technology, 33: 2007-2015.
32 Maricq M. M., Podsiadlik D. H. and Chase R. E. (1999). “Examination of the Size Resolved and Transient Nature of Motor Vehicle Particle Emissions”. Environmental Science and Technology, 33: 1618-1626.

41
33 Khalek I. A. and Kittelson D. B. (1995). “Real Time Measurement of Volatile and Solid Exhaust Particles Using a Catalytic Stripper”. SAE Technical Paper 950236.
34 Graskow B. R., Kittelson D. B., Abdul-Khalek I. S., Ahmadi M. R. and Morris J. E. (1998). “Characterization of Exhaust Particulate Emissions from a Spark Ignition Engine”. SAE Technical Paper 980528.
35 Hall D. E. and Dickens C. J. (1999). “Measurement of the Number and Size Distribution of Particles Emitted from a Gasoline Direct Injection Vehicle”. SAE Technical Paper 1999-01-3530.
36 Mathis U., Mohr M. and Forss A.-M. (2005). “Comprehensive particle characterization of modern gasoline and diesel passenger cars at low ambient temperatures”. Atmospheric Environment, 39: 107-117.
37 Ristimäki J., Keskinen J., Virtanen A., Maricq M. And Aakko P. (2005). Cold Temperature PM Emissions Measurement: Method Evaluation and Application to Light Duty Vehicles. Environmental Science and Technology, 39: 9424-9430.
38 Kittelson D. B., Watts W. F., Johnson J.P., Schauer J.J. and Lawson D.R. (2006). “On-Road and Laboratory Evaluation of Combustion Aerosols-Part 2: Summary of Spark Ignition Engine Results”. Journal of Aerosol Science, 37: 931-949.
39 Schauer J.J., Christensen C. G., Kittelson D. B., Johnson J.P. and Watts W. F. (2008). “Impact of Ambient Temperatures and Driving Conditions on the Chemical Composition of Particulate Matter Emissions from Non-Smoking Gasoline-Powered Motor Vehicles”. Aerosol Science and Technology, 42: 201-223.
40 Mohr M., Lehmann U. and Margaria G. (2003). “ACEA Programme on the Emissions of Fine Particulates from Passenger Cars (2). Part 2: Effect of Sampling Conditions and Fuel Sulphur Content on the Particle Emissions”. SAE Technical Paper 2003-01-1890.
41 Directive 2009/30/EC of the European Parliament and of the Council of 23 April 2009, “amending Directive 98/70/EC as regards the specifications of petrol, diesel and gas-oil and introducing a mechanism to monitor and reduce greenhouse gas emissions and amending Council Directive 1999/32/EC as regards the specifications of fuel used by inland waterway vessels and repealing Directive 93/12/EEC”. Official Journal of the European Union, L 140, 88-113, 2009.
42 Graskow B. R., Kittelson D. B., Ahmadi M. R. and Morris J. E. (1999). “Exhaust Particulate Emissions from Two Port Fuel Injected Spark Ignition Engines”. SAE Technical Paper 1999-01-1144.
43 Maricq M. M., Chase R. E., Xu N. and Podsiadlik D. H. (2002). “The effects of the Catalytic Converter and Fuel Sulphur Content on Motor Vehicle Particulate Matter Emissions: Gasoline Vehicles”. Environmental Science and Technology, 36: 276-282.
44 Ericsson Per. (2010). “Particulate Number Emissions from Spark Ignition Engines”. Emission Control Consepts, 29 November – 01 December 2010, Dorint Pallas Wiesbaden, Germany.
45 Andersson J., Keenan M. and Åkerman K. (2009). “GDI Particles – Legislation, Current Levels and Control”. Cambridge Particle Meeting. 16 March 2009.
46 Mathis U., Kaegi R., Mohr M. and Zenobi R. (2004). “TEM Analysis of Volatile Nanoparticles from Particle Trap Equipped Diesel and Direct-Injection Spark-Ignition Vehicles”. Atmospheric Environment, 38:4347-4355.
47 Mathis U., Mohr M., Kaegi R., BErtola A. abd Boulouchos K. (2005). “Influence of Diesel Engine Combustion Parameters on Primary Soot Particle Diameter”. Environmental Science and Technology, 39: 1887-1892.
48 Maricq M. M. and Xu N. (2004). “The Effective Density and Fractal Dimension of Soot Particles from Premixed Flames and Motor Vehicle Exhaust”. Journal of Aerosol Science, 35: 1251-1274.
49 Environmental Protection Agency. Proposed Rules, 40 CFR Part 86. Fed. Regist. 1997, 62, 44753.
50 Hueglin C., Scherrer L., Burtscher H., (1997). “An accurate continuously adjustable dilution system (1:10 to 1:104) for submicron aerosols”, Journal of Aerosol Science, 28 (6): 1049-1055.

42
51 Kasper M., (2004). “The number concentration of non-volatile particles – design study for an instrument according to the PMP recommendations”, SAE Technical Paper 2004-01-0960.
52 Ntziachristos L., Giechaskiel B., Pistikopoulos P., Samaras Z., (2005). “Comparative assessment of two different sampling systems for particle emission type-approval measurements”, SAE Technical Paper 2005-01-0198.
53 Giechaskiel B., Cresnoverh M., Jörgl H. and Bergmann A. (2010). “Calibration and Accuracy of a Particle Number Measurement System”. Measurement Science and Technology, 21 045102 (13pp).
54 Harris S. J. and Maricq M. M. (2001). “Signature size distributions for diesel and gasoline engine exhaust particulate matter”. Journal of Aerosol Science, 32: 749-764.
55 Johnson T. (2010). “Review of Diesel Emissions and Control”. SAE Technical Paper 2010-01-0301.
56 Communication from the commission to the European Parliament, the Council, the European Economic and Social Committee and the Committee of the regions. Analysis of options to move beyond 20% greenhouse emission reductions and assessing the risk of carbon leakage. Brussels, 26.5.2010.
57 Weilenmann M., Soltic P., Saxer C., Forss A.-M. And Heeb N. (2005). „Regulated and Nonregulated Diesel and Gasoline Cold Start Emissions at Different Temperatures”. Atmospheric Environment, 39:2433-2441.
58 Weilenmann M., Favez J.-Y. and Alvarez R. (2009). “Cold-Start Emissions of Modern Passenger Cars at Different Low Ambient Temperatures and their Evolution Over Vehicle Legislation Categories”. Atmospheric Environment, 43: 2419-2429.
59 Mayer A., Czerwinski J., Ulrich A., Wichser A., Kasper M. And Mooney J. (2010). “Metal-Oxide Particles in Combustion Engine Exhaust”. SAE Technical Paper 2010-01-0792.
60 Jeng H.A. and Swanson J. (2006). “Toxicity of Metal Oxide Nanoparticles in Mammalian Cells”. Journal of Environmental Science and Health. Part A: Toxic/Hazardous Substances and Environmental Engineering, 41: 2699-2711.
61 Karlsson H. L., Gustafsson J., Cronholm P. and Möller L. (2009). “Size-dependent toxicity of metal oxide particles—A comparison between nano- and micrometer size”. Toxicology Letters, 188: 112-118.
62 De Filippo A. and Maricq M. M. (2008). “Diesel Nucleation Mode Particles: Semivolatile or Solid?” Environmental Science and Technology, 42: 7957–7962.

43
ANNEX A: PM/PN ANALYTICAL DATA Table 4 provides the detailed mean PM emission values measured at JRC VELA for each vehicle.
Table 4: PM emissions of the tested at JRC vehicles in [mg/km].
Vehicle Test cell temperature [°C] NEDC US06
PFI_E4_1 22 0.61 4.39
-7
PFI_E4_2 22 0.34 0.63
-7
PFI_E5_1 22 0.15
-7
PFI_E5_2 22 0.95
-7 2.04
G-DI_E4_L 22 1.81
-7
G-DI_E5_L 22 3.28
-7 3.35
G-DI_E4_S 22 0.87 0.90
-7
Table 5 provides the detailed mean PN emission values measured at JRC VELA for each vehicle.

44
Table 5: PN emissions of the tested at JRC vehicles in 1010 [#/km].
Vehicle Test cell temperature [°C] NEDC US06
PFI_E4_1 22 3.1 103
-7
PFI_E4_2 22 2.9 25
-7
PFI_E5_1 22 55
-7
PFI_E5_2 22 21
-7 154
G-DI_E4_L 22 341
-7
G-DI_E5_L 22 1380
-7 1640
G-DI_E4_S 22 126 169
-7
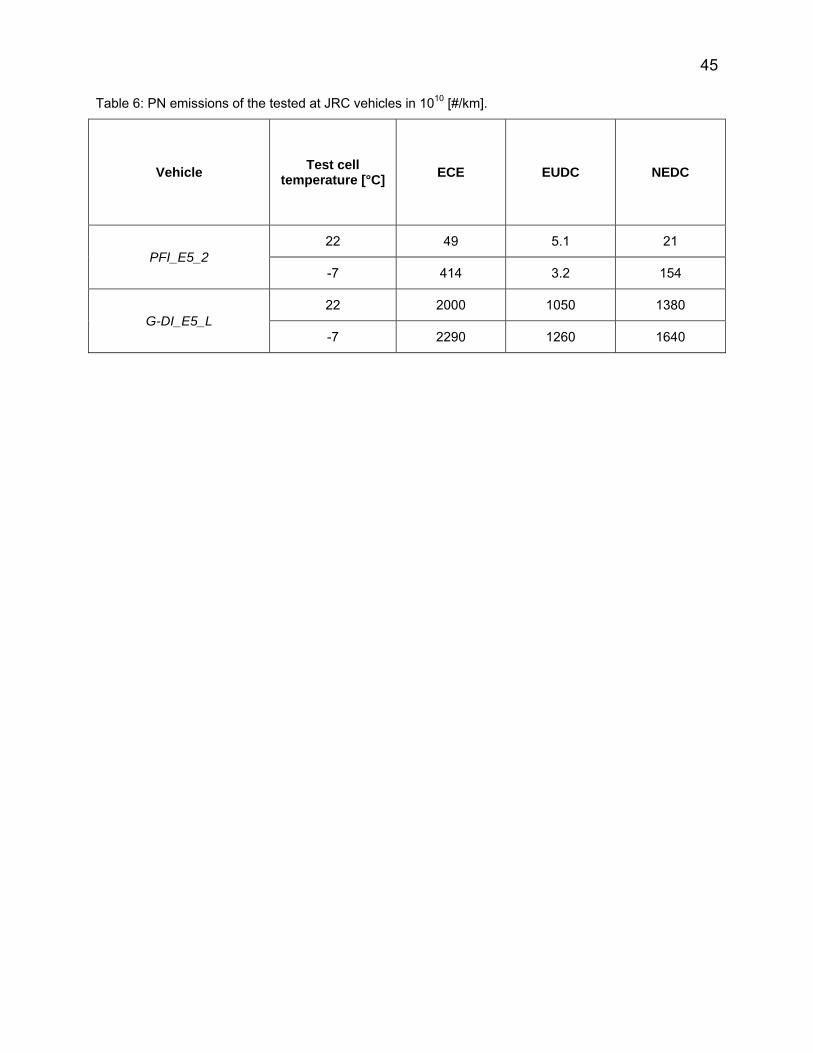
Table 6 provides the detailed mean PN emission values over the ECE, EUDC and NEDC driving cycles for the two vehicles tested at subzero ambient temperature.
45
Table 6: PN emissions of the tested at JRC vehicles in 1010 [#/km].
Vehicle Test cell temperature [°C] ECE EUDC NEDC
PFI_E5_2 22 49 5.1 21
-7 414 3.2 154
G-DI_E5_L 22 2000 1050 1380
-7 2290 1260 1640

46

47
European Commission EUR 25592 – Joint Research Centre – Institute for Energy and Transport Title: Assessment of particle number limits for petrol vehicles Author(s): Athanasios Mamakos, Christos Dardiotis, Giorgio Martini Luxembourg: Publications Office of the European Union 2012 – 47 pp. – 21.0 x 29.7 cm EUR – Scientific and Technical Research series – ISSN 1831-9424 (online), ISSN 1018-5593 (print) ISBN 978-92-79-27354-4 (pdf) ISBN 978-92-79-27355-1 (print) doi:10.2788/66109 Abstract The European Commission Regulations No 692/2008 and No 715/2007 set the regulatory framework for type-approval of motor vehicles with respect to emissions from light passenger and commercial vehicles (Euro 5/6). However, these regulations leave open some issues regarding the Euro 6 emission standards to be addressed and defined before the entry into force of these pieces of legislation. Among them, the Type I test particle number limit for vehicles equipped with Positive Ignition Direct Injection engines should be defined. The Joint Research Centre has carried out a study to support a possible implementation of such a limit for Euro 6 petrol vehicles. The first part of this report provides a review of the particle mass and number emissions of gasoline Port Fuel Injection (PFI) and Gasoline Direct Injection (G-DI) vehicles available in the literature. Over the second part, the particle mass and number emissions from a range of Euro 4 and Euro 5 gasoline vehicle/engine technology measured at JRC are synopsized. The vehicles have been tested over various driving cycles and ambient temperature conditions according to the Particle Measurement Programme (PMP) methodology.

48z
As the Commission’s in-house science service, the Joint Research Centre’s mission is to provide EU policies with independent, evidence-based scientific and technical support throughout the whole policy cycle. Working in close cooperation with policy Directorates-General, the JRC addresses key societal challenges while stimulating innovation through developing new standards, methods and tools,and sharing and transferring its know-how to the Member States and international community. Key policy areas include: environment and climate change; energy and transport; agriculture and food security; health and consumer protection; information society and digital agenda;safety and security including nuclear; all supported through a cross-cutting and multi-disciplinary approach.
LB-NA-25592-EN
-N