assessment of a trap for measuring larval supply of intertidal barnacles on wave-swept, semi-exposed...
TRANSCRIPT
www.elsevier.com/locate/jembe
Journal of Experimental Marine Biology and Ecology
290 (2003) 247–269
Assessment of a trap for measuring larval supply
of intertidal barnacles on wave-swept,
semi-exposed shores
Christopher D. Todd*
Gatty Marine Laboratory, University of St. Andrews, St. Andrews, Fife, Scotland, KY16 8LB, UK
Received 15 February 2002; received in revised form 6 December 2002; accepted 7 February 2003
Abstract
Larval supply and settlement of Semibalanus balanoides (L.) on a semi-exposed wave-swept
shore in E Scotland were assessed by means of a new larval trap design. Two midshore sites were
utilised throughout the peak of the 2001 settlement season (May 11–June 3). Larval supply was
quantified by 176 ml baffled cylinder traps filled with a 4-M killing solution of urea in seawater.
Larval trap washout of urea typically ranged from f 25% per day under minimal wave action to a
maximum of 39% under heavy wave action during an onshore gale. The maximum capture for a
single trap was 334 cyprids over one tide. Significant and consistent positional effects, both on urea
retention and larval capture, were found for replicate traps separated by 9 cm. These indicated fine-
scale variations in hydrodynamic flow and larval supply over the substratum which will have
implications for the quantification of spatial heterogeneity of larval input to the benthos. The
retention of urea and larval capture efficiency generally were not compromised by traps being
serviced daily, as opposed to tidally, except perhaps for captures at very low larval densities. Larval
supply measured on a tidal basis was strongly correlated between sites (r = 0.975), but supply at Site
C was f 5� that at Site T: the reduction at Site T could not be explained by its slightly shorter
immersion time and hence ‘availability’ of cyprids alone. At Site C settlement was quantified for
5� 5 cm quadrats of natural substratum cleared daily. Settlement on these clearances (subject to
possible grazing by limpets) was quantified only from May 20–June 3, after the peak of larval
supply on May 17, and the variation in larval supply explained 65% of the variance in settlement.
The larval supply/settlement relationship at Site T was quantified using grooved acrylic panels. A
high correlation coefficient (0.961) was obtained for the daily supply/settlement relationship for
these panels over the period May 15–June 3, which included the peak of supply. Larval supply
varied up to 15-fold within a site on consecutive tides and up to 100-fold between sites on the same
0022-0981/03/$ - see front matter D 2003 Elsevier Science B.V. All rights reserved.
doi:10.1016/S0022-0981(03)00093-5
* Tel.: +44-1334-463454; fax: +44-1334-463443.
E-mail address: [email protected] (C.D. Todd).

C.D. Todd / J. Exp. Mar. Biol. Ecol. 290 (2003) 247–269248
tide. Although further improvements to both the larval trap and the settlement panels can be made,
this larval trap does appear capable of providing high-resolution data on tidal or daily larval supply
over a wide range of wave conditions and larval concentrations.
D 2003 Elsevier Science B.V. All rights reserved.
Keywords: Cyprid; Larval supply; Panel; Semibalanus balanoides; Settlement; Trap
1. Introduction
The concept of larval supply—as a measure of propagule input—and the relative
importance of pre- and post-settlement processes are pivotal elements of current theory on
population regulation/limitation and community dynamics in marine benthic systems (e.g.
Booth and Brosnan, 1995; Caley et al., 1996; Connolly and Roughgarden, 1998; Menge,
2000; Bradbury and Snelgrove, 2001; Connolly et al., 2001). The pelagic larval stages of
most benthic or demersal species generally are presumed to be passively dispersed in the
water column prior to their acquiring competence to metamorphose (Booth and Brosnan,
1995; Caley et al., 1996). For communities characterised by species with long-lived larvae
the likelihood is, therefore, that local adult reproduction (output) and larval colonisation
(input) will be de-coupled and the populations demographically open. Nonetheless, at
large spatial scales (e.g. 102 km) there may yet be significant stock-recruitment relation-
ships in, for example, coral assemblages (Hughes et al., 2000).
Intertidal barnacles have featured prominently in studies of settlement, recruitment and
larval supply. More than most taxa, barnacles do provide a realistic opportunity of
providing a clear understanding of the interplay between larval supply, larval habitat
selection (in relation to resource [ = space] availability), and juvenile/adult mortality
schedules in determining local population abundances. There are well-documented
negative or detrimental influences of limpet grazers on the recruitment and establishment
of intertidal barnacles (e.g. Branch, 1981; Hawkins, 1983; Hunt and Scheibling, 1997).
Accordingly, and although they may well be representative of successful realised recruit-
ment, counts only of settled barnacle cyprids on otherwise unmanipulated natural substrata
can in some geographic localities (such as the British Isles) be markedly error-prone as
measures of potential input over a given tide. For these reasons, the approach here to
quantifying the larval supply/settlement relationship has involved a small larval trap for
deployment adjacent to artificial panels that are assured to be free of the grazing impact of
limpets. The broader aim of future studies will be that patterns of settlement on panels can
then be appraised together with counts for patches of natural substratum accessible to
grazers, and from which grazers have been excluded.
Bertness et al. (1996) reported wind-driven settlement patterns at Rhode Island, USA.
On a larger spatial and temporal scale Gaines and Bertness (1992) showed that most of the
variation in settlement over a 9-year period in Narragansett Bay, RI, USA was explained
by measures of flushing, and therefore the likely export of larvae from the bay. Such
studies encourage confidence that the supply/settlement relationship is quantitatively
tractable. But in order to ascertain the importance of larval input in determining adult
abundances it is essential to be able to quantify the actual delivery of larvae to the benthos

C.D. Todd / J. Exp. Mar. Biol. Ecol. 290 (2003) 247–269 249
(e.g. Setran, 1992; Gaines and Bertness, 1993; Castilla and Varas, 1998; Noda et al., 1998;
Miron et al., 1999) and on wave swept shores. Larval concentrations in the water column
often have been used as proxies for larval supply (Gaines et al., 1985; Miron et al., 1999;
Snelgrove et al., 1999; Jeffery and Underwood, 2000; Olivier et al., 2000; Ross, 2001;
Pineda et al., 2002) but this approach is incomplete. Larval supply is a flux and depends
not only larval concentration in the water column but also upon water flow over the
substratum (Yund et al., 1991; Gaines and Bertness, 1993) and, for intertidal substrata,
immersion time (Minchinton and Scheibling, 1991): assuming no interfering influence of
larval depletion by settlement (e.g. Satumanatpan and Keough, 2001), a low concentration
can still comprise a high supply under high flow or heavy wave action (Todd, 1998).
Early attempts to quantify barnacle larval supply with passive cylinder traps showed
these to be operationally limited to calm localities with little or no vertical component to
water movement. Moreover they had to be deployed in the sublittoral at several metres
depth and tens of metres distant from the intertidal (Yund et al., 1991; Bertness et al.,
1992; Gaines and Bertness, 1993). This clearly is disadvantageous if consistent and
significant variation in settlement densities is detected on small spatial scales within
shores. Most previously reported larval barnacle trapping rates have been very low (e.g.
V 10 larvae trap� 1 day� 1; Yund et al., 1991; Bertness et al., 1992) in relation to variation
in the densities of settlement. A disadvantage of some traps has been their reliance on
formaldehyde to retain trapped cyprids. Other traps incorporating nets within valved pipes
attached to the shore (Setran, 1992) are effective but may be unreliable under conditions of
heavier wave crash or when subject to clogging. Yet other designs involve some
specialised construction and are bulky (Castilla and Varas, 1998; Jeffery and Underwood,
2000): the latter feature may be especially important to local hydrodynamic flow, though
Jeffery and Underwood (2000) reduced this problem by deploying their traps in crevices.
Suitable crevices may not always be available on a given shore, but considerations of trap
size also raise difficulties of replication over appropriately small spatial scales.
Here a new larval trap design was assessed for use in parallel with adjacent settlement
panels and counts of settlers on natural substrata, as a means of quantifying the supply/
settlement relationship in barnacles on wave-swept shores. The ideal larval trap should be
simple, small, efficient, durable, effective over a wide range of environmental conditions,
cheap, easy to make (and to repair in situ), and easily serviced (perhaps on a tidal basis and
at night) in large replicate numbers. The described trap is a modification of previous
passive cylinder designs and appears to satisfy the above criteria. Most important, this trap
is capable of high-resolution spatial and temporal data on larval supply for intertidal
barnacles over a wide range of larval concentrations and wave conditions on semi-exposed
rocky shores. Wave action, energy dissipation and associated water velocities are physi-
cally complex and extremely difficult to measure (e.g. Elgar et al., 2001), but a simple
integrated index of wave action was required to confirm that the larval traps will operate
over a wide range of wave conditions. An indirect measure of overall wave action each
day was obtained from trapped suspended sand.
The primary objectives were to confirm the reliability of the trap—as a means of
measuring Semibalanus balanoides larval supply within and between sites—and to assess
the utility of acrylic panels for quantifying the supply–settlement relationship. For
practical and logistic reasons most barnacle settlement studies are undertaken on a daily

C.D. Todd / J. Exp. Mar. Biol. Ecol. 290 (2003) 247–269250
basis, but such data may conceal ecologically important tidal variation both in larval
supply and settlement. A priority was the comparison of the tidal vs. daily performance
and reliability of the trap. Differences in larval supply among days during the settlement
season were expected, but for the comparisons of tidal vs. daily emptying regime the null
hypothesis was that there would be no significant difference in trap performance. A clear
alternative was that capture efficiency of daily traps might fall systematically for the
second tide, perhaps due to washout of the urea killing solution during the first tide. For
larval settlement on acrylic panels, the null hypothesis was that plane panels and grooved
panels would be equally attractive settlement substrata: a likely alternative was that
settlement would be significantly enhanced on grooved panels. Moreover, settlement on
horizontally grooved panels might plausibly exceed that on vertically grooved panels. The
latter alternative hypothesis derives from field observations (Hills and Thomason, 1998,
personal observation) of cyprids showing a general net upward movement during
exploration of substrata lacking significant texture.
2. Materials and methods
2.1. Study sites
Larval traps, settlement panels and sediment traps (to provide an indirect measure of
wave action) were placed at two intertidal sites in the Semibalanus balanoides (L.) zone of
the rocky shore at St. Andrews, Scotland (56j21VN 02j45VW; Ordnance Survey grid
reference no. 529 160). Mean and maximum spring tide amplitudes in this locality are 4.8
and 6.0 m, respectively. The 15 km of coastline between St. Andrews and Fife Ness
headland has a NE aspect and is exposed to wind-generated waves from the NNW to ESE:
winds from SSE to WNW are offshore and generate minimal wave action. S. balanoides
are abundant, especially on steep or vertical surfaces, and there are extensive lower
midshore beds of Mytilus edulis (L.). Fucoid macroalgae are common on broken, or more
horizontal, bedrock substrata and the predominant infralittoral kelp is Laminaria digitata
(Huds.) Lamour.
Site C was a vertical rock face projecting f 1.5 m in height from the bedrock and
which faced SW (i.e. upshore). The rock face was emersed on every tide. There were no
major reefs to seaward and although the outcrop was exposed to waves the trap arrays
were protected from direct upshore wave crash by their SW aspect. The rock face was
populated by Littorina spp. and limpets (Patella vulgata L.) and cover of adult S.
balanoides approached 100% at the upper margins of the rock face. Site T also was
populated by limpets and littorinids but was a smaller vertical face of a reef outcrop f 30
m from Site C. The Site T traps and panels were located f 30 cm higher up the vertical
shore profile than at Site C, and faced directly downshore with an unprotected N aspect.
2.2. Larval traps
The trap was a development of the basic cylinder of Yund et al. (1991) but differed in
its size and the inclusion of internal conical baffles. Traps were fabricated from proprietary

C.D. Todd / J. Exp. Mar. Biol. Ecol. 290 (2003) 247–269 251
polypropylene laboratory tissue culture tubes (Cellstark, Product no. 210270; Greiner
Labortechnik, Germany; http://www.greiner-lab.com) of 57 ml capacity and with a conical
bottom surrounded by a skirt extension of the tube wall. Traps of 176 ml volume (Fig. 1)
were constructed from sections cut from four tubes to provide (i) a 57-ml entry chamber,
(ii) an intermediate three-cone baffled section (volume f 39 ml, each baffle separated by
3 cm) and (iii) a basal reception chamber (80 ml) which incorporated the screw-cap for
emptying/resealing the trap in situ. Holes of either 1 cm diameter (uppermost two baffles)
or 0.6 cm diameter (lowermost) were made in the centres of the cones by means of a
heated steel rod. To prevent the trapping of air on refilling, two holes were melted with a
needle through each of the baffles where they adjoin the interior cylinder wall. The cut
edges of the cylinder sections were abraded to a clean right angle finish with a sanding
wheel. This allowed the sections to be tightly abutted flush to one another. All sections
were firmly held together and sealed by their insertion into sections of 2.5 cm inside
diameter, 0.3 cm thick, clear PVC piping which had been softened in hot water. Placement
of the finished article in a freezer at � 20 jC for 20 min tightened and hardened the PVC
sections to provide a rigid leak-proof cylinder.
The trap was of overall dimensions 29 cm height and internal diameter 2.8 cm, resulting
in an aspect ratio of 10.4. Although less than the ratio of 12 for the plain cylinders of Yund
et al. (1991), the inclusion of baffles specifically aimed to (1) stabilize the volume of the
dead space, and (2) to minimize advection of larvae out of the trap by wave washout,
whilst not hindering advection of larvae into the trap. To further minimize advection out of
Fig. 1. Larval trap design (not to scale; see text for measurements and dimensions). Traps were emptied and
refilled in situ by means of the bottom screw cap.
C.D. Todd / J. Exp. Mar. Biol. Ecol. 290 (2003) 247–269252
the trap, a dense killing solution was required. Because the traps were specifically intended
for intertidal deployment, and would be accessible to the public, it was expedient to avoid
formaldehyde. A suitable alternative natural product was provided by a 4-M solution of
urea in seawater. Trap washout was quantified by adding 1 ppt bromophenol blue (BPB)
solution to the 4-M urea stock to provide a working concentration of 10 ppm BPB in the
traps. The concentration of BPB (and thence urea retention) at each emptying was
determined by spectrophotometry (Shimadzu UV-1601; absorbance at 594 nm; seawater
blank).
At Site C larval traps were cable-tied to a clear acrylic mounting plate which itself was
cable-tied to 0.6 cm nylon cords against the barnacle-covered substratum; the cords were
very tightly tied, and applied to, the rock face by means of 5 cm nylon tension rings. The
mounting plate was effectively held firmly against the vertical rock face, without the need
to drill the substratum and to cement securing bolts, by cable-ties to a cord lattice. Bolts
would confer rigidity and place excessive focused stress on the acrylic in heavy wave
action. Movement or flexing of the mounting plate was possible, but minimized. No
mounting plates, traps or settlement panels (Section 2.3 below) were lost or damaged by
wave action.
The Site C trap mounting plate had eight slot positions, each 9 cm apart and each being
occupied by a trap throughout the season. From May 7 to June 3 2001 four replicates were
deployed for continuous data of larval supply to Site C: there were 32 consecutive tidal
observations (May 7–23), followed by 11 daily observations (May 23–June 3) when
larval numbers became low. Although the first settlement of S. balanoides was on April
23, and there was a small but distinct peak of settlement input on May 1, the period May
11–June 3 accounted for 85% of the 2001 season’s settlement at Site C (data not shown).
Within-mounting plate positional effects on the larval capture efficiencies of the replicate
traps were assessed by altering the slot position randomisations. The slot positions
allocated were nos. 2, 4, 7, 8 (May 7–11), 1, 2, 3, 7 (May 11–14) and 1, 3, 5, 7 (May
14–June 3) with the remainder occupied by dummy traps. Because significant and
consistent positional effects were observed, the detailed analyses of the supply/settlement
relationship for Site C were confined to the three replicate traps occupying slot positions 1,
3 and 7 throughout the period May 11–June 3.
Larval capture efficiency was assessed by emptying traps either on a tidal (n = 4
replicate traps) or a daily (n = 4) basis, for five consecutive days (May 17–21) at Site C.
Comparisons were drawn between the daily summed captures for ‘tidal’ traps emptied and
refilled after each tide and ‘daily’ traps emptied and refilled only after two tides.
Spectrophotometry also enabled a comparison of urea retention for the ‘tidal’ vs. ‘daily’
traps in relation to varying levels of wave action.
At Site T lateral space on the vertical rock face was restricted, partly due to the need for
a large backplate to accommodate a mounting plate bearing triplicate settlement panels for
each of three panel treatments (see below). From May 9, duplicate larval traps were cable-
tied to the cord lattice, one at the left and right ends of the backplate. A further pair of
larval traps (separated by 9 cm), providing duplicates at each end of the settlement panel
array, was deployed from May 15 to June 3. Between-site comparisons of urea retention
were undertaken for traps serviced both tidally (13 consecutive tides, May 17–23) and
daily (8 days, between May 24 and June 3). Detailed analyses of the supply/settlement

C.D. Todd / J. Exp. Mar. Biol. Ecol. 290 (2003) 247–269 253
relationship for Site T were confined to cyprid counts for traps (n = 4) deployed for the 17
tidal observations (May 15–23) + 11 daily observations (May 23–June 3).
2.3. Placement of traps and panels, and settlement counts
Settlement panels at Site T were of black acrylic (8� 13� 0.6 cm). Although S.
balanoides will settle on plane acrylic substrata, settlement densities might be expected to
be much enhanced—perhaps up to levels typical of natural substrata—by the inclusion of
grooves on the panels (see also Pineda et al., 2002). Triplicate panels of two grooved
treatments (vertical or horizontal grooves; 0.5 cm wide and 0.1 cm deep) and triplicate
plane (non grooved) panels were allocated randomly to the nine positions on the 84 cm
mounting plate as a horizontal series in portrait orientation, with each separated by a 1-cm
gap. Panel randomisations were changed daily. Between each deployment, panels were
brush-scrubbed in hot freshwater, air-dried, abraded with a manual rotary sander, re-
washed and re-dried. All panels were then painted with an aqueous extract of adult
barnacles and air-dried before deployment. Panels were attached (by a nylon screw and
wing-nut) to a removable clear acrylic mounting plate (84� 24� 0.6 cm), which was itself
cable-tied to a clear acrylic backplate.
As a general protocol the aim was to undertake daily retrieval, counting and redeploy-
ment of panels, but also to obtain in situ counts of cyprids on the panels after the first tide.
From prior experience of likely settlement densities and numbers of cyprids to be counted
after a single tide just 12 cm2 area of groove was included for each grooved panel. For the
horizontal groove treatment, three 8-cm long grooves (2.75, 5.75 and 9.75 cm from the
top edge of the panel) were milled across the width of each panel. To maintain the same
groove length/area as for the horizontal groove treatment, the vertical groove treatment
comprised two grooves each of 12 cm length (2.5 cm in from each long side of the panel),
starting at the upper free edge of each panel but stopping 1 cm from the lower edge of the
panel.
Settlement on the natural rock substratum at Site C was quantified for triplicate quadrats
that straddled the backplate accommodating the traps. Clearances of approximately 7� 7
cm (leaving intact the peripheral barnacles) were made and a 5� 5 cm square was marked
with a fine permanent marker pen. Limpets were cleared to distances of at least 1 m from the
quadrats. Quadrats were scrubbed clean with a toothbrush and clean seawater after each
count. Counts were made tidally between May 20 and May 23 (7 tides) and thereafter daily
until June 3 (11 days). There were no data for May 28. Limpets were found to be occupying
one or more of the quadrats on 4 days and these were removed on each occasion.
2.4. Sediment traps
Sediment traps to provide an integrated index of wave action were constructed from
two Cellstar tubes (total volume 120 ml) with a single cone baffle, including a 0.6 cm
aperture, midway down the trap. Duplicate sediment traps were cable-tied adjacent to the
larval traps at Site C from April 20 to June 3. Sediment traps were refilled with clean
seawater following daily emptying. Retrieved sediment samples were washed through a
50-Am gauze with a soft paintbrush. Drift macroalgal fragments were removed and the

C.D. Todd / J. Exp. Mar. Biol. Ecol. 290 (2003) 247–269254
sand fraction retained on the sieve screen was oven-dried (90 jC, overnight), weighed,ashed (550 jC, 4.5 h) and re-weighed.
Analysis of the effects of variation in the daily wave crash index ( = trapped sediment) on
daily retention of urea by the Site C larval traps (below) was possible for eight days in the
periodMay 23–June 3, when contemporaneous daily sediment and larval trap samples were
obtained. The end of this period included an onshore northerly gale with heavy wave action.
2.5. Wind data
Wind strength (ms� 1; Beaufort scaled) and direction were recorded with a 1-WirekWeather Instrument Kit V3.0 (Tecnologıa Aplicada, Mexico) mounted on the roof of the
laboratory, approximately 500 m from the field sites. From the datalogs the prevailing
wind direction and its median and maximum strength (10 min averages) over the course of
each tidal period were derived.
2.6. Data analyses
All cyprid trap and quadrat counts were log x + 1 transformed prior to regression
analysis or ANOVA. The data for percent urea retention by the traps required angular
transformation. Factorial ANOVA involving multiple observations of, for example, cyprid
counts or urea retention by traps over time dictated that ‘Day’ be included as a random
factor. For comparisons of sediment trap/larval trap emptying frequency (i.e. daily [2 tides]
vs. tidally [1 + 1 tides]), the sampling frequency factor ‘Tides’ was considered fixed.
Comparisons between Sites C and T included Site as a random factor. GLM analyses of
positional effects on trap urea retention and larval captures within the mounting plate
included repeated measures observations for slot positions that are necessarily unreplicated
on any one tide or day. GLM (Slot position, fixed; Day, random) was applied to these data,
but the analysis proceeded to unplanned Tukey multiple comparisons only following
confirmation (by Tukey’s test for nonadditivity; Sokal and Rohlf, 1981; Underwood,
1981) that the differences among means were non-multiplicative and attributable to the
independent effects of the two factors.
Two factor ANOVA revealed, in certain instances, a significant interaction and hence
logically uninterpretable main effects. In these cases the means for each factor were
compared separately for the various levels of the second factor by unplanned comparisons
(SNK tests; Underwood, 1997). This procedure allowed the identification and explanation
of the source of the interaction and thereby the interpretation of the main effects.
3. Results
3.1. Sediment traps: daily vs. tidal emptying regime, Site C
Wave conditions varied markedly over the 5 days of comparison of daily (2 tides) vs.
tidal (1 + 1 tide) sediment trap samples (Fig. 2). Day 1 (April 20/21) followed an extended
period of Beaufort Force 8 N gales and heavy wave action. By Day 2 the wind had backed

Fig. 2. Sediment traps, Site C. Mean ashed weight ( + S.E.) of the sand fractions (particles z 50 Am) taken in traps
emptied tidally and daily over consecutive days, April 20–25 inclusive. Data for the tidally emptied traps on each
day were summed for comparison with those emptied just once daily.
C.D. Todd / J. Exp. Mar. Biol. Ecol. 290 (2003) 247–269 255
to the SW (offshore) and wave action fell quickly. Day 3 had SE/ESE winds at a maximum
of Force 5, with the wind veering to the SW on Day 4. By Day 5 the wind had again
veered to onshore, and from the NE, at a maximum of Force 6. Two-factor ANOVA
confirmed the significant Day effect (F4,34 = 1214.28; p < 0.001) and also that there was no
significant difference (F1,4 = 2.41; p = 0.195) between sediment traps emptied daily, and
those emptied tidally and summed each day. There was no significant interaction between
emptying regime and days (F4,34 = 0.59; p = 0.670). Accordingly, only daily data for
sediment traps were obtained throughout the subsequent settlement season.
3.2. Larval traps: daily vs. tidal emptying regime, Sites C and T
Larval catches at Site C for traps emptied daily were compared with those emptied
tidally, but with their cyprid catches summed, for each of the five analytical days (Fig. 3).
Larval captures ranged over three orders of magnitude. ANOVA (Table 1) showed a
significant interaction between emptying regime and time. The unplanned comparisons
confirmed that there were no significant differences between emptying regimes for Days
1–3 inclusive when larval supply was moderate to high. But for the lowest larval densities
on Days 4 and 5 (Fig. 3) there were significant differences (SNK test) in both directions for
emptying regime, leading to the interaction. Efficiency of the traps generally was not
compromised by their being serviced daily, except perhaps at very low larval densities, but
even then there was a lack of consistency of effect of the emptying regime. The
disproportionate influence of the log transformation on Days 4 and 5 (leading to the

Fig. 3. Larval traps, Site C. Comparison of larval catches ( + S.E.) for traps (n= 4) emptied daily vs. traps (n= 4)
emptied tidally, and for which the two tides’ catches were summed for each day.
C.D. Todd / J. Exp. Mar. Biol. Ecol. 290 (2003) 247–269256
significant interaction), when larval catches were very low, was confirmed by ANOVA of
the untransformed data: the main effect for Day remained significant (F4,30 = 87.72;
p < 0.001) but both emptying regime (F1,4 = 1.78; p= 0.253) and the interaction (F4,30 =
0.07; p = 0.991) were non-significant.
3.3. Larval traps: within-site heterogeneity in larval supply and between-site comparisons
of urea retention, Sites C and T
Positional effects for the eight trap slots on the mounting plate at Site C were suspected.
Fig. 4 shows the percent urea retention and larval captures of three replicate traps deployed
in the same slots (1, 3, 7) over 14 tides, with a fourth trap which was moved from slot 2 to
slot 5 after eight tides. Urea retention by traps here generally was high, varying only from
68% to 77%. Larval captures varied considerably and ranged from means of 41 to 112
Table 1
Larval traps: emptying regime, Site C
Source df SS MS F p
Tides 1 0.008 0.008 0.12 0.748
Day 4 22.145 5.536 317.13 < 0.001
Tides�Day 4 0.260 0.065 3.72 0.014
Error 30 0.524 0.018
Total 39 22.937
ANOVA for cyprid larva captures (log x+ 1) in traps (n= 4) emptied tidally vs. traps emptied daily. The factors
were emptying frequency, i.e. Tides [1 + 1 vs. 2 tides](fixed), and Day (random).

Fig. 4. Larval traps, Site C. Positional effects of percent (F S.E.) urea retention (the inverse of ‘‘washout’’) and
cyprid capture (F S.E.) for replicate traps (n= 4) within the eight-slot mounting plate. Data were collected tidally;
after eight tides the position of one of the traps (in slot 2) was randomly reassigned (to slot 5). Slots 1, 3 and 7
were occupied by traps throughout the period May 12–19, but individual traps were randomly reassigned to those
slots at the May 16 changeover. Upper case letters represent the Tukey groupings from GLM unplanned
comparisons (Tables 2 and 3).
C.D. Todd / J. Exp. Mar. Biol. Ecol. 290 (2003) 247–269 257
larvae trap� 1 tide� 1. There was a clear and consistent overall positional effect on trap
capture performance and a correlation between larval capture rates and urea retention
amongst the traps; on a comparative basis, trap slots 7, 3 and 1 performed very similarly
across both the eight-and six-tide periods. GLM (Tables 2 and 3) showed the very
Table 2
Larval traps: positional effects on trap performance, Site C
Source df Adj SS Adj MS F p
(A) Eight tides, May 12–16; Trap slot positions 1, 2, 3 and 7
Slot position 3 128.189 42.730 35.62 < 0.001
Tide 7 732.589 104.656 87.24 < 0.001
Error 21 25.191 1.200
Nonadditivity 1 3.635 3.635 3.372 > 0.05
Remainder 20 21.556 1.078
Total 31 885.969
(B) Six tides, May 17–19; Trap slot positions 1, 3, 5 and 7
Slot position 3 66.526 22.175 27.10 < 0.001
Tide 5 136.749 27.350 33.43 < 0.001
Error 15 12.273 0.818
Nonadditivity 1 2.328 2.328 3.279 > 0.05
Remainder 14 9.945 0.710
Total 23 215.547
GLM (including Tukey’s test for nonadditivity) for urea retention (arcsine percent) over eight and six tides (Slot
position, fixed; Tide, random). There was no significant nonadditivity, therefore the analysis proceeded to assess
the factor Slot position by Tukey multiple comparison tests. The multiple comparison groupings are included in
upper case on Fig. 4.

Table 3
Larval traps: positional effects on trap performance, Site C
Source df Adj SS Adj MS F p
(A) Eight tides, May 12–16; Trap slot positions 1, 2, 3 and 7
Slot position 3 0.4745 0.1582 20.42 < 0.001
Tide 7 8.9430 1.2776 164.96 < 0.001
Error 21 0.1626 0.0077
Nonadditivity 1 0.0103 0.0103 1.353 > 0.05
Remainder 20 0.1523 0.0076
Total 31 9.5801
(B) Six tides, May 17–19; Trap slot positions 1, 3, 5 and 7
Slot position 3 0.1279 0.0426 6.79 0.004
Tide 5 4.0052 0.8010 127.52 < 0.001
Error 15 0.0942 0.0063
Nonadditivity 1 0.0098 0.0098 1.633 > 0.05
Remainder 14 0.0844 0.0060
Total 23 4.2273
GLM (including Tukey’s test for nonadditivity) for cyprid catches (log x+ 1) over eight and six tides (Slot
position, fixed; Tide, random). Details as for Table 2.
C.D. Todd / J. Exp. Mar. Biol. Ecol. 290 (2003) 247–269258
significant Slot position and Tide main effects both for urea retention and for larval
capture. The inverse relationship between trap urea retention and the index of wave action
for Site C is shown in Fig. 5 for 12 daily larval trappings over the period May 23–June 3.
More comprehensive data (and especially additional observations at moderate to high
wave action) are needed to resolve the fuller detail of the true shape of this relationship.
The highest sediment values here were attributable to Force 8 onshore N gales (April 20,
Fig. 5. Larval traps, Site C. Scatterplot of mean percent urea retention for replicate daily larval traps (n= 4) against
the index of wave action (ashed sand fraction weight; n= 2 traps) at Site C during the period May 23–June 3. The
larval traps are differentiated into two subsets (n= 4 days, closed circles; n= 8 days, open circles) according to the
mounting plate slot positions that they occupied. The heaviest wave action and lowest percent urea retention were
recorded following the Force 8 onshore northerly gale on June 1/2. The bulk of the data were for days of offshore
winds and minimal wave action.

Fig. 6. Larval supply (Sites C, T), index of wave action (ashed sand fraction, Site C) and wind data (maximum
Beaufort strength and predominant direction over each tide from 10 min averages) for May 7–June 3. All error
terms are + S.E. Sediment traps were emptied daily throughout, whereas the larval traps initially were emptied on
a tidal basis, switching to a daily basis from May 23.
C.D. Todd / J. Exp. Mar. Biol. Ecol. 290 (2003) 247–269 259
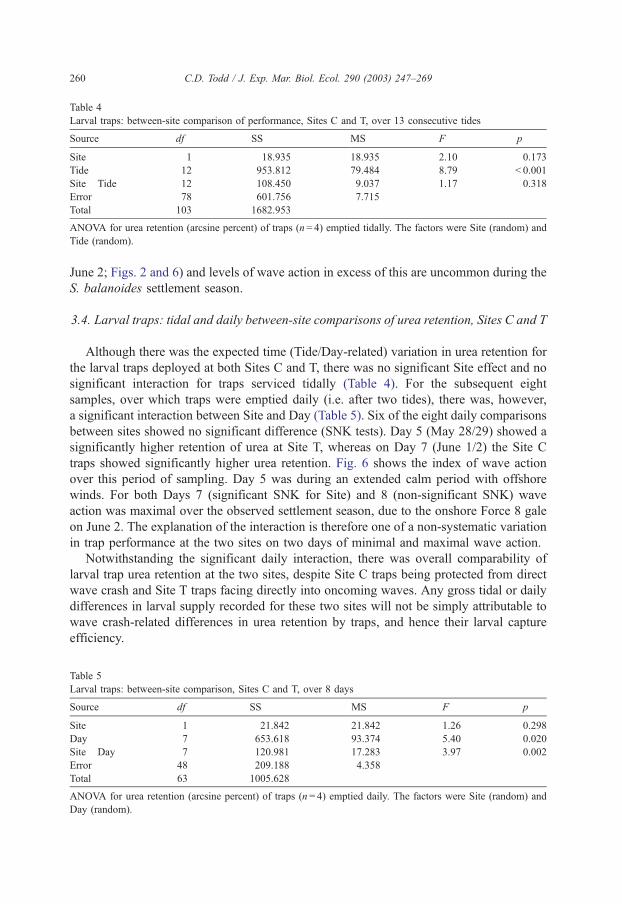
Table 4
Larval traps: between-site comparison of performance, Sites C and T, over 13 consecutive tides
Source df SS MS F p
Site 1 18.935 18.935 2.10 0.173
Tide 12 953.812 79.484 8.79 < 0.001
Site�Tide 12 108.450 9.037 1.17 0.318
Error 78 601.756 7.715
Total 103 1682.953
ANOVA for urea retention (arcsine percent) of traps (n= 4) emptied tidally. The factors were Site (random) and
Tide (random).
C.D. Todd / J. Exp. Mar. Biol. Ecol. 290 (2003) 247–269260
June 2; Figs. 2 and 6) and levels of wave action in excess of this are uncommon during the
S. balanoides settlement season.
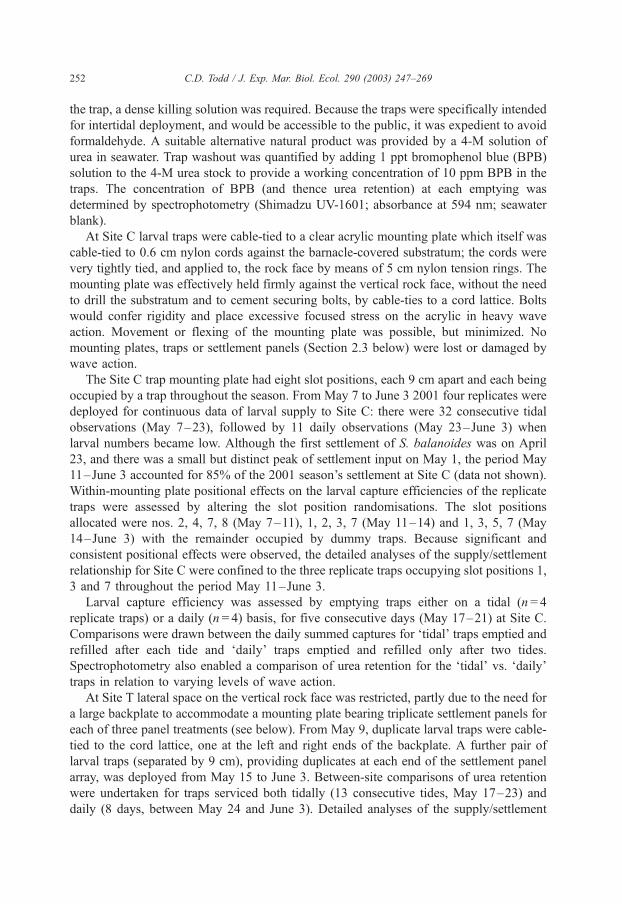
3.4. Larval traps: tidal and daily between-site comparisons of urea retention, Sites C and T
Although there was the expected time (Tide/Day-related) variation in urea retention for
the larval traps deployed at both Sites C and T, there was no significant Site effect and no
significant interaction for traps serviced tidally (Table 4). For the subsequent eight
samples, over which traps were emptied daily (i.e. after two tides), there was, however,
a significant interaction between Site and Day (Table 5). Six of the eight daily comparisons
between sites showed no significant difference (SNK tests). Day 5 (May 28/29) showed a
significantly higher retention of urea at Site T, whereas on Day 7 (June 1/2) the Site C
traps showed significantly higher urea retention. Fig. 6 shows the index of wave action
over this period of sampling. Day 5 was during an extended calm period with offshore
winds. For both Days 7 (significant SNK for Site) and 8 (non-significant SNK) wave
action was maximal over the observed settlement season, due to the onshore Force 8 gale
on June 2. The explanation of the interaction is therefore one of a non-systematic variation
in trap performance at the two sites on two days of minimal and maximal wave action.
Notwithstanding the significant daily interaction, there was overall comparability of
larval trap urea retention at the two sites, despite Site C traps being protected from direct
wave crash and Site T traps facing directly into oncoming waves. Any gross tidal or daily
differences in larval supply recorded for these two sites will not be simply attributable to
wave crash-related differences in urea retention by traps, and hence their larval capture
efficiency.
Table 5
Larval traps: between-site comparison, Sites C and T, over 8 days
Source df SS MS F p
Site 1 21.842 21.842 1.26 0.298
Day 7 653.618 93.374 5.40 0.020
Site�Day 7 120.981 17.283 3.97 0.002
Error 48 209.188 4.358
Total 63 1005.628
ANOVA for urea retention (arcsine percent) of traps (n= 4) emptied daily. The factors were Site (random) and
Day (random).

C.D. Todd / J. Exp. Mar. Biol. Ecol. 290 (2003) 247–269 261
3.5. Larval traps: within and between-site patterns in larval supply, Sites C and T
Larval supply for S. balanoides at Sites C and T, together with the wind observations
and sediment trap data (Site C), are presented in Fig. 6. Larval supply was consistently
approximately five times higher at Site C. This difference cannot be explained by the
slightly shorter immersion periods (and hence reduced larval ‘availability’, sensu Min-
chinton and Scheibling, 1991) for traps at Site T. For the final 13 tides (May 17–23) of the
tidal data set, three of the four larval traps at Site C occupied consistent positions in the
eight slot trap array. For those tides, the correlation in larval supply between Sites C and T
was 0.975 ( p < 0.001), but for the final 11 days (May 23–June 3), when the traps were
emptied daily, this fell to 0.193 (ns). This latter period was, however, one of a generally
very low larval supply, with only the 1 day (at Site C) when the mean exceeded 10 cyprids.
Pooling of the initial tidal data (n = 13) with the later daily data (n = 11) (see Fig. 6)
provided an overall correlation coefficient for supply at Sites C and T over the period May
17–June 3 of 0.969 ( p < 0.001). The consistently lower larval supply at Site T was a real
ecological difference and was not attributable to reduced urea retention, or reduced
efficiency, of the traps at Site T (Tables 4 and 5).
3.6. Larval supply/settlement relationships on natural substrata, Site C
Fig. 7 shows the larval supply/settlement relationship for the traps and 5� 5 cm
quadrats of natural substratum at Site C over the final fortnight of the observed settlement
season. Settlement here was maximally 12.8 cyprids cm� 2 day� 1. Given that the larval
Fig. 7. Mean tidal settlement densities (Site C; n= 3 quadrats; each of 25 cm2 area) of cleared natural substratum
adjacent to triplicate larval traps in relation to larval supply. Small open circles denote tidal data (May 20–23
inclusive), large open circles denote daily data (May 24–June 3) and the large filled circles denote days upon
which limpets were found resident in one or more quadrats. The regression equation ( y=� 2.35 + 21.556x;
r = 0.827, p< 0.001, n= 13) excludes the filled circles.
Fig. 8. Daily mean settlement (F S.E.) of cyprids on triplicate plane, horizontal grooved and vertical grooved
panels at Site T, May 5–June 3 inclusive.
C.D. Todd / J. Exp. Mar. Biol. Ecol. 290 (2003) 247–269262
peak had been passed by May 18, and that larval supply at this late stage was consistently
low, detailed analysis would be inappropriate but in terms of the utility of the trap a clear
supply/settlement relationship was apparent. At least some of these data (four low supply
occasions, Fig. 7 black fill) were affected by limpet grazers, which remained within one or
more quadrats at low tide. The correlation coefficient for the regressions either including
(0.822, p< 0.001; n = 17) or excluding (0.827, p < 0.001; n = 13) the limpet-affected data
were closely similar.
3.7. Larval supply/settlement relationships on panels, Site T
Both the horizontal and vertical grooved panels provided clear and comparable
settlement signals throughout the season. About 97% of the larvae settling on both the
vertical and horizontal grooved treatments settled in the grooves (area 12 cm2), rather than
on the plane areas of the panel surfaces (area 92 cm2), but settlement densities on the
horizontal groove treatment generally exceeded the vertical treatment (Fig. 8). Daily
Table 6
Settlement panels: between-treatment comparisons, Site T, May 5–June 3
Source df SS MS F p
Panel type 2 23.852 11.926 64.00 < 0.001
Day 29 46.012 1.587 48.94 < 0.001
Panel type�Day 58 10.809 0.186 5.75 < 0.001
Error 180 5.835 0.032
Total 269 86.508
ANOVA for cyprids (log x+ 1) settling on triplicate panels of three treatments (plane, horizontal grooved, vertical
grooved). The factors were Panel type (fixed) and Day (random).

Fig. 9. Scatterplot of mean tidal settlement densities per horizontal grooved panel (area 104 cm2) per tide (n= 17)
at Site T, May 15–23, in relation to larval supply. The supply data, as cyprid numbers per trap (n= 4), were for
traps deployed in pairs at either end of the settlement panel array. Regression equation: y=� 1.128 + 2.167x;
r = 0.919, p< 0.001; r2 = 0.845.
C.D. Todd / J. Exp. Mar. Biol. Ecol. 290 (2003) 247–269 263
settlement on all three panel treatments over the 30-day period showed the expected highly
significant main effects and interaction (Table 6), the latter being attributable to the
consistently poor or zero settlement on the plane panels almost irrespective of the variation
in larval supply. Exclusion of the uninformative plane panels from ANOVA confirmed the
superior settlement performance of the horizontally grooved panels over the vertically
grooved panels (F1,29 = 10.63, p = 0.003) and the lack of interaction (F29,120 = 0.98,
p = 0.503) for these two panel types.
Fig. 9 shows the tidal supply/settlement relationship for S. balanoides at Site T
(horizontal grooved panels only) over the peak of the settlement season (May 15–23
inclusive) and the high correlation coefficient. No striking instances of settlement failure
were apparent and a high overall proportion (85%) of the variance in settlement on the
horizontal groove panels was explained by the variation in larval supply over this
period.
4. Discussion
4.1. Tidal vs. daily performance of traps
Although an objective of any analysis of the larval supply/recruitment relationship
for littoral species should be the acquisition of data on a tidal basis, it has to be
acknowledged that for logistic reasons, or for species with extended seasonality of
settlement, it may prove that only daily data are practicable. A priority of the present

C.D. Todd / J. Exp. Mar. Biol. Ecol. 290 (2003) 247–269264
study was confirmation that the traps would provide comparable and reliable data over
either one or two tides deployment (Fig. 3) and under conditions of varying wave
action. Peak larval supply occurred over May 12–19, when the comparative assess-
ment of the performance of the traps on a tidal vs. daily basis was made. Larval
catches fluctuated considerably (Fig. 6) and this period also was one of a wide range
of wave action due initially to sustained onshore (NE) Force 4–5 winds, followed by
an extended run of strong offshore (SW) Force 5–6 winds (Fig. 6). Although more
severe gale force onshore winds and heavy wave action occurred in early June, the
May 12–19 tidal vs. daily data showed generally comparable larval captures over a
wide range of ambient conditions and larval densities. Capture efficiency of the traps
generally was not compromised by their being serviced daily. Although tidal servicing
of traps would be optimal for achieving maximum precision of the data on the supply/
settlement relationship, if only daily servicing were expedient this still will provide a
reliable, integrated measure of larval supply over the two tides in any one day. None
the less, a lack of consistency of performance was shown at very low larval densities
(Fig. 3, Table 1).
4.2. Within and between site tidal variation in larval supply
Consistent differences in season-long larval supply and settlement between sites
separated by tens of metres at the same tidal height probably are typical on broken rocky
shores (e.g. Gaines et al., 1985), but site rankings might switch under particular levels of
wave action, or when waves break from particular directions. The actual causes of the
between-site differences observed here were not of central interest in the present context of
assessing the trap design. Although qualitatively strikingly similar (Fig. 6), quantitatively
there were marked contrasts in supply to these two sites of closely similar tidal height and
separated linearly by only f 30 m. Larval supply varied up to 15-fold between
consecutive tides at Site C (May 16) and such variation will be reduced by almost an
order of magnitude if data are available only from daily trapping of larvae. The
consecutive tides of May 16 p.m./17 a.m. showed an exceptional (30-fold) level of
variation within Site T, due to a virtual absence of larvae trapped (mean 1.8 per trap) on the
p.m. tide (when a mean of 183 cyprids were trapped at Site C; Fig. 6). The May 16 p.m.
tide showed a 100-fold difference in larval supply between sites: that one tide’s larval
supply at Site C accounted for 15% of the recorded season’s input and hence was not
trivial. The ecological relevance of such tidal variations in supply will be particularly
manifest if there are significant tide to tide variations in early survivorship of recruits (e.g.
Hunt and Scheibling, 1997). Density dependent effects, larva–larva interactions and the
ameliorating influences of perhaps excessive levels of wave action, or seasonal variations
in the timing of acquisition of larval metamorphic competence and metamorphic delay
behaviour all will, to some extent, be implicated here. Extreme failures in settlement, and
within-shore spatial variations in larval supply such as the above, are the crux of the
unexplained variation in the supply/settlement relationship. Given the marked between-
cohort differences in early mortality of settled postlarvae noted by Wethey (1986), such
variation also can have clear and immediate implications on the ultimate determination of
local abundances of adults.

C.D. Todd / J. Exp. Mar. Biol. Ecol. 290 (2003) 247–269 265
4.3. The supply/settlement relationship and tidal vs. daily data
Access to only daily (rather than tidal) supply/settlement data will tend to inflate the
coefficient of determination for the supply/settlement relationship and lead to an over-
estimation of the strength of the relationship by concealing marked—and arguably
ecologically important—levels of tide to tide variation. At Site T, for acrylic panels, a
linear regression model gave a high correlation between tidal larval supply and settlement
(May 11–23, r = 0.919; Fig. 9). Collapsing of the initial tidal data set at Site T into daily
measures, and their pooling with the May 23–June 3 daily data yielded an even higher
correlation ( y =� 0.315 + 2.128x; r = 0.961, p < 0.001, n = 20). Whilst an ability to explain
so much of the variance in settlement by variation in larval supply engenders confidence in
the larval trapping protocol, daily data do limit the possibilities of achieving the rather
more important objective of accounting for the unexplained variation, much of which
occurs on a tidal basis (e.g. the p.m. tide of May 16; Fig. 6).
4.4. Trap positional effects on larval captures, Sites C and T
Positional effects on trap retention of urea (Table 2) and larval capture (Table 3; Fig. 4)
arose from unexpectedly small-scale patterns, driven presumably by local variations in
hydrodynamic flow over the vertical substratum. The observed variation may be
artefactual, in being generated by the replicate traps themselves (here separated by 9
cm). More likely, however, these positional effects are due to real, fine-scale hydro-
dynamically driven variations in larval supply to the heterogeneous substratum, although
this remains to be confirmed by further experimental manipulation of the trap array profile
and of trap spacing within a mounting plate. Notwithstanding this requirement, a
comparison of the relative larval capture performances of the duplicate traps (1 and 2)
deployed at Site T, before vs. after the deployment of the additional replicate traps (3 and
4), showed no change in trap performance. There were 12 occasions when traps 1 or 2
caught five or more cyprids; four when only the two traps were present, and eight when
four traps were deployed. There was no significant difference in arcsine larval capture
proportionality for traps 1 and 2 before vs. after deployment of the additional two traps
(t = 1.05, p = 0.298). Assuming that the small-scale variation in larval supply to the
substratum noted at Site C (Fig. 4) is indeed real, this level of heterogeneity will demand
especial consideration in future experimental design in terms of trap replication and their
spatial separation.
4.5. Trap washout and larval capture rates
Although the sediment traps provided a useful index of wave conditions in assessing
trap performance over a range of wave action, these data are limited in their utility and of
comparative value only within a given site locality. Future quantification of wave action
will be by means of autonomous data-logging pressure transducers. An inverse relation-
ship between larval capture and urea retention revealed by the positional analyses (Fig. 4)
indicated that over short periods of heavy wave action a greater proportion of larvae
entering the trap will be advected out before they pass irretrievably to the reception

C.D. Todd / J. Exp. Mar. Biol. Ecol. 290 (2003) 247–269266
chamber. Under such circumstances larval supply will be slightly under-estimated.
Approximately 25% of the urea content of the present design of larval trap is washed
out over one or two tides under minimal levels of wave action (Fig. 5), be those under
calm atmospheric conditions or during periods of strong offshore winds. At the highest
levels of wave action observed over the settlement season (during an onshore Force 8 gale,
June 2; Fig. 6), trap washout of urea peaked at a mean of just 39% (Fig. 5). This latter level
of washout is likely to approximate to the typical maximum during the settlement season
of S. balanoides in E Scotland, although periods of similar strength N/NE winds (and
greater wave action) are possible. The overall pattern was one of increased wave action
leading to increased trap washout, which also correlated with a decreased larval capture
rate (Fig. 4). Clearly, further improvements to the trap design to minimize larval advection
out of the trap can be incorporated, but any alterations to reduce advection losses must also
minimally compromise the entry of larvae into the trap.
4.6. Improvements to panel designs with respect to settlement on natural substrata
Yund et al. (1991) and Bertness et al. (1992) deployed their cylinder traps at 4–5 m
depth and up to 40 m offshore and serviced these fortnightly. Their captures of larvae were
low (V 10 trap� 1 day� 1), although scatterplots of settlement of S. balanoides on trapped
larval supply showed very high correlations and apparent linearity of the supply/settlement
relationship; but the predictive value of a regression of settlement on supply was weak due
to the numbers of cyprids trapped. From Bertness et al. (1992), for example, an increase in
cyprid captures from, say, 4 to 5 larvae per trap per day yielded a predicted increase of
settlement from f 16 to 21 cyprids/cm2 of quadrat/day. The converse problem was
encountered in the present study. Although larval captures commonly were high (peaking
at a tidal mean of 267 cyprids trap� 1; Site C, 17 May), settlement densities on the panels
(but not the rock substratum) generally were low (e.g. Fig. 8).
The grooved panels at Site T were considerably more effective than plane panels as
settlement substrata. May 17 was the highest settlement on the horizontal groove panels at
Site T, with a mean density of 1.2 cyprids cm� 2 of panel tide� 1, or f 10 cyprids cm� 2 of
groove tide� 1. Cyprids exploring the plane surface of these grooved panels evidently can
move considerable distances on their antennules (e.g. Hills et al., 1998), and can migrate
vertically into the grooves, but probably many exploring cyprids relinquished the plane
surface before encountering a groove. The number of grooves here had been restricted to
three to facilitate in situ scoring at night, but evidently will have to be increased in future
studies to ensure ecologically more realistic settlement rates of exploring cyprids.
Settlement data on natural substrata (Site C) and parallel trapped estimates of larval
supply were obtained only after the peak of larval supply (May 17) had passed for the
season. Although of limited extent, the data (Fig. 7) do corroborate the supply/settlement
patterns revealed by the panels at Site T, but it is clear that the present panels provide a
quantitatively inadequate reflection of the densities of natural settlement. The precision of
the data for the supply/settlement relationship on natural substrata potentially obtainable
from the larval traps is none the less apparent (Fig. 7): the expectation is that f 5
cyprids will settle per cm2 of rock for each cyprid trapped per cm2 of the trap entrance
(area 6.15 cm2).

C.D. Todd / J. Exp. Mar. Biol. Ecol. 290 (2003) 247–269 267
4.7. Effects of grazers on quantification of the supply/settlement relationship
Minchinton and Scheibling (1991) showed high correlations between settler density
and recruit density for S. balanoides in Nova Scotia. With the exception of Littorina spp.,
which are not a major source of mortality to post-settlement S. balanoides (Hancock and
Petraitis, 2001), and a low shore acmaeid limpet, settling barnacles in that locality are not
subject to intense post-settlement mortality from molluscan grazers. In NE England, over
the first 5 days post-settlement, Wethey (1986) recorded extremely high early mortality
rates, ranging from 60% (midshore) to 90% (high shore), for S. balanoides cyprids. The
sources of mortality in Wethey’s cleared patches were not specified but it is likely that their
removal by limpets and desiccation effects were major factors.
Other than manual clearances of limpets within f 1 m, no attempt was made here to
prevent access of limpets to the three settlement quadrats. On four occasions limpets were
found residing in one or more of the quadrats (Fig. 7). The possibility remains that limpets
grazed some, or all, of the quadrats to varying extents on each of the other occasions (at
high and/or night time low tide). Settlement rates greater than the foregoing 5:1 ratio might
therefore be expected on ungrazed quadrats. Notwithstanding the potentially severe
detrimental influence of limpet grazing on early recruitment of barnacles in the British
Isles, and the quantitative problems of under-estimation or over-estimation of settlement
input according to the time intervals over which census counts of settlers are made
(Minchinton and Scheibling, 1993), the greater challenge always has lain in the reliable
estimation of larval supply to the substratum. For example, Hawkins and Hartnoll (1982)
recorded a correlation between onshore winds and S. balanoides settlement on two shores
on the Isle of Man. In the absence of independent measures of larval supply one cannot
distinguish between different causations for such pattern. Equally plausible, but funda-
mentally different, explanations of the patterns they noted might include, for example, (i)
onshore winds concentrating larvae over the intertidal substrata, or (ii) higher wave action
( = greater larval encounter of the intertidal substratum) alone leading to an increased larval
supply whilst larval concentration remains unchanged.
Even if realistic, ‘‘grazer-free’’, and appropriately detailed comparative measurements
of natural barnacle settlement are available, there are likely to be important density
dependent interactions between the actual flux of pelagic larvae to the substratum and the
numbers that successfully settle and metamorphose. Final delivery of larvae to the
substratum (or to traps) during heavy wave action may be considered a largely passive
process, but actual choice of settlement site and attachment by barnacle cyprids is far from
passive (e.g. Hills et al., 1998). Variations in larval behaviour, together with environ-
mentally driven physical limitations on settlement (e.g. in extremely high flow), also will
contribute to the typically observed patterns of high spatial and temporal variation of
settlement on the shore (Gaines et al., 1985). The numbers of cyprids settling over a given
tide will not be a simple proportion of those available in the water column, and
superimposed upon this there may be seasonal variations in benthic–pelagic coupling
and specificity of larval responses to settlement cues (e.g. Jarrett, 1997). Ecologically
realistic predictive models (e.g. Roughgarden et al., 1985; Hyder et al., 2001), and a better
understanding of the seasonal, regional and local variations in settlement (e.g. Jeffery,
2000; Menge, 2000)—and thereby population and community dynamics—at particular

C.D. Todd / J. Exp. Mar. Biol. Ecol. 290 (2003) 247–269268
locations perhaps can be best achieved by integrating representative data for larval supply,
rather than larval concentration, with actual observations of settlement.
Acknowledgements
Helen Gurney–Smith and Bob Wilson assisted with aspects of the fieldwork and I am
grateful for their efforts. Two referees made helpful and constructive criticisms of an
earlier draft. [AU]
References
Bertness, M.D., Gaines, S.D., Stephens, E.G., Yund, P.O., 1992. Components of recruitment in populations of the
acorn barnacle Semibalanus balanoides (Linnaeus). J. Exp. Mar. Biol. Ecol. 156, 199–215.
Bertness, M.D., Gaines, S.D., Wahle, R.A., 1996. Wind driven settlement patterns in the acorn barnacle Semi-
balanus balanoides. Mar. Ecol. Prog. Ser. 137, 103–110.
Booth, D.J., Brosnan, D.M., 1995. The role of recruitment dynamics in rocky shore and coral reef fish commun-
ities. Adv. Ecol. Res. 26, 309–385.
Bradbury, I.R., Snelgrove, P.V.R., 2001. Contrasting larval transport in demersal fish and benthic invertebrates:
the roles of behaviour and advective processes in determining spatial pattern. Can. J. Fish. Aquat. Sci. 58,
811–823.
Branch, G.M., 1981. The biology of limpets: physical factors, energy flow, and ecological interactions. Oceanogr.
Mar. Biol. Ann. Rev. 19, 235–380.
Caley, M.J., Carr, M.H., Hixon, M.A., Hughes, T.P., Jones, G.P., Menge, B.A., 1996. Recruitment and the local
dynamics of open marine populations. Ann. Rev. Ecol. Syst. 27, 477–500.
Castilla, J.C., Varas, M.A., 1998. A plankton pump for exposed rocky intertidal shores. Mar. Ecol. Prog. Ser. 175,
299–305.
Connolly, S.R., Roughgarden, J., 1998. A latitudinal gradient in northeast Pacific intertidal community structure:
evidence for an oceanographically based synthesis of marine community theory. Am. Nat. 151, 311–326.
Connolly, S.R., Menge, B.A., Roughgarden, J., 2001. A latitudinal gradient in recruitment of intertidal inverte-
brates in the northeast Pacific ocean. Ecology 82, 1799–1813.
Elgar, S., Raubenheimer, B., Guza, R.T., 2001. Current meter performance in the surf zone. J. Atmos. Ocean.
Technol. 18, 1735–1746.
Gaines, S.D., Bertness, M.D., 1992. Dispersal of juveniles and variable recruitment in sessile marine species.
Nature 360, 579–580.
Gaines, S.D., Bertness, M., 1993. The dynamics of juvenile dispersal: why field ecologists must integrate.
Ecology 74, 2430–2435.
Gaines, S., Brown, S., Roughgarden, J., 1985. Spatial variation in larval concentrations as a cause of spatial
variation in settlement for the barnacle, Balanus glandula. Oecologia 67, 267–272.
Hancock, K.M., Petraitis, P.S., 2001. Effects of herbivorous snails and macroalgal canopy on recruitment and
early survivorship of the barnacle Semibalanus balanoides (L.). J. Exp. Mar. Biol. Ecol. 257, 205–218.
Hawkins, S.J., 1983. Interactions of Patella and macroalgae with settling Semibalanus balanoides (L.). J. Exp.
Mar. Biol. Ecol. 71, 55–72.
Hawkins, S.J., Hartnoll, R.G., 1982. Settlement patterns of Semibalanus balanoides (L.) in the Isle of Man
(1977–1981). J. Exp. Mar. Biol. Ecol. 62, 271–283.
Hills, J.M., Thomason, J.C., 1998. On the effect of tile size and surface texture on recruitment pattern and density
of the barnacle, Semibalanus balanoides. Biofouling 13, 31–50.
Hills, J.M., Thomason, J.C., Milligan, J.L., Richardson, M., 1998. Do barnacle larvae respond to multiple
settlement cues over a range of spatial scales? Hydrobiologia 375/376, 101–111.
Hughes, T.P., Baird, A.H., Dinsdale, E.A., Moltschaniwskyj, N.A., Pratchett, M.S., Tanner, J.E., Willis, B.L.,

C.D. Todd / J. Exp. Mar. Biol. Ecol. 290 (2003) 247–269 269
2000. Supply-side ecology works both ways: the link between benthic adults, fecundity, and larval recruits.
Ecology 81, 2241–2249.
Hunt, H.L., Scheibling, R.E., 1997. Role of early post-settlement mortality in recruitment of benthic marine
invertebrates. Mar. Ecol. Prog. Ser. 155, 269–301.
Hyder, K., Aberg, P., Johnson, M.P., Hawkins, S.J., 2001. Models of open populations with space-limited
recruitment: extension of theory and application to the barnacle Chthamalus montagui. J. Anim. Ecol. 70,
853–863.
Jarrett, J.N., 1997. Temporal variation in substratum specificity of Semibalanus balanoides (Linnaeus) cyprids.
J. Exp. Mar. Biol. Ecol. 211, 103–114.
Jeffery, C.J., 2000. Settlement in different-sized patches by the gregarious intertidal barnacle Chamaesipho
tasmanica Foster and Anderson in New South Wales. J. Exp. Mar. Biol. Ecol. 252, 15–26.
Jeffery, C.J., Underwood, A.J., 2000. Consistent spatial patterns of arrival of larvae of the honeycomb barnacle
Chamaesipho tasmanica Foster and Anderson in New South Wales. J. Exp. Mar. Biol. Ecol. 252, 109–127.
Menge, B.A., 2000. Recruitment vs. postrecruitment processes as determinants of barnacle population abun-
dance. Ecol. Monogr. 70, 265–288.
Minchinton, T.E., Scheibling, R.E., 1991. The influence of larval supply and settlement on the population
structure of barnacles. Ecology 72, 1867–1879.
Minchinton, T.E., Scheibling, R.E., 1993. Variations in sampling procedure and frequency affect estimates of
recruitment of barnacles. Mar. Ecol. Prog. Ser. 99, 83–88.
Miron, G., Boudreau, B., Bourget, E., 1999. Intertidal barnacle distribution: a case study using multiple working
hypotheses. Mar. Ecol. Prog. Ser. 189, 205–219.
Noda, T., Fukushima, K., Mori, T., 1998. Daily settlement variability of the barnacle Semibalanus cariosus:
importance of physical factors and density-dependent processes. Mar. Ecol. Prog. Ser. 169, 289–293.
Olivier, F., Tremblay, R., Bourget, E., Rittschof, D., 2000. Barnacle settlement: field experiments on the influence
of larval supply, tidal level, biofilm quality and age on Balanus amphitrite cyprids. Mar. Ecol. Prog. Ser. 199,
185–204.
Pineda, J., Riebensahm, D., Medeiros-Bergen, D., 2002. Semibalanus balanoides in winter and spring: larval
concentration, settlement, and substrate occupancy. Mar. Biol. 140, 789–800.
Ross, P.M., 2001. Larval supply, settlement and survival of barnacles in a temperate mangrove forest. Mar. Ecol.
Prog. Ser. 215, 237–249.
Roughgarden, J., Isawa, Y., Baxter, C., 1985. Demographic theory for an open marine population with space-
limited recruitment. Ecology 66, 54–67.
Satumanatpan, S., Keough, M.J., 2001. Roles of larval supply and behavior in determining settlement of
barnacles in a temperate mangrove forest. J. Exp. Mar. Biol. Ecol. 260, 133–153.
Setran, A.C., 1992. A new plankton trap for use in the collection of rocky intertidal zooplankton. Limnol.
Oceanogr. 37, 669–674.
Snelgrove, P.V.R., Grassle, J.P., Grassle, J.F., Petrecca, R.F., Ma, H.G., 1999. In situ habitat selection by settling
larvae of marine soft-sediment invertebrates. Limnol. Oceanogr. 44, 1341–1347.
Sokal, R.R., Rohlf, F.J., 1981. Biometry, 2nd ed. Freeman, New York. 859 pp.
Todd, C.D., 1998. Larval supply and recruitment of benthic invertebrates: do larvae always disperse as far as we
believe? Hydrobiologia 375/376, 1–21.
Underwood, A.J., 1981. Techniques of analysis of variance in experimental marine biology and ecology. Ocean-
ogr. Mar. Biol. Ann. Rev. 19, 513–605.
Underwood, A.J., 1997. Experiments in Ecology. Cambridge Univ. Press, Cambridge. 504 pp.
Wethey, D.S., 1986. Local and regional variation in settlement and survival in the littoral barnacle Semibalanus
balanoides (L.): patterns and consequences. In: Moore, P.G., Seed, R. (Eds.), Ecology of Rocky Coasts.
Hodder and Stoughton, Sevenoaks, pp. 194–202.
Yund, P.O., Gaines, S.D., Bertness, M.D., 1991. Cylindrical tube traps for larval sampling. Limnol. Oceanogr. 36,
1167–1177.