assessing us global tax competitiveness after tax … · acquisitions of us companies and...
TRANSCRIPT

Assessing US Global Tax Competitiveness after Tax Reform
Andrew B. Lyon* and William A. McBride
PricewaterhouseCoopers LLP
May 9, 2018
Abstract
This paper assesses the potential impacts of the major corporate tax changes in the 2017 tax
reform act on US competitiveness. Competitiveness is examined in terms of changes in
incentives for US investment, the competitiveness of US-headquartered multinational
corporations, and the locational choice for headquartering US multinational corporations.
US statutory rate reduction brings the corporate rate much closer to the median and average of
other OECD countries and has significantly improved investment incentives in tangible capital in
the US, as measured by marginal and average effective tax rates assuming an average use of debt
and equity. Rate reduction also enhances incentives for undertaking high-return investments in
research and development in the US, as does the special deduction for foreign-derived intangible
income. US research incentives, however, continue to lag behind those available in many other
major countries, taking into account special deductions, tax credits, and patent box regimes.
US international tax reforms bring the US both closer to and further from the tax systems of
other developed countries. While nearly all OECD countries now have participation exemption
systems, the new US global minimum tax is far more expansive than the base protection
measures of other developed countries and results in the current taxation of certain foreign
income previously eligible for deferral under the former US worldwide tax system. The
minimum tax reduces some of the intended competitive improvements of a participation
exemption system, and may result in foreign ownership of US assets continuing to be favored
over US ownership of foreign assets.
Acknowledgements: This draft was prepared for the National Tax Association 2018 Spring Symposium. We thank
Peter Merrill for extensive discussions and comments and Steven Wilber for modeling assistance. Any views
expressed are those of the authors and not those of PwC.
*Corresponding author: [email protected]

I. Introduction
The enactment in 2017 of major tax reform legislation, commonly referred to as the “Tax Cuts
and Jobs Act” (the “Act”), marks the most substantial reform to the US corporate income tax
system since the Tax Reform Act of 1986 and the greatest overhaul of the code’s international
tax provisions since 1962.
The Act is intended by Congress to increase US investment and to allow US multinational
corporations to be more competitive relative to foreign-based companies.1 By increasing US tax
competiveness and other reforms, Congress also intended the Act to reduce tax-motivated
acquisitions of US companies and incentives for US multinationals to move their tax domicile to
a foreign country through a cross-border merger or “inversion.”2
In this paper we analyze the Act’s major corporate tax changes, their effect on US investment
and headquartering incentives, and compare features of the US corporate tax system with those
of other developed countries.3
On many measures the reformed US corporate tax system is seen to make the United States a
much more attractive location for investment, both in absolute terms and relative to many other
countries. The Act significantly reduces both marginal and average effective tax rates on most
types of corporate investment in the United States, especially for equity-financed investments
and those using average debt-equity financing ratios.
The Act’s participation exemption system – considered apart from other international changes –
allows US multinational companies to compete globally on similar tax terms as foreign-based
multinational companies. The Act’s new global minimum tax, however, can be more expansive
than the base protection measures other countries apply to their resident multinational
corporations and, in these instances, makes the US international system less competitive than
many foreign country international tax systems. As a result, while in many cases the Act reduces
the incentives for redomiciliation, foreign tax residency can still remain advantageous.
The global tax environment has been anything but stable since the United States last enacted tax
reform and it remains to be seen the extent to which global changes intensify in response to the
US legislation, including ongoing corporate rate reduction in other countries. It would be
1 See, for example, statements from the Senate Finance Committee’s explanation of the Senate bill: Describing the
corporate rate reduction (p. 109): “The Committee believes that lowering the corporate tax rate is necessary to
ensure domestic corporations remain globally competitive with their counterparts domiciled in the United States’
largest international competitors.” Describing the participation exemption system (p. 353): “The provision would
allow U.S. companies to compete on a more level playing field against foreign multinationals when selling products
and services abroad by eliminating an additional level of tax.” 2 The Senate Finance Committee’s explanation of the Senate bill states (p. 391): “[T]he current U.S. international
tax system makes foreign ownership of almost any asset or business more attractive than U.S. ownership. This
unfairly favors foreign-headquartered companies over U.S. headquartered companies, creating a tax-driven incentive
for foreign takeovers of U.S. firms. Furthermore, it has created significant financial pressures for U.S.-
headquartered companies to re-domicile abroad and shift income to low-tax jurisdictions.” 3 The 2017 Act also made substantial changes to the tax treatment of pass-through businesses, including a new 20-
percent deduction for qualifying pass-through business income. This paper confines its analysis to corporate
business income.

2
expected that these foreign responses will seek to increase the attractiveness of locating
investment abroad and therefore may diminish some of the competitive advantage to US
investments resulting from the Act.
The next section provides a high-level overview of the corporate provisions of the Act. Section
III focuses on the statutory corporate tax rate reduction, section IV examines investment
incentives for tangible capital (equipment, structures, and inventory) as represented by the
effective marginal and effective average corporate tax rates, section V considers investment
incentives for research-based intellectual property, and section VI looks at international tax
changes.
II. Overview of Corporate Provisions in the Tax Cuts and Jobs Act
The 2017 Act substantially reformed tax provisions affecting both individuals and businesses.
The Joint Committee on Taxation (JCT) estimated the Act, ignoring macroeconomic feedback
effects, will reduce combined individual and corporate income tax collections and outlays by
$1.456 trillion dollars over the 10-year budget period 2018-2027.4
JCT does not report the net tax reduction for corporations separately from that of individuals
(including pass-through businesses), but based on CBO estimates, the Act reduced corporate
income tax revenues by less than $400 billion over the 10-year period, or about 10 percent of
CBO’s $3.9 trillion prior law corporate income tax baseline.5 Table 1 reports the major
categories of corporate tax provisions in the Act and their estimated revenue effect, adjusted to
be roughly consistent with CBO’s aggregate estimate for the Act.
Major business provisions affecting corporations include a reduction in the federal statutory
corporate tax rate from 35 percent to 21 percent, immediate full expensing for investment in
equipment through 2022 (and partial expensing from 2023 through 2026), preferential taxation
of certain high-return export income (“foreign-derived intangible income” or “FDII”), repeal of
the corporate alternative minimum tax (AMT), and international reforms providing for a 100-
percent participation exemption (“territorial”) tax system for some foreign earnings while greatly
expanding prior law anti-deferral rules to subject other active foreign earnings to immediate US
taxation by the creation of a global minimum tax (“global intangible low-taxed income” or
“GILTI”).
4 Joint Committee on Taxation, “Estimated Budget Effects of the Conference Agreement for H.R. 1, the Tax Cuts
and Jobs Act,” JCX-67-17, December 18, 2017. 5 CBO reports the combined effect of the 2017 Act, the Bipartisan Budget Act of 2018, and the Extension of
Continuing Appropriations Act was to reduce corporate revenues by $409 billion, excluding macroeconomic
feedback effects and using the same baseline as used by JCT. The latter two laws in total reduced tax revenues by
$34 billion over the 2018-2027 period; we estimate about half of the $34 billion is a reduction in corporate tax
revenue. See CBO, “The Budget and Economic Outlook: 2018 to 2028,” pp. 93-96.

3
Table 1.—Revenue estimates of 2017 Act major corporate categories, 2018-2027
Business tax category
Estimated change
in corporate tax
revenue
($ billions)
21 percent corporate tax rate -$1,348.5
Repeal corporate alternative minimum tax -40.3
Small business reforms -22.1
Cost recovery, etc. 466.1
Business-related deductions 105.4
Accounting methods 12.6
Business credits 32.6
Banks and financial instruments 18.4
Compensation 9.3
Insurance 39.9
Other 4.2
International 324.4
Total corporate provisions -$398.0
Note: Corporate revenue estimates are derived by the authors based on JCT estimates aggregated across all taxpayers and CBO
estimates. JCT revenue estimates are not published by type of taxpayer. Each business tax category in the table may contain
multiple provisions. For example, the category “Cost recovery, etc.” includes revenue losses from 100-percent expensing as well as revenue increases from limits on net interest deductions, limits on net operating losses, and amortization of research
expenses. For a comprehensive list of the provisions within each category, see Joint Committee on Taxation, “Estimated
Budget Effects of the Conference Agreement for H.R. 1, the Tax Cuts and Jobs Act,” JCX-67-17, December 18, 2017.
On a provision-by-provision basis, more than 75 percent of the 10-year corporate revenue loss
from favorable tax changes is offset under the Act by repealing certain prior law tax preferences,
enacting new base broadening provisions, and other revenue raisers applying to corporations.6
These include repeal of the prior law domestic production deduction (Section 199) and new
limitations on interest expense deductions and net operating losses (NOLs). In addition to
GILTI, another base protection measure creates a separate new minimum tax that can impose tax
on certain payments to related foreign parties (“base erosion and anti-abuse tax” or “BEAT”).
Some base broadening provisions are scheduled to become more restrictive over time or are
enacted with a delayed effective date. For example, beginning in 2022 the limitation on net
interest expense is scheduled to switch from a limitation based on 30-percent of a broader
measure of income (comparable to earnings before interest, tax, depreciation and amortization,
or “EBITDA”) to a narrower measure of income (comparable to earnings before interest and tax,
or “EBIT”). In addition, beginning in 2022 the deduction for research expenses is scheduled to
switch from immediate expensing (as codified under Section 174 since 1954) to 5-year
amortization.7
6 This calculation excludes any macroeconomic feedback effects of the provisions. 7 Prior to 1954, expensing of research and experimental expenditures was permitted for tax purposes to the extent
they were ordinary and necessary expenses, and capitalized and amortized otherwise. (Joint Committee on Internal
Revenue Taxation, “Summary of the New Provisions of the Internal Revenue Code of 1954,” February 1955.)

4
One-time tax revenue is raised by imposing tax on foreign earnings on which US tax had been
deferred. The JCT estimated that at the end of 2015, such foreign earnings amounted to
approximately $2.6 trillion.8 The one-time tax, which is payable over eight years, is estimated
by the JCT to raise $338.8 billion over the 10-year budget period.
While most individual income tax provisions of the Act are scheduled to expire after 2025, the
phased-in corporate tax provisions are permanent.
III. Corporate Tax Rate Reduction
The Act lowered the federal corporate statutory tax rate from 35 percent to 21 percent, effective
for 2018. The prior law graduated rate structure was repealed. Accounting for average state
income taxes of 6.1 percent in 2018, the combined federal and state corporate income tax rate is
25.8 percent, a reduction from the 38.9 percent combined rate under prior law.9
The average combined corporate statutory tax rate for the other 34 member countries of the
OECD was 23.9 percent in 2018.10
As shown in Figure 1 (next page), since the enactment of the 1986 tax reform act, there has been
little change in the combined US corporate statutory tax rate.11 In contrast, other OECD
countries embarked on significant ongoing rate reduction since 1986, bringing the average rate
down from 48.1 percent in 1985 to 25.4 percent in 2008, an average decline of just under one
percentage point per year. The average OECD corporate tax rate has declined at a much slower
rate since 2008, possibly due to fiscal pressures of the global recession, declining at an average
rate of less than 0.2 percentage points per year between 2008 and 2017. However, as discussed
in more detail below, even before the enactment of the lower US corporate tax rate, other OECD
countries had enacted rate reductions to take effect after 2017.
8 Letter from Thomas Barthold, Chief of Staff, Joint Committee on Taxation, to House Ways and Means Chairman
Kevin Brady and Ranking Member Richard Neal, August 31, 2016. 9 OECD Tax Database, updated April 2018 http://www.oecd.org/tax/tax-policy/tax-database.htm. 10 Computed from OECD Tax Database. 11 The 1986 tax reform act lowered the top federal corporate tax rate from 46 percent to 34 percent, phased in with a
40 percent rate applying in 1987. In 1993 the federal corporate tax rate was increased from 34 percent to 35 percent.
Minor other variations in the combined corporate tax rate since 1988 reflect small changes in the average state tax
rate as reported in the OECD Tax Database. Data for non-US OECD countries are also as reported in the OECD
Tax Database.

5
Figure 1.—US and average non-US OECD combined (national and subnational) statutory
corporate tax rates, 1981-2018
Source: OECD Tax Database.
In 2017 the 38.9 percent combined US corporate statutory tax rate was the highest among the 35
OECD countries. The new US combined corporate tax rate of 25.8 percent is 14th highest among
the 35 OECD countries (Figure 2). Among G7 countries the US rate is the second lowest, after
the UK’s 19 percent; Canada is third lowest in the G7, with a combined rate of 26.8 percent. The
countries with the lowest OECD tax rates are Hungary at 9 percent (down from 19 percent in
2016), followed by Ireland at 12.5 percent.
Figure 2.— OECD combined (national and subnational) statutory corporate tax rates, 2018
Note: Top combined national and sub-national marginal tax rate of each country, accounting for deductibility of sub-national tax. Estonia’s and Latvia’s 20% tax rate only applies to distributed earnings (with no additional shareholder-level tax); no tax applies to
retained earnings.
Source: OECD Tax Database, April 2018.
The statutory corporate tax rate is important for many economic decisions. It is the tax rate that
applies to an extra dollar of taxable income. At the new combined US tax rate of 25.8 percent, a

6
US company keeps 21 percent more in after-tax profit on an additional dollar of taxable income
than at the former rate of 38.9 percent.12 For multinational corporations, where they choose to
locate their high-return investments may be strongly influenced by the statutory tax rate.13
Contemporaneous with, or prior to the 2017 enactment of US tax reform, many countries had
enacted future (post-2017) corporate tax rate reductions.
As of March 2018, 11 other OECD countries have proposed or enacted corporate tax rate
reductions to take effect in 2018 or later years, and four OECD countries have enacted rate
increases (Table 2). Notably, the two OECD countries with the highest tax rate in 2017 after the
United States – Belgium and France – have already enacted rate reductions that will reduce their
corporate tax rates to 25 percent when fully phased in.
Table 2.—Proposed or enacted OECD corporate rate changes
Country 2017 Rate 2018 or Future
Rate Change Year in Effect
Countries with Rate Reductions
Australia* 30.0% 25.0% -5.0% Phase in 2024-27
Belgium 34.0% 25.0% -9.0% Phase in 2018-20
France 34.4% 25.0% -9.4% Phase in 2020-22
Greece 29.0% 26.0% -3.0% 2019
Israel 24.0% 23.0% -1.0% 2018
Luxembourg 27.1% 26.0% -1.1% 2018
Netherlands* 25.0% 21.0% -4.0% Phase in 2019-21
Norway 24.0% 23.0% -1.0% 2018
Sweden* 22.0% 20.0% -2.0% July 2018
Switzerland (Zurich*) 21.1% 18.2% -2.9% 2019
United Kingdom 19.0% 17.0% -2.0% 2020
United States 38.9% 25.8% -13.1% 2018
Countries with Rate Increases
Korea 24.2% 27.5% 3.3% 2018
Latvia** 15.0% 0% / 20.0% -15.0% / 5.0% 2018
Portugal 29.5% 31.5% 2.0% 2018
Turkey 20.0% 22.0% 2.0% 2018
* Proposed but not enacted rate reductions shown for Australia, Netherlands, Sweden, and Switzerland canton of Zurich.
**Latvia reformed its tax system from a 15% corporate tax rate to a 0% rate for retained earnings and to 20% for distributed earnings.
Note: Rate shown is combined national and sub-national rate. 2018 and future rate changes are those enacted as of March 2018.
Source: OECD Tax Database and PwC.
Some have suggested that tax competition among countries to attract investment will become
more focused in the future around corporate rate reduction as a result of the OECD Base Erosion
and Profit Shifting (BEPS) project that limits the ability of countries to use certain specialized tax
preferences and rulings to attract investment.14
12 (1-.258)/(1-.389). 13 See, for example, Michael P. Devereux and Rachel Griffith, “Evaluating Tax Policy for Location Decisions,”
International Tax and Public Finance (2003). 14 Richard Collier, “Tax Competition, Tax Co-Operation and BEPS,” Journal of Tax Administration (2017).

7
IV. Capital Cost Recovery and Investment Incentives as Measured by Effective
Marginal Tax Rates and Effective Average Tax Rates
In this section we consider how the 2017 Act changes corporate investment incentives for
equipment, structures, and inventory. We assess these by computing effective marginal
corporate tax rates (EMTR) and effective average corporate tax rates (EATR), following the
methodology of Devereux and Griffith.15 The EMTR represents the corporate tax burden on an
incremental break-even investment, while the EATR represents the corporate tax burden on
projects generating economic rents. The EATR may drive the decision of where to place a
specific investment when there is locational choice, while the EMTR may influence the scale of
the investment.
The effective tax rate calculations in this section take into account the changes in corporate
statutory tax rates, the repeal of the Section 199 domestic production deduction, and changes in
depreciation allowances. Both equity and debt finance, and mixes of each, are considered. The
analysis considers only corporate-level income taxes and does not consider taxes at the level of
the shareholder or interest recipient.
Changes to depreciation under the Act
The 2017 Act greatly accelerated capital cost recovery for most equipment by providing for 100-
percent expensing for qualifying assets placed in service on or after September 28, 2017 and
before January 1, 2023.16 After 2022 and before 2027, most equipment is eligible for partial
expensing, with 80-percent expensing for assets placed in service in 2023, 60-percent in 2024,
40-percent in 2025, and 20-percent in 2026.17 After 2026, most assets are to be recovered under
the modified accelerated cost recovery system (MACRS).
Prior to the Act, most equipment qualified for temporary partial expensing. Partial expensing,
also known as “bonus depreciation,” was first enacted in 2002 (retroactive to September 11,
2001) as a temporary measure and since then has been in effect at different rates continuously
except for the years 2005 through 2007 (see Table 3, next page).
A separate expensing provision, Section 179, was expanded to permit the first $1 million of
qualified investment to be expensed (up from $500,000), indexed for inflation. The deduction is
phased out for qualified investment between $2.5 million and $3.5 million (indexed for
inflation). This is a permanent provision.
15 Michael P. Devereux and Rachel Griffith, “Evaluating Tax Policy for Location Decisions,” International Tax and
Public Finance (2003). 16 Qualifying property is generally property with a recovery period of 20 years or less. Certain property with longer
production periods (generally property with a recovery period of at least 10 years or transportation property) is
eligible for full expensing if placed in service on or before December 31, 2023. Property of certain regulated
utilities that elect not to have new interest expense limitations apply is not eligible for expensing. 17 Property with longer production periods is provided an additional year to be placed in service for these partial
expensing percentages.

8
Depreciation rules for residential and non-residential buildings were not changed by the Act,
with minor exceptions.18
As is well known, under a system of permanent full expensing no tax is collected in present
value at the corporate level on an equity-financed investment that earns the break-even required
rate of return – i.e., such an investment has a corporate effective marginal tax rate of zero.
Under temporary expensing, investment incentives for marginal investments can be greater than
under permanent expensing because taxpayers benefit by accelerating planned future investment
from future periods when the investment would no longer qualify for expensing.19
Table 3.—Partial expensing rates, as enacted and superseded by subsequent legislation
Legislation Start Date End Date* Expensing
Percentage
Job Creation and Worker Assistance Act of 2002 9/11/2001 9/10/2004 30%
Jobs and Growth Tax Relief Reconciliation Act of 2003** 5/6/2003 12/31/2004 50%
[not in effect: 2005-2007]
Economic Stimulus Act of 2008 1/1/2008 12/31/2008 50%
American Recovery and Reinvestment Act of 2009 1/1/2009 12/31/2009 50%
Small Business Jobs Act of 2010 1/1/2010 12/31/2010 50%
Tax Relief, Unemployment Compensation
Reauthorization, and Jobs Creation Act of 2010**
9/9/2010 12/31/2011 100%
1/1/2012 12/31/2012 50%
American Taxpayer Relief Act of 2012 1/1/2013 12/31/2013 50%
Tax Increase Prevention Act of 2014 1/1/2014 12/31/2014 50%
Protecting Americans from Tax Hikes Act of 2015
1/1/2015 12/31/2017 50%
1/1/2018 12/31/2018 40%
1/1/2019 12/31/2019 30%
Tax Cuts and Jobs Act of 2017**
9/28/2017 12/31/2022 100%
1/1/2023 12/31/2023 80%
1/1/2024 12/31/2024 60%
1/1/2025 12/31/2025 40%
1/1/2026 12/31/2026 20%
* Certain property with a longer production period is provided an additional year by which it was required to be placed in service.
** Supersedes prior legislation.
Source: Authors.
Provisions of the Act excluded from the effective tax rate computations. Our analysis in this
section does not consider some significant changes of the Act that may have an effect on the
investment incentives of some companies. These include the repeal of the corporate alternative
minimum tax (AMT), new limitations on the deductions of NOLs and net interest expense, the
deduction for FDII, and the international tax reforms, including the 100-percent participation
exemption for some foreign earnings, GILTI, and BEAT.
18 Taxpayers operating real property businesses that elect not to have new interest expense limitations apply must
recover real property using slower alternative depreciation system lives. 19 See Alan J. Auerbach and Kevin Hassett, “Tax Policy and Business Fixed Investment in the United States,”
Journal of Public Economics (1992) and Darrel Cohen, Dorthe-Pernille Hansen, and Kevin Hassett, “The Effects of
Temporary Partial Expensing on Investment Incentives in the United States,” National Tax Journal (2002).

9
The effects of these particular provisions on investment incentives depend on many company-
specific assumptions, including the company’s current and future tax status. In some cases a
change to these provisions may have opposite effects on total tax liability and the incentive to
undertake additional investment. As a result, it is not appropriate to assume the effects of these
provisions on investment incentives can be approximated by the revenue estimate of the
provision.
For example, repeal of the corporate alternative minimum tax necessarily reduces corporate tax
payments of companies that would otherwise have been subject to it, but repeal can also result in
a higher effective marginal and effective average tax rate on incremental investment.20
As another example the new interest expense limitation disallows net interest expense that
exceeds 30 percent of adjusted taxable income, which is measured in a manner similar to
EBITDA from 2018-2021 and EBIT from 2022 onward. Disallowed interest expense is carried
forward indefinitely. A company that envisions itself permanently with excess interest expense
could be viewed as facing a marginal tax rate on incremental profits of 14.7 percent (70 percent
of the federal statutory 21 percent tax rate), since each additional dollar of profit will allow it to
claim 30 cents of suspended interest deductions. This could have the effect of providing an
increased incentive to undertake equity-financed investment than in the absence of the limitation.
Note, however, when adjusted taxable income is defined as EBIT and the limitation is binding,
investments in assets with first-year tax depreciation that is accelerated relative to economic
depreciation are potentially discouraged as additional investment causes EBIT to decline in the
year of the investment and thereby causes a loss of interest deductions (even if the marginal
assets are entirely equity financed).
Similarly, the new limitation on NOLs allows NOLs to offset only 80 percent of taxable income
in a given year and no carryback is permitted. If taxable income is less than 125 percent of the
NOL, the limitation is binding. Unused NOLs may be carried forward indefinitely. In a year in
which the 80-percent loss limitation is binding, incremental profits accelerate the ability to use
NOLs that would otherwise be carried forward, reducing the marginal tax rate below the 21
percent federal statutory tax rate. However, when the limitation is binding, investments in assets
with first-year tax depreciation that is accelerated relative to economic depreciation are
potentially discouraged as additional investment causes taxable income (before NOL) to decline,
causing some NOLs to be carried forward that would otherwise have been utilized.21
20 Under prior law a company permanently on the corporate AMT had a lower EMTR on equity-financed investment
than under the regular tax due to the benefit of the 20-percent AMT rate relative to the slower AMT depreciation
rules. A company can also have a lower EATR on the AMT as profits from a high-return investment would have
been subject to the lower 20-percent AMT rate. Impacts of the AMT vary depending on the initial tax status of the
firm (AMT or regular tax), the length of time in each tax status, and the source of finance. See Andrew B. Lyon,
“Investment Incentives Under the Alternative Minimum Tax,” National Tax Journal (1990). 21 Under prior law, NOLs could be carried back two years and carried forward 20 years and could offset 100 percent
of taxable income. For a consideration of the impact of NOLs on investment incentives under prior law, see Alan J.
Auerbach and James M. Poterba, “Tax Loss Carryforwards and Corporate Tax Incentives,” in The Effects of
Taxation on Capital Accumulation, ed. Martin Feldstein, University of Chicago Press, 1987, and Rosanne Altshuler,
Alan J. Auerbach, Michael Cooper, and Matthew Knittel, “Understanding U.S. Corporate Tax Losses,” in Tax
Policy and The Economy, vol. 23, eds. Jeffrey R. Brown and James M. Poterba, University of Chicago Press, 2009.

10
Effective tax rates: Comparisons with prior law
Effective tax rates are calculated under prior law and new law. As noted above, under prior law
50-percent expensing (bonus depreciation) for equipment was scheduled to phase down in 2018
and 2019, and under the Act expensing is scheduled to phase down between 2023 and 2026.
Calculations below provide two alternative assumptions under prior law, alternatively assuming
50-percent expensing is permanent or assuming no expensing for equipment. Two alternative
assumptions are also provided under the Act, alternatively assuming 100-percent expensing is
permanent or no expensing is permitted for equipment.
The calculations under prior law are based on the 2017 combined US federal and state corporate
tax rate after adjusting for the average domestic production deduction, resulting in a 37.58
percent combined tax rate. Under 2018 law, we hold the average state corporate income tax rate
constant at its 2017 value, and compute the US combined statutory tax rate to be 25.75 percent.
The Appendix provides further detail on assumptions used in the effective tax rate calculations.
Table 4 provides calculations of the EMTR for equity-financed investments earning the break-
even return. Under the Act, full expensing results in an EMTR of zero for equipment, a
reduction from the prior law 13.1 percent rate assuming 50-percent expensing. The effect of the
reduction in the corporate statutory tax rate under the Act (and hence the decline in the combined
federal and state corporate tax rate) can be seen by comparing the EMTR for equipment without
expensing under prior law to that of equipment without expensing under new law. Similarly,
large reductions in the EMTR for structures and inventory reflect the reduction in the corporate
statutory tax rate under the Act (after accounting for the repeal of the domestic production
deduction). The EMTR for structures exceeds the combined statutory corporate tax rate,
signifying that tax depreciation is less accelerated than economic depreciation. The EMTR for
inventory is equal to the combined statutory corporate tax rate under the assumed last-in first-out
method of inventory accounting. The composite category of total corporate capital, reflecting an
aggregate of equipment, structures, and inventory, shows substantial declines in the EMTR.
Table 4.—Effective marginal corporate tax rate for equity-financed investment: Equipment,
structures, inventory, and total
Asset type Prior law EMTR New law EMTR
Assumption: Assumption:
Equipment
With 50% expensing
Without expensing
13.1%
23.2%
With 100% expensing
Without expensing
0.0%
14.8%
Structures 38.9% 26.8%
Inventory 37.6% 25.7%
TOTAL With 50% expensing
Without expensing
32.7%
34.7%
With 100% expensing
Without expensing
20.2%
23.4%
Note: See Appendix for assumptions. Tax rates include federal and state corporate income tax rates (and assume full conformity for depreciation and expensing) and exclude all other taxes. Inventory is assumed to use LIFO. Total capital is a composite of equipment (30.15%), structures
(58.40%), and inventory (11.45%).
Table 5 (next page) provides calculations of the EATR for equity-financed investment
generating economic rents. A pre-tax return of 20 percent is assumed. Since the investment
yields profits greater than the break-even return, full expensing under the Act is not sufficient to

11
offset all tax on the equipment investment. EATRs across asset categories decline by 10 to 12
percentage points under the Act, driven by the decline in the combined federal and state
corporate tax rate net of the repeal of the domestic production deduction.
Table 5.—Effective average corporate tax rate for equity-financed investment: Equipment,
structures, inventory, and total
Asset type Prior law EATR New law EATR
Assumption: Assumption:
Equipment
With 50% expensing
Without expensing
30.5%
32.9%
With 100% expensing
Without expensing
19.3%
22.5%
Structures 38.1% 26.1%
Inventory 37.6% 25.7%
TOTAL With 50% expensing
Without expensing
35.8%
36.5%
With 100% expensing
Without expensing
24.0%
25.0%
Note: See Appendix for assumptions. Tax rates include federal and state corporate income tax rates and exclude all other taxes.
Table 6 shows calculations of the EMTR for debt-financed break-even investments. Because
interest on debt is deducted at the corporate level (including the component of interest reflecting
inflation) and no tax on interest recipients is included in the effective tax rate calculation, break-
even investments are all subsidized under both prior law and the Act and EMTRs are all
negative. The reduction in the corporate statutory tax rate under the Act has the effect of
reducing the subsidy to marginal debt-financed investment, raising the EMTR (resulting in a less
negative EMTR).
Table 6.—Effective marginal corporate tax rate for debt-financed investment: Equipment,
structures, inventory, and total
Asset type Prior law EMTR New law EMTR
Assumption: Assumption:
Equipment
With 50% expensing
Without expensing
-219.3%
-115.4%
With 100% expensing
Without expensing
-93.3%
-44.6%
Structures -25.4% -13.2%
Inventory -30.9% -15.7%
TOTAL With 50% expensing
Without expensing
-54.4%
-44.2%
With 100% expensing
Without expensing
-29.7%
-21.5%
Note: See Appendix for assumptions. Tax rates include federal and state corporate income tax rates and exclude all other taxes.
Table 7 (next page) shows calculations of the EATR rate for debt-financed investment
generating economic rents. The EATRs are all positive under both prior law and the Act.
Despite the subsidy to marginal break-even debt-financed investments, for investments with
profits sufficiently greater than the break-even return, positive amounts of tax are paid. The Act
reduces the EATR by 6 to 8 percentage points across asset categories, somewhat less than found
for equity-financed investments.

12
Table 7.—Effective average corporate tax rate for debt-financed investment: Equipment,
structures, inventory, and total
Asset type Prior law EATR New law EATR
Assumption: Assumption:
Equipment
With 50% expensing
Without expensing
17.5%
19.8%
With 100% expensing
Without expensing
10.3%
13.6%
Structures 25.0% 17.1%
Inventory 24.5% 16.8%
TOTAL With 50% expensing
Without expensing
22.7%
23.4%
With 100% expensing
Without expensing
15.1%
15.5%
Note: See Appendix for assumptions. Tax rates include federal and state corporate income tax rates and exclude all other taxes.
Table 8 provides calculations of the EMTR for investment financed with a mix of equity (68
percent) and debt (32 percent).22 The Act reduces effective marginal tax rates for all assets, but
by slightly less than found for entirely equity-financed investments.
Table 8.—Effective marginal corporate tax rate for debt/equity mix financed investment:
Equipment, structures, inventory, and total
Asset type Prior law EMTR New law EMTR
Assumption: Assumption:
Equipment
With 50% expensing
Without expensing
-13.2%
3.3%
With 100% expensing
Without expensing
-18.3%
1.9%
Structures 26.9% 17.5%
Inventory 25.0% 16.1%
TOTAL With 50% expensing
Without expensing
17.9%
20.8%
With 100% expensing
Without expensing
9.0%
13.2%
Note: See Appendix for assumptions. Tax rates include federal and state corporate income tax rates and exclude all other taxes.
Finally, Table 9 provides calculations of the EATR for investment financed with a mix of equity
and debt. The Act reduces effective average tax rates for all assets by about 10 percentage
points.
Table 9.—Effective average corporate tax rate for debt/equity mix financed investment:
Equipment, structures, inventory, and total
Asset type Prior law EATR New law EATR
Assumption: Assumption:
Equipment
With 50% expensing
Without expensing
26.4%
28.7%
With 100% expensing
Without expensing
16.4%
19.7%
Structures 33.9% 23.2%
Inventory 33.4% 22.9%
TOTAL With 50% expensing
Without expensing
31.6%
32.3%
With 100% expensing
Without expensing
21.1%
22.1%
Note: See Appendix for assumptions. Tax rates include federal and state corporate income tax rates and exclude all other taxes.
22 We use the same financing ratio as assumed by Congressional Budget Office, “Taxing Capital Income: Effective
Marginal Tax Rates Under 2014 Law and Selected Policy Options,” December 2014, p. 46.

13
Effective tax rates: Comparisons with other countries
In this section we compare the EMTR and EATR for 47 countries: the United States and 46 other
developed and emerging economies for which the necessary data are available.23 Calculations
for the United States are under both prior law and the Act (with and without 50-percent
expensing under prior law and with and without 100-percent expensing under the Act), while tax
parameters for all other countries are for 2017.
Figure 3 compares EMTRs for the composite category of total corporate capital, reflecting an
aggregate of equipment, structures, and inventory, assuming a mix of 68 percent equity finance
and 32 percent debt finance.
Figure 3.—Cross-country comparison of effective marginal corporate tax rates
Note: EMTR for a composite investment in equipment, structures, and inventory, financed with 68 percent equity and 32 percent debt. Includes
only corporate-level income taxes (combined federal and sub-federal). Estonia EMTR is zero. Negative EMTRs for Turkey (-17.6%) and Belgium
(-0.4%) are a result of the allowance for corporate equity (ACE) and an assumed 2 percent rate of inflation. 2017 tax parameters are used for all
countries other than the United States under the Act.
23 The 47 countries are 34 OECD countries (all except Latvia), all G20 countries (which adds eight non-OECD
countries: the BRICS (Brazil, Russia, India, China, and South Africa), and Argentina, Indonesia, and Saudi Arabia),
three EU countries not in the OECD (Bulgaria, Croatia, and Romania), and Serbia and the Ukraine.
0% 5% 10% 15% 20% 25% 30%
Argentina
JapanUSA2017-0%
New Zealand
ChileBrazil
Germany
UK
USA2017-50%
IndiaGreece
Mexico
Spain
Norway
Indonesia
SerbiaAustria
USA2027
Australia
Poland
China
France
Saudi Arabia
Canada
Luxembourg
Denmark
ItalyNetherlands
Sweden
Portugal
USA2018-100%
Slovenia
FinlandIceland
Israel
Romania
South Africa
SwitzerlandRussia
Ireland
Czech Republic
Hungary
Korea
UkraineCroatia
Slovakia
Bulgaria
Estonia
BelgiumTurkey
US 2018 law, with 100% expensing
US 2027 law, no expensing
US 2017 law, 50% expensing
US 2017 law, no expensing
14
Under prior law the US EMTR of 17.9 percent (shown in Table 8, assuming 50-percent
expensing for equipment) ranked eighth highest of the 47 countries. Without expensing, the US
EMTR of 20.8 percent under prior law ranked third highest of all 47 countries.
Under the Act, with 100-percent expensing for equipment, the US EMTR of 9.0 percent ranks
28th highest of the 47 countries. Among the 33 other OECD countries included in the
calculations, 12 countries have lower EMTRs and 21 have higher rates. The unweighted average
of the other 46 countries’ EMTR is 10.5 percent.
In 2027 after expensing is scheduled to be phased out, the US EMTR of 13.2 percent ranks 16th
highest of the 47 countries (assuming 2017 rates for all other countries).
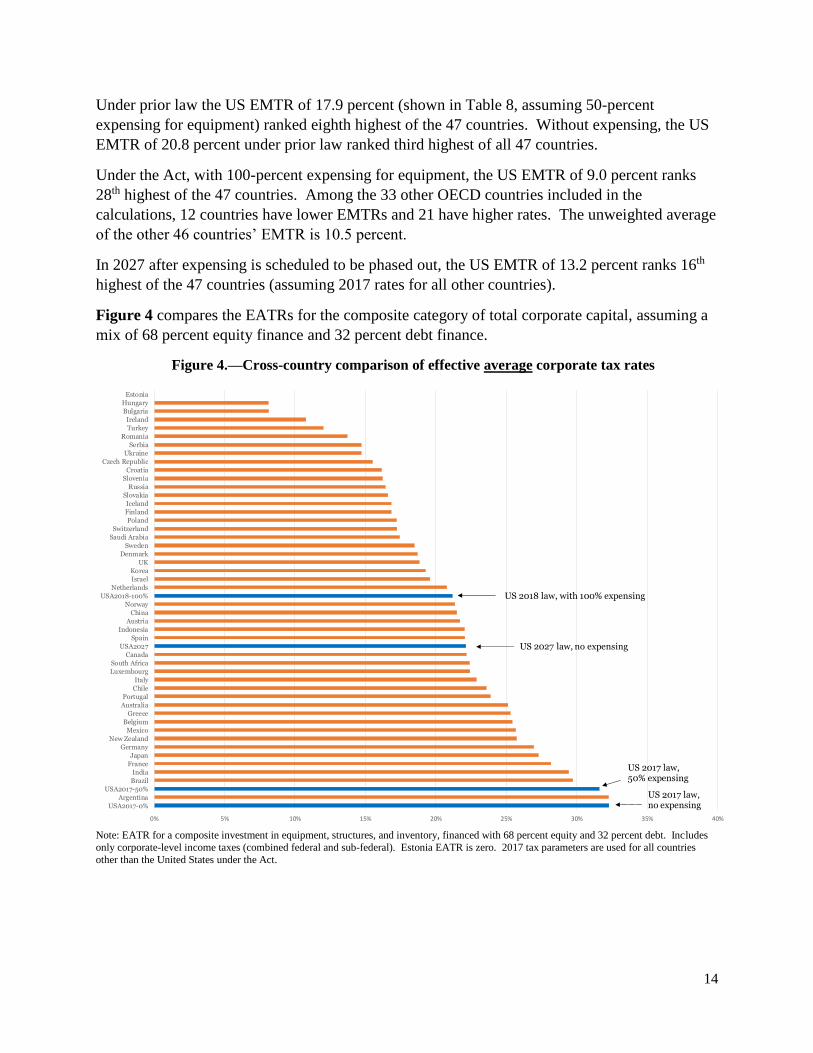
Figure 4 compares the EATRs for the composite category of total corporate capital, assuming a
mix of 68 percent equity finance and 32 percent debt finance.
Figure 4.—Cross-country comparison of effective average corporate tax rates
Note: EATR for a composite investment in equipment, structures, and inventory, financed with 68 percent equity and 32 percent debt. Includes
only corporate-level income taxes (combined federal and sub-federal). Estonia EATR is zero. 2017 tax parameters are used for all countries
other than the United States under the Act.
0% 5% 10% 15% 20% 25% 30% 35% 40%
USA2017-0%
Argentina
USA2017-50%
Brazil
India
France
Japan
Germany
New Zealand
Mexico
Belgium
Greece
Australia
Portugal
Chile
Italy
Luxembourg
South Africa
Canada
USA2027
Spain
Indonesia
Austria
China
Norway
USA2018-100%
Netherlands
Israel
Korea
UK
Denmark
Sweden
Saudi Arabia
Switzerland
Poland
Finland
Iceland
Slovakia
Russia
Slovenia
Croatia
Czech Republic
Ukraine
Serbia
Romania
Turkey
Ireland
Bulgaria
Hungary
Estonia
US 2018 law, with 100% expensing
US 2027 law, no expensing
US 2017 law, 50% expensing
US 2017 law, no expensing
15
Under prior law the US EATR of 31.6 percent (assuming 50-percent expensing) ranked second
highest of the 47 countries, exceeded only by Argentina.24 Without expensing, the US EATR of
32.3 percent under prior law ranked highest of all 47 countries. The unweighted average of the
other 46 countries’ EATR is 19.8 percent.
Under the Act, with 100-percent expensing, the US EATR of 21.1 percent ranks 23rd highest of
the 47 countries, placing it close to both the mean and the median EATR of the other countries.
Among the 33 other OECD countries included in the calculations, 17 countries have lower
EATRs and 16 have higher rates.
In 2027 after expensing is scheduled to be phased out, the US EATR of 22.1 percent ranks 18th
highest of the 47 countries.
In summary, the calculations in this section show that the Act enhanced the relative
attractiveness of representative corporate investments in the United States, bringing US effective
tax rates from among the highest to below the average and median EMTR and near the average
and median for the EATR.
Future reforms by other countries will likely diminish the relative US advantage. For example,
based on France’s 25-percent corporate tax rate to take effect in 2022, its EATR will decline
from 28.2 percent to 20.5 percent, even lower than the current US composite EATR of 21.1
percent (22.1 percent after 2026).
V. Incentives for Research-based Intellectual Property
In this section we examine the effect of the Act on incentives for research and development
(R&D) investments.
Investments in R&D are noted as a key contributor to economic growth. While private returns to
these investments are often high, the social returns to these investments are estimated to be
substantially greater, often two to three times greater. This is because it is difficult to confine the
know-how gained by R&D investments to the company undertaking the investment, resulting in
spillover benefits to other companies and consumers. For example, based on a survey of
economic research, Bureau of Economic Analysis authors conclude that the private return to
R&D investments averages 26 percent but the social return averages 66 percent.25 A Bureau of
Labor Statistics study draws similar conclusions.26
We consider changes in R&D investment incentives under the Act on both “marginal” break-
even R&D investments and R&D investments generating rents. As with the effective tax rate
24 In 2017, Argentina’s statutory corporate tax rate was 35 percent. Argentina has enacted a rate reduction to 30
percent for 2018 and 2019, and 25 percent after 2019. 25 These measures are gross of depreciation. See, Sumiye Okubo, Carol A. Robbins, Carol E. Moylan, Brian K.
Sliker, Laura I. Schultz, and Lisa S. Mataloni, “R&D Satellite Account: Preliminary Estimates,” Bureau of
Economic Analysis/National Science Foundation, September 2006, pp. 26-27. 26 This study finds private returns average 25 percent and social returns average 65 percent, gross of depreciation.
See, Lew Sveikauskas, “R&D and Productivity Growth: A Review of the Literature,” US Bureau of Labor Statistics,
Working Paper 408, September 2007.

16
calculations for tangible capital in the section IV, income generated by the R&D investments is
assumed to be taxed at the combined federal and state statutory corporate tax rate.27
We also explore a new special tax regime provided under the Act, the deduction for FDII, and
compare it to patent box regimes available in some other countries that tax qualified IP income at
preferential tax rates.
Marginal investment incentives for R&D
In these calculations we consider a stylized R&D investment project and assess the tax incentives
provided for a “break-even” project. Wages and supplies constitute 90 percent of the investment
expenditure (in present value), and it is assumed these expenditures are qualified research
expenses for purposes of the research credit.28 Depreciable equipment and structures each
constitute 5 percent of the cost of the investment project (in present value).
The initial impact of the Act on investment incentives is from the reduction in the statutory
corporate tax rate and, for 5 percent of the project expenditure, expensing provided for
equipment. Starting in 2022 the Act requires the amortization of research expenditures over a 5-
year period. Amortization applies to both the 90 percent of the costs of the stylized investment
project that would otherwise be expensed, as well as to the depreciation allowances for property
used in connection with research and experimentation. In the latter case, the depreciation
allowance that would otherwise be taken must be further amortized over 5 years.
The OECD has used the “B-index,” a transformation of the Hall-Jorgenson cost of capital, as a
measure for comparing the degree to which R&D investments are tax subsidized. The standard
formula for the cost of capital net of depreciation is:
𝜌 = [𝑟 + 𝛿]1 − 𝑘 − 𝛼𝑢𝑍
1 − 𝑢− 𝛿
where r is the discount rate, δ is the rate of economic depreciation, k is the research tax credit, α
is the basis adjustment for the tax credit, u is the statutory corporate tax rate, and Z is the present
value of expensing or amortization and depreciation allowances.
The B-index is simply the portion of the cost of capital formula representing the after-tax
acquisition cost of the asset (net of investment tax credits and depreciation allowances) over the
net of tax return on a dollar of pre-tax profit:
1 − 𝑘 − 𝛼𝑢𝑍
1 − 𝑢
This can also be interpreted as the after-tax acquisition cost of the asset relative to that of an asset
that may be expensed.
27 The US federal statutory tax rate under 2017 law is adjusted for the average domestic production deduction. 28 We assume an average effective research credit rate of 7.6 percent (before basis adjustment). The credit rate is
similar to that calculated by the Office of Tax Analysis, US Department of the Treasury, “Research &
Experimentation Tax Credit,” October 12, 2016.

17
When B is equal to 1, for example, with expensing and no tax credit, the cost of capital net of
depreciation is simply the discount rate and the METR is equal to zero. For B less than 1 (as
occurs with expensing and a tax credit), the cost of capital is less than the discount rate,
indicating a marginal investment is tax subsidized (METR is negative).
The generosity of incentives can be measured by 1 minus the B-index, where a value of 1
indicates the tax subsidy at the margin is equal in present value to the cost of the investment (full
government subsidy), a value of zero corresponds to a zero METR, and a negative value
corresponds to tax treatment less generous than expensing.
Figure 5 (next page) compares this measure (1 minus B-index) for the United States and 37
other major countries.29 We compute measures for the United States under three alternative
assumptions: 2018 law (100-percent expensing of current research expenditures and equipment),
2027 law (5-year amortization of research expenditures), and a hypothetical 2027 law that
assumes the expensing for current research expenses (wages and supplies) is maintained but the
expensing of equipment expires as scheduled under current law.
As computed by the OECD, the United States ranked 32nd out of the 38 countries in 2017 in
terms of the generosity of R&D tax incentives, with a subsidy rate of less than 5 percent. The
countries with the most generous incentives, Portugal and Spain, subsidize more than 35 percent
of the cost of R&D investments. The mean subsidy rate of the 37 countries excluding the United
States is 14 percent.
Under the 2018 law the US rank improves slightly to 30th. Under 2027 law providing for 5-year
amortization of research expenses, the US rank declines back to 32nd of the 38 countries and the
measure turns negative, indicating that the combined incentive provided by the research credit,
amortization, and depreciation is less generous than immediate expensing of all research costs.
The other 37 countries all provide for expensing of current research costs (wages and supplies).
None of the other six countries with a negative measure provide a research tax credit for profit-
making companies.30
Finally, under the hypothetical 2027 law under which the expensing of research expenses is
maintained but the expensing for equipment expires, the US rank is 30th, just slightly less
generous than found under 2018 law.
29 The non-US calculations are as reported by the OECD with values from http://dx.doi.org/10.1787/888933619448.
Further details are available in OECD, “OECD Review of National R&D Tax Incentives and Estimates of R&D Tax
Subsidy Rates, 2017,” April 2018. US values are computed by the authors. The value we compute for the United
States under 2017 law is slightly more generous than computed by the OECD. 30 Denmark and New Zealand provide a research tax credit for companies in a loss position. OECD, “OECD
Review of National R&D Tax Incentives and Estimates of R&D Tax Subsidy Rates, 2017,” April 2018.

18
Figure 5.—Cross-country comparison of R&D tax incentives, 1 minus B-index, 2017
For large, profit-making companies
Source: OECD, “OECD Review of National R&D Tax Incentives and Estimates of R&D Tax Subsidy Rates, 2017,” April 2018, for all non-US measures and author calculations for US measures.
Effective average tax rates for R&D investments
The B-index calculations provide a measure of investment incentives for marginal break-even
R&D investments. They do not, however, provide an adequate measure of the incentive to locate
a high-return research project in one country versus another. Given the high private rate of
return to R&D investments observed in prior economic studies, and the significant amount of
R&D conducted by multinational corporations, the EATR for these projects may be very
important in companies’ locational decisions for R&D projects.31
EATRs for the United States are shown in Table 10 (next page) for 2017 law, 2018 law (100-
percent expensing of research expenditures and equipment), 2027 law (5-year amortization of
research expenditures), and a hypothetical 2027 law that assumes the expensing of research
expenses is not replaced with 5-year amortization and the expensing of equipment expires as
31 US parent companies of US-headquartered multinational corporations accounted for 80 percent of US business
R&D in 2015. See, Bureau of Economic Analysis, “Activities of U.S. Multinational Enterprises in 2015,”
December 2017, and National Science Foundation, “2015 US R&D Expenditures,”
https://www.nsf.gov/statistics/2018/nsf18306/.

19
scheduled under current law. The project is assumed to be financed with a mix of equity (68
percent) and debt (32 percent).32 As before, the R&D project is assumed to consist of
expenditures on wages and supplies that are qualified research expenses for purposes of the
research credit (90 percent), equipment (5 percent), and structures (5 percent).
The EATR assumes the combined federal and state corporate tax rate, and does not account for
the new law deduction for FDII.33
Table 10.—Effective average corporate tax rate for debt/equity mix financed R&D investment
Asset type Prior law EATR New law EATR
Assumption: Assumption:
R&D project
With 50% expensing
Without expensing
20.7%
20.8%
With 100% expensing for
research expenditures and
equipment (2018 law)
With 5-year amortization
and without expensing for
equipment (2027 law)
With 100% expensing for
research expenditures and
no expensing for
equipment (hypothetical
2027 law)
11.7%
15.8%
11.8%
Under the Act the EATR for R&D projects financed with an average mix of equity and debt
declines from 20.7 percent in 2017 to 11.7 percent in 2018. Virtually the entire reduction in the
EATR in 2018 is due to the reduced federal corporate tax rate (as opposed to the expensing
provided for equipment).
If research expenditures must be amortized (as scheduled to take effect beginning in 2022) and
no expensing is provided for equipment investment (as occurs after the phase-out is compete in
2027), the EATR is 15.8 percent, about 5 percentage points less than under 2017 law. The
requirement of 5-year amortization for R&D is roughly equivalent to raising the US federal
corporate tax rate from 21 percent to 27 percent (raising the combined corporate statutory tax
rate to over 31 percent).
As can be seen by the comparison to the EATR for the hypothetical 2027 law (under which
expensing is maintained for research expenditures but no expensing is provided for equipment),
nearly all of the incentive provided under 2018 law can be maintained by not requiring 5-year
amortization of R&D investments.
32 As in the effective tax rate calculations for tangible capital in section IV, it is assumed the limitation on net
interest expense is not binding. 33 The US federal statutory tax rate under 2017 law is adjusted for the average domestic production deduction.
20
Foreign-derived intangible income and patent box regimes
The Act provides a lower tax rate for FDII, achieved by a special deduction. The lower tax rate
for this income has some similarities, but also differences, to patent box regimes offered by some
other countries for certain intellectual property (IP) income. The FDII deduction is intended by
Congress to compete with these patent box regimes.34
The basic concept of the FDII deduction is to encourage undertaking IP and other high-return
investments in the United States by offering a lower tax rate on the portion of the income derived
from these investments on products and services provided to foreign customers. This might
constitute a class of highly mobile investments that otherwise could be attracted abroad by much
lower foreign tax rates.
The calculation of the FDII deduction requires several steps. First, “deemed intangible income”
is determined by subtracting a 10-percent return on qualified business asset investment (the
adjusted basis on tangible depreciable property, determined by applying the alternative
depreciation system) from “deduction eligible income,” a concept similar to taxable income but
excluding certain foreign income and domestic oil and gas income. Next, FDII is the product of
deemed intangible income and the fraction “foreign-derived deduction eligible income” (defined
as deduction eligible income derived from the sale of products or services to foreign customers)
over deduction eligible income:
𝐹𝐷𝐼𝐼 = 𝐷𝑒𝑒𝑚𝑒𝑑 𝐼𝑛𝑡𝑎𝑛𝑔𝑖𝑏𝑙𝑒 𝐼𝑛𝑐𝑜𝑚𝑒 × 𝐹𝑜𝑟𝑒𝑖𝑔𝑛𝐷𝑒𝑟𝑖𝑣𝑒𝑑 𝐷𝑒𝑑𝑢𝑐𝑡𝑖𝑜𝑛 𝐸𝑙𝑖𝑔𝑖𝑏𝑙𝑒 𝐼𝑛𝑐𝑜𝑚𝑒
𝐷𝑒𝑑𝑢𝑐𝑡𝑖𝑜𝑛 𝐸𝑙𝑖𝑔𝑖𝑏𝑙𝑒 𝐼𝑛𝑐𝑜𝑚𝑒
Finally, the FDII deduction is 37.5 percent of this amount in 2018 through 2025; the deduction is
reduced to 21.875 percent after 2025.
Applying this deduction against the 21-percent federal corporate tax rate yields an effective
federal tax rate of 13.125 percent in 2018 through 2025 and 16.40625 percent after 2025.
Unless states adopt the FDII deduction, such income will remain fully taxable at an average state
tax rate of approximately 6 percent, resulting in a combined tax rate (after accounting for the
deduction of state taxes against FDII) of 18.3 percent in 2018 through 2025 and 21.4 percent
after 2025.35 Thus, compared to the combined regular corporate statutory tax rate of 25.8
percent, the FDII deduction is approximately equal to a 7 percentage point reduction in the
combined rate through 2025 and a 4 percentage point reduction after 2025.
The impact of the FDII deduction on investment incentives depends in part on the alternatives.
For example, a US-headquartered company could alternatively make such investments abroad.
34 The Senate Finance Committee’s explanation of the Senate bill states (p. 370): “[T]he Committee recognizes that
many countries in the OECD have preferential tax regimes for income related to certain forms of intellectual
property. These regimes, sometimes referred to as patent box or intellectual property regimes, put the United States
at a competitive tax disadvantage. The Committee believes that establishing a deduction for foreign-derived
intangible income earned by domestic corporations helps the United States compete with countries that offer
preferential rates for intellectual property.” 35 This is calculated as .13125 + (1-.13125)(.060) and .1641 + (1-.1641)(.06).

21
As discussed in more detail in the next section, in some cases such foreign income could qualify
for the new 100-percent participation exemption and not be subject to US taxation. This
alternative would be attractive if the foreign rate of tax in the investment location was less than
the effective tax rate on FDII. Locating the investment abroad might also be attractive if the
investments generated income from sales to US customers. Provided such income qualified for
the participation exemption, investment abroad would be favored whenever the foreign rate of
tax is below the US combined rate of 25.8 percent. However, as also discussed in the next
section, certain foreign income can also be subject to GILTI, which can result in the combined
US and foreign tax being roughly comparable to tax paid on FDII.
While the FDII deduction may not eliminate incentives of US companies to earn high-return
income abroad, compared to prior law the deduction is likely to provide an increased incentive to
locate such investments in the United States. Whether this incentive is strong enough to offset
the incentive for investing abroad to benefit from the participation exemption also requires a
comparison to prior law. Under prior law US taxation of foreign-earned income could be
postponed indefinitely through deferral. For companies that are not cash-constrained (and thus
could defer repatriation of foreign earnings under prior law), the participation exemption may not
increase the incentive to undertake foreign investment; in addition, the GILTI provision can
reduce the incentive to undertake high-return foreign investment. Therefore, for many
companies, the net effect of these interactions is to increase the incentive to undertake high-
return investments in the United States relative to prior law.
A simple example can illustrate these effects. For example, consider a company able to have
certain foreign intangible income on sales to foreign customers taxed at a foreign rate of 10
percent. Under prior law, US tax on this income could be deferred. Let us assume the implicit
cost of deferral as a percent of the foreign income was d. Alternatively, if this intangible income
were earned in the United States, it would have been subject to a combined state and federal tax
rate of approximately 37.6 percent (the combined federal and state statutory rate after adjustment
for the average domestic production deduction). The net advantage to the foreign location under
prior law as a percent of foreign income is:
(37.6 – 10.0 – d).
Under the new law, assuming such income if earned abroad is fully eligible for the new
participation exemption system, there is no residual US taxation and no longer a cost from
deferring repatriation. If the income is earned in the United States under the new law and fully
eligible for the FDII deduction at the margin (assuming for simplicity no change in the amount of
qualified business asset investment), it will be subject to a combined federal and state tax rate of
18.3 percent. The net advantage to the foreign location under the new law as a percent of foreign
income is:
(18.3 – 10.0).
In this example, the advantage to the foreign location relative to the US location is reduced
provided the implicit cost of deferral d is less than 19.3 percent (37.6 – 18.3), the change in the
US rate of taxation on this income. As can also be seen, this result is independent of the foreign

22
rate of tax.36 As described in section VI, the advantage to the foreign location under new law can
be further discouraged if it results in taxation under GILTI.
Comparison with patent box regimes. The FDII deduction, while providing a reduced tax rate
for certain deemed intangible income, differs from the patent boxes available in other countries.
Under OECD rules adopted as part of the Base Erosion and Profit Shifting (BEPS) project,
patent boxes must follow a “modified nexus” approach, under which the taxpayer must incur the
developmental costs generating the IP income.37 In general, qualifying IP assets include
inventions protected under patents or software protected by copyright. Market-related IP assets,
such as trademarks, are not eligible. Patent box regimes do not distinguish between income
derived from foreign and domestic sales.
FDII is both broader and narrower than income qualifying for patent box treatment. It is broader
in that FDII has no explicit nexus requirement and can include income from market-related IP. It
is narrower in that FDII excludes income from domestic sales.
Because of the broader coverage of FDII, the EU has asked the OECD to review whether the
FDII deduction complies with OECD BEPS agreements or could be considered a harmful tax
practice.38 In addition, because the FDII deduction excludes income from domestic sales, it is
possible that the deduction will be challenged in the World Trade Organization as a prohibited
export subsidy. Until there is greater certainty with respect to these issues, the incentive effects
of the FDII deduction may be dampened.39
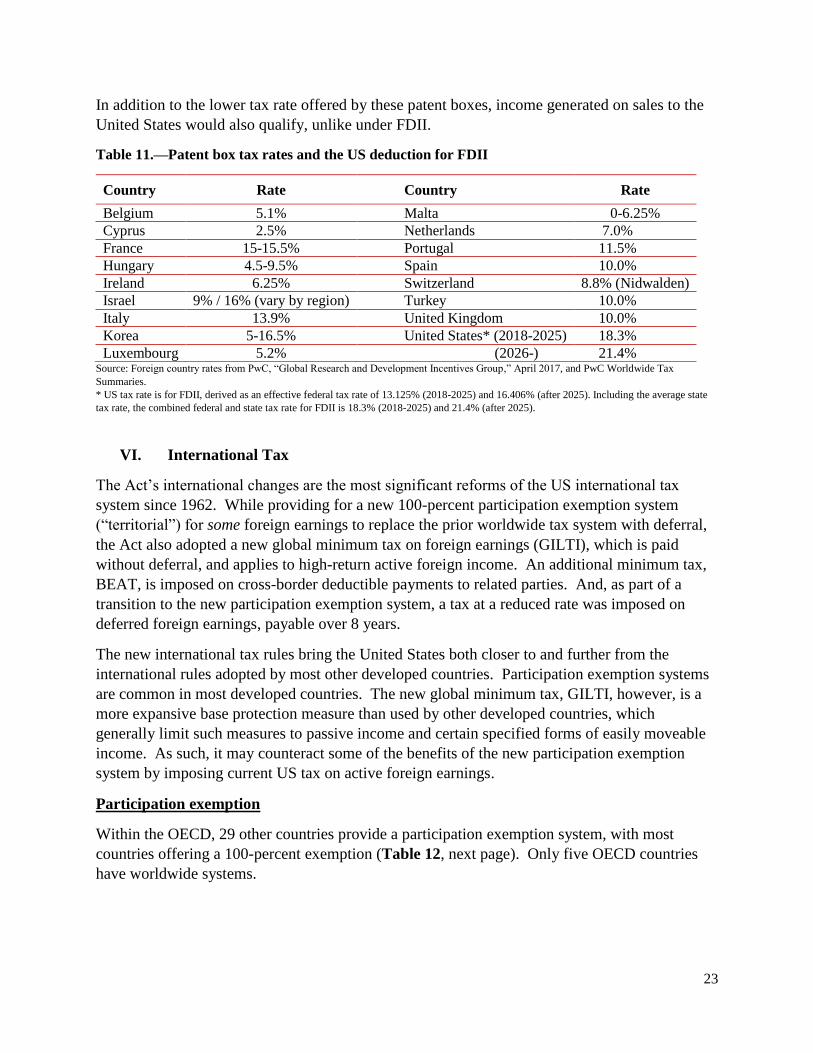
Patent box tax rates in other countries are shown in Table 11 (next page). As seen in the table,
many patent box tax rates are 10 percent or less. For income that qualifies for the patent box and
would not be subject to GILTI (as the case for foreign-headquartered companies and potentially
US companies with higher average foreign effective tax rates), these regimes may be much
preferred to undertaking the investment in the United States to benefit from the FDII deduction.
36 A more general expression might consider that only a portion of the income would be eligible for FDII if
production of the income requires an increase in qualified business asset investment. Analysis of this case results in
similar expressions except effective average tax rates for the relevant investment should replace the combined
statutory tax rate under prior law and new law. 37 Pre-existing patent boxes not complying with the modified nexus approach are subject to a limited grandfathering
period but must be abolished by June 30, 2021. See OECD, “Action 5: Agreement on Modified Nexus Approach
for IP Regimes,” 2015. 38 Joe Kirwin, “EU Requests OECD Review of U.S. Tax Law's Harmful Provisions,” BNA Daily Tax Report, March
3, 2018. 39 Treatment as a harmful tax practice could affect the deductibility of payments made in other countries. For
example, Germany limits the deductibility of a royalty payment to a related party taxed under a special tax regime
that does not conform to the modified nexus approach. As a result, the loss in deductibility against German tax can
exceed the benefit of the preferential regime. Deductibility is limited in the same proportion as the foreign tax rate
is less than 25 percent. If FDII were determined to be a non-conforming special tax regime, a royalty payment from
Germany to the US would be only 52.5 percent deductible (13.125/25). Given Germany’s tax rate of approximately
30 percent, this would result in an increase in German tax of $14.25 per $100 of royalty. The US federal tax savings
from FDII would be only $7.88 per $100 of royalty (i.e., the difference between tax at 21 percent and 13.125
percent). In such a case, the loss of the deduction in Germany would exceed the US tax savings.
23
In addition to the lower tax rate offered by these patent boxes, income generated on sales to the
United States would also qualify, unlike under FDII.
Table 11.—Patent box tax rates and the US deduction for FDII
Country Rate Country Rate
Belgium 5.1% Malta 0-6.25%
Cyprus 2.5% Netherlands 7.0%
France 15-15.5% Portugal 11.5%
Hungary 4.5-9.5% Spain 10.0%
Ireland 6.25% Switzerland 8.8% (Nidwalden)
Israel 9% / 16% (vary by region) Turkey 10.0%
Italy 13.9% United Kingdom 10.0%
Korea 5-16.5% United States* (2018-2025) 18.3%
Luxembourg 5.2% (2026-) 21.4% Source: Foreign country rates from PwC, “Global Research and Development Incentives Group,” April 2017, and PwC Worldwide Tax
Summaries.
* US tax rate is for FDII, derived as an effective federal tax rate of 13.125% (2018-2025) and 16.406% (after 2025). Including the average state
tax rate, the combined federal and state tax rate for FDII is 18.3% (2018-2025) and 21.4% (after 2025).
VI. International Tax
The Act’s international changes are the most significant reforms of the US international tax
system since 1962. While providing for a new 100-percent participation exemption system
(“territorial”) for some foreign earnings to replace the prior worldwide tax system with deferral,
the Act also adopted a new global minimum tax on foreign earnings (GILTI), which is paid
without deferral, and applies to high-return active foreign income. An additional minimum tax,
BEAT, is imposed on cross-border deductible payments to related parties. And, as part of a
transition to the new participation exemption system, a tax at a reduced rate was imposed on
deferred foreign earnings, payable over 8 years.
The new international tax rules bring the United States both closer to and further from the
international rules adopted by most other developed countries. Participation exemption systems
are common in most developed countries. The new global minimum tax, GILTI, however, is a
more expansive base protection measure than used by other developed countries, which
generally limit such measures to passive income and certain specified forms of easily moveable
income. As such, it may counteract some of the benefits of the new participation exemption
system by imposing current US tax on active foreign earnings.
Participation exemption
Within the OECD, 29 other countries provide a participation exemption system, with most
countries offering a 100-percent exemption (Table 12, next page). Only five OECD countries
have worldwide systems.

24
Table 12.—International tax systems of other OECD countries
Method of
Taxation
OECD Countries (excluding US)
Dividend
Exemption
Percentage
Participation
exemption systems
Australia, Austria, Canada, Czech Republic, Denmark, Estonia,
Finland, Greece, Hungary, Iceland, Latvia, Luxembourg,
Netherlands, New Zealand, Poland, Portugal, Slovak Republic,
Spain, Sweden, Turkey, United Kingdom
100% exemption
Norway 97% exemption Belgium, France, Germany, Italy, Japan, Slovenia, Switzerland 95% exemption
Worldwide tax
systems Chile, Ireland, Israel, Korea, Mexico 0% exemption
Source: PwC Worldwide Tax Summaries.
The participation exemption is intended to allow a US multinational corporation to serve foreign
markets on the same tax terms as non-US companies in those markets (in particular, foreign-
based multinational companies headquartered in other territorial countries, local-based foreign
companies, and foreign-based multinational companies headquartered in worldwide countries
with tax rates below the rate in the specific foreign market). Under the prior worldwide tax
system, a US multinational corporation in many cases would have to defer repatriation of its
foreign earnings to compete on the same tax terms as a foreign-based company.
The JCT estimated that at the end of 2015, $2.6 trillion of foreign earnings had been deferred by
US companies.40 Analysis of financial statements indicated that indefinitely reinvested foreign
earnings of US companies in the Russell 1000 index grew from $1.1 trillion in 2008 to $2.6
trillion in 2016, with the 50 top companies accounting for 70 percent of the 2016 accumulation.41
On its own, adoption of a participation exemption system might be thought to favor investment
abroad relative to US investment, particularly for US companies for whom the implicit cost of
deferring foreign earnings from US taxation under prior law was high. US statutory rate
reduction, domestic expensing incentives, and FDII, however, also result in large reductions in
the tax rate on domestic investment. Additionally, the potential impact of increased
competitiveness of US companies in foreign markets through these tax reductions and
complementarities between a company’s foreign and domestic activities may further increase US
investment.
The competitive disadvantage of a worldwide tax system is supported by research finding that
cross-border mergers and acquisitions are influenced by whether the target and acquirer are
located in participation exemption or worldwide tax systems. One study estimated that US
adoption of a participation exemption system would increase the number of cross-border mergers
40 Letter from Thomas Barthold, Chief of Staff, Joint Committee on Taxation, to House Ways and Means Chairman
Kevin Brady and Ranking Member Richard Neal, August 31, 2016. 41 Audit Analytics, “Indefinitely Reinvested Foreign Earnings: Balances Held by the Russell 1000,” July 2017.
Indefinitely reinvested foreign earnings differ from deferred foreign earnings for tax purposes in that some
companies may defer repatriation of foreign earnings but not assert it is indefinitely reinvested for accounting
purposes.

25
in which the US company was the acquirer by 17 percent.42 The competitive disadvantage of the
former US worldwide tax system was also one reason cited for the increase in cross-border
redomiciliation transactions prior to the Act.43
Lower tax rates on US companies can potentially expand the scope of their investments both in
the United States and abroad. Desai, Foley and Hines (2013) find significant complementarities
between increased foreign activity by the foreign subsidiaries of US companies and the domestic
activity of the US parent company.44 For example, they find the following complementary
relationships: 10 percent greater foreign investment by US foreign subsidiaries is associated with
2.6 percent greater domestic investment; 10 percent greater foreign labor compensation is
associated with 3.7 percent greater domestic labor compensation; and 10 percent greater foreign
employment is associated with 6.5 percent greater domestic employment.
The benefit of the participation exemption system for US companies, however, is limited by
GILTI, described below.
Global minimum tax
The intent behind GILTI is to discourage income shifting that might occur under the
participation exemption system by imposing US tax on high-return income of controlled foreign
corporations (CFCs) in excess of a “normal” return when the foreign effective tax rate measured
on an aggregated basis across all CFCs is less than 13.125 percent (from 2018 through 2025) or
below 16.4 percent (after 2025). However, due to the potential that expense allocation rules that
determine the foreign tax credit limitation may apply to GILTI, all high-return foreign income is
potentially subject to tax even where the foreign effective tax rate exceeds these thresholds. The
minimum tax is applied on a current basis whether or not foreign earnings are repatriated,
resulting in a potentially higher tax burden on foreign earnings than under prior law.
The computation of the minimum tax requires several steps, which are similar to the steps to
calculate FDII, but are limited to income of the CFCs. A simplified description follows. First,
“net CFC tested income” is calculated. This is a measure similar to aggregate net CFC income
(net of foreign tax) and excludes subpart F income, certain other foreign income, and foreign oil
and gas income. Second, “net deemed tangible income return” is determined as a 10-percent
return on qualified business asset investment (the adjusted basis on tangible depreciable
property, determined by applying the alternative depreciation system) less interest expense
allocable to net CFC tested income. Third, “global intangible low-taxed income” (GILTI) is
determined by subtracting net deemed tangible income return from net CFC tested income:45
42 Lars P. Feld, Martin Ruf, Uwe Scheuering, Ulrich Schreiber, and Johannes Voget, “Effects of Territorial and
Worldwide Corporation Tax Systems on Outbound M&As,” Center for European Economic Research (ZEW), 2013. 43 Congressional Budget Office, “An Analysis of Corporate Inversions,” September 2017. 44 Mihir Desai, C. Fritz Foley and James R. Hines, Jr., “Domestic Effects of the Foreign Activities of U.S.
Multinationals,” American Economic Journal: Economic Policy, February 2009. 45 GILTI is calculated at the US shareholder level by combining CFC tested income and deemed tangible income for
all CFCs.

26
𝐺𝐼𝐿𝑇𝐼 = 𝑁𝑒𝑡 𝐶𝐹𝐶 𝑇𝑒𝑠𝑡𝑒𝑑 𝐼𝑛𝑐𝑜𝑚𝑒 −
[.10 𝑥 𝑄𝑢𝑎𝑙𝑖𝑓𝑖𝑒𝑑 𝐵𝑢𝑠𝑖𝑛𝑒𝑠𝑠 𝐴𝑠𝑠𝑒𝑡 𝐼𝑛𝑣𝑒𝑠𝑡𝑚𝑒𝑛𝑡 − 𝐼𝑛𝑡𝑒𝑟𝑒𝑠𝑡 𝐸𝑥𝑝𝑒𝑛𝑠𝑒]
As can be seen by the definition, GILTI is not limited to low-taxed income, nor is it strictly
related to high-return intangible income, as it can be generated from non-depreciable tangible
property (land and inventory) and foreign interest expense is assumed to finance only qualified
business asset investment.
Using BEA and IRS data, Martin Sullivan provides an upper-bound estimate that net deemed
tangible income (the normal return to tangible capital) represents only 15 percent to 26 percent
of before tax income of CFCs.46 As a result, at least 74 percent to 85 percent of CFC income is
potentially subject to current US taxation.
GILTI is added to taxable income but becomes a minimum tax by providing for a partial
deduction of the amount included in income and allowing for a foreign tax credit equal to 80
percent of foreign taxes paid allocable to this income (subject to a foreign tax credit limitation).
A 50-percent deduction of GILTI is provided from 2018 through 2025 and 37.5-percent after
2025.
The 50-percent deduction results in a 10.5 percent tax rate on GILTI. Assuming positive taxable
income before GILTI and ignoring potential interactions with other tax provisions, the net
additional US tax arising from the provision is:
(. 21)(. 5)𝐺𝐼𝐿𝑇𝐼
1 − 𝜏− 𝐹𝑇𝐶
where τ is the average foreign rate of tax on GILTI (used here to reflect the Section 78 gross up
to claim the foreign tax credit) and FTC is the allowed foreign tax credit.
Ignoring expense allocation rules that may limit the foreign tax credit and assuming positive
taxable income before GILTI, provided foreign taxes of at least 13.125 percent have been paid, a
foreign tax credit of 80 percent of foreign taxes will eliminate any incremental US tax on GILTI
(since 10.5 = .80 x 13.125). This characterization of GILTI is how the tax is explained in the
Conference Report to the Act:
At foreign tax rates greater than or equal to 13.125 percent, there is no residual U.S. tax
owed on GILTI, so that the combined foreign and U.S. tax rate on GILTI equals the
foreign tax rate.47
After 2025, by the same logic, the smaller 37.5-percent deduction results in a tax rate of 13.125
percent on GILTI, which requires foreign taxes of at least 16.40625 percent to eliminate any
additional tax under GILTI.
46 Martin Sullivan, “GILTI and That Disappointing Deemed Tangible Return,” Tax Notes, May 7, 2018. 47 Tax Cut and Jobs Act, Conference Report, Rpt. 115–466, p. 627.

27
However, because GILTI has its own foreign tax credit basket, the calculation of the foreign tax
credit may need to take into account expense allocation rules that could result in the allocation
and apportionment of certain US expenses (such as interest, research, and G&A) to GILTI.48
Representing any allocated expenses as E, the allowable foreign tax credit for years in which the
50-percent deduction for GILTI applies is: the lesser of (i) the foreign tax credit limitation (the
non-negative amount of US tax that would be owed on GILTI, net of the 50-percent deduction,
and after allocating domestic expenses to GILTI) and (ii) 80-percent of foreign taxes paid on
GILTI:
𝐹𝑇𝐶 = 𝑚𝑎𝑥 {0, 𝑚𝑖𝑛 {(. 21) ((. 5)𝐺𝐼𝐿𝑇𝐼
1 − 𝜏− 𝐸) , .8𝜏
𝐺𝐼𝐿𝑇𝐼
1 − 𝜏}}
For foreign tax rates of 13.125 percent or higher, these expressions can be simplified, and the net
additional US tax on GILTI after allowable foreign tax credits is:
𝑚𝑖𝑛 {. 105𝐺𝐼𝐿𝑇𝐼
1 − 𝜏, .21𝐸}
This expression shows that even high-taxed GILTI income (income bearing an average tax rate
in excess of 13.125 percent or higher) creates an additional US tax burden equal to 21 percent of
allocated expenses (until such expenses exceed 10.5 percent of pre-tax GILTI income).
The GILTI tax is not designed to account for timing differences between US and foreign taxes
and volatile income flows can give rise to tax. For example, no foreign tax credit carryforward
or carryback is permitted for years in which foreign taxes exceed that needed to eliminate GILTI
tax. Nor can a net foreign loss in one year offset positive foreign income in another year. For a
US company with current domestic losses, the inclusion of GILTI can cause a loss in what would
have been future NOL deductions without preserving the foreign tax credits attributable to the
GILTI inclusion.
Each of these design flaws results in GILTI imposing additional US tax on foreign earnings that
have borne tax above a specified minimum rate. Even a better designed global minimum tax,
however, imposes a potential additional tax on US-headquartered companies not borne by a
foreign-headquartered company. A global minimum tax moves the international tax system in
the direction of a worldwide tax system, and unlike the prior US worldwide tax system, imposes
tax on a current basis on active foreign income without deferral.
As a result, GILTI reduces the ability of US companies to compete on equal tax terms in foreign
markets with their foreign-based competitors, offsetting at least in part the benefits of the
participation exemption system. GILTI can penalize US companies that have acquired high-
return assets through cross-border mergers and acquisitions and will discourage future M&A in
which the US parent is the acquirer, rather than the target.
48 There is currently some ambiguity if expense allocation rules apply to GILTI. This is expected to be clarified
through Treasury guidance.

28
Base erosion and anti-abuse tax
BEAT is an additional minimum tax imposed on certain outbound payments by a US taxpayer to
a related foreign party.
BEAT requires a separate tax calculation based on a modified definition of taxable income,
generally equal to regular taxable income without regard to any deductions for “base erosion
payments.” A tax rate of 10 percent is applied to modified taxable income (5 percent in 2018
and 12.5 percent after 2025). This tentative tax is reduced by regular tax liability, research tax
credits (before 2026) and 80 percent of certain other specified general business tax credits
(before 2026), yielding the additional minimum tax amount.49 Foreign tax credits are not
permitted to reduce this tax.
Base erosion payments are generally defined as deductible payments (other than those on which
US withholding tax is imposed) made to a related foreign party. Only taxpayers with average
gross receipts of at least $500 million are subject to BEAT, and only when base erosion
payments exceed 3 percent (2 percent for certain banks and security dealers) of all deductible
payments. The 3 percent threshold is a cliff – once exceeded all base erosion payments are
subject to BEAT, not simply those in excess of the threshold.
Generally, base erosion payments do not include payments for the cost of goods sold, since these
are treated as a reduction in gross receipts rather than a deduction from income for tax purposes.
As a result, payments for most imported goods, such as raw materials, supplies, and goods for
resale, would be excluded from the computation. Payments for royalties and services not related
to inventory would generally not be treated as cost of goods sold, and therefore would constitute
a base erosion payment. An exception is provided for certain service payments made at cost.50
While the intent of the provision is to prevent base erosion, it applies without any determination
that the payment exceeds an arm’s length transfer price; indeed the provision can apply even
where an existing advance pricing agreement or prior audit has agreed to the transfer price
established. It can also apply when the payment is made to a taxpayer in a jurisdiction with a tax
rate equal to or higher than the US rate.
As a minimum tax, it can apply whenever the deductible payments are large relative to taxes
paid, subject to the gross receipts and base erosion payment threshold tests being met. This can
occur when transitory fluctuations cause income to be low, profit margins are generally low, or
the taxpayer has regular tax liability reduced by general business tax credits and foreign tax
credits. There is no carryback or carryforward provision in years in which regular tax exceeds
minimum tax, unlike the prior law corporate AMT.
49 Before 2026, research credits and 80 percent of certain other specified general business credits (the low-income
housing tax credit and certain energy credits) are permitted to offset tentative tax. 50 There is presently some ambiguity as to whether the exception (service cost method) applies to the cost
component if the payment also includes a mark-up component.

29
It does not appear that the netting of cross-border payments is provided; for example, a taxpayer
could be subject to BEAT on its outbound interest payments even though it has a similar amount
of inbound interest income.
A lack of coordination among tax provisions can cause what would constitute a deductible
payment for regular tax purposes to be subject to tax in the foreign jurisdiction, included in the
US tax return as GILTI or subpart F income, and included in modified taxable income for
purposes of the BEAT both as an add-back to taxable income and through its initial inclusion in
taxable income. Further, the BEAT calculation does not permit any credit for foreign tax
imposed on this payment.
The provision applies to both US-headquartered companies and foreign-headquartered
companies with US operations, but Congress emphasized its impact on foreign-headquartered
companies as a way to level the playing field with US-headquartered companies.51 The BEAT
can clearly be seen to discourage payments structured for certain activities through a related
foreign affiliate (or parent) of a US company. How this affects US activities and US
competitiveness after accounting for behavioral reaction is uncertain.
While BEAT could encourage the on-shoring of some foreign activities, it could also encourage
the offshoring of US activities. For example, a BEAT payment might be avoided if the portion
of the US operation making the payment is moved offshore. BEAT can also be avoided by
hiring an unrelated foreign party to undertake the activity formerly undertaken by a related
foreign party.
The tax seems out of the norm of traditional tax policy. Itai Grinberg, while not disagreeing,
argues that the provision can help the United States in international negotiations to counter
aggressive actions by other countries toward US multinational corporations, including EU “state
aid” claims, proposals for new digital taxes on sales revenue, and the diverted profits tax enacted
by the United Kingdom and Australia.52 Successful negotiations, he argues, could lead to a
scaling back of the BEAT by treaty, with similar concessions made by the foreign country with
respect to US companies.
The EU has asked the OECD to review whether the BEAT is consistent with OECD tax
principles.53
51 The Senate Finance Committee’s explanation of the Senate bill states (p. 391): “Foreign-owned U.S. subsidiaries
are able to reduce their U.S. tax liability by making deductible payments to a foreign parent or foreign affiliates.
This can erode the U.S. tax base if the payments are subject to little or no U.S. withholding tax. Foreign corporations
often take advantage of deductions from taxable liability in their U.S. affiliates with payments of interest, royalties,
management fees, or reinsurance payments. This provision aims to tax payments of this kind… This provision aims
to level the playing field between U.S. and foreign-owned multinational corporations in an administrable way.” 52 Itai Grinberg, “The BEAT is a Pragmatic and Geopolitically Savvy Inbound Base Erosion Rule,” Georgetown
University Law Center, November 12, 2017. 53 Joe Kirwin, “EU Requests OECD Review of U.S. Tax Law's Harmful Provisions,” BNA Daily Tax Report, March
3, 2018.

30
Appendix: Effective Tax Rate Methodology
We calculated corporate Effective Marginal Tax Rates (EMTRs) and Effective Average Tax
Rates (EATRs) by country for 2017 according to the Devereux-Griffith methodology used by the
European Commission, including national and subnational corporate income taxes and
allowances for corporate equity (in the case of Belgium, Italy, and Turkey).54 We excluded all
other taxes, such as shareholder taxes and property taxes.
Data for corporate income tax rates and to allowances for corporate equity are from the OECD
database, the European Commission report, the database maintained by Oxford University’s
Center for Business Taxation (CBT), and PwC worldwide tax summaries.55
In the case of the US corporate tax rate under 2017 law, we reduced the federal corporate income
tax rate to account for the domestic production deduction (Section 199), according to the loss of
federal revenue attributable to it. Specifically, according to the US Treasury Department’s tax
expenditure estimates and corporate tax receipts for fiscal 2017, the domestic production
deduction reduced corporate tax revenue by 4.0 percent in 2017, amounting to a 1.4 percentage
point reduction in the federal corporate tax rate (reducing it from 35 percent to 33.6 percent).
The US combined statutory tax rate for 2017 (after adjusting for the domestic production
deduction), assuming an average state corporate income tax rate of 6.01 percent, is calculated to
be 37.58 percent. Under 2018 law, we held the average state corporate income tax rate constant
at its 2017 value, and compute the US combined statutory tax rate to be 25.75 percent.
For purposes of the EMTR and EATR cross-country comparisons and in accordance with other
studies utilizing the Devereux-Griffith methodology, we analyzed equipment deemed to have a
useful life of 7 years (economic depreciation rate of 17.5 percent) and structures deemed to have
a useful life of 25 years (economic depreciation rate of 3.1 percent).56 For the United States this
corresponds to equipment with a 5-year MACRS recovery period (double declining balance with
a switch to straight line) and structures recovered over 39 years, each with a half-year convention
for the year placed in service; we account for bonus depreciation and expensing where applicable
(equipment). We assume states conform to federal depreciation rules, including bonus
depreciation and expensing. Inventories in the United States were assumed to use the LIFO
accounting method. For other countries, we relied on the CBT database for the depreciation
allowances for equipment and structures, and for the treatment of inventory.
54 Christoph Spengel, Frank Schmidt, Jost Heckemeyer, and Katharina Nicolay, “Effective Tax Levels using the
Devereux/Griffith Methodology: Final Report 2016,” Project for the EU Commission TAXUD/2013/CC/120, Centre
for Economic Research (ZEW), October 2016, available at http://www.zew.de/en/publikationen/effective-tax-levels-
using-the-devereuxgriffith-methodology-final-report-2016/?cHash=cd1beff16840b2d302fd63720247e358. 55 The OECD database is available at http://www.oecd.org/tax/tax-policy/tax-database.htm; the Oxford University
database is available at https://www.sbs.ox.ac.uk/faculty-research/tax/publications/data; the PwC worldwide tax
summaries are available at http://taxsummaries.pwc.com/ID/tax-summaries-home. 56 Katarzyna Bilicka and Michael Devereux, “CBT Corporate Tax Ranking, 2012,” Oxford University Centre of
Business Taxation, available at
https://www.sbs.ox.ac.uk/sites/default/files/Business_Taxation/Docs/Publications/Reports/cbt-tax-ranking-2012.pdf.

31
For the tangible capital effective tax rate calculations we assume a real interest rate of 5 percent,
inflation of 2 percent, and, for EATR calculations, a pre-tax rate of return of 20 percent.
For weighted calculations of total corporate capital, we assumed asset weights for equipment
(30.15%), structures (58.40%), and inventory (11.45%) based on Congressional Budget Office
weights for corporate tangible capital, excluding land.57 When a mix of equity and debt is used
to finance investment, we also follow CBO in assuming a financing mix of 68 percent equity and
32 percent debt.58
For B-index and EMTR calculations of R&D projects, we follow the OECD in assuming 90
percent of project costs are for current expenditures (labor and supplies), 5 percent for
equipment, and 5 percent for structures.59 For the United States equipment has a 5-year MACRS
recovery period (double declining balance with a switch to straight line) and structures are
recovered over 39 years, each with a half-year convention for the year placed in service; we
account for bonus depreciation and expensing where applicable (equipment), as well as 5-year
amortization under the Act beginning in 2022. For other countries, the B-index values are as
reported by the OECD.60 To be consistent with the OECD computations for other countries, we
compute the B-index for the United States using a nominal discount rate of 10 percent for
depreciation allowances and amortization deductions. We assume states conform to federal
depreciation and amortization rules for R&D investments. For EMTR calculations, we follow
the same assumptions as for tangible capital (a real interest rate of 5 percent and inflation of 2
percent). We assume the economic depreciation rate for the composite R&D project is 17.5
percent.
57 Congressional Budget Office, “Taxing Capital Income: Effective Marginal Tax Rates Under 2014 Law and
Selected Policy Options,” December 2014 (Table A-1, p. 32). 58 Congressional Budget Office, “Taxing Capital Income: Effective Marginal Tax Rates Under 2014 Law and
Selected Policy Options,” December 2014, p. 46. 59 OECD, “OECD Review of National R&D Tax Incentives and Estimates of R&D Tax Subsidy Rates, 2017,” April
2018. 60 Values calculated by OECD are from http://dx.doi.org/10.1787/888933619448.