assessing curriculum implementation -...
TRANSCRIPT
Assessing Curriculum Implementation: Insights from the Comparing Options in Secondary Mathematics: Investigating
Curriculum (COSMIC) Project
Melissa D. McNaught James E. Tarr
Douglas A. Grouws
University of Missouri This paper reports and discusses preliminary findings related to curriculum implementation in mathematics classrooms. The primary focus is on the extent and manner in which teachers use textbooks in their daily teaching. Specific attention is given to implementation differences related to two types of mathematics textbooks where the mathematical content is organized differently. Research has established that students learn what they are given the opportunity to learn (OTL) (for mathematics, see Floden, 2002; Hiebert, 1999; Hiebert & Grouws, 2007). In classrooms, teachers are the final decision-makers with regard to the specific content taught and how it is taught. Furthermore, they rely heavily on curricular materials to inform and implement such decisions (Grouws & Smith, 2000; Weiss, Banilower, McMahon, & Smith, 2001; Weiss, Pasley, Smith, Banilower, & Heck, 2003). In order to understand how curriculum materials, in this case mathematics textbooks, impact student learning one must also understand how teachers enact the curriculum materials in the classroom. This study reports on how teachers use textbooks with two different approaches to mathematics content organization. Findings reported are based on data collected as part of an NSF-funded research project, Comparing Options in Secondary School Mathematics: Investigating Curriculum (COSMIC), a three-year longitudinal comparative study of integrated mathematics curricula and subject-specific mathematics curricula on student learning at the high school level. The primary goal of the COSMIC study is to evaluate high school students’ mathematics learning using multiple measures of student achievement while carefully attending to curriculum implementation via classroom observations, Textbook-Use Diaries (TUDs), Table of Content (TOC) Records, teacher surveys and interviews. In this paper we report results from Year 1 of the study with regard to similarities and differences in how teachers use their mathematics textbooks in general and specific types of textbooks in particular. In Year 1, one group of teachers in 10 schools taught students (N ≈ 1300) who studied from a textbook that reflected an integrated content approach (Core-Plus Mathematics Course 1) and another group of teachers in those same schools taught students (N ≈ 1300) who studied from a subject-specific content approach (Algebra I). Paper presented at the Annual Meeting of the American Education Research Association, New York, March 2008. The authors would like to thank the following people for their assistance with all aspects of the research: Angela Bowzer, Óscar Chávez, Maryann Huey, Ira Papick, Robert Reys, and Daniel Ross. This article is based upon work supported by the National Science Foundation under grant number REC-0532214. Any opinions, findings, and conclusions or recommendations expressed in this paper are those of the authors and do not necessarily reflect the views of the National Science Foundation.
2
Theoretical Perspectives When examining the relationship between student learning and specific mathematics curricula, one cannot assume that the curricula are being implemented in any specific way (Scott, 1994). In particular, teachers may modify curricula based on their personal beliefs, knowledge, and experience within the mathematics classroom (Chávez, 2006; Remillard, 2005; Stein, Remillard, & Smith, 2007). “Two classrooms in which the same curriculum is supposedly being ‘implemented’ may look very different; the activities of teacher and students in each room may be quite dissimilar, with different learning opportunities available, different mathematical ideas under consideration, and different outcomes achieved” (Kilpatrick, 2003). Therefore, how curriculum materials are implemented must be considered prior to drawing any inferences about the curriculum materials impact on student learning. Although we know textbooks are the centerpiece of mathematics instruction in U.S. schools (Grouws & Smith, 2000; Weiss, Banilower, McMahon, & Smith, 2001; Weiss, Pasley, Smith, Banilower, & Heck, 2003), very little is known about the relationship between implementation levels, specific textbooks, and what mathematics students learn. Teachers may choose to move through the textbook sequentially or not; they may choose to cover most of the chapters of the textbook or not; they may supplement the textbook with materials from other resources or not. All of these decisions, and others, affect the extent to which the curriculum materials are implemented and determine the mathematics that students are provided the opportunity to learn (Tarr, Chávez, Reys, & Reys, 2006). Each of these factors was carefully assessed via triangulated measures in the COSMIC study.
The Study
Textbook implementation was examined in this study through two conceptual lenses: content implementation and presentation implementation. The content lens examined what mathematics content in the intended curriculum was taught as part of classroom instruction. This construct was measured by multiple methods including ratings made by trained observers during classroom visits and teacher logs updated on a regular basis, as described in more detail later. The presentation lens examined how the curriculum materials were implemented. This construct considered the way students were expected to engage with the textbook material during the mathematics class period, as determined by textbook analysis and interviews with textbook authors. This aspect of implementation is particularly important when studying what are often referred to as “reform-oriented” textbooks because the program philosophy of these textbooks call for changes in the way mathematics is typically taught, such as students more regularly working in small group settings, engaging more frequently in discussion of ideas, often developing their own informal algorithms and procedures, and so on. Each of these facets of presentation implementation were assessed in this study, but their measurement required multiple instruments, including the ratings made by classroom observers reported in this paper. It is important to note that measures of implementation are not direct measures of the quality of teaching. That is, a low measure of implementation does not necessarily imply poor teaching. The measure of content implementation, for instance, represents the extent to which the content of a particular textbook is taught and there may be occasions where it is prudent for a teacher to
3
deviate from the content included in a textbook. For example, it could be that a teacher is aware that students have a deep knowledge of some particular mathematical topic, so it is appropriate not to spend additional instructional time on it. In summary, we remind the reader that documenting the extent of implementation is necessary in order to make valid interpretations of student achievement in relation to a specific textbook curriculum (NRC, 2004) and that there are few curriculum studies that take appropriate account of curriculum implementation (O’Donnell, 2008).
Research Questions
The research questions guiding this paper are addressed at two levels: Course and Lesson. At the Course Level, the focus is broad-based and aimed at determining how the textbook is used across the school year as determined by teacher supplied survey data. At the Lesson Level, the focus is an in-depth look at textbook use with a fine-grained examination using classroom observations.
Research Questions: Course Level
1. To what extent do high school teachers provide students the opportunity to learn the mathematics content embodied in their mathematics textbook during the course of a school year? Does the extent to which the opportunity to learn is provided vary by textbook type?
2. To what extent do high school teachers teach the mathematics content embodied in
the textbook directly from the textbook during the course of a school year? Does the extent to which the mathematics content is taught directly from the textbook vary by textbook type?
3. To what extent are the mathematics lessons taught by high school teachers directly
attributable to the textbook? Does the extent to which the lessons taught are directly attributable to the textbook vary by textbook type?
Research Questions: Lesson Level
4. Lesson Content Fidelity. To what extent do high school mathematics teachers teach the content in their textbooks in their daily lessons? Does the extent to which high school mathematics teachers teach the content in their textbooks vary by textbook type?
5. Lesson Presentation Fidelity. To what extent do high school mathematics teachers
use their textbook in their daily lessons in a way consistent with the pedagogical philosophy of the textbook? Does the extent to which high school mathematics teachers use their textbook as the textbook authors intend vary by textbook type?
6. To what extent is Lesson Content Fidelity related to Lesson Presentation Fidelity in
high school mathematics classrooms? Does the extent to which Lesson Content Fidelity is related to Lesson Presentation Fidelity vary by textbook type?
4
Discussion of Research Questions Teachers make numerous implementation decisions including whether to cover most of the chapters in the textbook or not, supplement the textbook problems with problems from other sources or not, or follow the textbook authors’ recommended classroom organization or not. These teacher decisions impact the content that students are provided the opportunity to learn. The Course Level research questions examine these implementation decisions at a broad level by first addressing how much of the content embodied in the textbook is taught to students. Furthermore, as we shall later see, by restructuring the graphs depicting implementation, the reader can easily see the location of lessons taught and not taught for any given teacher. The second and third questions look more closely at how much of this content is taught directly from the textbook. The second question considers how much of the content is taught primarily from the textbook in relation to all the content contained in the textbook, whereas the third question considers the way content is taught in relation to only those lessons that were reported as taught. The Lesson Level research questions provide an in-depth examination of Content and Presentation Fidelity for each teacher based on three classroom visits to each teacher. These questions then seek an independent assessment of these implementation dimensions; that is, an examination that does not rely on teacher self-report data.
Methodology In this section we provide information about the sample for the study, the instruments developed and used, data collection, and data sources. Sample: Participating School Districts Only schools where a dual curricular option program was in place (an integrated approach and subject-specific approach) and the students had a free choice between the two were recruited for participation in the study. Furthermore, only schools using the Core-Plus integrated textbook, Contemporary Mathematics in Context (Coxford, et al., 1998), the most widely used of the integrated curricula in secondary schools, were considered. In order to keep the potential sample of schools sufficiently large, the subject-specific textbook in use was left open. Assistance in identifying schools that met these criteria was garnered from state mathematics supervisors, notices in the NCTM News Bulletin, recommendations of colleagues at various universities, and textbook distributors. Districts were then chosen with regard to willingness to participate in the project. The sample for this report is comprised of 33 secondary school teachers who taught 112 classes (60 integrated and 52 subject-specific) in 5 states involving approximately 2600 students. The school locales varied from rural to urban settings and the student bodies ranged from high-middle socioeconomic (SES) backgrounds to schools where many students were from low SES families. In every participating school, students were allowed to choose (rather than be assigned via past achievement) their curriculum path by enrolling in a class utilizing the subject-specific approach (Algebra I) or in a class utilizing the integrated approach (Course 1). Every school utilized the integrated curriculum textbook Contemporary Mathematics in Context (Coxford, et al., 1998). The curriculum for the subject-specific course was taught from one of several
5
textbooks with the most widely used being the Glencoe Publishing Company textbook, Algebra I (Holliday, et al., 2005). Although all school districts in the sample used both an integrated textbook sequence and a subject-specific textbook sequence, there were unique circumstances regarding two districts. One district implemented the integrated series at two different paces, regular and accelerated. In these schools, five teachers taught the integrated course at an accelerated pace. The expectation for the accelerated course was that content from the Course 1 textbook and part of the content from the Course 2 textbook would be taught during the span of one school year. In another district, three teachers teaching from subject-specific curriculum materials were using a textbook series designed as a two-year algebra course. However, the expectation for these classes was that content from both of these two textbooks would be taught within the span of one school year. Instruments Several instruments were developed and used to measure implementation from both the perspective of the teacher and of the researchers. Each teacher completed: (1) written surveys; (2) a Table of Contents Record and (3) Textbook-Use Diaries. The researchers gathered data utilizing Classroom Visit Protocols, which were used during classroom visits to document implementation with regard to content and presentation dimensions, and also conducted teacher interviews. Written surveys. In the first written survey, teachers provided demographic and status information including years of teaching experience, recent professional development, educational background, and other information related to their context. In the second survey completed mid-year, teachers provided information about their use of the textbook during instruction (e.g., use of identified lesson components), perception of the quality of the textbook, use of given instructional practices (e.g., small group instruction), use of graphing calculators, assignment of homework, and use of assessments. Table of Contents Record (TOC). In the Table of Contents Record, the teacher provided information regarding each lesson of the textbook being used and the extent to which the content taught from the textbook was supplemented or taught from another source. To gather this information, the teacher was provided an instrument that included a copy of the table of contents of the textbook in use and was asked to indicate the level of use for each lesson by choosing one of the following options: (1) content taught primarily from textbook; (2) content taught from the textbook with some supplementation; (3) content taught primarily from an alternative source; and (4) content not taught. Updated TOC records were collected four times during the year corresponding to the end of each quarter of the school year. Textbook-Use Diaries (TUD). The textbook-use diaries focused on particular chapters of the textbook. Each teacher completed TUDs for two textbook chapters with a form tailored to the particular textbook used by the teacher. As part of completing this instrument the teacher provided information about what supplementary materials were used, what specific examples and textbook pages were utilized during instruction, what duplicated material was given to students, what textbook exercises the students worked in class, and what problems were assigned as homework. This instrument provided useful information about the nature of instruction and a means to triangulate the data gathered from the TOC records.
6
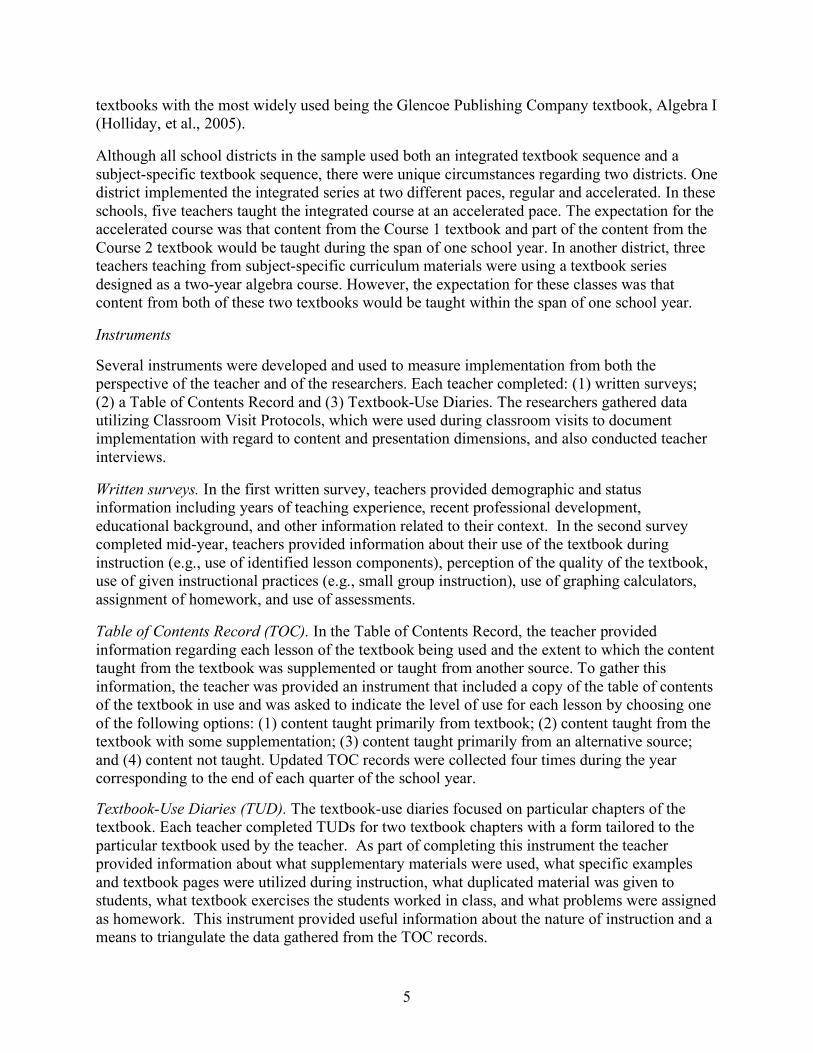
Classroom Visit Protocols (CVP). We interviewed textbook authors to determine what the developers of each curriculum expected of teachers in implementing their curricular materials. In interviewing authors, we asked questions regarding the key lesson components (e.g., Focus, Teach, Practice/Apply) of each textbook with particular attention to what constitutes a “faithful” implementation of each lesson component. Responses to these interview questions and analyses of the advice given to teachers in the teacher’s edition of the textbooks were then used to determine a pedagogical philosophy and to develop observation protocols specific to each textbook used in the participating school districts. During each classroom observation, the observer recorded classroom events and activities related to particular presentation features being implemented. Upon completion of the classroom visit, the observer completed a summary form that included recording information about the use of lesson components specific to the given curriculum including whether the component was observed or, in some cases, the extent to which it was observed. The observer also assigned an overall level of implementation rating for both Content Fidelity and Presentation Fidelity based on field notes and a well-defined rubric, well defined in the sense that three anchor points on each scale were characterized in detail (see Figure 1).
Figure 1. Rubric for assigning Content and Presentation Fidelity Ratings. Each lesson rating was independently made using a 1 to 5 scale allowing for the possibility of a high fidelity rating on one aspect of implementation and a lower rating on the other. Finally, the observer completed a classroom climate rating scale where a 1 to 5 rating was given on each of the 10 items that comprised the scale (discussed in a separate paper). Because these protocols were developed after interviewing the developers of the curriculum, observations focused on assessing the extent to which the textbook authors’ intent for the textbook’s use in the classroom was being honored.
1 2 3 4 5 Lower Content Fidelity Moderate Content Fidelity Higher Content Fidelity
The content of the enacted curriculum was largely inconsistent with the written curriculum. The textbook was not the primary source of the lesson content because of omissions, significant modifications, and/or supplementation.
The content of the enacted curriculum was moderately consistent with the written curriculum. Although the textbook was a source of some of the lesson content, other portions of the lesson could not be attributed to the textbook.
The content of the enacted curriculum was consistent with the written curriculum. The textbook was the primary source of the lesson content with little or no deviation or supplementation.
Lower Presentation Fidelity Moderate Presentation Fidelity Higher Presentation Fidelity The presentation of the enacted curriculum was not consistent with the expectations of the textbook authors. During the lesson, the teacher implemented actions/activities that were not recommended and/or neglected to implement actions/activities that were advised or recommended. The teacher placed disproportionate emphasis on particular lesson components at the expense of others.
The presentation of the enacted curriculum was moderately consistent with the expectations of the textbook authors. During the lesson, the teacher either implemented some actions/activities that were not recommended or neglected to implement actions/activities that were advised or recommended. The teacher generally placed appropriate emphasis on each lesson component.
The presentation of the enacted curriculum was consistent with the expectations of textbook authors. During the lesson, the teacher implemented recommended actions/activities and refrained from actions/activities that were not advised or recommended. The teacher placed appropriate emphasis on each lesson components.
7
Data Collection Teachers completed Table of Contents Records electronically at the end of each academic quarter. Classrooms observations were scheduled in advanced to ensure that the observation did not conflict with a test or another school activity. Data from more than 100 classroom observations were collected (3 observations for each teacher participant spread over the school year). Data Sources at the Course Level In this paper, the extent to which the textbook was used during instruction and the manner in which it was used is reported utilizing three indices developed from teacher-reported data on the Table of Contents Records. The indices are (1) Opportunity to Learn index; (2) Extent of Textbook Implementation index; and (3) Textbook Content Taught index. Opportunity to Learn (OTL) index. The OTL index indicates whether the textbook content was being taught or not taught. Content here refers to the content objectives included in the textbook lessons and includes content taught primarily from the textbook or from alternative sources. The OTL index is computed by summing the frequency of occurrence of the first three options (reported across all textbook lessons on a Table of Contents Record) and then dividing by the total number of lessons included in the particular textbook. The OTL index essentially represents the percentage of the content in the textbook that students were provided an opportunity to learn.
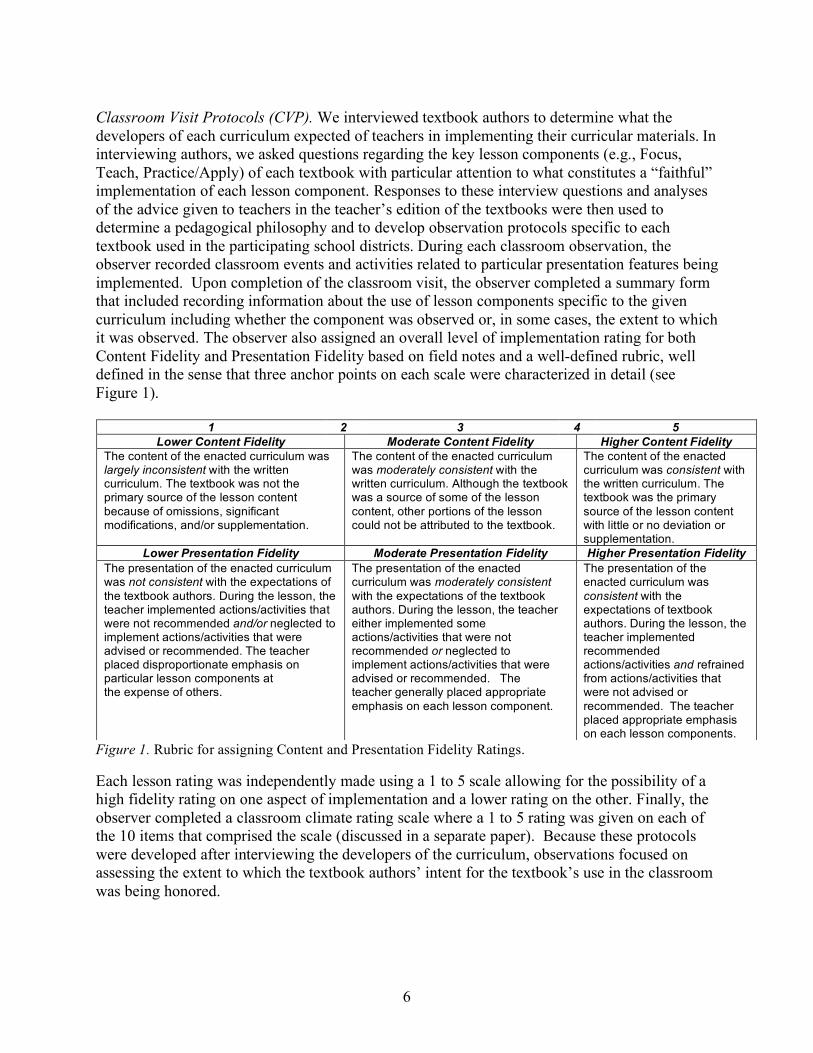
It should be noted that when interpreting OTL indices, an index of 63 does not imply that the coverage corresponds to the first 63% of the textbook, as illustrated in Figure 2 below. The first graph depicts the percent of the textbook lessons that were taught during the course of a year whereas the second graph reveals the location in the textbook lessons that were taught or not taught. Thus, for a teacher (Teacher 26) implementing the integrated textbook, we see that many of the lessons skipped occurred midway through the textbook.
a
63.64Int 26
OTL Index: Percent of Integrated Textbook Lessons Taught OTLIndex
63.64Int 26
Figure 2. Opportunity to Learn (OTL) index for a single teacher implementing an integrated textbook. Note: Heavy shading indicates the sum of the frequency of the first three options reported on TOC: (1) content taught primarily from textbook; (2) content taught from the textbook with some supplementation; (3) content taught primarily from an alternative source. White indicates content not taught. Extent of Textbook Implementation Index (ETI). The ETI index is determined by weighting each of the first three options provided to the teachers on the Table of Contents Record. The largest weight was given when the first option was identified for a lesson, i.e., content was taught primarily from the textbook. This was given a weight of 1. The lowest weight of 0 was given to the last option, i.e., content not taught. The two options in between, content taught with supplementation and content taught primarily from an alternative source were assigned weights
8
of
!
2
3and
!
1
3, respectively. The index was then calculated by summing the weights across textbook
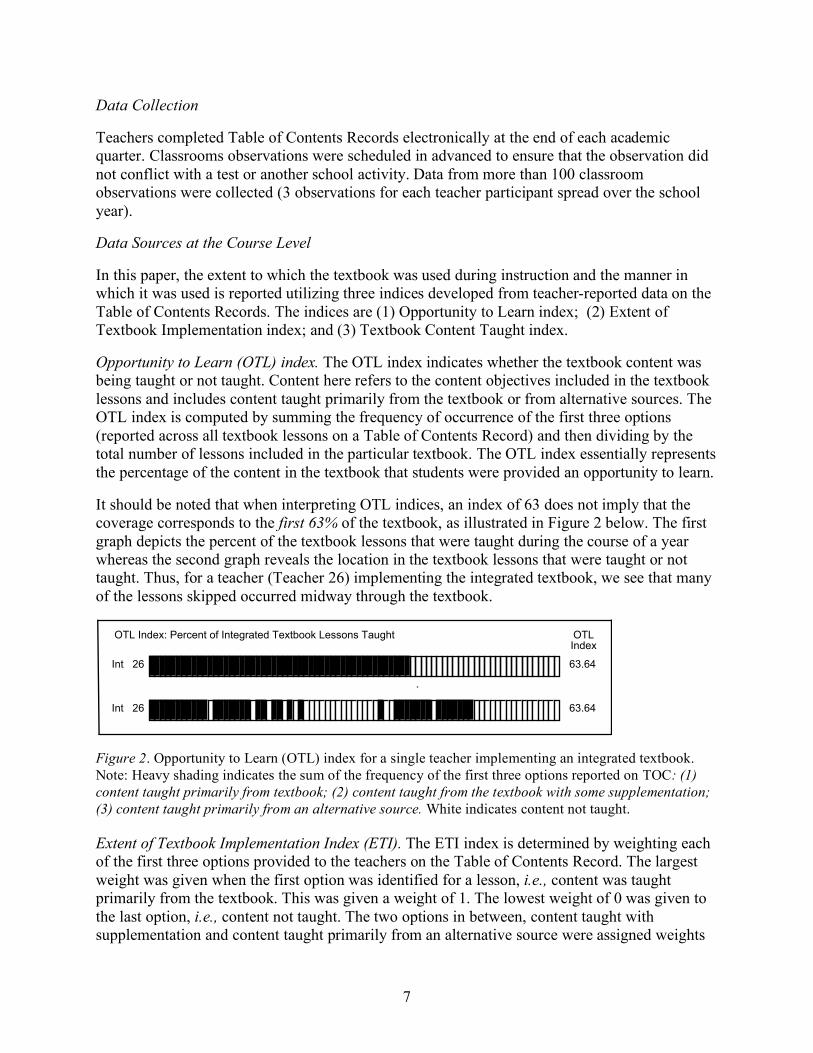
lessons and then dividing by the number of lessons contained in each respective textbook. The quotient was then multiplied by 100 giving the ETI index on a scale ranging from 0 to 100. An index of 100 would represent that every lesson contained in the textbook was taught directly from the textbook and done so without supplementation or use of alternate sources. An index of 0 would indicate that no lessons from the textbook were taught. As an example, Teacher 26, who taught from the integrated curriculum, reported 29 lessons taught primarily from the textbook, 11 lessons taught from the textbook with some supplementation, 9 taught primarily from an alternative source, and 28 not taught out of a total of 77 lessons. Thus, the ETI index was calculated as follows:
ETI =1 29( ) +
2
311( ) +
1
39( ) + 0 28( )
77!100 = 51.08
This index indicates the degree to which the content contained in the lessons was taught directly from the textbook. Note the heavy shading in Figure 3 takes on a different connotation than in Figure 2. In particular, the heavy shading indicates only lessons that are directly taught from the textbook. The crosshatched shading indicates lessons taught with supplementation, diagonal shading for lessons taught from another source, and unshaded for lessons not taught. Thus the first graph below depicts the manner in which Teacher 26 taught each individual textbook lesson. When these lessons are grouped together by method taught in the second graph, it reveals the proportion of the content of the lessons that were taught directly from the text, taught with some supplementation, taught primarily with alternatives to the textbook, or not taught.
a
ETI Index: Extent to Which Textbook Content is Taught Directly from the Integrated Textbook ETIIndex51.08Int 26
51.08Int 26
content taught primarily from textbookcontent taught from the textbook with some supplementationcontent taught primarily from an alternative sourcecontent not taught
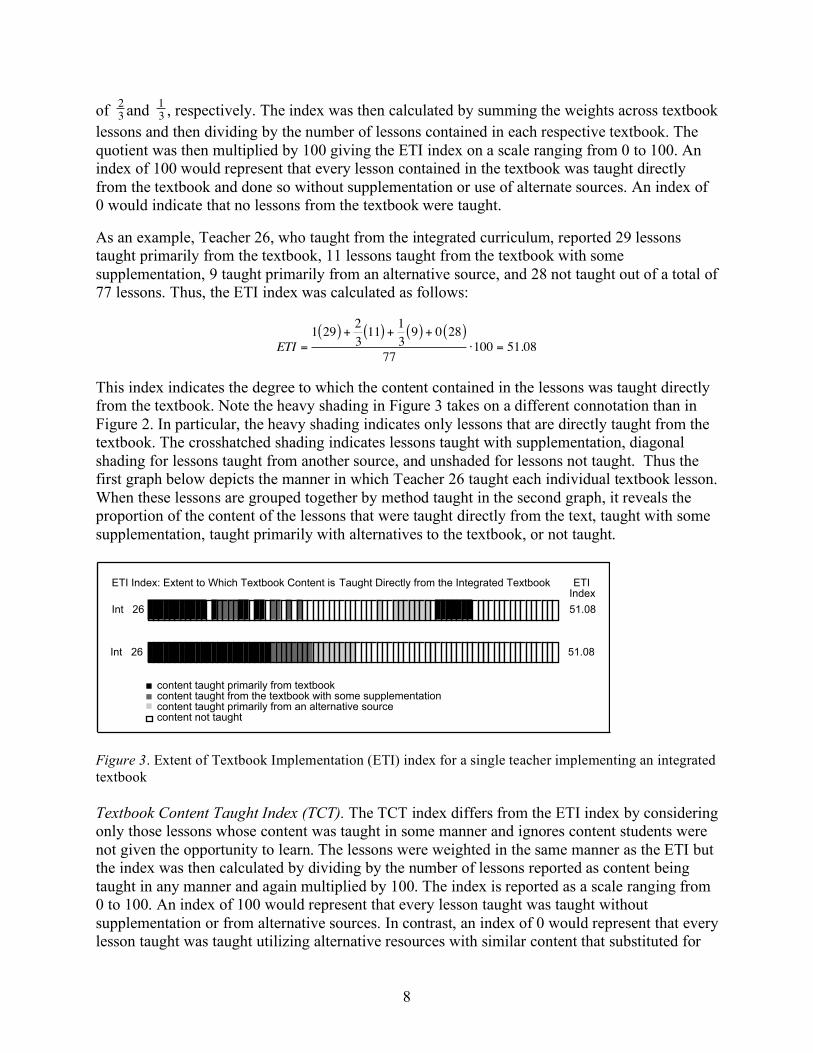
Figure 3. Extent of Textbook Implementation (ETI) index for a single teacher implementing an integrated textbook Textbook Content Taught Index (TCT). The TCT index differs from the ETI index by considering only those lessons whose content was taught in some manner and ignores content students were not given the opportunity to learn. The lessons were weighted in the same manner as the ETI but the index was then calculated by dividing by the number of lessons reported as content being taught in any manner and again multiplied by 100. The index is reported as a scale ranging from 0 to 100. An index of 100 would represent that every lesson taught was taught without supplementation or from alternative sources. In contrast, an index of 0 would represent that every lesson taught was taught utilizing alternative resources with similar content that substituted for
9
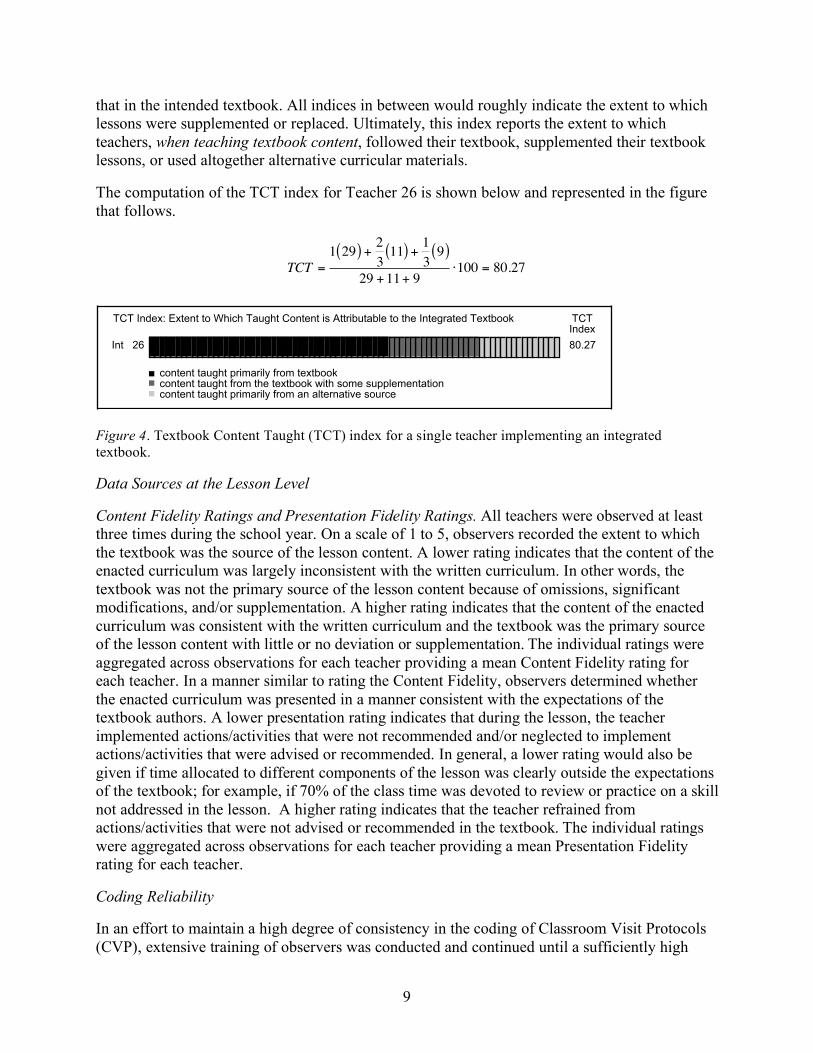
that in the intended textbook. All indices in between would roughly indicate the extent to which lessons were supplemented or replaced. Ultimately, this index reports the extent to which teachers, when teaching textbook content, followed their textbook, supplemented their textbook lessons, or used altogether alternative curricular materials. The computation of the TCT index for Teacher 26 is shown below and represented in the figure that follows.
TCT =1 29( ) +
2
311( ) +
1
39( )
29 +11+ 9!100 = 80.27
a
TCT Index: Extent to Which Taught Content is Attributable to the Integrated Textbook TCTIndex80.27Int 26
content taught primarily from textbookcontent taught from the textbook with some supplementationcontent taught primarily from an alternative source
Figure 4. Textbook Content Taught (TCT) index for a single teacher implementing an integrated textbook. Data Sources at the Lesson Level Content Fidelity Ratings and Presentation Fidelity Ratings. All teachers were observed at least three times during the school year. On a scale of 1 to 5, observers recorded the extent to which the textbook was the source of the lesson content. A lower rating indicates that the content of the enacted curriculum was largely inconsistent with the written curriculum. In other words, the textbook was not the primary source of the lesson content because of omissions, significant modifications, and/or supplementation. A higher rating indicates that the content of the enacted curriculum was consistent with the written curriculum and the textbook was the primary source of the lesson content with little or no deviation or supplementation. The individual ratings were aggregated across observations for each teacher providing a mean Content Fidelity rating for each teacher. In a manner similar to rating the Content Fidelity, observers determined whether the enacted curriculum was presented in a manner consistent with the expectations of the textbook authors. A lower presentation rating indicates that during the lesson, the teacher implemented actions/activities that were not recommended and/or neglected to implement actions/activities that were advised or recommended. In general, a lower rating would also be given if time allocated to different components of the lesson was clearly outside the expectations of the textbook; for example, if 70% of the class time was devoted to review or practice on a skill not addressed in the lesson. A higher rating indicates that the teacher refrained from actions/activities that were not advised or recommended in the textbook. The individual ratings were aggregated across observations for each teacher providing a mean Presentation Fidelity rating for each teacher. Coding Reliability In an effort to maintain a high degree of consistency in the coding of Classroom Visit Protocols (CVP), extensive training of observers was conducted and continued until a sufficiently high
10
degree of reliability was achieved on Content Fidelity and Presentation Fidelity ratings. Furthermore, during the first year, a confirmatory reliability test was conducted by double coding 15 lessons during data collection. These lessons were neither randomly selected nor purposefully selected but instead chosen based on feasible observation schedules. That is, two researchers attended the same lesson only when their individual schedules permitted such an opportunity. We sought to double code at least one lesson for every school in each year of data collection. Individual researchers took field notes and immediately following the lesson each researcher worked in isolation to complete the protocol including the content and presentation judgments. When all coding was completed, researchers compared codes, negotiating disagreements until they were resolved. Consensus codes were used in subsequent analysis of implementation data but the set of original assigned codes were used to gauge the ongoing reliability of the CVP coding. Overall, the reliability of the coding of Content Fidelity and Presentation Fidelity was quite high. With regard to Content Fidelity, 14 of the 15 rating pairs from the two observers were identical. In the one instance when the two observers disagreed, their individual ratings were within one unit of each other. The results for Presentation Fidelity revealed 10 of the 15 rating pairs were identical. Similar to Content Fidelity, the remaining 5 pairs were all within one unit of each other.
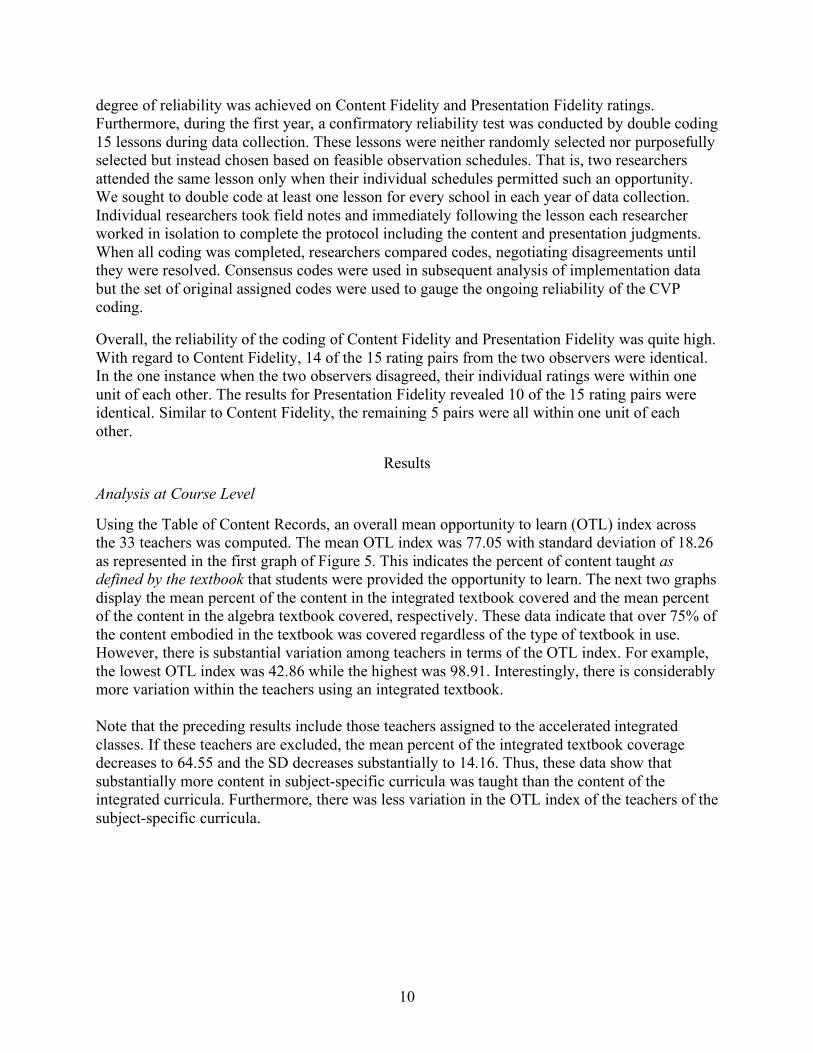
Results Analysis at Course Level Using the Table of Content Records, an overall mean opportunity to learn (OTL) index across the 33 teachers was computed. The mean OTL index was 77.05 with standard deviation of 18.26 as represented in the first graph of Figure 5. This indicates the percent of content taught as defined by the textbook that students were provided the opportunity to learn. The next two graphs display the mean percent of the content in the integrated textbook covered and the mean percent of the content in the algebra textbook covered, respectively. These data indicate that over 75% of the content embodied in the textbook was covered regardless of the type of textbook in use. However, there is substantial variation among teachers in terms of the OTL index. For example, the lowest OTL index was 42.86 while the highest was 98.91. Interestingly, there is considerably more variation within the teachers using an integrated textbook. Note that the preceding results include those teachers assigned to the accelerated integrated classes. If these teachers are excluded, the mean percent of the integrated textbook coverage decreases to 64.55 and the SD decreases substantially to 14.16. Thus, these data show that substantially more content in subject-specific curricula was taught than the content of the integrated curricula. Furthermore, there was less variation in the OTL index of the teachers of the subject-specific curricula.
11
a
OTL Index: Percent of Textbook Lessons Taught
77.05(18.26)All
75.65(24.26)Int
78.38(10.13)SS
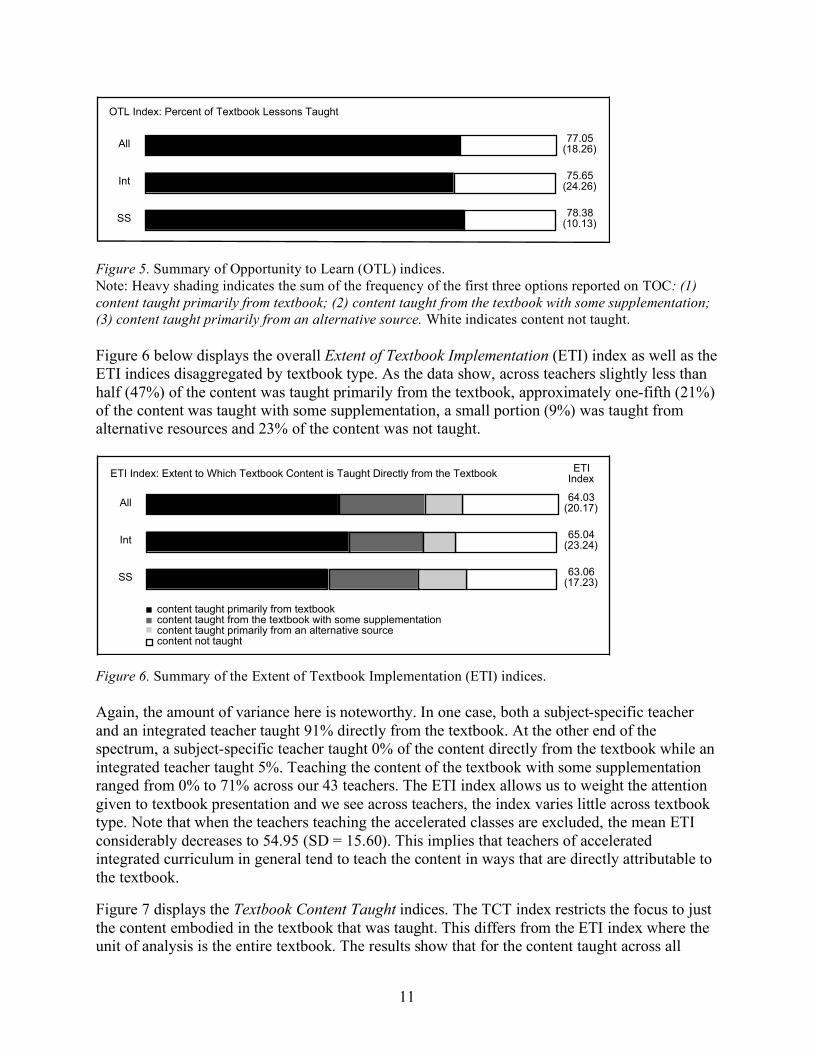
Figure 5. Summary of Opportunity to Learn (OTL) indices. Note: Heavy shading indicates the sum of the frequency of the first three options reported on TOC: (1) content taught primarily from textbook; (2) content taught from the textbook with some supplementation; (3) content taught primarily from an alternative source. White indicates content not taught. Figure 6 below displays the overall Extent of Textbook Implementation (ETI) index as well as the ETI indices disaggregated by textbook type. As the data show, across teachers slightly less than half (47%) of the content was taught primarily from the textbook, approximately one-fifth (21%) of the content was taught with some supplementation, a small portion (9%) was taught from alternative resources and 23% of the content was not taught.
a
ETI Index: Extent to Which Textbook Content is Taught Directly from the Textbook
content taught primarily from textbookcontent taught from the textbook with some supplementationcontent taught primarily from an alternative sourcecontent not taught
ETIIndex
64.03(20.17)All
65.04(23.24)Int
63.06(17.23)SS
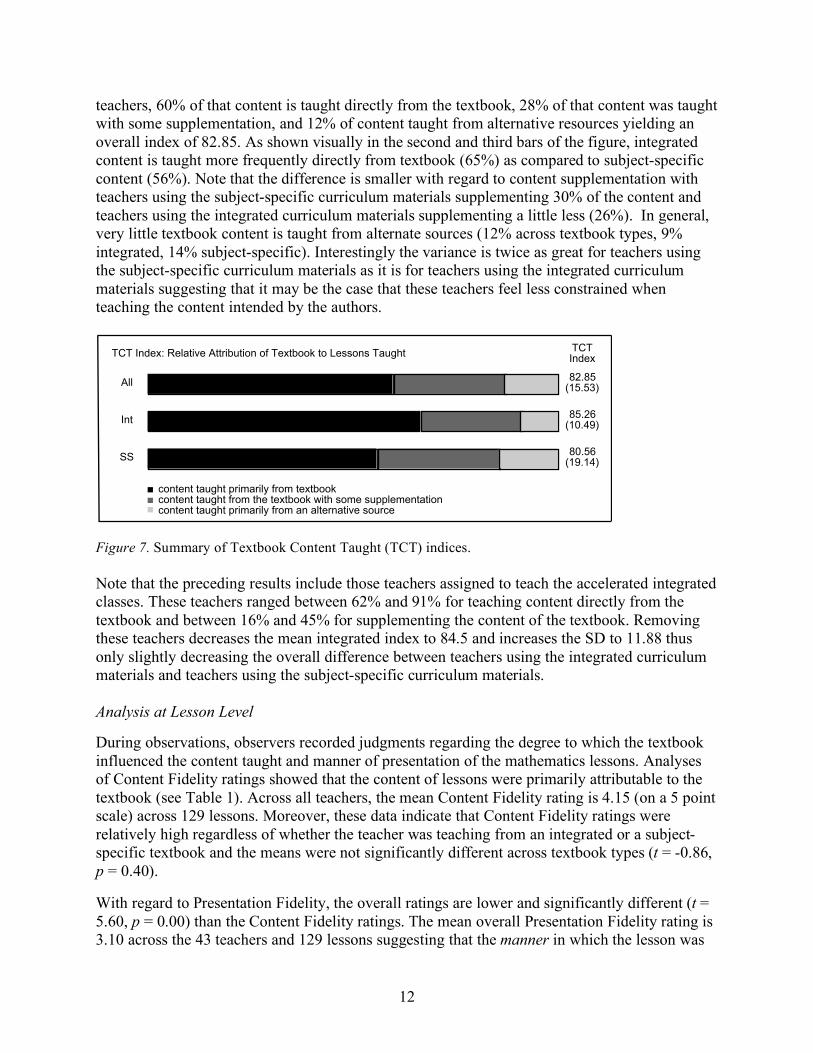
Figure 6. Summary of the Extent of Textbook Implementation (ETI) indices. Again, the amount of variance here is noteworthy. In one case, both a subject-specific teacher and an integrated teacher taught 91% directly from the textbook. At the other end of the spectrum, a subject-specific teacher taught 0% of the content directly from the textbook while an integrated teacher taught 5%. Teaching the content of the textbook with some supplementation ranged from 0% to 71% across our 43 teachers. The ETI index allows us to weight the attention given to textbook presentation and we see across teachers, the index varies little across textbook type. Note that when the teachers teaching the accelerated classes are excluded, the mean ETI considerably decreases to 54.95 (SD = 15.60). This implies that teachers of accelerated integrated curriculum in general tend to teach the content in ways that are directly attributable to the textbook. Figure 7 displays the Textbook Content Taught indices. The TCT index restricts the focus to just the content embodied in the textbook that was taught. This differs from the ETI index where the unit of analysis is the entire textbook. The results show that for the content taught across all
12
teachers, 60% of that content is taught directly from the textbook, 28% of that content was taught with some supplementation, and 12% of content taught from alternative resources yielding an overall index of 82.85. As shown visually in the second and third bars of the figure, integrated content is taught more frequently directly from textbook (65%) as compared to subject-specific content (56%). Note that the difference is smaller with regard to content supplementation with teachers using the subject-specific curriculum materials supplementing 30% of the content and teachers using the integrated curriculum materials supplementing a little less (26%). In general, very little textbook content is taught from alternate sources (12% across textbook types, 9% integrated, 14% subject-specific). Interestingly the variance is twice as great for teachers using the subject-specific curriculum materials as it is for teachers using the integrated curriculum materials suggesting that it may be the case that these teachers feel less constrained when teaching the content intended by the authors.
a
TCT Index: Relative Attribution of Textbook to Lessons Taught
content taught primarily from textbookcontent taught from the textbook with some supplementationcontent taught primarily from an alternative source
TCTIndex
82.85(15.53)All
85.26(10.49)Int
80.56(19.14)SS
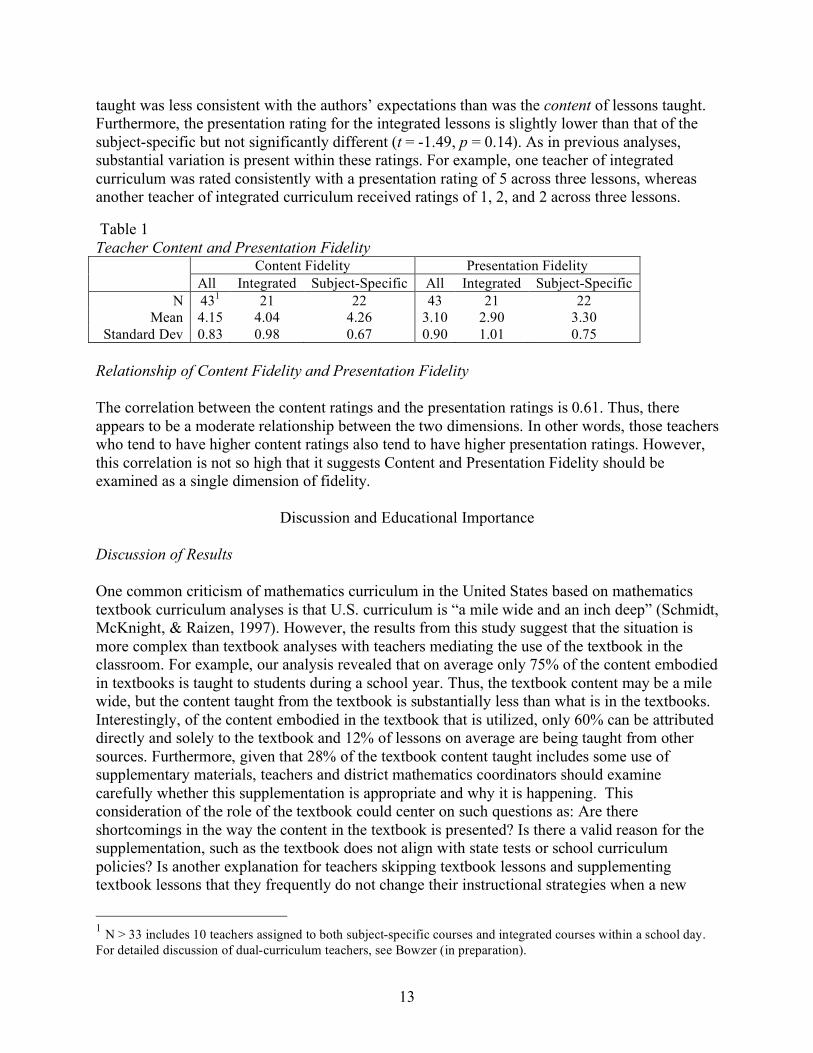
Figure 7. Summary of Textbook Content Taught (TCT) indices. Note that the preceding results include those teachers assigned to teach the accelerated integrated classes. These teachers ranged between 62% and 91% for teaching content directly from the textbook and between 16% and 45% for supplementing the content of the textbook. Removing these teachers decreases the mean integrated index to 84.5 and increases the SD to 11.88 thus only slightly decreasing the overall difference between teachers using the integrated curriculum materials and teachers using the subject-specific curriculum materials. Analysis at Lesson Level During observations, observers recorded judgments regarding the degree to which the textbook influenced the content taught and manner of presentation of the mathematics lessons. Analyses of Content Fidelity ratings showed that the content of lessons were primarily attributable to the textbook (see Table 1). Across all teachers, the mean Content Fidelity rating is 4.15 (on a 5 point scale) across 129 lessons. Moreover, these data indicate that Content Fidelity ratings were relatively high regardless of whether the teacher was teaching from an integrated or a subject-specific textbook and the means were not significantly different across textbook types (t = -0.86, p = 0.40). With regard to Presentation Fidelity, the overall ratings are lower and significantly different (t = 5.60, p = 0.00) than the Content Fidelity ratings. The mean overall Presentation Fidelity rating is 3.10 across the 43 teachers and 129 lessons suggesting that the manner in which the lesson was
13
taught was less consistent with the authors’ expectations than was the content of lessons taught. Furthermore, the presentation rating for the integrated lessons is slightly lower than that of the subject-specific but not significantly different (t = -1.49, p = 0.14). As in previous analyses, substantial variation is present within these ratings. For example, one teacher of integrated curriculum was rated consistently with a presentation rating of 5 across three lessons, whereas another teacher of integrated curriculum received ratings of 1, 2, and 2 across three lessons. Table 1 Teacher Content and Presentation Fidelity Content Fidelity Presentation Fidelity All Integrated Subject-Specific All Integrated Subject-Specific
N 431 21 22 43 21 22 Mean 4.15 4.04 4.26 3.10 2.90 3.30
Standard Dev 0.83 0.98 0.67 0.90 1.01 0.75 Relationship of Content Fidelity and Presentation Fidelity The correlation between the content ratings and the presentation ratings is 0.61. Thus, there appears to be a moderate relationship between the two dimensions. In other words, those teachers who tend to have higher content ratings also tend to have higher presentation ratings. However, this correlation is not so high that it suggests Content and Presentation Fidelity should be examined as a single dimension of fidelity.
Discussion and Educational Importance
Discussion of Results One common criticism of mathematics curriculum in the United States based on mathematics textbook curriculum analyses is that U.S. curriculum is “a mile wide and an inch deep” (Schmidt, McKnight, & Raizen, 1997). However, the results from this study suggest that the situation is more complex than textbook analyses with teachers mediating the use of the textbook in the classroom. For example, our analysis revealed that on average only 75% of the content embodied in textbooks is taught to students during a school year. Thus, the textbook content may be a mile wide, but the content taught from the textbook is substantially less than what is in the textbooks. Interestingly, of the content embodied in the textbook that is utilized, only 60% can be attributed directly and solely to the textbook and 12% of lessons on average are being taught from other sources. Furthermore, given that 28% of the textbook content taught includes some use of supplementary materials, teachers and district mathematics coordinators should examine carefully whether this supplementation is appropriate and why it is happening. This consideration of the role of the textbook could center on such questions as: Are there shortcomings in the way the content in the textbook is presented? Is there a valid reason for the supplementation, such as the textbook does not align with state tests or school curriculum policies? Is another explanation for teachers skipping textbook lessons and supplementing textbook lessons that they frequently do not change their instructional strategies when a new
1 N > 33 includes 10 teachers assigned to both subject-specific courses and integrated courses within a school day. For detailed discussion of dual-curriculum teachers, see Bowzer (in preparation).
14
textbook is adopted? Further pressures are added to teachers who are assigned to accelerated courses with the expectation of covering more material within a school year. On average, the teachers teaching accelerated courses supplement and omit lessons at approximately the same rate as their counterparts teaching regular integrated courses. For example, teachers of accelerated classes supplemented 22% of their lessons whereas teachers of regular classes supplemented 17% of their lessons. Thus, the results of this study indicate that moving through the content faster does not mean that teachers have to substantially deviate from the author’s intent with regard to content. When Content and Presentation Fidelity are considered, teachers tend to be more faithful in terms of Content Fidelity than in terms of Presentation Fidelity. However, across teachers there is considerable variation on both dimensions. For example, the range on the content scale was 1 to 5, and we had 10 of 129 lessons for which the teacher was rated a 1 on this measure. On the other hand we had 74 lessons for which the teacher’s rating was a 5. This result may be viewed negatively by textbook authors as they take care in sequencing topics, choosing the number and kind of exercises to include, and so on. The Presentation Fidelity ratings, which are lower than the Content Fidelity ratings, provide evidence that adopting a particular curriculum does not automatically change instructional practices (Ball & Cohen, 1996). Many new curricular programs include presentation strategies that were not well developed as part of many teacher education programs (e.g., an investigative approach to instruction, use of small cooperative groups, and so on). This may contribute to the wide range in Presentation Fidelity ratings we observed across teachers. For example, the range on this scale was 1 to 5, and we had 13 of 129 lessons for which the teacher was rated a 1 on this measure. On the other hand we had only 15 lessons for which the teacher’s rating was a 5. Noteworthy, there were five times as many lessons with a content rating of 5 than there were lessons with presentation rating of 5. This disparity is worthy of further research. It is a matter of professional judgment whether these results should be viewed positively or negatively, but the report does provide a clear picture of how mathematics textbooks are used to assist teachers in implementation of their curriculum materials. Needed Research Student achievement in secondary school mathematics is influenced in major ways by the way in which curriculum materials are used, the mathematics content students are given the opportunity to learn, and the manner in which the mathematical learning is facilitated; however, our knowledge of the effects of different approaches to mathematical content in textbooks is limited. Certainly studying what students learn from different organizational patterns of mathematics is important, however, it is impossible to judge effectiveness of curriculum and draw inferences regarding student learning without knowledge about how those curricula are being used (NRC, 2004). It has been well documented that the shortage of qualified mathematics teachers means many mathematics teaching positions are being filled by teachers with little preparation in mathematics or mathematics teaching (Ingersoll, 2004). The relationship between this phenomenon and the
15
wide range of Presentation Fidelity we found in our study suggests an interesting research question that should be pursued. Discussion of data and findings related to questions such as those we identified is critical for several reasons. School districts have their choice of a large number of textbooks from which to make their adoption and these textbooks differ in substantive ways from one another. In order to make informed decisions, school personnel, curriculum developers, and policy makers need high quality comparative studies of how mathematics curricula of differing types are used. Similar comparative studies are also needed at the high school level to show how different organizations of mathematics curricula impact students’ mathematics learning. Furthermore, understanding how teachers use textbooks assists researchers when building theory concerning the impact of curriculum on student achievement.
16
References Ball, D. & Cohen, D. (1996). Reform by the book: What is – or might be – the role of curriculum
materials in teacher learning and instructional reform? Educational Researcher, 25(9), 6-8. Bowzer, A. (in preparation). Identity and curricular construction: A study of teacher interaction
with mathematics curricula of two types. Unpublished doctoral dissertation, University of Missouri.
Chávez, O. (2006). From the textbook to the enacted Curriculum. In S. Alatorre, J. L. Cortina,
M. Sáiz, & A. Méndez (Eds.) Proceedings of the 28th annual meeting of the North American Chapter of the International Group for the Psychology of Mathematics Education. Mérida, México: Universidad Pedagógica Nacional.
Coxford, A., Fey, J., Hirsch, C., Schoen, H., Burrill, G., Hart, E., & Watkins, A. (1998).
Contemporary Mathematics in Context. New York, NY: Glencoe/McGraw Hill. Floden, R. E. (2002). The measurement of opportunity to learn. In A.C. Porter & A. Gamoran (Eds.), Methodological advances in cross-national surveys of educational achievement (pp. 231-266). Washington, DC: National Academy Press. Grouws, D. A. & Smith, M. (2000). NAEP findings on the preparation and practices of mathematics teachers. In E.A Silver & P.A. Kenney (Eds.), Results from the Seventh Mathematics Assessment of the National Assessment of Educational Progress (pp. 107-139). Reston, VA: National Council of Teachers of Mathematics. Hiebert, J. (1999). Relationships between research and the NCTM standards. Journal for Research in Mathematics Education, 30, 3-19. Hiebert, J. & Grouws, D. (2007). The effects of classroom mathematics teaching on students’ learning. In F. K. Lester (Ed.), Second handbook of research on mathematics teaching and learning (pp. 371-404). Charlotte, NC: Information Age Publishing. Holliday, B., Cuevas, G., Marks, D., Casey, R., Moore-Davis, B., Carter, J., Day, R., & Hayek,
L. (2005). Algebra 1. Columbus, OH: Glencoe. Ingersoll, R. M. (2004). Four myths about America’s teacher quality problem. In M. Smylie & d.
Miretzky (Eds.), Developing the teacher workforce: 103rd Yearbook of the National Society for the Study of Education (pp.1-33). Chicago: University of Chicago Press.
Kilpatrick, J. (2003). What works? In S.L. Senk & D.R. Thompson (Eds.), Standards-based school mathematics curricula: What are they? What do students learn? (pp. 471-488). Mahwah, NJ: Lawrence Erlbaum Associates. Mills, S. C., & Ragan, T. J. (2000). A tool for analyzing implementation fidelity of an integrated learning system. Educational Technology, Research, and Development. 48(4), 21-41.
17
National Research Council. (2004). On evaluating curricular effectiveness: Judging the quality of K-12 mathematics evaluations. Washington, DC: National Academies Press. O’Donnell, C. L. (2008). Defining, conceptualizing, and measuring fidelity of implementation and its relationship to outcomes in K-12 intervention research. Review of Educational Research, 78(1), 33-84. Remillard, J. (2005). Examining key concepts in research on teachers’ use of mathematics
curricula. Review of Educational Research, 75(2), 211-246. Schmidt, W.H., McKnight, C.C., & Raizen, S.C. (1997). A splintered vision: An investigation of US science and mathematics education. Dordrecht, The Netherlands: Kluwer Acadmic Publishers. Stein, M.K., Remillard, J., & Smith, M.S. (2007). How curriculum influences student learning.
In F. K. Lester (Ed.) Second Handbook of Research on Mathematics Teaching and Learning (Vol. 1, pp. 319-370). Charlotte, NC: Information Age.
Scott, D. (1994, November). “Fidelity” mentality is no reality: A message for curriculum developers. Paper presented at Australian Association for Research in Education (AARE). Tarr, J., Chávez, O., Reys, R. & Reys, B. (2006). From the written to enacted curricula:
Intermediary role of middle school mathematics in shaping students’ opportunity to learn. School Science and Mathematics, 106(4), 191-201.
Weiss, I. R., Banilower, E. R., McMahon, K. C., & Smith, P. S. (2001). Report of the 2000
national survey of science and mathematics education. Chapel Hill, NC: Horizon Research, Inc.
Weiss, I.R., Pasley, J.D., Smith, P.S., Banilower, E.R., & Heck, D.J. (2003). Looking inside the
classroom: A study of the K-12 mathematics and science education in the United States. Chapel Hill, NC: Horizon Research, Inc.