aspen property trust - aspen group€¦ · aspen property trust arsn 104 807 767 ... during the...
TRANSCRIPT
ASPEN GROUP LIMITED
ABN 50 004 160 927
ASPEN PROPERTY TRUST
ARSN 104 807 767
Responsible Entity: Aspen Funds Management Limited ABN 48 104 322 278
Appendix 4D
For the period ended
31 December 2016
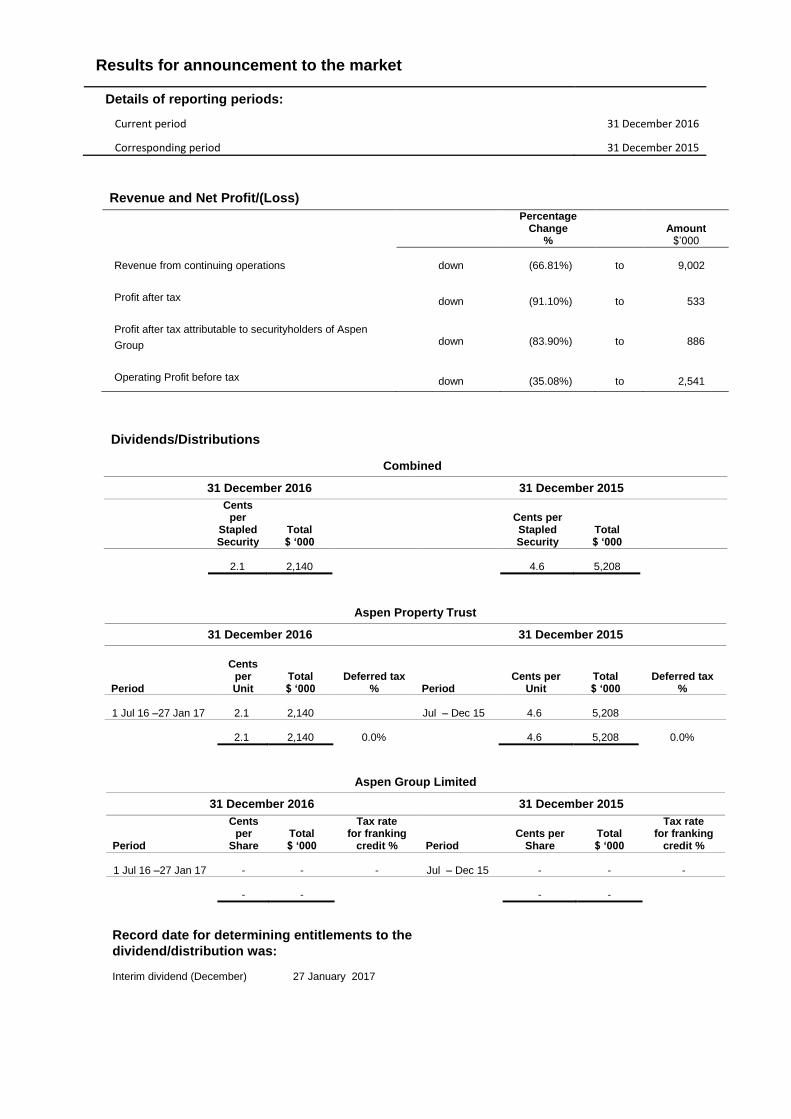
Results for announcement to the market
Details of reporting periods:
Current period
Corresponding period
31 December 2016
31 December 2015
Revenue and Net Profit/(Loss)
Percentage Change
% Amount $’000
Revenue from continuing operations down (66.81%) to 9,002
Profit after tax down (91.10%) to 533
Profit after tax attributable to securityholders of Aspen
Group down (83.90%) to 886
Operating Profit before tax down (35.08%) to 2,541
Dividends/Distributions
Combined
31 December 2016 31 December 2015
Cents per
Stapled Security
Total $ ‘000
Cents per Stapled Security
Total $ ‘000
2.1 2,140 4.6 5,208
Aspen Property Trust
31 December 2016 31 December 2015
Period
Cents
per Unit
Total $ ‘000
Deferred tax % Period
Cents per Unit
Total $ ‘000
Deferred tax %
1 Jul 16 –27 Jan 17 2.1 2,140 Jul – Dec 15 4.6 5,208
2.1 2,140 0.0% 4.6 5,208 0.0%
Aspen Group Limited
31 December 2016 31 December 2015
Period
Cents per
Share Total $ ‘000
Tax rate for franking
credit % Period Cents per
Share Total $ ‘000
Tax rate for franking
credit %
1 Jul 16 –27 Jan 17 - - - Jul – Dec 15 - - -
- - - -
Record date for determining entitlements to the
dividend/distribution was:
Interim dividend (December)
27 January 2017
Page 1
ASPEN GROUP LIMITED (THE COMPANY)
(ABN: 50 004 160 927)
ASPEN PROPERTY TRUST (THE TRUST)
(ARSN: 104 807 767)
ASPEN FUNDS MANAGEMENT LIMITED (AS RESPONSIBLE ENTITY)
(ABN: 48 104 322 278)
INTERIM FINANCIAL REPORT FOR THE PERIOD ENDED
31 December 2016
Page 2
INTERIM FINANCIAL REPORT FOR THE PERIOD ENDED
31 December 2016
Interim financial report table of contents
Directors Page 3
Operating and financial review Page 3
Auditor’s independence declaration Page 11
Independent review report Page 12
Condensed consolidated interim financial statements Page 14
Notes to the condensed consolidated interim financial statements Page 20
Directors’ declaration Page 35
Aspen Group for the period ended 31 December 2016
Page 3
Directors’ report The directors present their report together with the consolidated interim financial statements of Aspen Group comprising Aspen
Group Limited (“the Company”), its subsidiaries, Aspen Group’s interest in associates, and its stapled entity Aspen Property Trust
(“the Trust”) and its subsidiaries, which form the Aspen Group (“Aspen Group”), for the period ended 31 December 2016 (“period”)
and the auditor’s review report thereon.
Directors The directors of the Company and Aspen Funds Management Limited (“AFM”), the responsible entity of the Trust, at any time
during or since the end of the period are:
Non – Executive Directors
Clive Appleton
Guy Farrands
John Carter
Executive Director
Clem Salwin Resigned 30 September 2016
Operating and financial review Aspen recorded a profit after tax of $0.533 million for the period (1H FY16: profit of $5.986 million) calculated in accordance with
International Financial Reporting Standards (“IFRS”).
Operating results
Operating Profit (also referred to as “net profit after tax before non-underlying items”) is a non-IFRS measure that is determined to
present, in the opinion of the directors, the operating activities of Aspen in a way that appropriately reflects Aspen’s operating
performance. Operating Profit excludes items such as consolidation/deconsolidation losses and gains and adjustments arising from
the effect of revaluing assets/liabilities (such as derivatives, financial assets and investment property). Other Non-Operating Profit
adjustments are made for realised transactions occurring infrequently and those that are outside the course of Aspen’s core
ongoing business activities.
Operating Profit is determined having regard to principles which include providing clear reconciliation between statutory profit and
Operating Profit in the directors’ report and financial report, including both positive and negative adjustments, maintaining
consistency between reporting periods, and taking into consideration property industry practices.
Aspen Group for the period ended 31 December 2016
Page 4
Directors’ Report (continued)
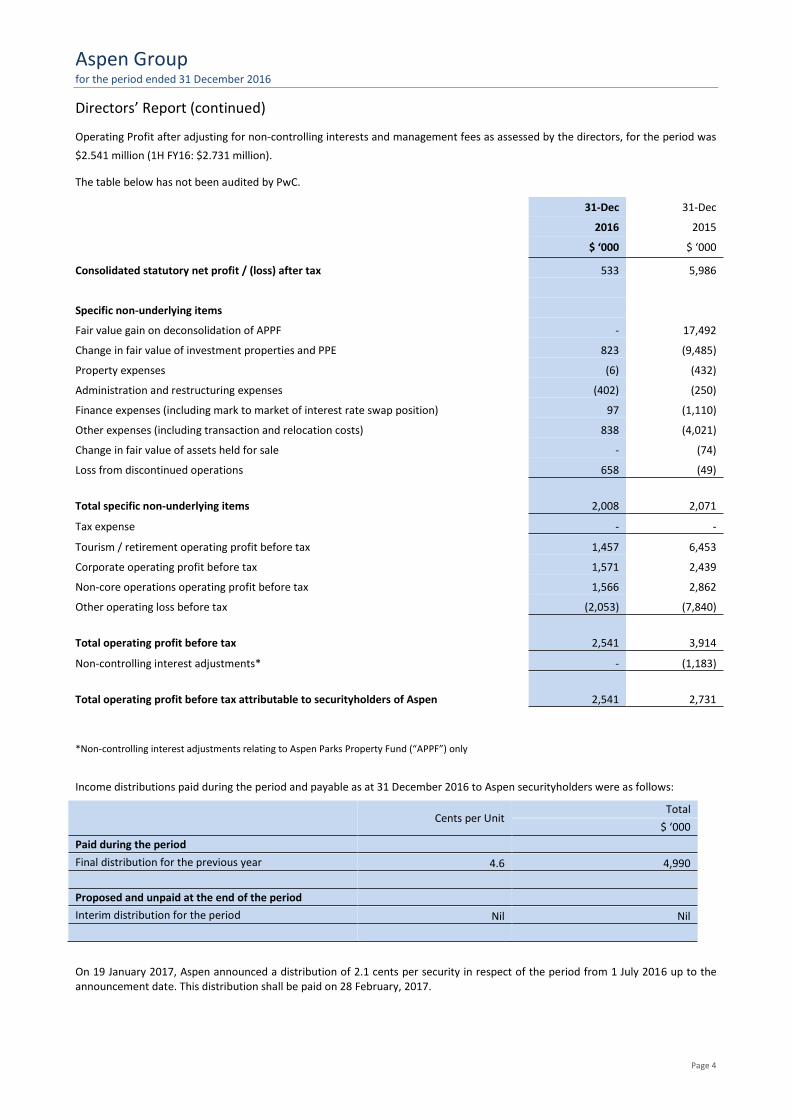
Operating Profit after adjusting for non-controlling interests and management fees as assessed by the directors, for the period was
$2.541 million (1H FY16: $2.731 million).
The table below has not been audited by PwC.
31-Dec 31-Dec
2016 2015
$ ‘000 $ ‘000
Consolidated statutory net profit / (loss) after tax 533 5,986
Specific non-underlying items Fair value gain on deconsolidation of APPF - 17,492
Change in fair value of investment properties and PPE 823 (9,485)
Property expenses (6) (432)
Administration and restructuring expenses (402) (250)
Finance expenses (including mark to market of interest rate swap position) 97 (1,110)
Other expenses (including transaction and relocation costs) 838 (4,021)
Change in fair value of assets held for sale - (74)
Loss from discontinued operations 658 (49)
Total specific non-underlying items 2,008 2,071
Tax expense - -
Tourism / retirement operating profit before tax 1,457 6,453
Corporate operating profit before tax 1,571 2,439
Non-core operations operating profit before tax 1,566 2,862
Other operating loss before tax (2,053) (7,840)
Total operating profit before tax 2,541 3,914
Non-controlling interest adjustments* - (1,183)
Total operating profit before tax attributable to securityholders of Aspen 2,541 2,731
*Non-controlling interest adjustments relating to Aspen Parks Property Fund (“APPF”) only
Income distributions paid during the period and payable as at 31 December 2016 to Aspen securityholders were as follows:
On 19 January 2017, Aspen announced a distribution of 2.1 cents per security in respect of the period from 1 July 2016 up to the announcement date. This distribution shall be paid on 28 February, 2017.
Cents per Unit
Total
$ ‘000
Paid during the period
Final distribution for the previous year 4.6 4,990
Proposed and unpaid at the end of the period
Interim distribution for the period Nil Nil
Aspen Group for the period ended 31 December 2016
Page 5
Directors’ Report (continued)
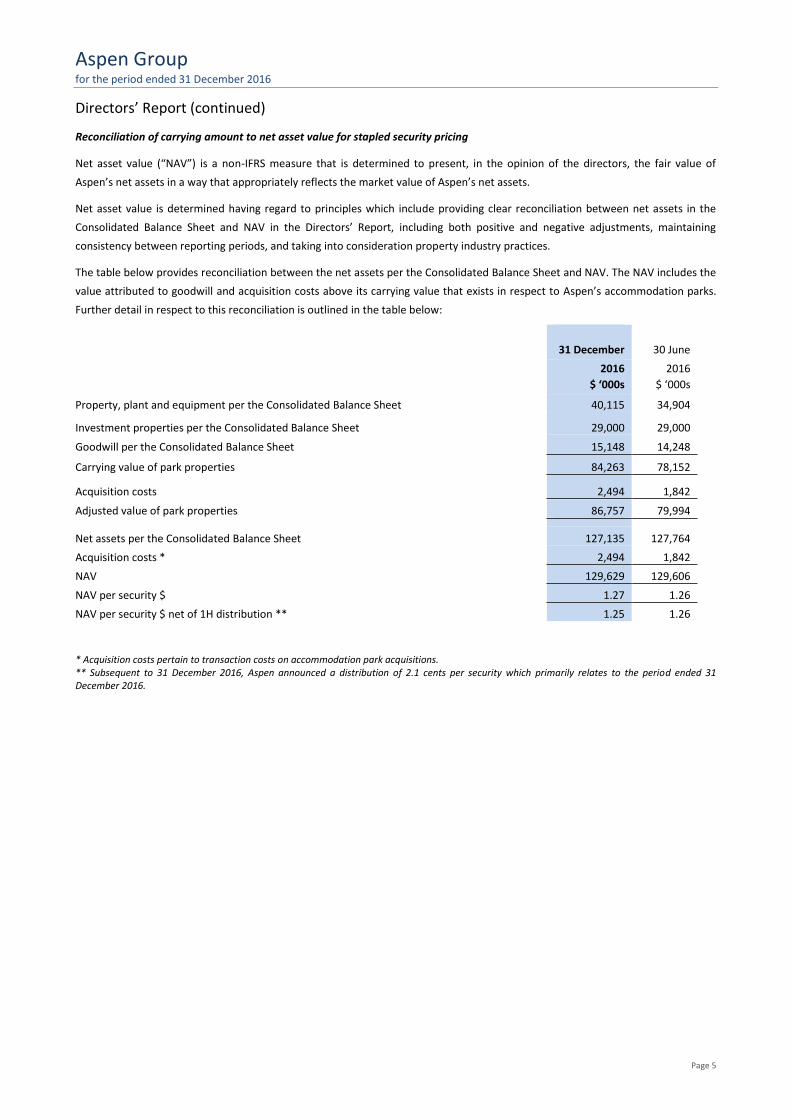
Reconciliation of carrying amount to net asset value for stapled security pricing
Net asset value (“NAV”) is a non-IFRS measure that is determined to present, in the opinion of the directors, the fair value of
Aspen’s net assets in a way that appropriately reflects the market value of Aspen’s net assets.
Net asset value is determined having regard to principles which include providing clear reconciliation between net assets in the
Consolidated Balance Sheet and NAV in the Directors’ Report, including both positive and negative adjustments, maintaining
consistency between reporting periods, and taking into consideration property industry practices.
The table below provides reconciliation between the net assets per the Consolidated Balance Sheet and NAV. The NAV includes the
value attributed to goodwill and acquisition costs above its carrying value that exists in respect to Aspen’s accommodation parks.
Further detail in respect to this reconciliation is outlined in the table below:
31 December
30 June
2016
$ ‘000s
2016
$ ‘000s
Property, plant and equipment per the Consolidated Balance Sheet 40,115 34,904
Investment properties per the Consolidated Balance Sheet 29,000 29,000
Goodwill per the Consolidated Balance Sheet 15,148 14,248
Carrying value of park properties 84,263 78,152
Acquisition costs 2,494 1,842
Adjusted value of park properties 86,757 79,994
Net assets per the Consolidated Balance Sheet 127,135 127,764
Acquisition costs * 2,494 1,842
NAV 129,629 129,606
NAV per security $ 1.27 1.26
NAV per security $ net of 1H distribution ** 1.25 1.26
* Acquisition costs pertain to transaction costs on accommodation park acquisitions. ** Subsequent to 31 December 2016, Aspen announced a distribution of 2.1 cents per security which primarily relates to the period ended 31 December 2016.
Aspen Group for the period ended 31 December 2016
Page 6
Directors’ Report (continued)
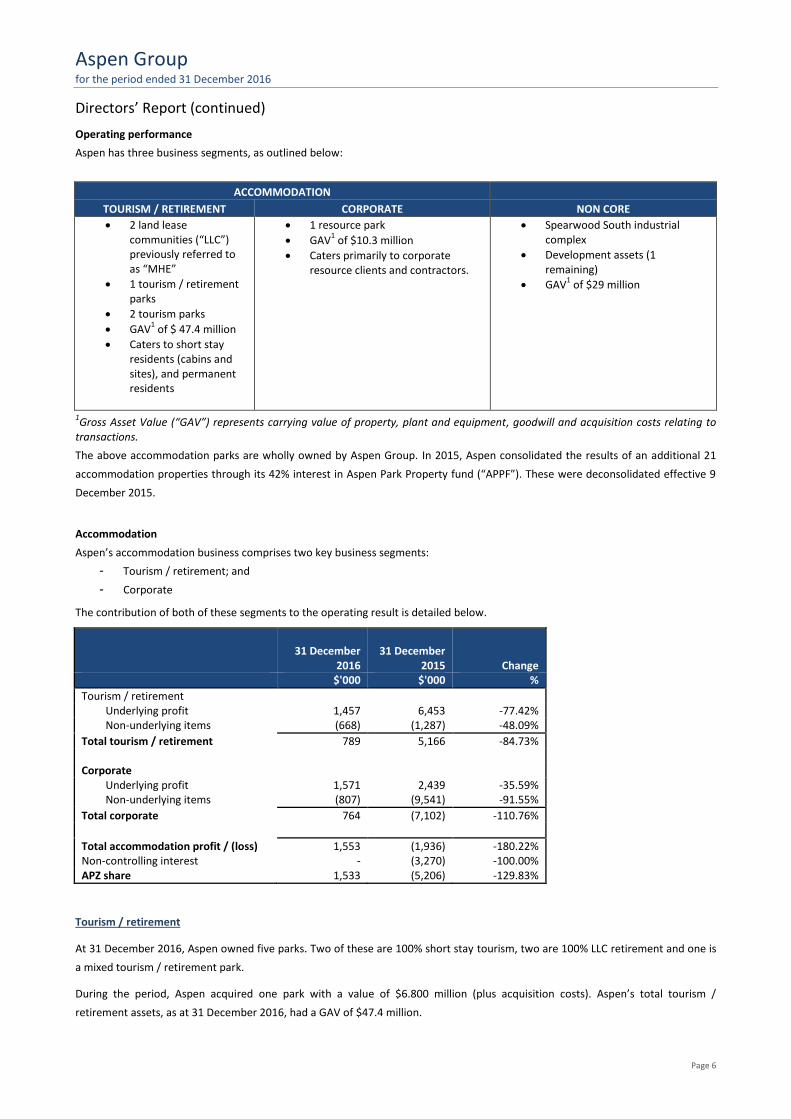
Operating performance
Aspen has three business segments, as outlined below:
ACCOMMODATION TOURISM / RETIREMENT CORPORATE NON CORE
2 land lease communities (“LLC”) previously referred to as “MHE”
1 tourism / retirement parks
2 tourism parks
GAV1 of $ 47.4 million
Caters to short stay residents (cabins and sites), and permanent residents
1 resource park
GAV1 of $10.3 million
Caters primarily to corporate resource clients and contractors.
Spearwood South industrial complex
Development assets (1 remaining)
GAV1 of $29 million
1Gross Asset Value (“GAV”) represents carrying value of property, plant and equipment, goodwill and acquisition costs relating to
transactions.
The above accommodation parks are wholly owned by Aspen Group. In 2015, Aspen consolidated the results of an additional 21
accommodation properties through its 42% interest in Aspen Park Property fund (“APPF”). These were deconsolidated effective 9
December 2015.
Accommodation
Aspen’s accommodation business comprises two key business segments:
- Tourism / retirement; and
- Corporate
The contribution of both of these segments to the operating result is detailed below.
31 December
2016 31 December
2015 Change $'000 $'000 %
Tourism / retirement Underlying profit 1,457 6,453 -77.42%
Non-underlying items (668) (1,287) -48.09%
Total tourism / retirement 789 5,166 -84.73%
Corporate Underlying profit 1,571 2,439 -35.59%
Non-underlying items (807) (9,541) -91.55%
Total corporate 764 (7,102) -110.76%
Total accommodation profit / (loss) 1,553 (1,936) -180.22% Non-controlling interest - (3,270) -100.00% APZ share 1,533 (5,206) -129.83%
Tourism / retirement
At 31 December 2016, Aspen owned five parks. Two of these are 100% short stay tourism, two are 100% LLC retirement and one is
a mixed tourism / retirement park.
During the period, Aspen acquired one park with a value of $6.800 million (plus acquisition costs). Aspen’s total tourism /
retirement assets, as at 31 December 2016, had a GAV of $47.4 million.
Aspen Group for the period ended 31 December 2016
Page 7
Directors’ Report (continued)
As at 31 December 2016, Aspen had $1.175 million of value enhancing works in progress on its parks, with $0.423 million being
incurred during the period. Value enhancing works are aimed at generating additional revenue through increasing either
accommodation capacity intensification or improving the amenity of residents or visitors at a number of parks.
a) Underlying earnings
Aspen’s operating profit from tourism / retirement parks during the period was $1.457 million (1H FY16: $6.453 million), a 77.4%
decrease against the comparative period. This is related to the inclusion of five months of APPF earnings in the comparative period.
b) Non underlying earnings
Aspen had a non-underlying loss of $0.668 million (1H FY16: $1.287 million) within the tourism / retirement segment. The non-
underlying transactions were primarily driven by acquisition costs of $0.652 million which have been included in NAV as at 31
December 2016.
Corporate
At 31 December 2016, Aspen held one corporate park on its balance sheet, being Aspen Karratha Village. Aspen’s lease with its sole
tenant extends to January 2018. This lease secures 83% occupancy within this resource park.
a) Underlying earnings
Aspen’s operating profit from resource parks during the period was $1,571 million (1H FY16: $2.439 million), a 35.5% reduction
against the prior period, primarily driven by reduction in room tariffs compared to the comparative period.
b) Non-underlying items
Aspen had a total non-underlying loss of $0.807 million (1H FY16: $9.541 million) within the resource segment. The non-underlying
items were predominantly attributed to net changes in the fair value of Aspen Karratha Village (a devaluation of $0.807 million).
Non-core
During the period, Aspen recorded an operating profit of $1.566 million (1H FY16: $2.862 million) and a non-underlying loss of
$0.828 million (1H FY16: loss of $0.500 million). The reduction in underlying earnings primarily reflects the contributions of
disposed APPF resort-style properties, and the Spearwood North industrial property included in the comparative period.

Aspen Group for the period ended 31 December 2016
Page 8
Directors’ Report (continued)
Industrial
At 31 December 2016, the industrial property portfolio consists of one property (Spearwood South) at balance date. Net income
from this industrial asset during the period was $1.694 million.
Assets held for sale
At 31 December 2016, Aspen had $7.748 million of development related assets remaining. Of these, $2.525 million were
contracted for sale.
During the period, Aspen continued the wind up of four of the five development syndicates.
Aspen Whitsunday Shores Pty Ltd is the remaining syndicate continuing to hold land assets, and upon the sale and settlement of its
land assets, this syndicate will also commence a process to wind up.
Capital management
Following the divestment of Aspen’s interest in APPF, the Group has operated without debt facilities. Cash reserves as at 31
December 2016 totalled $36.663 million.
Financial position
The NAV of Aspen at 31 December 2016 is $1.27 per security (30 June 2016: $1.26 per security). Including the 1H distribution
announced 19 January 2017, the adjusted NAV is $1.25 per security.
The following diagram outlines the key components of the NAV assessed as at 31 December 2016:
0.47
0.10
0.28
0.08
0.36
0.02 0.01 0.01 (0.05)
1.27
(0.02)
1.25
0.0
0.2
0.4
0.6
0.8
1.0
1.2
1.4
Tourism/Retirement
Corporate Spearwood Assets heldfor sale
Cash Trade and otherreceivables
Deposits Other Liabilities NAV31 December 16
1H Distribution Adjusted NAV31 December 16
Aspen Group for the period ended 31 December 2016
Page 9
Directors’ Report (continued)
Assets
Total assets have decreased by $6.241 million to $132.407 million during the period. This was primarily due to cash movements for
distributions paid to equity holders $5.248 million and payments for the securities buy back $0.693 million.
Liabilities
Total liabilities decreased by $5.612 to $5.272 million during the period. These are primarily a result of the reduction in the
distributions payable to equity holders which were settled during the period.
Equity
Total equity decreased by $0.629 million during the period, primarily as a result of the following:
Security buy back $0.693
Share based compensation movement $0.433 million
offset by net profit ($0.533 million) and revaluation reserve movements ($0.117 million) for the period.
Likely developments
The immediate focus for Aspen is to continue to pursue growth opportunities in the affordable accommodation sector, both in
acquisitions of assets and selected development works on existing accommodation parks.
In addition to this, Aspen will continue to progress the sale of remaining non-core held for sale property assets (carrying value of
$5.910 million).
Safety and environment
No significant accidents or injuries were recorded during the period in respect to Aspen employees.
There were no significant environmental issues during, or subsequent to, the period.
Significant changes in the state of affairs
Other than noted elsewhere in this Interim Financial Report, there were no significant changes in the state of affairs of Aspen
Group that occurred during the period under review.
Principal activities
The principal activities of Aspen during the period were to focus on the affordable accommodation sector, and to continue the
divestment of certain remaining non-core assets.
Other than as disclosed above, there was no significant change in the nature of the activities of Aspen during the period.
Aspen Group for the period ended 31 December 2016
Page 10
Events subsequent to reporting date
The following material events have occurred between the reporting date and the date of this report:
On 19 January 2017, Aspen announced a distribution of 2.1 cents per security in respect of the period from 1 July 2016 up
to the announcement date. This dividend shall be paid on 28 February, 2017;
On 31 January 2017, Aspen settled its acquisition of Barlings Beach Holiday Park for $13.25 million. $12.0 million of the
purchase consideration has been paid using cash reserves of the Group. The balance of $1.25 million is deferred until 31
January 2018; and
On 17 February 2017, Aspen reduced its cash backed bank guarantee facility from $2.5 million to 1.3 million.
Other than as noted above, there has not arisen any other item, transaction or event of a material and unusual nature likely, in the
opinion of the directors of Aspen, to affect significantly the operations of Aspen, the results of those operations, or the state of
affairs of Aspen, in future financial periods.
Auditor’s independence declaration under Section 307C of the Corporations Act 2001
A copy of the auditor’s independence declaration as required under section 307C of the Corporations Act 2001 is set out on page 11
and forms part of the Directors’ Report.
Rounding off
The Consolidated Group is of the kind referred to in ASIC Class Order 2016/191 and in accordance with the Class Order, amounts in
the Financial Report and Directors’ Report have been rounded off to the nearest thousand dollars, unless otherwise stated.
Signed in accordance with a resolution of the directors made pursuant to Sec 298(2) of the Corporations Act 2001.
On behalf of the directors of AGL and AFM
Clive Appleton
Chairman
SYDNEY, 21 February 2017
pwc
Independent auditor's review report to the stapled security holders of Aspen Group Limited
Report on the Half-Year Financial Report We have reviewed the accompanying half-year financial report of Aspen Group Limited (the company), which comprises the condensed consolidated balance sheet as at 31 December 2016, the condensed consolidated statement of profit or loss and the condensed consolidated statement of comprehensive income, condensed consolidated statement of changes in equity and condensed consolidated cash flow statement for the half-year ended on that date, selected explanatory notes and the directors' declaration for Aspen Group Limited (the consolidated entity). The consolidated entity comprises the company and the entities it controlled during that half-year.
Directors' responsibility for the half-year financial report The directors of the company are responsible for the preparation of the half-year financial report that gives a true and fair view in accordance with Australian Accounting Standards and the Corporations Act 2001 and for such internal control as the directors determine is necessary to enable the preparation of the half-year financial report that is free from mate1ial misstatement whether due to fraud or error.
Auditor's responsibility Our responsibility is to express a conclusion on the half-year financial report based on our review. We conducted our review in accordance with Australian Auditing Standard on Review Engagements ASRE 2410 Review of a Financial Report Performed by the Independent Auditor of the Entity, in order to state whether, on the basis of the procedures described, we have become aware of any matter that makes us believe that the half-year financial report is not in accordance with the Corporations Act 2001
including giving a true and fair view of the consolidated entity's financial position as at 31 December 2016 and its performance for the half-year ended on that date; and complying with Accounting Standard AASB 134 Interim Financial Reporting and the Corporations Regulations 2001. As the auditor of Aspen Group Limited, ASRE 2410 requires that we comply with the ethical requirements relevant to the audit of the annual financial report.
A review of a half-year financial report consists of making enquiries, primarily of persons responsible for financial and accounting matters, and applying analytical and other review procedures. A review is substantially less in scope than an audit conducted in accordance with Australian Auditing Standards and consequently does not enable us to obtain assurance that we would become aware of all significant matters that might be identified in an audit. Accordingly, we do not express an audit opinion.
Independence In conducting our review, we have complied with the independence requirements of the Corporations Act 2001.
Conclusion Based on our review, which is not an audit, we have not become aware of any matter that makes us believe that the half-year financial report of Aspen Group Limited is not in accordance with the Corporations Act 2001 including:
~ ·•• • o • • •O o O O O OOoo oO o o' o o 0 I OOooo•' oooo •o o ••I 0 I I I 00 o oo • • ••• 0 o oo o o ooo O o o oooOOO O O O'ooooo o•oo••o OO O I 0 OOOO OO o o o o o oooo o OOO Oooo OoO O OO OO O O O OO o o I 0 0 0 o o o o 0 o 0 o 0 o 0 o 0 0 0 0 0 0 0 0 0 0 0 0 0 o o o o o o o o o o o o o 0 0 0 I I I I I I 0 o o o o o o o o o o o oo o o O o oo n .. UH•OOo o o o o o ' ' ' ' ' o I 0 I 0 0 0 0 0 0 0 0 0 0 0000 00
Pricewa.terhouseCoopers, ABN 52 'JSo 433 757 Darling Park Tower 2, 201 Sussex Street, GPO BOX 2650, SYDNEY NSW 1171
T: +61 2 8266 0000, F: +61 2 8266 9999, www.pwc.com.au
Liability limited by a scheme approved under Professional Standards Legislation.
pwc
1. giving a true and fair view of the consolidated entity's financial position as at 31 December 2016 and of its performance for the half-year ended on that date;
2. complying with Accounting Standard AASB 134 Interim Financial Reporting and the Corporations Regulations 2001.
~l.v ..........
JADunning a Partner
Sydney 21February2017
Aspen Group for the period ended 31 December 2016
Page 14
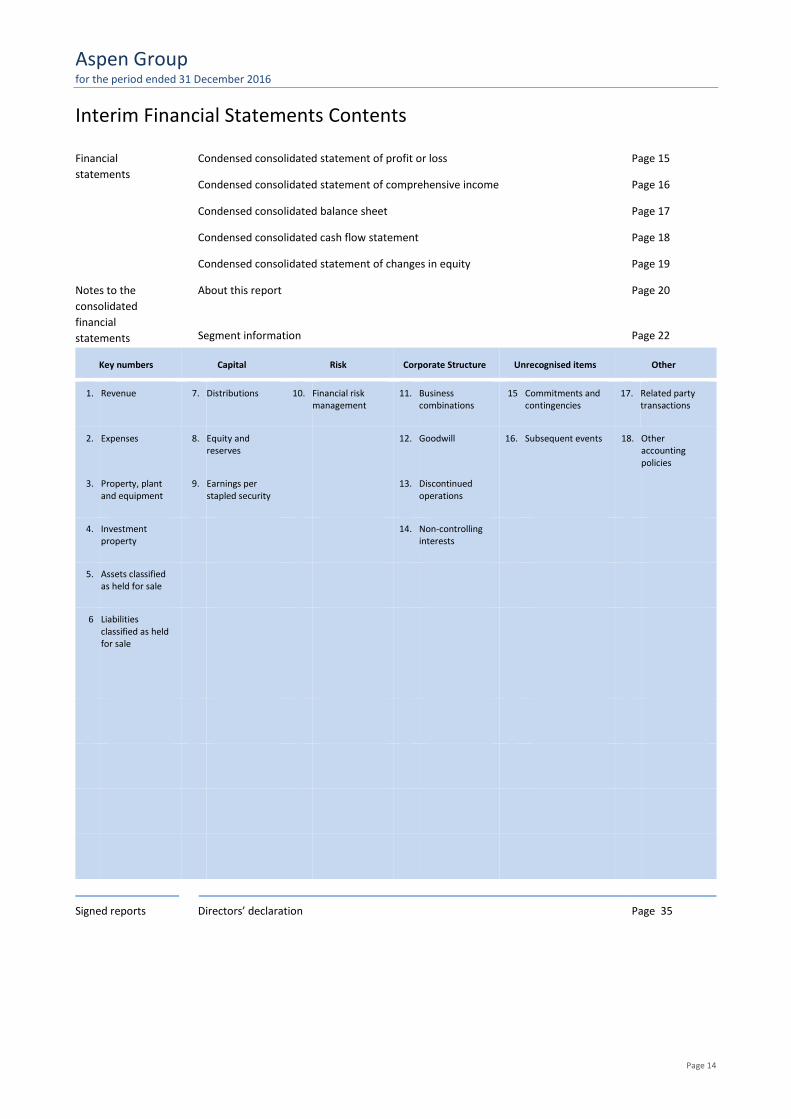
Interim Financial Statements Contents
Financial
statements
Condensed consolidated statement of profit or loss Page 15
Condensed consolidated statement of comprehensive income Page 16
Condensed consolidated balance sheet Page 17
Condensed consolidated cash flow statement Page 18
Condensed consolidated statement of changes in equity Page 19
Notes to the
consolidated
financial
statements
About this report Page 20
Segment information Page 22
Key numbers Capital Risk Corporate Structure Unrecognised items Other
1. Revenue 7. Distributions 10. Financial risk
management 11. Business
combinations 15 Commitments and
contingencies 17. Related party
transactions
2. Expenses 8. Equity and reserves
12. Goodwill 16. Subsequent events 18. Other accounting policies
3. Property, plant and equipment
9. Earnings per stapled security
13. Discontinued operations
4. Investment property
14. Non-controlling interests
5. Assets classified as held for sale
6 Liabilities classified as held for sale
Signed reports Directors’ declaration Page 35
Other
information
Glossary Page 77
Page 15
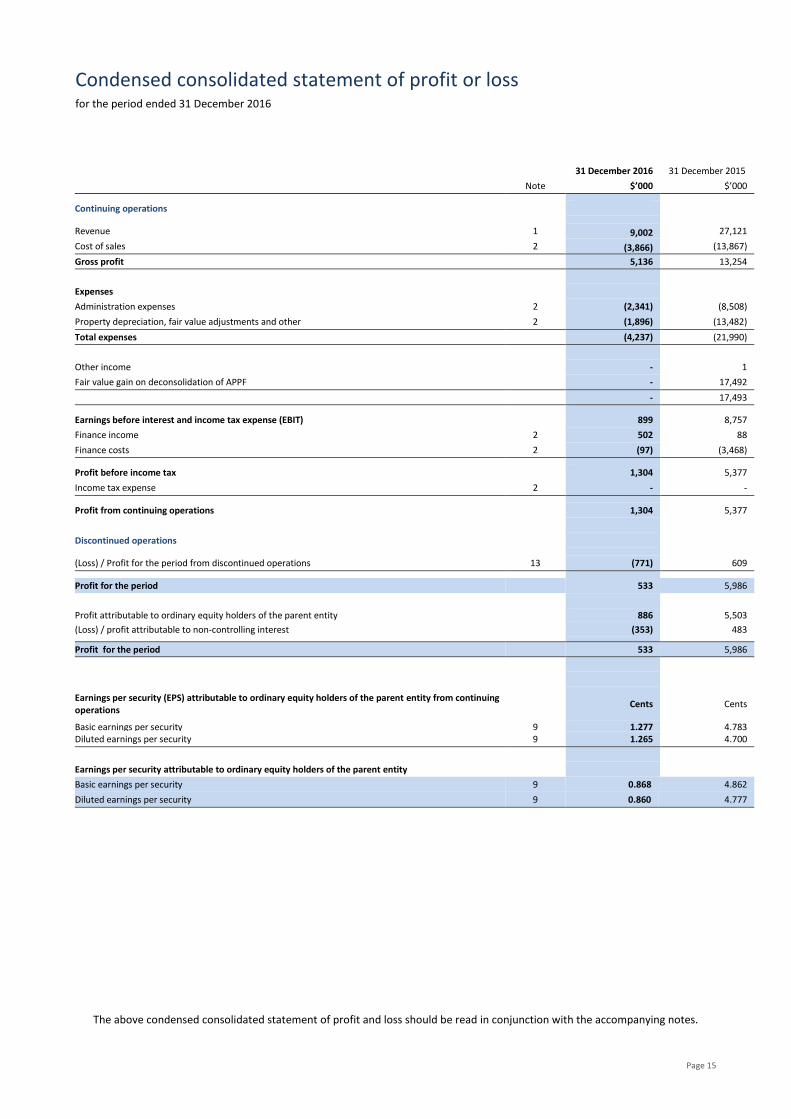
Condensed consolidated statement of profit or loss for the period ended 31 December 2016
31 December 2016 31 December 2015
Note $’000 $’000
Continuing operations
Revenue 1 9,002 27,121
Cost of sales 2 (3,866) (13,867)
Gross profit 5,136 13,254
Expenses
Administration expenses 2 (2,341) (8,508)
Property depreciation, fair value adjustments and other 2 (1,896) (13,482)
Total expenses (4,237) (21,990)
Other income - 1
Fair value gain on deconsolidation of APPF - 17,492
- 17,493
Earnings before interest and income tax expense (EBIT) 899 8,757
Finance income 2 502 88
Finance costs 2 (97) (3,468)
Profit before income tax 1,304 5,377
Income tax expense 2 - -
Profit from continuing operations 1,304 5,377
Discontinued operations
(Loss) / Profit for the period from discontinued operations 13 (771) 609
Profit for the period 533 5,986
Profit attributable to ordinary equity holders of the parent entity 886 5,503
(Loss) / profit attributable to non-controlling interest (353) 483
Profit for the period 533 5,986
Earnings per security (EPS) attributable to ordinary equity holders of the parent entity from continuing operations
Cents Cents
Basic earnings per security 9 1.277 4.783 Diluted earnings per security 9 1.265 4.700
Earnings per security attributable to ordinary equity holders of the parent entity
Basic earnings per security 9 0.868 4.862
Diluted earnings per security 9 0.860 4.777
The above condensed consolidated statement of profit and loss should be read in conjunction with the accompanying notes.
Page 16
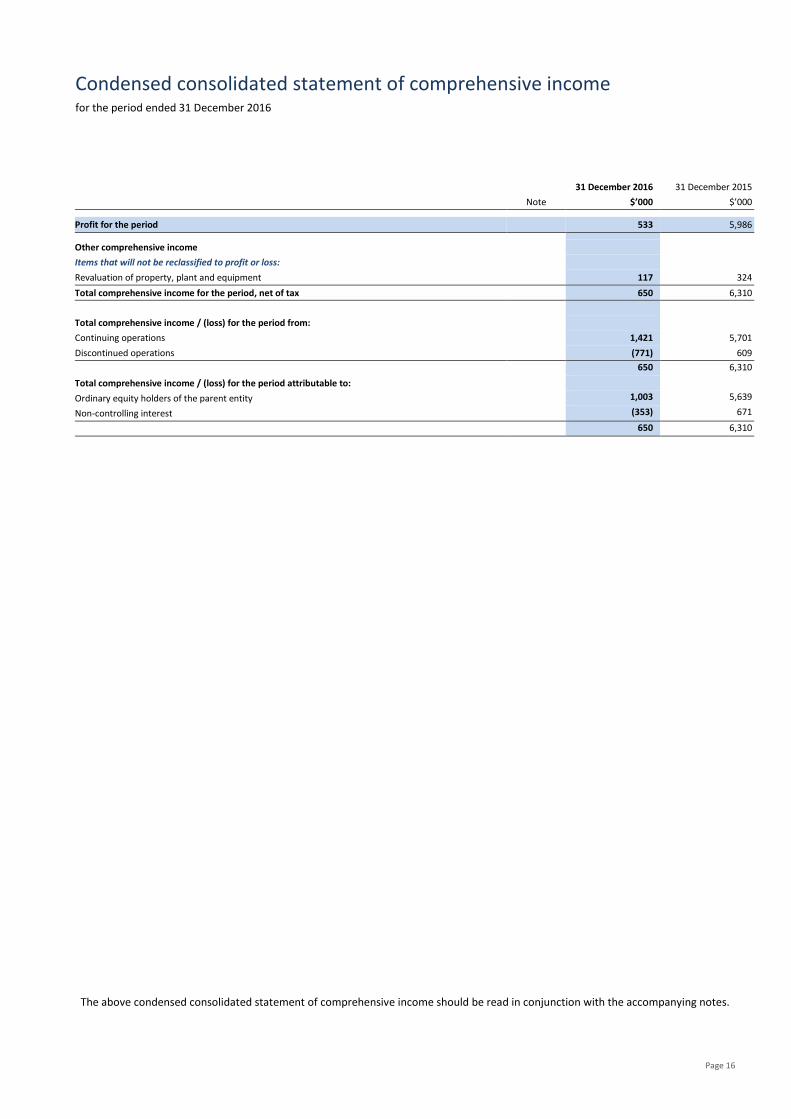
Condensed consolidated statement of comprehensive income for the period ended 31 December 2016
31 December 2016 31 December 2015
Note $’000 $’000
Profit for the period 533 5,986
Other comprehensive income
Items that will not be reclassified to profit or loss:
Revaluation of property, plant and equipment 117 324
Total comprehensive income for the period, net of tax 650 6,310
Total comprehensive income / (loss) for the period from:
Continuing operations 1,421 5,701
Discontinued operations (771) 609
650 6,310
Total comprehensive income / (loss) for the period attributable to:
Ordinary equity holders of the parent entity 1,003 5,639
Non-controlling interest (353) 671
650 6,310
The above condensed consolidated statement of comprehensive income should be read in conjunction with the accompanying notes.
Page 17
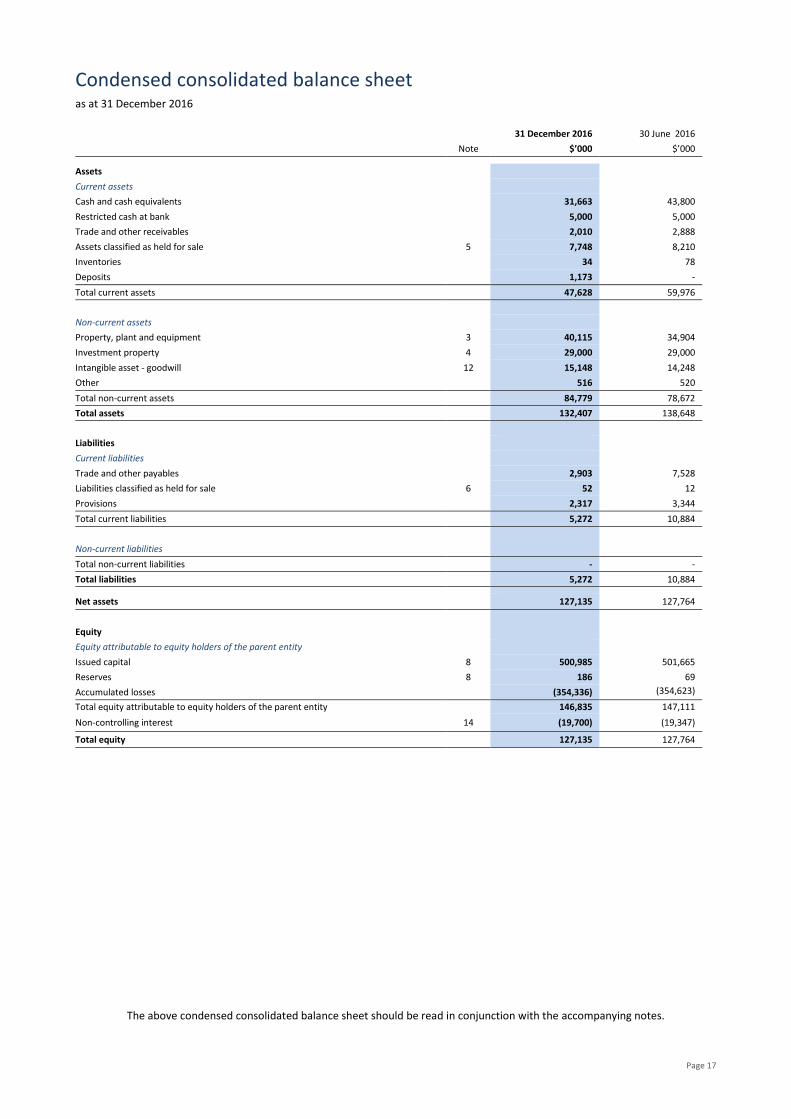
Condensed consolidated balance sheet as at 31 December 2016
The above condensed consolidated balance sheet should be read in conjunction with the accompanying notes.
31 December 2016 30 June 2016
Note $’000 $’000
Assets
Current assets
Cash and cash equivalents 31,663 43,800
Restricted cash at bank 5,000 5,000
Trade and other receivables 2,010 2,888
Assets classified as held for sale 5 7,748 8,210
Inventories 34 78
Deposits 1,173 -
Total current assets 47,628 59,976
Non-current assets
Property, plant and equipment 3 40,115 34,904
Investment property 4 29,000 29,000
Intangible asset - goodwill 12 15,148 14,248
Other 516 520
Total non-current assets 84,779 78,672
Total assets 132,407 138,648
Liabilities
Current liabilities
Trade and other payables 2,903 7,528
Liabilities classified as held for sale 6 52 12
Provisions 2,317 3,344
Total current liabilities 5,272 10,884
Non-current liabilities
Total non-current liabilities - -
Total liabilities 5,272 10,884
Net assets 127,135 127,764
Equity
Equity attributable to equity holders of the parent entity
Issued capital 8 500,985 501,665
Reserves 8 186 69
Accumulated losses (354,336) (354,623) (353,266) Total equity attributable to equity holders of the parent entity 146,835 147,111
Non-controlling interest 14 (19,700) (19,347)
Total equity 127,135 127,764
Page 18
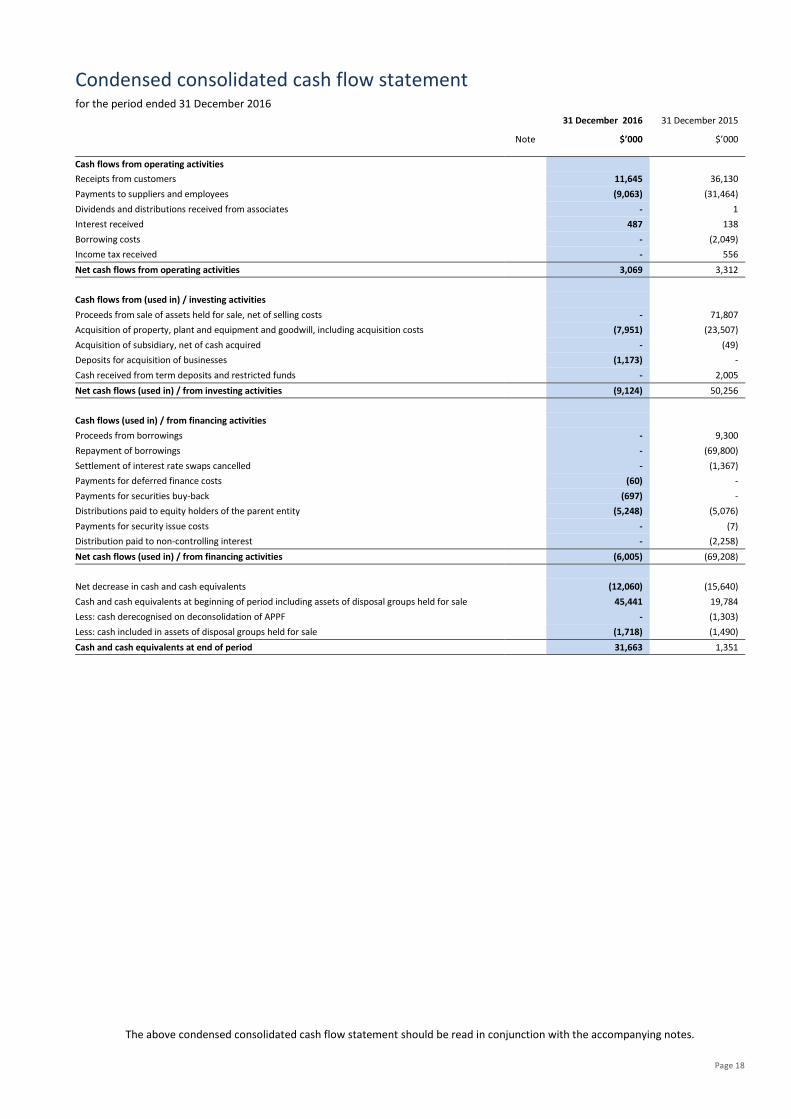
Condensed consolidated cash flow statement for the period ended 31 December 2016
The above condensed consolidated cash flow statement should be read in conjunction with the accompanying notes.
31 December 2016 31 December 2015
Note $’000 $’000
Cash flows from operating activities
Receipts from customers 11,645 36,130
Payments to suppliers and employees (9,063) (31,464)
Dividends and distributions received from associates - 1
Interest received 487 138
Borrowing costs - (2,049)
Income tax received - 556
Net cash flows from operating activities 3,069 3,312
Cash flows from (used in) / investing activities
Proceeds from sale of assets held for sale, net of selling costs - 71,807
Acquisition of property, plant and equipment and goodwill, including acquisition costs (7,951) (23,507)
Acquisition of subsidiary, net of cash acquired - (49)
Deposits for acquisition of businesses (1,173) -
Cash received from term deposits and restricted funds - 2,005
Net cash flows (used in) / from investing activities (9,124) 50,256
Cash flows (used in) / from financing activities
Proceeds from borrowings - 9,300
Repayment of borrowings - (69,800)
Settlement of interest rate swaps cancelled - (1,367)
Payments for deferred finance costs (60) -
Payments for securities buy-back (697) -
Distributions paid to equity holders of the parent entity (5,248) (5,076)
Payments for security issue costs - (7)
Distribution paid to non-controlling interest - (2,258)
Net cash flows (used in) / from financing activities (6,005) (69,208)
Net decrease in cash and cash equivalents (12,060) (15,640)
Cash and cash equivalents at beginning of period including assets of disposal groups held for sale 45,441 19,784
Less: cash derecognised on deconsolidation of APPF - (1,303)
Less: cash included in assets of disposal groups held for sale (1,718) (1,490)
Cash and cash equivalents at end of period 31,663 1,351
Page 19
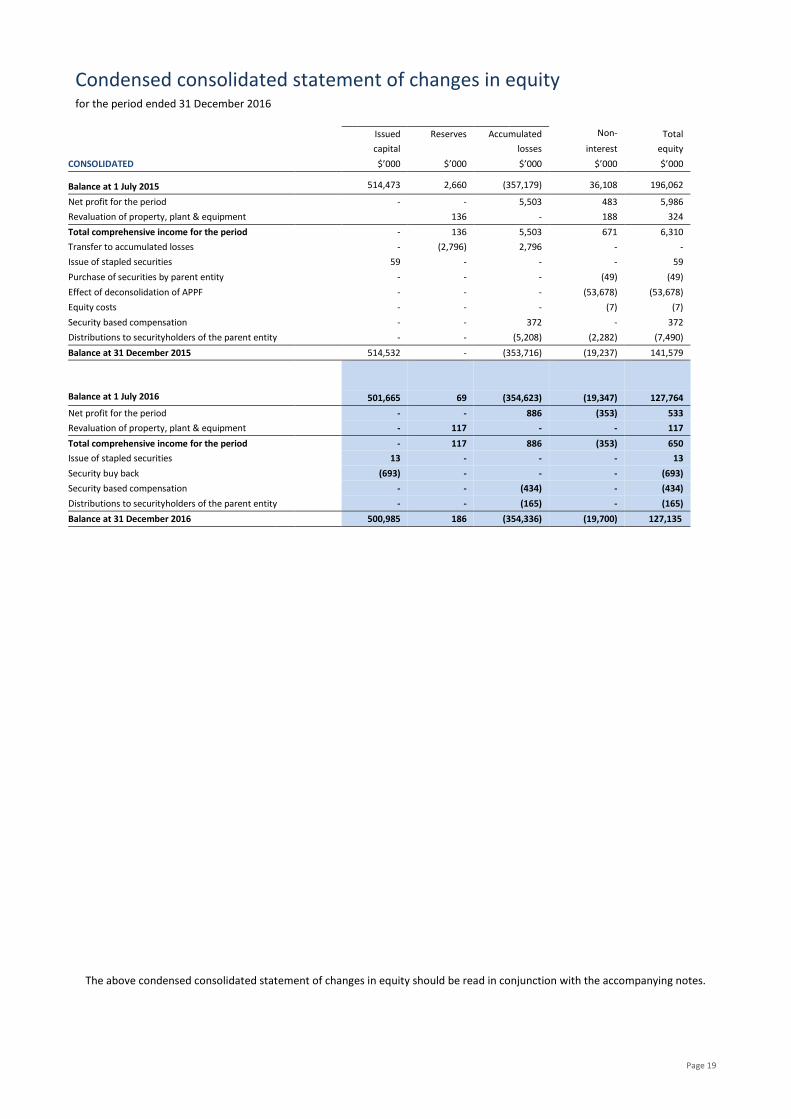
Condensed consolidated statement of changes in equity for the period ended 31 December 2016
The above condensed consolidated statement of changes in equity should be read in conjunction with the accompanying notes.
Issued Reserves Accumulated Non-controlling
Total
capital losses interest equity
CONSOLIDATED $’000 $’000 $’000 $’000 $’000
Balance at 1 July 2015 514,473 2,660 (357,179) 36,108 196,062
Net profit for the period - - 5,503 483 5,986
Revaluation of property, plant & equipment 136 - 188 324
Total comprehensive income for the period - 136 5,503 671 6,310
Transfer to accumulated losses - (2,796) 2,796 - -
Issue of stapled securities 59 - - - 59
Purchase of securities by parent entity - - - (49) (49)
Effect of deconsolidation of APPF - - - (53,678) (53,678)
Equity costs - - - (7) (7)
Security based compensation - - 372 - 372
Distributions to securityholders of the parent entity - - (5,208) (2,282) (7,490)
Balance at 31 December 2015 514,532 - (353,716) (19,237) 141,579
Balance at 1 July 2016 501,665 69 (354,623) (19,347) 127,764
Net profit for the period - - 886 (353) 533
Revaluation of property, plant & equipment - 117 - - 117
Total comprehensive income for the period - 117 886 (353) 650
Issue of stapled securities 13 - - - 13
Security buy back (693) - - - (693)
Security based compensation - - (434) - (434)
Distributions to securityholders of the parent entity - - (165) - (165)
Balance at 31 December 2016 500,985 186 (354,336) (19,700) 127,135
Notes to the condensed consolidated interim financial statements for the period ended 31 December 2016
Page 20
Aspen was established for the purpose of facilitating a joint quotation of the Trust and the Company and their controlled entities on the ASX. The Trust, the Company and their controlled entities are domiciled in Australia. The address of Aspen’s registered office is Level 3, 37 Pitt Street, Sydney, New South Wales 2000. The Deed of the Trust and the Constitution of the Company ensure that, for so long as the two entities remain jointly quoted, the number of units in the Trust and the number of shares in the Company shall be equal and that unit holders and shareholders be identical.
The condensed consolidated financial statements of Aspen as at and for the period ended 31 December 2016 comprise the Company and the Trust along with their subsidiaries and their interests in associates and jointly controlled entities. Aspen is a for-profit entity and is primarily involved in investment in the ‘value for money’ accommodation sector.
The condensed consolidated interim financial statements do not include all information required for full annual financial statements prepared in accordance with Australian Accounting Standards (“AAS”), and should be read in conjunction with the consolidated annual financial statements of Aspen as at and for the year ended 30 June 2016. Selected explanatory notes are included to explain events and transactions that are significant to an understanding of the changes in financial position and performance of Aspen since the last annual consolidated financial statements as at and for the year ended 30 June 2016.
Except as noted within this interim financial report, the accounting policies applied by Aspen in these condensed consolidated interim financial statements are consistent with those applied by Aspen in its consolidated financial statements as at and for the year ended 30 June 2016.
The condensed consolidated interim financial statements were authorised for issue by the Board on 21 February 2017.
The condensed consolidated interim financial statements are general purpose consolidated financial statements which:
- have been prepared in accordance with the requirements of the Corporations Act 2001, Australian Accounting Standards and other authoritative pronouncements of the AASB.
- complies with International Financial Reporting Standards (IFRS) as issued by the International Accounting Standards Board (IASB).
- has been prepared on a historical cost basis, except for derivative financial instruments, available for sale financial instruments, investment property, assets held for sale, assets of disposal group held for sale, assets of discontinued operations held for sale, certain classes of property, plant and equipment and share-based payments.
- is presented in Australian dollars with all values rounded to the nearest thousand dollars ($‘000) unless otherwise stated, in accordance with ASIC Class Order 2016/191;
- presents reclassified comparative information where required for consistency with the current year’s presentation;
- adopts all new and amended Accounting Standards and Interpretations issued by the AASB that are relevant to
the operations of Aspen and effective for reporting periods beginning on or after 1 July 2016. Refer to note 18 for further details; and
- does not early adopt any Accounting Standards and Interpretations that have been issued or amended but are not yet effective.
Key judgements and estimates
The preparation of the condensed consolidated financial statements requires management to make judgements, estimates and assumptions that affect the application of policies and reported amounts of assets and liabilities, income and expenses. Actual results may differ from these estimates
The judgments, estimates and underlying assumptions are reviewed on an ongoing basis. Information about judgements, estimates and assumptions that have a significant effect on the condensed consolidated financial statements are found in the following notes:
Note 3: Property, plant and equipment Page 24
Note 11: Business combinations Page 30
Note 12: Goodwill Page 30
Comparative information
Where necessary, prior period comparative information has been reclassified to achieve consistency in disclosure with current period amounts and other disclosures.
Financial Position
During the period ended 31 December 2016 Aspen recorded a profit after tax of $0.533 million (1H FY16: profit of $5.986 million). At 31 December 2016 Aspen had net assets of $127.135 million (30 June 2016: $127.764 million), cash reserves of $36.663 million (30 June 2016: $48.800 million) and current assets exceeded current liabilities by $42.356 million (30 June 2016: $49.092 million).
The consolidated interim financial statements have been prepared on the going concern basis, which contemplates the continuity of normal business activity and the realisation of assets and the settlement of liabilities in the normal course of business.
The Board believes that Aspen will continue as a going concern, and Aspen’s cash flow forecast supports the Board’s opinion that Aspen’s working capital position will remain positive for at least the next twelve months from the date of signing these consolidated interim financial statements.

Notes to the condensed consolidated interim financial statements for the period ended 31 December 2016
Page 21
Operating segments
Aspen has three operating segments as detailed below, which hold different asset classes and offer different products and services and are based on Aspen’s management reporting and oversight.
Internal management reports on each of these segments are reviewed on at a least a monthly basis by the executive management team, representing the chief operating decision makers. Segment results and assets include items directly attributable to the operating segments as well as those that can be allocated on a reasonable basis.
The following details the three operating and reporting segments, namely tourism/retirement, corporate, and non-core in addition to the other segment:
• Tourism / retirement – this segment includes income and expenses relating to two land lease communities (previously refered to as manufactured housing estates), two tourism parks and one mixed use accomodation park. These properties cater to permanent and short stay residents.
In addition, for the period ended 31 December 2015, this segment includes an allocation of earnings associated with Aspen’s investment in, and funds management of APPF, as it related to APPF’s 17 mixed use parks. With the deconsolidation of APPF on 9 December 2015, earnings from the 17 APPF mixed use accommodation assets were no longer reported in this segment.
• Corporate – this segment includes income and expenses relating to Aspen’s sole resource accommodation park, being Aspen Karratha Village. This property primarily caters to one corporate resource client.
In addition, for the period ended 31 December 2015, this segment includes an allocation of earnings associated with Aspen’s investment in, and funds management of APPF, as it relates to APPF’s 4 resource accommodation parks. With the deconsolidation of APPF on 9 December 2015, earnings from the 4 APPF resource parks were no longer reported in this segment.
• Non-core – this segment includes income and expenses relating to discontinued development assets and resort / short stay parks, continuing Spearwood South industrial property, and any other activities deemed non-core by the Board.
Details of assets within the non-core segment are included in the Operating and Financial Review within this financial report. In addition, for the period ended 31 December 2015, this segment includes an allocation of earnings associated with Aspen’s investment in and funds management of APPF as it relates to the resort accommodation assets which were settled during the period.
• Other – this segment includes income and expenses that is not allocated to an operating segment. This includes corporate overheads, interest revenue and interest expenses. In addition, for the period ended 31 December 2015, this segment includes the gain on deconsolidation of APPF on 9 December 2015.
Geographical segments
Aspen is Australian based, and as such has its current operating activities spread throughout Australia. There are no other geographical segments.
Notes to the condensed consolidated interim financial statements for the period ended 31 December 2016
Page 22
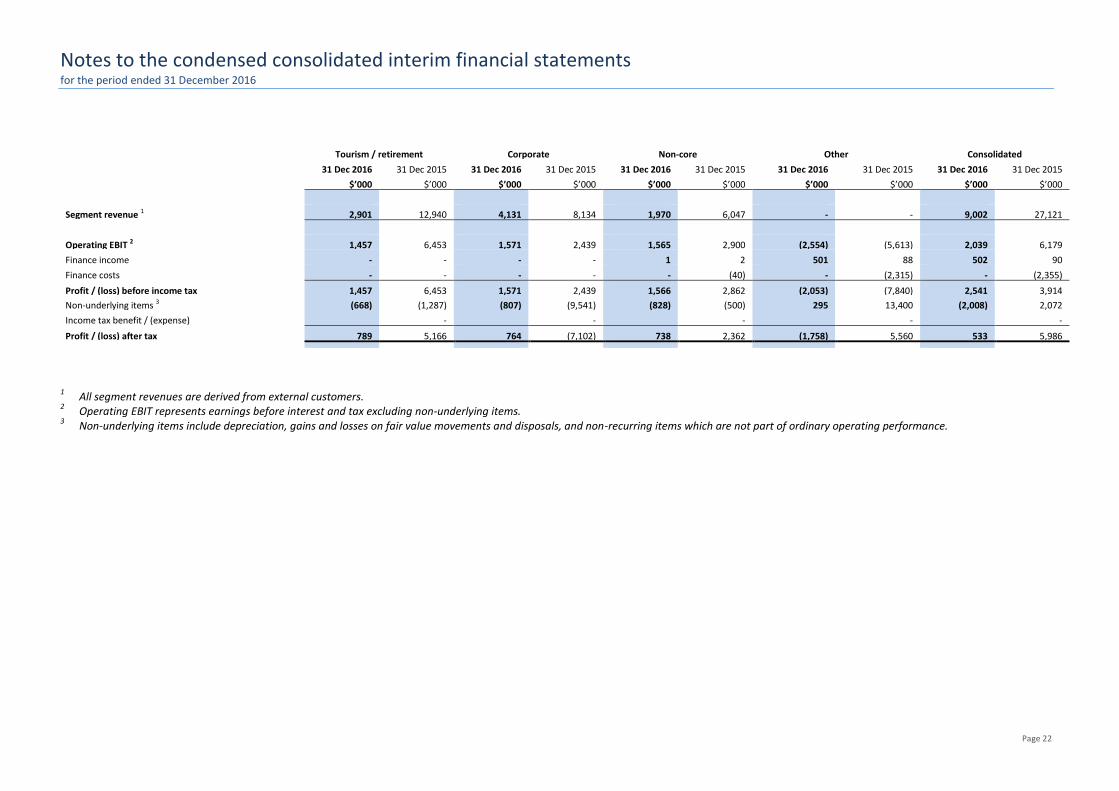
Tourism / retirement Corporate Non-core Other Consolidated
31 Dec 2016 31 Dec 2015 31 Dec 2016 31 Dec 2015 31 Dec 2016 31 Dec 2015 31 Dec 2016 31 Dec 2015 31 Dec 2016 31 Dec 2015
$’000 $’000 $’000 $’000 $’000 $’000 $’000 $’000 $’000 $’000
Segment revenue 1 2,901 12,940 4,131 8,134 1,970 6,047 - - 9,002 27,121
Operating EBIT 2 1,457 6,453 1,571 2,439 1,565 2,900 (2,554) (5,613) 2,039 6,179
Finance income - - - - 1 2 501 88 502 90
Finance costs - - - - - (40) - (2,315) - (2,355)
Profit / (loss) before income tax 1,457 6,453 1,571 2,439 1,566 2,862 (2,053) (7,840) 2,541 3,914
Non-underlying items 3 (668) (1,287) (807) (9,541) (828) (500) 295 13,400 (2,008) 2,072
Income tax benefit / (expense) - - - - -
Profit / (loss) after tax 789 5,166 764 (7,102) 738 2,362 (1,758) 5,560 533 5,986
1 All segment revenues are derived from external customers.
2 Operating EBIT represents earnings before interest and tax excluding non-underlying items.
3 Non-underlying items include depreciation, gains and losses on fair value movements and disposals, and non-recurring items which are not part of ordinary operating performance.
Notes to the condensed consolidated interim financial statements for the period ended 31 December 2016
Page 23
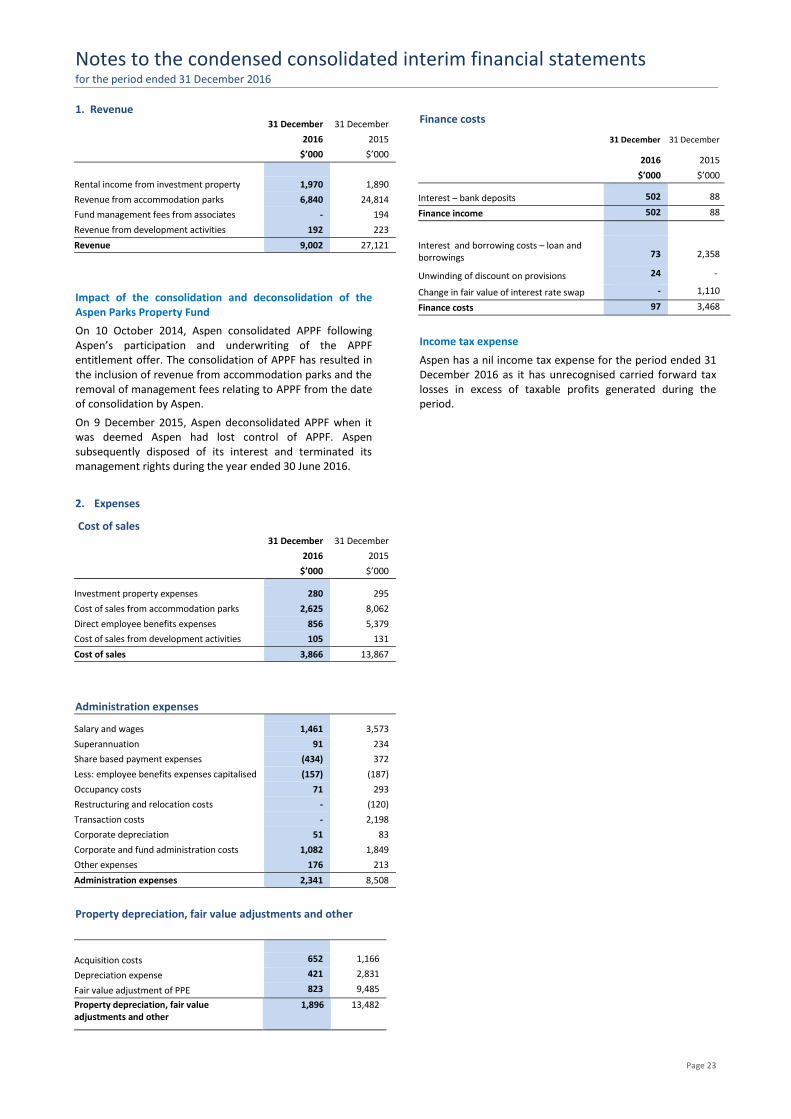
1. Revenue 31 December 31 December
2016 2015
$’000 $’000
Rental income from investment property 1,970 1,890
Revenue from accommodation parks 6,840 24,814
Fund management fees from associates - 194
Revenue from development activities 192 223
Revenue 9,002 27,121
Impact of the consolidation and deconsolidation of the Aspen Parks Property Fund
On 10 October 2014, Aspen consolidated APPF following Aspen’s participation and underwriting of the APPF entitlement offer. The consolidation of APPF has resulted in the inclusion of revenue from accommodation parks and the removal of management fees relating to APPF from the date of consolidation by Aspen.
On 9 December 2015, Aspen deconsolidated APPF when it was deemed Aspen had lost control of APPF. Aspen subsequently disposed of its interest and terminated its management rights during the year ended 30 June 2016.
2. Expenses
Cost of sales 31 December 31 December
2016 2015
$’000 $’000
Investment property expenses 280 295
Cost of sales from accommodation parks 2,625 8,062
Direct employee benefits expenses 856 5,379
Cost of sales from development activities 105 131
Cost of sales 3,866 13,867
Administration expenses Salary and wages 1,461 3,573
Superannuation 91 234
Share based payment expenses (434) 372
Less: employee benefits expenses capitalised (157) (187)
Occupancy costs 71 293
Restructuring and relocation costs - (120)
Transaction costs - 2,198
Corporate depreciation 51 83
Corporate and fund administration costs 1,082 1,849
Other expenses 176 213
Administration expenses 2,341 8,508
Property depreciation, fair value adjustments and other
Acquisition costs 652 1,166
Depreciation expense 421 2,831
Fair value adjustment of PPE 823 9,485
Property depreciation, fair value adjustments and other
1,896 13,482
Finance costs
31 December 31 December
2016 2015
$’000 $’000
Interest – bank deposits 502 88
Finance income 502 88
Interest and borrowing costs – loan and borrowings
73
2,358
Unwinding of discount on provisions 24 -
Change in fair value of interest rate swap - 1,110
Finance costs 97 3,468
Income tax expense
Aspen has a nil income tax expense for the period ended 31 December 2016 as it has unrecognised carried forward tax losses in excess of taxable profits generated during the period.
Notes to the condensed consolidated interim financial statements for the period ended 31 December 2016
Page 24
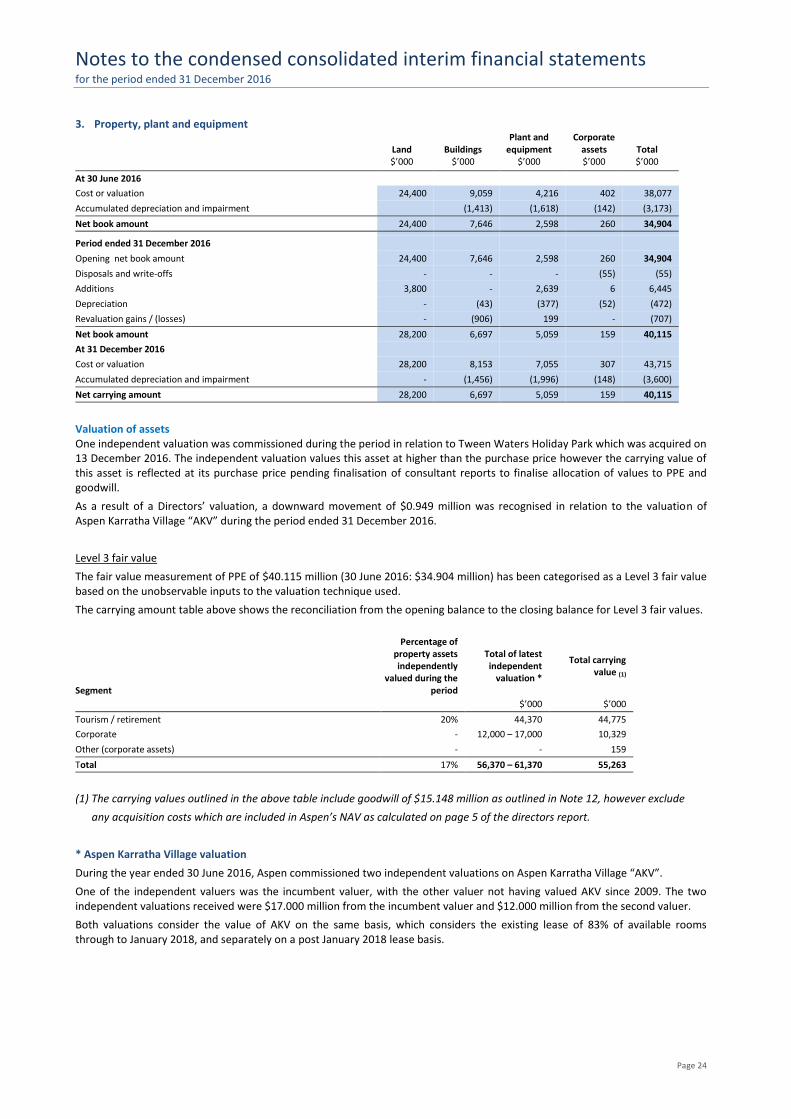
3. Property, plant and equipment
Land Buildings Plant and
equipment Corporate
assets Total
$’000 $’000 $’000 $’000 $’000
At 30 June 2016
Cost or valuation 24,400 9,059 4,216 402 38,077
Accumulated depreciation and impairment (1,413) (1,618) (142) (3,173)
Net book amount 24,400 7,646 2,598 260 34,904
Period ended 31 December 2016
Opening net book amount 24,400 7,646 2,598 260 34,904
Disposals and write-offs - - - (55) (55)
Additions 3,800 - 2,639 6 6,445
Depreciation - (43) (377) (52) (472)
Revaluation gains / (losses) - (906) 199 - (707)
Net book amount 28,200 6,697 5,059 159 40,115
At 31 December 2016
Cost or valuation 28,200 8,153 7,055 307 43,715
Accumulated depreciation and impairment - (1,456) (1,996) (148) (3,600)
Net carrying amount 28,200 6,697 5,059 159 40,115
Valuation of assets One independent valuation was commissioned during the period in relation to Tween Waters Holiday Park which was acquired on 13 December 2016. The independent valuation values this asset at higher than the purchase price however the carrying value of this asset is reflected at its purchase price pending finalisation of consultant reports to finalise allocation of values to PPE and goodwill.
As a result of a Directors’ valuation, a downward movement of $0.949 million was recognised in relation to the valuation of Aspen Karratha Village “AKV” during the period ended 31 December 2016.
Level 3 fair value
The fair value measurement of PPE of $40.115 million (30 June 2016: $34.904 million) has been categorised as a Level 3 fair value based on the unobservable inputs to the valuation technique used.
The carrying amount table above shows the reconciliation from the opening balance to the closing balance for Level 3 fair values.
Segment
Percentage of property assets independently
valued during the period
Total of latest independent
valuation *
Total carrying value (1)
$’000 $’000
Tourism / retirement 20% 44,370 44,775
Corporate - 12,000 – 17,000 10,329
Other (corporate assets) - - 159
Total 17% 56,370 – 61,370 55,263
(1) The carrying values outlined in the above table include goodwill of $15.148 million as outlined in Note 12, however exclude
any acquisition costs which are included in Aspen’s NAV as calculated on page 5 of the directors report.
* Aspen Karratha Village valuation
During the year ended 30 June 2016, Aspen commissioned two independent valuations on Aspen Karratha Village “AKV”.
One of the independent valuers was the incumbent valuer, with the other valuer not having valued AKV since 2009. The two independent valuations received were $17.000 million from the incumbent valuer and $12.000 million from the second valuer.
Both valuations consider the value of AKV on the same basis, which considers the existing lease of 83% of available rooms through to January 2018, and separately on a post January 2018 lease basis.
Notes to the condensed consolidated interim financial statements for the period ended 31 December 2016
Page 25
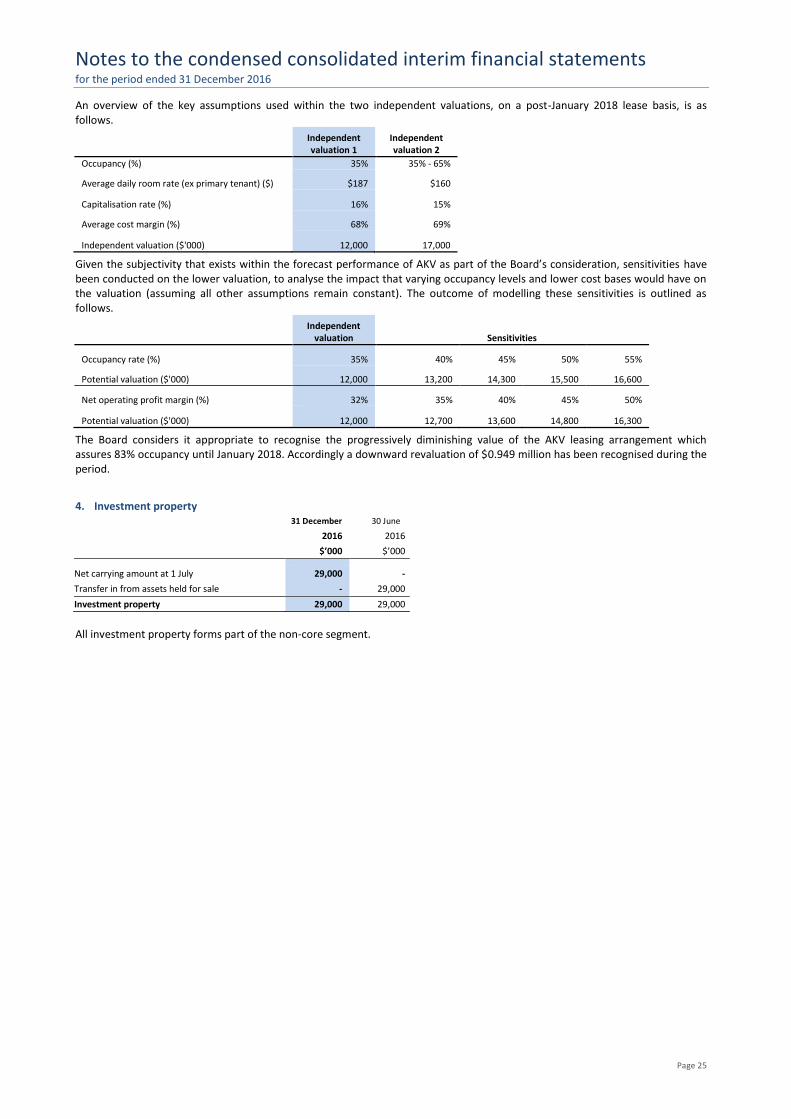
An overview of the key assumptions used within the two independent valuations, on a post-January 2018 lease basis, is as follows.
Independent valuation 1
Independent valuation 2
Occupancy (%) 35% 35% - 65%
Average daily room rate (ex primary tenant) ($) $187 $160
Capitalisation rate (%) 16% 15%
Average cost margin (%) 68% 69%
Independent valuation ($'000) 12,000 17,000
Given the subjectivity that exists within the forecast performance of AKV as part of the Board’s consideration, sensitivities have been conducted on the lower valuation, to analyse the impact that varying occupancy levels and lower cost bases would have on the valuation (assuming all other assumptions remain constant). The outcome of modelling these sensitivities is outlined as follows.
Independent
valuation Sensitivities
Occupancy rate (%) 35% 40% 45% 50% 55%
Potential valuation ($'000) 12,000 13,200 14,300 15,500 16,600
Net operating profit margin (%) 32% 35% 40% 45% 50%
Potential valuation ($'000) 12,000 12,700 13,600 14,800 16,300
The Board considers it appropriate to recognise the progressively diminishing value of the AKV leasing arrangement which assures 83% occupancy until January 2018. Accordingly a downward revaluation of $0.949 million has been recognised during the period.
4. Investment property 31 December 30 June
2016 2016
$’000 $’000
Net carrying amount at 1 July 29,000 -
Transfer in from assets held for sale - 29,000
Investment property 29,000 29,000
All investment property forms part of the non-core segment.
Notes to the condensed consolidated interim financial statements for the period ended 31 December 2016
Page 26
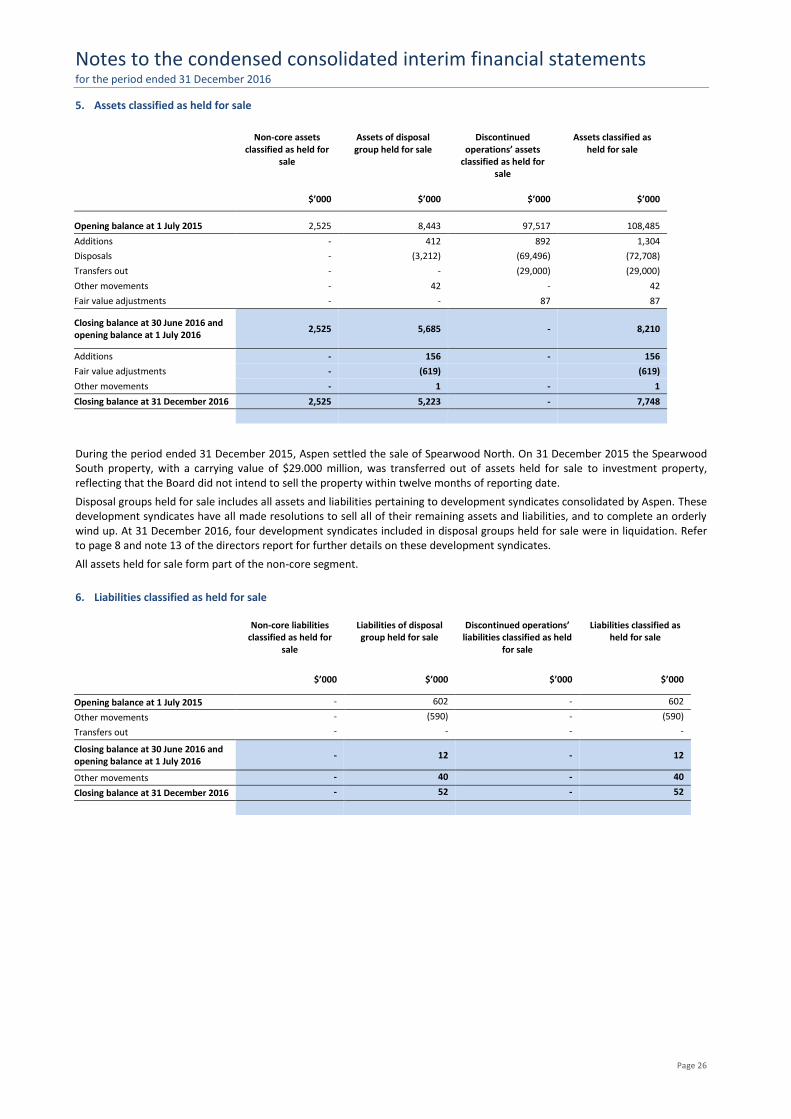
5. Assets classified as held for sale
Non-core assets classified as held for
sale
Assets of disposal group held for sale
Discontinued operations’ assets
classified as held for sale
Assets classified as held for sale
$’000 $’000 $’000 $’000
Opening balance at 1 July 2015 2,525 8,443 97,517 108,485
Additions - 412 892 1,304
Disposals - (3,212) (69,496) (72,708)
Transfers out - - (29,000) (29,000)
Other movements - 42 - 42
Fair value adjustments - - 87 87
Closing balance at 30 June 2016 and opening balance at 1 July 2016
2,525 5,685 - 8,210
Additions - 156 - 156
Fair value adjustments - (619) (619)
Other movements - 1 - 1
Closing balance at 31 December 2016 2,525 5,223 - 7,748
During the period ended 31 December 2015, Aspen settled the sale of Spearwood North. On 31 December 2015 the Spearwood South property, with a carrying value of $29.000 million, was transferred out of assets held for sale to investment property, reflecting that the Board did not intend to sell the property within twelve months of reporting date.
Disposal groups held for sale includes all assets and liabilities pertaining to development syndicates consolidated by Aspen. These development syndicates have all made resolutions to sell all of their remaining assets and liabilities, and to complete an orderly wind up. At 31 December 2016, four development syndicates included in disposal groups held for sale were in liquidation. Refer to page 8 and note 13 of the directors report for further details on these development syndicates.
All assets held for sale form part of the non-core segment.
6. Liabilities classified as held for sale
Non-core liabilities classified as held for
sale
Liabilities of disposal group held for sale
Discontinued operations’ liabilities classified as held
for sale
Liabilities classified as held for sale
$’000 $’000 $’000 $’000
Opening balance at 1 July 2015 - 602 - 602
Other movements - (590) - (590)
Transfers out - - - -
Closing balance at 30 June 2016 and opening balance at 1 July 2016
- 12 - 12
Other movements - 40 - 40
Closing balance at 31 December 2016 - 52 - 52
Notes to the condensed consolidated interim financial statements for the period ended 31 December 2016
Page 27
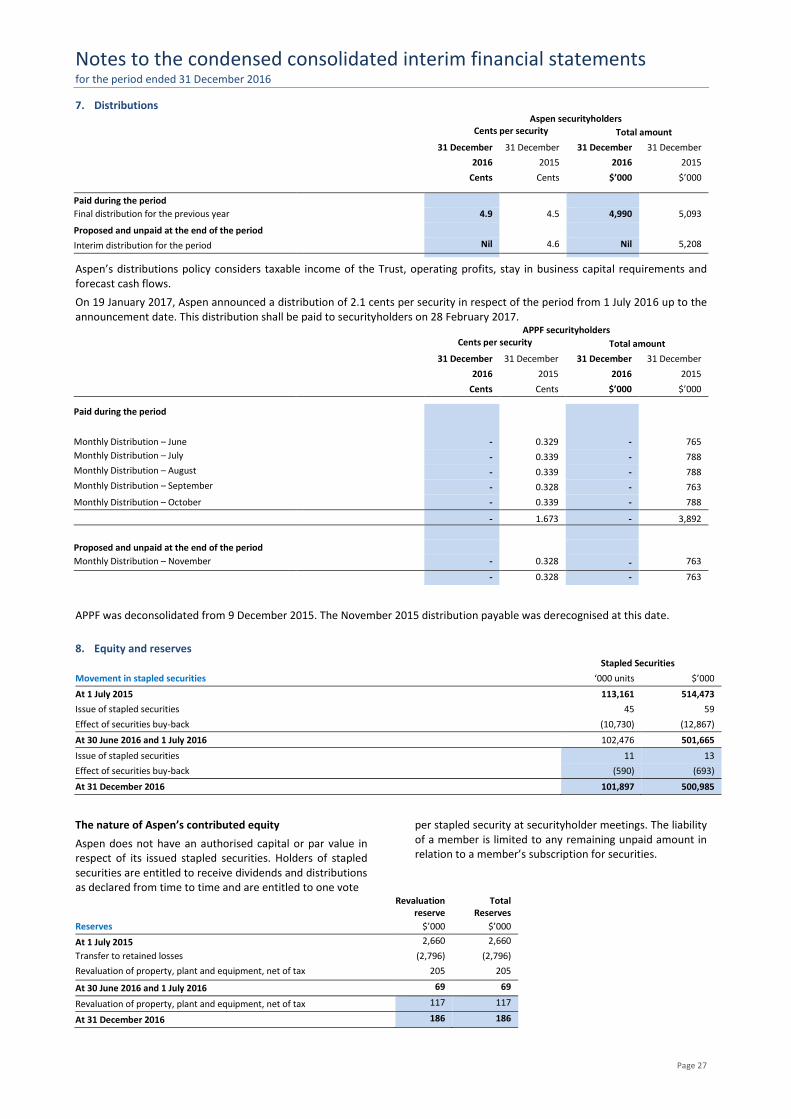
7. Distributions Aspen securityholders
Cents per security Total amount
31 December 31 December 31 December 31 December
2016 2015 2016 2015
Cents Cents $’000 $’000
Paid during the period
Final distribution for the previous year
4.9 4.5 4,990 5,093
Proposed and unpaid at the end of the period
Interim distribution for the period Nil 4.6 Nil 5,208
Aspen’s distributions policy considers taxable income of the Trust, operating profits, stay in business capital requirements and forecast cash flows.
On 19 January 2017, Aspen announced a distribution of 2.1 cents per security in respect of the period from 1 July 2016 up to the announcement date. This distribution shall be paid to securityholders on 28 February 2017.
APPF securityholders
Cents per security Total amount
31 December 31 December 31 December 31 December
2016 2015 2016 2015
Cents Cents $’000 $’000
Paid during the period
Monthly Distribution – June - 0.329 - 765
Monthly Distribution – July - 0.339 - 788
Monthly Distribution – August - 0.339 - 788
Monthly Distribution – September - 0.328 - 763
Monthly Distribution – October - 0.339 - 788
- 1.673 - 3,892
Proposed and unpaid at the end of the period
Monthly Distribution – November
- 0.328 - 763
- 0.328 - 763
APPF was deconsolidated from 9 December 2015. The November 2015 distribution payable was derecognised at this date.
8. Equity and reserves
Stapled Securities
Movement in stapled securities ‘000 units $’000
At 1 July 2015 113,161 514,473
Issue of stapled securities 45 59
Effect of securities buy-back (10,730) (12,867)
At 30 June 2016 and 1 July 2016 102,476 501,665
Issue of stapled securities 11 13
Effect of securities buy-back (590) (693)
At 31 December 2016 101,897 500,985
The nature of Aspen’s contributed equity
Aspen does not have an authorised capital or par value in respect of its issued stapled securities. Holders of stapled securities are entitled to receive dividends and distributions as declared from time to time and are entitled to one vote
per stapled security at securityholder meetings. The liability of a member is limited to any remaining unpaid amount in relation to a member’s subscription for securities.
Revaluation
reserve Total
Reserves
Reserves $’000 $’000
At 1 July 2015 2,660 2,660
Transfer to retained losses (2,796) (2,796)
Revaluation of property, plant and equipment, net of tax 205 205
At 30 June 2016 and 1 July 2016 69 69
Revaluation of property, plant and equipment, net of tax 117 117
At 31 December 2016 186 186
Notes to the condensed consolidated interim financial statements for the period ended 31 December 2016
Page 28
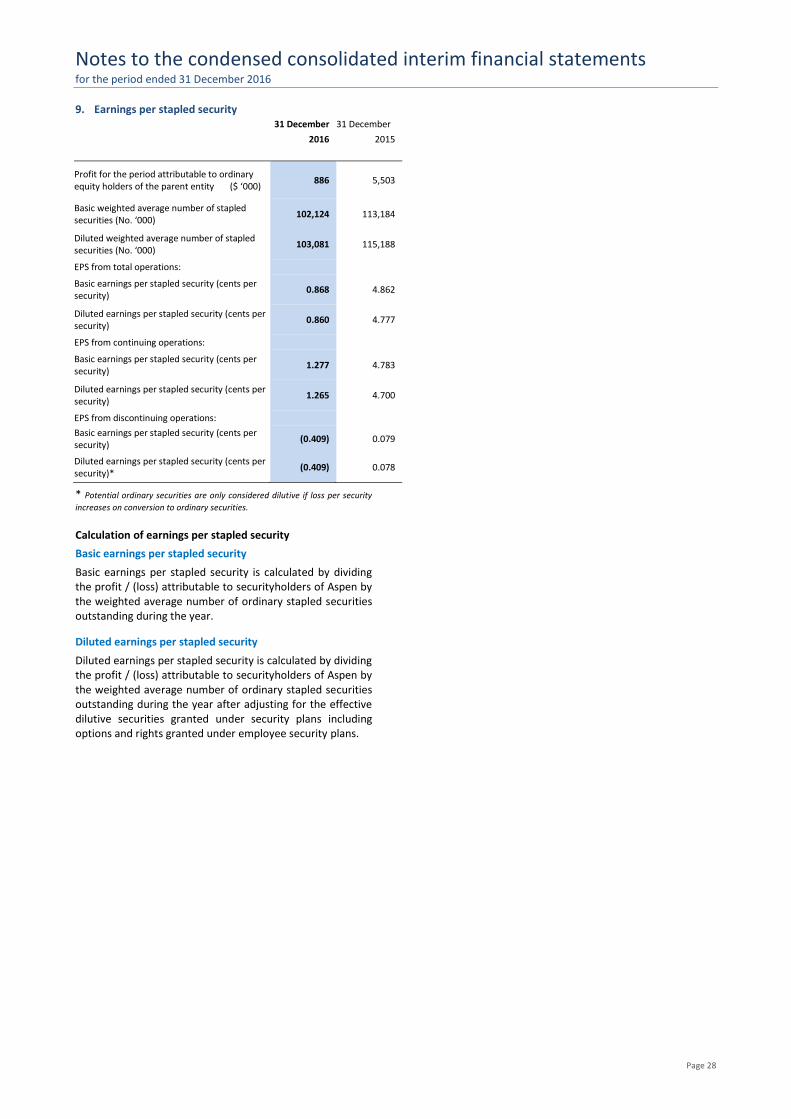
9. Earnings per stapled security 31 December 31 December
2016 2015
Profit for the period attributable to ordinary equity holders of the parent entity ($ ‘000)
886 5,503
Basic weighted average number of stapled securities (No. ‘000)
102,124 113,184
Diluted weighted average number of stapled securities (No. ‘000)
103,081 115,188
EPS from total operations:
Basic earnings per stapled security (cents per security)
0.868 4.862
Diluted earnings per stapled security (cents per security)
0.860 4.777
EPS from continuing operations:
Basic earnings per stapled security (cents per security)
1.277 4.783
Diluted earnings per stapled security (cents per security)
1.265 4.700
EPS from discontinuing operations:
Basic earnings per stapled security (cents per security)
(0.409) 0.079
Diluted earnings per stapled security (cents per security)*
(0.409) 0.078
* Potential ordinary securities are only considered dilutive if loss per security
increases on conversion to ordinary securities.
Calculation of earnings per stapled security
Basic earnings per stapled security
Basic earnings per stapled security is calculated by dividing the profit / (loss) attributable to securityholders of Aspen by the weighted average number of ordinary stapled securities outstanding during the year.
Diluted earnings per stapled security
Diluted earnings per stapled security is calculated by dividing the profit / (loss) attributable to securityholders of Aspen by the weighted average number of ordinary stapled securities outstanding during the year after adjusting for the effective dilutive securities granted under security plans including options and rights granted under employee security plans.
Notes to the condensed consolidated interim financial statements for the period ended 31 December 2016
Page 29
10. Financial risk management
Financial risk management
Aspen Group’s financial risk management objectives and policies are consistent with those disclosed in the consolidated financial statements for the year ended 30 June 2016.
Liquidity risk
Nature of the risk
Liquidity risk is the risk that Aspen will not be able to meet its financial obligations as they fall due. Aspen is exposed to liquidity risk primarily due to its capital management policies, which view debt as an element of Aspen’s capital structure.
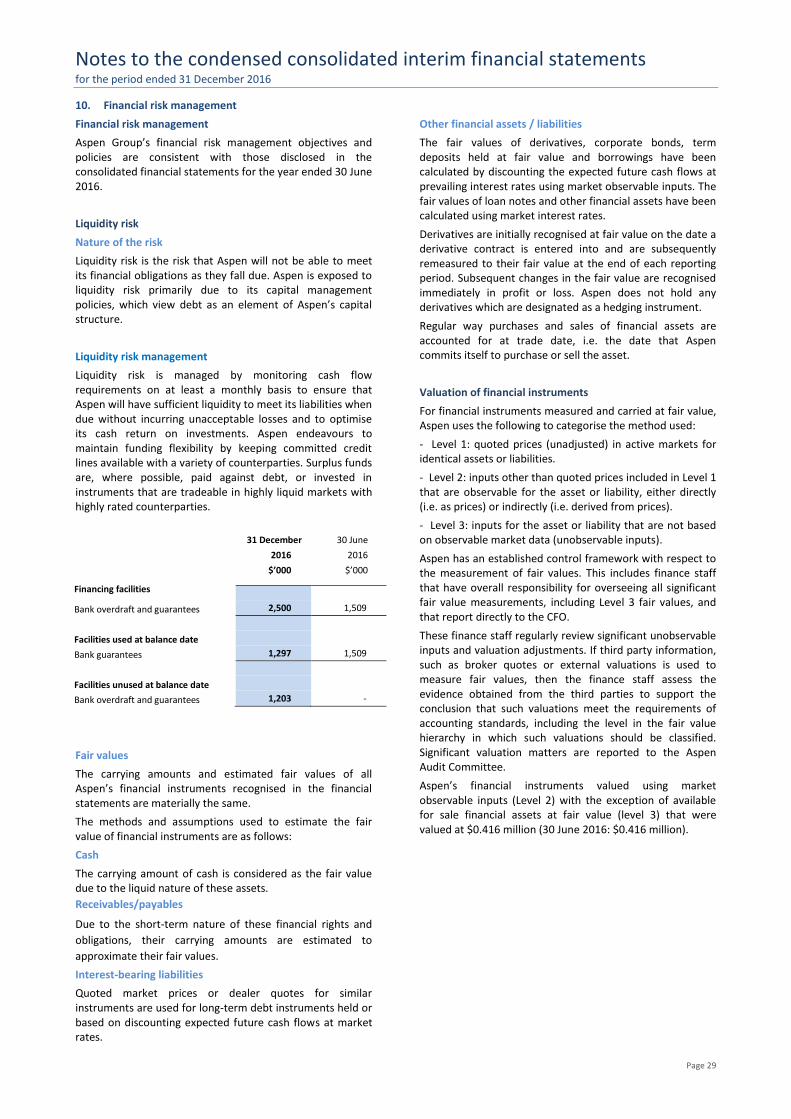
Liquidity risk management
Liquidity risk is managed by monitoring cash flow requirements on at least a monthly basis to ensure that Aspen will have sufficient liquidity to meet its liabilities when due without incurring unacceptable losses and to optimise its cash return on investments. Aspen endeavours to maintain funding flexibility by keeping committed credit lines available with a variety of counterparties. Surplus funds are, where possible, paid against debt, or invested in instruments that are tradeable in highly liquid markets with highly rated counterparties.
31 December 30 June
2016 2016
$’000 $’000
Financing facilities
Bank overdraft and guarantees 2,500 1,509
Facilities used at balance date
Bank guarantees 1,297 1,509
Facilities unused at balance date
Bank overdraft and guarantees 1,203 -
Fair values
The carrying amounts and estimated fair values of all Aspen’s financial instruments recognised in the financial statements are materially the same.
The methods and assumptions used to estimate the fair value of financial instruments are as follows:
Cash
The carrying amount of cash is considered as the fair value due to the liquid nature of these assets.
Receivables/payables
Due to the short-term nature of these financial rights and
obligations, their carrying amounts are estimated to
approximate their fair values.
Interest-bearing liabilities
Quoted market prices or dealer quotes for similar instruments are used for long-term debt instruments held or based on discounting expected future cash flows at market rates.
Other financial assets / liabilities
The fair values of derivatives, corporate bonds, term deposits held at fair value and borrowings have been calculated by discounting the expected future cash flows at prevailing interest rates using market observable inputs. The fair values of loan notes and other financial assets have been calculated using market interest rates.
Derivatives are initially recognised at fair value on the date a derivative contract is entered into and are subsequently remeasured to their fair value at the end of each reporting period. Subsequent changes in the fair value are recognised immediately in profit or loss. Aspen does not hold any derivatives which are designated as a hedging instrument.
Regular way purchases and sales of financial assets are accounted for at trade date, i.e. the date that Aspen commits itself to purchase or sell the asset.
Valuation of financial instruments
For financial instruments measured and carried at fair value, Aspen uses the following to categorise the method used:
- Level 1: quoted prices (unadjusted) in active markets for identical assets or liabilities.
- Level 2: inputs other than quoted prices included in Level 1 that are observable for the asset or liability, either directly (i.e. as prices) or indirectly (i.e. derived from prices).
- Level 3: inputs for the asset or liability that are not based on observable market data (unobservable inputs).
Aspen has an established control framework with respect to the measurement of fair values. This includes finance staff that have overall responsibility for overseeing all significant fair value measurements, including Level 3 fair values, and that report directly to the CFO.
These finance staff regularly review significant unobservable inputs and valuation adjustments. If third party information, such as broker quotes or external valuations is used to measure fair values, then the finance staff assess the evidence obtained from the third parties to support the conclusion that such valuations meet the requirements of accounting standards, including the level in the fair value hierarchy in which such valuations should be classified. Significant valuation matters are reported to the Aspen Audit Committee.
Aspen’s financial instruments valued using market observable inputs (Level 2) with the exception of available for sale financial assets at fair value (level 3) that were valued at $0.416 million (30 June 2016: $0.416 million).
Notes to the condensed consolidated interim financial statements for the period ended 31 December 2016
Page 30
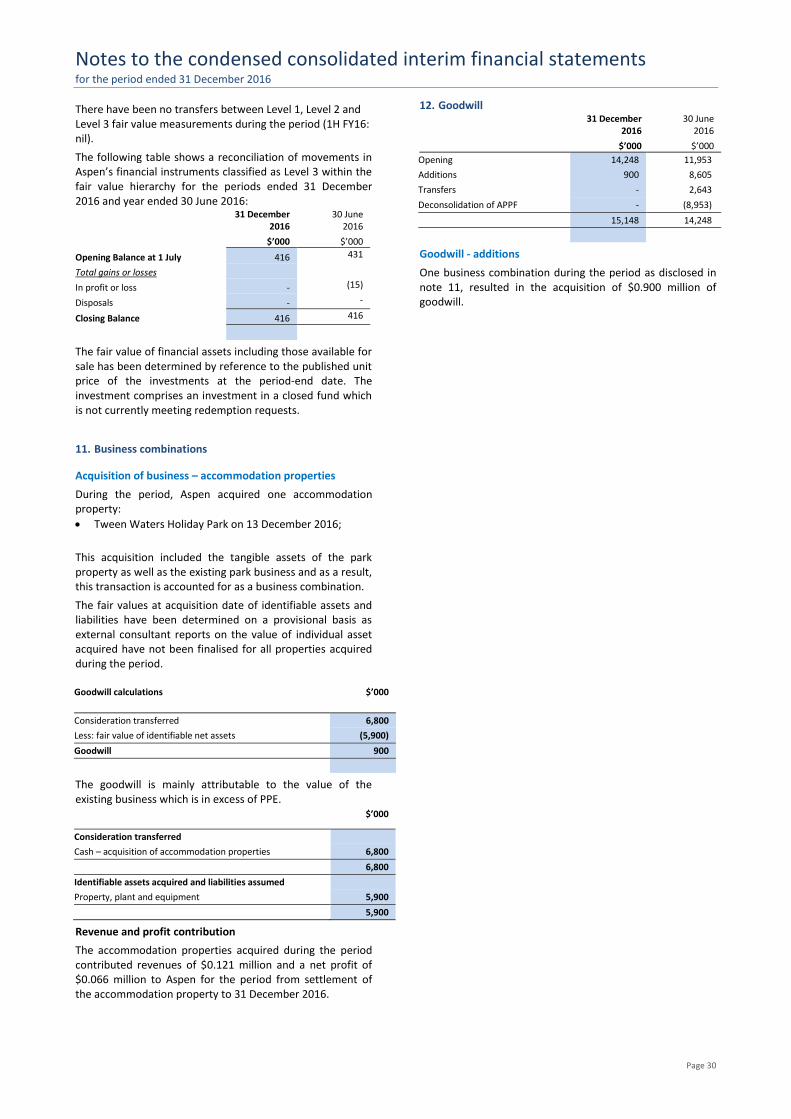
There have been no transfers between Level 1, Level 2 and Level 3 fair value measurements during the period (1H FY16: nil).
The following table shows a reconciliation of movements in Aspen’s financial instruments classified as Level 3 within the fair value hierarchy for the periods ended 31 December 2016 and year ended 30 June 2016: 31 December 30 June 2016 2016
Opening Balance at 1 July
$’000 $’000
416 431
Total gains or losses
In profit or loss - (15)
Disposals - -
Closing Balance 416 416
The fair value of financial assets including those available for sale has been determined by reference to the published unit price of the investments at the period-end date. The investment comprises an investment in a closed fund which is not currently meeting redemption requests.
11. Business combinations
Acquisition of business – accommodation properties
During the period, Aspen acquired one accommodation property:
Tween Waters Holiday Park on 13 December 2016;
This acquisition included the tangible assets of the park property as well as the existing park business and as a result, this transaction is accounted for as a business combination.
The fair values at acquisition date of identifiable assets and liabilities have been determined on a provisional basis as external consultant reports on the value of individual asset acquired have not been finalised for all properties acquired during the period.
Goodwill calculations $’000
Consideration transferred 6,800
Less: fair value of identifiable net assets (5,900)
Goodwill 900
The goodwill is mainly attributable to the value of the existing business which is in excess of PPE. $’000
Consideration transferred
Cash – acquisition of accommodation properties 6,800
6,800
Identifiable assets acquired and liabilities assumed
Property, plant and equipment 5,900
5,900
Revenue and profit contribution
The accommodation properties acquired during the period contributed revenues of $0.121 million and a net profit of $0.066 million to Aspen for the period from settlement of the accommodation property to 31 December 2016.
12. Goodwill 31 December 30 June 2016 2016
$’000 $’000
Opening 14,248 11,953
Additions 900 8,605
Transfers - 2,643
Deconsolidation of APPF - (8,953)
15,148 14,248
Goodwill - additions
One business combination during the period as disclosed in note 11, resulted in the acquisition of $0.900 million of goodwill.
Notes to the condensed consolidated interim financial statements for the period ended 31 December 2016
Page 31
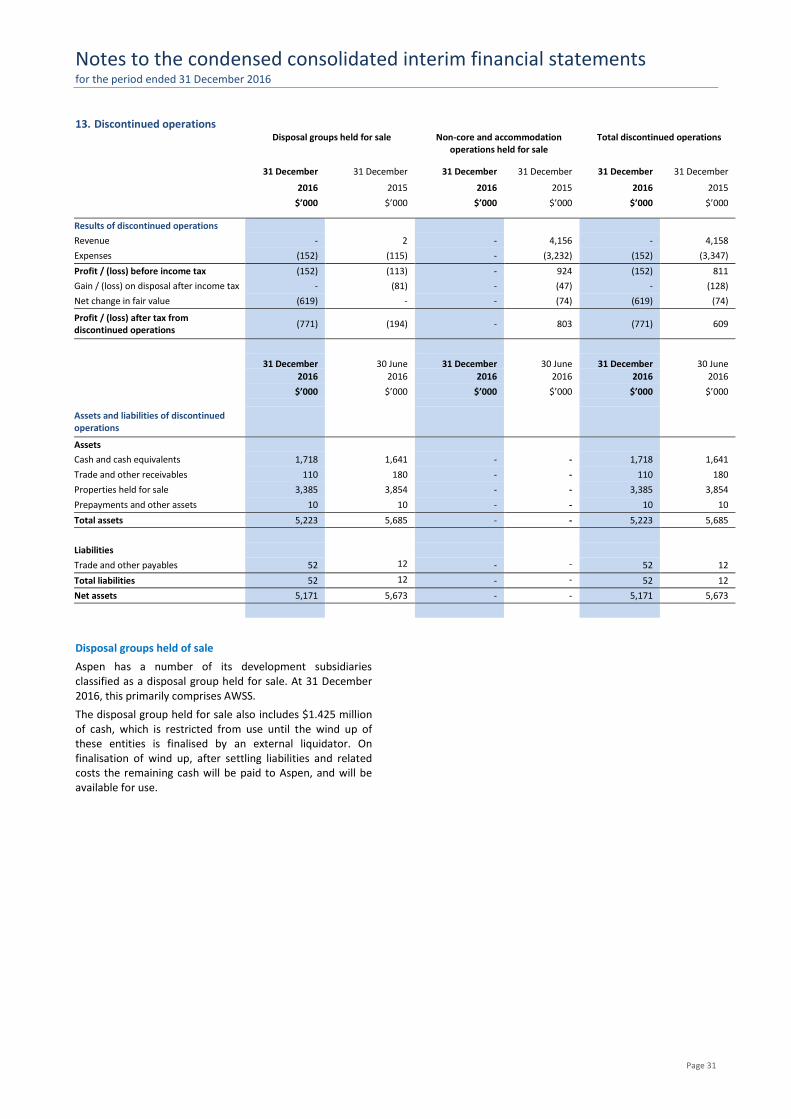
13. Discontinued operations
Disposal groups held for sale Non-core and accommodation operations held for sale
Total discontinued operations
31 December
31 December
31 December
31 December
31 December
31 December 2016 2015 2016 2015 2016 2015
$’000 $’000 $’000 $’000 $’000 $’000
Results of discontinued operations
Revenue - 2 - 4,156 - 4,158
Expenses (152) (115) - (3,232) (152) (3,347)
Profit / (loss) before income tax (152) (113) - 924 (152) 811
Gain / (loss) on disposal after income tax - (81) - (47) - (128)
Net change in fair value (619) - - (74) (619) (74)
Profit / (loss) after tax from discontinued operations
(771) (194) - 803 (771) 609
31 December
30 June
31 December
30 June
31 December
30 June
2016 2016 2016 2016 2016 2016
$’000 $’000 $’000 $’000 $’000 $’000
Assets and liabilities of discontinued operations
Assets
Cash and cash equivalents 1,718 1,641 - - 1,718 1,641
Trade and other receivables 110 180 - - 110 180
Properties held for sale 3,385 3,854 - - 3,385 3,854
Prepayments and other assets 10 10 - - 10 10
Total assets 5,223 5,685 - - 5,223 5,685
Liabilities
Trade and other payables 52 12 - - 52 12
Total liabilities 52 12 - - 52 12
Net assets 5,171 5,673 - - 5,171 5,673
Disposal groups held of sale
Aspen has a number of its development subsidiaries classified as a disposal group held for sale. At 31 December 2016, this primarily comprises AWSS.
The disposal group held for sale also includes $1.425 million of cash, which is restricted from use until the wind up of these entities is finalised by an external liquidator. On finalisation of wind up, after settling liabilities and related costs the remaining cash will be paid to Aspen, and will be available for use.
Notes to the condensed consolidated interim financial statements for the period ended 31 December 2016
Page 32
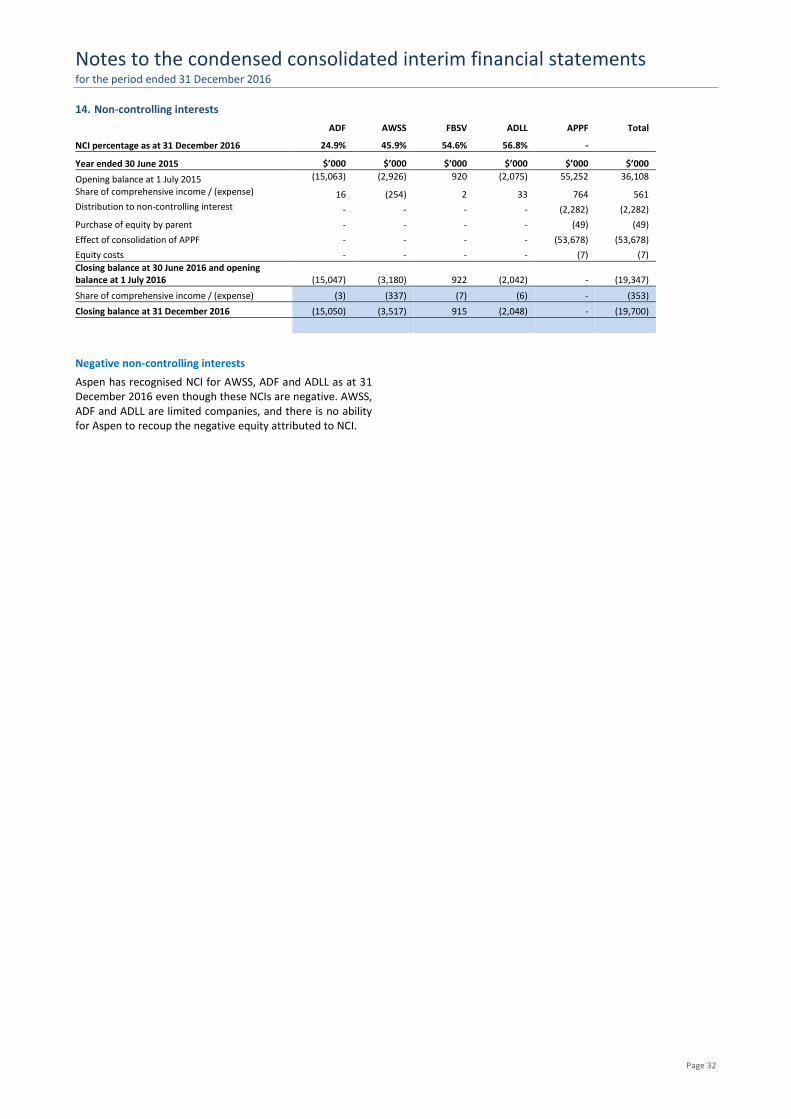
14. Non-controlling interests
ADF AWSS FBSV ADLL APPF Total
NCI percentage as at 31 December 2016 24.9% 45.9% 54.6% 56.8% -
Year ended 30 June 2015 $’000 $’000 $’000 $’000 $’000 $’000
Opening balance at 1 July 2015 (15,063) (2,926) 920 (2,075) 55,252 36,108
Share of comprehensive income / (expense) 16 (254) 2 33 764 561 Distribution to non-controlling interest - - - - (2,282) (2,282)
Purchase of equity by parent - - - - (49) (49)
Effect of consolidation of APPF - - - - (53,678) (53,678)
Equity costs - - - - (7) (7)
Closing balance at 30 June 2016 and opening balance at 1 July 2016 (15,047) (3,180) 922 (2,042) - (19,347)
Share of comprehensive income / (expense) (3) (337) (7) (6) - (353)
Closing balance at 31 December 2016 (15,050) (3,517) 915 (2,048) - (19,700)
Negative non-controlling interests
Aspen has recognised NCI for AWSS, ADF and ADLL as at 31 December 2016 even though these NCIs are negative. AWSS, ADF and ADLL are limited companies, and there is no ability for Aspen to recoup the negative equity attributed to NCI.
Notes to the condensed consolidated financial statements for the period ended 31 December 2016
Page 33
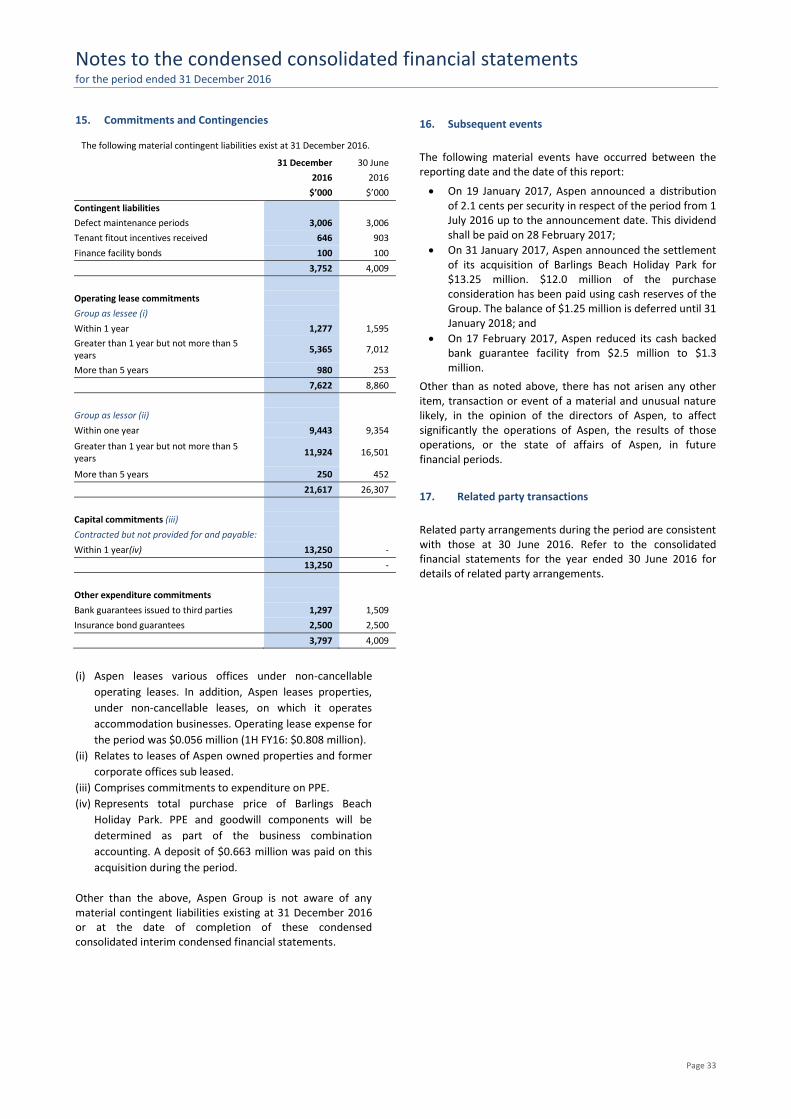
15. Commitments and Contingencies The following material contingent liabilities exist at 31 December 2016.
31 December 30 June
2016 2016
$’000 $’000
Contingent liabilities
Defect maintenance periods 3,006 3,006
Tenant fitout incentives received 646 903
Finance facility bonds 100 100
3,752 4,009
Operating lease commitments
Group as lessee (i)
Within 1 year 1,277 1,595
Greater than 1 year but not more than 5 years
5,365 7,012
More than 5 years 980 253
7,622 8,860
Group as lessor (ii)
Within one year 9,443 9,354
Greater than 1 year but not more than 5 years
11,924 16,501
More than 5 years 250 452
21,617 26,307
Capital commitments (iii)
Contracted but not provided for and payable:
Within 1 year(iv) 13,250 -
13,250 -
Other expenditure commitments
Bank guarantees issued to third parties 1,297 1,509
Insurance bond guarantees 2,500 2,500
3,797 4,009
(i) Aspen leases various offices under non-cancellable
operating leases. In addition, Aspen leases properties,
under non-cancellable leases, on which it operates
accommodation businesses. Operating lease expense for
the period was $0.056 million (1H FY16: $0.808 million).
(ii) Relates to leases of Aspen owned properties and former
corporate offices sub leased.
(iii) Comprises commitments to expenditure on PPE.
(iv) Represents total purchase price of Barlings Beach
Holiday Park. PPE and goodwill components will be
determined as part of the business combination
accounting. A deposit of $0.663 million was paid on this
acquisition during the period.
Other than the above, Aspen Group is not aware of any material contingent liabilities existing at 31 December 2016 or at the date of completion of these condensed consolidated interim condensed financial statements.
16. Subsequent events
The following material events have occurred between the reporting date and the date of this report:
On 19 January 2017, Aspen announced a distribution of 2.1 cents per security in respect of the period from 1 July 2016 up to the announcement date. This dividend shall be paid on 28 February 2017;
On 31 January 2017, Aspen announced the settlement of its acquisition of Barlings Beach Holiday Park for $13.25 million. $12.0 million of the purchase consideration has been paid using cash reserves of the Group. The balance of $1.25 million is deferred until 31 January 2018; and
On 17 February 2017, Aspen reduced its cash backed bank guarantee facility from $2.5 million to $1.3 million.
Other than as noted above, there has not arisen any other item, transaction or event of a material and unusual nature likely, in the opinion of the directors of Aspen, to affect significantly the operations of Aspen, the results of those operations, or the state of affairs of Aspen, in future financial periods.
17. Related party transactions
Related party arrangements during the period are consistent with those at 30 June 2016. Refer to the consolidated financial statements for the year ended 30 June 2016 for details of related party arrangements.
Notes to the condensed consolidated financial statements for the period ended 31 December 2016
Page 34
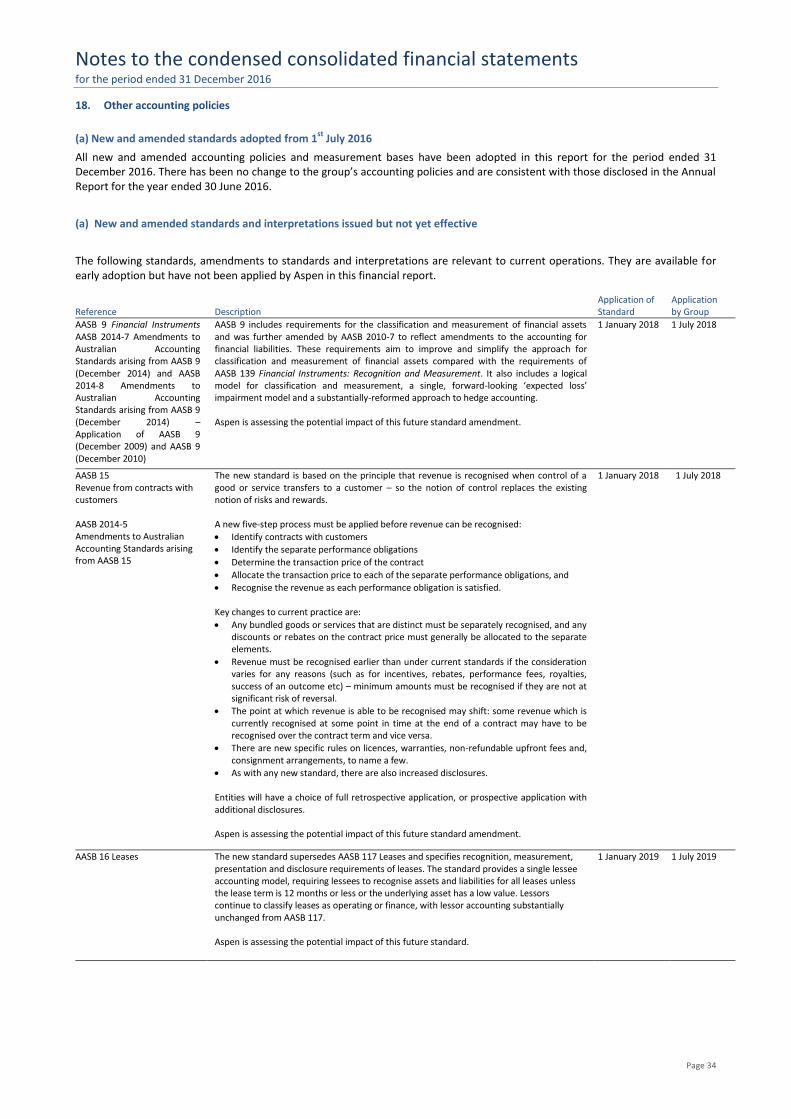
18. Other accounting policies
(a) New and amended standards adopted from 1st
July 2016
All new and amended accounting policies and measurement bases have been adopted in this report for the period ended 31 December 2016. There has been no change to the group’s accounting policies and are consistent with those disclosed in the Annual Report for the year ended 30 June 2016.
(a) New and amended standards and interpretations issued but not yet effective
The following standards, amendments to standards and interpretations are relevant to current operations. They are available for early adoption but have not been applied by Aspen in this financial report.
Reference Description Application of Standard
Application by Group
AASB 9 Financial Instruments AASB 2014-7 Amendments to Australian Accounting Standards arising from AASB 9 (December 2014) and AASB 2014-8 Amendments to Australian Accounting Standards arising from AASB 9 (December 2014) – Application of AASB 9 (December 2009) and AASB 9 (December 2010)
AASB 9 includes requirements for the classification and measurement of financial assets and was further amended by AASB 2010-7 to reflect amendments to the accounting for financial liabilities. These requirements aim to improve and simplify the approach for classification and measurement of financial assets compared with the requirements of AASB 139 Financial Instruments: Recognition and Measurement. It also includes a logical model for classification and measurement, a single, forward-looking ‘expected loss’ impairment model and a substantially-reformed approach to hedge accounting. Aspen is assessing the potential impact of this future standard amendment.
1 January 2018 1 July 2018
AASB 15 Revenue from contracts with customers AASB 2014-5 Amendments to Australian Accounting Standards arising from AASB 15
The new standard is based on the principle that revenue is recognised when control of a good or service transfers to a customer – so the notion of control replaces the existing notion of risks and rewards. A new five-step process must be applied before revenue can be recognised:
Identify contracts with customers
Identify the separate performance obligations
Determine the transaction price of the contract
Allocate the transaction price to each of the separate performance obligations, and
Recognise the revenue as each performance obligation is satisfied. Key changes to current practice are:
Any bundled goods or services that are distinct must be separately recognised, and any discounts or rebates on the contract price must generally be allocated to the separate elements.
Revenue must be recognised earlier than under current standards if the consideration varies for any reasons (such as for incentives, rebates, performance fees, royalties, success of an outcome etc) – minimum amounts must be recognised if they are not at significant risk of reversal.
The point at which revenue is able to be recognised may shift: some revenue which is currently recognised at some point in time at the end of a contract may have to be recognised over the contract term and vice versa.
There are new specific rules on licences, warranties, non-refundable upfront fees and, consignment arrangements, to name a few.
As with any new standard, there are also increased disclosures. Entities will have a choice of full retrospective application, or prospective application with additional disclosures. Aspen is assessing the potential impact of this future standard amendment.
1 January 2018 1 July 2018
AASB 16 Leases The new standard supersedes AASB 117 Leases and specifies recognition, measurement, presentation and disclosure requirements of leases. The standard provides a single lessee accounting model, requiring lessees to recognise assets and liabilities for all leases unless the lease term is 12 months or less or the underlying asset has a low value. Lessors continue to classify leases as operating or finance, with lessor accounting substantially unchanged from AASB 117. Aspen is assessing the potential impact of this future standard.
1 January 2019 1 July 2019
Notes to the condensed consolidated financial statements for the period ended 31 December 2016
Page 35
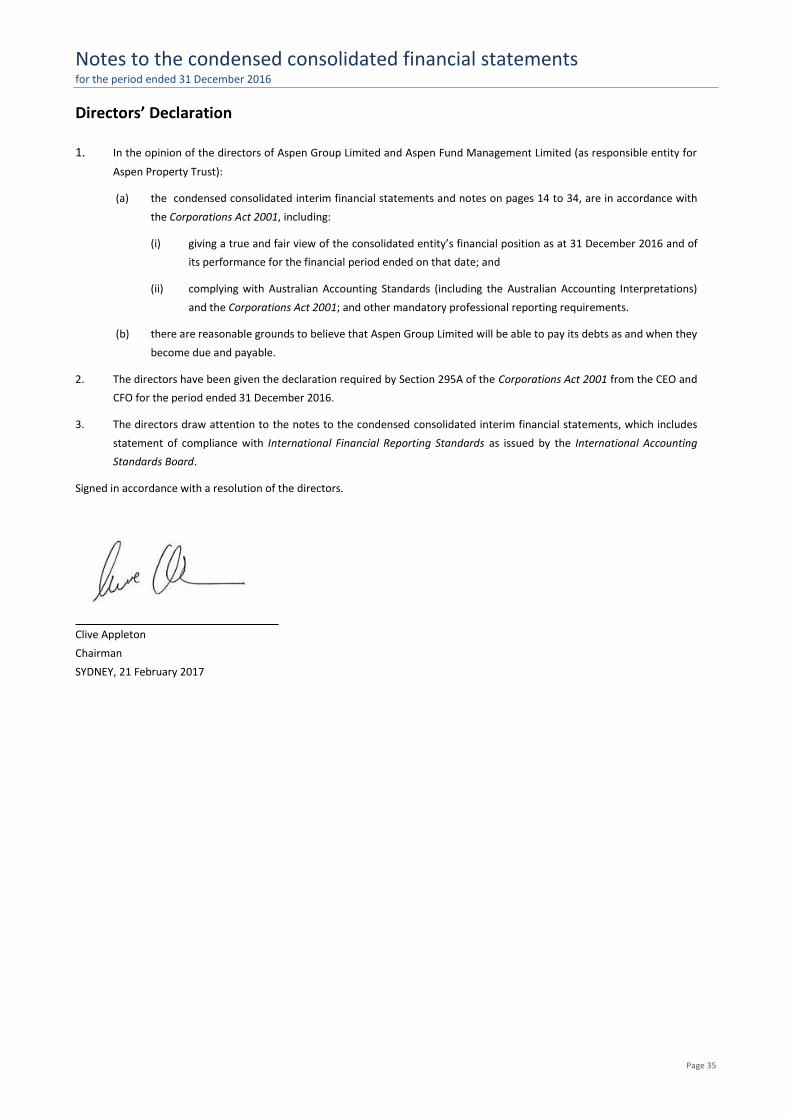
Directors’ Declaration
1. In the opinion of the directors of Aspen Group Limited and Aspen Fund Management Limited (as responsible entity for
Aspen Property Trust):
(a) the condensed consolidated interim financial statements and notes on pages 14 to 34, are in accordance with
the Corporations Act 2001, including:
(i) giving a true and fair view of the consolidated entity’s financial position as at 31 December 2016 and of
its performance for the financial period ended on that date; and
(ii) complying with Australian Accounting Standards (including the Australian Accounting Interpretations)
and the Corporations Act 2001; and other mandatory professional reporting requirements.
(b) there are reasonable grounds to believe that Aspen Group Limited will be able to pay its debts as and when they
become due and payable.
2. The directors have been given the declaration required by Section 295A of the Corporations Act 2001 from the CEO and
CFO for the period ended 31 December 2016.
3. The directors draw attention to the notes to the condensed consolidated interim financial statements, which includes
statement of compliance with International Financial Reporting Standards as issued by the International Accounting
Standards Board.
Signed in accordance with a resolution of the directors.
Clive Appleton
Chairman
SYDNEY, 21 February 2017