asia session: hongpeng liu, energy security and water resources section, 15th january un water...
TRANSCRIPT
Current status and major challenges on water in the Asia-Pacific region
Hongpeng Liu
Chief, Energy Security and Water Resources Section
Content
• Major Issues and challenges in Asia and the Pacific– Climate Change Impacts
– Disaster Risks
– Water & Sanitation
• Emerging focus– Water security
– Water-Food-Energy Nexus
• Tools & IWRM
Major Issues and challenges in Asia & the Pacific
Multiple challenges in water sector
• Increasing water scarcity threat• High water utilization• Deteriorating water quality, Poor water quality and low water
endowment• Flood-prone countries, Cyclone-prone countries, Drought-prone
countries• Ecosystem changes/ Climate change risk• Poor access to drinking water, Poor access to sanitation, etc
– 635 million people lack access to safe water and 1.9 billion lack access to effective sanitation. Require over US$ 130b investments
– China, India, Indonesia, South Korea and Vietnam, are all in or close to being in conditions of water stress
– The exceptions are few: Bhutan, Brunei, Burma, Cambodia, Laos, Malaysia and Papua New Guinea
CLIMATE CHANGE IMPACTS
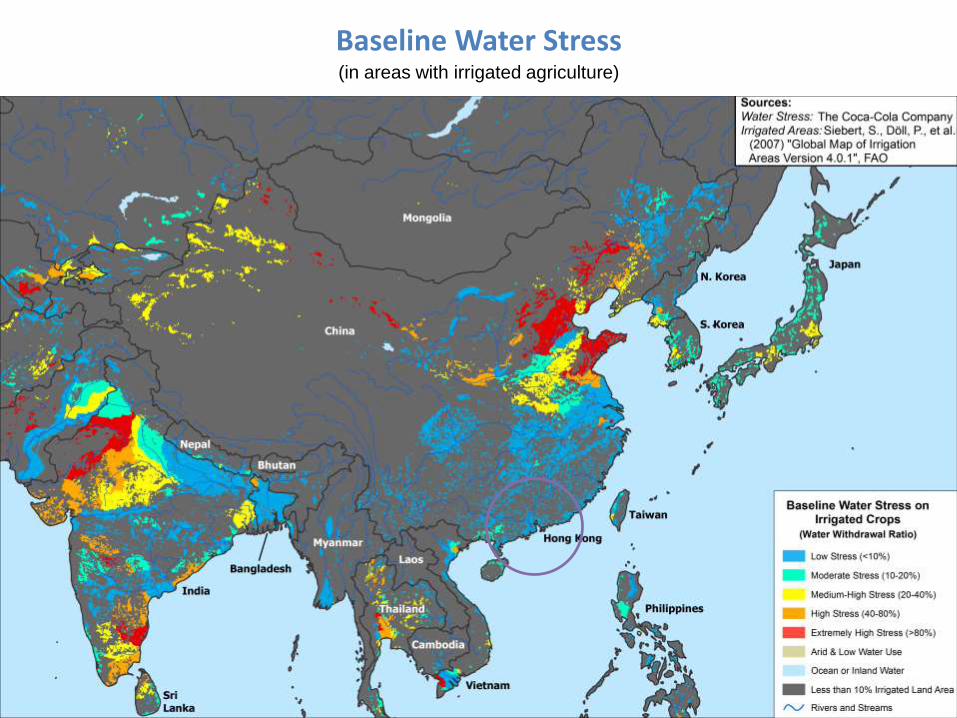
Baseline Water Stress(in areas with irrigated agriculture)
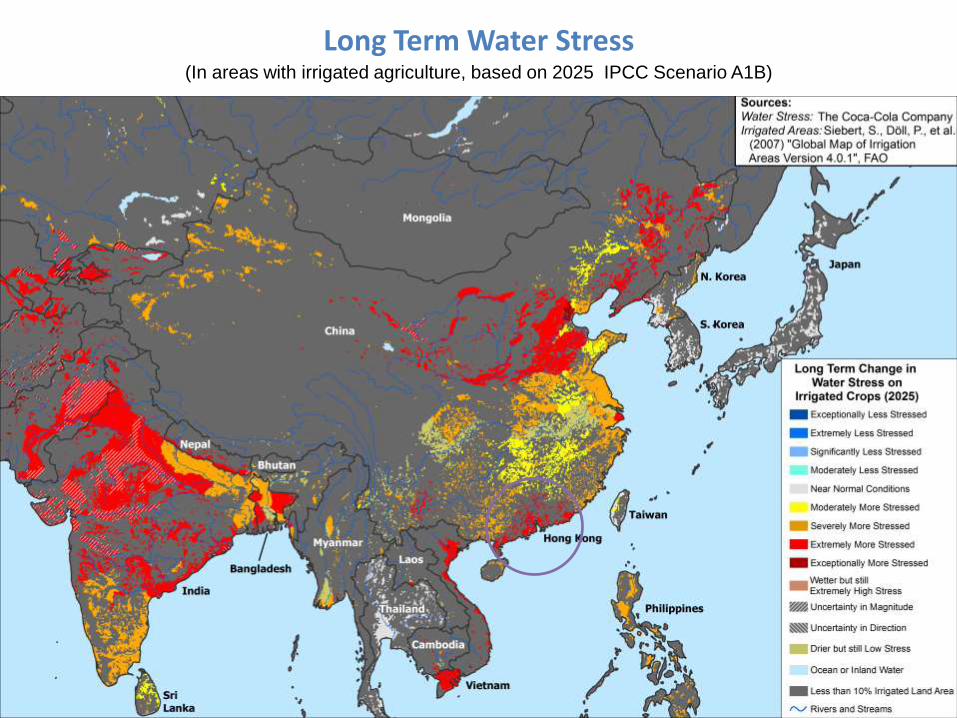
(In areas with irrigated agriculture, based on 2025 IPCC Scenario A1B)
Long Term Water Stress
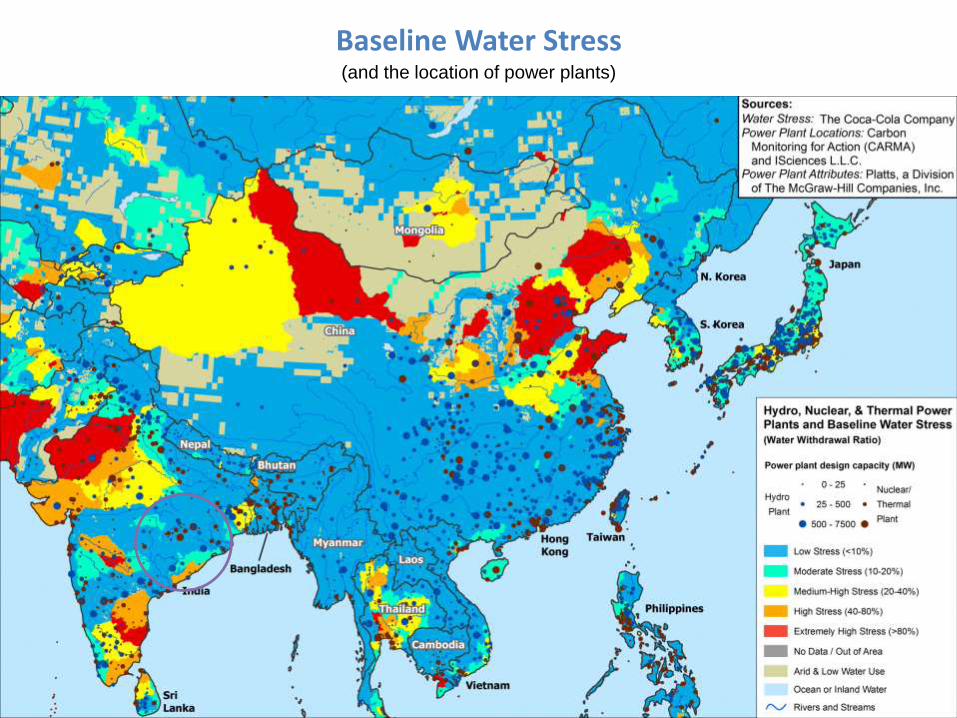
Baseline Water Stress(and the location of power plants)
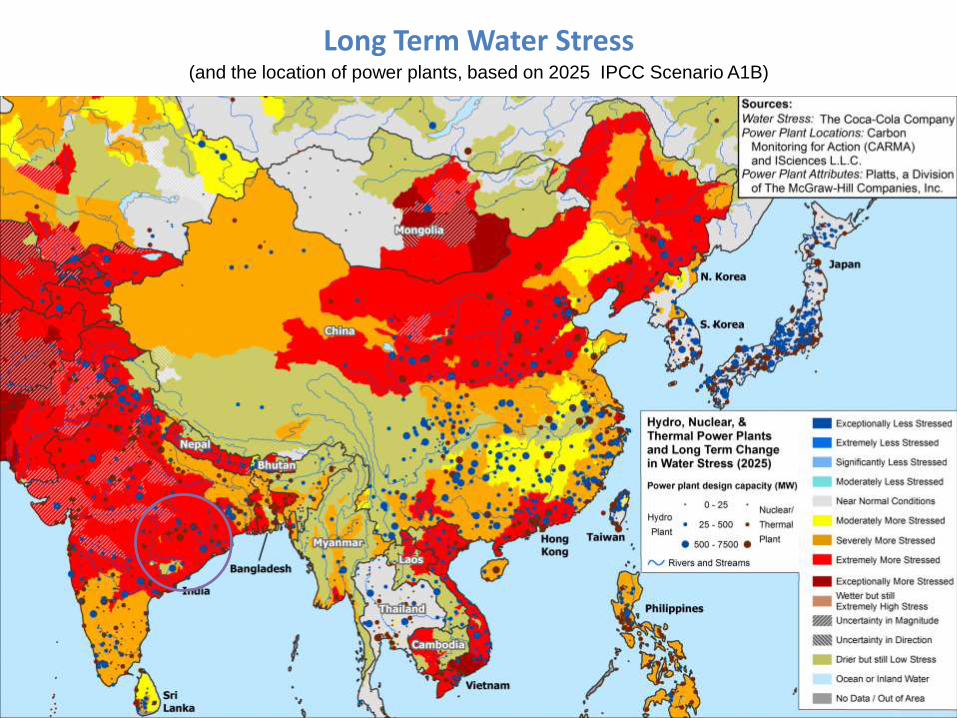
(and the location of power plants, based on 2025 IPCC Scenario A1B)
Long Term Water Stress
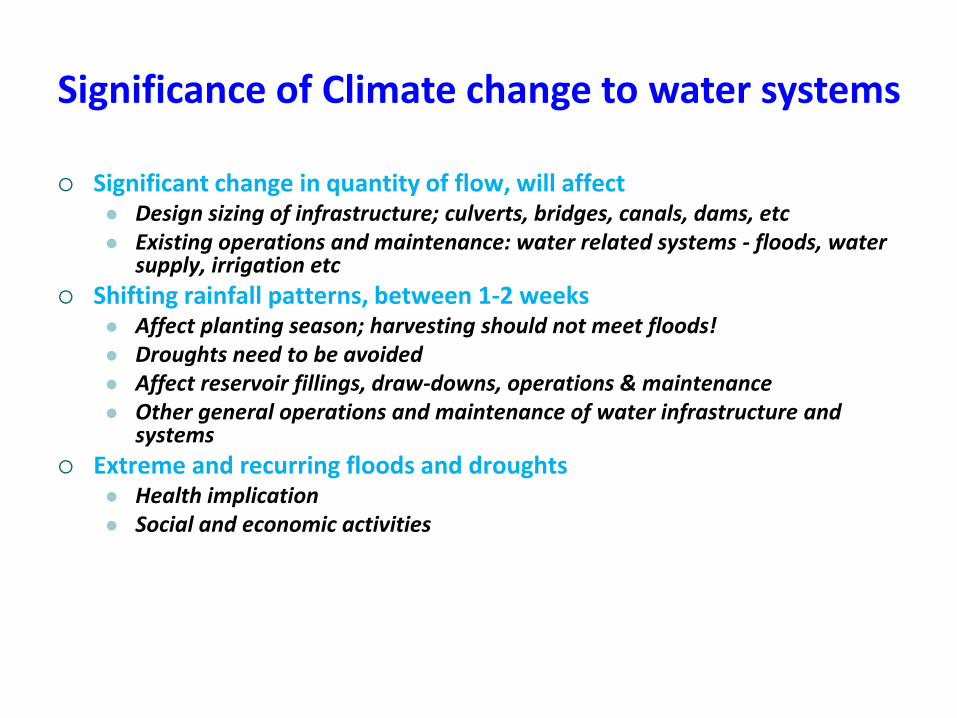
Significance of Climate change to water systems
Significant change in quantity of flow, will affect Design sizing of infrastructure; culverts, bridges, canals, dams, etc Existing operations and maintenance: water related systems - floods, water
supply, irrigation etc
Shifting rainfall patterns, between 1-2 weeks Affect planting season; harvesting should not meet floods! Droughts need to be avoided Affect reservoir fillings, draw-downs, operations & maintenance Other general operations and maintenance of water infrastructure and
systems
Extreme and recurring floods and droughts Health implication Social and economic activities
DISASTER RISKS IN ASIA PACIFIC
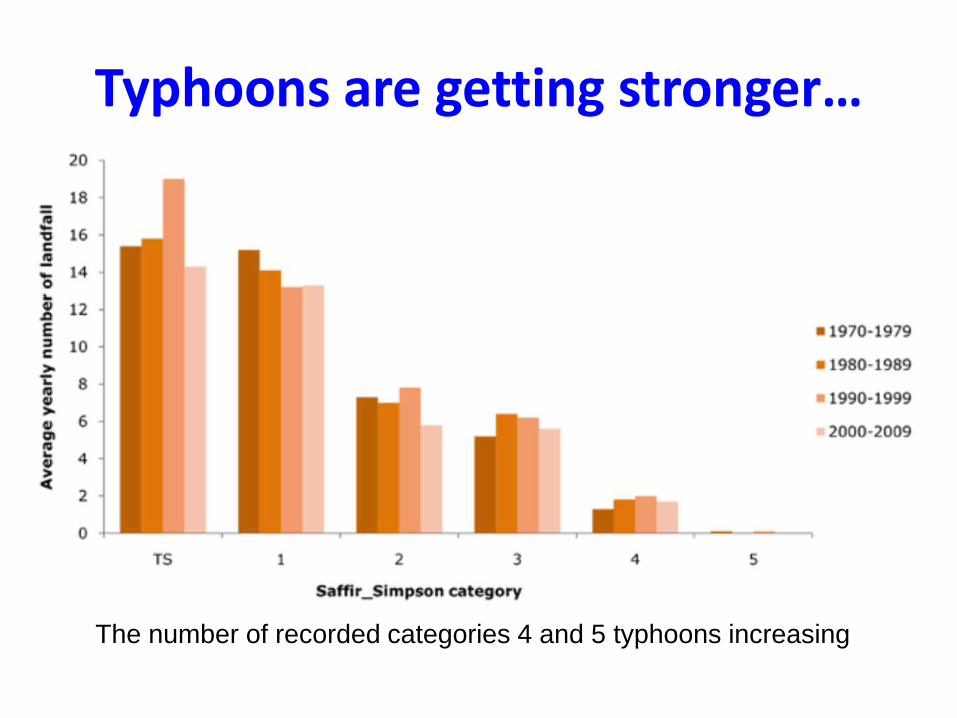
Typhoons are getting stronger…
The number of recorded categories 4 and 5 typhoons increasing
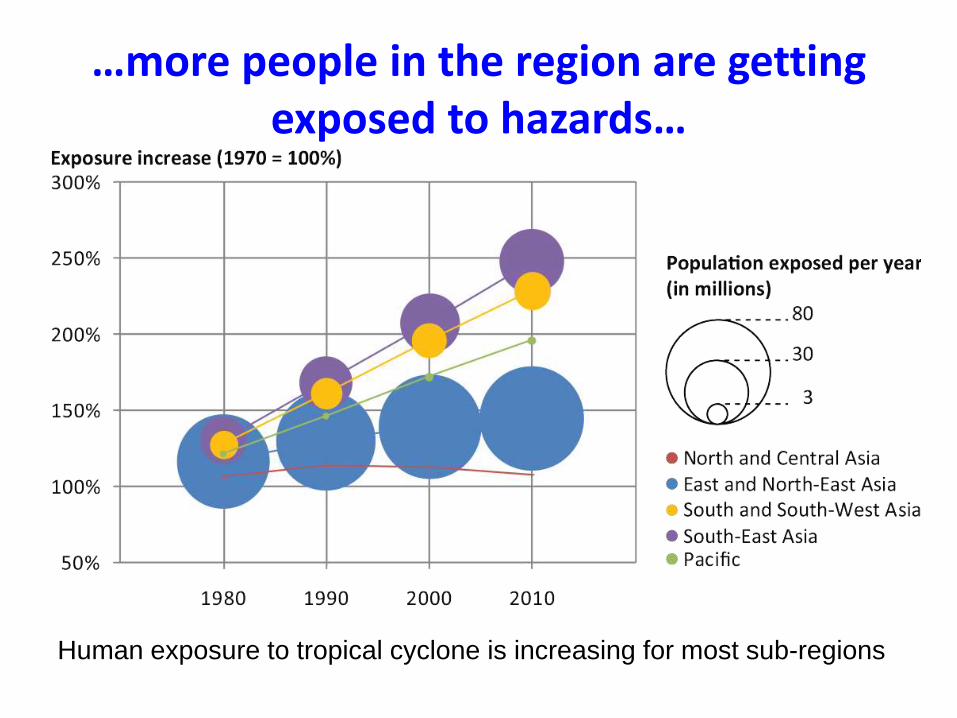
…more people in the region are getting exposed to hazards…
Human exposure to tropical cyclone is increasing for most sub-regions
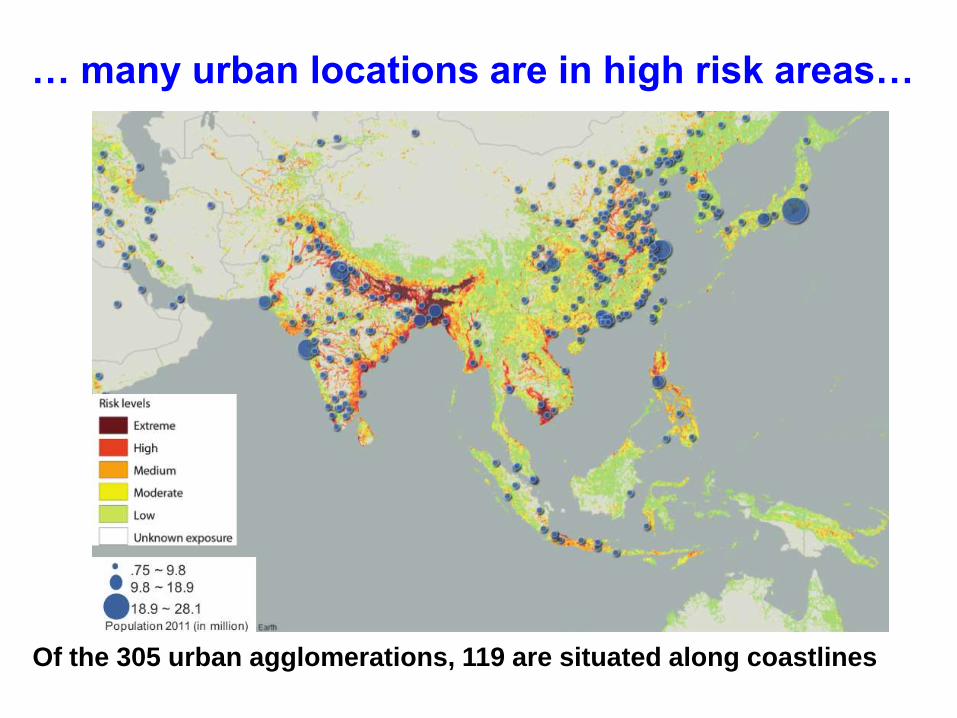
… many urban locations are in high risk areas…
Of the 305 urban agglomerations, 119 are situated along coastlines
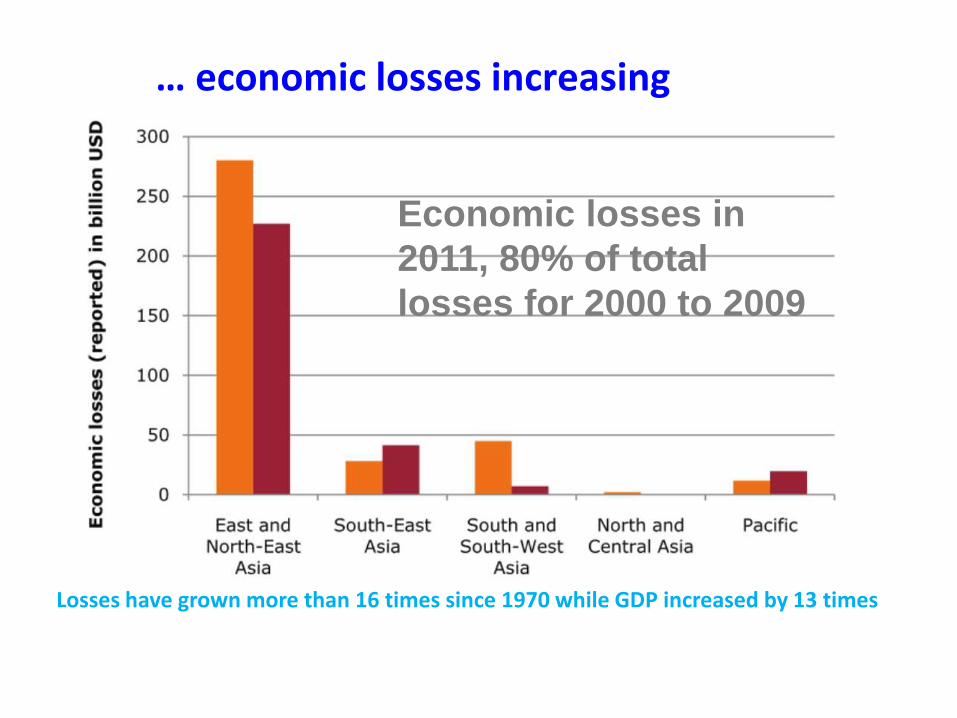
… economic losses increasing
Economic losses in
2011, 80% of total
losses for 2000 to 2009
Losses have grown more than 16 times since 1970 while GDP increased by 13 times
Water and Sanitation
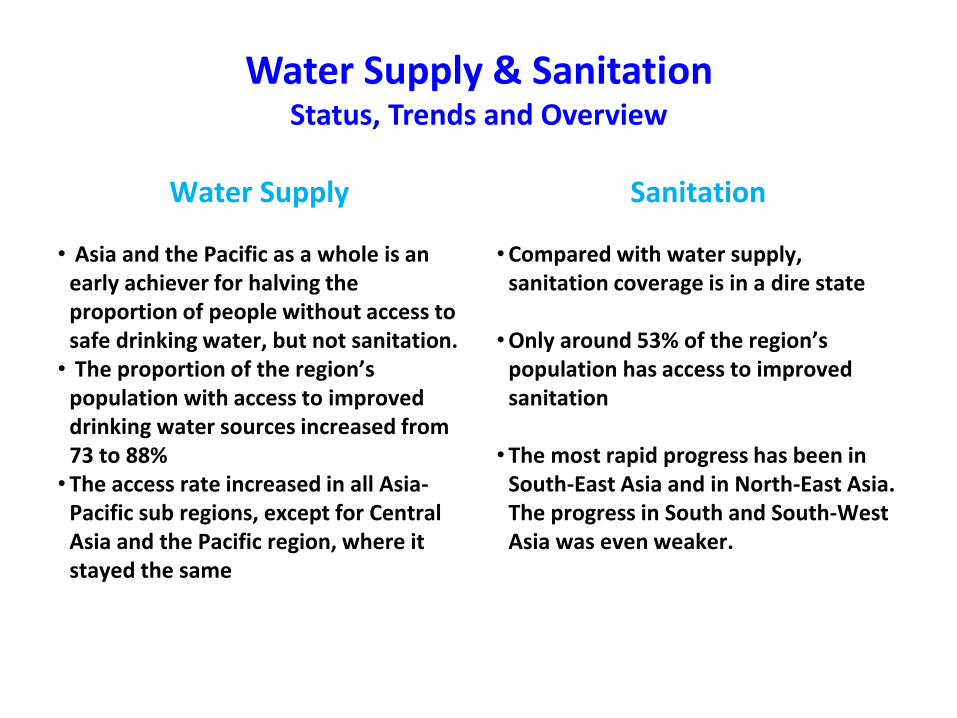
Water Supply & Sanitation Status, Trends and Overview
Water Supply
• Asia and the Pacific as a whole is an early achiever for halving the proportion of people without access to safe drinking water, but not sanitation. • The proportion of the region’s
population with access to improved drinking water sources increased from 73 to 88%• The access rate increased in all Asia-
Pacific sub regions, except for Central Asia and the Pacific region, where it stayed the same
Sanitation
•Compared with water supply, sanitation coverage is in a dire state
•Only around 53% of the region’s population has access to improved sanitation
• The most rapid progress has been in South-East Asia and in North-East Asia. The progress in South and South-West Asia was even weaker.
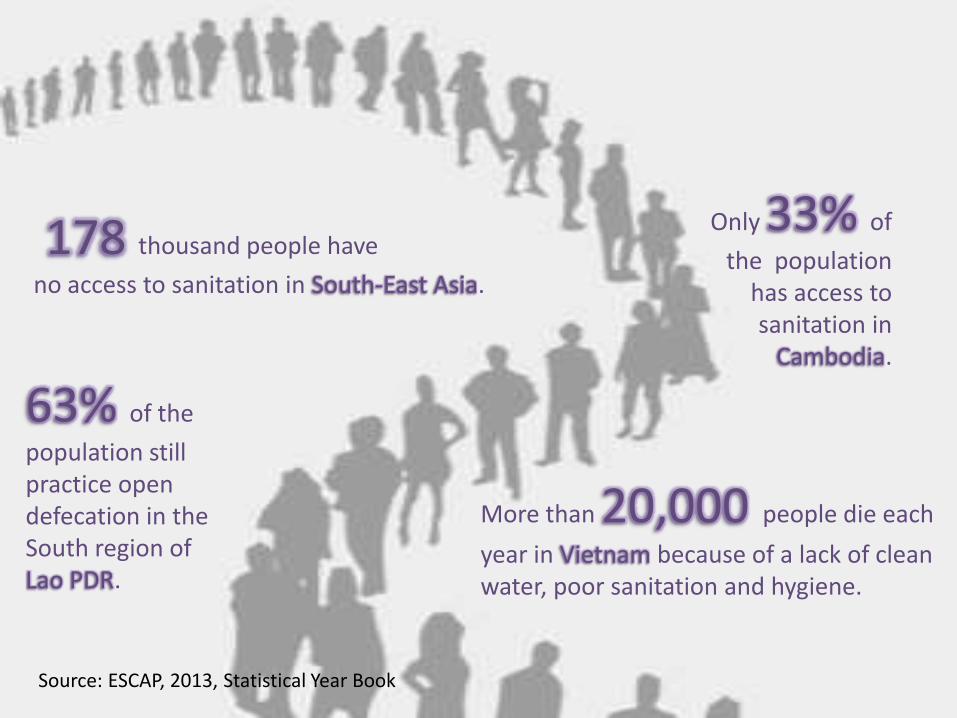
178 thousand people have
no access to sanitation in South-East Asia.
Only 33% of
the population has access to sanitation in
Cambodia.
63% of the
population still practice open defecation in the South region of Lao PDR.
More than 20,000 people die each
year in Vietnam because of a lack of clean water, poor sanitation and hygiene.
Source: ESCAP, 2013, Statistical Year Book
Emerging Focus
• Water security
• Water-Food-Energy Nexus
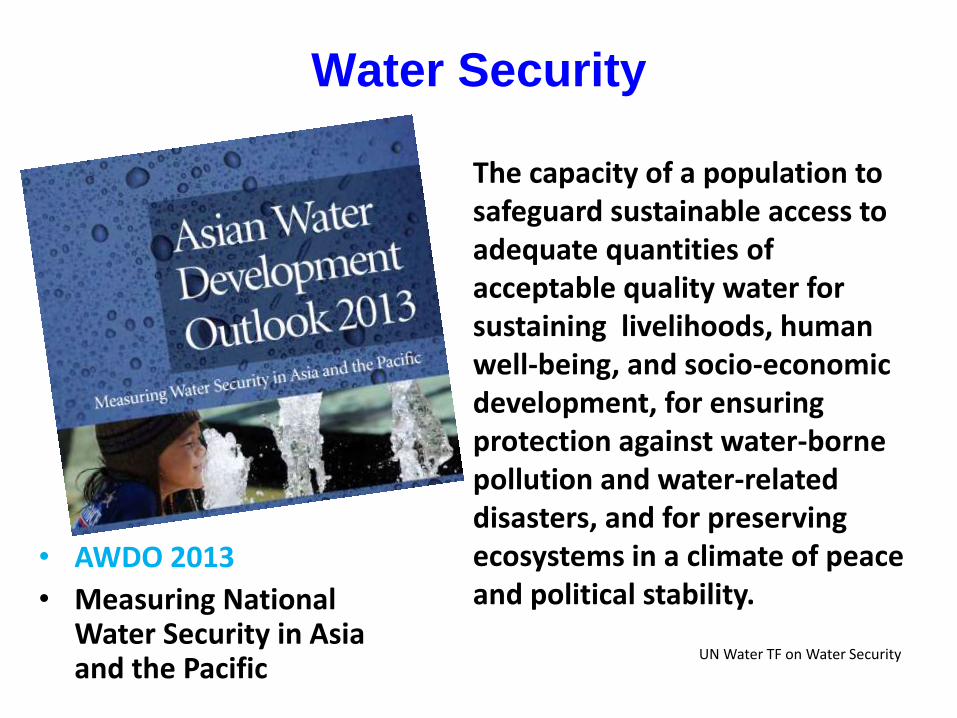
Water Security
• AWDO 2013
• Measuring National Water Security in Asia and the Pacific
The capacity of a population to safeguard sustainable access to adequate quantities of acceptable quality water for sustaining livelihoods, human well-being, and socio-economic development, for ensuring protection against water-borne pollution and water-related disasters, and for preserving ecosystems in a climate of peace and political stability.
UN Water TF on Water Security
Vision
• Societies can enjoy water security when they successfully manage their water resources and services to
1. Satisfy household water and sanitation needs in all communities
2. Support productive economies in agriculture, industry and energy
3. Develop vibrant, livable cities and towns
4. Restore healthy rivers and ecosystems
5. Build resilient communities that can adapt to change
Water-Food-Energy Nexus
• Why a nexus approach?
– ‘The key drivers impacting the condition, use and management of water resources are all external to the water box’. (Uncer, UN Water)
– The same is true in agriculture (and energy to a lesser extent)
– The Ministry of Water, acting alone, cannot prevent a water crisis
Demand for food (and meat) is growing…
• To meet forecast growth in demand for food over the next 20 years, farmers will need to increase global agricultural production by 70-100%
• More than 25% of this increase in grain demand will actually be due to changes in consumer diets (meat)
Demand for energy is growing…
• Global energy demand is set to grow by 37% by 2040 (IEA )
• The global distribution of energy demand changes more dramatically, with energy use essentially flat in much of Europe, Japan, Korea and North America, and rising consumption concentrated in the rest of Asia (60% of the global total), Africa, the Middle East and Latin America
• By 2030 China will need to expand its power generating capacity by over 1,300 GW (1.5 times the current level of the United States); and India by 400 GW (equal to the current combined total power generation of Japan, South Korea and Australia) (IEA)
• More energy and more food means growing demand for water…
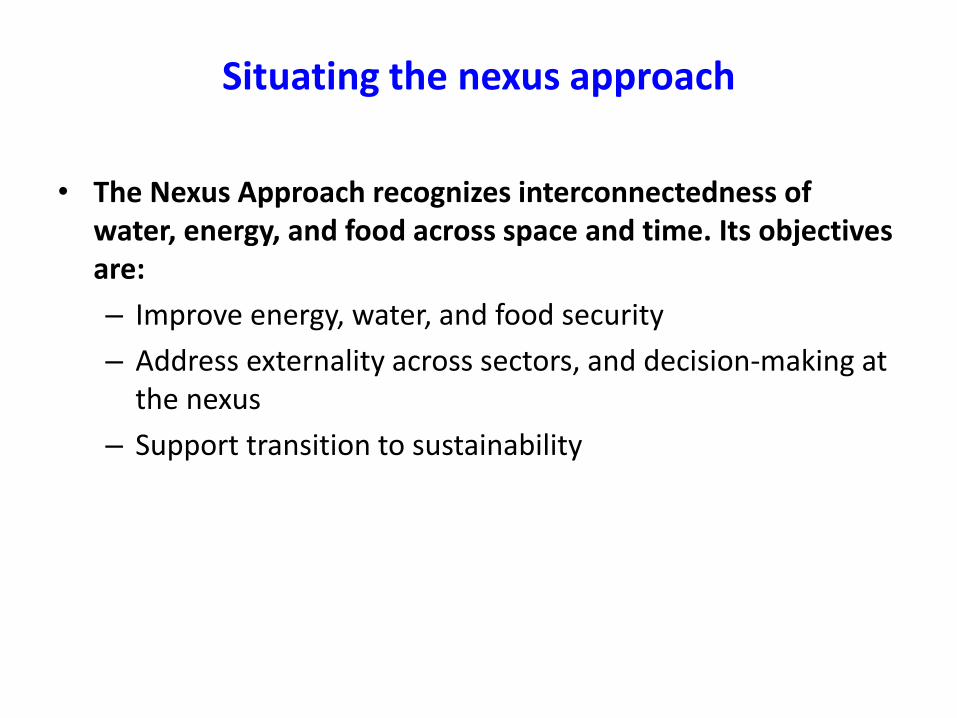
Situating the nexus approach
• The Nexus Approach recognizes interconnectedness of water, energy, and food across space and time. Its objectives are:
– Improve energy, water, and food security
– Address externality across sectors, and decision-making at the nexus
– Support transition to sustainability
Tools
• Water Hotspots
• Water Security Framework
• Household Water Security Index
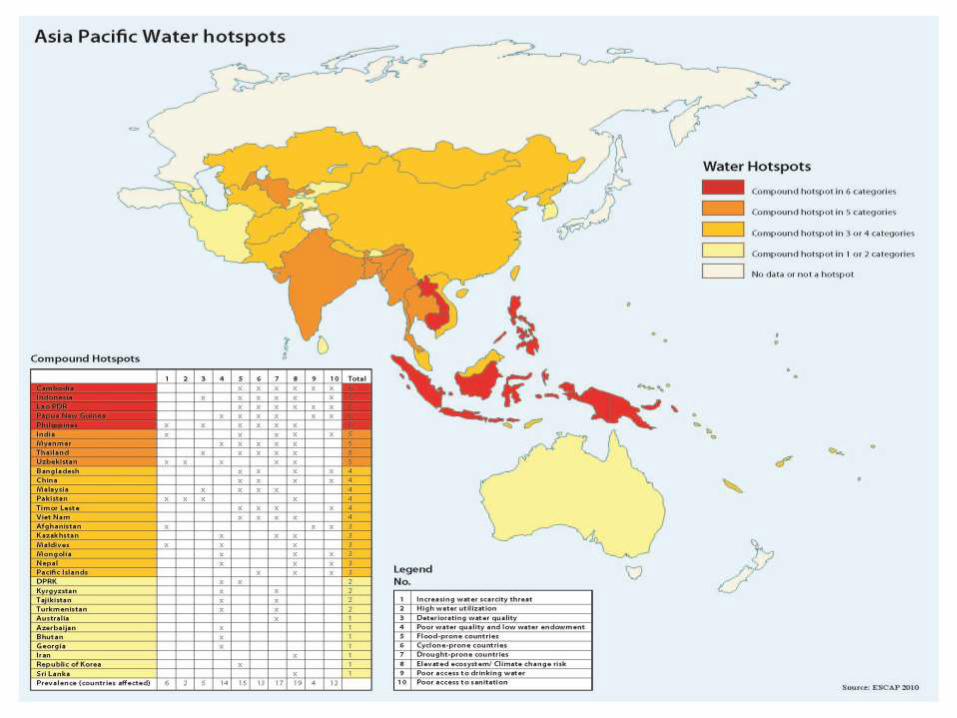
Asia Pacific Water Hotspots (2011)
• Hotspots - countries or areas or ecosystems with overlapping challenges of poor access to water and sanitation, deteriorating water quality, limited water availability and increased exposure to climate change and water-related disasters
Hotspots
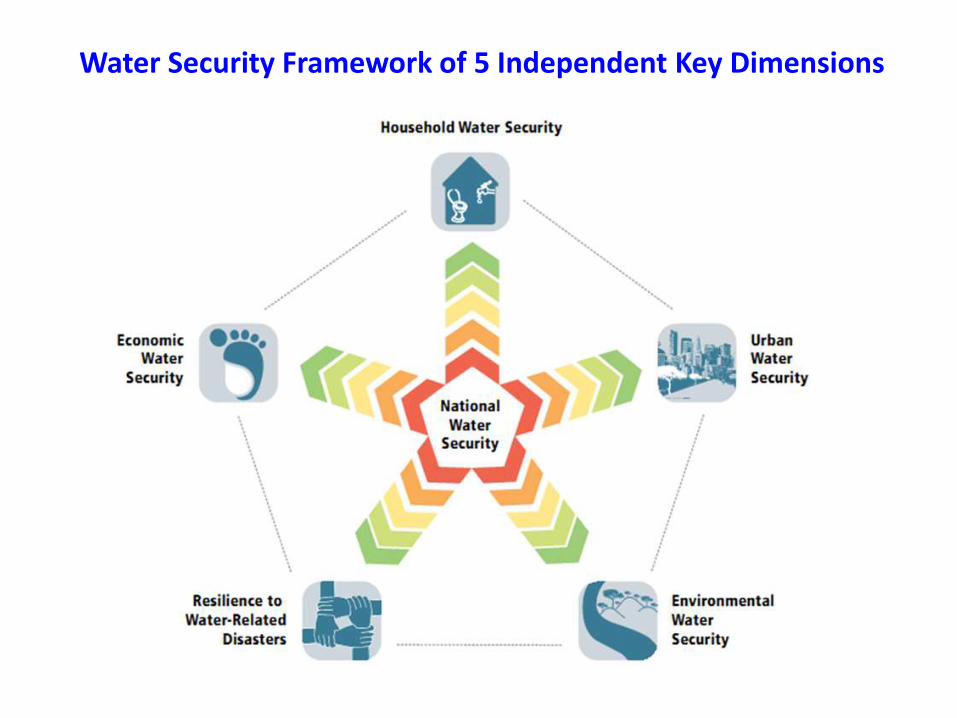
Water Security Framework of 5 Independent Key Dimensions
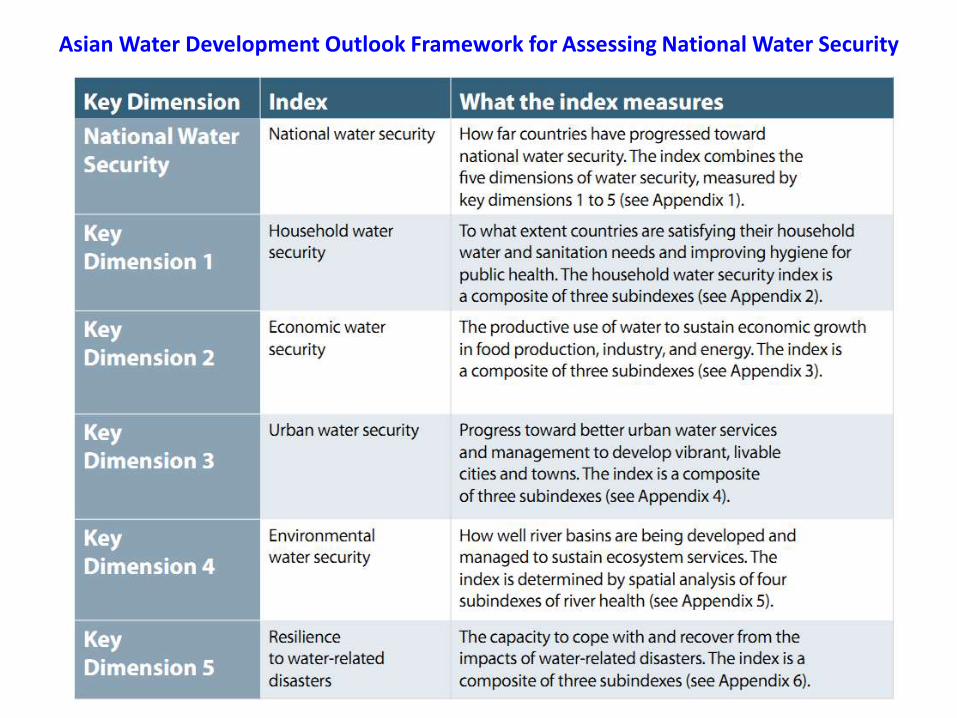
Asian Water Development Outlook Framework for Assessing National Water Security
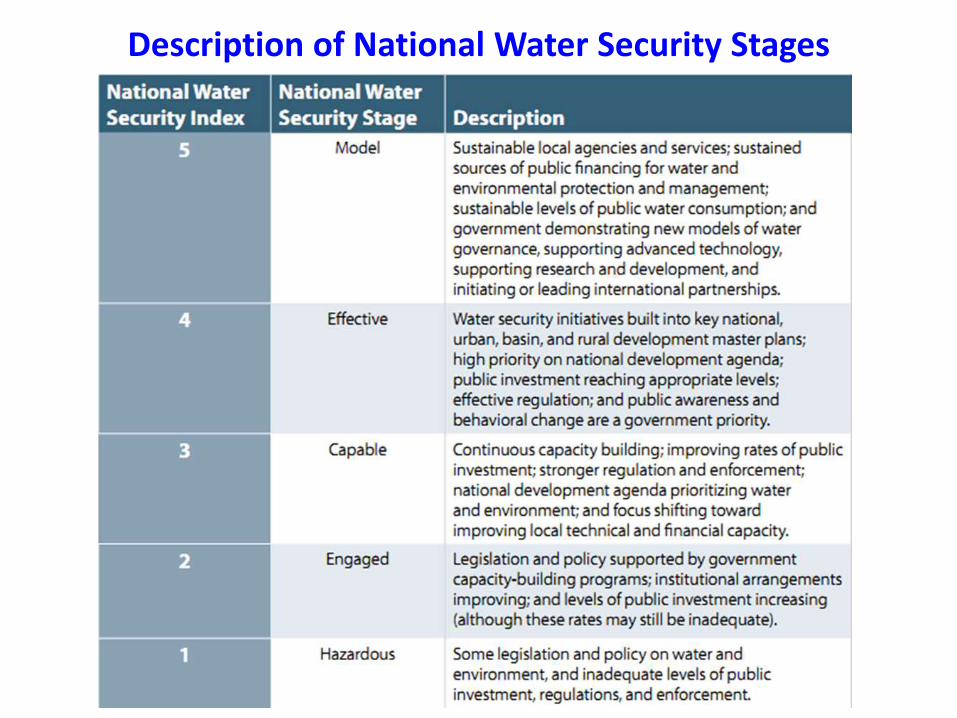
Description of National Water Security Stages
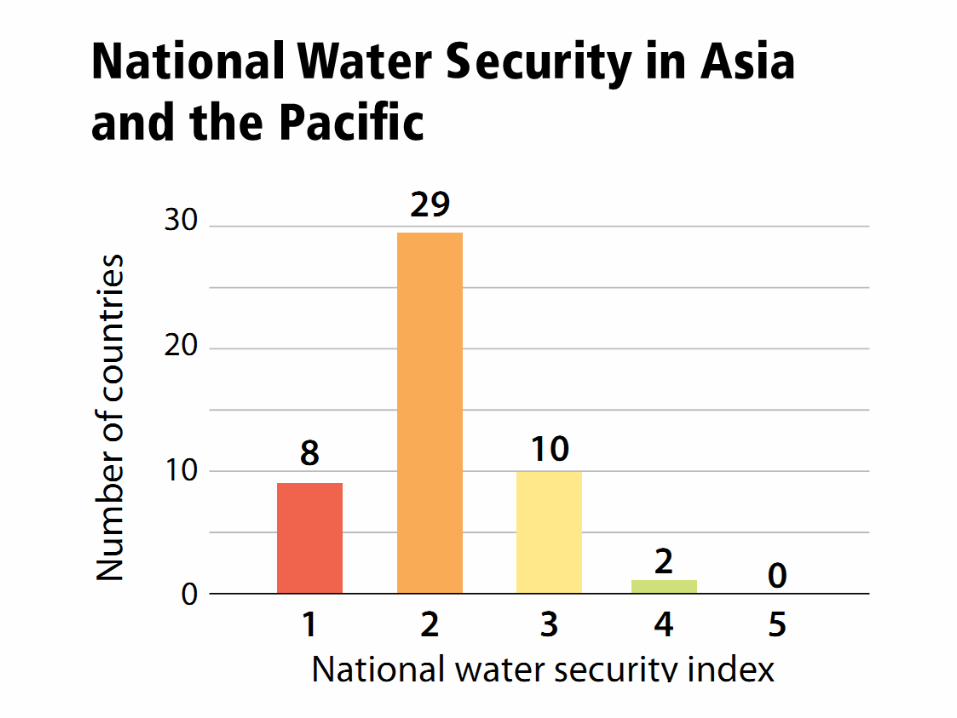
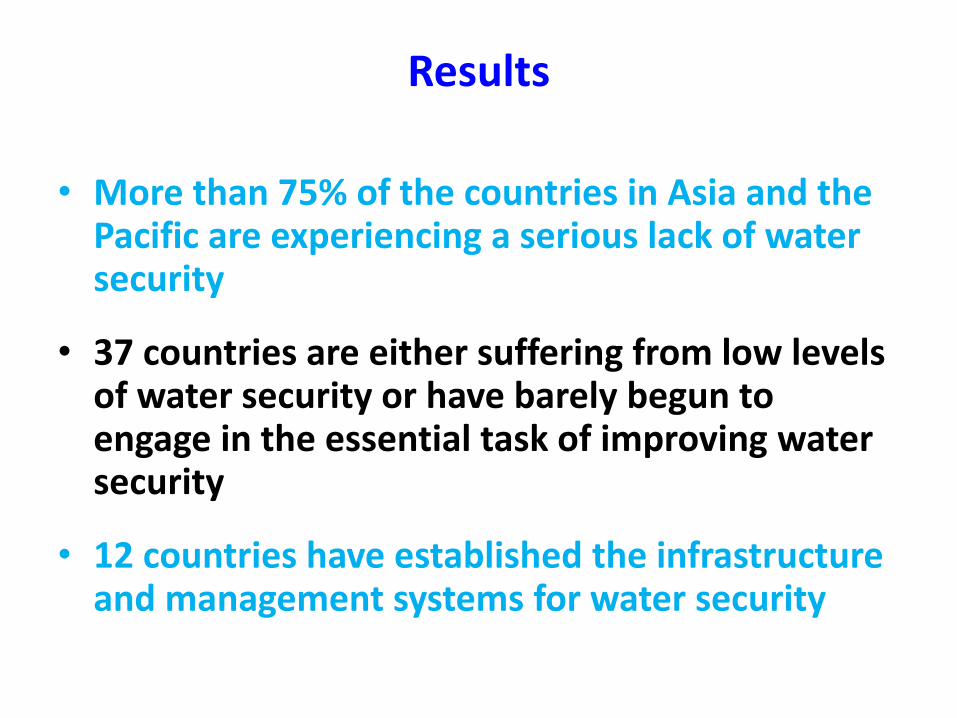
Results
• More than 75% of the countries in Asia and the Pacific are experiencing a serious lack of water security
• 37 countries are either suffering from low levels of water security or have barely begun to engage in the essential task of improving water security
• 12 countries have established the infrastructure and management systems for water security
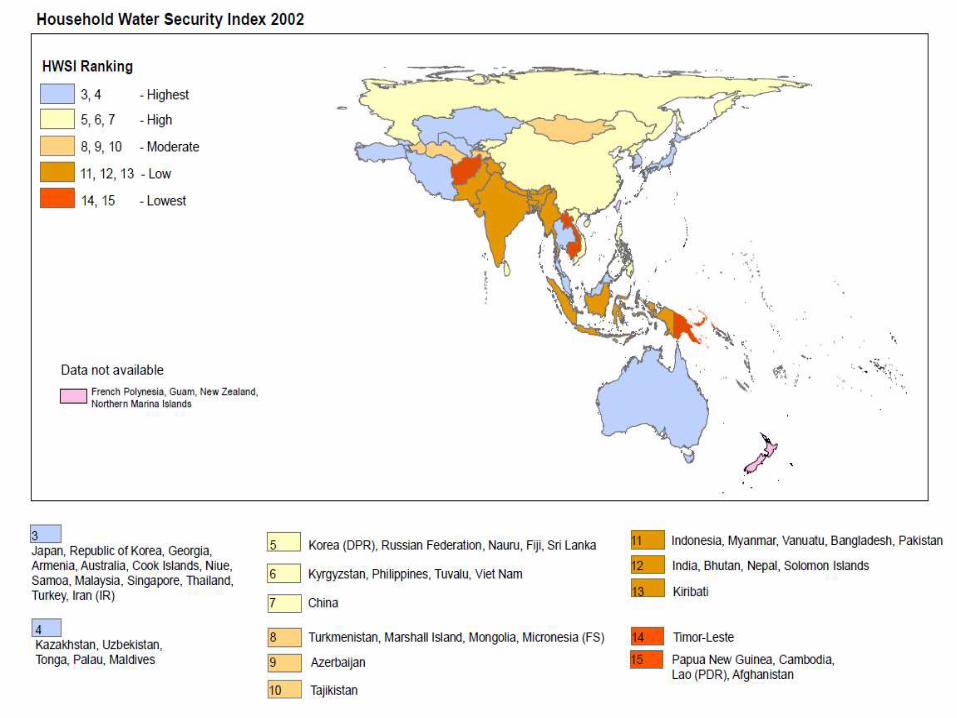
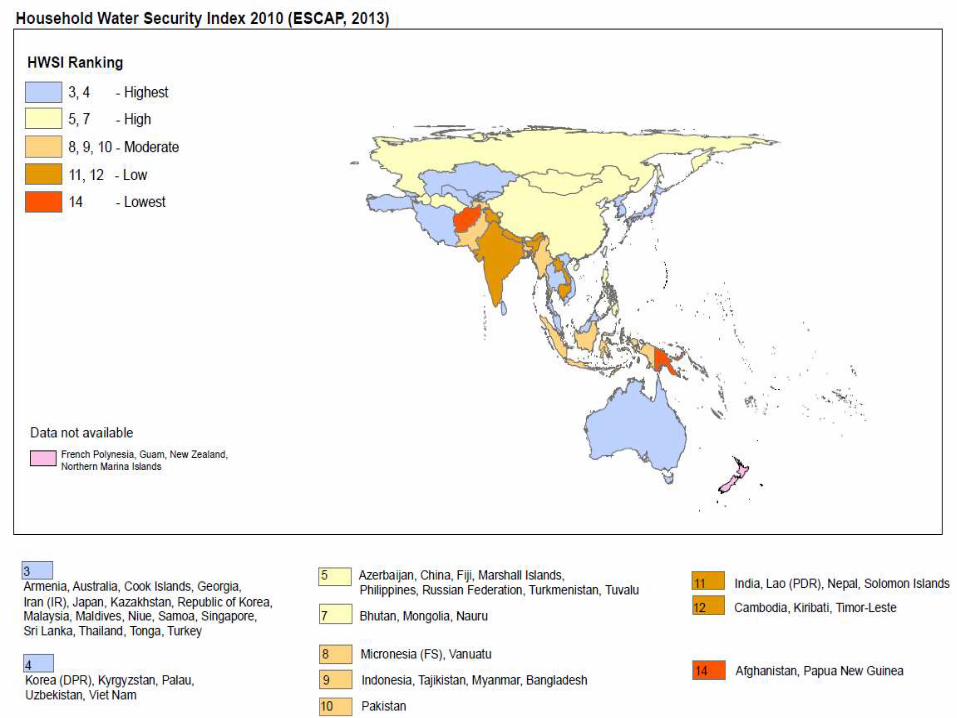
Household Water Security Index (HWSI)
• Household Water Security is one of five key dimensions within the Water Security Framework. The security of household water is necessary to assist in achieving global goals of eradicating poverty and encouraging further economic and social development.
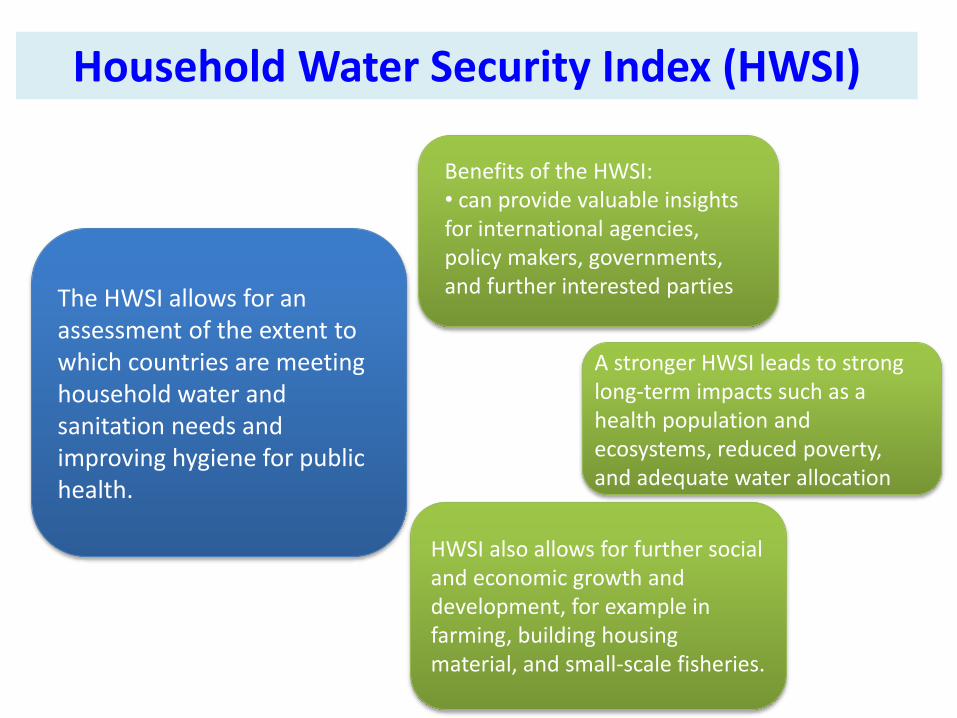
The HWSI allows for an assessment of the extent to which countries are meeting household water and sanitation needs and improving hygiene for public health.
Benefits of the HWSI:• can provide valuable insights for international agencies, policy makers, governments, and further interested parties
A stronger HWSI leads to strong long-term impacts such as a health population and ecosystems, reduced poverty, and adequate water allocation
HWSI also allows for further social and economic growth and development, for example in farming, building housing material, and small-scale fisheries.
Household Water Security Index (HWSI)
Water Acess
Percentage
Water
Rank
Sanitation Access
Percentage
Sanitation
Rank
DALYs
Diarrhoea
Quality
Rank
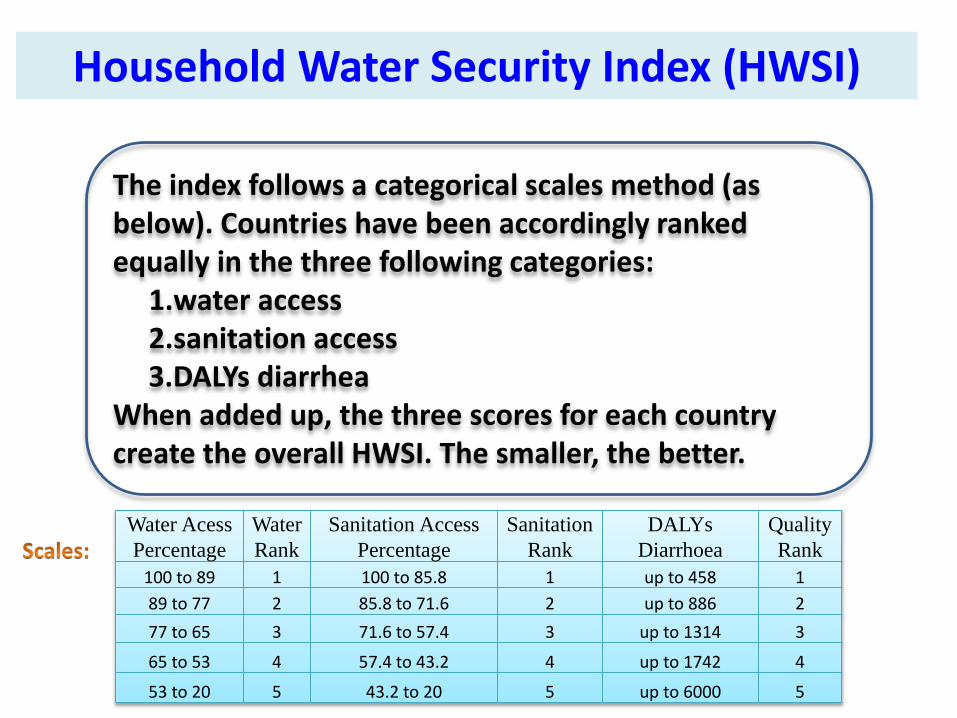
100 to 89 1 100 to 85.8 1 up to 458 1
89 to 77 2 85.8 to 71.6 2 up to 886 2
77 to 65 3 71.6 to 57.4 3 up to 1314 3
65 to 53 4 57.4 to 43.2 4 up to 1742 4
53 to 20 5 43.2 to 20 5 up to 6000 5
The index follows a categorical scales method (as below). Countries have been accordingly ranked equally in the three following categories:
1.water access2.sanitation access 3.DALYs diarrhea
When added up, the three scores for each country create the overall HWSI. The smaller, the better.
Household Water Security Index (HWSI)
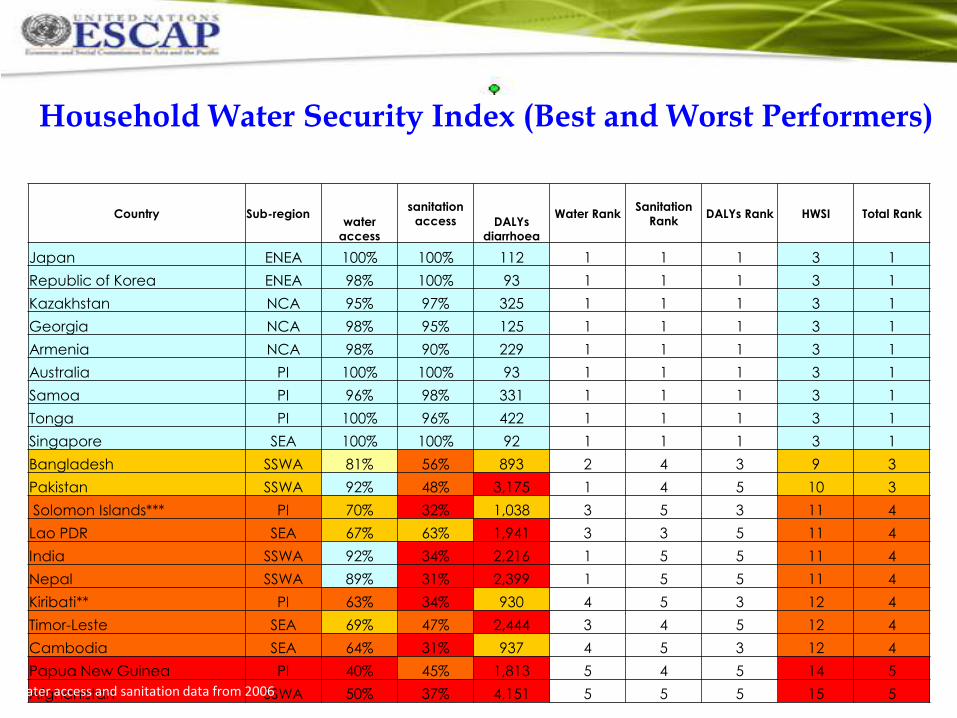
Household Water Security Index (Best and Worst Performers)
Country Sub-regionwater
access
sanitation
access DALYs
diarrhoea
Water RankSanitation
RankDALYs Rank HWSI Total Rank
Japan ENEA 100% 100% 112 1 1 1 3 1
Republic of Korea ENEA 98% 100% 93 1 1 1 3 1
Kazakhstan NCA 95% 97% 325 1 1 1 3 1
Georgia NCA 98% 95% 125 1 1 1 3 1
Armenia NCA 98% 90% 229 1 1 1 3 1
Australia PI 100% 100% 93 1 1 1 3 1
Samoa PI 96% 98% 331 1 1 1 3 1
Tonga PI 100% 96% 422 1 1 1 3 1
Singapore SEA 100% 100% 92 1 1 1 3 1
Bangladesh SSWA 81% 56% 893 2 4 3 9 3
Pakistan SSWA 92% 48% 3,175 1 4 5 10 3
Solomon Islands*** PI 70% 32% 1,038 3 5 3 11 4
Lao PDR SEA 67% 63% 1,941 3 3 5 11 4
India SSWA 92% 34% 2,216 1 5 5 11 4
Nepal SSWA 89% 31% 2,399 1 5 5 11 4
Kiribati** PI 63% 34% 930 4 5 3 12 4
Timor-Leste SEA 69% 47% 2,444 3 4 5 12 4
Cambodia SEA 64% 31% 937 4 5 3 12 4
Papua New Guinea PI 40% 45% 1,813 5 4 5 14 5
Afghanistan SSWA 50% 37% 4,151 5 5 5 15 5**water access and sanitation data from 2006
*** water access and sanitation data from 2005
The Way Forward
Achieving water security through
sustainable water management
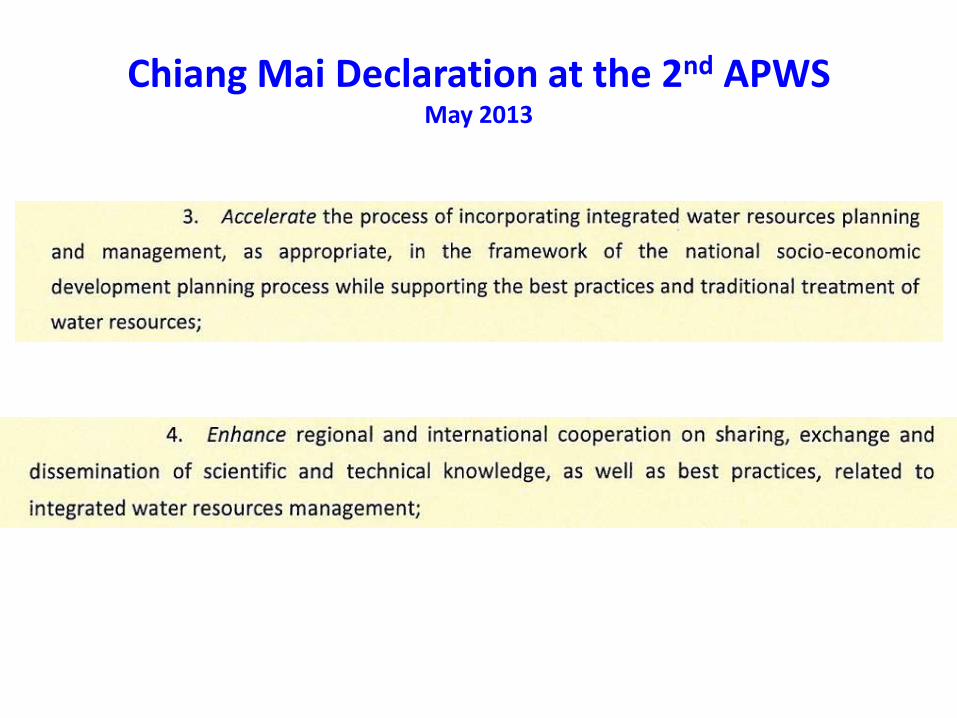
Chiang Mai Declaration at the 2nd APWSMay 2013
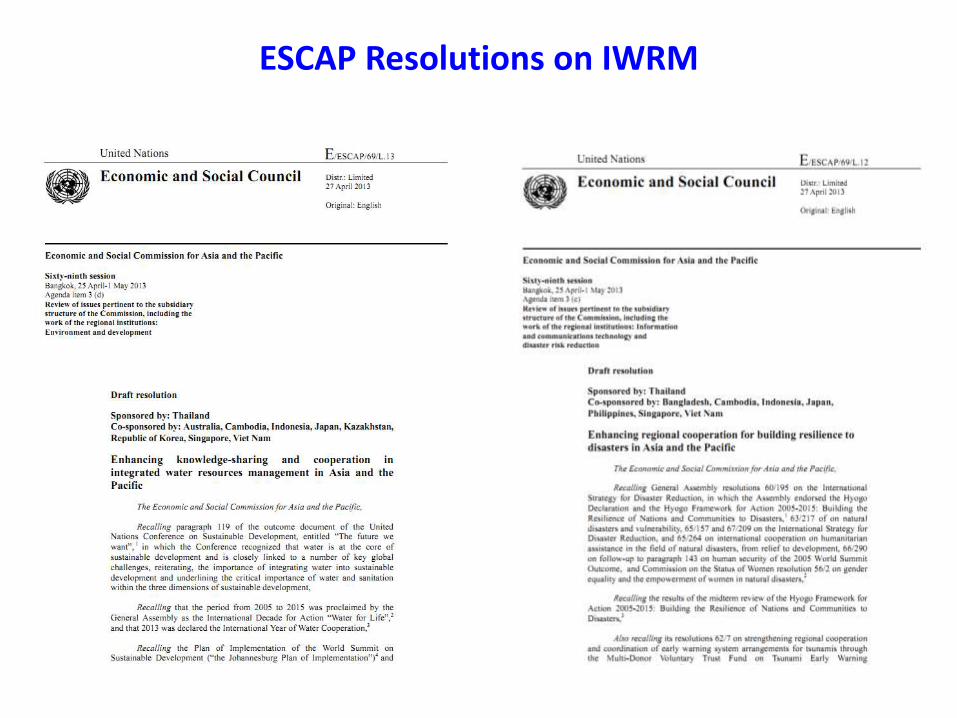
ESCAP Resolutions on IWRM
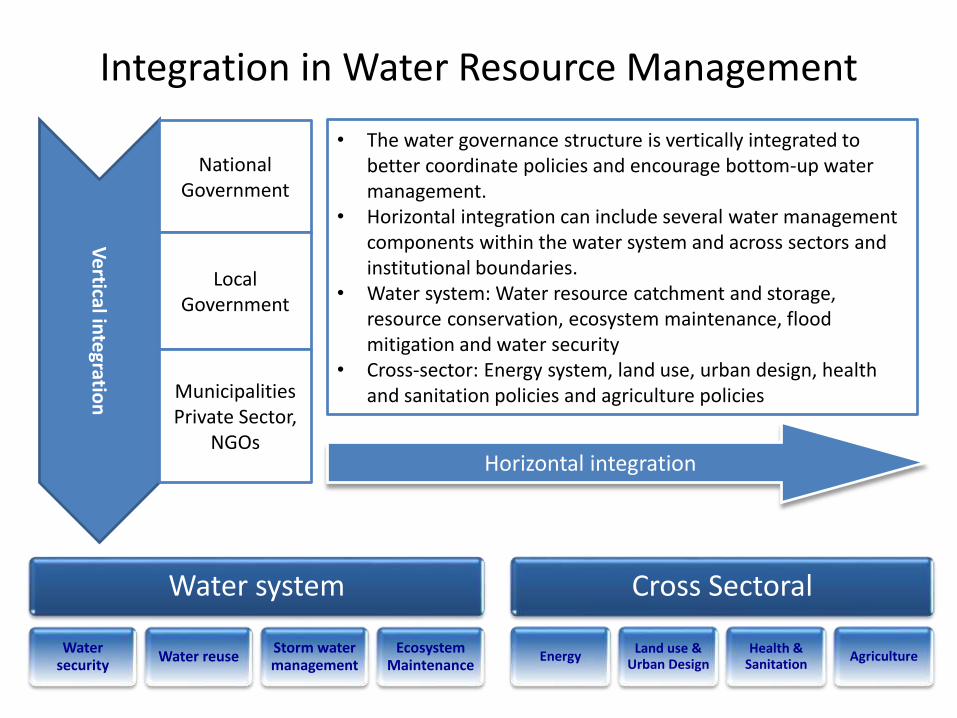
Integration in Water Resource Management
Ve
rtical inte
gration
National Government
Local Government
MunicipalitiesPrivate Sector,
NGOs
• The water governance structure is vertically integrated to better coordinate policies and encourage bottom-up water management.
• Horizontal integration can include several water management components within the water system and across sectors and institutional boundaries.
• Water system: Water resource catchment and storage, resource conservation, ecosystem maintenance, flood mitigation and water security
• Cross-sector: Energy system, land use, urban design, health and sanitation policies and agriculture policies
Horizontal integration
Water system
Watersecurity
Water reuseStorm water management
Ecosystem Maintenance
Cross Sectoral
EnergyLand use &
Urban DesignHealth &
SanitationAgriculture
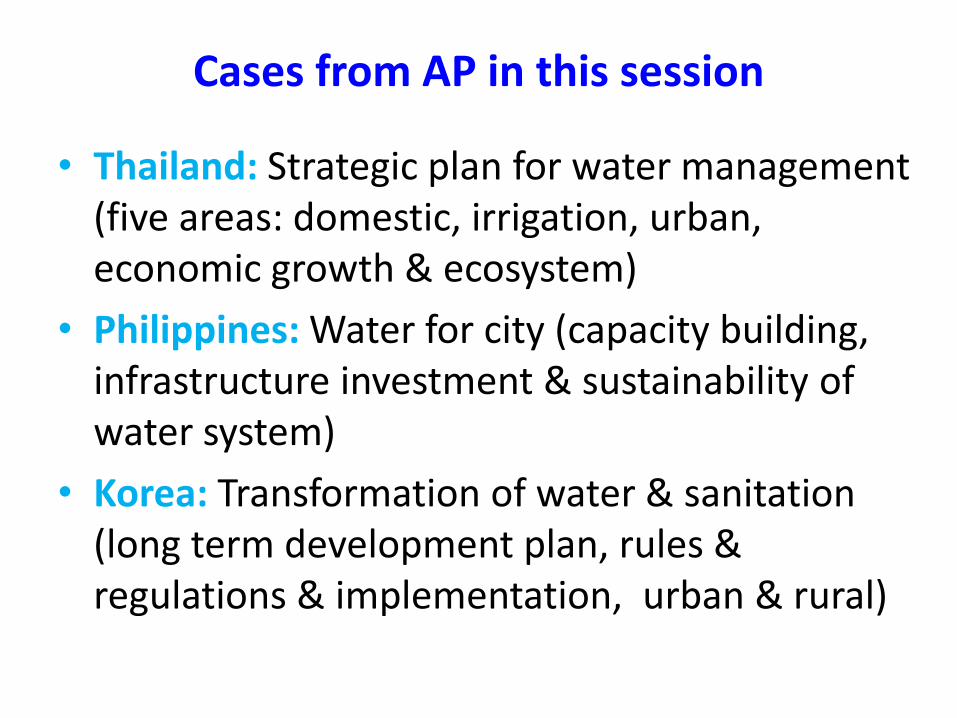
Cases from AP in this session
• Thailand: Strategic plan for water management (five areas: domestic, irrigation, urban, economic growth & ecosystem)
• Philippines: Water for city (capacity building, infrastructure investment & sustainability of water system)
• Korea: Transformation of water & sanitation (long term development plan, rules & regulations & implementation, urban & rural)
Thank you