asia-pacific dance music study · nielsen asia-pacific dance music study 2017, us music 360 2016,...
TRANSCRIPT

1Cop
yri
gh
t ©
20
17
Th
e N
iels
en
Com
pa
ny (
US
), L
LC
. C
on
fid
en
tia
l a
nd
pro
pri
eta
ry. D
o n
ot d
istr
ibu
te.
Copyright © 2017 The Nielsen Company. Confidential and proprietary.
ASIA-PACIFICDANCE MUSIC STUDYCOMMISSIONED BY A2LiVE
HIGHLIGHTS PRESENTATION
IMS ASIA PACIFIC
SEPT 21, 2017
2Cop
yri
gh
t ©
20
17
Th
e N
iels
en
Com
pa
ny (
US
), L
LC
. C
on
fid
en
tia
l a
nd
pro
pri
eta
ry. D
o n
ot d
istr
ibu
te.
NIELSEN ENTERTAINMENT Unparalleled Expertise
GLOBALOur subject matter
experts provide the insights
and support you need to
grow your business in over
30 international markets.
MUSICNielsen Entertainment is
the leader in music consumer
research. Our team has been a
trusted name in music and
entertainment
for over 30 years.
BRAND PARTNERSHIPWe advise some of
the biggest names in
sponsorship, managing global
portfolios for Fortune 500
companies across music, sports
and entertainment.
Using our broad and deep expertise to help you succeed
3Cop
yri
gh
t ©
20
17
Th
e N
iels
en
Com
pa
ny (
US
), L
LC
. C
on
fid
en
tia
l a
nd
pro
pri
eta
ry. D
o n
ot d
istr
ibu
te.
NIELSEN ENTERTAINMENTThe Science Behind What’s Next
Nielsen Music is the leading insights provider for the music industry across:
MUSIC SPORTS GAMES HOME ENT. BOOKS
• Live Event Producers
• Talent Agencies
• Publishing Rights Organizations
• Record Labels
• Artist Management
• Streaming Providers
And Brand Sponsors in the music marketing industry
4
This artwork was created using Nielsen data.
Copyright © 2017 The Nielsen Company (US), LLC. Confidential and proprietary. Do not distribute.
U.S. DANCE MUSIC
CONSUMER LANDSCAPE
5Cop
yri
gh
t ©
20
17
Th
e N
iels
en
Com
pa
ny (
US
), L
LC
. C
on
fid
en
tia
l a
nd
pro
pri
eta
ry. D
o n
ot d
istr
ibu
te.
Cop
yri
gh
t ©
20
17
Th
e N
iels
en
Com
pa
ny (
US
), L
LC
. C
on
fid
en
tia
l a
nd
pro
pri
eta
ry. D
o n
ot d
istr
ibu
te.
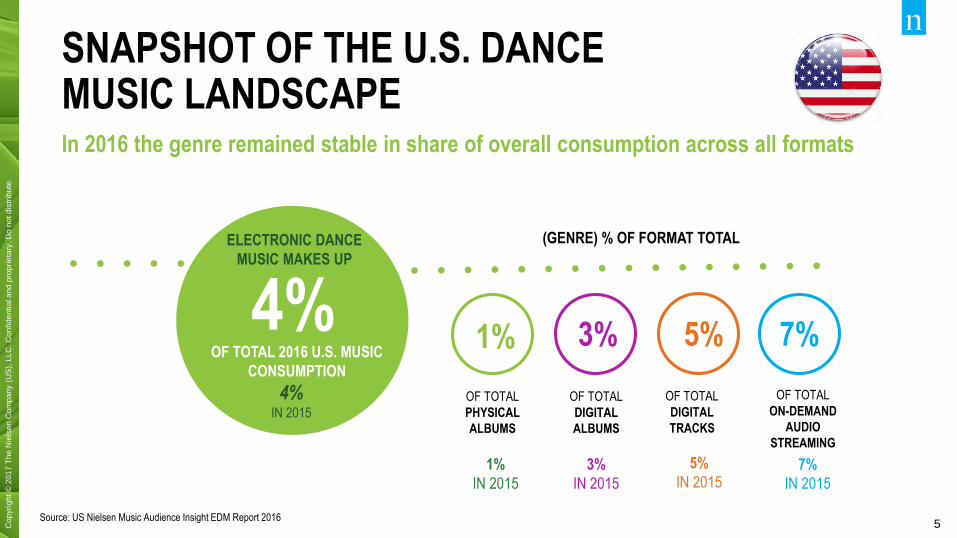
In 2016 the genre remained stable in share of overall consumption across all formats
SNAPSHOT OF THE U.S. DANCE MUSIC LANDSCAPE
(GENRE) % OF FORMAT TOTAL
1% 3% 5% 7%
OF TOTAL
PHYSICAL
ALBUMS
ELECTRONIC DANCE
MUSIC MAKES UP
OF TOTAL 2016 U.S. MUSIC
CONSUMPTION
4%OF TOTAL
DIGITAL
ALBUMS
OF TOTAL
DIGITAL
TRACKS
OF TOTAL
ON-DEMAND
AUDIO
STREAMING
4%IN 2015
1%
IN 2015
3%
IN 2015
5%
IN 20157%
IN 2015
Source: US Nielsen Music Audience Insight EDM Report 2016
6Cop
yri
gh
t ©
20
17
Th
e N
iels
en
Com
pa
ny (
US
), L
LC
. C
on
fid
en
tia
l a
nd
pro
pri
eta
ry. D
o n
ot d
istr
ibu
te.
Cop
yri
gh
t ©
20
17
Th
e N
iels
en
Com
pa
ny (
US
), L
LC
. C
on
fid
en
tia
l a
nd
pro
pri
eta
ry. D
o n
ot d
istr
ibu
te.
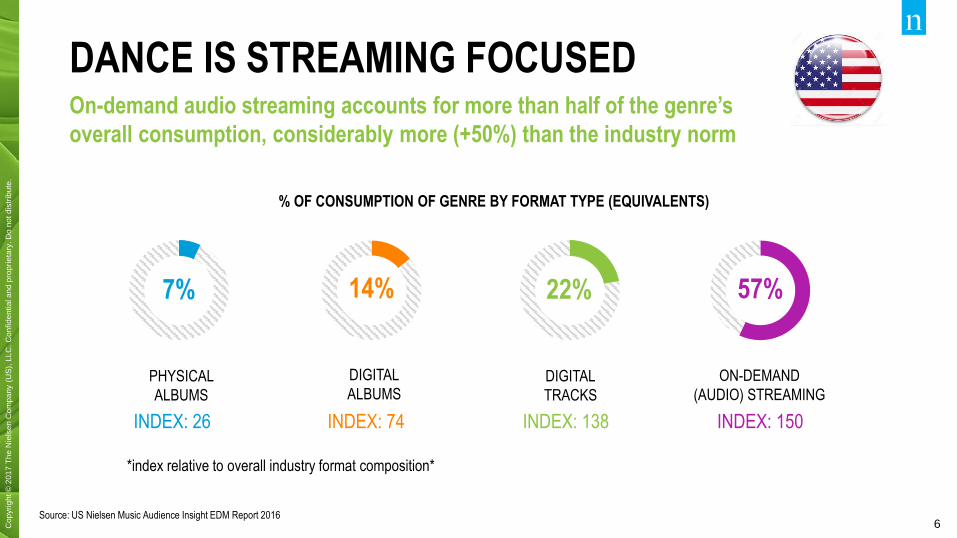
On-demand audio streaming accounts for more than half of the genre’s
overall consumption, considerably more (+50%) than the industry norm
DANCE IS STREAMING FOCUSED
Source: US Nielsen Music Audience Insight EDM Report 2016
% OF CONSUMPTION OF GENRE BY FORMAT TYPE (EQUIVALENTS)
*index relative to overall industry format composition*
14%7% 22% 57%
INDEX: 26
PHYSICAL
ALBUMS
INDEX: 74
DIGITAL
ALBUMS
INDEX: 138
DIGITAL
TRACKS
INDEX: 150
ON-DEMAND
(AUDIO) STREAMING
7Cop
yri
gh
t ©
20
17
Th
e N
iels
en
Com
pa
ny (
US
), L
LC
. C
on
fid
en
tia
l a
nd
pro
pri
eta
ry. D
o n
ot d
istr
ibu
te.
Cop
yri
gh
t ©
20
17
Th
e N
iels
en
Com
pa
ny (
US
), L
LC
. C
on
fid
en
tia
l a
nd
pro
pri
eta
ry. D
o n
ot d
istr
ibu
te.
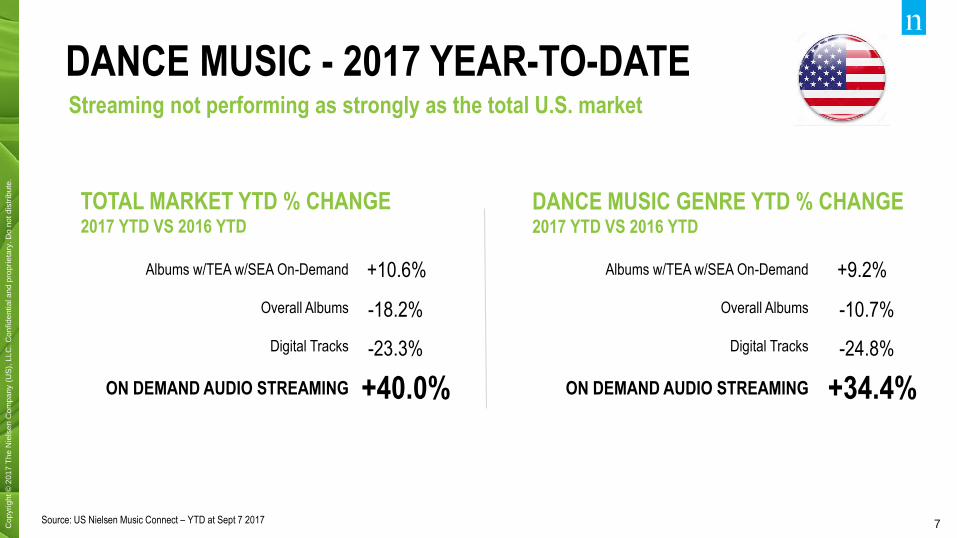
Streaming not performing as strongly as the total U.S. market
DANCE MUSIC - 2017 YEAR-TO-DATE
Source: US Nielsen Music Connect – YTD at Sept 7 2017
TOTAL MARKET YTD % CHANGE2017 YTD VS 2016 YTD
DANCE MUSIC GENRE YTD % CHANGE2017 YTD VS 2016 YTD
Albums w/TEA w/SEA On-Demand
Overall Albums
Digital Tracks
ON DEMAND AUDIO STREAMING
Albums w/TEA w/SEA On-Demand
Overall Albums
Digital Tracks
ON DEMAND AUDIO STREAMING+40.0%
+10.6%
-18.2%
-23.3%
+34.4%
+9.2%
-10.7%
-24.8%
Copyright © 2017 The Nielsen Company (US), LLC. Confidential and proprietary. Do not distribute. 8
NIELSEN APAC DANCE
MUSIC STUDY
COMMISSIONED BY A2LIVE
9Cop
yri
gh
t ©
20
17
Th
e N
iels
en
Com
pa
ny (
US
), L
LC
. C
on
fid
en
tia
l a
nd
pro
pri
eta
ry. D
o n
ot d
istr
ibu
te.
How We Did It - Methodology
Engagement with Dance Music in APAC
Who Are Dance Music Listeners?
How to Reach Dance Music Listeners
APAC DANCE MUSIC STUDY - OVERVIEW
10Cop
yri
gh
t ©
20
17
Th
e N
iels
en
Com
pa
ny (
US
), L
LC
. C
on
fid
en
tia
l a
nd
pro
pri
eta
ry. D
o n
ot d
istr
ibu
te.
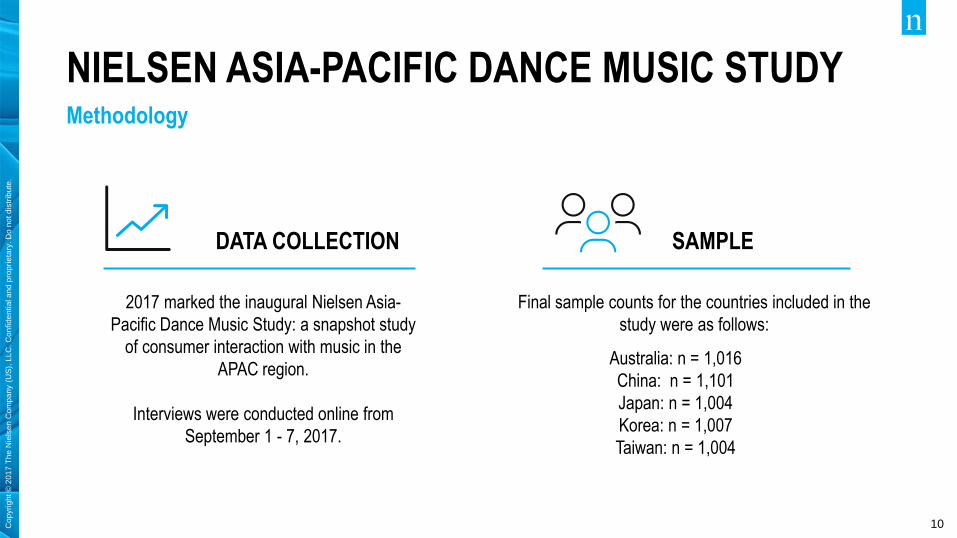
NIELSEN ASIA-PACIFIC DANCE MUSIC STUDYMethodology
DATA COLLECTION
2017 marked the inaugural Nielsen Asia-
Pacific Dance Music Study: a snapshot study
of consumer interaction with music in the
APAC region.
Interviews were conducted online from
September 1 - 7, 2017.
Final sample counts for the countries included in the
study were as follows:
SAMPLE
Australia: n = 1,016
China: n = 1,101
Japan: n = 1,004
Korea: n = 1,007
Taiwan: n = 1,004
11Cop
yri
gh
t ©
20
17
Th
e N
iels
en
Com
pa
ny (
US
), L
LC
. C
on
fid
en
tia
l a
nd
pro
pri
eta
ry. D
o n
ot d
istr
ibu
te.
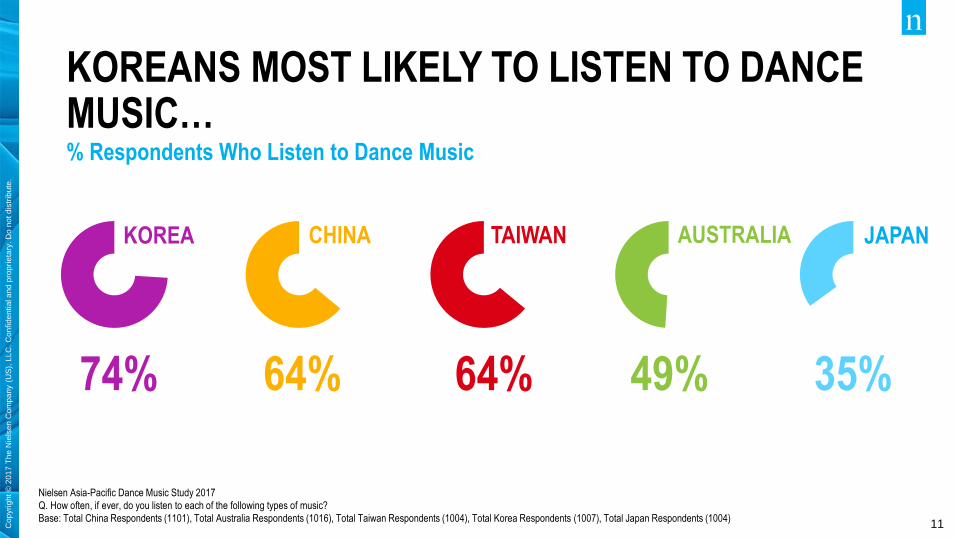
KOREANS MOST LIKELY TO LISTEN TO DANCE MUSIC…% Respondents Who Listen to Dance Music
Nielsen Asia-Pacific Dance Music Study 2017
Q. How often, if ever, do you listen to each of the following types of music?
Base: Total China Respondents (1101), Total Australia Respondents (1016), Total Taiwan Respondents (1004), Total Korea Respondents (1007), Total Japan Respondents (1004)
64% 64% 35%74% 49%
KOREA CHINA TAIWAN AUSTRALIA JAPAN
12Cop
yri
gh
t ©
20
17
Th
e N
iels
en
Com
pa
ny (
US
), L
LC
. C
on
fid
en
tia
l a
nd
pro
pri
eta
ry. D
o n
ot d
istr
ibu
te.
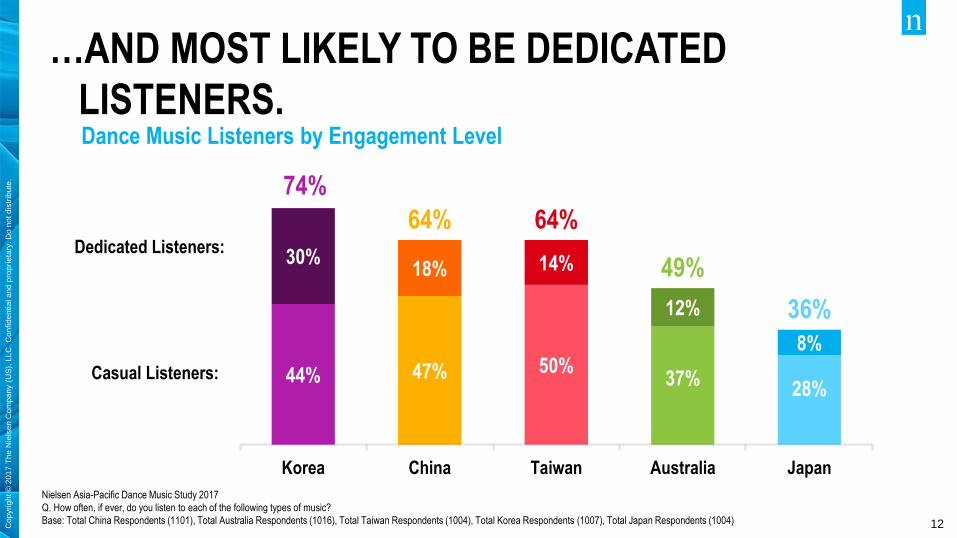
Dance Music Listeners by Engagement Level
44% 47% 50%37%
28%
30%18% 14%
12%
8%
74%
64% 64%
49%
36%
Korea China Taiwan Australia Japan
Dedicated Listeners:
Casual Listeners:
Nielsen Asia-Pacific Dance Music Study 2017
Q. How often, if ever, do you listen to each of the following types of music?
Base: Total China Respondents (1101), Total Australia Respondents (1016), Total Taiwan Respondents (1004), Total Korea Respondents (1007), Total Japan Respondents (1004)
…AND MOST LIKELY TO BE DEDICATED
LISTENERS.
13Cop
yri
gh
t ©
20
17
Th
e N
iels
en
Com
pa
ny (
US
), L
LC
. C
on
fid
en
tia
l a
nd
pro
pri
eta
ry. D
o n
ot d
istr
ibu
te.
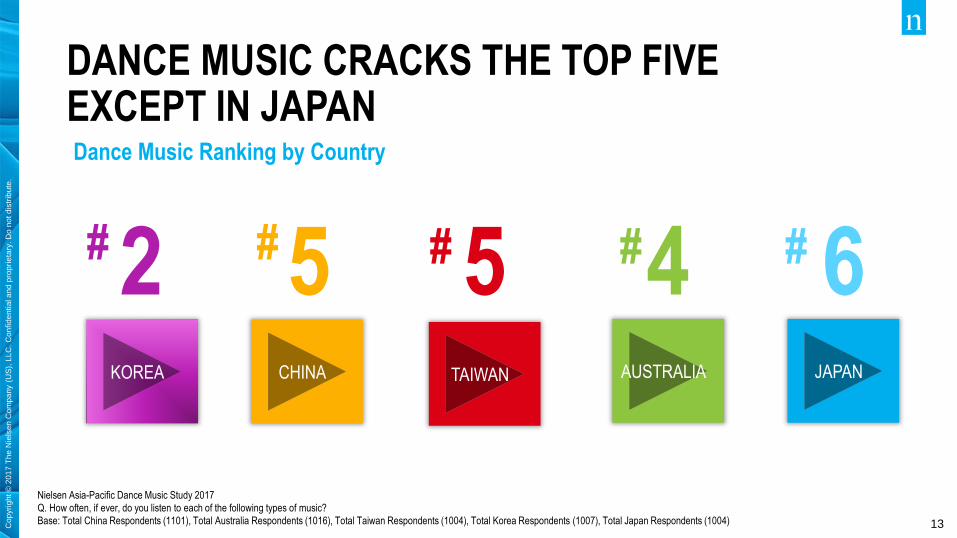
DANCE MUSIC CRACKS THE TOP FIVE EXCEPT IN JAPAN Dance Music Ranking by Country
Nielsen Asia-Pacific Dance Music Study 2017
Q. How often, if ever, do you listen to each of the following types of music?
Base: Total China Respondents (1101), Total Australia Respondents (1016), Total Taiwan Respondents (1004), Total Korea Respondents (1007), Total Japan Respondents (1004)
2# 5 5 4 6# # # #
KOREA CHINA TAIWAN AUSTRALIA JAPAN
14Cop
yri
gh
t ©
20
17
Th
e N
iels
en
Com
pa
ny (
US
), L
LC
. C
on
fid
en
tia
l a
nd
pro
pri
eta
ry. D
o n
ot d
istr
ibu
te.
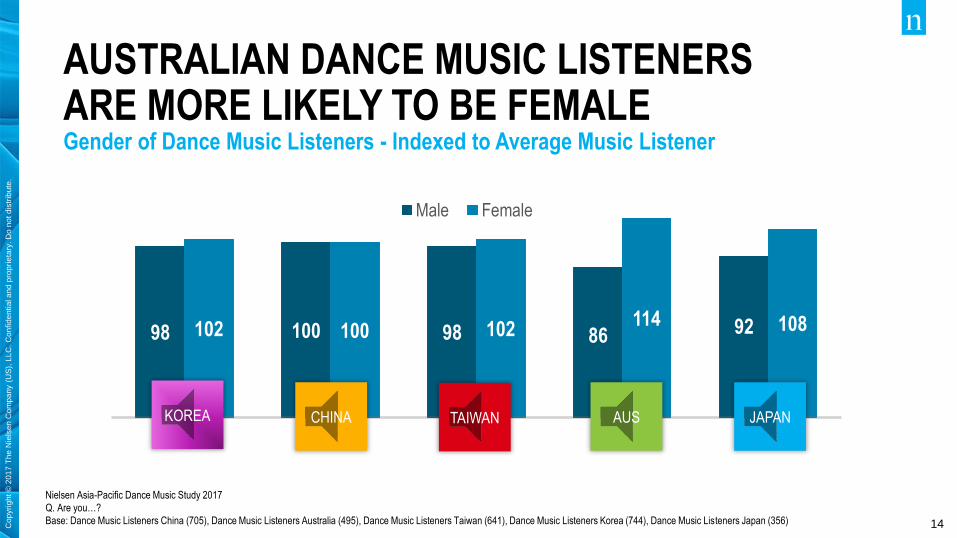
Gender of Dance Music Listeners - Indexed to Average Music Listener
98 100 98 86 92102 100 102114 108
Korea China Taiwan Australia Japan
Male Female
Nielsen Asia-Pacific Dance Music Study 2017
Q. Are you…?
Base: Dance Music Listeners China (705), Dance Music Listeners Australia (495), Dance Music Listeners Taiwan (641), Dance Music Listeners Korea (744), Dance Music Listeners Japan (356)
AUSTRALIAN DANCE MUSIC LISTENERS ARE MORE LIKELY TO BE FEMALE
KOREA CHINA TAIWAN AUS JAPAN
15Cop
yri
gh
t ©
20
17
Th
e N
iels
en
Com
pa
ny (
US
), L
LC
. C
on
fid
en
tia
l a
nd
pro
pri
eta
ry. D
o n
ot d
istr
ibu
te.
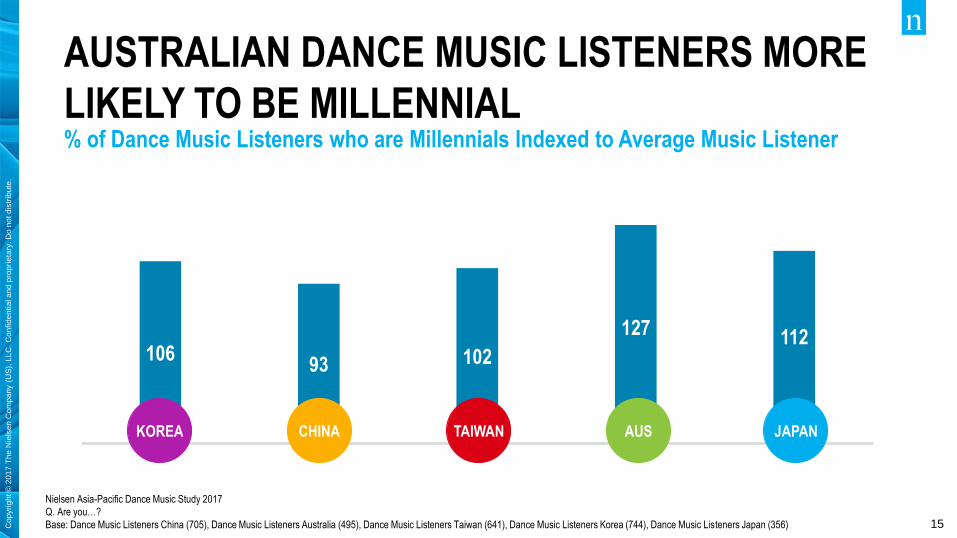
% of Dance Music Listeners who are Millennials Indexed to Average Music Listener
10693 102
127 112
Korea China Taiwan Australia Japan
AUSTRALIAN DANCE MUSIC LISTENERS MORE
LIKELY TO BE MILLENNIAL
Nielsen Asia-Pacific Dance Music Study 2017
Q. Are you…?
Base: Dance Music Listeners China (705), Dance Music Listeners Australia (495), Dance Music Listeners Taiwan (641), Dance Music Listeners Korea (744), Dance Music Listeners Japan (356)
KOREA CHINA TAIWAN AUS JAPAN
16
This artwork was created using Nielsen data.
Copyright © 2017 The Nielsen Company (US), LLC. Confidential and proprietary. Do not distribute.
HOW MUCH MONEY IS
SPENT ON LIVE MUSIC?
17Cop
yri
gh
t ©
20
17
Th
e N
iels
en
Com
pa
ny (
US
), L
LC
. C
on
fid
en
tia
l a
nd
pro
pri
eta
ry. D
o n
ot d
istr
ibu
te.
Cop
yri
gh
t ©
20
17
Th
e N
iels
en
Com
pa
ny (
US
), L
LC
. C
on
fid
en
tia
l a
nd
pro
pri
eta
ry. D
o n
ot d
istr
ibu
te.
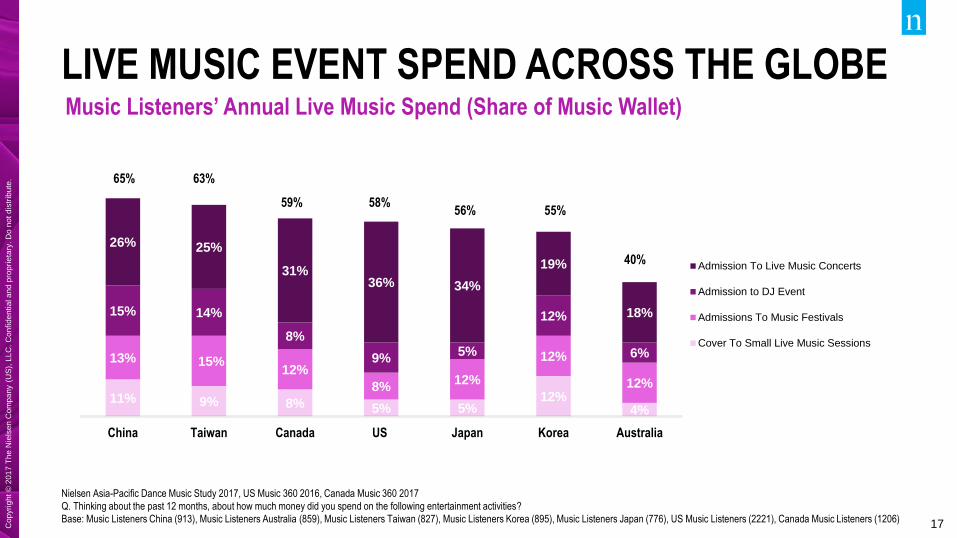
11% 9% 8% 5% 5%12%
4%
13% 15%12%
8%12%
12%
12%
15% 14%
8%
9%5%
12%
6%
26% 25%
31%36% 34%
19%
18%
China Taiwan Canada US Japan Korea Australia
Admission To Live Music Concerts
Admission to DJ Event
Admissions To Music Festivals
Cover To Small Live Music Sessions
65% 63%
59% 58%56% 55%
40%
LIVE MUSIC EVENT SPEND ACROSS THE GLOBEMusic Listeners’ Annual Live Music Spend (Share of Music Wallet)
Nielsen Asia-Pacific Dance Music Study 2017, US Music 360 2016, Canada Music 360 2017
Q. Thinking about the past 12 months, about how much money did you spend on the following entertainment activities?
Base: Music Listeners China (913), Music Listeners Australia (859), Music Listeners Taiwan (827), Music Listeners Korea (895), Music Listeners Japan (776), US Music Listeners (2221), Canada Music Listeners (1206)
18Cop
yri
gh
t ©
20
17
Th
e N
iels
en
Com
pa
ny (
US
), L
LC
. C
on
fid
en
tia
l a
nd
pro
pri
eta
ry. D
o n
ot d
istr
ibu
te.
Cop
yri
gh
t ©
20
17
Th
e N
iels
en
Com
pa
ny (
US
), L
LC
. C
on
fid
en
tia
l a
nd
pro
pri
eta
ry. D
o n
ot d
istr
ibu
te.
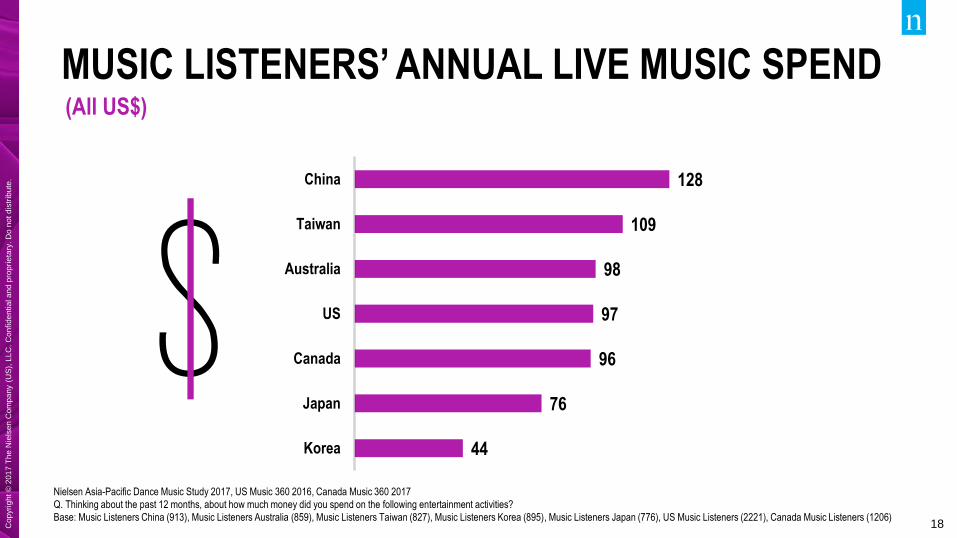
MUSIC LISTENERS’ ANNUAL LIVE MUSIC SPEND(All US$)
44
76
96
97
98
109
128
Korea
Japan
Canada
US
Australia
Taiwan
China
Nielsen Asia-Pacific Dance Music Study 2017, US Music 360 2016, Canada Music 360 2017
Q. Thinking about the past 12 months, about how much money did you spend on the following entertainment activities?
Base: Music Listeners China (913), Music Listeners Australia (859), Music Listeners Taiwan (827), Music Listeners Korea (895), Music Listeners Japan (776), US Music Listeners (2221), Canada Music Listeners (1206)
19
This artwork was created using Nielsen data.
Copyright © 2017 The Nielsen Company (US), LLC. Confidential and proprietary. Do not distribute.
HOW DO PEOPLE
DISCOVER NEW MUSIC?
20Cop
yri
gh
t ©
20
17
Th
e N
iels
en
Com
pa
ny (
US
), L
LC
. C
on
fid
en
tia
l a
nd
pro
pri
eta
ry. D
o n
ot d
istr
ibu
te.
Cop
yri
gh
t ©
20
17
Th
e N
iels
en
Com
pa
ny (
US
), L
LC
. C
on
fid
en
tia
l a
nd
pro
pri
eta
ry. D
o n
ot d
istr
ibu
te.
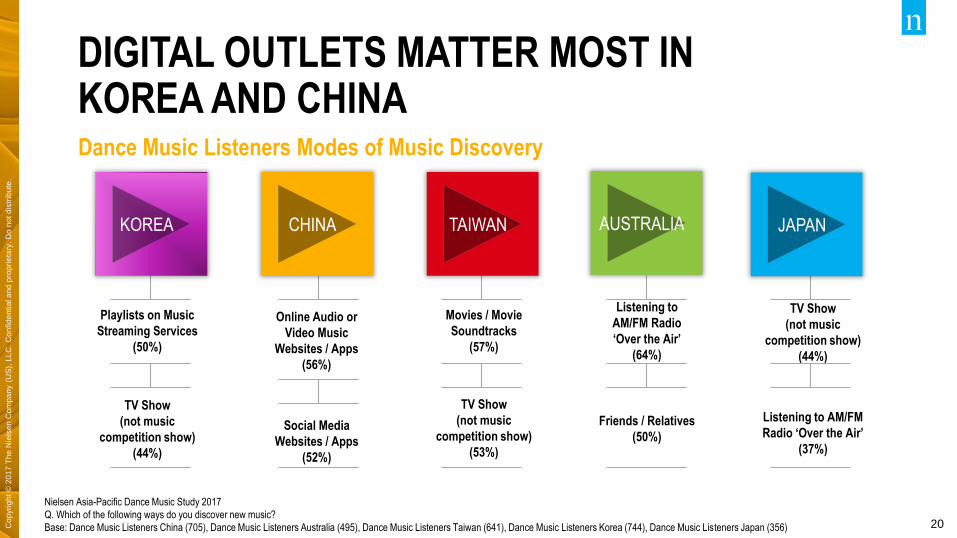
DIGITAL OUTLETS MATTER MOST IN KOREA AND CHINA
Nielsen Asia-Pacific Dance Music Study 2017
Q. Which of the following ways do you discover new music?
Base: Dance Music Listeners China (705), Dance Music Listeners Australia (495), Dance Music Listeners Taiwan (641), Dance Music Listeners Korea (744), Dance Music Listeners Japan (356)
Playlists on Music
Streaming Services
(50%)
Online Audio or
Video Music
Websites / Apps
(56%)
Social Media
Websites / Apps
(52%)
Listening to
AM/FM Radio
‘Over the Air’
(64%)
TV Show
(not music
competition show)
(44%)
Listening to AM/FM
Radio ‘Over the Air’
(37%)
TV Show
(not music
competition show)
(44%)
Movies / Movie
Soundtracks
(57%)
TV Show
(not music
competition show)
(53%)
Friends / Relatives
(50%)
Dance Music Listeners Modes of Music Discovery
KOREA CHINA TAIWAN AUSTRALIA JAPAN
21Cop
yri
gh
t ©
20
17
Th
e N
iels
en
Com
pa
ny (
US
), L
LC
. C
on
fid
en
tia
l a
nd
pro
pri
eta
ry. D
o n
ot d
istr
ibu
te.
Cop
yri
gh
t ©
20
17
Th
e N
iels
en
Com
pa
ny (
US
), L
LC
. C
on
fid
en
tia
l a
nd
pro
pri
eta
ry. D
o n
ot d
istr
ibu
te.
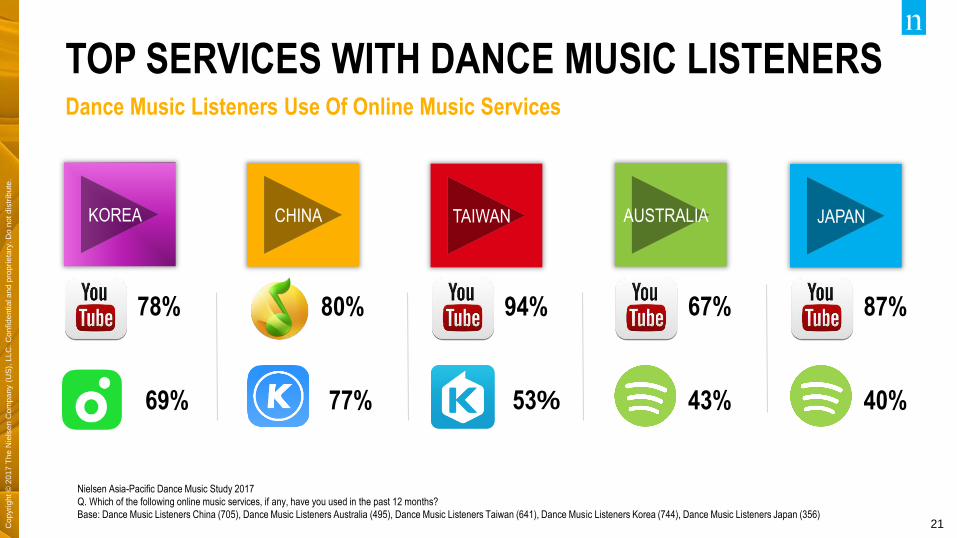
TOP SERVICES WITH DANCE MUSIC LISTENERSDance Music Listeners Use Of Online Music Services
Nielsen Asia-Pacific Dance Music Study 2017
Q. Which of the following online music services, if any, have you used in the past 12 months?
Base: Dance Music Listeners China (705), Dance Music Listeners Australia (495), Dance Music Listeners Taiwan (641), Dance Music Listeners Korea (744), Dance Music Listeners Japan (356)
78%
69%
80%
77%
94%
53%
67%
43%
87%
40%
KOREA CHINA TAIWAN AUSTRALIA JAPAN

22
This artwork was created using Nielsen data.
Copyright © 2017 The Nielsen Company (US), LLC. Confidential and proprietary. Do not distribute.
CONSUMER PROFILES
23Cop
yri
gh
t ©
20
17
Th
e N
iels
en
Com
pa
ny (
US
), L
LC
. C
on
fid
en
tia
l a
nd
pro
pri
eta
ry. D
o n
ot d
istr
ibu
te.
Cop
yri
gh
t ©
20
17
Th
e N
iels
en
Com
pa
ny (
US
), L
LC
. C
on
fid
en
tia
l a
nd
pro
pri
eta
ry. D
o n
ot d
istr
ibu
te.
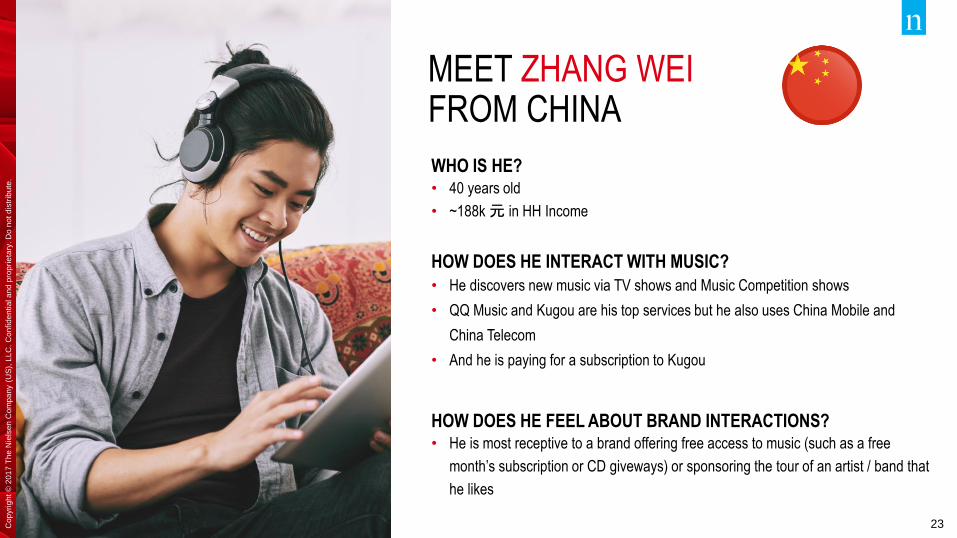
MEET ZHANG WEI FROM CHINA
WHO IS HE?• 40 years old
• ~188k 元 in HH Income
HOW DOES HE INTERACT WITH MUSIC?
• He discovers new music via TV shows and Music Competition shows
• QQ Music and Kugou are his top services but he also uses China Mobile and
China Telecom
• And he is paying for a subscription to Kugou
HOW DOES HE FEEL ABOUT BRAND INTERACTIONS?• He is most receptive to a brand offering free access to music (such as a free
month’s subscription or CD giveways) or sponsoring the tour of an artist / band that
he likes
24Cop
yri
gh
t ©
20
17
Th
e N
iels
en
Com
pa
ny (
US
), L
LC
. C
on
fid
en
tia
l a
nd
pro
pri
eta
ry. D
o n
ot d
istr
ibu
te.
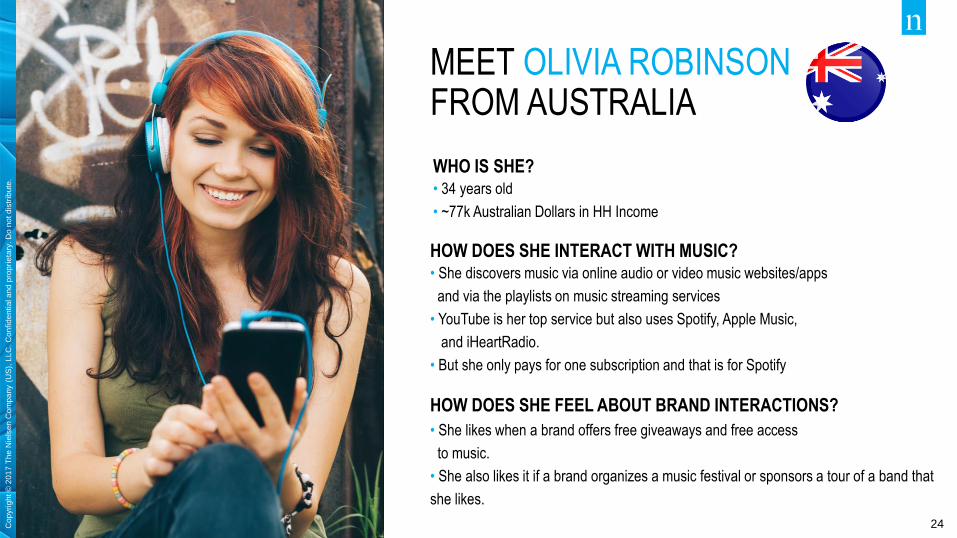
MEET OLIVIA ROBINSON FROM AUSTRALIA
WHO IS SHE?• 34 years old
• ~77k Australian Dollars in HH Income
HOW DOES SHE INTERACT WITH MUSIC?• She discovers music via online audio or video music websites/apps
and via the playlists on music streaming services
• YouTube is her top service but also uses Spotify, Apple Music,
and iHeartRadio.
• But she only pays for one subscription and that is for Spotify
HOW DOES SHE FEEL ABOUT BRAND INTERACTIONS?
• She likes when a brand offers free giveaways and free access
to music.
• She also likes it if a brand organizes a music festival or sponsors a tour of a band that
she likes.
25Cop
yri
gh
t ©
20
17
Th
e N
iels
en
Com
pa
ny (
US
), L
LC
. C
on
fid
en
tia
l a
nd
pro
pri
eta
ry. D
o n
ot d
istr
ibu
te.
Cop
yri
gh
t ©
20
17
Th
e N
iels
en
Com
pa
ny (
US
), L
LC
. C
on
fid
en
tia
l a
nd
pro
pri
eta
ry. D
o n
ot d
istr
ibu
te.
Get access to the first ever
NIELSEN ASIA-PACIFIC DANCE MUSIC REPORTcommissioned by A2LiVE
Covering the hottest topics, music trends and target consumers in the dance music market
O N S A L E W O R L D W I D E N O V E M B E R 1Please contact [email protected] for purchasing details

Copyright © 2017 The Nielsen Company (US), LLC. Confidential and proprietary. Do not distribute. 26
HELENA KOSINSKI
VP, Client Solutions, Nielsen Music Global
@Helena_NM