asia competition barometer: petrochemicals and chemicals
TRANSCRIPT
Asia Competition BarometerPetrochemicals and chemicalsAn Economist Intelligence Unit report
Supported by

© The Economist Intelligence Unit Limited 2012 1
Asia Competition Barometer:Petrochemicals and chemicals
Contents
Preface 2
Executive summary 3
Asia’s growing importance for corporate performance and global competitiveness 5
Competition and profitability at Asian firms 8 Competition: Declining since 2008 8
Profitability:Slightoveralldecline 10
Commodity prices 12
Case study: Tata Chemicals 12
Positioning for success in Asia 13 Asiaremainsvitalbothasamarketandasaproductionsource 13
Evolvingsupplychainsandpartnerships 14
Case study: BASF 15
Outlook 16
Barometer methodology 17
© The Economist Intelligence Unit Limited 20122
Asia Competition Barometer:Petrochemicals and chemicals
SupportedbySingapore’sEconomicDevelopmentBoard(EDB),theEconomistIntelligenceUnithasdevelopedtheAsiaCompetitionBarometerwiththeaimofunderstandingthechangingmarketdynamicsinkeysectorsandassessingtheintensityofcompetitioninthem.Drawinguponcompany-leveldataonprofitabilityandotherindicators,theBarometerquantifiesthechangingdynamicsofcompetitivenessinAsiaforselectindustriesbetween2004and2009.
ThisreportfocusesontheBarometerfindingsforthepetrochemicalsandchemicalsmanufacturing(PeC)sector.Assessingauniverseofover550PeCcompaniesthatarepubliclylistedineightcountries—China,India,Indonesia,Malaysia,thePhilippines,Singapore,ThailandandVietnam—theBarometerexamineschangingprofitabilityandthecompetitionlandscapeforthesector.
Otherreportsinthisserieslookattheinformationtechnologyservices,pharmaceuticals,precisionengineering,andtransportandlogisticssectorsinAsia.
February2012
Preface
© The Economist Intelligence Unit Limited 2012 3
Asia Competition Barometer:Petrochemicals and chemicals
Executive summary
WhatdoestheemergenceofAsiaasamajorengineofglobaleconomicgrowthmeanforcompaniesoperatingintheregion?Asia’srobusteconomicoutlook—coupledwithdiminishedgrowthprospects
inmanyotherpartsoftheworld—hasattractednewinvestmentintothemarketbothfromregionalplayersandWesternmultinationals(MNCs).Asaresult,competitionintheregionisexpectedtointensify.Giventhedarkeningglobaleconomicoutlook,andtheexpectedimpactonsomeeconomiesandsectorsintheregion,growthandprofitabilitylookuncertaininthenearterm.Butoverthemediumtolongerterm,Asia’sstrongeconomicfundamentalswillensureconsistentgrowthacrossarangeofindustries.HowarecompaniespositioningthemselvestocapitaliseonAsia’sgrowthopportunitiesoverthenextfewyears?
TheAsiaCompetitionBarometerassessestheintensityofcompetitionandchangingmarketdynamicsinseveralkeysectors.Thisreportexaminesthepetrochemicalsandchemicalsmanufacturing(PeC)sector,whichincludes:basicchemicals,fertilisersandnitrogencompounds,plasticsandsyntheticrubberinprimaryforms,pesticidesandotheragrochemicalproducts,paints,varnishesandsimilarcoatings,printinginkandmastics,soapanddetergents,cleaningandpolishingpreparations,perfumesandtoiletpreparations,explosives,otherchemicalproductsandman-madefibres.
Amongthekeyfindingsofthisreportarethefollowing:
• Asia’s PeC sector has been expanding rapidly, in line with the region’s stellar economic growth.Severalbroadmacroeconomictrends,includingAsia’semergenceasaglobalmanufacturingpowerhouse,haveboosteddemandforPeCproductsandservicesintheregion,andwillcontinuetodoso.Inparticular,demandfromtheconsumergoods,agriculture,automotiveandconstructionsectorswilldrivetheregion’sPeCsector.Meanwhile,theincreasingglobalandregionalemphasisonsustainabledevelopmentandalternativeenergysourceswillcreatenewpotentialmarketsforPeCfirms.Theindustryisexpectedtogrowatacompoundannualgrowthrateof10.5%between2010and2015,bywhenitwillbeworthsomeUS$2.6trn,accordingtoDatamonitor,aresearchfirm.
© The Economist Intelligence Unit Limited 20124
Asia Competition Barometer:Petrochemicals and chemicals
• The number of players in Asia’s PeC sector has risen since 2004, though recent consolidation suggests that this growth may be moderating.Thenumberandsizeofpublicly-listedfirmsinthePeCsectorinAsiahasincreaseddramatically,from376firmsin2004to549in2009.TotalcombinedrevenuesmorethandoubledfromUS$113.2bntoUS$256.3bnduringtheperiod.However,withongoingconsolidationthegrowthinthenumberoffirmsmaybemoderating—from2008to2009,thenumberofpublicly-listedPeCcompaniesinAsiaactuallydeclinedfrom559to549.Meanwhile,inrecognitionofAsia’sincreasingimportancetotheglobalPeCsector,foreignMNCshavebeenbuildinguptheirpresenceintheregion.ThelatterareincreasinglyviewingAsianotonlyasakeymarketbutalsoavitalsourceofproduction.
• Competition has decreased marginally, and large players are growing stronger. Competition in the PeCindustrygrewslightlybetweentheyears2004and2007,largelyduetoaninfluxofnewplayersintothesector.However,between2007and2009thelargestfirmsintheindustrybegantosteadilyincreasetheirmarketshare,partlybyexploitingeconomiesofscale.Withongoingconsolidationintheindustryitseemslikelythatthebiggerfirms,withresourcestoinvestinresearchanddevelopment,andseekoutlower-costsourcesoffeedstockandenergy,willcontinuetogrowindominance.
• Despite a slight overall decline, profitability in the sector has remained relatively resilient.ProfitmarginsforthePeCindustryin2009havefallenslightlyrelativeto2004,andhavegenerallyfluctuatedbroadlyintandemwithglobaleconomicgrowth.Theaveragegrossmarginofpublicly-listedAsianfirmsdeclinedfrom21.5%in2007to18.4%in2008.Thiswaslargelyduetoaslowdownindemandamidtheglobaleconomicdownturn,andaspikeinthecostofrawmaterials,suchasoil,thatyear.Theaveragegrossmarginthenbouncedbacktoreach21.4%by2009.Thiswaspartlybecauseofindustryconsolidation—whenrevenuegrowthslowedasaresultofthecrisis,thesmallerplayerscouldnotkeeppacewithlargeMNCsandstate-ownedcompanies,whowereabletofurtherexploiteconomiesofscaleandgrowtheirmarketshare.Inthecomingyears,profitabilitywillbelargelydependentoninnovation,theabilitytotapintomarketsthatarerelativelyunderpenetrated,andaccesstoresources.
• Access to resources has displaced low labour costs as the key driver of competitive advantage, disrupting traditional industry supply chains.Inasectorwithlittleproductdifferentiation,oneofthebiggestprofitabilitydriversispreferentialaccesstolow-costenergyandrawmaterialssuchasoil,naturalgas,water,metalsandminerals.IndustrysupplychainsarehencebeingreworkedtotapresourcesinplacessuchastheMiddleEast.Asaresult,thesectorisalsoseeinganincreasingnumberofpartnershipsbetweenMNCswithglobalnetworksandtechnologicalknow-how,andlocalplayers,includingstate-ownedfirms,withaccesstoresources.Followingsteeprisesin2010-11,theEIUexpectsthepricesofoilandnon-oilcommoditiestomoderatesomewhatin2012-16.Nevertheless,PeCfirmswillcontinuetocompetefiercelyforaccesstotheseresources,particularlygiventhesupplyconstraintsinmanycommoditymarkets.

© The Economist Intelligence Unit Limited 2012 5
Asia Competition Barometer:Petrochemicals and chemicals
Asia’s growing importance for corporate performance and global competitiveness
Overthepastdecade,Asiahasrapidlygrowninimportancetotheglobaleconomy.ItsshareofglobalGDP,measuredinpurchasing-powerparityterms,increasedfrom26.8%in2001to33.8%in2010.1
By2016,theEconomistIntelligenceUnit(EIU)expectsthisproportiontoriseto38.9%.ThereareseveralbroadtrendsthathavebeendrivingAsia’spetrochemicalsandchemicals
manufacturing(PeC)sector.2ThefirstisAsia’semergenceasaglobalmanufacturingpowerhouse.Overthepastdecade,Asia’sshareofglobalmanufacturingoutputhasincreaseddramatically,ledbyChina(seeFigure1).ThishasboosteddemandforPeCproductsthatareusedasrawmaterialsforthemanufactureofavarietyofgoods.
Thesecondtrend,whichishelpingtounderpinthefirst,relatestorisingprivateconsumptioninAsia,whichisboostingregionaldemandinanumberofsectors,fromautomobilesandconsumergoodstoconstruction,pharmaceuticalsandfood.DuetoAsia’srapideconomicgrowthoverthelastfewyears,theregionisnowhometoahugeandgrowingmiddleclass.TheAsianDevelopmentBank(ADB)estimates
1AsiahereincludesBangladesh,China,HongKong,Indonesia,India,Japan,SouthKorea,Malaysia,Myanmar,Philippines,Pakistan,Singapore,SriLanka,Thailand,Taiwan,andVietnam
2ThePeCsectorincludesthefollowingsub-segments:basicchemicals,fertilisersandnitrogencompounds,plasticsandsyntheticrubberinprimaryforms,pesticidesandotheragrochemicalproducts,paints,varnishesandsimilarcoatings,printinginkandmastics,soapanddetergents,cleaning and polishing preparations,perfumesandtoiletpreparations,explosives,otherchemicalproductsandman-madefibres.
Figure 1: Share of world manufacturing output(%, constant 2000 US$)
0
3
6
9
12
15
IndiaTaiwanSouth KoreaASEANChina
2000 2009
Note: ASEAN here comprises Indonesia, Malaysia, The Philippines, Singapore, Thailand and Vietnam
Source: UNIDO
© The Economist Intelligence Unit Limited 20126
Asia Competition Barometer:Petrochemicals and chemicals
thatbetween1990and2008developingAsia’smiddleclasspopulationmorethantripledfrom565mto1.9bn.Asashareofthetotalpopulation,itgrewfrom21%to56%overthatperiod.3
Thesenewconsumershavebeenspendingonproductssuchascarsandhouses,whichrelydirectlyonthePeCsectorforinputs.Asiahassomeofthefastestgrowingautomobilemarketsaswellassomeofthelargestautomobilemanufacturersintheworld.In2009,ChinaovertooktheUnitedStatesastheworld’sbiggestcarmarket.Between2011and2015,theEIUexpectsAsiatosee157.5mmorepassengervehiclesand54.7mmorecommercialvehiclesonitsroads.RisingvehiclesaleshaveadirectandnoticeableimpactonPeCsectorperformance,withalagofaboutsixmonths,accordingtoRamakrishnanMukundan,themanagingdirectorofTataChemicals,anIndianchemicalsmanufacturer.
Onaverage,theproductionofonecarrequiresabout155kgofpolymersandotherchemicals,valuedataboutUS$2,300.4Examplesofchemicalproductsusedinautomobilemanufacturingincludepolypropylene,polyethylene,polycarbonate,polyvinylchloride,polyesterfabric,adhesives,primers,powdercoatings,surfacecoatingmaterials,paintsandmetalhandlingandpolymeradhesives.Theyareusedinawholevarietyofwaysincludingdashboards(vents,gauges,dialsandpanelling),steeringwheels,seats(armrests,headrests,foam),coatingsfortheoutsideofthevehicle,tyres,andfoamforroofing,amongothers.
RisingincomesinAsiahavealsoledtoaboomintheregion’sconstructionsector,whichusesarangeofPeCinputs,includingcellulosics,whosemarketgrewby15%in2011.“Newconstructionismainlydrivenbyinfrastructureandhousingneedsofcountrieswithstrongmigrationmovementsofyoungpopulationsintourbaneconomiccentres,”TilmanKrauch,headofBASF’sconstructionchemicalsdivision,wasquotedassaying.5
Theworldmarketforconstructionchemicalsisexpectedtogrowatanannualaverageof5%perannumfromUS$30.7bnin2009toUS$39.2bnin2014,accordingtoSRIConsulting.6Chinawillaccountformuchofthisgrowth,withitsmarketexpandingbyanannualaverageof9%perannumfromUS$7.9bntoUS$12.1bnoverthatperiod.Tomeetthegrowingdemand,globalcompaniesareinvestinginAsia.AmericanfirmDowConstructionChemicals,forinstance,planstoexpanditscellulosicproductioncapacityinAsia.7
Intheareaofinfrastructure,manyAsianeconomies,despiteyearsofrapidgrowth,stillfacehugeinfrastructuredeficits.Asaresult,thereismuchpublicandprivatespendingonroads,ports,bridgesandotherinfrastructure,allofwhichrequirePeCinputsfortheirconstruction.
Asia’sgrowingfoodconsumptionisanotherdemandbooster.AccordingtoMrMukundan,agricultureandfarm-relatedchemicalsisthesegmentshowingthe“mostrobustgrowth”intermsofprofitability.“Themarginstructuresoffertilisercompanieshavebeeninkeepingwithfoodprices,”headds.
AthirdtrendthatwilldrivethePeCindustryisthegrowingemphasisonsustainabledevelopmentandalternativeenergysources.ChemicalproducerBASFsees“strongpotentialinsolutionsthatcontributetosustainabledevelopment,”saysAlbertHeuser,thefirm’spresidentformarketandbusinessdevelopmentinAsiaPacific.Forinstance,BASFestimatesthatby2020theglobalmarketforitswindpowerproducts—includingepoxysystems,corefoams,advancedcoatingsandhydraulicfluids—willbeworthsome€300m(US$390m).Muchofthissegment’sgrowthwillcomefromChina,whichisalreadytheworld’slargestwindpowermarket.
4“Globalchemicalindustryrecovers,butanautomotiveshifttoAsiawillposemorechallenges”,ICIS,March22nd2010
3“TheriseofAsia’smiddleclass”,AsianDevelopmentBank,2010
5“Urbanizationtrendboostsconstructionchemicalsmarket”,ICIS,July9th2010
6Citedin“ChemicalsandConstruction:BuildingaFutureTogether”,KPMG,June13th2011
7“DowplanstoexpandcellulosicproductioncapacityinAsia-Pacific”,Chemicals-technology.com,Dec12th2001

© The Economist Intelligence Unit Limited 2012 7
Asia Competition Barometer:Petrochemicals and chemicals
Thefourthtrendisgrowingdemandforpotablewater.Millionsofpeople,particularlyincountriessuchasIndia,donothaveaccesstosafedrinkingwater.MrHeuseridentifieswaterproductsandservicesasakeygrowthsegment.BASFbelievesitcancapturearound€800m(US$1bn)oftheestimated€20bn(US$26bn)globalwatertreatmentandpurificationmarket.
ForeignPeCfirmshavebeenoperatinginAsiaforseveraldecades.Recently,inrecognitionofAsia’sgrowingimportance,theyhavebeeninvestingheavilyintheregion.BetweenJanuary2004andDecember2011,fDiMarkets,aresearchhouse,recordedatotalof1,512projectsinAsia.MostofthoseinvestmentsoriginatedfromtheUS(24%oftheinvestmentprojects),Japan(24%)andGermany(15%).ThetopthreeinvestmentdestinationmarketswereChina(48%oftheinvestmentprojects),India(14%)andThailand(6%).Aboutone-thirdoftheseforeigninvestmentswerefocussedonproductionforregionalmarkets.

© The Economist Intelligence Unit Limited 20128
Asia Competition Barometer:Petrochemicals and chemicals
Competition and profitability at Asian firms
Thenumberandsizeofpublicly-listedfirmsinthePeCsectorinAsiahasincreaseddramatically,by46%between2004and2009,from376firmsto549.Overthesameperiod,thetotalcombinedrevenue
ofpublicly-listedPeCcompaniesmorethandoubledfromUS$113.2bntoUS$256.3bn;thesefirms’combinedtotalassetsrosefromUS$104.2bntoUS$254.2bn.
Competition: Declining since 2008WithmanycompaniesraisingtheirexpectationsofAsiatodelivergrowthandprofits,itisreasonabletoexpectcompetitionintensityintheregiontoincrease.TocapturethisintensitywehaveusedtheHerfindahl–HirschmanIndex(HHI),whichmeasuresthemarketconcentrationofanindustry’slargestfirms.HHIvaluescanrangefrom0(extremelyfragmentedmarket)to1.0(monopoly).Herewehavemultipliedthevaluesby100toachieveascaleconsistentwithprofitabilityindicators(seebelow).
TheHHIforAsia’sPeCindustryincreasedslightlyfrom8.27in2004to8.48in2009,signifyingthatthe50biggestfirmsintheBarometersawamarginalincreaseinconcentrationbetween2004and2009(seeFigure2).8
CompetitioninthePeCindustrygrewbetweentheyears2004and2007.TheHHIdroppedfrom8.27to7.52overthatperiod,signifyingthatthemarketshareofthe50biggestfirmsdeclined.Thisislargelybecauseofaninfluxofnewplayersintothesector—inthosetwoyears,157newAsiancompaniesenteredtheindustry,capturingmuchoftherapidlygrowingmarket.
However,between2007and2009,thelargestfirmsintheindustrybegantosteadilyincreasetheirconcentrationonceagain.TheHHIrosefrom7.52to8.48overthatperiod.Thisismostlybecauseoftheglobaleconomicslowdown’simpactonsmallerfirmsintheregion,andtheresultingindustryconsolidation.
ProfitabilityinthePeCsectorinAsiadeclinedsignificantlyin2008(seenextsectionformoredetails),hurtingsmallercompaniesinparticular.Largercompanies,whowereflushwithcashandhadgreater
8Ameasureofthesizeofcompanies in relation to the industry,andanindicatoroftheamountofcompetitionamongthem,theHHIisdefinedasthesumofthesquaresofthemarketsharesofthe50largestfirmsfromtheuniverseofover200listedcompaniesassessed.FormoreinformationontheBarometermethodology,pleaserefertothelastsectioninthisreport.

© The Economist Intelligence Unit Limited 2012 9
Asia Competition Barometer:Petrochemicals and chemicals
Figure 2: Herfindahl–Hirschman Index
7.0
7.5
8.0
8.5
9.0
200920082007200620052004
Source: Economist Intelligence Unit
2004 2005 2006 2007 2008 2009
Herfindahl—Hirschman Index (HHI) 8.27 7.90 7.65 7.52 7.54 8.48
flexibilitytoadjustproduction,werebetterabletoweatherthestorm.From2008to2009,thenumberofpublicly-listedPeCcompaniesinAsiaactuallydeclinedfrom559to549.
MrMukundansaysthatbeforethe2008-09economicslowdown,severalfirmsmadebiginvestmentsbasedonhowtheyexpectedPeCsupplychainstoevolve.“Someofthesebetshavegonewrongduetoinsufficientdata,someduetoinactionandsomesimplybecauseofthewaythemarketsturned,”hesays.TataChemicalsusedthecrisistoexamineitscoststructures.ItdecidedtocloseamanufacturingplantintheNetherlands,andthenacquiredasaltbusinessintheUK.“Companiesthatsharpenedtheirfocusoncashcameoutwithbetterbalancesheets,”saysMrMukundan.Manyfirmswereabletobouncebackfromtherecessionas“alotofthebelt-tighteninghappenedfairlyquickly”.
MrMukundanbelievesthatsegmentsinthePeCsectorarebecomingmorecommoditisedandthe“spacetoaddanintangibleorservicecomponentisgettingshavedquickly”.Withtheexceptionofafewcleaningagents,mostPeCproductsareusedasrawmaterialsforthemanufactureofotherproducts.Asthereislittledifferentiationintheseproducts,economiesofscaleareimportant.
Figure 3: Top ten companies by turnover
Company Country of origin 2004 turnover (US$bn) 2009 turnover (US$bn)
Indian Oil Corporation India 30.02 56.62
RelianceIndustries India 15.14 47.6
ThaiOilPublicCompany Thailand 6.16 9.48
SinopecShanghaiPetrochemical China 5.88 7.21
MangaloreRefineryandPetrochemicals India 0.41 7.07
ShanghaiMaterialTrading China 1.3 6.91
ChennaiPetroleumCorporation India NA 5.6
IRPCPublicCompany Thailand 5.14 5.51
HindustanUnilever India 2.41 4.04
BangchakPetroleum Thailand 2.65 3.61
Note:ThesearethetenbiggestcompaniesbyturnoverthatwereanalysedintheBarometer,whichconsideredonlypubliclylistedfirmsineightcountries:China,India,Indonesia,Malaysia,thePhilippines,Singapore,ThailandandVietnam
© The Economist Intelligence Unit Limited 201210
Asia Competition Barometer:Petrochemicals and chemicals
Whenrevenuegrowthslowedasaresultofthecrisis,thesmallerplayerscouldnotkeeppacewithlargeMNCsandstate-ownedcompanies.Tocompeteintoday’sclimate,MrMukundansayscompaniesneedtofocusonbeingcost-competitiveandtoinvestininnovation.“Bothofthesearequitecriticalandcompaniesthatdobothoratleastoneoftheseareonesthathavetendedtogainmarketshare,”hesays.Thesmallerplayers,headds,havehadatoughtimeandonlyafewofthemhaveadaptedwellenough.Consolidationhasledtothecreationofevenlargerfirmswithmultiplecapabilities.
Thethreelargestcompaniesby2009turnover(seeFigure3)—IndianOilCorporation,RelianceIndustriesandThaiOilPublicCompany—togetheraccountforalmosthalfoftheindustry’scombinedrevenues.
MrHeuseratBASFsaysthatlargerfirmshave“aclearedge”overthecompetitionastheycanbuildontheirexistingglobalresearchanddevelopment(R&D)platforms.Nevertheless,rivalryamongthelargestPeCfirmsremainsextremelystrong,andcompetitionbetweenthemislikelytoincrease.
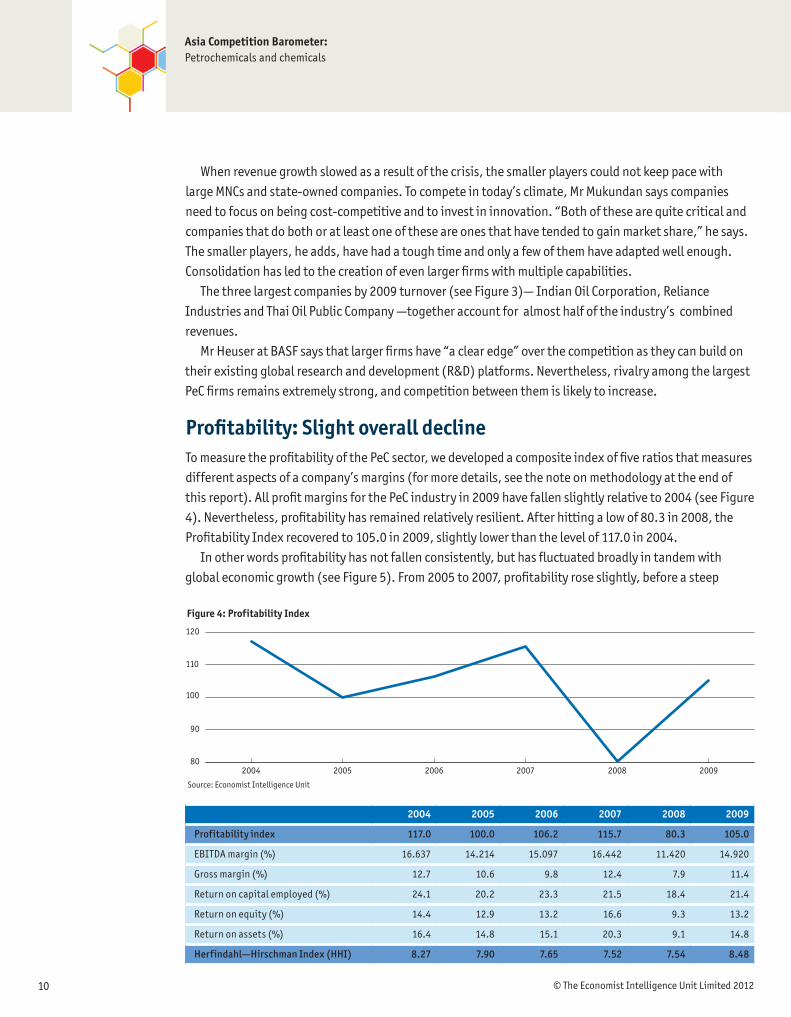
Profitability: Slight overall declineTomeasuretheprofitabilityofthePeCsector,wedevelopedacompositeindexoffiveratiosthatmeasuresdifferentaspectsofacompany’smargins(formoredetails,seethenoteonmethodologyattheendofthisreport).AllprofitmarginsforthePeCindustryin2009havefallenslightlyrelativeto2004(seeFigure4).Nevertheless,profitabilityhasremainedrelativelyresilient.Afterhittingalowof80.3in2008,theProfitabilityIndexrecoveredto105.0in2009,slightlylowerthanthelevelof117.0in2004.
Inotherwordsprofitabilityhasnotfallenconsistently,buthasfluctuatedbroadlyintandemwithglobaleconomicgrowth(seeFigure5).From2005to2007,profitabilityroseslightly,beforeasteep
Figure 4: Profitability Index
80
90
100
110
120
200920082007200620052004
Source: Economist Intelligence Unit
2004 2005 2006 2007 2008 2009
Profitability index 117.0 100.0 106.2 115.7 80.3 105.0
EBITDAmargin(%) 16.637 14.214 15.097 16.442 11.420 14.920
Grossmargin(%) 12.7 10.6 9.8 12.4 7.9 11.4
Returnoncapitalemployed(%) 24.1 20.2 23.3 21.5 18.4 21.4
Returnonequity(%) 14.4 12.9 13.2 16.6 9.3 13.2
Returnonassets(%) 16.4 14.8 15.1 20.3 9.1 14.8
Herfindahl—Hirschman Index (HHI) 8.27 7.90 7.65 7.52 7.54 8.48

© The Economist Intelligence Unit Limited 2012 11
Asia Competition Barometer:Petrochemicals and chemicals
declinebetween2007and2008,adirectreflectionofthegatheringfinancialstormattheendof2007thatdepressedglobaldemand.9Asmuchofthedevelopedworldenteredarecession,exportsofmanufacturedgoodsfromAsiatotheWestcontractedsharply.ThishadadirectimpactonprofitabilityinAsia’sPeCsector.
Rawmaterialcostswerealsoafactorinprofitability.WhileoverallrevenuesofthefirmsintheIndexincreasedin2008,thecostofrawmaterials,suchasoil,naturalgas,water,metalsandminerals,roseevenmore.Asiancompaniessawtheiraveragegrossprofitmarginfallfrom21.5%in2007to18.4%in2008.Thepriceofoilpeakedinmid-2008,theyearprofitabilityfellmost.MrMukundanatTataChemicalssaysthatthepricesofseveralotherinputs,suchasrockphosphate,ureaandammonia,allhitapeakin2008“astraderswereflippingtheseassetsinahurry”.
Profitabilitybouncedbackin2009asemergingAsia’seconomiesbegantogrowrapidlyagain.Asiaex-JapansawrealGDPgrowthof5.2%thatyear.Meanwhile,rawmaterialcostsdeclinedsharply.Finally,industryconsolidationwouldhaveimprovedtheallocationandaverageproductivityofassets,assomesmallerfirmsshut,andsomelargerfirmswereabletogrowtheirmarketshare.
Inthecomingyears,profitabilitywilllargelybedependentoninnovationandtheabilitytotapintomarketsthatarerelativelyunderpenetrated.Mostimportantly,accordingtoMrMukundan,istheneedforcompaniestosecureaccesstolow-costrawmaterialsandenergy.
TheEIUexpectsthepricesofoilandindustrialrawmaterialstomoderateoverthenextfewyears(seeBox:Commodityprices).
9ThecompositeProfitabilityIndexismadeupoffiveratios that each represents adifferentaspectofacompany’sprofitability.FormoreinformationontheBarometermethodology,pleaserefertothelastsectioninthisreport.
Figure 5: Global GDP(% real change p.a.)
-3
-2
-1
0
1
2
3
4
5
2016201520142013201220112010200920082007200620052004
Source: Economist Intelligence Unit

© The Economist Intelligence Unit Limited 201212
Asia Competition Barometer:Petrochemicals and chemicals
Commodity prices
Aftersharpfallsinthefinalquarterof2011,commoditypricesgenerallyhavehadastrongstartto2012,buoyedbydatareleasesshowingmorepositivegrowthtrendsinbothChinaandtheUSandsometentativesignsthattheeurozonedebtmarketswillavoidwidespreaddefaults.Oilprices,inparticular,havebeenstrongowingtosupplyconcernsrelatedtocivilunrestinNigeriaandtensionsbetweenIranandtheWest.Priceswillremainhostagetosentimentsurroundingtheoutcomeoftheeurozonecrisisandglobaleconomicprospectsinearly2012.Amarkeddeteriorationintheoutlookforthe
eurozonecouldbeexpectedtoleadtodramaticfallsincommodityprices,giventhatitwouldmostlikelyhavesevereconsequencesforglobalgrowth.
Onaverage,pricesareexpectedtobeweakerin2012,owingtoslowerconsumptiongrowthand,dependingonthecommodity,someimprovementonthesupplyfront.AstrongerUSdollarwillalsobenegativeforcommodityprices.However,looseglobalmonetaryconditionsandalossofconfidenceinsovereigncreditworthiness,whichisencouraginginvestorstoseekreturnsinrealassets,willoffersomesupporttoprices.Withglobaldemandsettostabilisein2015-16,commoditypricesareexpectedtonudgehigher.
Figure 6: Commodity price forecasts
2007 2008 2009 2010 2011 2012 2013 2014 2015 2016
OilpricesBrent;US$/b 72.71 97.66 61.86 79.63 111.01 110.00 103.63 108.25 104.00 110.00
Non-oilcommodities*%changeinUS$prices 20.8 12.2 -22.4 24.0 26.3 -12.2 -1.9 -3.6 3.4 2.8
*IndexincludesBeverages,Grains,Oilseeds,Sugar,Metals,FibresandRubber
Source:TheEconomistIntelligenceUnit,Feb10th2012
Case study: Tata Chemicals
Tata Chemicals: Competing to secure raw materials and energyTataChemicals,oneofIndia’slargestchemicalcompanies,sawits
annualrevenuesquadruplefromUS$674min2004toUS$2.9bnin2008,beforefallingslightlytoUS$2.1bnin2009,duringtheglobaleconomicdownturn.
“WeareveryfortunatethatourhomemarketisAsia,”saysRamakrishnanMukundan,thefirm’smanagingdirector.“Ifyoulookatthepastandtheimmediatefuture,thebulkofprofitgrowthandthebulkofnewsegmentgrowthintermsofproductsarehappeninginAsia.”EventhoughEuropeandNorthAmericacontinuetoleadinafewmanufacturingsegments,suchashigh-endpharmaceuticals,MrMukundanbelievesthatAsiaisclosingthegap,drivenpartlybyrapiddevelopmentsintheregion’sregulatoryframeworks.
MrMukundanbelievesthatcompetitioninthePeCsectorhaschangedwithgreaterconsolidationinthemarket.“Ithasledtothecreationoflargerfirmsthathavemultiplecapabilities,”saysMrMukundan.“Firmswithmarketaccesshavebeenacquiringormerging
withfirmsthathaveaccesstolowercostsintheformofcheaperenergyoraccesstorawmaterials.”Assuch,PeCfirmsarelookingtopartnerwithothercompaniesthathavecomplementaryskillsorcompetitiveadvantages.
Overthenextfewyears,MrMukundanexpectsPeCfirmstocompeteacrossthreedimensions.“Thefirstisalargefocusonsustainability.Thesecondissueisinnovation.Thethirdishowcompaniescanimplementthefirsttwoinordertoharnesswhatisreferredtoasthemarketatthebottomofthepyramid,”hesays,referringtoemergingmarketsinAsia,LatinAmericaandAfrica.Inthisregard,Asiancompanieshaveanadvantageas“theyhaveatouchandfeel”ofthismarket.MrMukundanbelievesthesethreefactorswillbethekeydriversofprofitability.
However,MrMukundanstressesthatunderlyingthethreedimensionsofcompetitiveness—innovation,sustainabilityanduntappedmarkets—ispreferentialaccesstoenergyandfeedstock.“Firmshavetoreachoutandgetthatadvantage,”hesays,pointingoutthattheseinputcostarbitrageopportunitieshavegrownoverthelastfewyears.

© The Economist Intelligence Unit Limited 2012 13
Asia Competition Barometer:Petrochemicals and chemicals
Positioning for success in Asia
Asia remains vital both as a market and as a production source
Giventhelong-termstructuralproblemsinmanyWesternmarketsandemergingAsia’slargelybullisheconomicfundamentals,theshiftintradeandinvestmentfromtheWesttoAsiawillcontinue.The
EIUestimatesthatby2016theeightAsiancountriesinthisstudyalonewillaccountfor28.9%ofglobalGDP(measuredinpurchasing-powerparityterms),upfrom23.2%in2010.
Growingregionaldemandforarangeofproducts,fromautomobilestohouses,willdriveAsia’sPeCsector.Itisexpectedtogrowatacompoundannualgrowthrateof10.5%between2010and2015,bywhenitwillbeworthsomeUS$2.6trn,accordingtoDatamonitor,aresearchfirm.China’smarketalonewillaccountforaboutUS$1.4bn.
GlobalPeCfirmsareincreasinglyviewingAsianotonlyasakeymarketbutalsoavitalsourceofproduction.BASFestimatesthatemergingmarketswillberesponsiblefor54%ofglobalchemicalproduction(excludingpharmaceuticals)by2015andalmost60%by2020,withChinaaloneaccountingfor30%ofglobalproductioninthatyear(seeFigure7).
ThekeyquestionforforeignplayersishowtheywillpositionthemselvesinAsianmarketstotakeadvantageofthisglobalshiftinthechemicalindustry.ThereareanumberoflargeAsianlocalcompaniesalreadyactiveinthisspace;severalofthem,suchasOilandNaturalGasCorporation(ONGC)andIndianOilCorporationinIndia,PetronasinMalaysia,andChinaPetroleumandPetrochemicalCorporation(Sinopec),ChinaNationalOilOffshoreCorporation(CNOOC)and
Figure 7: Global chemical production (excluding pharma)(Trillion $, real 2005)
0.0
0.5
1.0
1.5
2.0
2.5
3.0
2020201520101995
Thereof China
Emerging marketsDeveloped markets*World
~1.3
~2.1
~3.1
~3.2% p.a.
~4.0% p.a.
* BASF definition: Developed markets include EU15, Norway, Switzerland, North Amercia, Japan, Australia, New Zealand.
Source: BASF
~40% ~45%
~1.4~1.2
1.01.10.9
0.4 ~60%
~1.8

© The Economist Intelligence Unit Limited 201214
Asia Competition Barometer:Petrochemicals and chemicals
PetroChina,arestate-ownedenterprises.Theirlocalknowledgeandclosegovernmenttiesofferthemanadvantageagainstforeigncompetition.
ChinesePeCfirms,forinstance,havebeenabletosecuresuppliesofcrudeinplacessuchasAfricalargelybecauseoftheirgovernment’sfinancialandpoliticalbacking.Similarly,PetronasenjoysavirtualmonopolyinMalaysia.IthastherightstoallofMalaysia’shydrocarbonreserves.
Facedwiththesechallenges,privatesectorPeCfirmshaveforyearsbeenenteringintopartnershipswiththesestate-backedincumbents,offeringthemskillsandtechnologyinreturnforaccesstorawmaterials.Ashydrocarbonreservesdwindle,andastheseprivatesectorfirmsfindithardertosecuretherawmaterialstheyneed,thesepartnershipsarelikelytogrowinnumberandscope.
Evolving supply chains and partnershipsThescrambleforaccesstorawmaterialsandenergyisalreadyhavinganimpactonsupplychains.Thesespecificinputpricedifferentialsfaroutweighanyadditionallabourcosts.Forinstance,MiddleEasterncompaniesproducingfertilisernowhaveacrucialcompetitiveadvantagebecauseoftheiraccesstocheapnaturalgasintheregion.
Moreover,itisnolongeramatterofAsianstate-ownedenterprisesteamingwithlargelyWesternMNCs.Asiancompaniesarelookingoutsidetheregion.
TataChemicals,whichhasmanufacturingfacilitiesinAsia,Europe,NorthAmericaandAfrica,hasitslargestproductioncentreintheUS—energycoststherearerelativelylow,andthecountryhastheworld’slargestdepositsoftrona,whichisusedintheproductionofsodaash.
Logisticsarealsoevidentlymoreimportantthanlowcosts.InAsia,globalfirmsareestablishingkeyproductionsitesnotonlyclosetofeedstocksources,butalsoatlocationswhichprovidegoodaccessandconnectivitytorawmaterialsanddestinationmarkets.Forexample,ExxonMobil,anAmericanoilandgasfirm,willthisyearcompletetheconstructionofitslargestintegratedchemicalandrefiningsiteinSingapore.Similarly,Lanxess,aGermanchemicalscompany,recentlymoveditsbutylrubberglobalheadquartersfromSwitzerlandtoSingapore.
Thisraceforaccesstorawmaterialsandenergypartlyexplainstheincreasingnumberofpartnershipsinvolvingstate-ownedPeCfirms.OneofthelargestprojectsisRoyalDutchShell’sUS$4.3bnintegratedrefineryandpetrochemicalsjointventurewithCNOOCinGuangdongthatwassetupinApril2006.10 AnotherisBASF’sNanjing-basedUS$2.9bnjointventurewithSinopecthatbeganoperationsin2005.BASFalsohasajointventurewithPetronasinKuantan,Malaysia.ThesetwofacilitiesareBASF’slargestproductionsitesinAsia.
Similarly,inNovember2011,nationally-ownedKuwaitPetroleumCorporationandChina’sSinopecstartedbuildinganRMB59bn(US$9.3bn)jointrefiningandpetrochemicalcomplexinGuangdong.11 The projectincludesarefineryandaone-milliontonneayearethylenecrackingunitandisexpectedtocomeonstreamin2015.ThistypifiesthekindofpartnershipMrMukundanspeaksof:KuwaitneedsasteadyoutletforitsoilandSinopecneedsareliablesupplyofoilinordertomanufacturepetrochemicalstomeetChina’sgrowingdemand.
10“ChemicalsinChina:Thenextdecade”,KPMG,Sep1st2006.
11“Sinopec,KPCstartbuilding$9.3blnpetrochemproject”,Reuters,Nov17th2011.
© The Economist Intelligence Unit Limited 2012 15
Asia Competition Barometer:Petrochemicals and chemicals
Case study: BASF
BASF: Deepening its presence in AsiaAtBASF,theworld’slargestchemicalproducerbyturnover,Asia
revenuesreached€12.5bn(US$16.3bn)in2010,orabout21%ofthecompany’sglobalsales.AlbertHeuser,thefirm’spresidentofmarketandbusinessdevelopmentinAsiaPacific,saysthatinthefirstthreequartersof2011,BASF’ssalesincreasedacrossallsegmentsofitsbusinessinAsiaPacific.Chinaaloneaccountedforsalesof€5.8bn(US$7.5bn)in2010,makingitthethirdlargestmarketforBASFglobally,afterGermanyandtheUS.
“Wetargetregionalgrowthofaround8%perannuminAsiaPacificbetween2010and2020,”MrHeusersays.By2020,BASFexpectsAsiatoaccountfor25%ofitsglobalsales.Asiaisincreasinglyimportantnotmerelyasamarket,butalsoforproduction—BASFforecaststhatemergingmarketswillcontributeabout60%oftotalglobalchemicalproductionby2020.
MrHeusersaysthatBASFisstrivingtodevelopitsportfoliotowards“moremarketdrivenandinnovativebusinesses”.Forinstance,overthepastseveralyears,thecompanyhasmadeacquisitionsthatbuilditscapacitiesinengineeringplastics,electronicchemicals,catalysts,water-basedcoatings,pigmentsandplasticadditives.Thecompanyhassimultaneouslydivestedbusinessesinpharmaceuticals,fibres,printingsystems,polyolefins,agrogenericsandvitaminspremix.
HeaddsthatacrossAsia,theadoptionofnewtechnologiesisessential.Forinstance,thecompanyrecentlycompletedthesecond
phaseofits“highly-integrated,highlyenergy-efficient”productioncomplexinNanjingwhichservesmultipleindustriessuchasagriculture,construction,electronics,pharmaceutical,automotiveandchemicalmanufacturing.Furthermore,BASF’sconstructionchemicalsdivisionismovingtostrengthenitsfocuson“thirdgenerationtechnology”fortheconcreteadmixturemarketinChina.
“Atthesametimewearelookingfornewwaystotakeadvantageofthedevelopmentoftheregionfromanoperationalstandpoint,”MrHeusersays.BASFhassetupanengineeringandtechnicalprocurementofficeinShanghai,whichrepresentsanimportantpartofthefirm’sglobalengineeringandprocurementnetwork.TheofficeprovidesprojectmanagementandexecutionservicesforprojectsinAsia,andengineeringandtechnicalprocurementservicesfornon-Asianprojects.
Thereisaneedtoensurecoststructuresarecompetitive,saysMrHeuser,andBASFisdoingthisthroughefficiencymeasuressuchasfixedcostsavings,capacityincreasesandbettersourcing.“TheintensityofcompetitionhasincreasedintheAsiaPacificregion,withnewcapacitycomingonstreamfrommultinationalcompanies,state-ownedandprivatecompaniesthroughouttheregion,”saysMrHeuser.“Localcompetitorsareimprovingtheircapabilities,butthisvarieswidelyfromproducttoproduct.”
Inordertomaintainitsprofitabilityoverthenextfewyears,MrHeuserwantsBASFtomovedownstreamtowardscustomerindustriessothatby2020theshareofitssalesofclassicalchemicalswillbecloserto30%,whilecustomisedproducts,functionalisedmaterialsandsolutionswillreacharound70%.
© The Economist Intelligence Unit Limited 201216
Asia Competition Barometer:Petrochemicals and chemicals
Outlook
ThePeCmarketinAsiahasgrownsteadilyoverthepastfewyears.Giventheregion’sbullishlong-termgrowthoutlook,thistrendlookslikelytocontinue.Inparticular,demandfromtheconsumergoods,
agriculture,automotiveandconstructionsectorswilldrivetheregion’sPeCsector.Meanwhile,theincreasingglobalandregionalemphasisonsustainabledevelopmentandalternativeenergysourceswillcreatenewpotentialmarketsforPeCfirms.Moreover,AsiahasalsobecomeanimportantregionforPeCproduction.
Fortheindustryasawhole,afterasharpdipinprofitabilityin2008—duetoaslowdownindemandamidtheglobaleconomicdownturncrisis,coupledwithhigherinputcosts—marginshaverisentoneartheirsix-yearpeak.Inparticular,bigcompanieshavebeenabletoexploiteconomiesofscaleandgrowrapidly,bothorganicallyandthroughmergersandacquisitions.Withongoingconsolidationintheindustry,itseemslikelythatthebiggerfirms,withadequateresourcestoinvestinR&D,willcontinuetogrowtheirmarketshare.
MrHeuseratBASFsayscompetitioninAsiawillcontinuetoincreaseasallregionalplayersviewtheregion—andespeciallyChina—asakeymarket,“meaningthatmanagementattentionishighandresourcesaremadeavailable”.However,hebelievesthatbecausePeCsectorcompetitivenessiscloselytiedtotherateandqualityofinnovation,internationalcompaniesenjoythebenefitsofaglobalresearchanddevelopmentnetwork.Accordingtohim,suchfirmshaveadistinctadvantageiftheycantailorthebenefitsofsuchaninternationalnetworktotheneedsoflocalcustomers.Inrecognitionofthis,BASFisinvestingheavilyinR&DinAsia,includingsubstantiallyincreasingitsR&Dheadcount.
PerhapsthegreatestimperativeforPeCfirmsoverthenextfewyearsistheneedtosecureaccesstolow-costrawmaterialsandenergy.Asaresult,thesectorisseeinganincreasingnumberofpartnershipsbetweenMNCswithglobalnetworksandtechnologicalknow-how,andlocalplayers,includingstate-ownedfirms,withaccesstoresources—anothertrendthatwillfavourlargercompanies.
Withenergyandfeedstockpricearbitragelikelytodetermineprofitabilityandcompetitiveness,companiesofallnationalitieswillbeforcedtoexpandintonewmarkets.AccordingtoMrMukundan,“Allofushavetorealignourselves.”GlobalPeCfirmsthatareabletoadapttotheseevolvingindustrytrendswillbebestplacedtoboosttop-andbottom-linegrowth.

© The Economist Intelligence Unit Limited 2012 17
Asia Competition Barometer:Petrochemicals and chemicals
Barometer methodology
Toassesstheintensityofcompetitionandunderstandthechangingmarketdynamicsinkeysectors,theEconomistIntelligenceUnithasdevelopedtheAsiaCompetitionBarometer.Drawinguponcompany-
leveldataonprofitabilityandotherindicators,theBarometerquantifiesthechangingdynamicsofcompetitivenessinAsiaforselectindustriesbetween2004and2009.
Assessingauniverseofover550publicly-listedpetrochemicalandchemicalcompaniesacrosseightcountries—China,India,Indonesia,Malaysia,thePhilippines,Singapore,ThailandandVietnam—theBarometerexamineschangingprofitabilityandthecompetitionlandscapefortheT&Lsector.
How do we define the petrochemicals and chemicals manufacturing sector? Thepetrochemicalsandchemicalsmanufacturing(PeC)sectorincludesthefollowingsub-segments:
basicchemicals,fertilisersandnitrogencompounds,plasticsandsyntheticrubberinprimaryforms,pesticidesandotheragrochemicalproducts,paints,varnishesandsimilarcoatings,printinginkandmastics,soapanddetergents,cleaningandpolishingpreparations,perfumesandtoiletpreparations,explosives,otherchemicalproductsandman-madefibres.
Methodology TheBarometerhastwodimensions:profitabilityandmarketconcentration.
Profitability IndexToassesstheaggregateprofitabilityofthePeCmanufacturingsectorinAsia,theEconomistIntelligenceUnitdevelopedacompositeindexoffiveratiosthateachrepresentadifferentaspectofacompany’sprofitability:
• EBITDA margin (%):Ameasureofacompany’soperatingprofitability.Itisequaltoearningsbeforeinterest,tax,depreciationandamortisation(EBITDA)dividedbytotalrevenue.BecauseEBITDAexcludesdepreciationandamortisation,EBITDAmarginprovidesaclearerviewofacompany’scoreprofitability.Anincreaseincompetitionmayputpressureonanindustry’sprofitmargins.

© The Economist Intelligence Unit Limited 201218
Asia Competition Barometer:Petrochemicals and chemicals
• Gross margin (%):Whenusedasamarketmeasureofcompetition,grossmarginmeasurestheprofitabilityconsideringonlythecostsofgoodssold.Thehigherthepercentage,themorethecompanyretainsoneachdollarofsalestoserviceitsothercostsandobligations.Anincreaseincompetitiontendstoreducefirms’abilitytoincreasepricesandtherebyincreaseitsgrossmargin.
• Return on capital employed (%):Ameasureoftheefficiencyandprofitabilityofacompany’scapitalinvestments.Returnoncapitalemployedalsoindicateswhetherthecompanyisearningsufficientrevenuesandprofitsinordertomakethebestuseofitscapitalassets.Anincreaseincompetitionmayrequirefirmstoemployadditionalcapitaltomaintainprofitability.
• Return on equity (%):Ameasureoftherateofreturnontheshareholders’equity.Itmeasuresafirm’sefficiencyatgeneratingprofitsfromeveryunitofshareholders’equity.Returnonequityshowshowwellacompanyusesshareholderfundstogenerateearningsgrowth.Ariseincompetitiontendstoputpressureonreturnsonshareholderfunds.
• Return on assets (%):Ameasureofhowprofitableacompany’sassetsareingeneratingrevenue,orhowprofitableacompanyisrelativetoitsassets.Returnonassetsdeterminesacompany’sabilitytoutiliseitsassetsefficientlyandeffectively.Highercompetitiontendstoputpressureonfirms’abilitytomaintainreturnonassets.
Weaggregatedcompany-leveldataforover550publicly-quotedPeCcompaniesandexaminedtheirprofitabilityratios.Toenableobservationoftrendsovertime,acompositeProfitabilityIndexwasdeveloped(whereyear2005=100).EBITDAandgrossmarginaregivenahigherweightingintheindexastheyspeakdirectlytobottomlineprofitability,whilethereturnoncapitalemployed,returnonequityandreturnonassetsratiosspeaktohowacompanymakeuseofitsvariousresourcestodrivereturn(i.eefficiency/productivity).
Profitability indicator Weight in Profitability Index
EBITDAmargin(%) 35%
Grossmargin(%) 35%
Returnoncapitalemployed(%) 10%
Returnonequity(%) 10%
Returnonassets(%) 10%
Market concentration Toassessmarketconcentration,theEconomistIntelligenceUnitcalculatedtheHerfindahl-HirschmannIndex(HHI)forthePeCsectorinAsiafrom2004to2009.Ameasureofthesizeofcompaniesinrelationtotheindustry,andanindicatoroftheamountofcompetitionamongthem,theHHIisdefinedasthesumofthesquaresofthemarketsharesofthe50largestfirmsfromtheuniverseofover550listedcompaniesassessed.12HHIvaluescanrangefrom0to1.0,movingfromanextremelyfragmentedmarket(0)toamonopoly(1).HHIvalueshavebeenmultipliedby100toachieveascaleconsistentwithprofitabilityindicators.ArisingHHIindexgenerallyindicatesfallingmarketcompetition,whileafallintheHHIsuggeststhatcompetitionisincreasing.
12Orsummedforallthefirmsin the case that there are fewerthan50.

Whilst every effort has been taken to verify the accuracy of this information, neither The Economist Intelligence Unit Ltd. nor the sponsor of this report can accept any responsibility or liability for reliance by any person on this report or any of the information, opinions or conclusions set out herein.
