arkansas 21st century community learning centers statewide ... · arkansas 21st century community...
TRANSCRIPT
`
Arkansas21stCenturyCommunityLearningCentersStatewideEvaluation
2014-2015 Annual Report Report to the Arkansas Department of Education
April, 2016
301 W. Michigan Ave. | Suite 200 | Ypsilanti, Michigan 48197 | Phone: 734.961.6900 | www.cypq.org The David P. Weikart Center for Youth Program Quality is a division of The Forum for Youth Investment.
2014-2015 Arkansas 21st CCLC Statewide Evaluation Report Page 2
Arkansas21stCenturyCommunityLearningCentersStatewideEvaluationReport:2014-2015AnnualReportPrepared by Anna Gersh, Charles Smith, Gina McGovern The David P. Weikart Center for Youth Program Quality A Division of the Forum for Youth Investment
2014-2015 Arkansas 21st CCLC Statewide Evaluation Report Page 3
TableofContentsIntroduction ............................................................................................................................................................ 5
Purpose and Components of the Evaluation ............................................................................................................. 6
Summary of Findings .............................................................................................................................................. 8
Statewide Goals and Objectives Results ............................................................................................................... 8
Leading Indicator Findings ................................................................................................................................ 10
Evaluation Methodology ....................................................................................................................................... 13
Measures, Data Collection Procedures, and Sample Characteristics .................................................................... 13
Project Director/Site Coordinator Survey & Sample .......................................................................................... 14
Direct Staff/Youth Worker Survey .................................................................................................................... 15
Youth Survey .................................................................................................................................................... 16
Parent Survey .................................................................................................................................................... 17
Program Quality Assessment ............................................................................................................................. 19
Annual Performance Report (APR) ..................................................................................................................... 20
Findings/Results ................................................................................................................................................... 22
Leading Indicator 1.1 – Staffing Model .............................................................................................................. 24
Leading Indicator 1.2 – Continuous Improvement ............................................................................................. 25
Leading Indicator 1.2 – Continuous Improvement continued ............................................................................. 26
Leading Indicator 1.3 – Youth Governance ........................................................................................................ 27
Leading Indicator 1.4 – Enrollment Policy ......................................................................................................... 28
Leading Indicator 2.1 – Academic Press ............................................................................................................. 30
Leading Indicator 2.2 – Engaging Instruction ..................................................................................................... 31
Leading Indicator 2.2 – Engaging Instruction continued ..................................................................................... 32
Indicator 3.1 – System Norms ............................................................................................................................ 34
Indicator 3.2 – Family Engagement ................................................................................................................... 35
Indicator 3.3 – School Alignment ....................................................................................................................... 36
Indicator 3.4 – Community Resources ............................................................................................................... 37
Indicator 4.1 – Socioemotional Development ..................................................................................................... 39
Indicator 4.2 – Academic Efficacy ...................................................................................................................... 40
Indicator 4.2 – Academic Efficacy continued ...................................................................................................... 41
Indicator 5.1 – Family Satisfaction ..................................................................................................................... 43
Indicator 5.1 – Family Satisfaction continued ..................................................................................................... 44
2014-2015 Recommendations ................................................................................................................................ 45
References ............................................................................................................................................................. 47
Appendix A: Technical Detail on Reliability of Measures ....................................................................................... 49

2014-2015 Arkansas 21st CCLC Statewide Evaluation Report Page 4
Appendix B: Profiles of High- and Low-Performing Sites ...................................................................................... 51
Appendix C: Statewide Goals & Objectives ............................................................................................................ 53
2014-2015 Arkansas 21st CCLC Statewide Evaluation Report Page 5
IntroductionIn 2002, the No Child Left Behind Act (NCLB) was reauthorized and the responsibility for distributing federal funding regarding 21st Century Community Learning Centers (CCLC) was shifted to each state. These dollars are intended to fund afterschool programs that are located in high poverty areas or in low-achieving schools. Grants are awarded to applicants whose main goals are to increase academic achievement, provide additional enrichment activities, and provide literacy and educational services for the parents of youth who attend the afterschool programs (United States Department of Education, 2011).
Both the State Education Agency (SEA) and grantees must comply with specific evaluation and accountability policies and reporting structures. SEAs must provide comprehensive annual evaluations of their 21st CCLC programs, reporting on the performance measures listed in their applications to the United States Department of Education. These reports must be made available for public consumption.
In order to aide in the evaluation process, grantees are required to submit data annually via the Annual Performance Report (APR). Prior to 2014, the Profile and Performance Information Collection System (APR) was used as an online portal that housed information from all 21st CCLC grantees across the United States. In 2014, this system was taken off line and replaced in 2015 with a new online federal reporting system. Data entry for the 2014-15 program year was entered during specified data entry windows in fall 2015, winter, and spring 2016.
Since 2002, the Arkansas Department of Education (ADE) has utilized federal dollars to fund afterschool programming in a wide variety of school districts and community organizations. To date, ADE has awarded approximately 250 different grants serving approximately 12,000 youth per year (Profile and Performance Information Collection System, 2013; Afterschool Alliance, 2011).
During the 2014-2015 program year, 21 grantees were awarded bringing the total number of grantees receiving funding to 89. These 89 grantees, representing 89 distinct sites/centers would split the approximately $11.4 million that was delegated to ADE by the federal government.
In fulfillment of the federal requirement for an annual evaluation, and because ADE does not require that grantees hire local evaluators, ADE sought an evaluation design that also prioritized usefulness to grantee level stakeholders.
Therefore, in the fall of 2012, the Arkansas Department of Education enlisted the David P. Weikart Center for Youth Program Quality at the Forum for Youth Investment (hereafter “evaluation contractor”) to provide a statewide evaluation of the Arkansas 21st CCLC program.
2014-2015 Arkansas 21st CCLC Statewide Evaluation Report Page 6
PurposeandComponentsoftheEvaluationThe evaluation design includes two overarching components – Program Evaluation and Program Quality improvement. Program Evaluation includes 1) support in the collection and submission of federally required data through the Annual Performance Report (APR), 2) collection of statewide Leading Indicator data at multiple levels from multiple sources and 3) preparation of grantee level Leading Indicator Reports allowing for grantee level comparisons to statewide norms. Table 1 presents a complete timeline of the services and supports surrounding the Program Evaluation component.
Table 1 – 2014-2015 Program Evaluation Component Timeline
Date/Time Activities September 11 &12, 2014 Quality and Evaluation Orientation & Team-Building Meeting November 2-4, 2014 Arkansas Annual Statewide Out-of-School Time Conference January 14 & 16, 2015 APR Orientation Webinar: Grantee Profile January 30, 2015 Due Date: Grantee Profile Updated/Completed in APR March – April, 2015 Evaluation Surveys Administered April 2014 Annual Performance Report (APR) Opens May 6 & 8, 2015 APR Orientation Webinar: Annual Performance Report (APR) May 29, 2015 Due Date: Operations, feeder schools, and partners data due in APR
End of program year – last day of data collection for the 2013-2014 program year June 30, 2015 Due Date: Activities, and Teacher Survey data due June 30, 2015 Due Date: Attendance, Staffing, and State Assessment data due Summer/Fall 2015 Site-Level Leading Indicator Reports Created April 2016 Statewide Evaluation Report
The program quality improvement process (see Figure 1) is aimed at embedding a culture of continuous assessment, planning, and improvement (Smith, Akiva, Sugar, Lo, et al., 2012). Typically, clients are asked to select a site team to conduct program self assessment using the Youth Program Quality Assessment (Youth PQA; Smith & Hohmann, 2005). Once data is collected, clients look at their data to see where they were doing well and where they could improve. A Program Improvement Plan is then created based on these areas, which includes very detailed information about the timeline for the goals, resources and supports necessary, and roles and responsibilities for goal completion. Throughout the program year, clients work toward implementing the steps necessary to achieve these goals. Another program self assessment is conducted to assess where gains were made and to examine other areas that may need attention, repeating the continuous improvement cycle.
The program quality improvement process used in the Arkansas 21st CCLC network was adapted from the Weikart Center’s evidence-based continuous improvement model and includes 1) support in the understanding and interpretation of the Leading Indicator Reports, and 2) support in the creation and implementation of Program Improvement Plans based on the data in the Leading Indicator Reports. Efforts to use the site-level Leading Indicator Reports were initiated during a grantee orientation process in September 2014. During this orientation process, grantees reviewed their Leading Indicator Reports and created a program goal for the beginning of the 2014-2015 program year.
2014-2015 Arkansas 21st CCLC Statewide Evaluation Report Page 7
Figure 1
Table 2 presents a complete timeline of the services and supports regarding the Program Quality Improvement component.
Table 2 – 2013-2014 Program Quality Improvement Component Timeline
Date/ Time Activities September 11&12, 2014 Quality and Evaluation Orientation & Team-Building Meeting November 2-4, 2014 Arkansas Annual Statewide Out-of-School Time Conference
Live Youth PQA Basics/Plus Training: Online training also available October – December, 2014 External assessment conducted by ASU Division for Cycles 11 & 12 September 29 – Feb 10, 2014 PQA Box Set orders October 8-10, 2014 Live PQA Basic and Basics Plus trainings October – December, 2014 Program self assessment November 7 & 14, 2014 Program self assessment and data entry webinars December 5, 2014 Due Date: All PQA program self assessment data due in Scores Reporter January 5 – February 7, 2015 Improvement planning January 22, 2015 Advanced Planning with Data training February 4 & 6, 2014 Improvement Planning webinars February 13, 2015 Improvement plans due in Scores Reporter February – May, 2015 Youth Work Methods trainings
2014-2015 Arkansas 21st CCLC Statewide Evaluation Report Page 8
SummaryofFindingsIn this section, we divide the presentation of findings into two sections. First, we describe system level performance against specific objectives and indicators set at the federal and state levels. More detailed findings can be found on pages 22-44 of the report. In this section we draw upon several data sources including federally mandated data on school success outcomes (i.e., achievement, school behaviors) as well as some of the Leading Indicators performance information. Second, we characterize findings from the Leading Indicators performance measurement framework in terms of strengths and areas for improvement. In this section we summarize across sites to describe findings at the system level.
StatewideGoalsandObjectivesResults
Each statewide goal and objective is listed below with progress made during the 2014-2015 program year noted for each.
Project Goal 1: Increase academic achievement in participants who regularly attend 21st CCLC Programs. (Note: Objectives for Project Goals 1 and 2 were modified prior to the 2013-2014 reporting period. The decision was made to omit the Teacher survey and periodic student assessments featured in the 2012-2013 Project Goal Objectives. The three objectives associated with Project Goal 1 were pared down to a single objective for the 2013- 2014 report. The benchmark for improvement in Objectives 1.1 and 1.2 was lowered from 80% to 60%.)
- Objective 1.1: Sixty (60) percent of participants attending the 21st CCLC program more than 30 days will
show improvement in raw scores on the Benchmark Exam in Literacy and Mathematics. • Thirty-five percent (35%) of regular participants showed improvement in state benchmark exams for
reading and 7% showed improvement for mathematics. - Objective 1.2: Sixty (60) percent of participants attending the 21st CCLC program 30 days or more will show
improvement in classroom academic performance as reported on the Arkansas Department of Education Statewide Information System.
• Among all 9-12th grade participants with 30 or more days in program (N=1935), comparative GPA indicated; 69% showed improvement in GPA from the 2013-2014 program year to the 2014-2015 program year.
• Among 9-12th grade participants with 30 or more days in program, who also receive free or reduced lunch (N=584), comparative GPA indicated; 71% showed improvement in GPA from the 2013-2014 program year to the 2014-2015 program year.
2014-2015 Arkansas 21st CCLC Statewide Evaluation Report Page 9
Project Goal 2: Increase non-academic achievement in participants who regularly attend 21st CCLC Programs
- Objective 2.1: Seventy-five percent (75%) of youth attending 21st CCLC programs report high levels (scoring
in the upper third of the rating scale) of social emotional skills, as reported on the youth survey administered by the Weikart Center.1
• The majority of students (an average of 71%) participating in the evaluation surveys administered during Spring 2015 reported that the program helped them: work well with other kids, talk with people they didn’t know, and tell other kids what they think, even if they disagree.
- Objective 2.2: Seventy-five percent (75%) of youth attending 21st CCLC programs report high levels (scoring
in the upper third of the rating scale) of positive academic habits, as reported on the youth survey administered by the Weikart Center.
• The majority of students (an average of 65%) participating in the evaluation surveys administered during Spring 2015 reported: having positive academic habits, doing things they had never done before, being challenged in a good way, feeling like they belong and matter, working well with other students, making and keeping friends with other students, completing their homework, and feeling academically efficacious.
Project Goal 3: Offer quality activit ies to al l youth attending the program. (Note: Information on program activit ies for the 2014-2015 was collected by the online APR system. At this t ime, the reporting function is sti l l in development. Information about Project Goal 3 wil l be available for the 2015-2016 report.)
- Objective 3.1: All 21st CCLC programs will offer homework help time to 21st CCLC participants.
- Objective 3.2: All 21st CCLC programs will offer academic (beyond homework help) and enrichment activities.
- Objective 3.3: Ninety (90) percent of 21st CCLC programs will offer monthly quality activities to families of
participating students.
- Objective 3.4: All programs will fully engage and complete all elements of the Youth Program Quality Intervention (YPQI).
• All programs were asked to fully participate in the four elements of the YPQI process: program assessment, data-driven planning, continuous quality feedback loops, and aligned professional development. The majority of sites participated in these efforts. Ninety-Seven percent (97%) of sites submitted program assessment data, while 89% submitted Program Improvement Plans.
- Objective 3.5: Seventy-five percent of programs will score a 3.90 or higher on the Instructional Total score as
measured by the Youth Program Quality Assessment (Youth PQA) or School-Age Program Quality Assessment (SAPQA).
• Forty-nine percent (49%) of sites submitting PQA data (N=87) scored a 3.90 or higher on the Instructional Total Score.
1 Changes in Project Goal 2 were affected by the omission of the Teacher survey. Behavioral data following 2012-2013 has been collected from the Leading Indicator Youth Survey.
2014-2015 Arkansas 21st CCLC Statewide Evaluation Report Page 10
LeadingIndicatorFindings
This section provides a summary of findings from the Leading Indicator measures including; program strengths; areas for potential targeted improvement efforts; and youth reported interest in academic subjects by grade and gender. Appendix B (see Figure B1) also provides a Performance Index which provides an overall description of site performance on scales of the leading Indicator measures. Approximately 10% of sites were identified in the low quartile on 10 or more scales of the Leading Indicator measures.
Program Strengths:
v Projects completed a fourth year of data collection to support improvement of quality afterschool programs
in Arkansas. In addition to submission of federally required data through APR, projects also submitted a number of Leading Indicator evaluation surveys. This year, project directors were more familiar with the requirements for data submission as part of the statewide evaluation.
v Most parents of the youth in the afterschool programs continue to appear to be satisfied with the services
that the 21st CCLC programs provide in terms of the program’s convenience, the safety of the program setting, and the program’s contribution to their child’s success in school. Parents also report regular communication with afterschool staff.
v Staff in the afterschool programs continue to report that they are able to provide opportunities for growth
and mastery for students, especially by exposing them to new experiences.
v Staff appear to be satisfied with their jobs, know the goals and priorities of their programs, and are able to talk to their peers and supervisors. Being able to communicate with peers and supervisors is especially important in fostering a professional learning community focused on program improvement.
v Project directors and site coordinators report that they are familiar with the standards of quality for the 21st
CCLC program, they collaborate across sites and share a common definition of quality, and are aware of the learning that is happening for their students during the school day.
v According to youth, Arkansas 21st CCLC programs continue to provide settings where they feel they can be
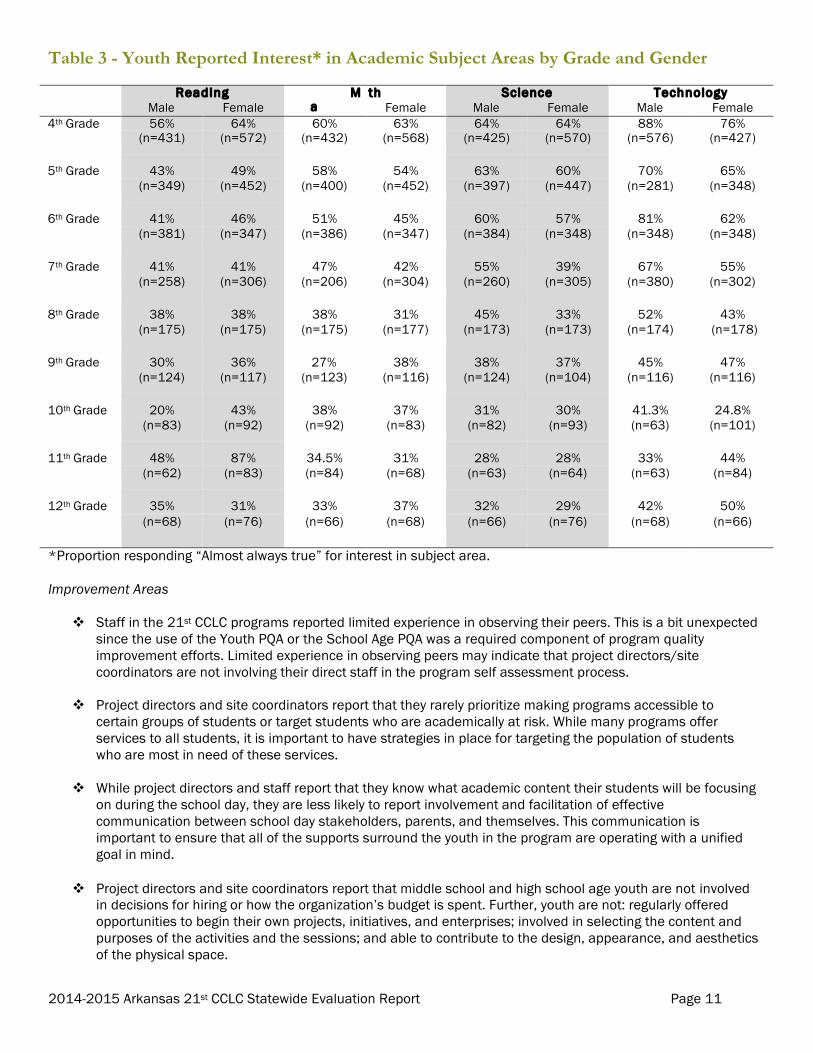
efficacious in academic subjects, develop good work habits, develop positive relationships, and complete their homework while being supported in doing so. Students appear to be moderately more interested in the science and technology subjects than in reading or math.
2014-2015 Arkansas 21st CCLC Statewide Evaluation Report Page 11
Table 3 - Youth Reported Interest* in Academic Subject Areas by Grade and Gender Reading
Male Female M
a Male
th Female
Science Male Female
Technology Male Female
4th Grade 56% 64% 60% 63% 64% 64% 88% 76% (n=431) (n=572) (n=432) (n=568) (n=425) (n=570) (n=576) (n=427)
5th Grade 43% 49% 58% 54% 63% 60% 70% 65% (n=349) (n=452) (n=400) (n=452) (n=397) (n=447) (n=281) (n=348)
6th Grade 41% 46% 51% 45% 60% 57% 81% 62% (n=381) (n=347) (n=386) (n=347) (n=384) (n=348) (n=348) (n=348)
7th Grade 41% 41% 47% 42% 55% 39% 67% 55% (n=258) (n=306) (n=206) (n=304) (n=260) (n=305) (n=380) (n=302)
8th Grade 38% 38% 38% 31% 45% 33% 52% 43% (n=175) (n=175) (n=175) (n=177) (n=173) (n=173) (n=174) (n=178)
9th Grade 30% 36% 27% 38% 38% 37% 45% 47% (n=124) (n=117) (n=123) (n=116) (n=124) (n=104) (n=116) (n=116)
10th Grade 20% 43% 38% 37% 31% 30% 41.3% 24.8% (n=83) (n=92) (n=92) (n=83) (n=82) (n=93) (n=63) (n=101)
11th Grade 48% 87% 34.5% 31% 28% 28% 33% 44% (n=62) (n=83) (n=84) (n=68) (n=63) (n=64) (n=63) (n=84)
12th Grade 35% 31% 33% 37% 32% 29% 42% 50% (n=68) (n=76) (n=66) (n=68) (n=66) (n=76) (n=68) (n=66)
*Proportion responding “Almost always true” for interest in subject area.
Improvement Areas
v Staff in the 21st CCLC programs reported limited experience in observing their peers. This is a bit unexpected since the use of the Youth PQA or the School Age PQA was a required component of program quality improvement efforts. Limited experience in observing peers may indicate that project directors/site coordinators are not involving their direct staff in the program self assessment process.
v Project directors and site coordinators report that they rarely prioritize making programs accessible to
certain groups of students or target students who are academically at risk. While many programs offer services to all students, it is important to have strategies in place for targeting the population of students who are most in need of these services.
v While project directors and staff report that they know what academic content their students will be focusing
on during the school day, they are less likely to report involvement and facilitation of effective communication between school day stakeholders, parents, and themselves. This communication is important to ensure that all of the supports surround the youth in the program are operating with a unified goal in mind.
v Project directors and site coordinators report that middle school and high school age youth are not involved
in decisions for hiring or how the organization’s budget is spent. Further, youth are not: regularly offered opportunities to begin their own projects, initiatives, and enterprises; involved in selecting the content and purposes of the activities and the sessions; and able to contribute to the design, appearance, and aesthetics of the physical space.

2014-2015 Arkansas 21st CCLC Statewide Evaluation Report Page 12
v An important part of building new skills and intrinsic motivation in youth is involving them in engaging activities that grow increasingly complex over time. Staff report that for about half of the time, group projects offered in the afterschool program typically do not take over five sessions to complete.
v Parent involvement and connectedness to the program is an important part of making sure the needs of
students and parents are being met. Parent respondents noted that the communication with the afterschool program is limited, particularly regarding the recruitment of parents to participate and/or lead sessions at the program.
2014-2015 Arkansas 21st CCLC Statewide Evaluation Report Page 13
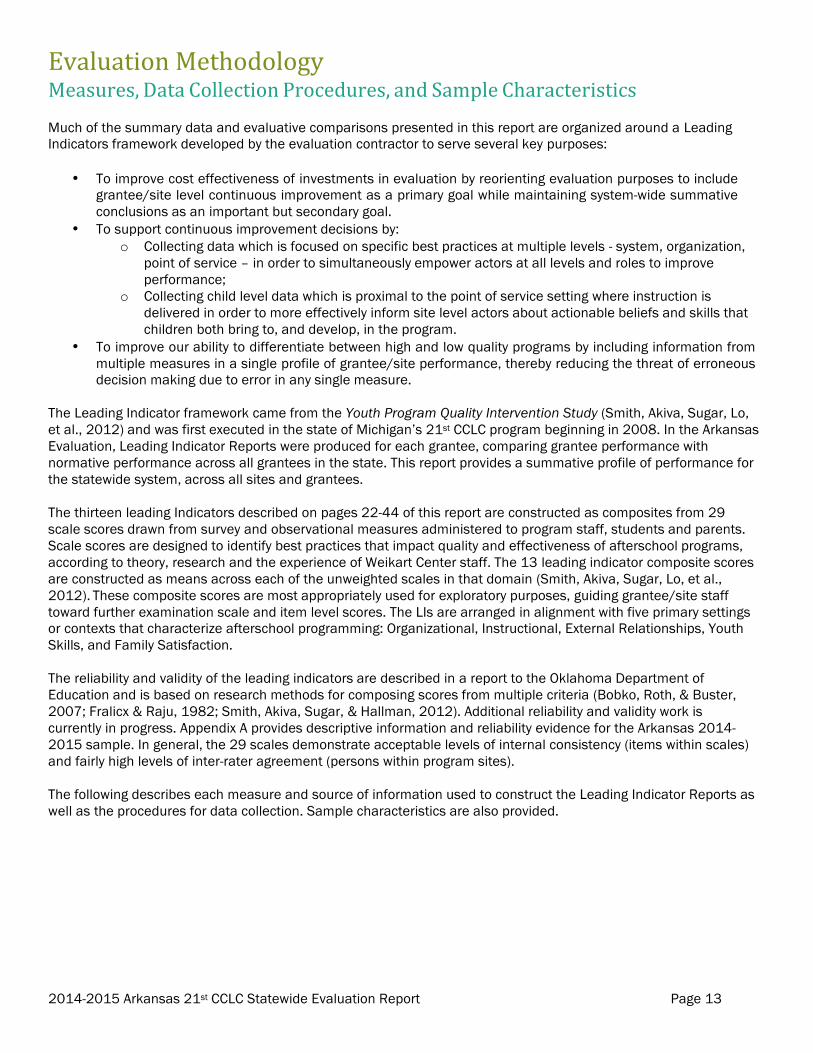
EvaluationMethodologyMeasures,DataCollectionProcedures,andSampleCharacteristics
Much of the summary data and evaluative comparisons presented in this report are organized around a Leading Indicators framework developed by the evaluation contractor to serve several key purposes:
• To improve cost effectiveness of investments in evaluation by reorienting evaluation purposes to include
grantee/site level continuous improvement as a primary goal while maintaining system-wide summative conclusions as an important but secondary goal.
• To support continuous improvement decisions by: o Collecting data which is focused on specific best practices at multiple levels - system, organization,
point of service – in order to simultaneously empower actors at all levels and roles to improve performance;
o Collecting child level data which is proximal to the point of service setting where instruction is delivered in order to more effectively inform site level actors about actionable beliefs and skills that children both bring to, and develop, in the program.
• To improve our ability to differentiate between high and low quality programs by including information from multiple measures in a single profile of grantee/site performance, thereby reducing the threat of erroneous decision making due to error in any single measure.
The Leading Indicator framework came from the Youth Program Quality Intervention Study (Smith, Akiva, Sugar, Lo, et al., 2012) and was first executed in the state of Michigan’s 21st CCLC program beginning in 2008. In the Arkansas Evaluation, Leading Indicator Reports were produced for each grantee, comparing grantee performance with normative performance across all grantees in the state. This report provides a summative profile of performance for the statewide system, across all sites and grantees.
The thirteen leading Indicators described on pages 22-44 of this report are constructed as composites from 29 scale scores drawn from survey and observational measures administered to program staff, students and parents. Scale scores are designed to identify best practices that impact quality and effectiveness of afterschool programs, according to theory, research and the experience of Weikart Center staff. The 13 leading indicator composite scores are constructed as means across each of the unweighted scales in that domain (Smith, Akiva, Sugar, Lo, et al., 2012). These composite scores are most appropriately used for exploratory purposes, guiding grantee/site staff toward further examination scale and item level scores. The LIs are arranged in alignment with five primary settings or contexts that characterize afterschool programming: Organizational, Instructional, External Relationships, Youth Skills, and Family Satisfaction.
The reliability and validity of the leading indicators are described in a report to the Oklahoma Department of Education and is based on research methods for composing scores from multiple criteria (Bobko, Roth, & Buster, 2007; Fralicx & Raju, 1982; Smith, Akiva, Sugar, & Hallman, 2012). Additional reliability and validity work is currently in progress. Appendix A provides descriptive information and reliability evidence for the Arkansas 2014- 2015 sample. In general, the 29 scales demonstrate acceptable levels of internal consistency (items within scales) and fairly high levels of inter-rater agreement (persons within program sites).
The following describes each measure and source of information used to construct the Leading Indicator Reports as well as the procedures for data collection. Sample characteristics are also provided.
2014-2015 Arkansas 21st CCLC Statewide Evaluation Report Page 14
ProjectDirector/SiteCoordinatorSurvey&Sample
In many 21st CCLC systems across the United States, a grantee would typically oversee multiple sites (or locations where programming is offered), each of which is managed by a site coordinator who is responsible for the daily operations of programming and staff supervision. Conversely, the project director typically operates at a higher level of management, communicating accountability policies to site coordinators. However, in Arkansas’s 21st CCLC system, there are many grantees who offer programming at only one site and in which the project director is also the site coordinator. Therefore, this survey was directed primarily at project directors, although site coordinators who were not also project directors were surveyed where appropriate.
The project director/site coordinator survey consisted of 44 items addressing perceptions of various practices and organizational characteristics that fell under the Organizational and External Relationships Contexts. These questions focused on issues such as staff capacity to carry out the work, job satisfaction, what role youth have in governing the program (where age appropriate), enrollment for students with academic risk factors, accountability and collaboration norms, connections to the school day, and community engagement with the afterschool program.
The project director/site coordinator survey was administered February-May 2014 via Qualtrics, an online survey software program. Surveys were constructed within the Qualtrics website and the participation link was then posted to Arkansas 21st CCLC’s webpage on the evaluation contractor’s website (www.cypq.org/ar21cclc) for project directors and site coordinators to easily access at their convenience. E-mail reminders were sent to non-respondents roughly halfway through the data collection period. Information at the beginning of the survey clarified the purpose of the surveys and defined confidentiality assurances.
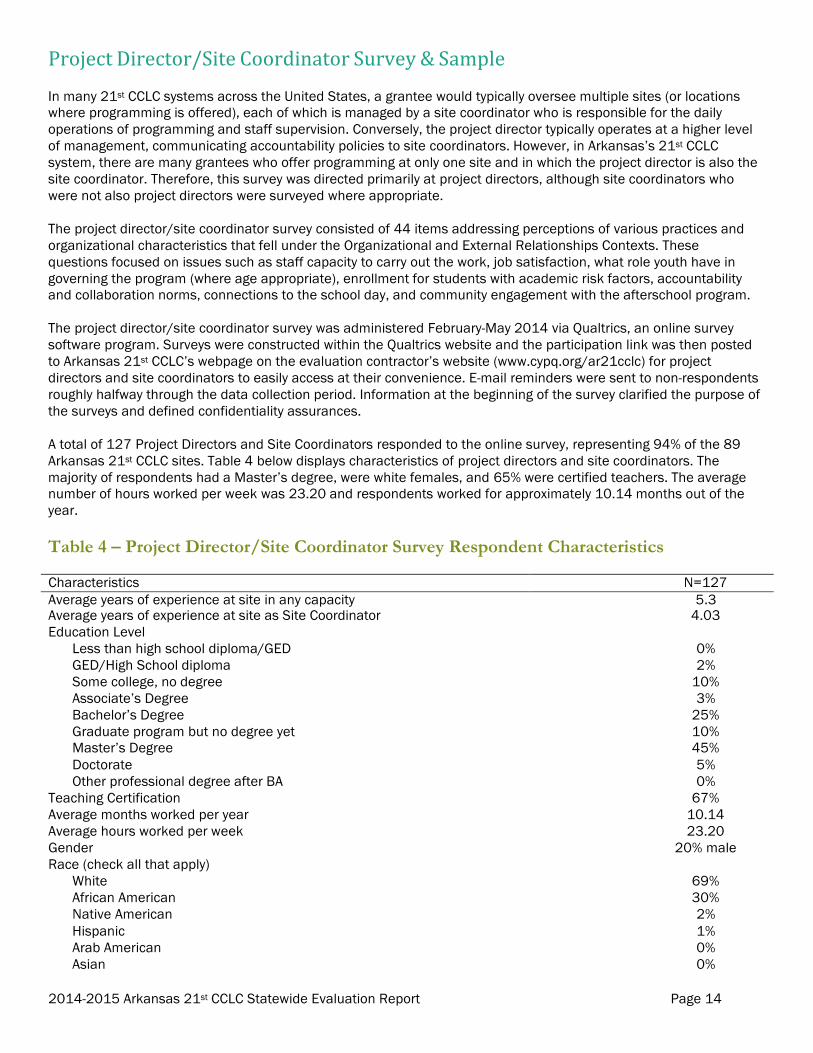
A total of 127 Project Directors and Site Coordinators responded to the online survey, representing 94% of the 89 Arkansas 21st CCLC sites. Table 4 below displays characteristics of project directors and site coordinators. The majority of respondents had a Master’s degree, were white females, and 65% were certified teachers. The average number of hours worked per week was 23.20 and respondents worked for approximately 10.14 months out of the year.
Table 4 – Project Director/Site Coordinator Survey Respondent Characteristics
Characteristics N=127 Average years of experience at site in any capacity 5.3 Average years of experience at site as Site Coordinator 4.03 Education Level
Less than high school diploma/GED 0% GED/High School diploma 2% Some college, no degree 10% Associate’s Degree 3% Bachelor’s Degree 25% Graduate program but no degree yet 10% Master’s Degree 45% Doctorate 5% Other professional degree after BA 0%
Teaching Certification 67% Average months worked per year 10.14 Average hours worked per week 23.20 Gender 20% male Race (check all that apply)
White 69% African American 30% Native American 2% Hispanic 1% Arab American 0% Asian 0%
2014-2015 Arkansas 21st CCLC Statewide Evaluation Report Page 15
Other Race 0%
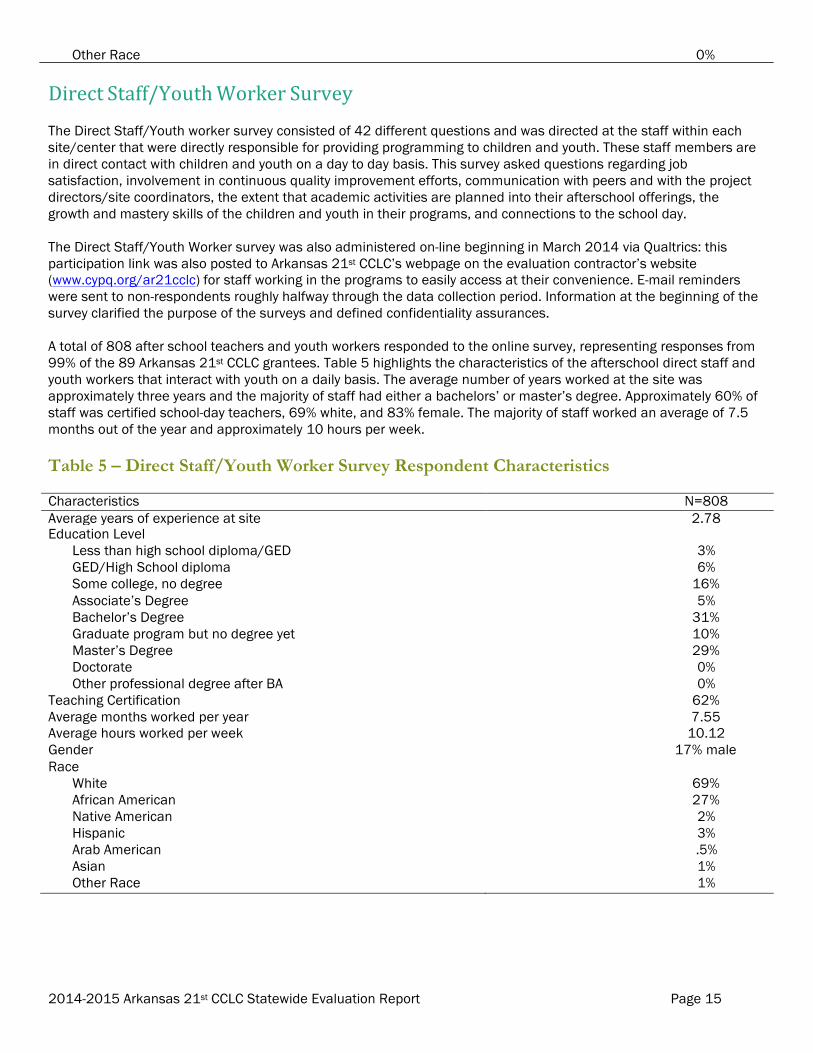
DirectStaff/YouthWorkerSurveyThe Direct Staff/Youth worker survey consisted of 42 different questions and was directed at the staff within each site/center that were directly responsible for providing programming to children and youth. These staff members are in direct contact with children and youth on a day to day basis. This survey asked questions regarding job satisfaction, involvement in continuous quality improvement efforts, communication with peers and with the project directors/site coordinators, the extent that academic activities are planned into their afterschool offerings, the growth and mastery skills of the children and youth in their programs, and connections to the school day.
The Direct Staff/Youth Worker survey was also administered on-line beginning in March 2014 via Qualtrics: this participation link was also posted to Arkansas 21st CCLC’s webpage on the evaluation contractor’s website (www.cypq.org/ar21cclc) for staff working in the programs to easily access at their convenience. E-mail reminders were sent to non-respondents roughly halfway through the data collection period. Information at the beginning of the survey clarified the purpose of the surveys and defined confidentiality assurances.
A total of 808 after school teachers and youth workers responded to the online survey, representing responses from 99% of the 89 Arkansas 21st CCLC grantees. Table 5 highlights the characteristics of the afterschool direct staff and youth workers that interact with youth on a daily basis. The average number of years worked at the site was approximately three years and the majority of staff had either a bachelors’ or master’s degree. Approximately 60% of staff was certified school-day teachers, 69% white, and 83% female. The majority of staff worked an average of 7.5 months out of the year and approximately 10 hours per week.
Table 5 – Direct Staff/Youth Worker Survey Respondent Characteristics
Characteristics N=808 Average years of experience at site 2.78 Education Level
Less than high school diploma/GED 3% GED/High School diploma 6% Some college, no degree 16% Associate’s Degree 5% Bachelor’s Degree 31% Graduate program but no degree yet 10% Master’s Degree 29% Doctorate 0% Other professional degree after BA 0%
Teaching Certification 62% Average months worked per year 7.55 Average hours worked per week 10.12 Gender 17% male Race
White 69% African American 27% Native American 2% Hispanic 3% Arab American .5% Asian 1% Other Race 1%
2014-2015 Arkansas 21st CCLC Statewide Evaluation Report Page 16
YouthSurvey
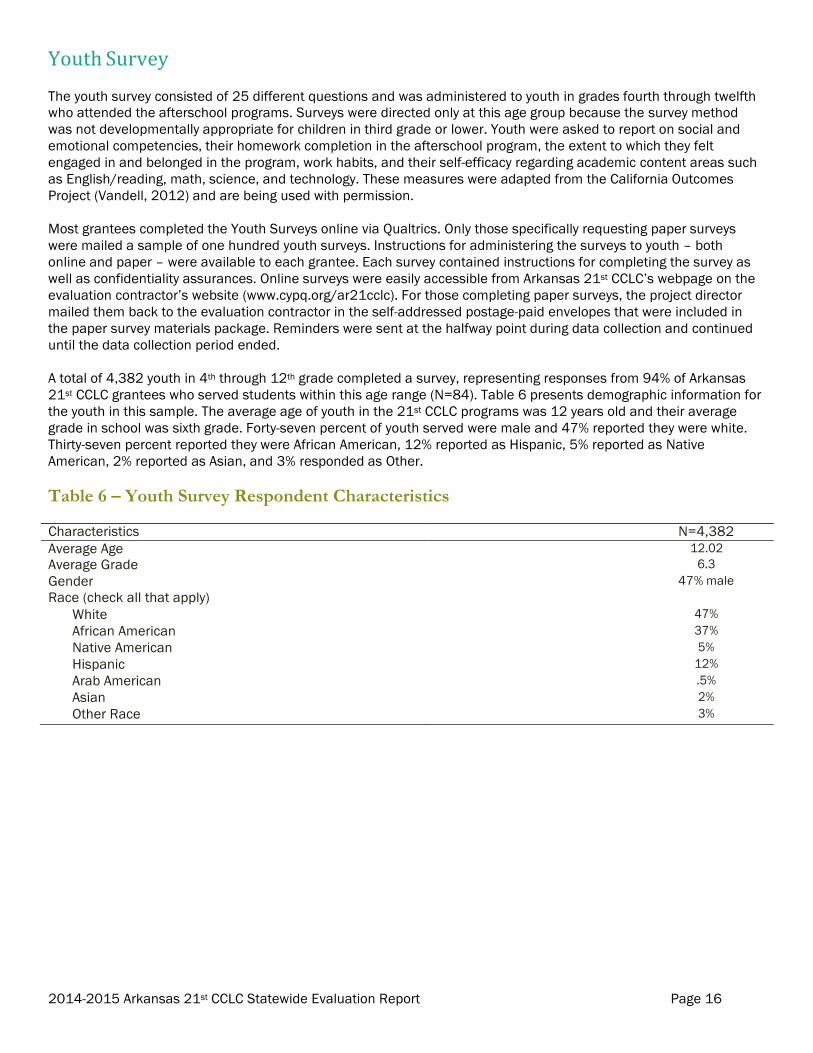
The youth survey consisted of 25 different questions and was administered to youth in grades fourth through twelfth who attended the afterschool programs. Surveys were directed only at this age group because the survey method was not developmentally appropriate for children in third grade or lower. Youth were asked to report on social and emotional competencies, their homework completion in the afterschool program, the extent to which they felt engaged in and belonged in the program, work habits, and their self-efficacy regarding academic content areas such as English/reading, math, science, and technology. These measures were adapted from the California Outcomes Project (Vandell, 2012) and are being used with permission.
Most grantees completed the Youth Surveys online via Qualtrics. Only those specifically requesting paper surveys were mailed a sample of one hundred youth surveys. Instructions for administering the surveys to youth – both online and paper – were available to each grantee. Each survey contained instructions for completing the survey as well as confidentiality assurances. Online surveys were easily accessible from Arkansas 21st CCLC’s webpage on the evaluation contractor’s website (www.cypq.org/ar21cclc). For those completing paper surveys, the project director mailed them back to the evaluation contractor in the self-addressed postage-paid envelopes that were included in the paper survey materials package. Reminders were sent at the halfway point during data collection and continued until the data collection period ended.
A total of 4,382 youth in 4th through 12th grade completed a survey, representing responses from 94% of Arkansas 21st CCLC grantees who served students within this age range (N=84). Table 6 presents demographic information for the youth in this sample. The average age of youth in the 21st CCLC programs was 12 years old and their average grade in school was sixth grade. Forty-seven percent of youth served were male and 47% reported they were white. Thirty-seven percent reported they were African American, 12% reported as Hispanic, 5% reported as Native American, 2% reported as Asian, and 3% responded as Other.
Table 6 – Youth Survey Respondent Characteristics
Characteristics N=4,382 Average Age 12.02 Average Grade 6.3 Gender 47% male Race (check all that apply)
White 47% African American 37% Native American 5% Hispanic 12% Arab American .5% Asian 2% Other Race 3%
2014-2015 Arkansas 21st CCLC Statewide Evaluation Report Page 17
ParentSurvey
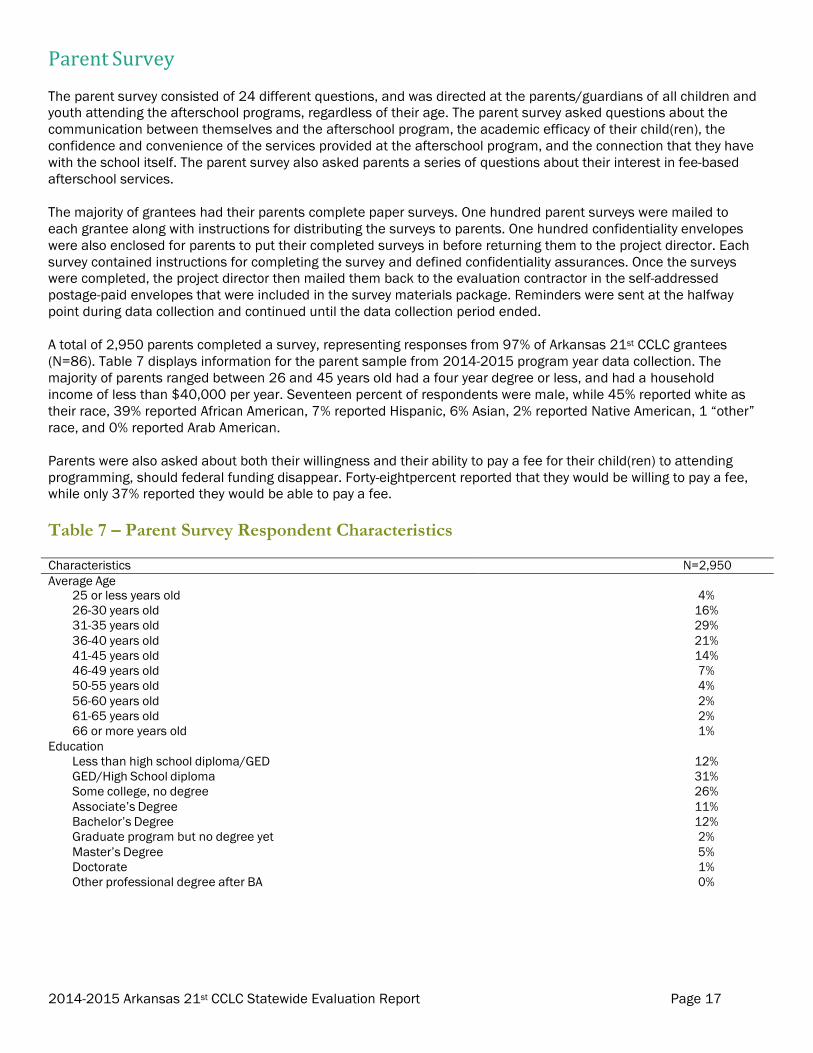
The parent survey consisted of 24 different questions, and was directed at the parents/guardians of all children and youth attending the afterschool programs, regardless of their age. The parent survey asked questions about the communication between themselves and the afterschool program, the academic efficacy of their child(ren), the confidence and convenience of the services provided at the afterschool program, and the connection that they have with the school itself. The parent survey also asked parents a series of questions about their interest in fee-based afterschool services.
The majority of grantees had their parents complete paper surveys. One hundred parent surveys were mailed to each grantee along with instructions for distributing the surveys to parents. One hundred confidentiality envelopes were also enclosed for parents to put their completed surveys in before returning them to the project director. Each survey contained instructions for completing the survey and defined confidentiality assurances. Once the surveys were completed, the project director then mailed them back to the evaluation contractor in the self-addressed postage-paid envelopes that were included in the survey materials package. Reminders were sent at the halfway point during data collection and continued until the data collection period ended.
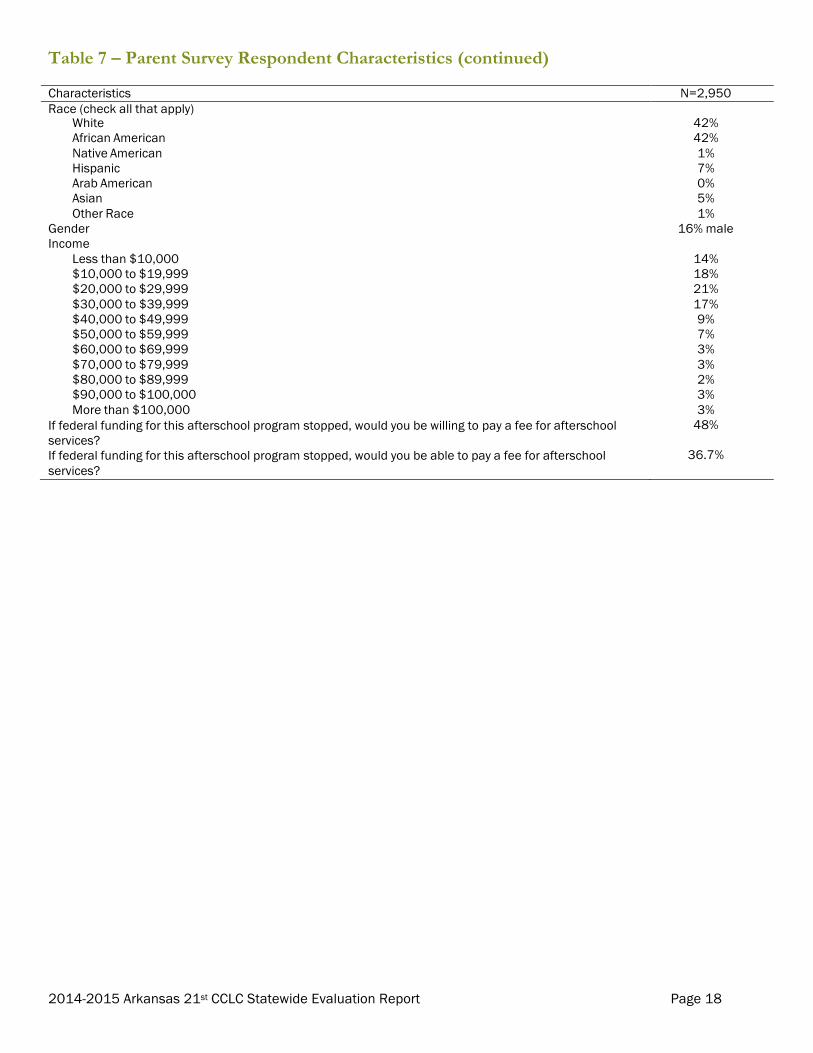
A total of 2,950 parents completed a survey, representing responses from 97% of Arkansas 21st CCLC grantees (N=86). Table 7 displays information for the parent sample from 2014-2015 program year data collection. The majority of parents ranged between 26 and 45 years old had a four year degree or less, and had a household income of less than $40,000 per year. Seventeen percent of respondents were male, while 45% reported white as their race, 39% reported African American, 7% reported Hispanic, 6% Asian, 2% reported Native American, 1 “other” race, and 0% reported Arab American.
Parents were also asked about both their willingness and their ability to pay a fee for their child(ren) to attending programming, should federal funding disappear. Forty-eightpercent reported that they would be willing to pay a fee, while only 37% reported they would be able to pay a fee.
Table 7 – Parent Survey Respondent Characteristics
Characteristics N=2,950 Average Age
25 or less years old 4% 26-30 years old 16% 31-35 years old 29% 36-40 years old 21% 41-45 years old 14% 46-49 years old 7% 50-55 years old 4% 56-60 years old 2% 61-65 years old 2% 66 or more years old 1%
Education Less than high school diploma/GED 12% GED/High School diploma 31% Some college, no degree 26% Associate’s Degree 11% Bachelor’s Degree 12% Graduate program but no degree yet 2% Master’s Degree 5% Doctorate 1% Other professional degree after BA 0%
2014-2015 Arkansas 21st CCLC Statewide Evaluation Report Page 18
Table 7 – Parent Survey Respondent Characteristics (continued)
Characteristics N=2,950 Race (check all that apply)
White 42% African American 42% Native American 1% Hispanic 7% Arab American 0% Asian 5% Other Race 1%
Gender 16% male Income
Less than $10,000 14% $10,000 to $19,999 18% $20,000 to $29,999 21% $30,000 to $39,999 17% $40,000 to $49,999 9% $50,000 to $59,999 7% $60,000 to $69,999 3% $70,000 to $79,999 3% $80,000 to $89,999 2% $90,000 to $100,000 3% More than $100,000 3%
If federal funding for this afterschool program stopped, would you be willing to pay a fee for afterschool services?
48%
If federal funding for this afterschool program stopped, would you be able to pay a fee for afterschool services?
36.7%
2014-2015 Arkansas 21st CCLC Statewide Evaluation Report Page 19
ProgramQualityAssessment
The Youth Program Quality Assessment (Youth PQA) and the School-Age Program Quality Assessment (School-Age PQA) are observation-based measures which were used to conduct program self-assessments as a critical piece of the Program Quality Improvement component, but also provided very useful data within the Instructional Context of the Leading Indicators. Assessors score the PQA using observational notes to score rubrics describing the extent to which specific staff practices are happening within each program session.
The Youth PQA is composed of 60 different items comprising 18 different scales, which fall under four domains: Safe Environment, Supportive Environment, Interaction, and Engagement. The Youth PQA is currently being used in over 70 afterschool networks across the United States and evidence from multiple replication samples suggests that data produced by the Youth PQA has characteristics of both precision (reliability) and meaningfulness (validity) (Smith, Akiva, Sugar, Lo, et al., 2012; Smith & Hohmann, 2005).
The School-Age PQA is composed of 68 different items comprising 20 different scales, which also fall under the same four domains as the Youth PQA: Safe Environment, Supportive Environment, Interaction, and Engagement. The School-Age PQA assesses staff instructional practices that are developmentally appropriate for younger children. Evidence of reliability and validity for the School Age PQA is available from the Weikart Center.
Program quality program self assessments were conducted with each site. The program self assessment method includes the selection of a site team that observes each other’s practice using the developmentally appropriate PQA assessment tool (Youth PQA or School-Age PQA). Once the site team has a chance to observe each other’s practice, a scoring meeting is scheduled in which staff discusses their observations and come to a consensus on the score for each item on the PQA.
Program quality external assessments were also conducted for a subset of these sites (those in the first and second year of their grant). ADE contracted with Arkansas State University (ASU) to hire trained reliable external assessors to observe programs in these two funding cycle years. Raters received endorsement through the completion of a rigorous reliability training process in which they are required to pass an examination by reaching 80% perfect agreement with the Weikart Center’s gold standard scores on the PQA.
2014-2015 Arkansas 21st CCLC Statewide Evaluation Report Page 20
AnnualPerformanceReport(APR)
Annual Performance Reporting data (collected via PPICS2 prior to 2014 and via an updated online Federal APR data collection system beginning in 2015) included in this report represents recruitment and retention information, program attendance information, student progress on academic achievement, and community partnerships.
The evaluation contractor provided technical assistance to grantees needing to fulfill data submission requirements via the online APR system. Grantees were asked to submit or update their grantee profile and their operations, objectives, activities, partners, teacher survey, and feeder school information under the annual performance report (APR) via online software provided by the Tactile Group, and with assistance from evaluation contractor staff. Conversely, the evaluation contractor submitted the staffing, attendance, and impact category for regular attendees (state assessment cross year) in the APR for all grantees.
In order to complete the attendance, staffing, and state assessment modules for grantees, the evaluation contractor asked all grantees to keep track of their data using an Excel spreadsheet created by the evaluation contractor. Grantees were asked to update these files on a monthly basis and then submit to the evaluation contractor once the program year had ended.
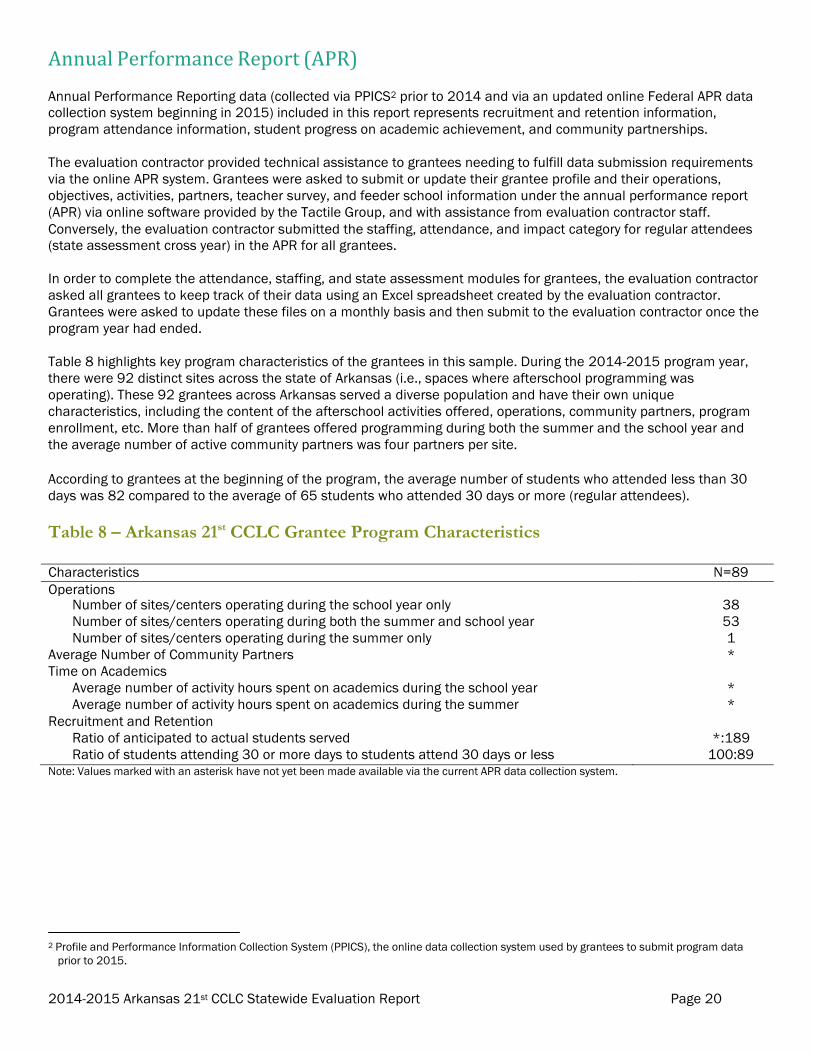
Table 8 highlights key program characteristics of the grantees in this sample. During the 2014-2015 program year, there were 92 distinct sites across the state of Arkansas (i.e., spaces where afterschool programming was operating). These 92 grantees across Arkansas served a diverse population and have their own unique characteristics, including the content of the afterschool activities offered, operations, community partners, program enrollment, etc. More than half of grantees offered programming during both the summer and the school year and the average number of active community partners was four partners per site.
According to grantees at the beginning of the program, the average number of students who attended less than 30 days was 82 compared to the average of 65 students who attended 30 days or more (regular attendees).
Table 8 – Arkansas 21st CCLC Grantee Program Characteristics
Characteristics N=89 Operations
Number of sites/centers operating during the school year only 38 Number of sites/centers operating during both the summer and school year 53 Number of sites/centers operating during the summer only 1
Average Number of Community Partners * Time on Academics
Average number of activity hours spent on academics during the school year * Average number of activity hours spent on academics during the summer *
Recruitment and Retention Ratio of anticipated to actual students served *:189 Ratio of students attending 30 or more days to students attend 30 days or less 100:89
Note: Values marked with an asterisk have not yet been made available via the current APR data collection system.
2 Profile and Performance Information Collection System (PPICS), the online data collection system used by grantees to submit program data prior to 2015.
2014-2015 Arkansas 21st CCLC Statewide Evaluation Report Page 21
Arkansas 21st CCLC Attendance and Academic Achievement In previous years Attendance and Academic Achievement in the Arkansas 21st CCLC Network was reported in terms of improvement in Reading and Math scores as measured by statewide benchmark exams across the current and previous reporting years. Different assessments were used for Arkansas students during the 2013-2014 (state benchmark exams) and 2014-2015 (PARCC) programming years. Because proficiency levels are unique to these exams, we are unable to gauge improvement across the 2013-2014 and 2014-2015 programming years. For this reason the attendance and academic achievement data has been omitted from this report. In 2015-2016 a new assessment will be introduced (ACT Aspire). Given the inherent problems with comparing proficiency across these different assessments, it may be advisable to consider alternative outcome measures for the 2015-2016 reporting period.
2014-2015 Arkansas 21st CCLC Statewide Evaluation Report Page 22
Findings/ResultsThe following section presents findings from the 2014-2015 Arkansas 21st CCLC Statewide Evaluation conducted by the evaluation contractor. The 2014-2015 third year the evaluation contractor has used the leading indicators framework to collect, analyze, and present data aligned with specific best practices at multiple levels of each grantee, representing baseline data.
The inclusion of 2012-2013 and 2013-2014 program data is provided to support comparisons across years, with a number of critical caveats:
• In most cases, this data cannot be used to represent changes in the behavior of specific individuals. We do not collect identifying information for any specific individual, so year-to-year comparisons only represent changes in the average scores for groups of individuals (within sites) that almost certainly differ across years.
• When we create average scores for all individuals within a site, these scores are only meaningful as an average level if individual scores are similar. If there is wide variation within sites, then average scores are hard to interpret.
The inclusion of multi-year data is aimed at driving deeper and more critical thinking, investigation, and question- raising to support lower stakes decision making about program improvement.
All summaries of data tables and figures described below are predicated upon 2014-2015 program year data along with the data from prior years. Data representations are meant solely for reference and examination purposes.

2014-2015 Arkansas 21st CCLC Statewide Evaluation Report Page 23
4.38 4.29 4.38
3.66 3.62 3.75
3.13 3.11 2.78 2.91 3.05
2.41
OrganizationalContext
Four Leading Indicators were included under the organizational context: Staffing Model, Continuous Improvement, Youth Governance, and Enrollment Policy. These four indicators reflect organizational level policies and practices. Scores are presented in Figure 2.
Figure 2 –Organizational Context Leading Indicators
5.00
4.00
3.00
2.00
1.00 Leading Indicator 1.1 -
Staffing Model
Leading Indicator 1.2 -
Continuous Improvement
Leading Indicator 1.3 -
Youth Governance
Leading Indicator 1.4 -
Enrollment Policy Indicato
r 2012-2013 Arkansas Aggregate (N=102) 2013-2014 Arkansas Aggregate (N=92) 2014-2015 Arkansas Aggregate (N=89)
Staffing Model assesses the degree to which project directors and site coordinators feel their staff is prepared for their jobs, their own ability to offer supports and resources to their staff, and the extent to which people feel like they enjoy their jobs. Overall, it appears that project directors and site coordinators feel their staff is prepared and all respondents are relatively satisfied with their job.
Continuous Improvement measures the extent to which staff participates in professional development opportunities and activities that are meant to increase the quality of the services they provide. It also measures how well staff communicates with their peers and supervisors regarding program quality. On average, staff are engaged in professional development opportunities, exhibit effective communication, and report using an assessment tool to measure program quality, however, the opportunity to observe/be observed by peers is less likely.
Youth Governance scores lower than Staffing Model and Continuous Improvement. It is important to note that questions related to this Leading Indicator were only asked of grantees who serve middle school and high school age youth (N=563), however average scores below a 3 on this measure suggest that, on average, less than half of students at Arkansas 21CCLC sites are given opportunities to participate in important decision-making roles.
Enrollment Policy is the lowest scoring Leading Indicator within organizational context, signaling that the intentional efforts to target low-income at-risk youth, a primary purpose of the 21st CCLC funding stream, could use improvement. It is also possible that the intent of this Leading Indicator is not clearly understood by respondents, which may require further specification for continuing data collection.
3 This value represents all Arkansas 21CCLC sites using the Youth PQA to assess quality practice.
Sco
re

2014-2015 Arkansas 21st CCLC Statewide Evaluation Report Page 24
4.40 4.29
4.47
4.36 4.29 4.29
LeadingIndicator1.1–StaffingModel
This Leading Indicator is meant to capture the degree to which staff are prepared for their position and have the necessary supports and resources to do their job effectively. Also, this Leading Indicator captures an overall sense of job satisfaction.
Figure 3 – Leading Indicator 1.1 Staffing Model: Scale Scores
Capacity
Job Satisfaction
1 2 3 4 5 Score
2014-2015 Arkansas Aggregate (N=89) 2013-2014 Arkansas Aggregate (N=92) 2012-2013 Arkansas Aggregate (N=102)
Table 10 – Capacity Scale Detailed Scores
PROMPT: Please rate the extent to which the following statements are true for staff in your program (1=Almost never true of staff, 3=True for about half of staff, 5=Almost always true of staff).
2012-2013 AR
Aggregate (N=102)
2013-2014 AR
Aggregate (N=92)
2014-2015 AR
Aggregate (N=89)
Capacity 4.47 4.29 4.40 Staff come to the program with adequate training or experience 4.44 4.18 4.22 Staff stay at our program for a long time 4.53 4.18 4.34 We have enough staff and/or student-to-staff ratios are good 4.75 4.70 4.69 New staff get an adequate orientation 4.40 4.19 4.28 Staff have enough time to attend meetings or do planning 4.23 4.06 4.28 Staff are designing and delivering activities consistent with program goals and objectives for students 4.45 4.45 4.58
Data Source: Project Director/Site Coordinator Survey
Table 11 – Job Satisfaction Scale Detailed Scores
PROMPT: Please rate the extent to which the following statements are true for you (1=Almost never true, 3=True about half of the time, 5=Almost always true).
2012-2013 AR
Aggregate (N=102)
2013-2014 AR
Aggregate (N=92)
2014-2015 AR
Aggregate (N=89)
Job Satisfaction 4.29 4.29 4.36 In most ways, this job is close to my ideal 4.20 4.20 4.27 The condition of my current job is excellent 4.40 4.39 4.41 I am satisfied with this job 4.48 4.45 4.53 If I could change my career so far, I would not change anything 4.09 4.10 4.22
Data Source: Project Director/Site Coordinator Survey & Direct Staff/Youth Worker Survey
Key Points: - Project directors and site coordinators report that they have enough staff and that these staff stay at the
program for a long time. Also, student-to-staff ratios are good - Respondents report an overall sense of job satisfaction.
Sca
le
2014-2015 Arkansas 21st CCLC Statewide Evaluation Report Page 25
3.42 3.33
3.38
3.67 3.51
3.58
4.16 4.03
4.03
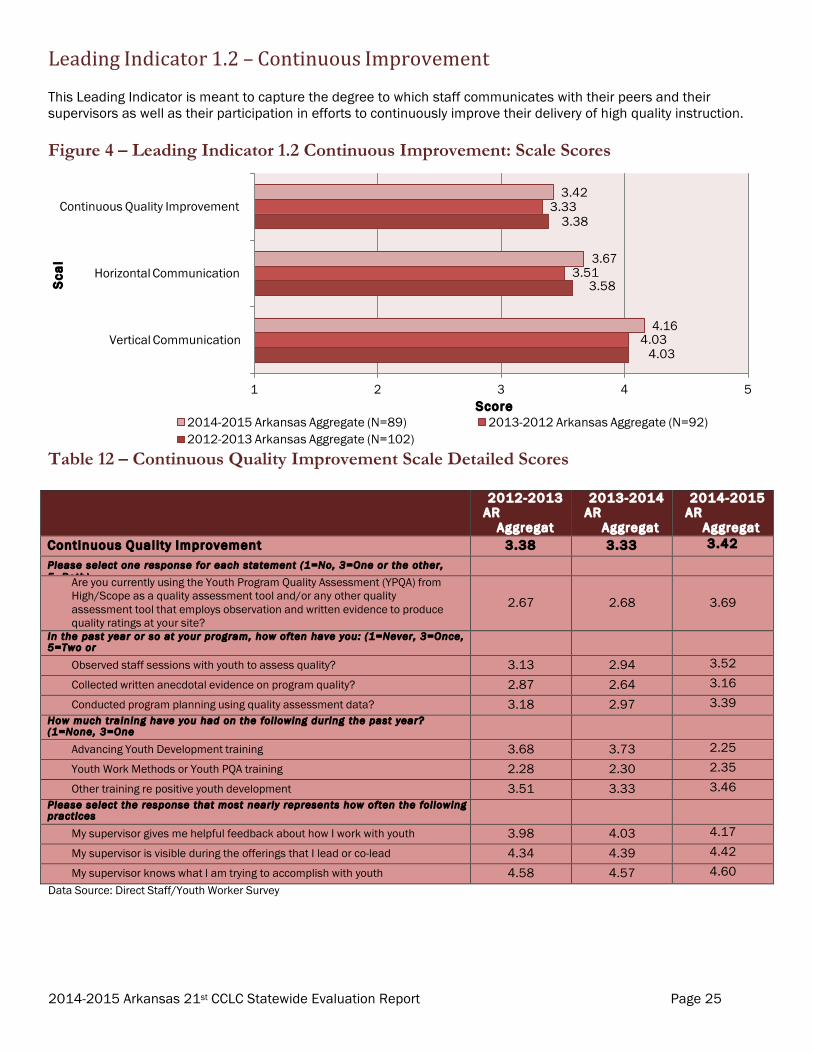
LeadingIndicator1.2–ContinuousImprovement
This Leading Indicator is meant to capture the degree to which staff communicates with their peers and their supervisors as well as their participation in efforts to continuously improve their delivery of high quality instruction.
Figure 4 – Leading Indicator 1.2 Continuous Improvement: Scale Scores
Continuous Quality Improvement
Horizontal Communication
Vertical Communication
1 2 3 4 5 Score
2014-2015 Arkansas Aggregate (N=89) 2013-2012 Arkansas Aggregate (N=92) 2012-2013 Arkansas Aggregate (N=102)
Table 12 – Continuous Quality Improvement Scale Detailed Scores 2012-2013
AR Aggregate (N=102)
2013-2014 AR
Aggregate (N=92)
2014-2015 AR
Aggregate (N=89)
Continuous Quality Improvement 3.38 3.33 3.42 Please select one response for each statement (1=No, 3=One or the other, 5=Both).
Are you currently using the Youth Program Quality Assessment (YPQA) from High/Scope as a quality assessment tool and/or any other quality assessment tool that employs observation and written evidence to produce quality ratings at your site?
2.67
2.68
3.69
In the past year or so at your program, how often have you: (1=Never, 3=Once, 5=Two or more times).
Observed staff sessions with youth to assess quality? 3.13 2.94 3.52 Collected written anecdotal evidence on program quality? 2.87 2.64 3.16 Conducted program planning using quality assessment data? 3.18 2.97 3.39
How much training have you had on the following during the past year? (1=None, 3=One day or less, 5=Two days or more)
Advancing Youth Development training 3.68 3.73 2.25 Youth Work Methods or Youth PQA training 2.28 2.30 2.35 Other training re positive youth development 3.51 3.33 3.46
Please select the response that most nearly represents how often the following practices occur in your program (1=Never, 3=Every few months, 5=At least weekly).
My supervisor gives me helpful feedback about how I work with youth 3.98 4.03 4.17 My supervisor is visible during the offerings that I lead or co-lead 4.34 4.39 4.42 My supervisor knows what I am trying to accomplish with youth 4.58 4.57 4.60
Data Source: Direct Staff/Youth Worker Survey
Sca
le

2014-2015 Arkansas 21st CCLC Statewide Evaluation Report Page 26
LeadingIndicator1.2–ContinuousImprovementcontinued
Table 13 – Horizontal Communication Scale Detailed Scores
PROMPT: Please select the response that most nearly represents how often the following practices occur in your program (1=Never, 3=Every few months, 5=At least weekly).
2012-2013 AR
Aggregate (N=102)
2013-2014 AR
Aggregate (N=92)
2014-2015 AR
Aggregate (N=89)
Horizontal Communication 3.58 3.51 3.67 I co-plan with another member of staff 3.88 3.74 3.89 I discuss teaching problems or practices with another staff member 4.30 4.17 4.25 A co-worker observes my session and offers feedback about my performance 3.30 3.25 3.45 I work on plans for program policies or activities with other staff 3.52 3.47 3.64 I observe a co-worker's session and provide feedback about their performance 2.88 2.89 3.10
Data Source: Direct Staff/Youth Worker Survey
Table 14 – Vertical Communication Scale Detailed Scores
PROMPT: Please select the response that most nearly represents how often the following practices occur in your program (1=Never, 3=Every few months, 5=At least weekly).
2012-2013 AR
Aggregate (N=102)
2013-2014 AR
Aggregate (N=92)
2014-2015 AR
Aggregate (N=89)
Vertical Communication 4.03 4.03 4.16 My supervisor challenges me to innovate and try new ideas 3.86 3.84 3.99 My supervisor makes sure that program goals and priorities are clear to me 4.20 4.22 4.32
Data Source: Direct Staff/Youth Worker Survey
Key Points: - Staff report that they typically use one type of quality assessment tool - either the PQA assessment tool
and/or other quality assessment tools. Staff report moderate involvement in a number of different professional development opportunities (typically one day or less). Staff also report that supervisors are present and available during program hours and know the goals of their staff.
- Staff report that they discuss teaching problems or practices with other staff members, but are less likely to have had experience observing their peers and providing feedback about their performance.
- Staff report they know the goals and priorities of the program and are sometimes able to be innovative in their work.
2014-2015 Arkansas 21st CCLC Statewide Evaluation Report Page 27
2.91
2.41
2.78
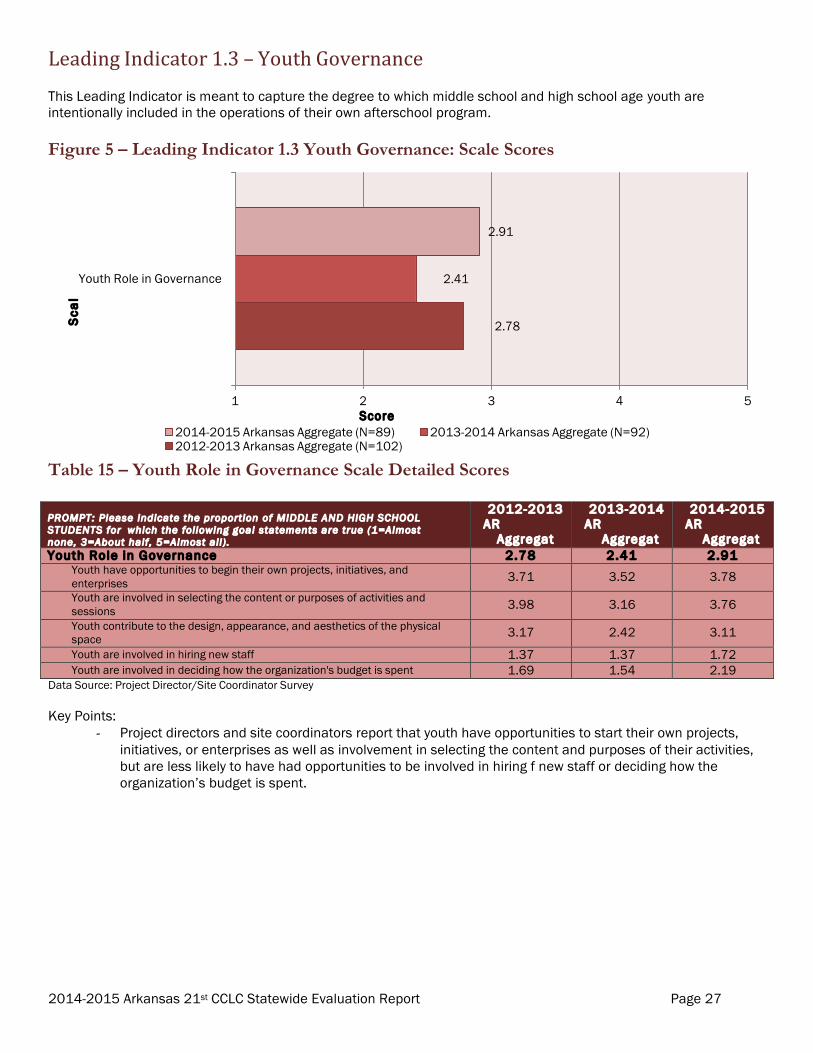
LeadingIndicator1.3–YouthGovernance
This Leading Indicator is meant to capture the degree to which middle school and high school age youth are intentionally included in the operations of their own afterschool program.
Figure 5 – Leading Indicator 1.3 Youth Governance: Scale Scores
Youth Role in Governance
1 2 Score
3 4 5
2014-2015 Arkansas Aggregate (N=89) 2013-2014 Arkansas Aggregate (N=92) 2012-2013 Arkansas Aggregate (N=102)
Table 15 – Youth Role in Governance Scale Detailed Scores
PROMPT: Please indicate the proportion of MIDDLE AND HIGH SCHOOL STUDENTS for which the following goal statements are true (1=Almost none, 3=About half, 5=Almost all) .
2012-2013 AR
Aggregate (N=102)
2013-2014 AR
Aggregate (N=92)
2014-2015 AR
Aggregate (N=89)
Youth Role in Governance 2.78 2.41 2.91 Youth have opportunities to begin their own projects, initiatives, and enterprises 3.71 3.52 3.78 Youth are involved in selecting the content or purposes of activities and sessions 3.98 3.16 3.76 Youth contribute to the design, appearance, and aesthetics of the physical space 3.17 2.42 3.11 Youth are involved in hiring new staff 1.37 1.37 1.72 Youth are involved in deciding how the organization's budget is spent 1.69 1.54 2.19
Data Source: Project Director/Site Coordinator Survey
Key Points: - Project directors and site coordinators report that youth have opportunities to start their own projects,
initiatives, or enterprises as well as involvement in selecting the content and purposes of their activities, but are less likely to have had opportunities to be involved in hiring f new staff or deciding how the organization’s budget is spent.
Sca
le
2014-2015 Arkansas 21st CCLC Statewide Evaluation Report Page 28
3.11
3.05
3.13
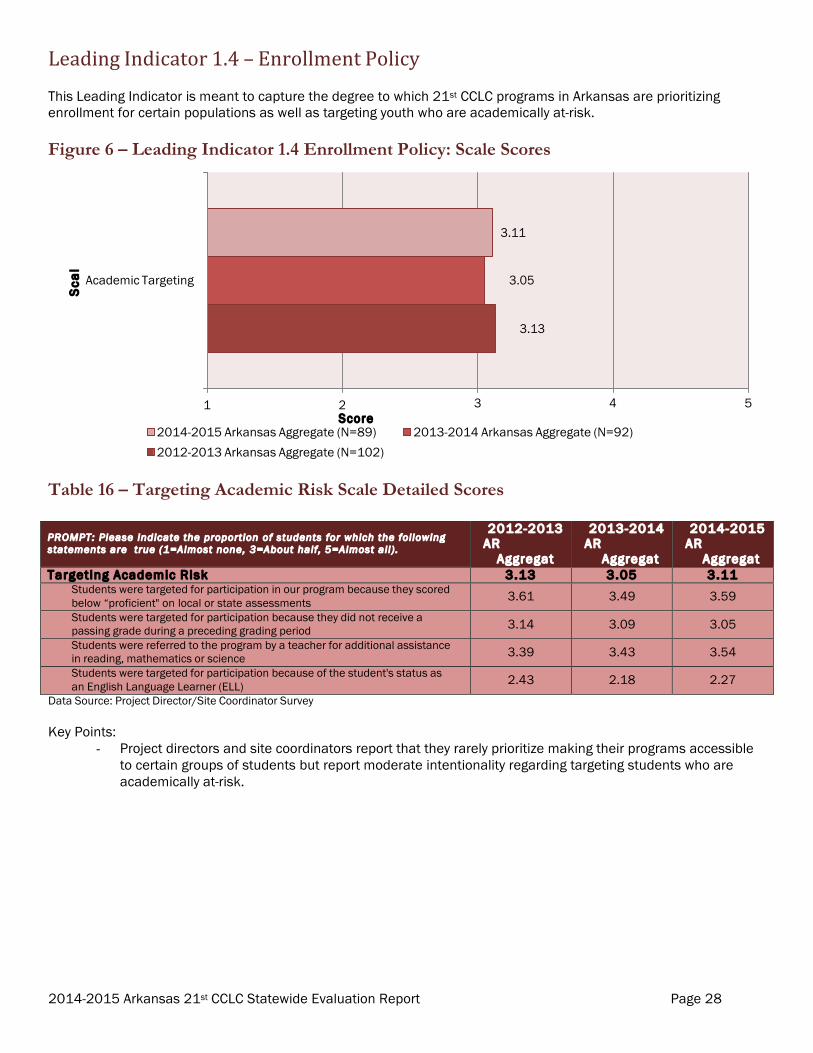
LeadingIndicator1.4–EnrollmentPolicy
This Leading Indicator is meant to capture the degree to which 21st CCLC programs in Arkansas are prioritizing enrollment for certain populations as well as targeting youth who are academically at-risk.
Figure 6 – Leading Indicator 1.4 Enrollment Policy: Scale Scores
Academic Targeting
1 2 Score
3 4 5
2014-2015 Arkansas Aggregate (N=89) 2013-2014 Arkansas Aggregate (N=92) 2012-2013 Arkansas Aggregate (N=102)
Table 16 – Targeting Academic Risk Scale Detailed Scores
PROMPT: Please indicate the proportion of students for which the following statements are true (1=Almost none, 3=About half, 5=Almost all) .
2012-2013 AR
Aggregate (N=102)
2013-2014 AR
Aggregate (N=92)
2014-2015 AR
Aggregate (N=89)
Targeting Academic Risk 3.13 3.05 3.11 Students were targeted for participation in our program because they scored below “proficient" on local or state assessments 3.61 3.49 3.59 Students were targeted for participation because they did not receive a passing grade during a preceding grading period 3.14 3.09 3.05 Students were referred to the program by a teacher for additional assistance in reading, mathematics or science 3.39 3.43 3.54 Students were targeted for participation because of the student's status as an English Language Learner (ELL) 2.43 2.18 2.27
Data Source: Project Director/Site Coordinator Survey
Key Points: - Project directors and site coordinators report that they rarely prioritize making their programs accessible
to certain groups of students but report moderate intentionality regarding targeting students who are academically at-risk.
Sca
le
2014-2015 Arkansas 21st CCLC Statewide Evaluation Report Page 29
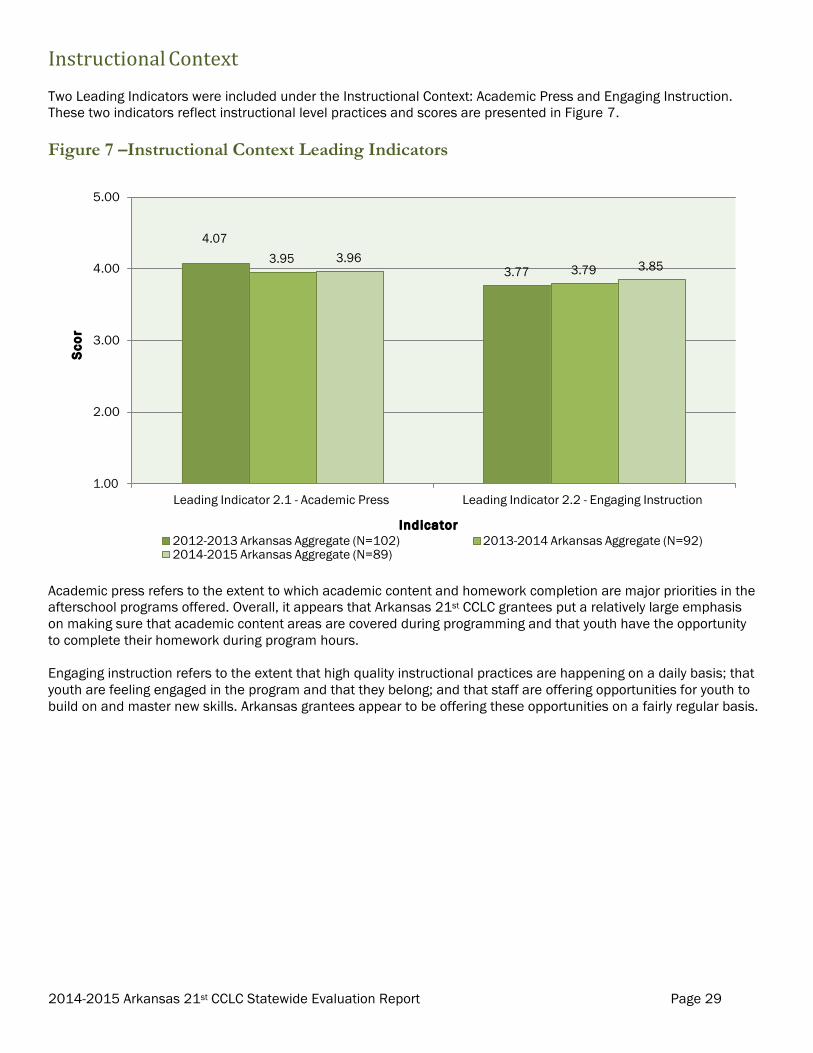
4.07 3.95 3.96
3.77 3.79 3.85
InstructionalContext
Two Leading Indicators were included under the Instructional Context: Academic Press and Engaging Instruction. These two indicators reflect instructional level practices and scores are presented in Figure 7.
Figure 7 –Instructional Context Leading Indicators
5.00
4.00
3.00
2.00
1.00 Leading Indicator 2.1 - Academic Press Leading Indicator 2.2 - Engaging Instruction
Indicator 2012-2013 Arkansas Aggregate (N=102) 2013-2014 Arkansas Aggregate (N=92) 2014-2015 Arkansas Aggregate (N=89)
Academic press refers to the extent to which academic content and homework completion are major priorities in the afterschool programs offered. Overall, it appears that Arkansas 21st CCLC grantees put a relatively large emphasis on making sure that academic content areas are covered during programming and that youth have the opportunity to complete their homework during program hours.
Engaging instruction refers to the extent that high quality instructional practices are happening on a daily basis; that youth are feeling engaged in the program and that they belong; and that staff are offering opportunities for youth to build on and master new skills. Arkansas grantees appear to be offering these opportunities on a fairly regular basis.
Sco
re
2014-2015 Arkansas 21st CCLC Statewide Evaluation Report Page 30
4.10
4.09
4.17
3.78
3.79
3.94
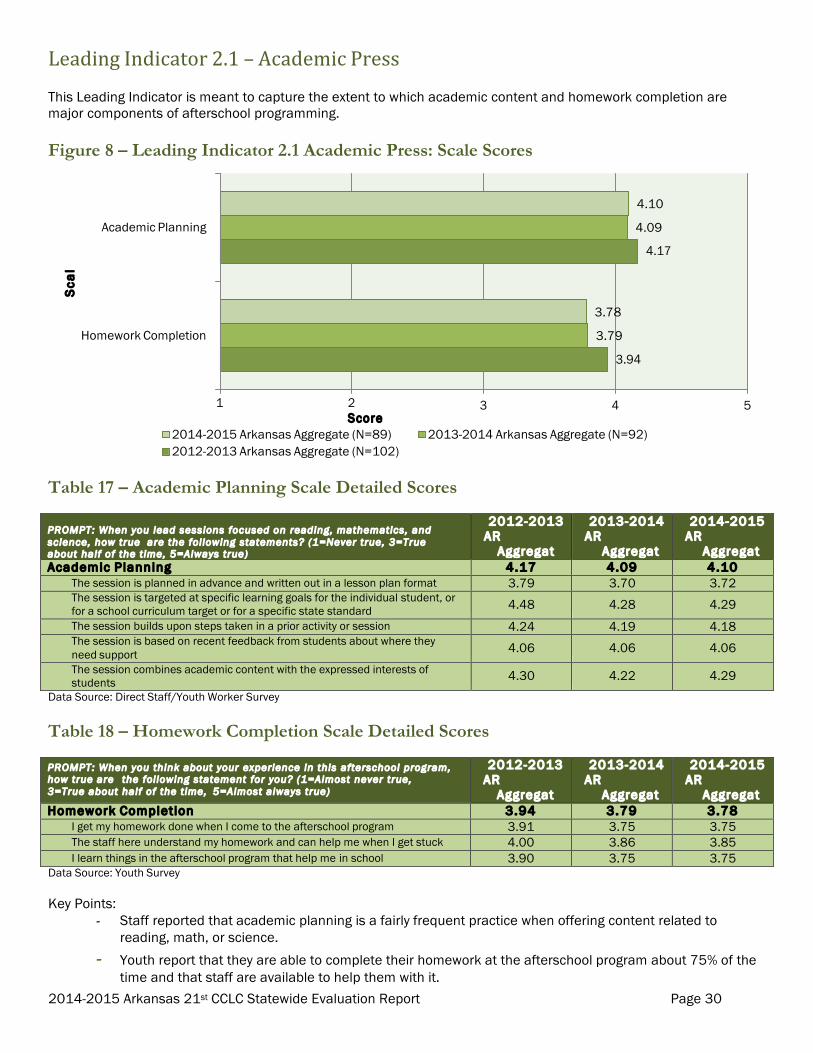
LeadingIndicator2.1–AcademicPress
This Leading Indicator is meant to capture the extent to which academic content and homework completion are major components of afterschool programming.
Figure 8 – Leading Indicator 2.1 Academic Press: Scale Scores
Academic Planning
Homework Completion
1 2 Score
3 4 5
2014-2015 Arkansas Aggregate (N=89) 2013-2014 Arkansas Aggregate (N=92) 2012-2013 Arkansas Aggregate (N=102)
Table 17 – Academic Planning Scale Detailed Scores
PROMPT: When you lead sessions focused on reading, mathematics, and science, how true are the following statements? (1=Never true, 3=True about half of the time, 5=Always true)
2012-2013 AR
Aggregate (N=102)
2013-2014 AR
Aggregate (N=92)
2014-2015 AR
Aggregate (N=89)
Academic Planning 4.17 4.09 4.10 The session is planned in advance and written out in a lesson plan format 3.79 3.70 3.72 The session is targeted at specific learning goals for the individual student, or for a school curriculum target or for a specific state standard 4.48 4.28 4.29 The session builds upon steps taken in a prior activity or session 4.24 4.19 4.18 The session is based on recent feedback from students about where they need support 4.06 4.06 4.06 The session combines academic content with the expressed interests of students 4.30 4.22 4.29
Data Source: Direct Staff/Youth Worker Survey
Table 18 – Homework Completion Scale Detailed Scores
PROMPT: When you think about your experience in this afterschool program, how true are the following statement for you? (1=Almost never true, 3=True about half of the time, 5=Almost always true)
2012-2013 AR
Aggregate (N=102)
2013-2014 AR
Aggregate (N=92)
2014-2015 AR
Aggregate (N=89)
Homework Completion 3.94 3.79 3.78 I get my homework done when I come to the afterschool program 3.91 3.75 3.75 The staff here understand my homework and can help me when I get stuck 4.00 3.86 3.85 I learn things in the afterschool program that help me in school 3.90 3.75 3.75
Data Source: Youth Survey
Key Points: - Staff reported that academic planning is a fairly frequent practice when offering content related to
reading, math, or science. - Youth report that they are able to complete their homework at the afterschool program about 75% of the
time and that staff are available to help them with it.
Sca
le
2014-2015 Arkansas 21st CCLC Statewide Evaluation Report Page 31
3.67 3.62
3.73
3.96 3.84 3.81
3.88 3.86
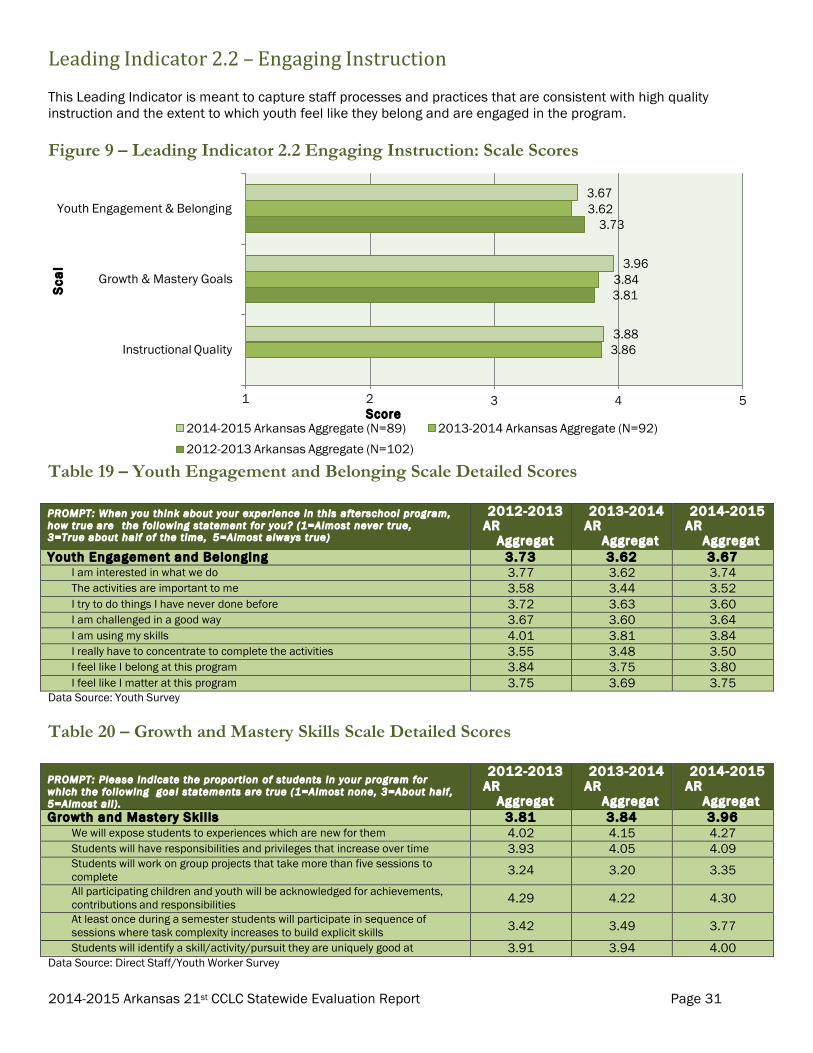
LeadingIndicator2.2–EngagingInstruction
This Leading Indicator is meant to capture staff processes and practices that are consistent with high quality instruction and the extent to which youth feel like they belong and are engaged in the program.
Figure 9 – Leading Indicator 2.2 Engaging Instruction: Scale Scores
Youth Engagement & Belonging
Growth & Mastery Goals
Instructional Quality
1 2 Score
3 4 5
2014-2015 Arkansas Aggregate (N=89) 2013-2014 Arkansas Aggregate (N=92) 2012-2013 Arkansas Aggregate (N=102)
Table 19 – Youth Engagement and Belonging Scale Detailed Scores
PROMPT: When you think about your experience in this afterschool program, how true are the following statement for you? (1=Almost never true, 3=True about half of the time, 5=Almost always true)
2012-2013 AR
Aggregate (N=102)
2013-2014 AR
Aggregate (N=92)
2014-2015 AR
Aggregate (N=89)
Youth Engagement and Belonging 3.73 3.62 3.67 I am interested in what we do 3.77 3.62 3.74 The activities are important to me 3.58 3.44 3.52 I try to do things I have never done before 3.72 3.63 3.60 I am challenged in a good way 3.67 3.60 3.64 I am using my skills 4.01 3.81 3.84 I really have to concentrate to complete the activities 3.55 3.48 3.50 I feel like I belong at this program 3.84 3.75 3.80 I feel like I matter at this program 3.75 3.69 3.75
Data Source: Youth Survey
Table 20 – Growth and Mastery Skills Scale Detailed Scores
PROMPT: Please indicate the proportion of students in your program for which the following goal statements are true (1=Almost none, 3=About half, 5=Almost all) .
2012-2013 AR
Aggregate (N=102)
2013-2014 AR
Aggregate (N=92)
2014-2015 AR
Aggregate (N=89)
Growth and Mastery Skil ls 3.81 3.84 3.96 We will expose students to experiences which are new for them 4.02 4.15 4.27 Students will have responsibilities and privileges that increase over time 3.93 4.05 4.09 Students will work on group projects that take more than five sessions to complete 3.24 3.20 3.35 All participating children and youth will be acknowledged for achievements, contributions and responsibilities 4.29 4.22 4.30 At least once during a semester students will participate in sequence of sessions where task complexity increases to build explicit skills 3.42 3.49 3.77 Students will identify a skill/activity/pursuit they are uniquely good at 3.91 3.94 4.00
Data Source: Direct Staff/Youth Worker Survey
Sca
le
2014-2015 Arkansas 21st CCLC Statewide Evaluation Report Page 32
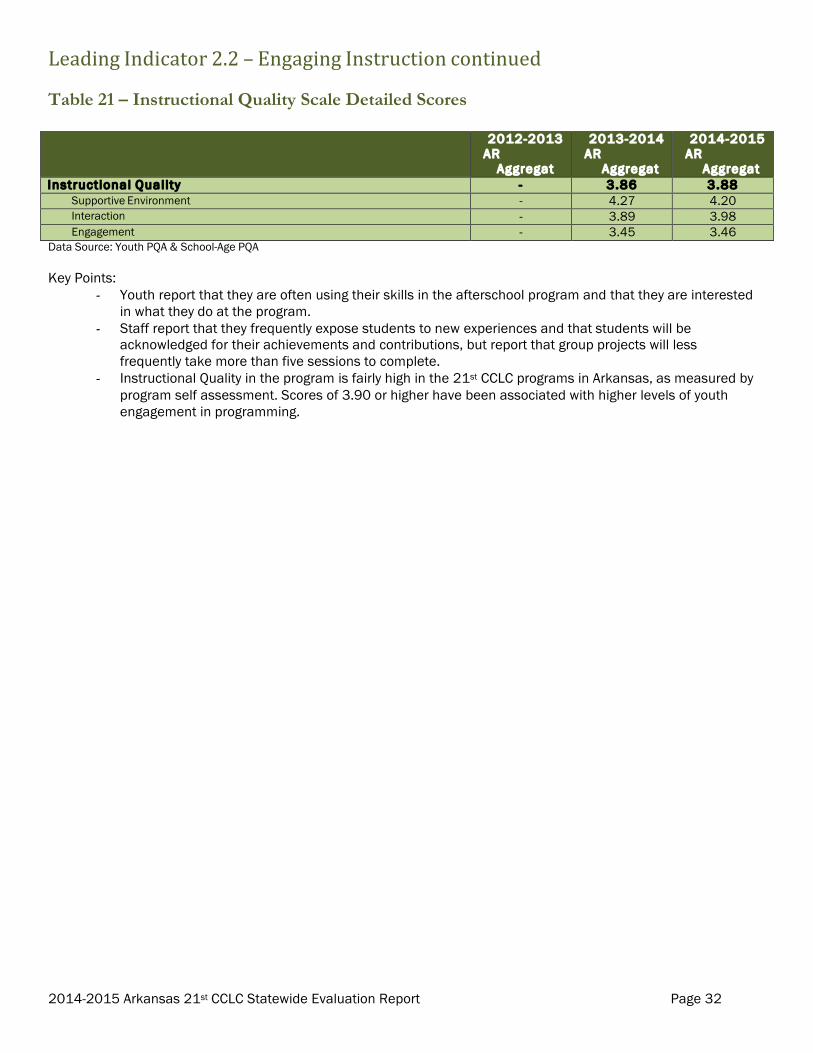
LeadingIndicator2.2–EngagingInstructioncontinued
Table 21 – Instructional Quality Scale Detailed Scores 2012-2013
AR Aggregate (N=102)
2013-2014 AR
Aggregate (N=92)
2014-2015 AR
Aggregate (N=89)
Instructional Quality - 3.86 3.88 Supportive Environment - 4.27 4.20 Interaction - 3.89 3.98 Engagement - 3.45 3.46
Data Source: Youth PQA & School-Age PQA
Key Points: - Youth report that they are often using their skills in the afterschool program and that they are interested
in what they do at the program. - Staff report that they frequently expose students to new experiences and that students will be
acknowledged for their achievements and contributions, but report that group projects will less frequently take more than five sessions to complete.
- Instructional Quality in the program is fairly high in the 21st CCLC programs in Arkansas, as measured by program self assessment. Scores of 3.90 or higher have been associated with higher levels of youth engagement in programming.
2014-2015 Arkansas 21st CCLC Statewide Evaluation Report Page 33
4.38 4.37 4.41
3.98 3.89 3.97
3.16 3.00 2.95 3.02
2.64 2.55
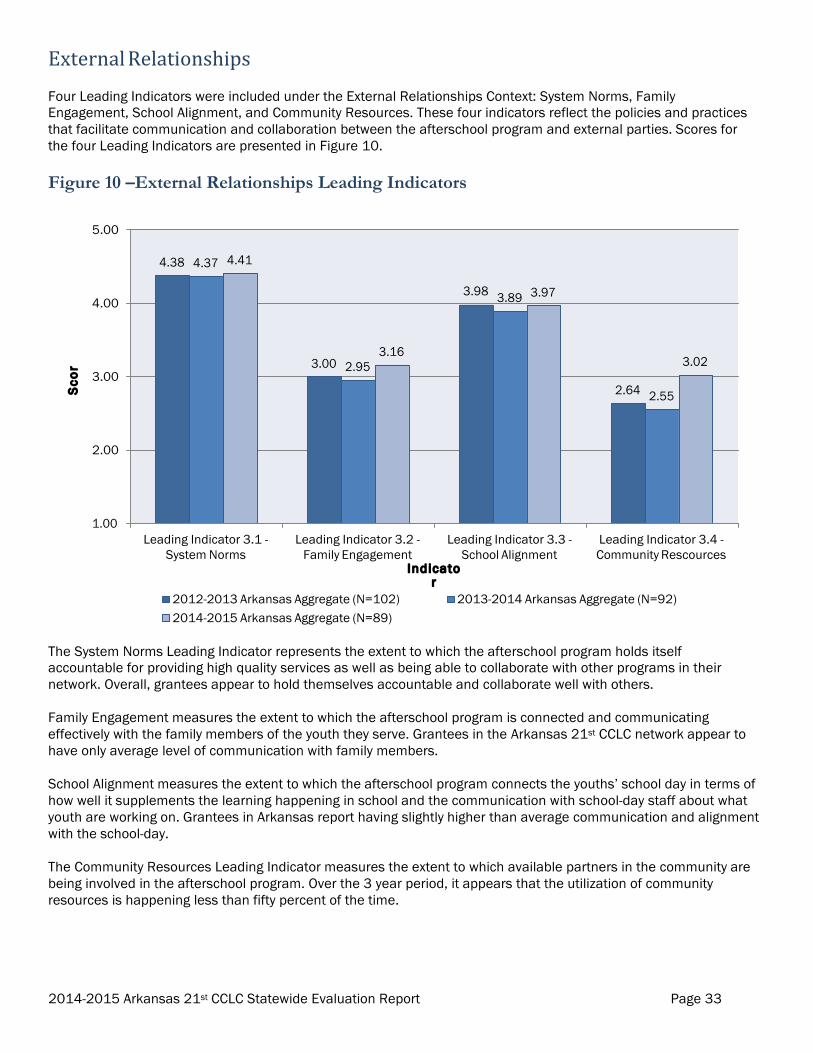
ExternalRelationships
Four Leading Indicators were included under the External Relationships Context: System Norms, Family Engagement, School Alignment, and Community Resources. These four indicators reflect the policies and practices that facilitate communication and collaboration between the afterschool program and external parties. Scores for the four Leading Indicators are presented in Figure 10.
Figure 10 –External Relationships Leading Indicators
5.00
4.00
3.00
2.00
1.00
Leading Indicator 3.1 - System Norms
Leading Indicator 3.2 - Family Engagement
Leading Indicator 3.3 - School Alignment
Leading Indicator 3.4 - Community Rescources
Indicator
2012-2013 Arkansas Aggregate (N=102) 2013-2014 Arkansas Aggregate (N=92) 2014-2015 Arkansas Aggregate (N=89)
The System Norms Leading Indicator represents the extent to which the afterschool program holds itself accountable for providing high quality services as well as being able to collaborate with other programs in their network. Overall, grantees appear to hold themselves accountable and collaborate well with others.
Family Engagement measures the extent to which the afterschool program is connected and communicating effectively with the family members of the youth they serve. Grantees in the Arkansas 21st CCLC network appear to have only average level of communication with family members.
School Alignment measures the extent to which the afterschool program connects the youths’ school day in terms of how well it supplements the learning happening in school and the communication with school-day staff about what youth are working on. Grantees in Arkansas report having slightly higher than average communication and alignment with the school-day.
The Community Resources Leading Indicator measures the extent to which available partners in the community are being involved in the afterschool program. Over the 3 year period, it appears that the utilization of community resources is happening less than fifty percent of the time.
Sco
re
2014-2015 Arkansas 21st CCLC Statewide Evaluation Report Page 34
4.53
4.42
4.47
4.29
4.32
4.28
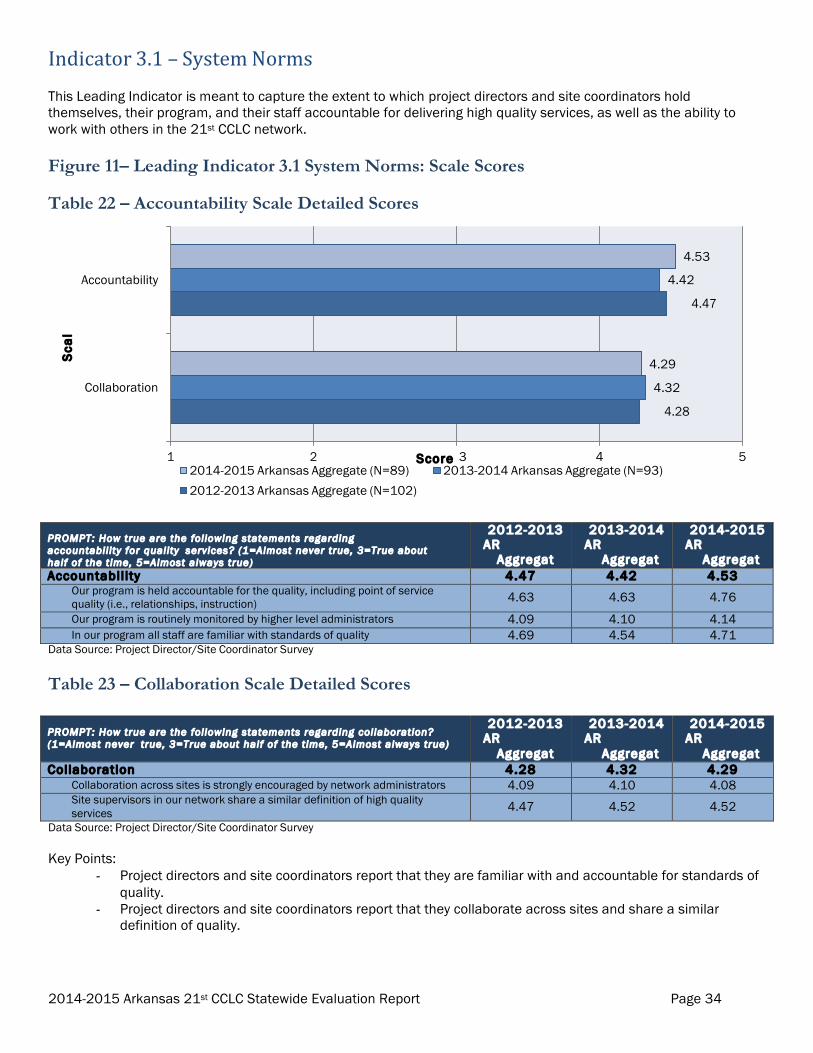
Indicator3.1–SystemNorms
This Leading Indicator is meant to capture the extent to which project directors and site coordinators hold themselves, their program, and their staff accountable for delivering high quality services, as well as the ability to work with others in the 21st CCLC network.
Figure 11– Leading Indicator 3.1 System Norms: Scale Scores
Table 22 – Accountability Scale Detailed Scores
Accountability
Collaboration
1 2 Score 3 4 5 2014-2015 Arkansas Aggregate (N=89) 2013-2014 Arkansas Aggregate (N=93) 2012-2013 Arkansas Aggregate (N=102)
Data Source: Project Director/Site Coordinator Survey
Table 23 – Collaboration Scale Detailed Scores
PROMPT: How true are the following statements regarding collaboration? (1=Almost never true, 3=True about half of the time, 5=Almost always true)
2012-2013 AR
Aggregate (N=102)
2013-2014 AR
Aggregate (N=92)
2014-2015 AR
Aggregate (N=89)
Collaboration 4.28 4.32 4.29 Collaboration across sites is strongly encouraged by network administrators 4.09 4.10 4.08 Site supervisors in our network share a similar definition of high quality services 4.47 4.52 4.52
Data Source: Project Director/Site Coordinator Survey
Key Points: - Project directors and site coordinators report that they are familiar with and accountable for standards of
quality. - Project directors and site coordinators report that they collaborate across sites and share a similar
definition of quality.
Sca
le
PROMPT: How true are the following statements regarding accountabil ity for quality services? (1=Almost never true, 3=True about half of the time, 5=Almost always true)
2012-2013 AR
Aggregate (N=102)
2013-2014 AR
Aggregate (N=92)
2014-2015 AR
Aggregate (N=89)
Accountabil i ty 4.47 4.42 4.53 Our program is held accountable for the quality, including point of service quality (i.e., relationships, instruction) 4.63 4.63 4.76 Our program is routinely monitored by higher level administrators 4.09 4.10 4.14 In our program all staff are familiar with standards of quality 4.69 4.54 4.71
2014-2015 Arkansas 21st CCLC Statewide Evaluation Report Page 35
3.16
2.95
3.00
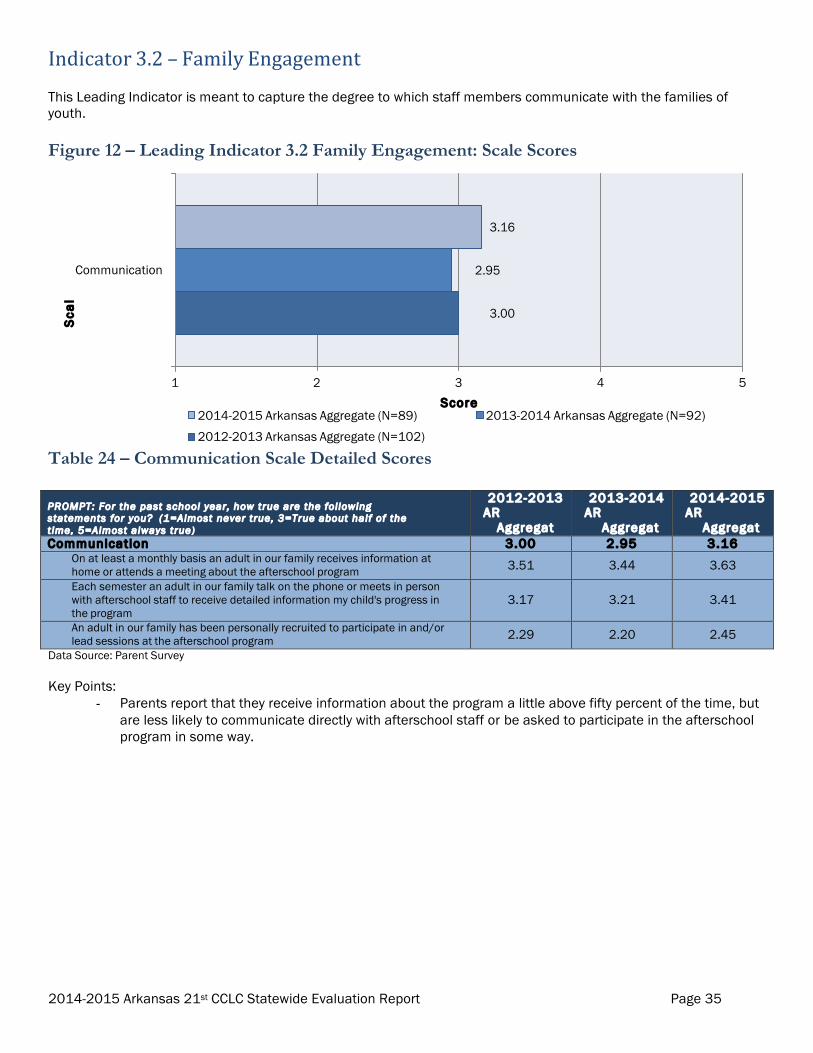
Indicator3.2–FamilyEngagement
This Leading Indicator is meant to capture the degree to which staff members communicate with the families of youth.
Figure 12 – Leading Indicator 3.2 Family Engagement: Scale Scores
Communication
1 2 3 4 5 Score
2014-2015 Arkansas Aggregate (N=89) 2013-2014 Arkansas Aggregate (N=92)
2012-2013 Arkansas Aggregate (N=102)
Table 24 – Communication Scale Detailed Scores
PROMPT: For the past school year, how true are the following statements for you? (1=Almost never true, 3=True about half of the time, 5=Almost always true)
2012-2013 AR
Aggregate (N=102)
2013-2014 AR
Aggregate (N=92)
2014-2015 AR
Aggregate (N=89)
Communication 3.00 2.95 3.16 On at least a monthly basis an adult in our family receives information at home or attends a meeting about the afterschool program 3.51 3.44 3.63 Each semester an adult in our family talk on the phone or meets in person with afterschool staff to receive detailed information my child's progress in the program
3.17 3.21 3.41
An adult in our family has been personally recruited to participate in and/or lead sessions at the afterschool program 2.29 2.20 2.45
Data Source: Parent Survey
Key Points: - Parents report that they receive information about the program a little above fifty percent of the time, but
are less likely to communicate directly with afterschool staff or be asked to participate in the afterschool program in some way.
Sca
le
2014-2015 Arkansas 21st CCLC Statewide Evaluation Report Page 36
4.24
4.20
4.24
3.70
3.58
3.72
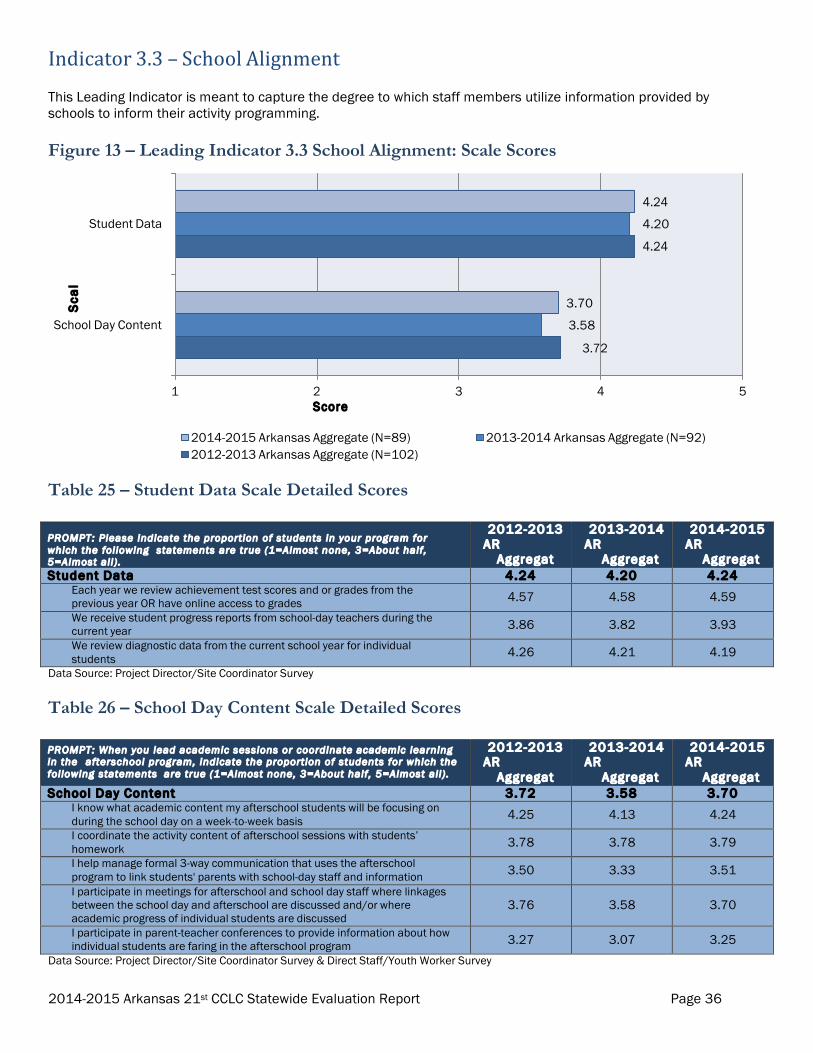
Indicator3.3–SchoolAlignment
This Leading Indicator is meant to capture the degree to which staff members utilize information provided by schools to inform their activity programming.
Figure 13 – Leading Indicator 3.3 School Alignment: Scale Scores
Student Data
School Day Content
1 2 Score
3 4 5
2014-2015 Arkansas Aggregate (N=89) 2013-2014 Arkansas Aggregate (N=92) 2012-2013 Arkansas Aggregate (N=102)
Table 25 – Student Data Scale Detailed Scores
PROMPT: Please indicate the proportion of students in your program for which the following statements are true (1=Almost none, 3=About half, 5=Almost all) .
2012-2013 AR
Aggregate (N=102)
2013-2014 AR
Aggregate (N=92)
2014-2015 AR
Aggregate (N=89)
Student Data 4.24 4.20 4.24 Each year we review achievement test scores and or grades from the previous year OR have online access to grades 4.57 4.58 4.59 We receive student progress reports from school-day teachers during the current year 3.86 3.82 3.93 We review diagnostic data from the current school year for individual students 4.26 4.21 4.19
Data Source: Project Director/Site Coordinator Survey
Table 26 – School Day Content Scale Detailed Scores
PROMPT: When you lead academic sessions or coordinate academic learning in the afterschool program, indicate the proportion of students for which the following statements are true (1=Almost none, 3=About half, 5=Almost all) .
2012-2013 AR
Aggregate (N=102)
2013-2014 AR
Aggregate (N=92)
2014-2015 AR
Aggregate (N=89)
School Day Content 3.72 3.58 3.70 I know what academic content my afterschool students will be focusing on during the school day on a week-to-week basis 4.25 4.13 4.24 I coordinate the activity content of afterschool sessions with students’ homework 3.78 3.78 3.79 I help manage formal 3-way communication that uses the afterschool program to link students' parents with school-day staff and information 3.50 3.33 3.51 I participate in meetings for afterschool and school day staff where linkages between the school day and afterschool are discussed and/or where academic progress of individual students are discussed
3.76 3.58 3.70
I participate in parent-teacher conferences to provide information about how individual students are faring in the afterschool program 3.27 3.07 3.25
Data Source: Project Director/Site Coordinator Survey & Direct Staff/Youth Worker Survey
Sca
le
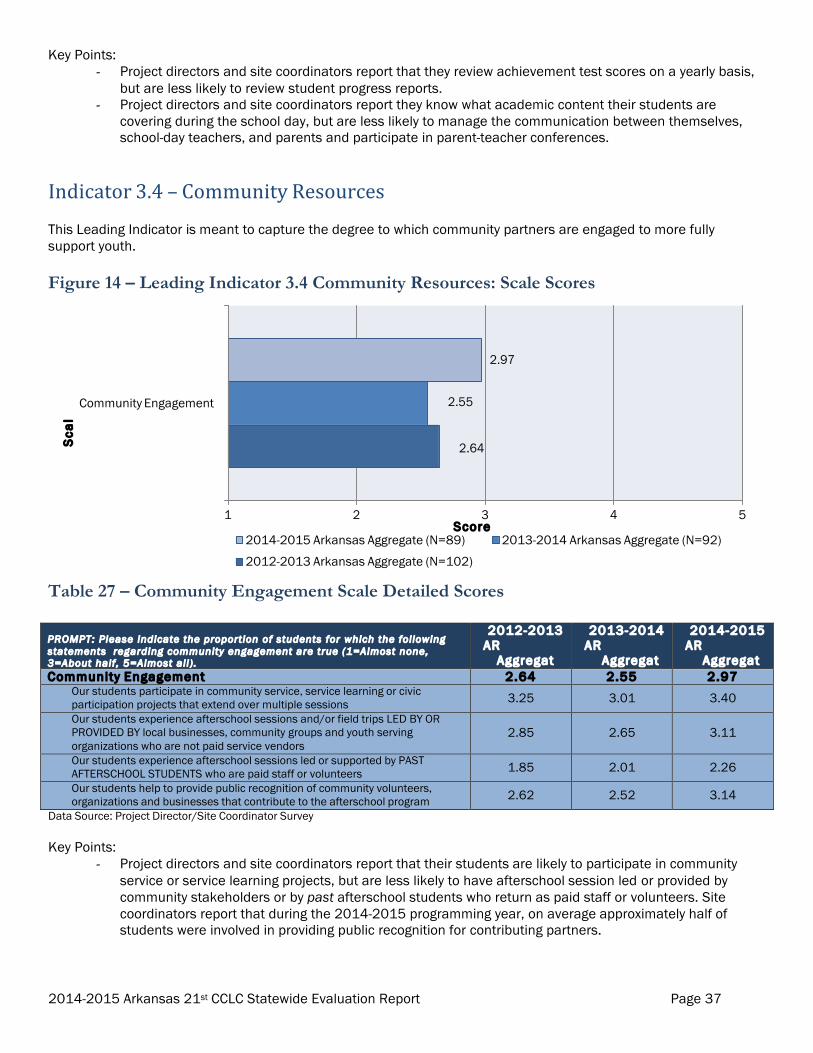
2014-2015 Arkansas 21st CCLC Statewide Evaluation Report Page 37
2.97
2.55
2.64
Key Points: - Project directors and site coordinators report that they review achievement test scores on a yearly basis,
but are less likely to review student progress reports. - Project directors and site coordinators report they know what academic content their students are
covering during the school day, but are less likely to manage the communication between themselves, school-day teachers, and parents and participate in parent-teacher conferences.
Indicator3.4–CommunityResources
This Leading Indicator is meant to capture the degree to which community partners are engaged to more fully support youth.
Figure 14 – Leading Indicator 3.4 Community Resources: Scale Scores
Community Engagement
1 2 3 4 5 Score
2014-2015 Arkansas Aggregate (N=89) 2013-2014 Arkansas Aggregate (N=92)
2012-2013 Arkansas Aggregate (N=102)
Table 27 – Community Engagement Scale Detailed Scores
PROMPT: Please indicate the proportion of students for which the following statements regarding community engagement are true (1=Almost none, 3=About half, 5=Almost all) .
2012-2013 AR
Aggregate (N=102)
2013-2014 AR
Aggregate (N=92)
2014-2015 AR
Aggregate (N=89)
Community Engagement 2.64 2.55 2.97 Our students participate in community service, service learning or civic participation projects that extend over multiple sessions 3.25 3.01 3.40 Our students experience afterschool sessions and/or field trips LED BY OR PROVIDED BY local businesses, community groups and youth serving organizations who are not paid service vendors
2.85 2.65 3.11
Our students experience afterschool sessions led or supported by PAST AFTERSCHOOL STUDENTS who are paid staff or volunteers 1.85 2.01 2.26 Our students help to provide public recognition of community volunteers, organizations and businesses that contribute to the afterschool program 2.62 2.52 3.14
Data Source: Project Director/Site Coordinator Survey
Key Points: - Project directors and site coordinators report that their students are likely to participate in community
service or service learning projects, but are less likely to have afterschool session led or provided by community stakeholders or by past afterschool students who return as paid staff or volunteers. Site coordinators report that during the 2014-2015 programming year, on average approximately half of students were involved in providing public recognition for contributing partners.
Sca
le

2014-2015 Arkansas 21st CCLC Statewide Evaluation Report Page 38
4.06 4.05 4.06 4.03 4.16
4.01
YouthCharacteristics
Two Leading Indicators were included under the Youth Characteristics Context: Socioemotional Development and Academic Efficacy. These two indicators reflect the characteristics of the youth who attend the afterschool programs and are reported by the youth themselves or their parents. Scores for the two Leading Indicators are presented in Figure 15.
Figure 15 –Student Characteristics Leading Indicators
5.00
4.00
3.00
2.00
1.00
Leading Indicator 4.1 - Socioemotional Development Leading Indicator 4.2 - Academic Efficacy Indicator
2012-2013 Arkansas Aggregate (N=102) 2013-2014 Arkansas Aggregate (N=92)
2014-2015 Arkansas Aggregate (N=89)
The Socioemotional Development Leading Indicator measures the extent to which youth feel they are competent and able to work with others. Overall, the youth in this sample report that they feel relatively competent socially and emotionally.
Academic Efficacy measures the extent to which youth feel they are good at different academic content areas. Youth report high levels of academic efficacy overall, while parents report that the afterschool program has helped their child(ren) in both work habits and academic skills.
Sco
re
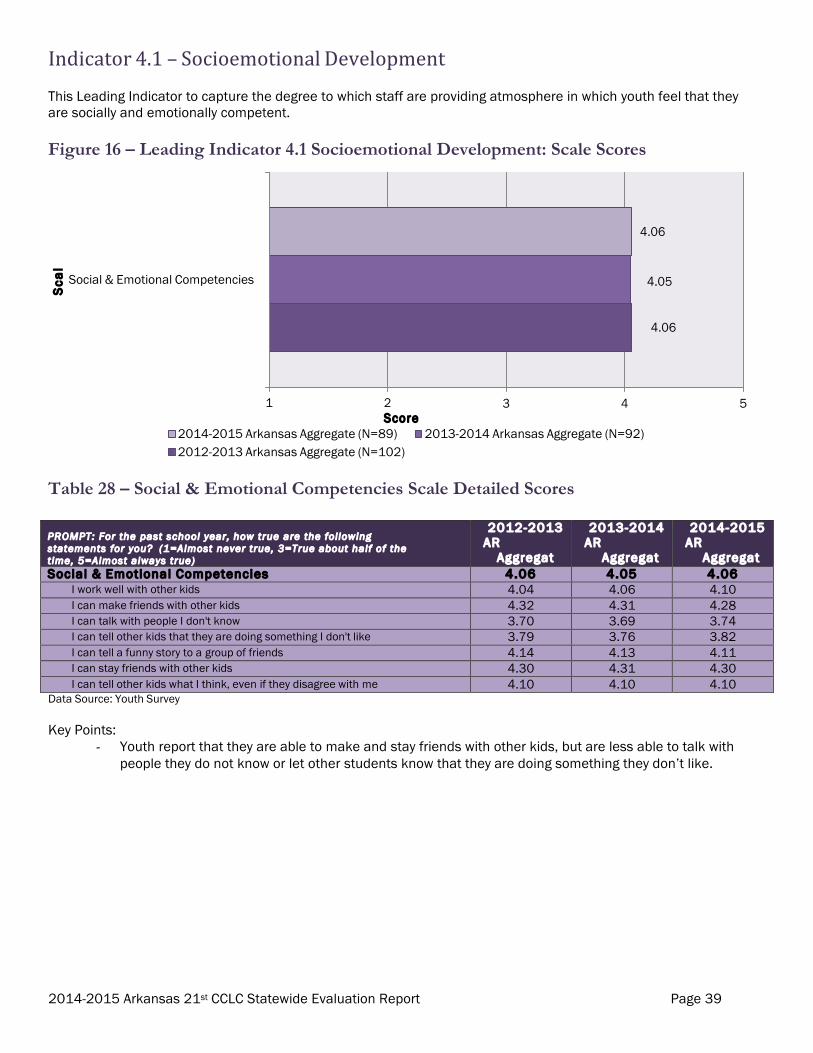
2014-2015 Arkansas 21st CCLC Statewide Evaluation Report Page 39
4.06
4.05
4.06
Indicator4.1–SocioemotionalDevelopment
This Leading Indicator to capture the degree to which staff are providing atmosphere in which youth feel that they are socially and emotionally competent.
Figure 16 – Leading Indicator 4.1 Socioemotional Development: Scale Scores
Social & Emotional Competencies
1 2 Score
3 4 5
2014-2015 Arkansas Aggregate (N=89) 2013-2014 Arkansas Aggregate (N=92) 2012-2013 Arkansas Aggregate (N=102)
Table 28 – Social & Emotional Competencies Scale Detailed Scores
PROMPT: For the past school year, how true are the following statements for you? (1=Almost never true, 3=True about half of the time, 5=Almost always true)
2012-2013 AR
Aggregate (N=102)
2013-2014 AR
Aggregate (N=92)
2014-2015 AR
Aggregate (N=89)
Social & Emotional Competencies 4.06 4.05 4.06 I work well with other kids 4.04 4.06 4.10 I can make friends with other kids 4.32 4.31 4.28 I can talk with people I don't know 3.70 3.69 3.74 I can tell other kids that they are doing something I don't like 3.79 3.76 3.82 I can tell a funny story to a group of friends 4.14 4.13 4.11 I can stay friends with other kids 4.30 4.31 4.30 I can tell other kids what I think, even if they disagree with me 4.10 4.10 4.10
Data Source: Youth Survey
Key Points: - Youth report that they are able to make and stay friends with other kids, but are less able to talk with
people they do not know or let other students know that they are doing something they don’t like.
Sca
le
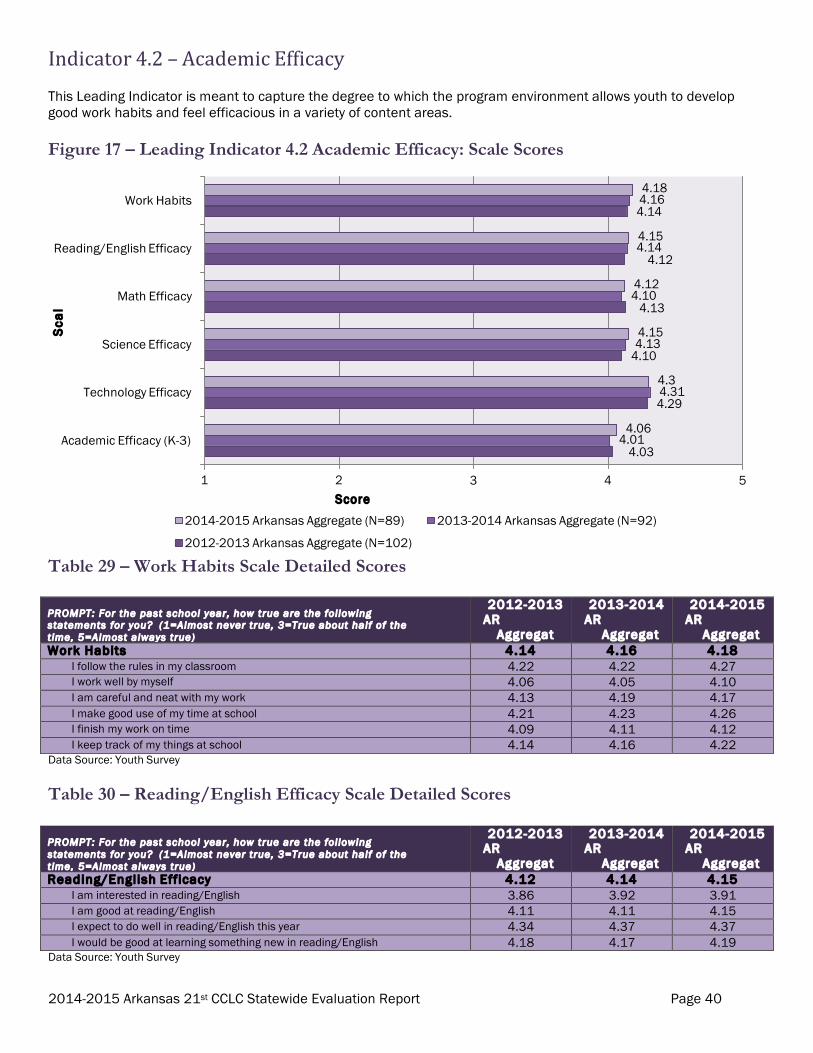
2014-2015 Arkansas 21st CCLC Statewide Evaluation Report Page 40
4.18 4.16 4.14
4.15 4.14
4.12
4.12 4.10
4.13
4.15 4.13
4.10
4.3 4.31 4.29
4.06 4.01
4.03
Indicator4.2–AcademicEfficacy
This Leading Indicator is meant to capture the degree to which the program environment allows youth to develop good work habits and feel efficacious in a variety of content areas.
Figure 17 – Leading Indicator 4.2 Academic Efficacy: Scale Scores
Work Habits
Reading/English Efficacy
Math Efficacy
Science Efficacy
Technology Efficacy
Academic Efficacy (K-3)
1 2 Score
3 4 5
2014-2015 Arkansas Aggregate (N=89) 2013-2014 Arkansas Aggregate (N=92)
2012-2013 Arkansas Aggregate (N=102)
Table 29 – Work Habits Scale Detailed Scores
PROMPT: For the past school year, how true are the following statements for you? (1=Almost never true, 3=True about half of the time, 5=Almost always true)
2012-2013 AR
Aggregate (N=102)
2013-2014 AR
Aggregate (N=92)
2014-2015 AR
Aggregate (N=89)
Work Habits 4.14 4.16 4.18 I follow the rules in my classroom 4.22 4.22 4.27 I work well by myself 4.06 4.05 4.10 I am careful and neat with my work 4.13 4.19 4.17 I make good use of my time at school 4.21 4.23 4.26 I finish my work on time 4.09 4.11 4.12 I keep track of my things at school 4.14 4.16 4.22
Data Source: Youth Survey
Table 30 – Reading/English Efficacy Scale Detailed Scores
PROMPT: For the past school year, how true are the following statements for you? (1=Almost never true, 3=True about half of the time, 5=Almost always true)
2012-2013 AR
Aggregate (N=102)
2013-2014 AR
Aggregate (N=92)
2014-2015 AR
Aggregate (N=89)
Reading/English Efficacy 4.12 4.14 4.15 I am interested in reading/English 3.86 3.92 3.91 I am good at reading/English 4.11 4.11 4.15 I expect to do well in reading/English this year 4.34 4.37 4.37 I would be good at learning something new in reading/English 4.18 4.17 4.19
Data Source: Youth Survey
Sca
le
2014-2015 Arkansas 21st CCLC Statewide Evaluation Report Page 41
Indicator4.2–AcademicEfficacycontinued
Table 31 – Math Efficacy Scale Detailed Scores
PROMPT: For the past school year, how true are the following statements for you? (1=Almost never true, 3=True about half of the time, 5=Almost always true)
2012-2013 AR
Aggregate (N=102)
2013-2014 AR
Aggregate (N=92)
2014-2015 AR
Aggregate (N=89)
Math Eff icacy 4.13 4.10 4.12 I am interested in math 3.97 3.94 3.98 I am good at math 3.99 3.99 4.01 I expect to do well in math this year 4.35 4.33 4.33 I would be good at learning something new in math 4.21 4.15 4.18
Data Source: Youth Survey
Table 32 – Science Efficacy Scale Detailed Scores
PROMPT: For the past school year, how true are the following statements for you? (1=Almost never true, 3=True about half of the time, 5=Almost always true)
2012-2013 AR
Aggregate (N=102)
2013-2014 AR
Aggregate (N=92)
2014-2015 AR
Aggregate (N=89)
Science Eff icacy 4.29 4.13 4.15 I am interested in science 4.28 4.09 4.11 I would be good at learning something new in science 4.31 4.17 4.20
Data Source: Youth Survey
Table 33 – Technology Efficacy Scale Detailed Scores
PROMPT: For the past school year, how true are the following statements for you? (1=Almost never true, 3=True about half of the time, 5=Almost always true)
2012-2013 AR
Aggregate (N=102)
2013-2014 AR
Aggregate (N=92)
2014-2015 AR
Aggregate (N=89)
Technology Eff icacy 4.29 4.32 4.30 I am interested in technology (computers, robotics, internet design) 4.28 4.32 4.32 I would be good at learning something new in technology 4.31 4.32 4.29
Data Source: Youth Survey
Table 34 – Academic Efficacy Scale Detailed Scores
PROMPT: For the past school year, how true are the following statements for your child? (1=Almost never true, 3=True about half of the time, 5=Almost always true)
2012-2013 AR
Aggregate (N=102)
2013-2014 AR
Aggregate (N=92)
2014-2015 AR
Aggregate (N=89)
Academic Eff icacy 4.03 4.01 4.06 As a result of participating in the afterschool program this year my child has developed better work habits 4.07 4.06 4.12 As a result of participating in the afterschool program this year my child has developed more confidence in math 4.00 4.00 4.02 As a result of participating in the afterschool program this year my child has developed more confidence in reading/English 4.03 4.02 4.07 As a result of participating in the afterschool program this year my child has developed more confidence in science and/or technology 4.01 3.96 4.01
Data Source: Parent Survey
Key Points: - Youth report they have good work habits. - Youth report they feel more efficacious in math and technology than in reading and science and have the
least amount of interest in reading/English. - Parents report that the afterschool program has helped their child(ren) develop better work habits as
well as confidence in all subject areas noted.
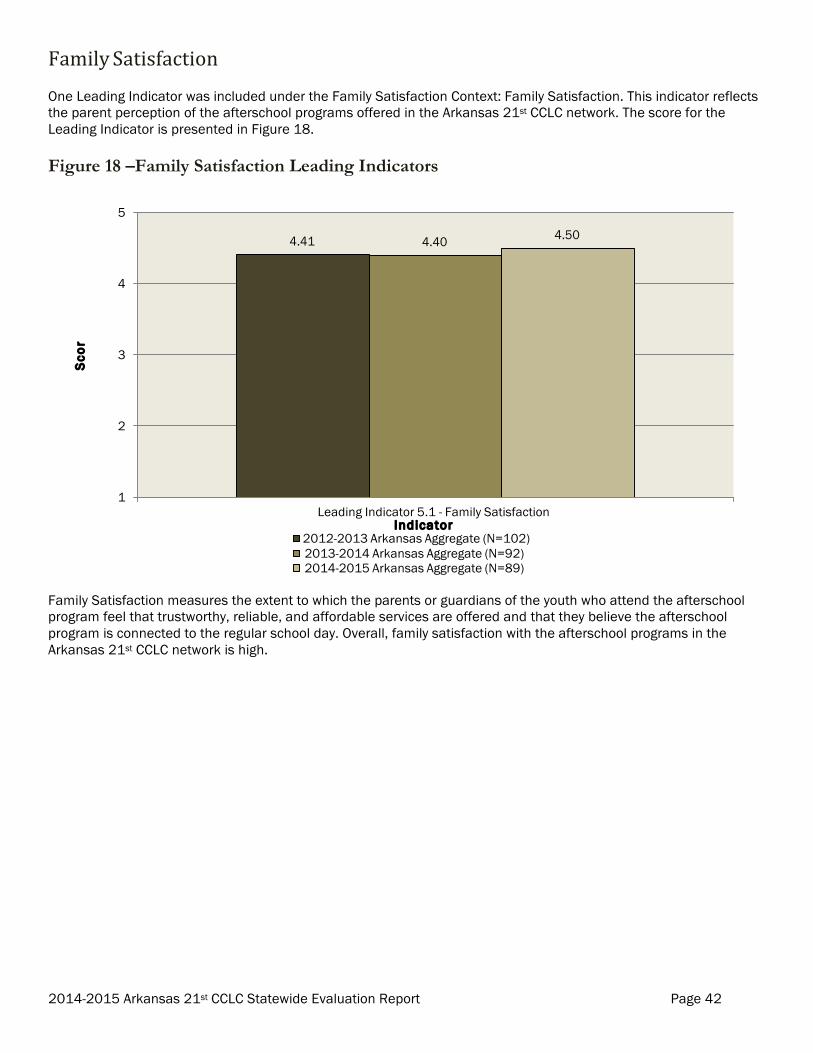
2014-2015 Arkansas 21st CCLC Statewide Evaluation Report Page 42
4.41 4.40 4.50
FamilySatisfaction
One Leading Indicator was included under the Family Satisfaction Context: Family Satisfaction. This indicator reflects the parent perception of the afterschool programs offered in the Arkansas 21st CCLC network. The score for the Leading Indicator is presented in Figure 18.
Figure 18 –Family Satisfaction Leading Indicators
5
4
3
2
1 Leading Indicator 5.1 - Family Satisfaction
Indicator 2012-2013 Arkansas Aggregate (N=102) 2013-2014 Arkansas Aggregate (N=92) 2014-2015 Arkansas Aggregate (N=89)
Family Satisfaction measures the extent to which the parents or guardians of the youth who attend the afterschool program feel that trustworthy, reliable, and affordable services are offered and that they believe the afterschool program is connected to the regular school day. Overall, family satisfaction with the afterschool programs in the Arkansas 21st CCLC network is high.
Sco
re
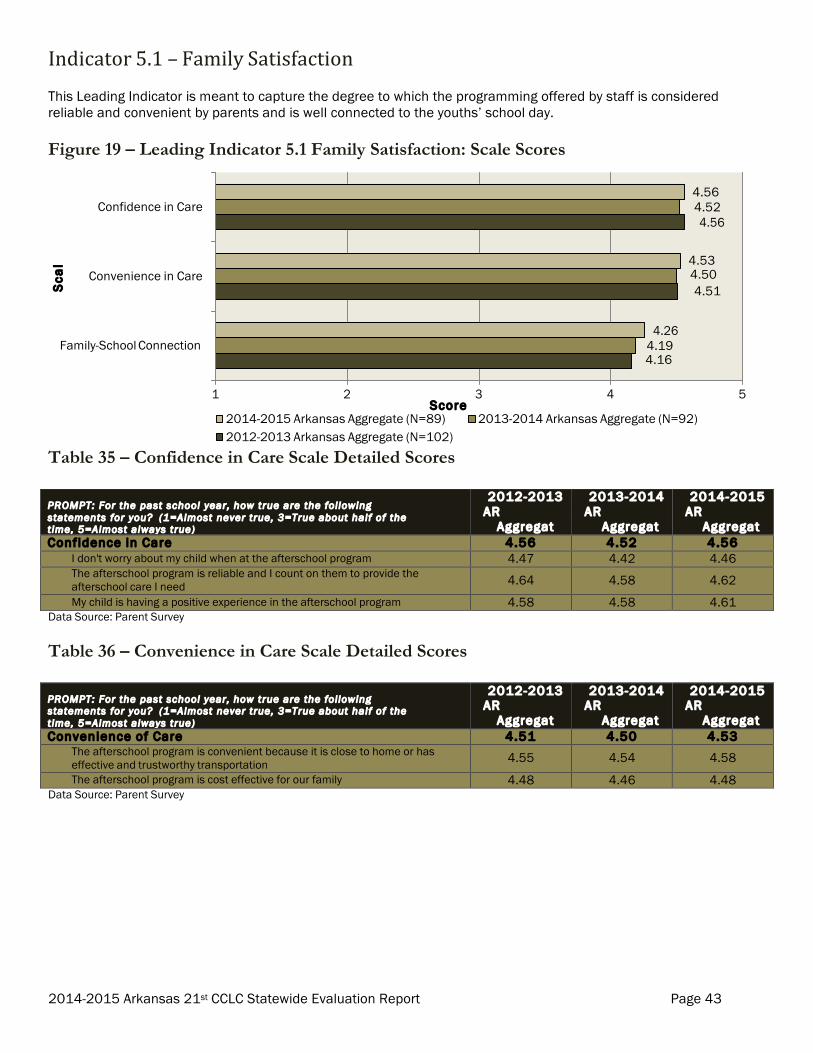
2014-2015 Arkansas 21st CCLC Statewide Evaluation Report Page 43
4.56 4.52 4.56
4.53 4.50 4.51
4.26 4.19 4.16
Indicator5.1–FamilySatisfaction
This Leading Indicator is meant to capture the degree to which the programming offered by staff is considered reliable and convenient by parents and is well connected to the youths’ school day.
Figure 19 – Leading Indicator 5.1 Family Satisfaction: Scale Scores
Confidence in Care
Convenience in Care
Family-School Connection
1 2 3 4 5 Score
2014-2015 Arkansas Aggregate (N=89) 2013-2014 Arkansas Aggregate (N=92) 2012-2013 Arkansas Aggregate (N=102)
Table 35 – Confidence in Care Scale Detailed Scores
PROMPT: For the past school year, how true are the following statements for you? (1=Almost never true, 3=True about half of the time, 5=Almost always true)
2012-2013 AR
Aggregate (N=102)
2013-2014 AR
Aggregate (N=92)
2014-2015 AR
Aggregate (N=89)
Confidence in Care 4.56 4.52 4.56 I don't worry about my child when at the afterschool program 4.47 4.42 4.46 The afterschool program is reliable and I count on them to provide the afterschool care I need 4.64 4.58 4.62 My child is having a positive experience in the afterschool program 4.58 4.58 4.61
Data Source: Parent Survey
Table 36 – Convenience in Care Scale Detailed Scores
PROMPT: For the past school year, how true are the following statements for you? (1=Almost never true, 3=True about half of the time, 5=Almost always true)
2012-2013 AR
Aggregate (N=102)
2013-2014 AR
Aggregate (N=92)
2014-2015 AR
Aggregate (N=89)
Convenience of Care 4.51 4.50 4.53 The afterschool program is convenient because it is close to home or has effective and trustworthy transportation 4.55 4.54 4.58 The afterschool program is cost effective for our family 4.48 4.46 4.48
Data Source: Parent Survey
Sca
le

2014-2015 Arkansas 21st CCLC Statewide Evaluation Report Page 44
Indicator5.1–FamilySatisfactioncontinued
Table 37 – Family-School Connection Scale Detailed Scores
PROMPT: For the past school year, how true are the following statements for you? (1=Almost never true, 3=True about half of the time, 5=Almost always true)
2012-2013 AR
Aggregate (N=102)
2013-2014 AR
Aggregate (N=92)
2014-2015 AR
Aggregate (N=89)
Family-School Connection 4.16 4.19 4.26 The afterschool program is helping my child to be more successful in school 4.43 4.47 4.51 Afterschool staff are well informed about my child's learning successes and challenges in school 4.22 4.26 4.34 The afterschool program has helped our family get to know the school and school day teachers better 3.85 3.85 3.92
Data Source: Parent Survey
Key Findings: - Parents report that they do not worry about their child(ren) when at the afterschool program and that
they believe their child(ren) are having a positive experience. - Parents report that either the location of the program or the transportation is convenient and reliable,
and cost-effective. - Parents report that the afterschool program has been beneficial to their child(ren)’s learning in school,
that they are well informed about student progress, and that the program has helped them get to know the school-day teachers better.

2014-2015 Arkansas 21st CCLC Statewide Evaluation Report Page 45
2014-2015RecommendationsThe findings presented above highlighted key areas where it may be beneficial to do some further investigation and reflection. The recommendations below serve as a starting point for further examination.
1. Review statewide goals and objectives. Objectives for Project Goals 1 and 2 were modified prior to
the 2013-2014 reporting period. For the 2015-16 reporting period, the state lead, in cooperation with the evaluation contractor, may wish to further adjust the thresholds based on normative performance within the network. Considerations include:
o Reporting on the “proportion of sites meeting target” with different performance requirements for first-year programs and experienced programs.
o Given the changes in state proficiency measures over the past three program years, the state lead, in cooperation with the evaluation contractor, should consider reviewing available classroom grade data to assess whether this data might be an appropriate supplement to state testing data to evaluate proficiency.
2. Provide targeted assistance to sites. A Risk Index was used to identify sites which scored in the
lowest quartile across the 23 Leading Indicator measures4. Three school districts were identified as in need of targeted assistance in both 2013-14 and 2014-15. Additional action steps include:
o Conducting a “performance study” of high performing sites as a way of identifying best practices and use this information to support lower performing sites in the network. Such a performance study might be made available on the ADE website as guidance for incoming 21st CCLC sites.
3. Streamline data collection. In response to recommendations in the 2013-14 report, the state lead
made the decision to collect data from the state warehouse with the goal of streamlining data collection. The state lead, in cooperation with the evaluation contractor, made updates to data collection processes for sites as well, including updated data management spreadsheet to reflect updated federal data collection schedule; and additional site support around data collection processes. The state lead, in cooperation with the evaluation contractor should plan to continue to provide additional support to sites until the new federal data collection system stabilizes.
4. Include youth measures of social and emotional learning into site continuous
improvement process. In response to a recommendation in the 2013-14 report, a group of 10 sites were invited to participate in a small pilot of the Devereux Student Strengths Assessment (DESSA) – Mini Form. By the end of data collection, seven sites had submitted data for the pilot and viewed their reports. Further action steps include:
o The state lead, in cooperation with the evaluation contractor, should develop additional support materials to help participating sites understand how to incorporate the DESSA data into sites’ program quality improvement plans.
o Student data from the 2014-15 programming year can be matched to data for the same students in the 2015-16 programming year to examine social-emotional skills growth at the student level and at the program level.
o For the 2015-16 programming year, the state lead should continue to slowly expand the pilot by reengaging experienced sites with trained leads.
4 Last year, nine sites were identified with 10 or more low-scoring indicators. The state lead used this information to provide targeted assistance to sites. In 2014-15 the Risk Index found 12 sites across the network with low scores in 10 or more of the Leading Indicator measures. This does not necessarily represent a decline in quality. Because quartiles are a fixed percentage of sites, it is important to consider quartile scores along with quartile placement. For example in 2013-14, there were 22 (25% of 92 sites) sites in the low quartile for Capacity and the low quartile mean was 3.50. In 2014-15, there were 20 sites (25% of 89 sites) in the Capacity low quartile, however, the low quartile mean was 4.08. Overall, this may be viewed as an indicator of improvement in Capacity for Arkansas 21st CCLC sites.
2014-2015 Arkansas 21st CCLC Statewide Evaluation Report Page 46
5. Increase efforts to target academically at-r isk youth. Measures of the Targeting leading indicator have remained consistent over the three years Arkansas 21st CCLC has been involved in the QIS. Since 21st
CCLC funding is intended to be directed at academically at-risk youth, the state lead may want to review guidance pertaining to enrollment of these students. Many grants may service all students in the community, but are intentional efforts being made to make sure the students who would benefit from programming are actually coming to programming? Are programs prepared to deliver targeted services to students who are identified as experiencing academic challenges? Action steps include:
o Discuss barriers to enacting policies to target students who are at risk for program enrollment. o Provide a one-pager of guiding steps to walk a grantee director through the process of targeting their
at-risk population. Identify program exemplars where targeted services are available to students who are identified as being academically at risk.
o Clarify the intent of the question on the evaluation survey to better identify programs who are either not targeting or do not have a targeted service model available for academically at risk students.
6. Improve program designs. ADE may want to provide specific training and technical assistance for
grantees to implement these best practice, which focus on improving the design of programs. o Develop program offerings that build in complexity over t ime. An important pathway to
skill development is involving students in engaging activities that sequentially grow more complex over time (Durlak & Weissberg, 2007; Marzano, 1998). The state lead may want to guide grantees to implement programming that has a larger goal or end product and takes multiple sessions to complete. STEM or art activities may be a great way to build in multi-session projects. For example, create themes to cover a specific amount of time (days, weeks, semesters) with specific learning objectives that build from one session to the next.
o Foster successful and posit ive communication with external stakeholders such as parents, school- day personnel, and other community members. When information is shared across contexts, it creates a complementary learning environment that supports the development of students (Catalano, Haggerty, Oesterle, Fleming, & Hawkins, 2004; Weiss, Little, Bouffard, Deschenes, & Malone, 2009). Consider identifying grantees who have been effective communicators with parents and community members. These exemplars could share their methods as a webinar or at a statewide network meeting.
o Foster youth voice in programs. Youth voice is important in establishing a sense of ownership of the afterschool program for middle and high school youth. Fostering youth voice involves finding ways for young people to actively participate in shaping the decisions that affect their lives (Mitra, 2004) and helping youth to develop and realize their own goal, interests and values (Assor, Kaplan, & Roth, 2002; Connell & Wellborn, 1991; Reeve, Jang, Carrell, Jeon, & Barch, 2004). ADE may consider establishing a working group made up of volunteers from sites that serve middle and high school students. These sites would be interested in expanding youth involvement at their sites.

2014-2015 Arkansas 21st CCLC Statewide Evaluation Report Page 47
ReferencesAfterschool Alliance. (2011). 21st century community learning centers afterschool initiative. Retrieved from
http://www.afterschoolalliance.org/policy21stcclc.cfm
Assor, A., Kaplan, H., & Roth, G. (2002). Choice is good, but relevnance is excellent: Autonomy-enhancing and
supressing teacher behaviours predicting students' engagement in school work. Journal of Educational
Psychology, 72, 261-278.
Bliese, P. (Ed.) (2000). Within-Group Agreement, Non-Independence, and Reliability Implications for Data
Aggregation and Analysis: Jossey-Bass.
Bobko, P., Roth, P. L., & Buster, M. A. (2007). The usefulness of unit weights in creating composite scores: A
literature review, application to content validity, and meta-analysis. Organizational Research Methods, 10(4),
689-709.
Catalano, R. F., Haggerty, K. P., Oesterle, S., Fleming, C. B., & Hawkins, J. D. (2004). The Importance of Bonding to
School for Healthy Development: Findings from the Social Development Research Group. Journal of School
Health, 74(7), 252-261.
Connell, J. P., & Wellborn, J. G. (1991). Competence, autonomy and relatedness: A motivational analysis of self-
system processes. In M. R. Gunar & L. A. Sroufe (Eds.), Self Processes and Development (pp. 43-77).
Hillsdale, NJ: L. Erlbaum Associates. Durlak, J. A., & Weissberg, R. P. (2007). The impact of after-school programs that promote personal and social skills.
Retrieved from Chicago, IL:
Fralicx, R. D., & Raju, N. S. (1982). A comparison of five methods for combining multiple criteria into a single
composite. Educational and Psychological Measurement, 42, 823-827.
Marzano, R. J. (1998). A theory-based meta-analysis of research on instruction. Retrieved from Aurora, CO:
http://www.peecworks.org/PEEC/PEEC_Research/I01795EFA.2/Marzano%20Instruction%20Meta_An.pdf
Mitra, D. L. (2004). The significance of students: Can increasing student voice in schools lead to gains in youth
development. Teachers college record, 106(4), 651-688.
Reeve, J., Jang, H., Carrell, D., Jeon, S., & Barch, J. (2004). Enhancing students engagement by increasing teachers'
autonomy support. motivation and emotion, 28(2).
2014-2015 Arkansas 21st CCLC Statewide Evaluation Report Page 48
Smith, C., Akiva, T., Sugar, S. A., & Hallman, S. (2012). Leading indicators measurement system: Analysis of
Oklahoma data - Technical appendix to the Oklahoma 21st Century Community Learning Centers statewide
evaluation. Retrieved from Ypsilanti, MI:
Smith, C., Akiva, T., Sugar, S. A., Lo, Y.-J., Frank, K. A., Peck, S. C., & Cortina, K. (2012). Continuous quality
improvement in afterschool settings: Impact findings from the Youth Program Quality Intervention study.
Retrieved from Ypsilanti, MI:
Smith, C., & Hohmann, C. (2005). Full findings from the Youth PQA validation study. Retrieved from Ypsilanti, MI:
http://www.highscope.org/file/EducationalPrograms/Adolescent/ResearchEvidence/WebFinalYouthPQATec
hReport.pdf
Vandell, D. L. (2012). California Afterschool Outcome Measures Project: Field Test Of The Online Toolbox Final
Report To California Department Of Education. Retrieved from Irvine, CA:
http://afterschooloutcomes.org/reports
Weiss, H., Little, P., Bouffard, S. M., Deschenes, S. N., & Malone, H. J. (2009). Strengthen What Happens outside
School to Improve What Happens inside. Phi Delta Kappan, 90(8), 592-596.
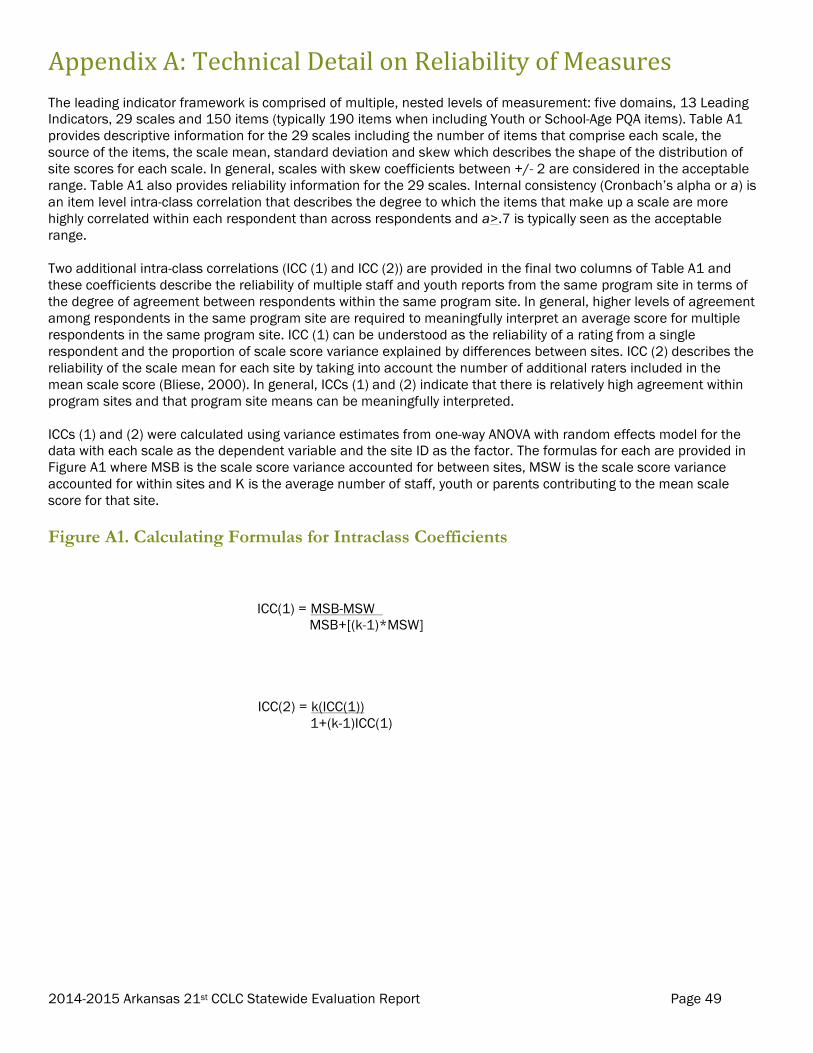
2014-2015 Arkansas 21st CCLC Statewide Evaluation Report Page 49
AppendixA:TechnicalDetailonReliabilityofMeasuresThe leading indicator framework is comprised of multiple, nested levels of measurement: five domains, 13 Leading Indicators, 29 scales and 150 items (typically 190 items when including Youth or School-Age PQA items). Table A1 provides descriptive information for the 29 scales including the number of items that comprise each scale, the source of the items, the scale mean, standard deviation and skew which describes the shape of the distribution of site scores for each scale. In general, scales with skew coefficients between +/- 2 are considered in the acceptable range. Table A1 also provides reliability information for the 29 scales. Internal consistency (Cronbach’s alpha or a) is an item level intra-class correlation that describes the degree to which the items that make up a scale are more highly correlated within each respondent than across respondents and a>.7 is typically seen as the acceptable range.
Two additional intra-class correlations (ICC (1) and ICC (2)) are provided in the final two columns of Table A1 and these coefficients describe the reliability of multiple staff and youth reports from the same program site in terms of the degree of agreement between respondents within the same program site. In general, higher levels of agreement among respondents in the same program site are required to meaningfully interpret an average score for multiple respondents in the same program site. ICC (1) can be understood as the reliability of a rating from a single respondent and the proportion of scale score variance explained by differences between sites. ICC (2) describes the reliability of the scale mean for each site by taking into account the number of additional raters included in the mean scale score (Bliese, 2000). In general, ICCs (1) and (2) indicate that there is relatively high agreement within program sites and that program site means can be meaningfully interpreted.
ICCs (1) and (2) were calculated using variance estimates from one-way ANOVA with random effects model for the data with each scale as the dependent variable and the site ID as the factor. The formulas for each are provided in Figure A1 where MSB is the scale score variance accounted for between sites, MSW is the scale score variance accounted for within sites and K is the average number of staff, youth or parents contributing to the mean scale score for that site.
Figure A1. Calculating Formulas for Intraclass Coefficients
ICC(1) = MSB-MSW MSB+[(k-1)*MSW]
ICC(2) = k(ICC(1)) 1+(k-1)ICC(1)
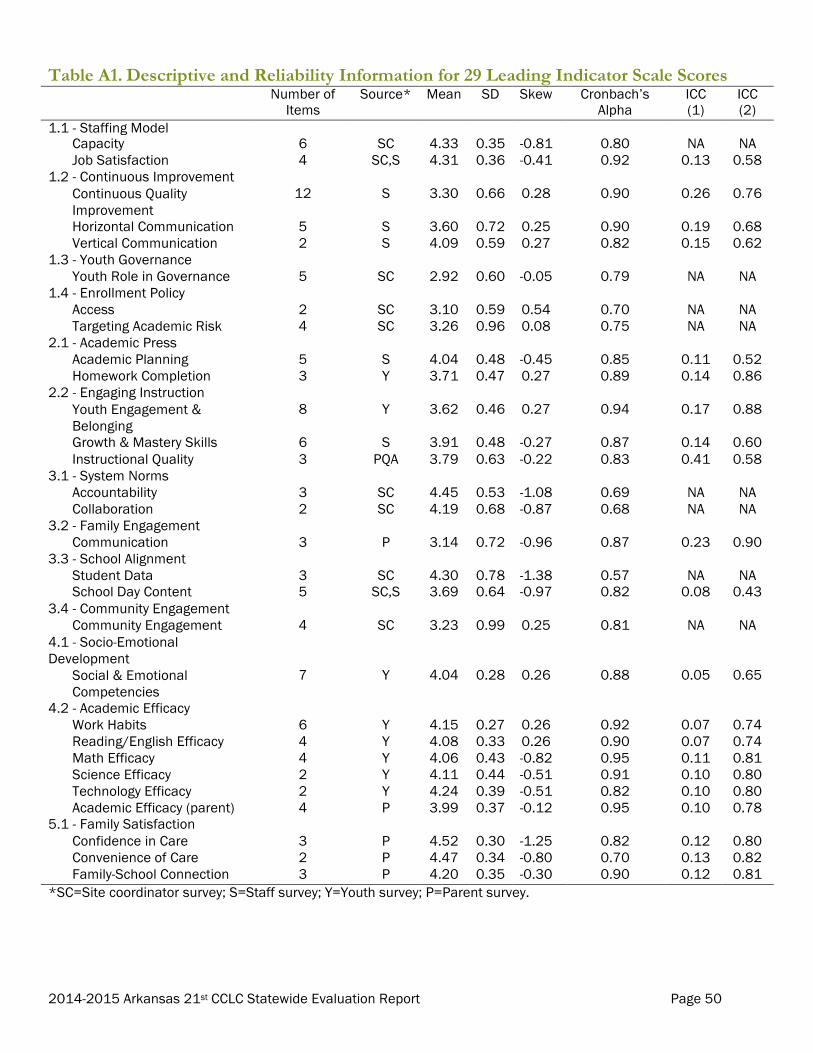
2014-2015 Arkansas 21st CCLC Statewide Evaluation Report Page 50
Table A1. Descriptive and Reliability Information for 29 Leading Indicator Scale Scores Number of
Items Source* Mean SD Skew Cronbach’s
Alpha ICC (1)
ICC (2)
1.1 - Staffing Model Capacity 6 SC 4.33 0.35 -0.81 0.80 NA NA Job Satisfaction 4 SC,S 4.31 0.36 -0.41 0.92 0.13 0.58
1.2 - Continuous Improvement Continuous Quality Improvement
12 S 3.30 0.66 0.28 0.90 0.26 0.76
Horizontal Communication 5 S 3.60 0.72 0.25 0.90 0.19 0.68 Vertical Communication 2 S 4.09 0.59 0.27 0.82 0.15 0.62
1.3 - Youth Governance Youth Role in Governance 5 SC 2.92 0.60 -0.05 0.79 NA NA
1.4 - Enrollment Policy Access 2 SC 3.10 0.59 0.54 0.70 NA NA Targeting Academic Risk 4 SC 3.26 0.96 0.08 0.75 NA NA
2.1 - Academic Press Academic Planning 5 S 4.04 0.48 -0.45 0.85 0.11 0.52 Homework Completion 3 Y 3.71 0.47 0.27 0.89 0.14 0.86
2.2 - Engaging Instruction Youth Engagement & Belonging
8 Y 3.62 0.46 0.27 0.94 0.17 0.88
Growth & Mastery Skills 6 S 3.91 0.48 -0.27 0.87 0.14 0.60 Instructional Quality 3 PQA 3.79 0.63 -0.22 0.83 0.41 0.58
3.1 - System Norms Accountability 3 SC 4.45 0.53 -1.08 0.69 NA NA Collaboration 2 SC 4.19 0.68 -0.87 0.68 NA NA
3.2 - Family Engagement Communication 3 P 3.14 0.72 -0.96 0.87 0.23 0.90
3.3 - School Alignment Student Data 3 SC 4.30 0.78 -1.38 0.57 NA NA School Day Content 5 SC,S 3.69 0.64 -0.97 0.82 0.08 0.43
3.4 - Community Engagement Community Engagement 4 SC 3.23 0.99 0.25 0.81 NA NA
4.1 - Socio-Emotional Development
Social & Emotional Competencies
7 Y 4.04 0.28 0.26 0.88 0.05 0.65
4.2 - Academic Efficacy Work Habits 6 Y 4.15 0.27 0.26 0.92 0.07 0.74 Reading/English Efficacy 4 Y 4.08 0.33 0.26 0.90 0.07 0.74 Math Efficacy 4 Y 4.06 0.43 -0.82 0.95 0.11 0.81 Science Efficacy 2 Y 4.11 0.44 -0.51 0.91 0.10 0.80 Technology Efficacy 2 Y 4.24 0.39 -0.51 0.82 0.10 0.80 Academic Efficacy (parent) 4 P 3.99 0.37 -0.12 0.95 0.10 0.78
5.1 - Family Satisfaction Confidence in Care 3 P 4.52 0.30 -1.25 0.82 0.12 0.80 Convenience of Care 2 P 4.47 0.34 -0.80 0.70 0.13 0.82 Family-School Connection 3 P 4.20 0.35 -0.30 0.90 0.12 0.81
*SC=Site coordinator survey; S=Staff survey; Y=Youth survey; P=Parent survey.
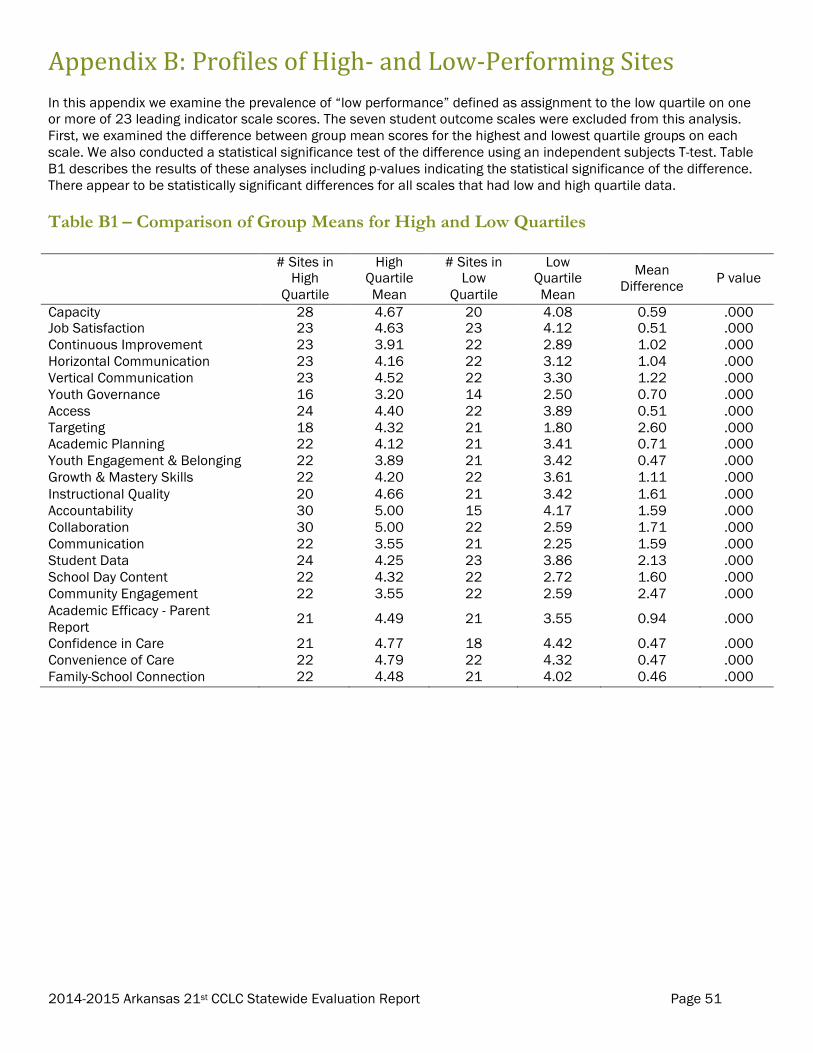
2014-2015 Arkansas 21st CCLC Statewide Evaluation Report Page 51
AppendixB:ProfilesofHigh-andLow-PerformingSitesIn this appendix we examine the prevalence of “low performance” defined as assignment to the low quartile on one or more of 23 leading indicator scale scores. The seven student outcome scales were excluded from this analysis. First, we examined the difference between group mean scores for the highest and lowest quartile groups on each scale. We also conducted a statistical significance test of the difference using an independent subjects T-test. Table B1 describes the results of these analyses including p-values indicating the statistical significance of the difference. There appear to be statistically significant differences for all scales that had low and high quartile data.
Table B1 – Comparison of Group Means for High and Low Quartiles
# Sites in
High Quartile
High Quartile Mean
# Sites in Low
Quartile
Low Quartile Mean
Mean Difference
P value
Capacity 28 4.67 20 4.08 0.59 .000 Job Satisfaction 23 4.63 23 4.12 0.51 .000 Continuous Improvement 23 3.91 22 2.89 1.02 .000 Horizontal Communication 23 4.16 22 3.12 1.04 .000 Vertical Communication 23 4.52 22 3.30 1.22 .000 Youth Governance 16 3.20 14 2.50 0.70 .000 Access 24 4.40 22 3.89 0.51 .000 Targeting 18 4.32 21 1.80 2.60 .000 Academic Planning 22 4.12 21 3.41 0.71 .000 Youth Engagement & Belonging 22 3.89 21 3.42 0.47 .000 Growth & Mastery Skills 22 4.20 22 3.61 1.11 .000 Instructional Quality 20 4.66 21 3.42 1.61 .000 Accountability 30 5.00 15 4.17 1.59 .000 Collaboration 30 5.00 22 2.59 1.71 .000 Communication 22 3.55 21 2.25 1.59 .000 Student Data 24 4.25 23 3.86 2.13 .000 School Day Content 22 4.32 22 2.72 1.60 .000 Community Engagement 22 3.55 22 2.59 2.47 .000 Academic Efficacy - Parent Report 21 4.49 21 3.55 0.94 .000 Confidence in Care 21 4.77 18 4.42 0.47 .000 Convenience of Care 22 4.79 22 4.32 0.47 .000 Family-School Connection 22 4.48 21 4.02 0.46 .000
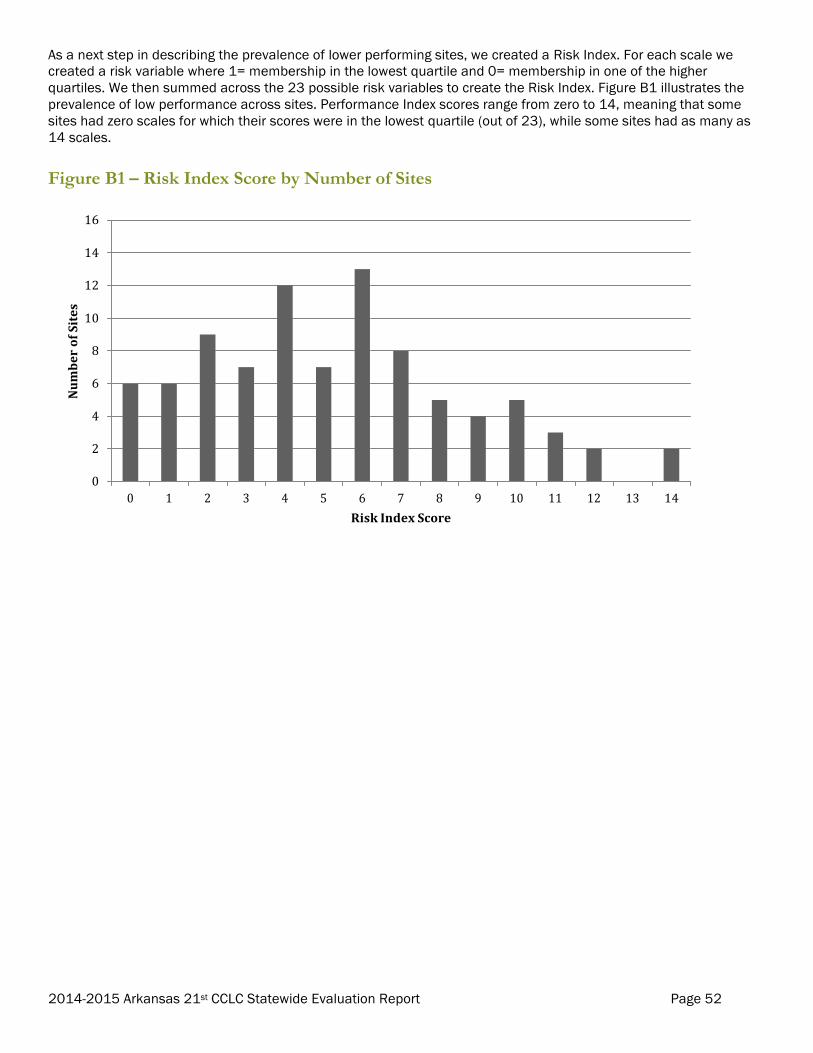
2014-2015 Arkansas 21st CCLC Statewide Evaluation Report Page 52
As a next step in describing the prevalence of lower performing sites, we created a Risk Index. For each scale we created a risk variable where 1= membership in the lowest quartile and 0= membership in one of the higher quartiles. We then summed across the 23 possible risk variables to create the Risk Index. Figure B1 illustrates the prevalence of low performance across sites. Performance Index scores range from zero to 14, meaning that some sites had zero scales for which their scores were in the lowest quartile (out of 23), while some sites had as many as 14 scales.
Figure B1 – Risk Index Score by Number of Sites
16
14
12
10
8
6
4
2
00 1 2 3 4 5 6 7 8 9 10 11 12 13 14
RiskIndexScore
Num
berofSites
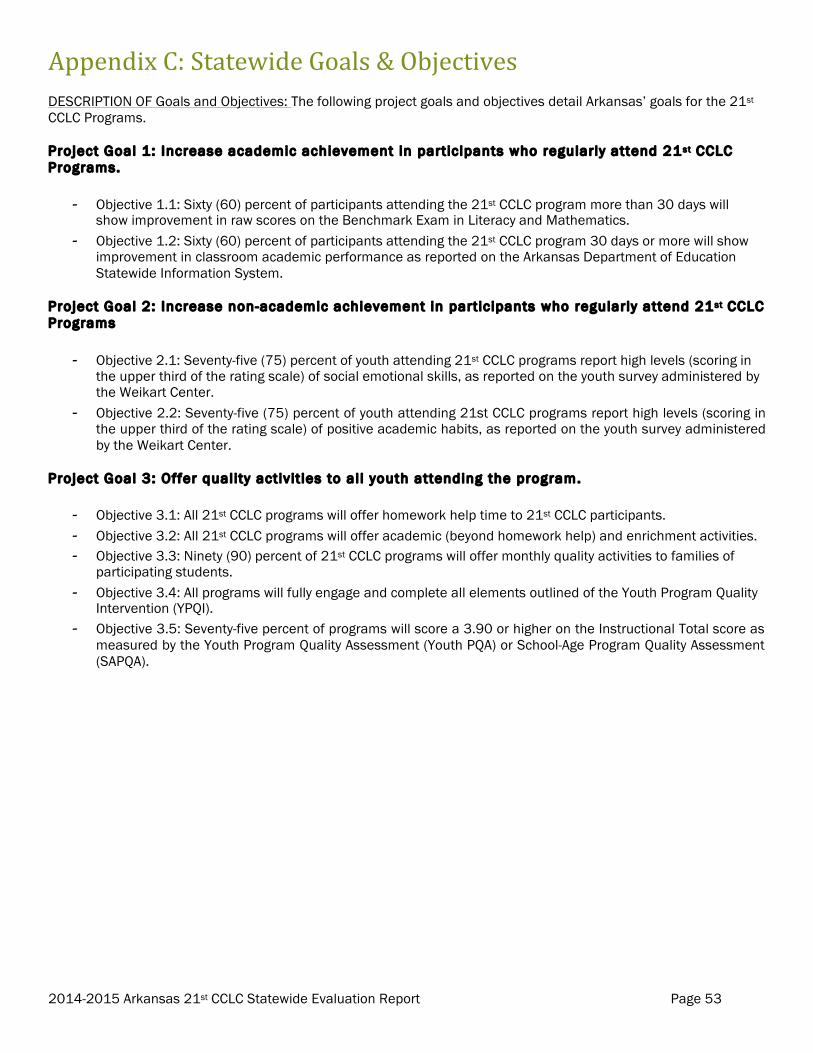
2014-2015 Arkansas 21st CCLC Statewide Evaluation Report Page 53
AppendixC:StatewideGoals&ObjectivesDESCRIPTION OF Goals and Objectives: The following project goals and objectives detail Arkansas’ goals for the 21st
CCLC Programs. Project Goal 1: Increase academic achievement in participants who regularly attend 21st CCLC Programs.
- Objective 1.1: Sixty (60) percent of participants attending the 21st CCLC program more than 30 days will
show improvement in raw scores on the Benchmark Exam in Literacy and Mathematics. - Objective 1.2: Sixty (60) percent of participants attending the 21st CCLC program 30 days or more will show
improvement in classroom academic performance as reported on the Arkansas Department of Education Statewide Information System.
Project Goal 2: Increase non-academic achievement in participants who regularly attend 21st CCLC Programs
- Objective 2.1: Seventy-five (75) percent of youth attending 21st CCLC programs report high levels (scoring in
the upper third of the rating scale) of social emotional skills, as reported on the youth survey administered by the Weikart Center.
- Objective 2.2: Seventy-five (75) percent of youth attending 21st CCLC programs report high levels (scoring in the upper third of the rating scale) of positive academic habits, as reported on the youth survey administered by the Weikart Center.
Project Goal 3: Offer quality activit ies to al l youth attending the program.
- Objective 3.1: All 21st CCLC programs will offer homework help time to 21st CCLC participants. - Objective 3.2: All 21st CCLC programs will offer academic (beyond homework help) and enrichment activities. - Objective 3.3: Ninety (90) percent of 21st CCLC programs will offer monthly quality activities to families of
participating students. - Objective 3.4: All programs will fully engage and complete all elements outlined of the Youth Program Quality
Intervention (YPQI). - Objective 3.5: Seventy-five percent of programs will score a 3.90 or higher on the Instructional Total score as
measured by the Youth Program Quality Assessment (Youth PQA) or School-Age Program Quality Assessment (SAPQA).