areal segregation of face-processing neurons in prefrontal cortex
TRANSCRIPT
IMSMSMSSSSiMsQ m;mms^^msmmstmmsmM
ity to totally inhibit the GAP activity of RGS proteins for their correct cellular targets. Thus, the palmitoylation-depalmitoyl-ation cycle may control both the signal amplitude and the temporal response in G-protein pathways. Palmitoylation can amplify G protein-mediated signals or, alternatively, regulated depalmitoylation could serve as either an off-switch or signal attenuator. Such controls may be G protein-specific, and their complete elucidation awaits better understanding of the control of palmi-tate addition and removal. Regardless, any of these mechanisms would be compatible with the enhanced binding of palmitoylated Ga to Gfiy (7), which would serve to lower background signaling in the absence of stimulation. Regulation of GAP activity may be a major function of Ga palmitoylation.
REFERENCES AND NOTES
1. P. B. Wedegaertner, P. T. Wilson, H. R. Bourne, J. Biol. Chem. 270, 503 (1995); S. M. Mumby, Curr. Opin. Cell Biol. 9, 148 (1997); E. M. Ross, Curr. Biol. 5, 107 (1995); G. Milligan et a/., Biochem. Soc. Trans. 23, 583 (1995); C. Kleuss and A. G. Gilman Proc. Natl. Acad. Sci. U.S.A. 94, 6116 (1997).
2. M. E. Under etal., Proc. Natl. Acad. Sci. U.S.A. 90, 3675(1993).
3. P. B. Wedegaertner and H. R. Bourne, Cell 77,1063 (1994).
4. S. M. Mumby, C. Kleuss, A. G. Gilman, Proc. Natl. Acad. Sci. U.S.A. 91, 2800 (1994).
5. D. Stanislaus, J. A. Jovanovick, S. Brothers, P. M. Conn, Mol. Endocrinol. 11, 738 (1997).
6. M. Y. Degtyarev, A. M. Spiegel, T. L. Z. Jones, J. Biol. Chem. 268, 23769 (1993); ibid. 269, 30898 (1994).
7. T. liri, P. S. Backlund Jr., T. L. Z. Jones, P. B. Wedegaertner, H. R. Bourne, Proc. Natl. Acad. Sci. U.S.A. 93, 14592(1996).
8. M. A. Grassieetal., Biochem. J. 302, 913 (1994); F. Galbiati, F. Guzzi, A. I. Magee, G. Milligan, M. Parenti, ibid. 313,717(1996).
9. P. T. Wilson and H. R. Bourne, J. Biol. Chem. 270, 9667(1995).
10. J. R. Hepler et a/., ibid. 271, 496 (1996). 11. M. D. Edgerton, C. Chabert, A. Chollet, S. Arkinstall,
FEBS Lett. 354, 195 (1994); P. B. Wedegaertner, D. H. Chu, P. T. Wilson, M. J. Levis, H. R. Bourne, J. Biol. Chem. 268, 25001 (1993).
12. J. Song and H. G. Dohlman, Biochemistry 35,14806 (1996).
13. H. K. W. Fong, K. K. Yoshimoto, P. Eversole-Cire, M. I. Simon, Proc. Natl. Acad. Sci. U.S.A. 85, 3066 (1988); M. Matsuoka, H. Itoh, T. Kozasa, Y. Kaziro, ibid. 85, 5384-(1988).
14. P. J. Casey, H. K. W. Fong, M. I. Simon, A. G. Gilman, J. Biol. Chem. 265, 2383 (1990).
15. J. Wang, Y. Tu, J. Woodson, X. Song, E. M. Ross, ibid. 272,5732(1997).
16. Sequence data indicate that the purified brain Gz
GAP (75) is an RGS protein related to RET-RGS1 {31) and GAIP {26).
17. H. G. Dohlman and J. Thorner, J. Biol. Chem. 272, 3871 (1997); M. R, Koelle, Curr. Opin. Cell Biol. 9, 143(1997).
18. J. A. Duncan and A. G. Gilman, J. Biol. Chem. 271, 23594(1996).
19. Gaz expressed in Sf9 cells is both myristoylated and palmitoylated (2), but palmitate is largely removed during purification. Gaz (4 (JLM) purified from Sf9 cells or myristoylated Gal1 from £ coli {32) was palmitoylated by incubation for 2 to 3 hours at 30°C with 50 JJLM Pal-CoA, either unlabeled or 3H-labeled at 1000 cpm/pmol, in 50 mM NaHepes (pH 7.8), 2 mM EDTA, and 7.5 mM CHAPS detergent (78). [3H]Palmitoylation was measured by liquid scintilla
tion counting after precipitation with 10% trichloroacetic acid (78) or SDS-polyacrylamide gel electrophoresis (PAGE). The concentration of active Gaz
was assayed according to the binding of 10 IJLM [35S]GTP-7-S (75, 33) except that the binding reaction mixture was incubated for 60 min in the presence of 25 mM (NH4)2S04, which increases the rate of nucleotide exchange on G-protein a subunits {34). Maximal observed binding of [35S]GTP-7-S was 65 to 70% of that predicted from assay of total protein.
20. Hydrolysis of Gaz-bound> [r32P]GTP and Gz GAP
activity were measured at 15°C as described (75). GAP activity is expressed either as the amount of bound GTP hydrolyzed above background at early times (quasi-linear time course) or as an apparent first-order rate constant (/capp). A unit of GAP activity is defined as an increment in kapp of 1 min-1 (75). Basal and stimulated hydrolysis of GTP bound to GaM was measured with a single-turnover assay (75) that included centrifugal gel filtration to remove unbound [r32P]GTP and [32P]Pi formed during the binding reaction.
21. To proteolyze Gaz near its NH2-terminus, Gaz was first incubated with either 50 (JLM GTP-7-S (30°C for 90 min) or 50 IJLM guanosine diphosphate (GDP), 30 IJLM AICI3, 10 mM NaF, and 10 mM MgCI2 (15°C for 20 min) in 25 mM NaHepes (pH 7.5), 1 mM EDTA, 0.5 mM Mg2+ , 1 mM DTT, and 0.1% Triton X-100. The mixture was further incubated with trypsin (0.05 milligrams per milligram of Gaz) at 30°C for 30 min. Phenylmethylsulfonylfluoride (1 mM) and tosyl-lysyl-chloromethylketone (0.2 mM) were added and digestion was checked by SDS-PAGE. Trypsin cleaved activated Gaz after Arg29, according to automated Edman sequencing of the large tryptic fragment {22).
22. Y. Tu and J. Wang, unpublished data. 23. Both reversal of inhibition by DTT treatment and
mock palmitoylation of Gaz without Pal-CoA were routine controls.
24. N. Watson, M. E. Under, K. M. Druey, J. H. Kehrl,
K. J. Blumer, Nature 383, 172 (1996); J. R. Hepler, D. M. Berman, A. G. Gilman, T. Kozasa, Proc. Natl. Acad. Sci. U.S.A. 94, 428 (1997).
25. D. M. Berman, T. M. Wilkie, A. G. Gilman, Cell 86, 445(1996).
26. L. De Vries, M. Mousli, A. Wurmser, M. G. Farquhar, Proc. Natl. Acad. Sci. U.S.A. 92, 11916 (1995).
27. M. R. Koelle and H. R. Horvitz, Ce//84, 115 (1996). 28. T. W. Hunt, T. A. Fields, P. J. Casey, E. G. Peralta,
Nature 383, 175(1996). 29. Palmitoylation of GaM also blocked acceleration by
RGS4 of M2 muscarinic cholinergic receptor-stimulated steady-state GTPase activity when assayed in reconstituted phospholipid vesicles as described (75, 22). The effect of palmitoylation does not therefore depend on interaction with detergent.
30. J. J. G. Tesmer, D. M. Berman, A. G. Gilman, S. R. Sprang, Cell 89,251 (1997). Direct and specific contact of RGS proteins with Cys3 of Ga is not crucial, because mutation of this residue to Ala did not alter the responsiveness of Ga^ to RGS4 {22).
31. E. Faurobert and J. B. Hurley, Proc. Natl. Acad. Sci. U.S.A. 94,2945(1997).
32. M. E. Under et a/., J. Biol. Chem. 266, 4654 (1991). 33. D. R. Brandt and E. M. Ross, ibid. 260, 266 (1985). 34. K. M. Ferguson and T. Higashijima, Methods Enzy-
mol. 195, 188(1991). 35. T. Kozasa and A. G. Gilman, J. Biol. Chem. 270,
1734(1995). 36. We thank A. Duncan for advice and [3H]Pal-CoA, D.
Berman for RGS4 protein and for GAIP cDNA, S. Popov for purified RGS10, P. Chidiac for advice, K. Chapman and J. Woodson for expert technical assistance, C. Slaughter and S. Afendis for peptide sequencing, and M. Cobb, S. Mukhopadhyay, and S. Sprang for comments on the manuscript. Supported by NIH grant GM30355, R. A. Welch Foundation grant I-0982, and a postdoctoral fellowship to J.W. from Cadus Pharmaceuticals Corp.
22 May 1997; accepted 30 September 1997
Areal Segregation of Face-Processing Neurons in Prefrontal Cortex
Seamas P. 6 Scalaidhe,* Fraser A. W. Wilson,f Patricia S. Goldman-Rakic
A central issue in cognitive neuroscience concerns the functional architecture of the prefrontal cortex and the degree to which it is organized by sensory domain. To examine this issue, multiple areas of the macaque monkey prefrontal cortex were mapped for selective responses to visual stimuli that are prototypical of the brain's object vision pathway—pictorial representations of faces. Prefrontal neurons not only selectively process information related to the identity of faces but, importantly, such neurons are localized to a remarkably restricted area. These findings suggest that the prefrontal cortex is functionally compartmentalized with respect to the nature of its inputs.
A major advance in understanding cortical organization has been the partitioning of large territories of cortex into regions on the basis of sensory modalities and submo-dalities (J, 2). This is particularly striking in the visual system, where processes related
Section of Neurobiology, Yale University Medical School, 333 Cedar Street, New Haven, CT 06510, USA.
*To whom correspondence should be addressed. E-mail: [email protected] tPresent address: ARL Division of Neural Systems, University of Arizona, Life Sciences North Building, Tuscon, AZ 85724, USA.
to central and peripheral vision can be traced from the retina to the highest levels of visual association cortex in the inferior temporal cortex (IT) and the posterior parietal cortex. The situation is less clear for prefrontal cortex. Because of its status as the archetypal association cortex, the functional architecture of prefrontal cortex has theoretical implications for the issue of whether association cortex has a modular functional organization like that of the sensory regions or is instead relatively undifferentiated. Evidence from the study of lesions (3),
www.sciencemag.org • SCIENCE • VOL. 278 • 7 NOVEMBER 1997 1135
anatomical connections (4, 5), and human imaging (6, but see 7) indicates that the prefrontal cortex may also be partitioned on the basis of its sensorv innervation. At the cellular level, electrophysiological studies have revealed s~atiallv selective resDonses in the dorsolaterk pref;ontal cortex (b) and object-specific neural responses within the inferior prefrontal. convexity of the ma- caque monkey (9, 10). However, only a few studies have directly compared dorsal and ventral areas involved in spatial and object vision, respectively, and these studies have found either only quantitative differences (1 1) or no specialization of function at all (1 2). We reasoned that using an ecological- ly salient stimulus to map prefrontal cortex might reveal a degree of areal specialization that has not been evident in ~ r i o r studies. Given that recognition of and interaction with one's conspecifics is critical to social behavior and relies heavily on the ability to discriminate between faces and facial ex- pressions, neuronal responses to faces, as seen in inferior temporal cortex (13), pro- vide such a probe. O n the basis of extensive mapping, we now report that the prefrontal cortex contains a highly circumscribed re- gion, the inferior prefrontal cortex, where neurons selectively process information contained in faces. Therefore, these results indicate that the ventral visual stream ded- icated to stimulus identification in central vision (1) extends from visual cortex to the prefrontal cortex.
The results are based on 46 face-selective neurons from a sample recorded throughout the prefrontal cortex of three monkeys
trained to maintain fixation while visual stimuli were presented (14). The analysis of neuronal activity to a wide variety of stimuli revealed that these neurons' responses were triggered by pictures of a face and gave little or no response to any pictures of nonface stimuli (Fig. 1A) (15). To determine wheth- er the face-selective responses were deter- mined by potentially confounding factors such as the emotional or motivational signif- icance associated with faces or local visual features of certain faces, putative face-selec- tive neurons were tested with a variety of additional stimuli. Neurons that showed re- sponses to face stimuli were tested on an array of additional stimuli with strong moti- vational or emotional significance to the monkeys such as monkey chow, fruit, leather handling gloves, snakes, insects, and the like. There was no sign that motivational or emo- tional significance of the stimuli was a de- termining factor in the responses to faces. Indeed, the only significant difference due to stimulus class (faces, objects, colored rectan- gles, peripherally presented spots of light, common "laboratory" stimuli such as orient- ed lines, emotionally significant stimuli, and motivationally significant stimuli) in the re- sponses of face-selective neurons was be- tween faces and other stimuli (P < 0.00013; Tukey Honestly Significant Difference test). Face-selective responses were also not deter- mined by local features within the face. In- stead, the neurons appeared to respond to the face as an identifiable object, because their response was greatly diminished or eliminated when the same face was scram- bled to preserve elements such as internal
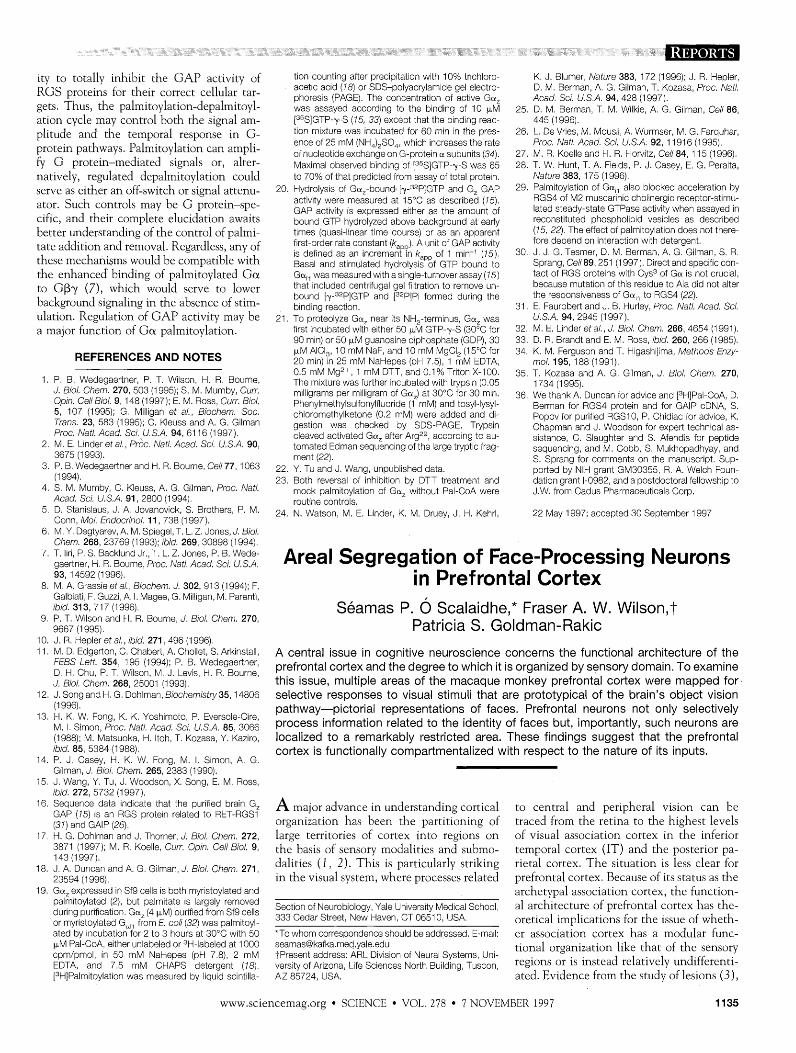
Fig. 1. (A) Trial by trial ras-
density functions (SDFs) of one face-selective cell to the , 8 " 8 ,,L!.7.8FJ Y I c r > I
most effective face and the loo
most effective nonface stim- ulus with which it was test- ed. Each raster tick denotes o s / ~ one extracellularly recorded action potential, and the SDFs are averaged neural activity convolved with a Gaussian function (SD = 30 ms). For all rasters and SDFs, the first vertical line denotes the animal's fove- ation of the fixation ~oint, the second vertical lineindicates '"1 stimulus onset, and the third vertical line indicates stimu- lus offset. The duration of o s/s the stimulus was 1 s. The actual stimuli were color im- ages presented on a com- puter monitor (14). The ordi- nate represents the neural response in spikes per second (s/s). (B) The mean response of the another face and to this face scrambled. Conventions are as in (A).
same face-selective neuron to
texture, color, and local contours but lacked the immediate impression of a face to a human observer (Fig. 1B; two-tailed t test for paired observations, P = 0.00002). To fur- ther determine that the selective responses to faces were not merelv the result of local features idiosyncratic to certain face stimuli, six face-selective neurons were tested with the same sets of 10 stimuli inverted, convert- ed to black and white, and decreased in size. As is the case in IT (16), stimulus identity was strongly correlated with response magni- tude across manipulations (Pearson r = -0.877, P < In contrast, manipulation of stimulus orientation, size, or color versus black and white did not significantly affect response magnitude (r = 0.132, P = 0.418).
Because foveation is a critical aspect of stimulus identification, it would be expected that neurons processing such information would exhibit their best resDonses to foveal stimulation, and, indeed, this was the case when 11 face-selective neurons were tested with faces at nine locations: foveally and at eight locations 13' from the fixation point
0 sls 0 1 S Cell GR287
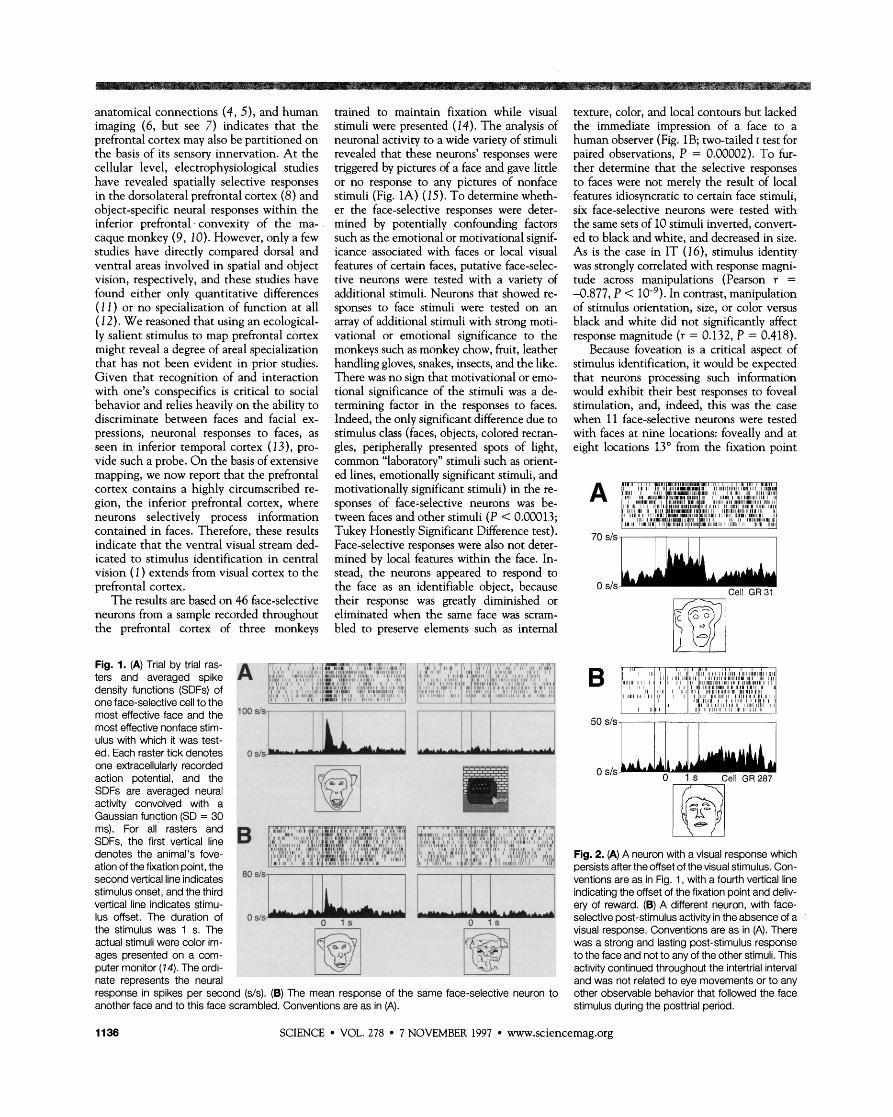
Fig. 2. (A) A neuron with a visual response which persists after the offset of the visual stimulus. Con- ventions are as in Fig. 1, with a fourth vertical line indicating the offset of the fixation point and deliv- ery of reward. (6) A different neuron, with face- selective post-stimulus activity in the absence of a visual response. Conventions are as in (A). There was a strong and lasting post-stimulus response to the face and not to any of the other stimuli. This activity continued throughout the intertrial interval and was not related to eye movements or to any other observable behavior that followed the face stimulus during the posttrial period.
1136 SCIENCE VOL. 278 7 NOVEMBER 1997 www.sciencemag.org
(12.7 versus 5.0 spikes per second over base- line; P = 0.00016, two-tailed t test for un- paired observations). Typically, there was a maximal response to foveal stimulation and weaker resDonses to a subset of the extrafo- veal stimuii. The foveal emphasis and rela- tively large receptive fields of face-selective neurons are similar to neurons in IT cortex (13).
An interesting feature of face-selective responses was their marked tendency to ei- ther continue or begin firing after stimulus offset. We observed two types of persistent remnses. First. "onset" face-selective visual re&nses that Lgan with stimulus onset and persisted from 200 to 1500 ms after offset of the visual stimulus were observed for 15/18 of the face-selective neurons with tonic re- sponses (Fig. 2A) (17). Most remarkably, in six face-selective neurons, we observed a sec- ond type of persistent face-selective activity: "offset" responses (Fig. 2B) that began only after stimulus offset and lasted for up to 2600 ms (until the next trial began). The firing of these neurons was not related to eve move- ments or to any other observable 'behavior articular to the offset of the face stimuli. These responses, indistinguishable from stimulus-selective delav activitv seen in memory tasks,. were observed G t h in two monkeys that had been trained on memory tasks and in a monkey that viewed visual stimuli while fixating but was never trained
nod activity does not depend on intention to make a response, but appears to reflect an intrinsic property of the neurons' responses to visual stimuli.
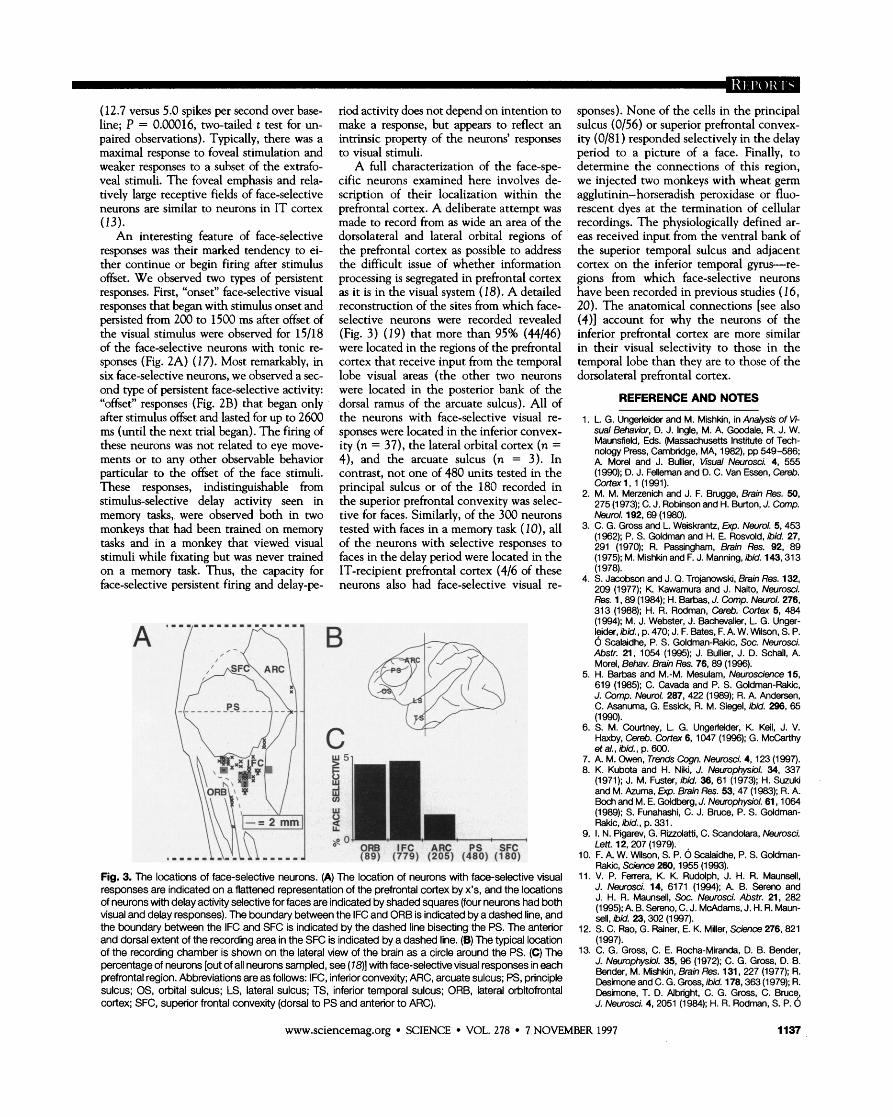
A full characterization of the face-spe- cific neurons examined here involves de- scription of their localization within the prefrontal cortex. A deliberate attempt was made to record from as wide an area of the dorsolateral and lateral orbital regions of the prefrontal cortex as possible to address the difficult issue of whether information processing is segregated in prefrontal cortex as it is in the visual system (18). A detailed reconstruction of the sites from which face- selective neurons were recorded revealed (Fig. 3) (19) that more than 95% (44146) were located in the regions of the prefrontal cortex that receive input from the temporal lobe visual areas (the other two neurons were located in the posterior bank of the dorsal ramus of the arcuate sulcus). All of the neurons with face-selective visual re- sponses were located in the inferior convex- ity (n = 37), the lateral orbital cortex (n = 4), and the arcuate sulcus (n = 3). In contrast, not one of 480 units tested in the principal sulcus or of the 180 recorded in the superior prefrontal convexity was selec- tive for faces. Similarly, of the 300 neurons tested with faces in a memory task (JO), all of the neurons with selective responses to faces in the delav period were located in the
on a memory task. -Thus, the capacity for IT-recipient preiibntal cortex (416 of these face-selective persistent firing and delay-pe- neurons also had face-selective visual re-
Fig. 3. The locations of face-selective neurons. (A) The location of neurons with face-selective visual responses are indicated on a flattened representation of the prefrontal cortex by x's, and the locations of neurons with delay activity selective for faces are indicated by shaded squares (four neurons had both visual and delay responses). The boundary between the IFC and ORB is indicated by a dashed line, and the boundary between the IFC and SFC is indicated by the dashed line bisecting the PS. The anterior and dorsal extent of the recording area in the SFC is indicated by a dashed line. (6) The typical location of the recording chamber is shown on the lateral view of the brain as a circle around the PS. (C) The
, - = 2 mm
,I.I - - - I I----.
percentage of neurons [out of all neurons sampled, see (1 8)] with face-selectivevisual responses in.each prefrontal region. Abbreviations are as follows: IFC, inferior convexity; ARC, arcuate sulcus; PS, principle
"& W
0 2 $ 0
ORB IFC ARC PS SFC (89) (779) (205) (480) (180)
sulcus; OS, orbiial sulcus; LS, lateral sulcus; TS, inferior temporal sulcus; ORB, lateral orbiiofrontal cortex; SFC, superior frontal convexity (dorsal to PS and anterior to ARC).
sponses). None of the cells in the principal sulcus (0156) or superior prefrontal convex- ity (0181) responded selectively in the delay period to a picture of a face. Finally, to determine the connections of this region. " ,
we injected two monkeys with wheat germ agglutinin-horseradish peroxidase or fluo- rescent dyes at the termination of cellular recordings. The physiologically defined ar- eas received input from the ventral bank of the superior temporal sulcus and adjacent cortex on the inferior temporal gyrus-re- gions from which face-selective neurons have been recorded in ~revious studies (1 6. . ,
20). The anatomical connections [see also (411 account for whv the neurons of the . ,- inferior prefrontal cortex are more similar in their visual selectivity to those in the temporal lobe than they are to those of the dorsolateral prefrontal cortex.
REFERENCE AND NOTES
1. L. G. Ungerieider and M. Mishkin, in Andpis of Vi- sual Behavior, D. J. Ingle, M. A Goodale, R. J. W. Maunsfield, Ed?.. (Massachusetts Institute of Tech- nology Press. Cambridge, MA. 1982), pp 549686; A Morel and J. Bullier, Visual Neurosci. 4, 555 (1990); D. J. Felleman and D. C. Van Essen. Cereb. Cortex 1, 1 (1991).
2. M. M. Merzenich and J. F. Brugge, Brain Res. 50, 275 (1973); C. J. Robinson and H. Burton. J. Comp. NeuruI. 192,69 (1 980).
3. C. G. Gross and L. Weislaantz, l3p. Neurol. 5.453 (1962); P. S. Gddman and H. E. Rowold, ibid. 27, 291 (1970); R. Passingham, Brain Res. 92, 89 (1 975); M. Mishkin and F. J. Manning, ibid. 114,313 (1 978).
4. S. Jacobson and J. Q. Trojanowski, Brain Res. 132, 209 (1977); K. Kawarnura and J. Naito, Nwmci. Res. 1,89 (1984); H. Barbas, J. Comp. Nwrol. 276, 313 (1988); H. R. Rodman, Cereb. Cortex 5, 484 (1994); M. J. Webster, J. Bacheval'i, L. G. Unger- I$der,ibid., p. 470; J. F. Bates, F. A. W. Wilson, S. P. 0 Scalaidhe. P. S. Gddman-Mc, Soc. Nwroscii. Abstr. 21, 1054 (1995); J. Eullier, J. D. Schall, A. Morel, Behav. Brain Res. 76,89 (1996).
5. H. Barbas and M.-M. Mesulam, Nwmcience 15. 619 (1985); C. Cavada and P. S. Gddman-Rakic. J. Comp. Neurol. 287, 422 (1989); R. A. Andersen, C. Asanuma, G. Essick, R. M. Siegel, ibid. 296,65 (1990).
6. S. M. Courtney, L G. Ungerleider, K. Keil. J. V. Haxby, Cereb. Cortex 6, 1047 (1996); G. McCarthy eta/. , ibid., p. 600.
7. A. M. Owen. Trenok Cogn. Neurosc. 4,123 (1997). 8. K. Kubda and H. Niki. J. Newophysid. 34, 337
(1971); J. M. Fuster, ibid. 36, 61 (1973); H. Suzuki and M. Azuma, l3p. Brain Res. 53,47 (1983); R. A. Boch and M. E. Goldberg. J. Nwrophysiol. 61,1064 (1989); S. Funahashi. C. J. W e , P. S. Goldman- Rakic, ibid., p. 331.
9. 1. N. Pigarev, G. Rinolatti, C. Scanddara, Neumci. Lett. 12, 207 (1979).
10. F. A. W. Wilson, S. P. 0 Scalaidhe, P. S. Gddman- Rakic, Science 260,1955 (1 993).
11. V. P. Fenera. K. K. Rudolph, J. H. R. Maunsell, J. Neurosci. 14, 6171 (1994); A. B. Sereno and J. H. R. Maunsell, Soc. Neumci. Abstr. 21, 282 (1995); A B. Sereno. C. J. McAdams, J. H. R. Maun- sell, (bid. 23.302 (1 997).
12. S. C. Rao, G. Rainer, E. K. Miller, Science 276,821 (1 997).
13. C. G. Gross, C. E. Rocha-Miranda. D. B. Bender, J. Nwrophysid. 3 6 9 6 (1972); C. G. Gross, D. B. Bender, M. Mishkin. Bran Res. 131, 227 (1977); R. Desimone and C. G. Gross, ibid. 178,363 (1979); R. Desimone. T. D. Albright, C. G. Gross, C. Bruce, J. Neurosw. 4,2051 (1984); H. R. Rodman. S. P. 0
www.sciencemag.org SCIENCE VOL. 278 7 NOVEMBER 1997 1137
Scaladhe, C. G. Gross, J. Neurophysioi. 70, 11 15 (1 993).
14. Monkeys were trained by successve approxma- tion to f~xate wlthn 2.0" of the fixatlon point. If the animal's eye postion left the flxaton window, the flxat~on l~ght extngushed, no reward was d e v - ered, and a 1 s tme-out was imposed In addtion to the lntertral interval. A trlal conssted of: flxaton of a centrally presented flxation pont for 0.5 s, 1 0 s of visual st~mulus presentation, followed by an addi- tional 0.5 s of f~xaton. No behavioral response oth- er than vlsual fixat~on was required, and stimuli were presented In a randomzed order. Every neu- ron was tested on one or more basic sets of color stmul presented on a computer montor including faces, objects. and colored rectangles. Stimull typ- ically subtended 8" to 10" of visual angle and were presented on a yonitor with 640 p x e by 400 pixel resolution and 16-b~ t color. In two of three mon- keys, when neurons appeared to show selectiv~ty for faces, they were then tested exhaust~vely wlth addtona s t m u to assess the bass for an appar- ent seectlve response to a face stimulus.
15. The mean flrlng rate was calculated for five time Intervals for the task. 1 s during the pretr~al perlod precedng the onset of the flxaton pont, 400 ms starting 100 ms after v~sual f~xat~on, 200 ms begin- ning 100 ms after presentation of the visual st~mulus, 900 ms from 100 ms after onset of the vsua stimu- lus, and 2000 ms starting 100 ms after offset of the visual stimulus. An analysis of variance [ANOVA) was then petformed using stmulus as a factor and f~rng rate in the time w~ndows as a factor with repeated measures The ANOVA ylelded P values for the ef- fects of time period, st~mulus, and interaction be- tween stimulus and tme perod Only neurons with a significant main effect of stimulus or a significant interacton between stimulus and tme window and a significant one-way ANOVA for one of the cue peri- ods or the postcue period at a level of P < 0.05 were considered select~vely responsive. Usng the crlteria of Perret and colleagues [20), cells that met the ANOVA crlter~a and had a response magnitude to the best face stmuus that was more than twice as strong as the best response to a nonface stimulus were considered to be face-selectve.
16. E. L. Schwartz, R. Desimone, T. D. Albr~ght, C. G. Gross, Proc. Natl. Acad Sci. U.S.A. 80, 5776 [1983), E. T. Rolls and G. C. Bayis, Exp. Brain Res. 65, 38 (1986); G. Sary, R. Vogels, G. A. Orban, Science 260, 995 (1 993).
17. Offset of response was determined by when the response returned to below (or above) a 9556 confi- dence interval based on pretral firng for at least 100 ms [J. M MacPherson and J W. Aldrldge, Brain Res. 175, 183 [1979)].
18 To enable an unb~ased sample of neurons, and therefore meaningful lntrareglonal comparisons, neurons were not preselected for visual responsive- ness, visual selectivity, or any other form of task- related actlvty.
19. Flattened representations of the prefrontal cortex were constructed with methods smilar to D C. Van Essen and J H R. Maunseil [J Comp. Neural 191, 255 (1980)] as modified by H. Barbas 14). The loca- tion of each face-selectve neuron was drawn on a tracng of the appropriate secton through the mon- key's brarn, these sectrons were compared to sec- tions of a cortca atlas, and the neurons' locaton was transferred to the atlas. Then the cortca atlas with the locations ofthe cells was flattened along the midpont between white matter and the p a sutface
20. D. I Perret, E T. Rolls, W. Caan, Exp Brain Res. 47, 329 (1982); G. C. Baylls, E. T Rolls, C. M. Leonard, J. Neurosci 7. 330 (1 987)
21. Experments were conducted In accordance wth the Yale University Anma Care Committee. Supported by Natlona lnstltute of Mental Health grants MH44866 and MH38546 to P.S.G.-R. and by Mc- Donnell Foundation fellowsh~p JSMF 91-47 to S.P.OS. We thank M. Chafee, K. McEvoy, L. Ro- manskl, and N. Vnek for comments on prellmnary drafts of the manuscript.
23 July 1997: accepted 3 October 1997
Thermsregulation in the Mouths of Feeding Gray Whales
John E. Heyning and James G. Mead
Vascular structures for heat conservation In the tongue of the gray whale (Eschrichtius robustus) are reported here. Numerous individual countercurrent heat exchangers are found throughout the massive tongue. These converge at the base of the tongue to form a bilateral pair of retia. Temperature measurements from the oral cavity of a l~ve gray whale indicate that more heat may be lost through the blubber layer over the body than through the tongue, desp~te the fact that the tongue is far more vascularized and has much less insulation. These heat exchangers substantially reduce heat loss when these whales feed in cold waters.
Because of the high thermal conductivity of water, the oceans and seas are energetically challenging environments for endotherms. Countercurrent heat exchangers in the vas- cular system of whales assist in the regulation of body temperature (1 ) : those within the fins and flukes (2) function to conserve core body temperature, whereas those associated with the re~roductive tracts (3) serve to prevent hyperthermia in these heat-sensitive organs. The mouths of baleen whales (sub- - order Mysticeti) are relatively large, in order to accommodate the filtering surface com- posed of baleen, and the oral cavity of baleen whales is a major site for heat loss during feeding. To date, there have been no mea- surements to quantifv this loss (4), nor have any structures been identified that would serve to reduce it.
In each of two young gray whale calves dissected (5) (LACM 88981, 3.98 m long; and LACM 92044, 5.25 In long), we found numerous individual countercurrent heat exchangers spaced throughout the tongue (Fig. 1A). These periarterial venous retia (6) consist of a single central artery encir- cled by a sheath of surrounding veins and are about 0.5 cm in diameter, making them similar in size to the individual countercur- rent heat exchaneers within the flukes of - the same animals. The groups of blood ves- sels are oriented in planes, so that cool venous blood returning from the surface of the tongue flows first ventrally then poste- riorly toward the back of the tongue. Along the posterior half of the base of the tongue, these individual countercurrent heat ex- changers converge to form a bilateral pair of large vascular retia (Fig. 1B), each com- posed of over 50 such heat exchangers ori- ented adjacent and parallel. We term each
vascular bundle a lineual rete. In the - 5.25-ln calf, each of these llngual retla was about 13 br 2 cm in cross-section and ao- proximate1 55 cm long. The lingual re& form one of the lareest countercurrent heat "
exchangers described in any endotherm (2, 3). A t the base of the toneue, these heat- - exchanger retla sweep dorsally and separate Into numerous ~ndivldual arterles and velns that connect to the external carotid artery and jugular vein, respectively. The counter- current vascular retia are situated in the fascia1 plane located between the tongue muscles (styloglossus, hyoglossus, and in- trinsic tongue muscles) and the more super- ficial gular muscles (geniohyoideus and myohyoideus). This vascular complex is de- rived from the lingual arteries and veins.
The distinct lingual artery is short, bi- furcating into numerous arteries about 3 cm distal to the external carotid artery. This proliferation of arterles just proximal to the lingual rete functionally increases the cross-sectional area of this vascular system and the surface area of the blood vessel walls. Both of these structural at- tributes fi~nction to slow blood flow in any single vessel, thereby increasing the time available for the transfer of heat from ar- teries to veins. This should greatly en- hance the efficiency of the countercurrent heat-exchaneer svstetn.
" 3
We measured a lingual surface area of 0.325 m%n the 5.25-m soecimen, which yields an estimated surface area of 2 mZ for a 12-m adult. This represents approximately 5% of the surface area of the body ( 7 ) , excludine the extremities. Because a mobile " and dexterous tongue 1s needed to control water flow over the baleen, the toneue - could not properly function if it were cloaked with a thick, semirigid adiuose laver
J. E. Heyning, Secton of Vertebrates, Natural History Mu- similar to the blubier encYasing ;he body.
seum of Los Anaees Countv. 900 Exoositon Boulevard. However, the outer surface of the tongue is Los Angeles, Ci90007. USA. ~-mali : [email protected], invested with a diffuse laver of fatty tissue edu J. G. Mead, Dvison of Mammals, Natonal Museum of
about 2 cm thick.
Natural Hstory, Washngton, DC 20560, USA. E-mail: Skin to am- [email protected]~.edu bient temperature is a good indicator of
1138 SCIENCE VOL 278 7 NOVEMBER 1997 www.sciencemag.org