are multinational corporations safer?
TRANSCRIPT
Are Multinational Corporations Safer?Author(s): Israel ShakedSource: Journal of International Business Studies, Vol. 17, No. 1 (Spring, 1986), pp. 83-106Published by: Palgrave Macmillan JournalsStable URL: http://www.jstor.org/stable/154751 .
Accessed: 29/09/2013 19:51
Your use of the JSTOR archive indicates your acceptance of the Terms & Conditions of Use, available at .http://www.jstor.org/page/info/about/policies/terms.jsp
.JSTOR is a not-for-profit service that helps scholars, researchers, and students discover, use, and build upon a wide range ofcontent in a trusted digital archive. We use information technology and tools to increase productivity and facilitate new formsof scholarship. For more information about JSTOR, please contact [email protected].
.
Palgrave Macmillan Journals is collaborating with JSTOR to digitize, preserve and extend access to Journal ofInternational Business Studies.
http://www.jstor.org
This content downloaded from 136.167.3.36 on Sun, 29 Sep 2013 19:51:12 PMAll use subject to JSTOR Terms and Conditions
ARE MULTINATIONAL CORPORATIONS SAFER?
Israel Shaked* Boston University
Abstract. The failure-probabilities of a sample of multinational corporations (MNCs) are derived and compared with those of a control group of domestic corporations (DMCs). The results sug- gest that the mean insolvency-probability of DMCs is significantly higher than that of the MNCs. It is also observed that MNCs are significantly more capitalized, and the standard deviation of their equity as well as their average systematic risk are also significantly lower. Furthermore, the average insolvency probability of the DMCs is more sensitive to changes in the values of the parameters than those of the MNCs.
While much has been written on the potential effects of international diversification, relatively little has focused specifically on the risk-reduc- tion via corporate international diversification. In this paper we directly calculate the failure-probabilities of a sample of multinational corporations (MNCs) and compare them with those derived for a control group of domestic corporations (DMCs). Section one represents a discussion of the relevance of international diversification at the corporate level, and the second section considers the existing empirical evidence. The third section provides the motivation of the proposed approach and in section four the methodology, data and estimation procedure are presented. The results are evaluated in the fifth section and the final section presents the summary.
RELEVANCE OF INTERNATIONAL DIVERSIFICATION AT THE CORPORATE LEVEL
The degree to which diversification can reduce risk depends on the cor- relation among security returns. Within a given economy, a strong tendency
* Israel Shaked is Associate Professor of Finance at Boston University's School of Management. He earned his Doctor of Business Administration degree at the Harvard Business School, and his B.A. in economics, B.A. in statistics and M.B.A. from the Hebrew University of Jerusalem. He has published in the areas of corporate financial decisions, mergers and acquisitions, financial institutions and international finance. His book "Takeover Madness: Corporate America Fights Back," published by John Wiley, is forthcoming. The author is grateful to Allen Michel and anonymous referees for helpful comments and to Teresa Jones for excellent research assistance. Any remaining errors are, of course, his own. Date Received: March 27, 1984; Revised: October 30, 1984/April 14, 1985; Accepted: July 12, 1985.
83
This content downloaded from 136.167.3.36 on Sun, 29 Sep 2013 19:51:12 PMAll use subject to JSTOR Terms and Conditions
JOURNAL OF INTERNATIONAL BUSINESS STUDIES, SPRING 1986
usually exists for economic phenomena to move more or less in unison, which gives rise to periods of relatively high or low business activity. This also holds true for individual securities and industries. The existence of a relatively high degree of positive correlation within an economy suggests the possibility that risk reduction might be facilitated by diversifying securities portfolio internationally. That potential gain has been analyzed by applying portfolio theory. Grubel [ 1968], was the first to apply it, and his results have been subsequently confirmed and extended by Levy and Sarnat [1970], Grubel and Fander [1971],Agmon [1972], Solnik ([1973, 1974]), Lessard ([1974, 1976]), and others in a book edited by Elton and Gruber [1975]. If international capital markets are perfectly inte- grated, if transaction costs are low, and if investors are rational and risk averse, then there are no diversification benefits inherent to multinational corporations that could not be obtained by investors making direct port- folio investment in the countries in which the multinational corporations would otherwise operate. That is, in the case of perfect financial markets there is no systematic advantage to owning shares in multinational firms versus holding shares directly in firms in different countries. Some assert, however, that because of control on capital flows, differential trading costs, different tax structures, and several other factors, markets are im- perfectly integrated. Hence, investors may not actually be diversifying internationally and thus foregoing advantages which could accrue to them if they were willing to hold foreign securities. Thus, if markets are not per- fectly integrated, the multinational corporation is performing a valuable function for investors. Another aspect of corporate international diversifi- cation is the potential reduction in the probability of bankruptcy. In this sense, the argument is perfectly analogous to the discussion of the benefits of conglomeration. This discussion is based on the recognized distinction between lender diversification and borrower diversification (Lewellen [1971 ]): when a lender diversifies, he "spreads the risk" by lending small fractions of his total portfolio to each of a number of different enterprises. In this manner, he diminishes the probability that a very large percentage of his loan will turn bad simultaneously, but he cannot thereby affect the probability that any given individual borrower will be forced to default. On the other hand, if certain of the borrowers should diversify by merging their operations, the joint probability of default under the collection of outstanding loans is reduced. The phenomenon produces enhanced ability of diversified corporations to meet the cash-inadequacy test of lenders, and thus creates additional borrowing capacity. Similarly, corporate inter- national diversification has its own merit even if there are no barriers to an investor's diversification in his own portfolio (see Shapiro [ 1978 ] ). Though the potential for risk reduction is clear, the identity of the "true winner" is less obvious. If bankruptcy is costless, then any increase in the value of the firm's debt (if diversifying internationally at the corporate level re- duces the probability that the firm would default on its debt) will be exactly offset by a decrease in the value of equity. This argument has been
84
This content downloaded from 136.167.3.36 on Sun, 29 Sep 2013 19:51:12 PMAll use subject to JSTOR Terms and Conditions
ARE MULTINATIONAL CORPORATIONS SAFER?
initiated for the conglomeration-analogy by Higgins [1971 ], and has been rigorously proven by Rubinstein [1973], Higgins and Schall [1975], and Galai and Masulis [1976]. However, the bondholders' gain yields greater debt-capacity for the firm, which allows greater leverage and ultimately, perhaps, greater gains for stockholders. In sum, the existing literature recognizes the potential risk reduction via corporate multinational diversifi- cation. The relevance of this issue hinges on the generally believed proposi- tion that for various reasons, markets are imperfectly integrated. How- ever, even in a world with no imperfections, corporate multinational diversification is supported by the potential for a reduced insolvency- probability and the associated increase in debt-capacity.
MULTINATIONAL CORPORATIONS AND RISK REDUCTION: EXISTING EMPIRICAL EVIDENCE
The issue of whether the market assigns different measures of risk to MNCs than to otherwise comparable firms has been researched by Hughes, Logue and Sweeney [1975]. Comparing various risk measures of 46 MNCs with 100 DMCs (for the period 1970-1973), they have observed that multina- tional corporations have lower systematic risk (3) as well as lower unsys- tematic risk. Hence, MNCs also have a lower total risk (as measured by the standard deviation of the rates of return on equity). Thus, they concluded that their results support the view that investors perceive multinational corporations as providing substantial diversification benefits.
Following Hughes et al., Agmon and Lessard [1977] published their work, focusing on the question of whether investors appear to recognize the diversification opportunities provided by shares of MNCs. They ranked 217 U.S. firms according to their degree of international activity, and grouped them in deciles in order to reduce the influence of differences other than the extent of international activity. Then they regressed the composite monthly return series (1959-1972) for the resultant portfolios on the indices for the U.S. stock market and the rest of the world. Their results indicated that the betas relating the returns on each of the port- folios to the U.S. index are much higher for those portfolios with little international involvement. Hence, they concluded that the market recog- nizes the geographically diversified nature of the U.S.-based multinational corporations as well as the extent of their international involvement. In sum, empirical evidence indicates recognition of the different systematic risk of MNCs by the market.
THE MOTIVATION OF THE PROPOSED METHODOLOGY
There have been a number of studies on predicting corporate financial per- formance in general and insolvency-risk in particular. The most notable published contributions are Altman (1968, 1971, 1973, 1977), Altman, Haldeman and Narayanan [1977], Altman and McGough [1974], Edmis- ter [1972], Deakin [1972], and Beaver (1966, 1968a, 1968b). The
85
This content downloaded from 136.167.3.36 on Sun, 29 Sep 2013 19:51:12 PMAll use subject to JSTOR Terms and Conditions
JOURNAL OF INTERNATIONAL BUSINESS STUDIES, SPRING 1986
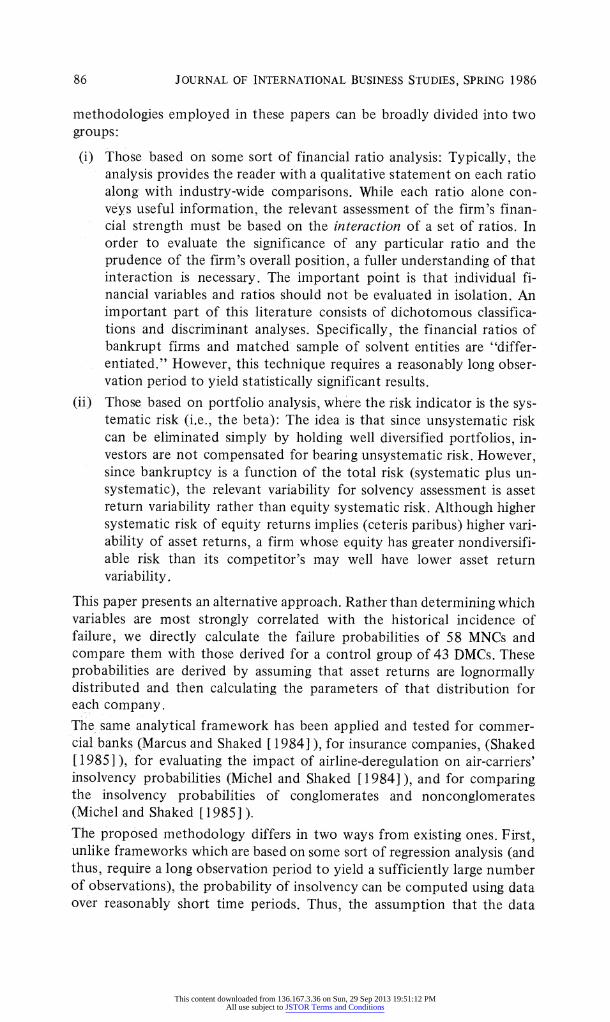
methodologies employed in these papers can be broadly divided into two groups:
(i) Those based on some sort of financial ratio analysis: Typically, the analysis provides the reader with a qualitative statement on each ratio along with industry-wide comparisons. While each ratio alone con- veys useful information, the relevant assessment of the firm's finan- cial strength must be based on the interaction of a set of ratios. In order to evaluate the significance of any particular ratio and the prudence of the firm's overall position, a fuller understanding of that interaction is necessary. The important point is that individual fi- nancial variables and ratios should not be evaluated in isolation. An important part of this literature consists of dichotomous classifica- tions and discriminant analyses. Specifically, the financial ratios of bankrupt firms and matched sample of solvent entities are "differ- entiated." However, this technique requires a reasonably long obser- vation period to yield statistically significant results.
(ii) Those based on portfolio analysis, where the risk indicator is the sys- tematic risk (i.e., the beta): The idea is that since unsystematic risk can be eliminated simply by holding well diversified portfolios, in- vestors are not compensated for bearing unsystematic risk. However, since bankruptcy is a function of the total risk (systematic plus un- systematic), the relevant variability for solvency assessment is asset return variability rather than equity systematic risk. Although higher systematic risk of equity returns implies (ceteris paribus) higher vari- ability of asset returns, a firm whose equity has greater nondiversifi- able risk than its competitor's may well have lower asset return variability.
This paper presents an alternative approach. Rather than determining which variables are most strongly correlated with the historical incidence of failure, we directly calculate the failure probabilities of 58 MNCs and compare them with those derived for a control group of 43 DMCs. These probabilities are derived by assuming that asset returns are lognormally distributed and then calculating the parameters of that distribution for each company. The same analytical framework has been applied and tested for commer- cial banks (Marcus and Shaked [1984]), for insurance companies, (Shaked [1985]), for evaluating the impact of airline-deregulation on air-carriers' insolvency probabilities (Michel and Shaked [1984]), and for comparing the insolvency probabilities of conglomerates and nonconglomerates (Michel and Shaked [1985]). The proposed methodology differs in two ways from existing ones. First, unlike frameworks which are based on some sort of regression analysis (and thus, require a long observation period to yield a sufficiently large number of observations), the probability of insolvency can be computed using data over reasonably short time periods. Thus, the assumption that the data
86
This content downloaded from 136.167.3.36 on Sun, 29 Sep 2013 19:51:12 PMAll use subject to JSTOR Terms and Conditions
ARE MULTINATIONAL CORPORATIONS SAFER?
collected are still relevant to the problem at hand is far more palatable. More importantly, dichotomous classification and discriminant analyses use a sample consisting of firms with an ex post "zero-one" probability of bankruptcy. In contrast, our framework provides an opportunity to directly locate many firms along a continuum of ex-ante failure rates which are derived independently from any actual (historical) failure-rates.
METHODOLOGY, DATA AND ESTIMATION PROCEDURE
The Basic Framework
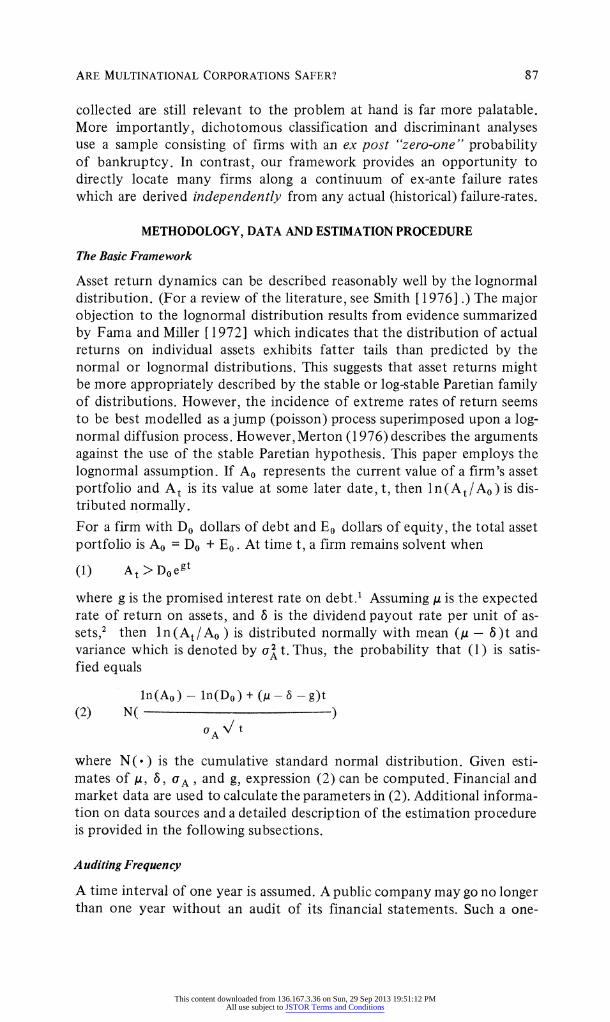
Asset return dynamics can be described reasonably well by the lognormal distribution. (For a review of the literature, see Smith [ 1976] .) The major objection to the lognormal distribution results from evidence summarized by Fama and Miller [1972] which indicates that the distribution of actual returns on individual assets exhibits fatter tails than predicted by the normal or lognormal distributions. This suggests that asset returns might be more appropriately described by the stable or log-stable Paretian family of distributions. However, the incidence of extreme rates of return seems to be best modelled as a jump (poisson) process superimposed upon a log- normal diffusion process. However, Merton (1976) describes the arguments against the use of the stable Paretian hypothesis. This paper employs the lognormal assumption. If Ao represents the current value of a firm's asset portfolio and At is its value at some later date, t, then ln(At/Ao) is dis- tributed normally. For a firm with Do dollars of debt and Eo dollars of equity, the total asset portfolio is Ao = Do + Eo. At time t, a firm remains solvent when
(1) At > Doegt
where g is the promised interest rate on debt.' Assuming , is the expected rate of return on assets, and 6 is the dividend payout rate per unit of as- sets,2 then ln(At/Ao ) is distributed normally with mean (, - 6)t and variance which is denoted by a2 t. Thus, the probability that (1) is satis- fied equals
ln(Ao) - ln(Do) + (- - g)t
(2) N( )
aAo t
where N(.) is the cumulative standard normal distribution. Given esti- mates of 6, , UA, and g, expression (2) can be computed. Financial and market data are used to calculate the parameters in (2). Additional informa- tion on data sources and a detailed description of the estimation procedure is provided in the following subsections.
Auditing Frequency
A time interval of one year is assumed. A public company may go no longer than one year without an audit of its financial statements. Such a one-
87
This content downloaded from 136.167.3.36 on Sun, 29 Sep 2013 19:51:12 PMAll use subject to JSTOR Terms and Conditions
JOURNAL OF INTERNATIONAL BUSINESS STUDIES, SPRING 1986
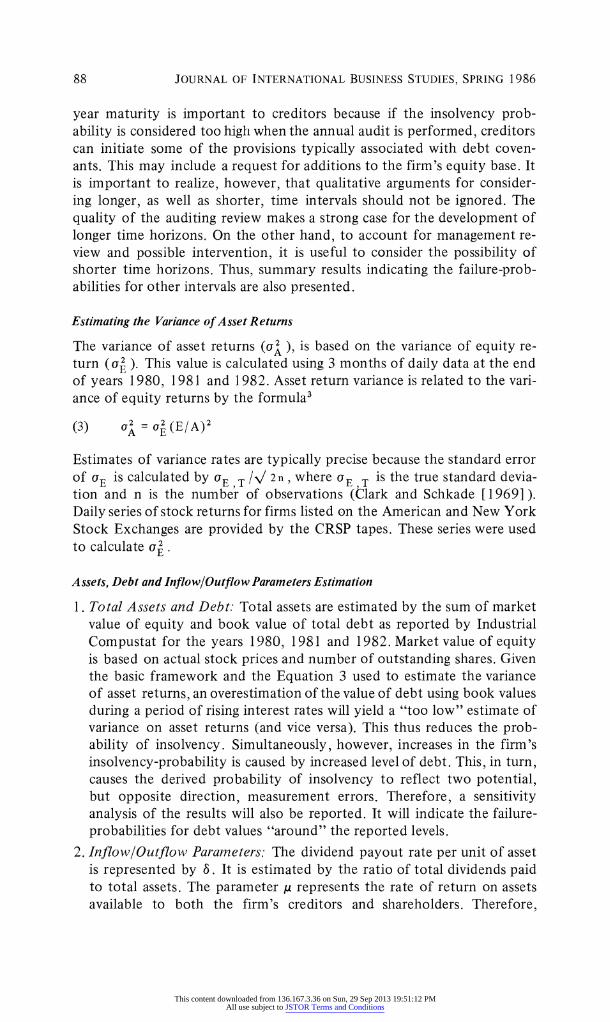
year maturity is important to creditors because if the insolvency prob- ability is considered too high when the annual audit is performed, creditors can initiate some of the provisions typically associated with debt coven- ants. This may include a request for additions to the firm's equity base. It is important to realize, however, that qualitative arguments for consider- ing longer, as well as shorter, time intervals should not be ignored. The quality of the auditing review makes a strong case for the development of longer time horizons. On the other hand, to account for management re- view and possible intervention, it is useful to consider the possibility of shorter time horizons. Thus, summary results indicating the failure-prob- abilities for other intervals are also presented.
Estimating the Variance of Asset Returns
The variance of asset returns (a' ), is based on the variance of equity re- turn (o ). This value is calculated using 3 months of daily data at the end of years 1980, 1981 and 1982. Asset return variance is related to the vari- ance of equity returns by the formula3
(3) A = oE (E/A)2
Estimates of variance rates are typically precise because the standard error of aE is calculated by aE ,T \/ 2n, where UE T is the true standard devia- tion and n is the number of observations (Clark and Schkade [1969]). Daily series of stock returns for firms listed on the American and New York Stock Exchanges are provided by the CRSP tapes. These series were used to calculate o.
Assets, Debt and Inflow/Outflow Parameters Estimation
1. Total Assets and Debt. Total assets are estimated by the sum of market value of equity and book value of total debt as reported by Industrial Compustat for the years 1980, 1981 and 1982. Market value of equity is based on actual stock prices and number of outstanding shares. Given the basic framework and the Equation 3 used to estimate the variance of asset returns, an overestimation of the value of debt using book values during a period of rising interest rates will yield a "too low" estimate of variance on asset returns (and vice versa). This thus reduces the prob- ability of insolvency. Simultaneously, however, increases in the firm's insolvency-probability is caused by increased level of debt. This, in turn, causes the derived probability of insolvency to reflect two potential, but opposite direction, measurement errors. Therefore, a sensitivity analysis of the results will also be reported. It will indicate the failure- probabilities for debt values "around" the reported levels.
2. Inflow/Outflow Parameters: The dividend payout rate per unit of asset is represented by 6. It is estimated by the ratio of total dividends paid to total assets. The parameter p represents the rate of return on assets available to both the firm's creditors and shareholders. Therefore,
88
This content downloaded from 136.167.3.36 on Sun, 29 Sep 2013 19:51:12 PMAll use subject to JSTOR Terms and Conditions

ARE MULTINATIONAL CORPORATIONS SAFER?
subtraction of the cost of debt gives the return per unit of assets avail- able to equity holders. Practically, the term (u - g) in equation (2) can be estimated using either an accounting or market approach to the esti- mation of cash flow.
(i.) The accounting measure cash flow approach (AMCF), is based on the expected net cash flow per unit of capital. It is estimated by
(4-A) (net income + depreciation)/assets
or by including changes in working capital in the cash flow,
(4-B) [net income + depreciation ? (Aworking capital)] /assets
where the data on each of the inputs to equation 4-B (income, de- preciation and changes in working capital) are taken from the In- dustrial Compustat tapes. It may be argued, however, that financial distress may be correlated with poor performance of the asset port- folio. If so, current tax outflow will be an overestimation of the expected tax outflow. To account for such an argument the use of earnings before taxes rather than net income figures in equations 4-A and 4-B is also considered.
(ii.) The market measure cash flow approach (MMCF), is based on the expected net cash flow per unit of capital. It is estimated by
(5) [E(RA)A- gD] /A
where
E(RA) = RF + A [E(RM) - RF]
and
E D OA =-OE + - OD A A
with the following notation:
E( )= expectation operator RF = risk-free rate of interest RM = rate of return on the value-weighted market portfolio
fj = Cov(R , Rj)/oa = systematic (nondiversifiable) risk of securiy j.
and the parameters estimated as follows:
3j: = Insolvency probabilities are computed at the end of 1980, 1981 and 1982. The beta of each firm's equity is estimated based on the preceding 60 monthly returns. An approximation of .44, reflecting the beta of the corporate bond index is used to estimate the beta of the debt for each firm.
RF: = The Treasury-bill rate on the estimation date is used to compute insolvency probabilities at year end.
89
This content downloaded from 136.167.3.36 on Sun, 29 Sep 2013 19:51:12 PMAll use subject to JSTOR Terms and Conditions
JOURNAL OF INTERNATIONAL BUSINESS STUDIES, SPRING 1986
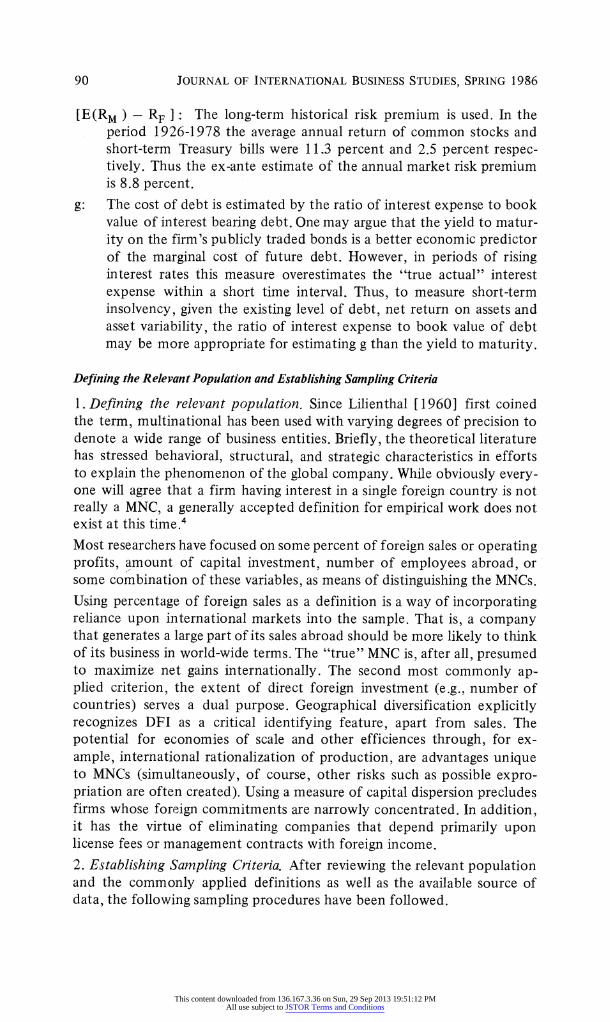
[E(RM ) - RF ]: The long-term historical risk premium is used. In the period 1926-1978 the average annual return of common stocks and short-term Treasury bills were 11.3 percent and 2.5 percent respec- tively. Thus the ex-ante estimate of the annual market risk premium is 8.8 percent.
g: The cost of debt is estimated by the ratio of interest expense to book value of interest bearing debt. One may argue that the yield to matur- ity on the firm's publicly traded bonds is a better economic predictor of the marginal cost of future debt. However, in periods of rising interest rates this measure overestimates the "true actual" interest expense within a short time interval. Thus, to measure short-term insolvency, given the existing level of debt, net return on assets and asset variability, the ratio of interest expense to book value of debt may be more appropriate for estimating g than the yield to maturity.
Defining the Relevant Population and Establishing Sampling Criteria
1. Defining the relevant population. Since Lilienthal [1960] first coined the term, multinational has been used with varying degrees of precision to denote a wide range of business entities. Briefly, the theoretical literature has stressed behavioral, structural, and strategic characteristics in efforts to explain the phenomenon of the global company. While obviously every- one will agree that a firm having interest in a single foreign country is not really a MNC, a generally accepted definition for empirical work does not exist at this time.4 Most researchers have focused on some percent of foreign sales or operating profits, amount of capital investment, number of employees abroad, or some combination of these variables, as means of distinguishing the MNCs.
Using percentage of foreign sales as a definition is a way of incorporating reliance upon international markets into the sample. That is, a company that generates a large part of its sales abroad should be more likely to think of its business in world-wide terms. The "true" MNC is, after all, presumed to maximize net gains internationally. The second most commonly ap- plied criterion, the extent of direct foreign investment (e.g., number of countries) serves a dual purpose. Geographical diversification explicitly recognizes DFI as a critical identifying feature, apart from sales. The potential for economies of scale and other efficiences through, for ex- ample, international rationalization of production, are advantages unique to MNCs (simultaneously, of course, other risks such as possible expro- priation are often created). Using a measure of capital dispersion precludes firms whose foreign commitments are narrowly concentrated. In addition, it has the virtue of eliminating companies that depend primarily upon license fees or management contracts with foreign income. 2. Establishing Sampling Criteria. After reviewing the relevant population and the commonly applied definitions as well as the available source of data, the following sampling procedures have been followed.
90
This content downloaded from 136.167.3.36 on Sun, 29 Sep 2013 19:51:12 PMAll use subject to JSTOR Terms and Conditions
ARE MULTINATIONAL CORPORATIONS SAFER?
(i) Criteria Applied to Both The MNCs and The Control Group: First, because accounting data provided in Annual Reports constitutes both the most accessible and reasonably standardized information, only pub- licly held corporations are included. Secondly, because it is probable that industries are effected differently and respond idiosyncratically to the same conditions, both groups are composed only of business en- gaged in manufacturing (i.e., SIC codes in the range 2000-3999). Third, since it also seems that the relative size of the firm might confound an assessment of total risk, the groups were confined to Fortune 500 com- panies for the fiscal year ending 1979, the year prior to the first test period.
(ii) Sampling the Group of MNCs: Initially, corporations have been classified as multinationals on the basis of two conditions:
a) foreign sales account for at least 20 percent of revenues.
b) direct capital investment exists in at least 6 countries outside the United States.5
The genesis of the sample was the Forbes list of America's 125 MNCs, according to volume of foreign sales. Forbes publishes the percent of foreign sales in its rankings. The scope of direct foreign investment was determined by reference to the 1979 edition of The Directory of American Firms Operating in Foreign Countries. The Directory cata- logues those countries in which a company has "substantial direct capital investment, [While] Foreign firms in which American firms participate only on a royalty or profit-sharing basis are omitted." Cross-reference was then made to the 1982 Annual Reports and 10-Ks of companies for which 10 or fewer countries were mentioned to insure that no significant disinvestment had taken place since the statistics had been compiled. At the same time, Forbes lists for fiscal years 1980 to 1982 were used to gather sales data for the study period. The final sample of 58 U.S.-based multinationals has been obtained after the fol- lowing elimination process:
125 Forbes MNCs (58) nonmanufacturing SIC codes
(3) did not meet the foreign sales criterion (5) did not meet the DFI criterion (1) other reasons
58 Final Sample
(iii) Sampling the Control Group: Developing the control group was somewhat more problematic. The primary difficulty in isolating uni- national firms was to guard against the inclusion of companies that were in the process of internationalizing their sphere of operations. The first step was to sort out businesses with capital investments in more than one foreign country. Again, the Directory was used, although this time only as a first approximation. For the control group, Annual Reports
91
This content downloaded from 136.167.3.36 on Sun, 29 Sep 2013 19:51:12 PMAll use subject to JSTOR Terms and Conditions
JOURNAL OF INTERNATIONAL BUSINESS STUDIES, SPRING 1986
for each period were consulted and searched for evidence of omissions or new DFI since the Directory's publication, as well as for levels of foreign sales. With the advent of FASB's statement 14-mandating dis- closure of segment information when 10% or more of total sales, profits, of identifiable assets can be traced to foreign sources-the mere ab- sence of such data confirmed the status of many of the DMCs. In one case, a control company (Handy and Harmon) did have foreign sales above 10% but these were confined to Canada. A few others had ex- port sales in some years in the range of 10-15%, but virtually no DFI. Finally, some eligible companies were eliminated because they were either closely held, traded only on the regional exchanges or OTC or, data was unavailable through both Industrial Compustat tapes and An- nual Reports. The final sample of 43 DMCs has been obtained after the following elimination process:
375 Fortune 500 and not on Forbes list of 125 MNCs. (249) Sales in more than 1 foreign country. ( 73) Not publicly traded, or traded only on OTC or on region-
al exchanges. ( 5) Major changes within the research period in foreign sales
or DFI. ( 5) Data availability and other reasons.
43 Final Sample
RESULTS
Prospective Failure Probabilities
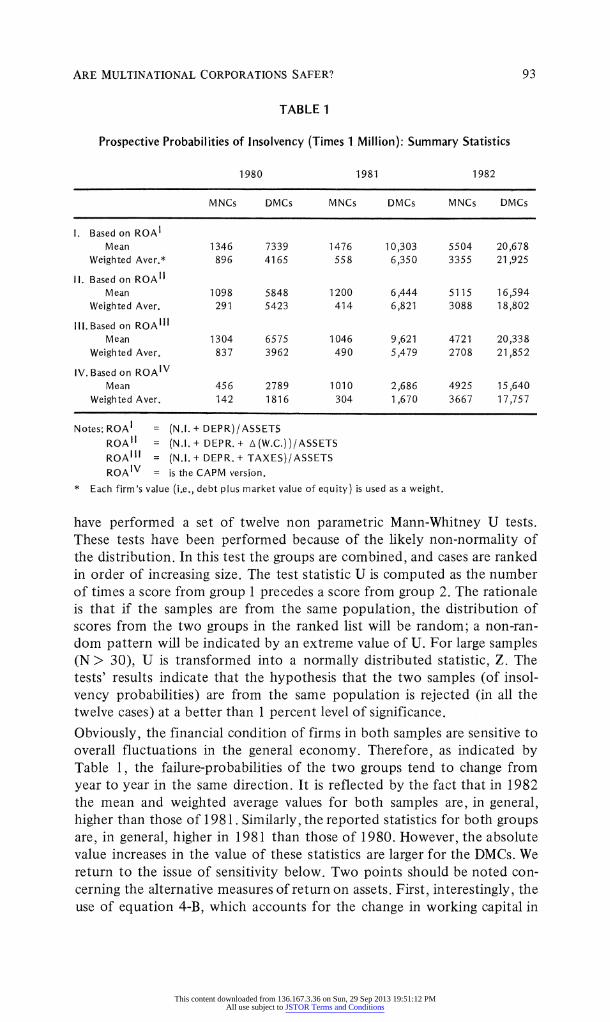
Summary statistics of prospective failure probabilities (multiplied by 1 million for ease of presentation) are provided in Table 1. Though the probabilities calculated for both the MNCs and the control group are typi- cally small, the results are clearly suggestive. As indicated by the table, in every year of the study period (1980-1982) the mean and the weighted (by assets) average failure-probability of the DMCs are higher than those derived for the MNCs. Moreover, as can be observed by reviewing the four panels of Table 1, this relationship holds, independent on the measure used to estimate the expected return on assets. In general, the reported mean probability of the DMCs is larger than that of the MNCs by a factor of five, where depending on the ROA version, this factor varies from three to nine. In order to determine whether the differences between the mean values are statistically significant we have performed a set of twelve t-tests (i.e., 3 years, 4 ROA versions). The tests' results indicate that the mean insol- vency-probability of the DMCs is significantly higher than the correspond- ing values of the MNCs (in every year and for each ROA measure). The t- statistics of the twelve tests ranged from -3.52 to -15.54 (i.e., the results are significant at a better than 1 percent level). In addition, to test whether the two sets of insolvency-probabilities are from the same population we
92
This content downloaded from 136.167.3.36 on Sun, 29 Sep 2013 19:51:12 PMAll use subject to JSTOR Terms and Conditions
ARE MULTINATIONAL CORPORATIONS SAFER?
TABLE 1
Prospective Probabilities of Insolvency (Times 1 Million): Summary Statistics
1980 1981 1982
MNCs DMCs MNCs DMCs MNCs DMCs
I. Based on ROAI Mean 1346 7339 1476 10,303 5504 20,678
Weighted Aver.* 896 4165 558 6,350 3355 21,925
II. Based on ROA11 Mean 1098 5848 1200 6,444 5115 16,594
Weighted Aver. 291 5423 414 6,821 3088 18,802
III. Based on ROAIil Mean 1304 6575 1046 9,621 4721 20,338
Weighted Aver. 837 3962 490 5,479 2708 21,852
IV. Based on ROAIV Mean 456 2789 1010 2,686 4925 15,640
Weighted Aver. 142 1816 304 1,670 3667 17,757
Notes: ROAI = (N.I. + DEPR)/ASSETS ROA1I = (N.I.+ DEPR.+ A(W.C.))/ASSETS ROA111 = (N.I.+ DEPR.+ TAXES)/ASSETS ROAIV = is the CAPM version.
* Each firm's value (i.e., debt plus market value of equity) is used as a weight.
have performed a set of twelve non parametric Mann-Whitney U tests. These tests have been performed because of the likely non-normality of the distribution. In this test the groups are combined, and cases are ranked in order of increasing size. The test statistic U is computed as the number of times a score from group 1 precedes a score from group 2. The rationale is that if the samples are from the same population, the distribution of scores from the two groups in the ranked list will be random; a non-ran- dom pattern will be indicated by an extreme value of U. For large samples (N > 30), U is transformed into a normally distributed statistic, Z. The tests' results indicate that the hypothesis that the two samples (of insol- vency probabilities) are from the same population is rejected (in all the twelve cases) at a better than 1 percent level of significance.
Obviously, the financial condition of firms in both samples are sensitive to overall fluctuations in the general economy. Therefore, as indicated by Table 1, the failure-probabilities of the two groups tend to change from
year to year in the same direction. It is reflected by the fact that in 1982 the mean and weighted average values for both samples are, in general, higher than those of 1981. Similarly, the reported statistics for both groups are, in general, higher in 1981 than those of 1980. However, the absolute value increases in the value of these statistics are larger for the DMCs. We return to the issue of sensitivity below. Two points should be noted con-
cerning the alternative measures of return on assets. First, interestingly, the use of equation 4-B, which accounts for the change in working capital in
93
This content downloaded from 136.167.3.36 on Sun, 29 Sep 2013 19:51:12 PMAll use subject to JSTOR Terms and Conditions
JOURNAL OF INTERNATIONAL BUSINESS STUDIES, SPRING 1986
the cash flow estimation, causes the insolvency-probabilities (in some cases) to decline. This can be observed by comparing the figures in Panel I of Table 1 with the corresponding values in Panel II. Typically, including the change in working capital reduces available cash flows, which in turn in- creases insolvency risk. The drop in insolvency-probabilities has been caused by the decline in the firms' working capital. From the model's per- spective, the declining insolvency-probability resulted from the increased cash flow generated by reducing the level of working capital. Obviously, such a situation is unstable and cannot continue without equity value deteriorating, thus producing increased insolvency-probabilities. Since the model considers the firm in a short-term steady-state condition, the results based on the version where changes in working capital were included may well be misleading.
Secondly, note that if one expected the sampled firms to earn the return on assets implied by the Capital Asset Pricing Model (i.e., ROAIV) in the period 1980-1982, then the implied failure probabilities would have been lower than those implied by the other versions. However, as noted earlier, it seems that in periods of simultaneous recession and high interest rates the results derived under the AMCF approach may be more realistic than those generated by the alternative (MMCF) approach.
Finally, we have calculated (for both the MNCs and DMCs) the financial ratios that have been suggested by Altman (1968) as most significant in discriminating the financially distressed firms from the solvent ones. Using these ratios, the firms' z-scores have been derived.6
Interestingly, the discriminant analysis yields mixed results for the period 1980-1982. Specifically, while the average z-scores for the group of MNCs for the years 1980, 1981, and 1982 are respectively 4.00, 3.79, and 3.79, the corresponding figures for the group of DMCs were 4.12, 4.00, and 3.57. Thus, the traditional discriminant analysis implies that the group of DMCs was, on the average, safer than the MNCs in 1980 and 1981, and the MNCs scored "better" in 1982. The fact that our model leads to different results than those derived by Altman's discriminant analysis is not surprising. The two models used dif- ferent financial information as an input. For example, while the z-score re- flects the ratio of working capital to total assets (as a "proxy" for liquidity), in our model the changes in working capital are used only to adjust the traditional (net income + depreciation) cash-flow measure. Furthermore, while the z-score is based on the ratio of pre-tax earnings to assets (as a "proxy" for return), our model assigns a heavier weight to cash-flow per unit of assets. Though being biased, we believe that for solvency assess- ment, the cash flows, rather than the traditional earning figures, are more relevant. Similarly, while Altman's model utilizes total assests based on book value, our model has been applied using market value of equity plus debt. In sum, although a detailed comparison of the discriminant analysis method with our model is beyond the scope of this paper, the different results
94
This content downloaded from 136.167.3.36 on Sun, 29 Sep 2013 19:51:12 PMAll use subject to JSTOR Terms and Conditions
ARE MULTINATIONAL CORPORATIONS SAFER?
derived by using these two alternative methods are not unexpected. Never- theless, further research on the compatibility of the two methods might add insight to this issue.
Selected Financial Variables
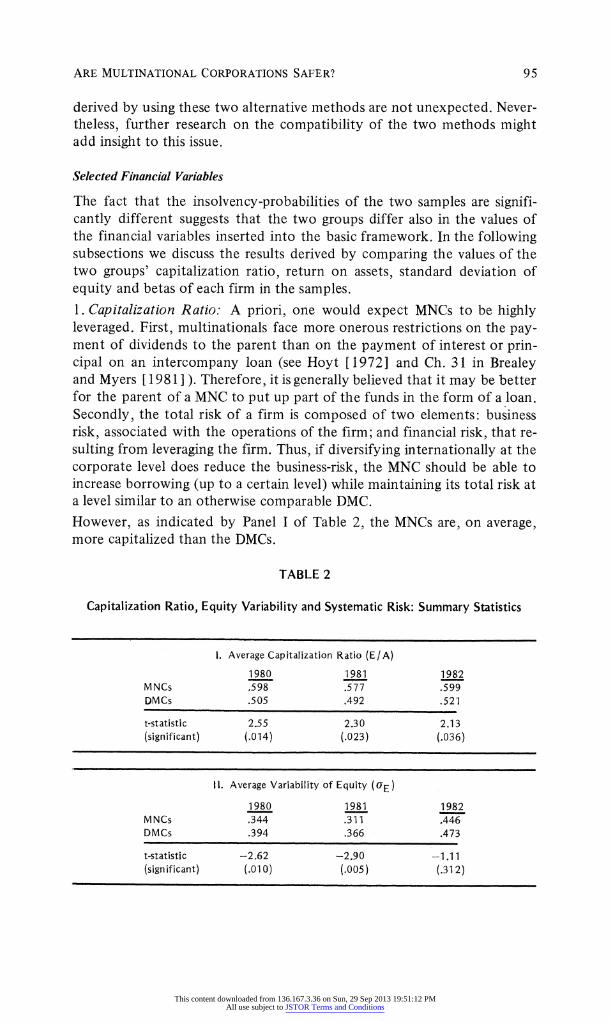
The fact that the insolvency-probabilities of the two samples are signifi- cantly different suggests that the two groups differ also in the values of the financial variables inserted into the basic framework. In the following subsections we discuss the results derived by comparing the values of the two groups' capitalization ratio, return on assets, standard deviation of equity and betas of each firm in the samples. 1. Capitalization Ratio. A priori, one would expect MNCs to be highly leveraged. First, multinationals face more onerous restrictions on the pay- ment of dividends to the parent than on the payment of interest or prin- cipal on an intercompany loan (see Hoyt [1972] and Ch. 31 in Brealey and Myers [1981] ). Therefore, it is generally believed that it may be better for the parent of a MNC to put up part of the funds in the form of a loan. Secondly, the total risk of a firm is composed of two elements: business risk, associated with the operations of the firm; and financial risk, that re- sulting from leveraging the firm. Thus, if diversifying internationally at the corporate level does reduce the business-risk, the MNC should be able to increase borrowing (up to a certain level) while maintaining its total risk at a level similar to an otherwise comparable DMC.
However, as indicated by Panel I of Table 2, the MNCs are, on average, more capitalized than the DMCs.
TABLE 2
Capitalization Ratio, Equity Variability and Systematic Risk: Summary Statistics
1. Average Capitalization Ratio (E/A)
1980 1981 1982 MNCs ,598 .577 .599 DMCs .505 ,492 .521
t-statistic 2.55 2.30 2.13 (significant) (.014) (.023) (.036)
I. Average Variability of Equity (UE)
1980 1981 1982 MNCs .344 .311 ,446 DMCs .394 .366 .473
t-statistic -2.62 -2.90 -1.11 (significant) (.010) (.005) (.312)
95
This content downloaded from 136.167.3.36 on Sun, 29 Sep 2013 19:51:12 PMAll use subject to JSTOR Terms and Conditions
JOURNAL OF INTERNATIONAL BUSINESS STUDIES, SPRING 1986
TABLE 2 (Continued)
II. Systematic Risk (3)
Frequency Distribution
Range MNCs DMCs
.00- .60 .103 -
.61- .90 .414 .093
.91 -1.20 .310 .419 1.21 - 1.50 .103 .326 1.51 - 1.80 .069 .093 1.81 - 2.10 - .069
1.000 1.000 Mean 3 .954 1.253
t-statistic -4.70 (significant) (.000)
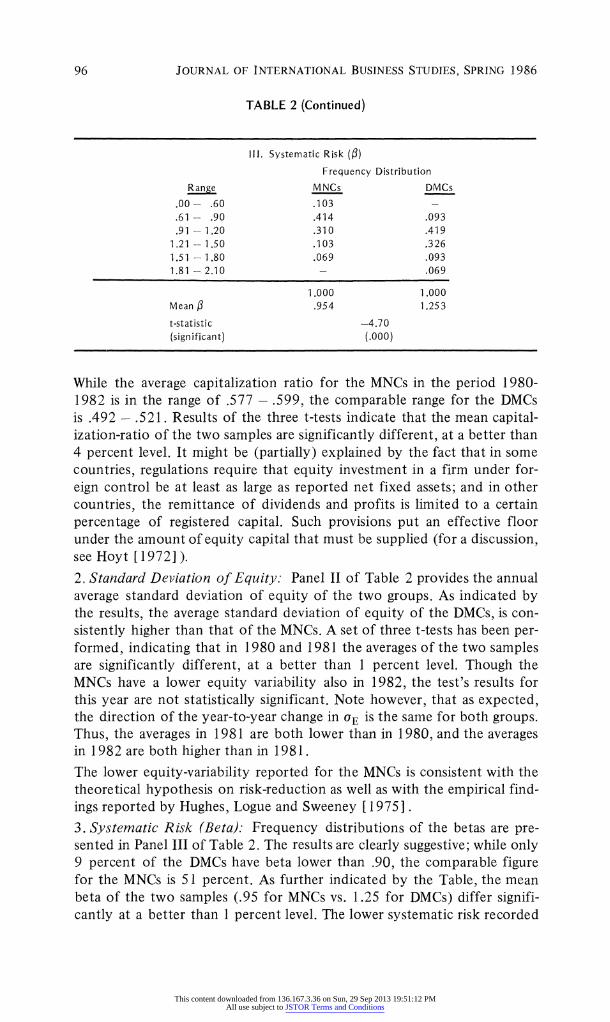
While the average capitalization ratio for the MNCs in the period 1980- 1982 is in the range of .577 -.599, the comparable range for the DMCs is .492 -.521. Results of the three t-tests indicate that the mean capital- ization-ratio of the two samples are significantly different, at a better than 4 percent level. It might be (partially) explained by the fact that in some countries, regulations require that equity investment in a firm under for- eign control be at least as large as reported net fixed assets; and in other countries, the remittance of dividends and profits is limited to a certain percentage of registered capital. Such provisions put an effective floor under the amount of equity capital that must be supplied (for a discussion, see Hoyt [1972]). 2. Standard Deviation of Equity: Panel II of Table 2 provides the annual average standard deviation of equity of the two groups. As indicated by the results, the average standard deviation of equity of the DMCs, is con- sistently higher than that of the MNCs. A set of three t-tests has been per- formed, indicating that in 1980 and 1981 the averages of the two samples are significantly different, at a better than 1 percent level. Though the MNCs have a lower equity variability also in 1982, the test's results for this year are not statistically significant. Note however, that as expected, the direction of the year-to-year change in UE is the same for both groups. Thus, the averages in 1981 are both lower than in 1980, and the averages in 1982 are both higher than in 1981.
The lower equity-variability reported for the MNCs is consistent with the theoretical hypothesis on risk-reduction as well as with the empirical find- ings reported by Hughes, Logue and Sweeney [1975]. 3. Systematic Risk (Beta). Frequency distributions of the betas are pre- sented in Panel III of Table 2. The results are clearly suggestive; while only 9 percent of the DMCs have beta lower than .90, the comparable figure for the MNCs is 51 percent. As further indicated by the Table, the mean beta of the two samples (.95 for MNCs vs. 1.25 for DMCs) differ signifi- cantly at a better than 1 percent level. The lower systematic risk recorded
96
This content downloaded from 136.167.3.36 on Sun, 29 Sep 2013 19:51:12 PMAll use subject to JSTOR Terms and Conditions

ARE MULTINATIONAL CORPORATIONS SAFER?
for the MNCs is consistent with findings reported by Hughes, Logue and Sweeney [1975], Rugman [1977] and Agmon and Lessard [ 1977]. 4. Return on Assets: The literature lists various theoretical propositions, typically arguing that MNC has a potential advantage, expected to be re- flected in its profits. For example, Hirsch [1976] suggests a cost saving that permits an increase in the export of intermediate products as well as entry to market of new products sharing production economies. Agmon and Lessard [1977] and Lessard [1979] note the incremental value of being able to arbitrage tax regimes, and Vernon [1979] stresses the in- formation and profit scanning functions of a multinational network. How- ever, the empirical evidence comparing profitability of MNCs with DMCs is mixed. While one group of studies has reported higher profit rates for MNCs (e.g., Reuber, et al. [1973], Horst [1975], and Fajnzylber and Martinez-Tarrago [1976]), a second group has reported higher profit rates for DMCs (e.g., Newfarmer and Marsh [1981a], [1981b] and Mooney [1982]) and a third group found no significant differences in profitability (e.g., Lall and Streeten [1977]). Table 3 presents data on the average re- turn on assets of the two samples under the four alternative measures.
TABLE 3
Average Return on Assets Based on Alternative Measures
I. ROA' = [N.I. + Depr.] /Assets
1980 1981 1982
MNCs .108 .118 .096
DMCs ,116 .118 .089
II. ROA1' = [N.I. + Depr. + A (W.C.)] /Assets
1980 1981 1982
MNCs .101 .112 .097
DMCs .103 .101 .101
III ROAIII [N.I. + Depr. + Taxes] /Assets
1980 1981 1982
MNCs .159 .170 .131
DMCs .160 .163 .115
IV. ROAIV (Based on the CAPM)
1980 1981 1982
MNCs .166 .158 .112
DMCs .169 .162 ,118 ,
The results presented in the four panels of this table indicate that the ROAs of the MNCs and the DMCs are only minimally different. A set of
97
This content downloaded from 136.167.3.36 on Sun, 29 Sep 2013 19:51:12 PMAll use subject to JSTOR Terms and Conditions
JOURNAL OF INTERNATIONAL BUSINESS STUDIES, SPRING 1986
twelve t-tests has been performed (3 years, 4 ROA versions), indicating that once a particular measure of return on asset is considered, there is no significant difference between the mean ROA of the two groups. Thus, al- though the MNCs and the DMCs do differ in their degree of financial leverage, total risk of equity and systematic risk, they are reasonably com- parable in the returns generated by employing their available assets. Hence, the findings presented in Table 3 are consistent with those reported by Lall and Streetan.7
5. Size and Industry: Although, as noted earlier, both the MNCs and the DMCs have been selected from the Fortune 500 list, there is a substantial difference in the average size of the firms in these two samples. Using our asset variable (A) to measure size, indicates that the average size of a firm in the multinational sample in 1980, 1981 and 1982 is respectively $6.25 billion, $7.58 billion and $7.57 billion. The corresponding values for the DMCs are $578 million, $620 million and $646 million. Note, however, that in our basic framework the important element is the total debt rela- tive to the total size of the firm (ln (A/D) in equation (2)). Thus, size per se should not affect the probability-estimates generated by our analysis. Nevertheless, it is useful to test whether the insolvency-probabilities of the firms in the two groups differ because of the different extent of inter- national activity or simply because of the size effect. The literature on multinationals has reported few cases where the firm's size rather than its international activities was the important explanatory variable. For ex- ample, Haegele [ 1974] has shown that while the betas of MNCs are slightly lower than those of DMCs, when corrected for size, there is no significant difference between the betas of the two groups. Similarly, size is a signifi- cant explanatory variable in the regression results reported by Miller and Pras [1979].8 Therefore, we have performed a set of twelve one-way ANOVA, with insolvency-probability as dependent variable, group type (i.e., MNC vs. DMC) as independent variable and size as a covariate. Thus we performed the analysis for each year and for each ROA version. The tests' results indicate that in none of the twelve cases size is a significant variable. Specifically, the F-statistics ranged in the interval .277 - 2.199 which imply that the corresponding significance levels of the twelve tests ranged between 13 to 60 percent. Hence, despite the differences in size, it could not account for the observed difference in the two groups' insolv- ency-probabilities.
Alternatively, one might want to know whether multinational corporations are safer because they are multinational or because several of the MNCs are in the chemical and machinery industries, while the DMCs were mostly in a set of less technologically advanced material industries. Unfortunately, the number of sampled firms from each type of industry is not sufficiently large to generate reliable estimates. In order to derive significant results for testing the "Industry Hypothesis," one needs a reasonably large num- ber of observations in each industry-type subsample. However, this im- plies that the sampling criteria for MNCs and DMCs would have to be less
98
This content downloaded from 136.167.3.36 on Sun, 29 Sep 2013 19:51:12 PMAll use subject to JSTOR Terms and Conditions
ARE MULTINATIONAL CORPORATIONS SAFER?
rigid. Therefore, we did not pursue this line of investigation within the scope of this research.
Sensitivity Analysis
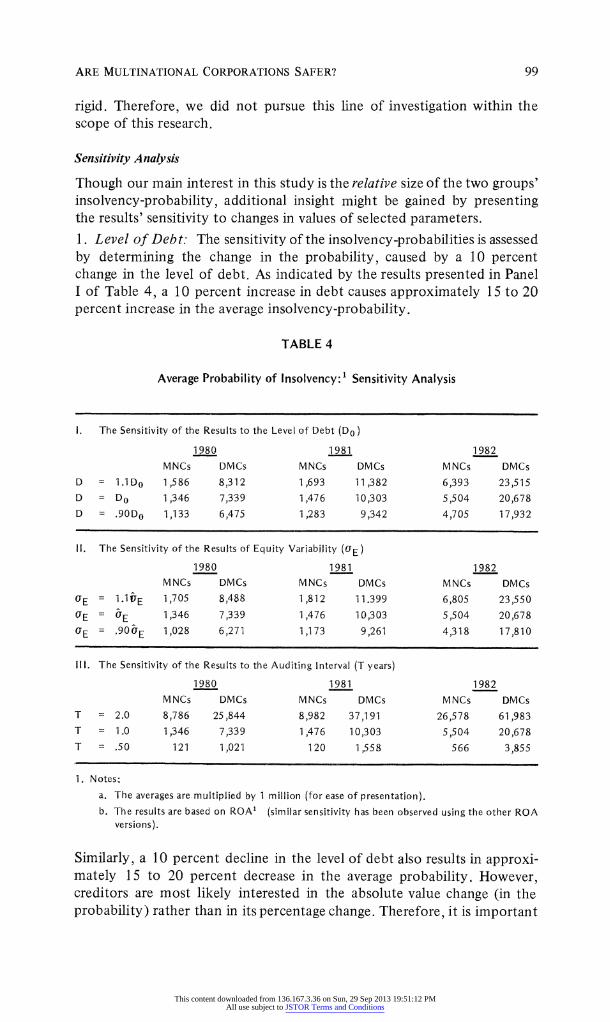
Though our main interest in this study is the relative size of the two groups' insolvency-probability, additional insight might be gained by presenting the results' sensitivity to changes in values of selected parameters. 1. Level of Debt: The sensitivity of the insolvency-probabilities is assessed by determining the change in the probability, caused by a 10 percent change in the level of debt. As indicated by the results presented in Panel I of Table 4, a 10 percent increase in debt causes approximately 15 to 20 percent increase in the average insolvency-probability.
TABLE 4
Average Probability of Insolvency:1 Sensitivity Analysis
I. The Sensitivity of the Results to the Level of Debt (Do)
1980 1981 1982
MNCs DMCs MNCs DMCs MNCs DMCs D = 1.1 Do 1,586 8,312 1,693 11,382 6,393 23,515 D = Do 1,346 7,339 1,476 10,303 5,504 20,678 D = .90Do 1,133 6,475 1,283 9,342 4,705 17,932
II. The Sensitivity of the Results of Equity Variability (OE) 1980 1981 1982
MNCs DMCs MNCs DMCs MNCs DMCs
UE = 1.11E 1,705 8,488 1,812 11.399 6,805 23,550
OE = 0E 1,346 7,339 1,476 10,303 5,504 20,678
OE = -906E 1,028 6,271 1,173 9,261 4,318 17,810
III. The Sensitivity of the Results to the Auditing Interval (T years)
1980 1981 1982 MNCs DMCs MNCs DMCs MNCs DMCs
T = 2.0 8,786 25,844 8,982 37,191 26,578 61,983 T = 1.0 1,346 7,339 1,476 10,303 5,504 20,678 T = .50 121 1,021 120 1,558 566 3,855
1. Notes-
a. The averages are multiplied by 1 million (for ease of presentation). b. The results are based on ROA1 (similar sensitivity has been observed using the other ROA
versions).
Similarly, a 10 percent decline in the level of debt also results in approxi- mately 15 to 20 percent decrease in the average probability. However, creditors are most likely interested in the absolute value change (in the probability) rather than in its percentage change. Therefore, it is important
99
This content downloaded from 136.167.3.36 on Sun, 29 Sep 2013 19:51:12 PMAll use subject to JSTOR Terms and Conditions
JOURNAL OF INTERNATIONAL BUSINESS STUDIES, SPRING 1986
to note that the absolute-value changes in the average insolvency-prob- abilities are larger for the DMCs.9
2. Equity (Asset) Variability: Another factor affecting the probability of insolvency is the standard deviation of assets. As the standard deviation increases, there is increased risk that the firm's anticipated debt level at the end of the period will exceed its asset level, resulting in insolvency. Given our estimation procedure (i.e., equation 3), the standard deviation of assets is a linear function of the standard deviation of equity. Thus, for a given capitalization ratio, the effect of a 10 percent change in aE is equi- valent to that of a 10 percent change in oA. Results of such sensitivity analysis are presented in Panel II of Table 4. As indicated by the results, the effect of a 10 percent change in asset variability is approximately 15 to 20 percent change in the average insolvency-probability. Again, it is the riskier group (i.e., the DMCs) which is most sensitive to changes in the value of the parameters. 3. Auditing Interval." As indicated by Panel III of Table 4, by increasing the auditing frequency by a factor of 2 (i.e., T = .5), the average insolvency rate drops dramatically. On the other hand, reducing the auditing fre- quency by a factor of 2 results in at least a tripling of the average insol- vency-probability. Again, it is interesting to note that when the auditing frequency is reduced the absolute increase in the average insolvency-prob- ability is larger for the DMCs.
SUMMARY
This study provides a comparison of insolvency-probabilities associated with a sample of multinational corporations and a control group of domestic corporations. The results suggest that:
(a) the mean insolvency-probability of the DMCs is significantly higher than that of the MNCs;
(b) the MNCs are significantly more capitalized than the DMCs; (c) the average standard deviation of equity of the DMCs is significantly
higher than that of the MNCs; (d) the average systematic risk (beta) of MNCs is significantly lower than
that of DMCs; (e) the mean ROAs of the two groups are not significantly different; (f) the fact that the MNCs are substantially larger than the DMCs is not
significant in explaining the observed difference in their insolvency- rates;
(g) the results are moderately sensitive to changes in financial leverage and asset variability. However, they are highly sensitive to changes in the assumed auditing frequency;
(h) the average insolvency-probability of the DMCs is more sensitive (to changes in the values of the parameters) than those of the MNCs.
100
This content downloaded from 136.167.3.36 on Sun, 29 Sep 2013 19:51:12 PMAll use subject to JSTOR Terms and Conditions

ARE MULTINATIONAL CORPORATIONS SAFER?
Though the results are clearly suggestive, further research is needed in order to determine a more specific relationship between risk and the ex- tent of international activity. For example, one might consider a more intensive utilization of our data on the ratio of foreign sales to total sales. Hence, to study the differences within a sample of multinational corpora- tions. We hope to report results of such a study in the future.
NOTES
1. Equation (1) abstracts from net changes in outstanding debt during the period. For reasonably short periods, such net flows are of second order relative to the "stock of debt."
2. Dividends as a fraction of assets (rather than the traditional dividend payout ratio) is the vari- able of interest since we need to measure the effect of dividends on the expected growth rate of assets backing the firm's liabilities. The measure is the appropriate one and has the same dimen- sionality as the other rates in equation (2).
3. This is a standard textbook adjustment for the effects of leverage. See, for example, the text by Weston and Brigham [1982]. 4. For an excellent review on the problem of defining a multinational firm see Aharoni [1971]. More recently, Miller and Pras [1979] reviewed the criteria most commonly used now.
5. This criterion is identical to the one used by Kelly and Phillippatos [1982]. 6. Based on Altman's results, the z-score value of financial viability is calculated from the follow- ing financial data:
z = 1.2A + 1.4B + 3.3C + 1.OD + 0.6E
Where:
A = Working capital/assets B = Retained earnings/assets C = Pre-tax earnings/assets D = Sales/assets E = Market value of equity/liabilities
A firm scoring less than 1.8 is classified as troubled.
7. Note, however, that unlike other studies referred to in this subsection, we have used the debt plus market value of equity rather than book value of equity in estimating the total asset parameters. 8. However, in their regressions, product diversification and geographic diversifications are also significant explanatory variables.
9. Technically, this is fully explained by the shape of the normal distribution. The riskier firm will be closer to the mean of the standardized distribution than the low risk firm; thus for a given change in any of the parameters in equation 2, the change in the area under the normal curve is greater for riskier firms.
101
This content downloaded from 136.167.3.36 on Sun, 29 Sep 2013 19:51:12 PMAll use subject to JSTOR Terms and Conditions
JOURNAL OF INTERNATIONAL BUSINESS STUDIES, SPRING 1986
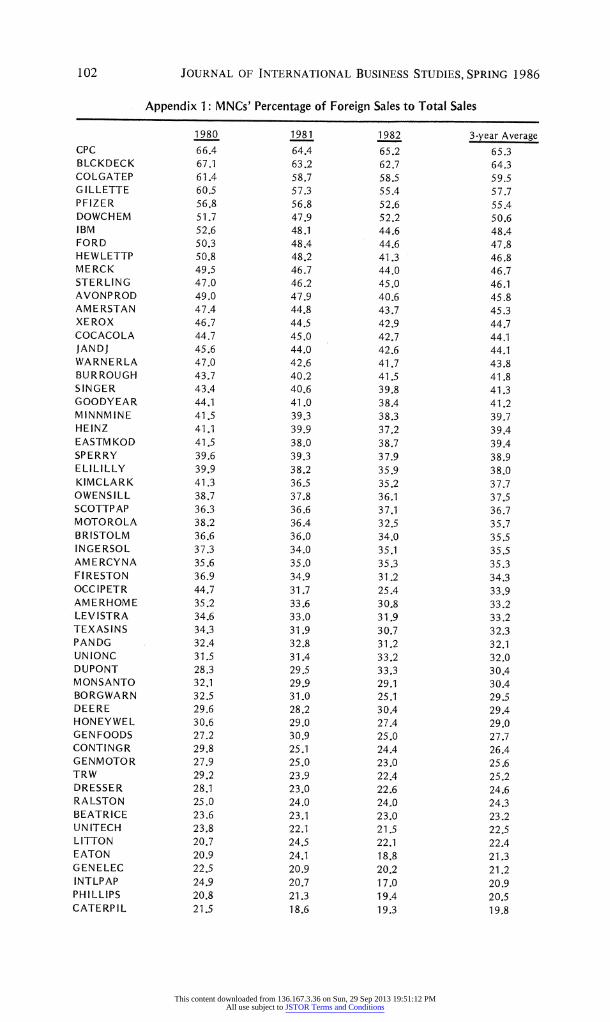
Appendix 1: MNCs' Percentage of Foreign Sales to Total Sales
1980 1981 1982 3-year Average CPC 66.4 64.4 65.2 65.3 BLCKDECK 67.1 63.2 62.7 64.3 COLGATEP 61.4 58.7 58.5 59.5 GILLETTE 60.5 57.3 55.4 57.7 PFIZER 56.8 56.8 52.6 55.4 DOWCHEM 51.7 47.9 52.2 50.6 IBM 52.6 48.1 44.6 48.4 FORD 50.3 48.4 44.6 47.8 HEWLETTP 50.8 48.2 41.3 46.8 MERCK 49.5 46.7 44.0 46.7 STERLING 47.0 46.2 45.0 46.1 AVONPROD 49.0 47.9 40.6 45.8 AMERSTAN 47.4 44.8 43.7 45.3 XEROX 46.7 44.5 42.9 44.7 COCACOLA 44.7 45.0 42.7 44.1 JANDJ 45.6 44.0 42.6 44.1 WARNERLA 47.0 42.6 41.7 43,8 BUR ROUGH 43.7 40.2 41.5 41.8 SINGER 43.4 40.6 39.8 41.3 GOODYEAR 44.1 41.0 38.4 41.2 MINNMINE 41.5 39.3 38.3 39.7 HEINZ 41.1 39.9 37,2 39.4 EASTM KOD 41.5 38.0 38.7 39.4 SPERRY 39.6 39.3 37.9 38.9 ELILILLY 39.9 38.2 35.9 38.0 KIMCLARK 41.3 36.5 35.2 37.7 OWENSILL 38.7 37.8 36.1 37.5 SCOTTPAP 36.3 36.6 37.1 36.7 MOTOROLA 38.2 36.4 32.5 35.7 BRISTOLM 36.6 36.0 34.0 35.5 INGERSOL 37.3 34.0 35.1 35.5 AMERCYNA 35.6 35.0 35.3 35.3 FIRESTON 36.9 34.9 31.2 34.3 OCCIPETR 44.7 31.7 25.4 33.9 AMERHOME 35.2 33,6 30.8 33.2 LEVISTRA 34.6 33.0 31.9 33.2 TEXASINS 34.3 31.9 30.7 32.3 PANDG 32.4 32.8 31.2 32.1 UNIONC 31,5 31.4 33.2 32.0 DUPONT 28.3 29.5 33.3 30.4 MONSANTO 32.1 29.9 29.1 30.4 BORGWARN 32.5 31.0 25.1 29.5 DEERE 29.6 28.2 30.4 29.4 HONEYWEL 30.6 29.0 27.4 29.0 GENFOODS 27.2 30.9 25.0 27.7 CONTINGR 29.8 25.1 24.4 26.4 GENMOTOR 27.9 25.0 23.0 25.6 TRW 29.2 23,9 22.4 25.2 DRESSER 28.1 23.0 22.6 24,6 RALSTON 25.0 24.0 24.0 24.3 BEATRICE 23.6 23.1 23.0 23.2 UNITECH 23.8 22.1 21.5 22.5 LITTON 20.7 24.5 22.1 22.4 EATON 20.9 24.1 18.8 21,3 GENELEC 22.5 20.9 20.2 21.2 INTLPAP 24.9 20.7 17.0 20.9 PHILLIPS 20.8 21.3 19.4 20.5 CATERPIL 21.5 18.6 19.3 19.8
102
This content downloaded from 136.167.3.36 on Sun, 29 Sep 2013 19:51:12 PMAll use subject to JSTOR Terms and Conditions

ARE MULTINATIONAL CORPORATIONS SAFER?
Appendix 2: The Sampled MNCs and DMCs
MULTINATIONAL CORPORATIONS
BEATRICE FOODS CO CPC INTERNATIONAL INC GENERAL FOODS CORP HEINZ (H.J.) CO RALSTON PURI NA CO COCA-COLA CO LEVI STRAUSS & CO INTL PAPER CO KIMBERLY-CLARK CORP SCOTT PAPER CO JOHNSON & JOHNSON MINNESOTA MINING & MFG CO AMERICAN CYANAMID CO DOW CHEMICAL DU PONT (E. I.) DE NEMOURS MONSANTO CO UNION CARBIDE CORP AMERICAN HOME PRODUCTS CORP BRISTOL-MYERS CO LILLY (ELI) & CO MERCK & CO PFIZER INC STERLING DRUG INC WARNER-LAMBERT CO COLGATE-PALMOLIVE CO PROCTER & GAMBLE CO AVON PRODUCTS OCCIDENTAL PETROLEUM CORP PHILLIPS PETROLEUM CO FIRESTONE TIRE & RUBBER CO OWENS-ILLINOIS INC CONTINENTAL GROUP GILLETTE CO DEERE & CO CATERPILLAR TRACTOR CO DRESSER INDUSTRIES INC BLACK & DECKER MFG CO INGERSOLL-RAND CO BURROUGHS CORP HEWLETT-PACKARD CO HONEYWELL INC INTL BUSINESS MACHINES CORP SPERRY CORP GENERAL ELECTRIC CO LITTON INDUSTRIES INC SINGER CO MOTOROLA INC TRW INC TEXAS INSTRUMENTS INC FORD MOTOR CO GENERAL MOTORS CORP BORG-WARN E R CORP EATON CORP UNITED TECHNOLOGIES CORP AMERICAN STANDARD INC EASTMAN KODAK CO XEROX CORP
DOMESTIC CORPORATIONS
CONAGRA INC FEDERAL CO KANE-MILLER CORP AMERICAN BAKERIES CO AM STAR CORP CONE MILLS CORP LOWENSTEIN (M.) CORP INTERCO INC VF CORP LOUISIANA-PACIFIC CORP SKYLINE CORP FEDERAL PAPER BOARD CO GREAT NORTHERN NEKOOSA CORP HAMMERMILL PAPER CO POTLATCH CORP SOUTHWEST FOREST INDUSTRIES HARCOURT BRACE JOVANOVICH SCOTT & FETZ ER CO DONNELLEY (R. R.) & SONS CO DORSEY CORP HOOVER UNIVERSAL INC WALTER (JIM) CORP ANCHOR HOCKING CORP BROCKWAY INC IDEAL BASIC INDUSTRIES CARPENTER TECHNOLOGY CYCLOPS CORP NORTHWEST INDUSTRIES NUCOR CORP HANDY & HARMAN INS ILCO CORP CECO CORP TYLER CORP BRIGGS & STRATTON ROPER CORP EAGLE-PITCHER INDS BIG THREE INDUSTRIES STORAGE TECHNOLOGY CORP NORTH AMERICAN PHILIPS CORP NATIONAL SERVICE INDS INC BANGOR PUNTA CORP TALLEY INDUSTRIES INC DAN RIVER INC
103
This content downloaded from 136.167.3.36 on Sun, 29 Sep 2013 19:51:12 PMAll use subject to JSTOR Terms and Conditions
104 JOURNAL OF INTERNATIONAL BUSINESS STUDIES, SPRING 1986
REFERENCES
Agmon, T. "The Relations Among Equity Markets: A Study of Share-Price Comovements in the United States, The United Kingdom, Germany, and Japan," Journal of Finance, September 1972.
-- - and D. R. Lessar. "Investor Recognition of Corporate International Diversification," Journal of Finance, September 1977.
and D. R. Lessard. "Financial Factors and International Expansion of Small-Country Firms," in Agmon, T. and C. P. Kindleberger (eds.), Multinationals From Small Countries, MIT Press, Cambridge, Mass., 1977.
Aharoni, Y. "On the Definition of a Multinational Corporation," Quarterly Review of Economics and Business, Autumn 1971.
Altman, E. I. "Financial Ratios, Discriminant Analysis and the Prediction of Corporate Bankruptcy," Journal of Finance, September 1968.
--- . Corporate Bankruptcy in America, Heath Lexington, Lexington, Mass., 1971.
. "Predicting Railroad Bankruptcies in America," Bell Journal of Economics and Manage- ment Science, Spring 1973.
--- . "Predicting Performance in the Savings and Loan Association Industry," Journal of Monetary Economics, 1977.
--- , R. G. Haldeman and P. Narayanan. "ZETA Analysis: A New Model to Identify Bank- ruptcy Risk of Corporations," Journal of Banking and Finance, Vol. 1, 1977.
and T. McGough. "Evaluation of a Company as a Going Concern," Journal of Account- ancy, December 1974.
Beaver, W. H. "Financial Ratios as Predictors of Failure," Empirical Research in Accounting: Selected Studies, 1966, supplement to Vol. 4, Journal of Accounting Research, 1966, pp. 71-111.
- . "Market Prices, Financial Ratios and the Prediction of Failure," The Accounting Review, January 1968a.
. "Market Prices, Financial Ratios and the Prediction of Failure," Journal of Accounting Research, Autumn 1968b.
Brealey, R. and S. Myers. Principles of Corporate Finance, McGraw-Hill, Inc., 1981.
Clark, C. T. and L. L. Schkade. Statistical Methods for Business Decisions, Southwestern Pub- lishing Co., Cincinnati, 1969.
Deakin, E. B. "A Discriminant Analysis of Predictors of Business Failure," Journal of Accounting Research, Spring 1972.
Edmister, R. O. "An Empirical Test of Financial Ratio Analysis for Small Business Failure Predic- tion," Journal of Financial and Quantitative Analysis, March 1972.
Fajnzylber, F. and T. Martinez-Tarrago. La Emprasas Trancionales. Fundo De Cultura Economica, Mexico City, 1976.
Fama, E. F. and M. H. Miller. The Theory of Finance, Dryden Press, Hinsdale, Illinois, 1972.
Elton, E. J., and M. J. Gruber. (eds.). International Capital Markets, North-Holland Publishing Company, Amsterdam, Holland, 1975.
Galai, D. and R. W. Masulis. "The Option Pricing Model and the Risk Factor of Stock," Journal of Financial Economics, January/March 1976.
Grubel, H. G. "Internationally Diversified Portfolios: Welfare Gains and Capital Flows,"American Economic Review, December 1968.
---- and K. Fander. "The Interdependence of International Equity Markets." Journal of Fi- nance, March 1971.
Haegele, M. J. "Exchange Rate Expectations and Security Returns." Unpublished Ph.D. Disserta- tion, The University of Pennsylvania, 1974.
Higgins, R. C. "Discussion," Journal of Finance, May 1971.
---- - and L. D. Schall. "Corporate Bankruptcy and Conglomerate Merger," Journal of Finance, March 1975.
Hirsch, S. "An International Trade and Investment Theory of the Firm," Oxford Economic Papers, a28, 1976.
This content downloaded from 136.167.3.36 on Sun, 29 Sep 2013 19:51:12 PMAll use subject to JSTOR Terms and Conditions
ARE MULTINATIONAL CORPORATIONS SAFER?
Horst, T. "American Investments Abroad and Domestic Market Power," unpublished manuscript, 1975.
Hoyt, N. "The Management of Currency Exchange Risk by the Singer Company," Financial Manage- ment, Spring 1972.
Hughes, J. S., D. E. Logue, and R. J. Sweeney. "Corporate International Diversification and Market Assigned Measures of Risk and Diversification," Journal of Financial and Quantitative Analysis, November 1975.
Kelly, M. and G. Phillippatos. "Comparative Analysis of the Foreign Investment Evaluation Prac- tices by U.S. Based Manufacturing Multinational Companies," Journal of International Business, Winter 1982.
Lall, S. and P. Streeten. Foreign Investment, Transnationals and Developing Countries, Westview Press, Boulder, Colo., 1977.
Lessard, D. R. "World, National and Industry Factors in Equity Returns," Journal of Finance, May 1974.
.-- "World, Country and Industry Relationships in Equity Returns," Financial Analyst Jour- nal, February 1976.
--- . "Transfer Prices, Taxes and Financial Markets: Implications of Internal Financial Trans- fers within the Multinational Firm," in R. G. Hawkins (ed.) Economic Issues of Multinational Firms, JAI Press, New York, 1979.
Levy, H. and M. Sarnat. "International Diversification of Investment Portfolios," American Eco- nomic Review, September 1970.
Lewellen, W. G. "A Pure Financial Rationale for a Conglomerate Merger," Journal of Finance, May 1971.
Lilienthal, D. "Management of the Multinational Corporation," Management and Corporations, edited by M. Anshen and G. Bach, Mc-Graw-Hill, New York, 1960.
Marcus, A. and I. Shaked, "The Relationship Between Accounting Measures and Prospective Probabilities of Insolvency: An Application to the Banking Industry." Financial Review, March 1984.
Merton, R. C. "Option Pricing When Underlying Stock Returns are Discontinuous," Journal of Fi- nancial Economics, 3 (1976).
Michel, A. and I. Shaked. "Are Conglomerates Safer?" In Research in Finance, edited by H. Levy, JAI Press, 1985.
--- . "Airline Deregulation and the Probability of Air-Carrier Insolvency." Boston University School of Management Working Paper, 1984.
Miller, J. and B. Pras. "The Effects of Multinational and Export Diversification on the Profit Sta- bility of U.S. Corporations," Southern Economic Review, Vol. 46, 1979.
Mooney, J. "Profit and Concentration in Brazil," Ph.D. Thesis, University of Notre Dame, 1982.
Newfarmer, R. and L. Marsh. "Foreign Ownership, Market Structure and Industrial Performance: Brazil's Electrical Industry," Journal of Development Economics, 1981(a).
. International Interdependence and Development, Report to the U.S. Department of Labor, July 1981(b).
Reuber, G. L., H. Crookell, M. Emerson and G. Hamonno. Private Foreign Investment in Develop- ment, Clarendon Press, Oxford, 1973.
Rubinstein, M. E. "A Mean-Variance Synthesis of Corporate Financial Theory," Journal of Finance, March 1973.
Shaked, I. "Measuring Prospective Probabilities of Insolvency: An Application to the Life Insurance Industry." Journal of Risk and Insurance, March 1985.
Shapiro, A. C. "Financial Structure and Cost of Capital in the Multinational Corporation," Journal of Financial and Quantitative Analysis, June 1978.
Smith, C. W. "Option Pricing: A Review," Journal of Financial Economics, Vol. 3, 1976.
Solnik, B. H. "International Pricing of Risk," Journal of Finance, May 1974.
105
This content downloaded from 136.167.3.36 on Sun, 29 Sep 2013 19:51:12 PMAll use subject to JSTOR Terms and Conditions

106 JOURNAL OF INTERNATIONAL BUSINESS STUDIES, SPRING 1986
Solnik, B. H. European Capital Markets, D. C. Heath and Co., Lexington, Mass., 1973.
Vernon, R. "The Product Cycle Hypothesis In a New International Environment," Oxford Bulletin of Economics and Statistics, a41, 1979.
Weston, J. F. and E. F. Brigham. Essentials of Managerial Finance, Dryden Press, Hinsdale, Illinois, 1982.
This content downloaded from 136.167.3.36 on Sun, 29 Sep 2013 19:51:12 PMAll use subject to JSTOR Terms and Conditions