arapahoe county school district no. 1 … 2017 cafr... · arapahoe county school district no. 1 ....
TRANSCRIPT

ARAPAHOE COUNTY SCHOOL DISTRICT NO. 1
ENGLEWOOD SCHOOLS
ENGLEWOOD, COLORADO
COMPREHENSIVE ANNUAL FINANCIAL REPORT
FOR THE YEAR ENDING JUNE 30, 2017
TABLE OF CONTENTS
PAGEINTRODUCTORY SECTION
Letter of Transmittal i - iv
Organizational Chart v
Roster of School Officials vi
GFOA Certificate of Achievement for Excellence in Financial Reporting vii
FINANCIAL SECTION
Independent Auditors’ Report viii - ix
Management’s Discussion and Analysis x - xvi
Basic Financial Statements
Statement of Net Position 1
Statement of Activities 2
Balance Sheet - Governmental Funds 3 - 4
Reconciliation of the Balance Sheet of Governmental Funds to the Statement of Net Position 5
Statement of Revenues, Expenditures and Changes in Fund Balances - Governmental Funds 6 - 7
Reconciliation of the Statement of Revenues, Expenditures and Changes inFund Balances of Governmental Funds to the Statement of Activities 8
Statement of Fiduciary Assets and Liabilities - Fiduciary Funds 9
Statement of Changes in Net Position - Private Purpose Trust Fund 10
Notes to Financial Statements 11 - 27
Required Supplementary Information
Schedule of Proportionate Share of the Net Pension Liabilityand Contributions 28
Budgetary Comparison Schedule - General Fund 29 - 30
Budgetary Comparison Schedule - Grants Fund 31
Notes to Required Supplementary Information 32

TABLE OF CONTENTS(Continued)
PAGEFINANCIAL SECTION (Continued)
Supplementary Information
Combining Balance Sheet - Nonmajor Governmental Funds 33
Combining Statement of Revenues, Expenditures and Changes in Fund Balances - Nonmajor Governmental Funds 34
Budgetary Comparison Schedule - Food Service Fund 35
Budgetary Comparison Schedule - Tuition Fund 36
Budgetary Comparison Schedule - Bond Redemption Fund 37
Budgetary Comparison Schedule - Building Fund 38
Budgetary Comparison Schedule - Capital Reserve Fund 39
Statement of Changes in Assets and Liabilities - Agency Fund 40
STATISTICAL SECTION
Financial Trends
Net Position by Components 41
Changes in Net Position 42
Fund Balances - Governmental Funds 43
Changes in Fund Balances - Governmental Funds 44
Revenue Capacity
Assessed Value and Estimated Actual Value of Taxable Property 45
Property Tax Rates - Direct and Overlapping Governments 46
Principal Property Taxpayers 47
Property Tax Levies and Collections 48
Debt Capacity
Outstanding Debt by Type 49
Ratios of General Bonded Debt Outstanding 50
TABLE OF CONTENTS(Continued)
PAGESTATISTICAL SECTION (Continued)
Debt Capacity (Continued)
Direct and Overlapping Governmental Activities Debt 51
Legal Debt Margin Information 52
Demographic and Economic Information
Demographic and Economic Statistics 53
Principal Employers 54
Operating Information
Full-Time Equivalent Employees by Type 55
Operating Statistics 56
Schedule of Insurance 57
Capital Asset Information 58 COMPLIANCE SECTION
Single Audit
Independent Auditors’ Report on Internal Control over Financial Reporting andon Compliance and Other Matters Based on an Audit of Financial StatementsPerformed in Accordance with Government Auditing Standards 59 - 60
Independent Auditors’ Report on Compliance for Each Major Federal Program,Internal Control over Compliance, and the Schedule of Expenditures of FederalAwards Required by the Uniform Guidance 61 - 63
Schedule of Findings and Questioned Costs 64 - 65
Corrective Action Plan 66
Schedule of Expenditures of Federal Awards 67
Notes to Schedule of Expenditures of Federal Awards 68
State Compliance
Auditors Integrity Report 69
INTRODUCTORY SECTION
i Wendy Rubin – Superintendent of Schools
Roscoe L. Davidson Administration Building – 4101 S Bannock St – Englewood, CO 80110 – Phone: 303-761-7050 – Fax: 303-806-2064
Sosan Schaller
Chief Financial Officer 303-806-2014
December 12, 2017 To the Citizens and Members of the Board of Education Englewood Schools (Arapahoe County School District Number One) Englewood, Colorado The Comprehensive Annual Financial Report of Arapahoe County School District Number One (Englewood Schools or District) as of June 30, 2017 and for the fiscal year then ended is hereby submitted. Responsibility for the accuracy, completeness and fairness of the presentation, including all disclosures, rests with the District. The data, as presented, is accurate in all material respects and is presented in a manner designed to fairly set forth the financial position and results of operations of the District. All disclosures necessary to enable the reader to gain an understanding of the District’s activities have been included. State law requires that the District publish within six months of the close of each fiscal year a complete set of financial statements presented in accordance with accounting principles generally accepted in the United States of America (US GAAP) and audited in accordance with auditing standards generally accepted in the United States of America (US GAAS), by a firm of licensed certified public accountants. Pursuant to this requirement, we hereby issue the comprehensive annual financial report of the Arapahoe County School District One for the fiscal year ended June 30, 2017. The District’s financial statements have been audited by Swanhorst & Company LLC, a firm of licensed certified public accountants. The independent audit of the financial statements is part of a broader, federally mandated “Single Audit” designed to meet the special needs of federal grantor agencies. The standards governing Single Audit engagements require the independent auditor to report not only on the fair presentation of the financial statements, but also on the District’s internal controls and compliance with legal requirements. The Comprehensive Annual Financial Report is presented in conformity with Statement No. 34 of the Governmental Accounting Standards Board, titled Basic Financial Statements – and Management’s Discussion and Analysis – for State and Local Governments. This reporting standard is intended to parallel private sector reporting by consolidating governmental activities and business-type activities into a single total column for government-wide activities. Statement 34 also requires that management provide a narrative introduction, overview and analysis to accompany the basic financial statements in the form of Management’s Discussion and Analysis (MD&A). This letter of transmittal is designed to complement the MD&A and should be read in conjunction. The financial section includes: the Independent Auditors’ Report, Management’s Discussion and Analysis (MD&A), the basic financial statements, and the combining and individual fund financial statements and

ii
schedules. The MD&A provides a narrative introduction, overview, and analysis to accompany the basic financial statements. Management assumes full responsibility for the completeness and reliability of the information contained in this report based upon a comprehensive framework of internal control that it has established for this purpose. Because the cost of internal control should not exceed anticipated benefits, the objective is to provide reasonable, rather than absolute, assurance that the financial statements are free of any material misstatements. Profile of the District Arapahoe County School District Number One (Englewood Schools) was formed in 1916. Nine schools provide instruction and related services to approximately 3,000 students from pre-kindergarten through twelfth grade. The District encompasses approximately 6.89 square miles, which is located within the City of Englewood, directly south of Denver, Colorado. The District is governed by a five-member Board of Education whose members are elected by the qualified electors within the District’s boundaries. The general duties of the Board of Education members include the power to employ all personnel necessary to maintain the operations and carry out the educational programs of the District and pay their compensation; to fix attendance boundaries; to establish annual budgets; to determine the educational programs to be carried on in the schools of the District; to prescribe the textbooks of any course of instruction or study in such educational programs; and to levy a property tax on properties located within its boundaries. The District offers a number of educational options including: Full-day kindergarten; International Baccalaureate (IB); Science, Technology, Engineering & Math (STEM) focus; Gifted and Talented; and vocational programs: cosmetology, culinary art, Sustainable Agriculture Education (S.A.G.E), business and journalism. District Strategic Plan 2016-2020 The District’s strategic plan was developed in 2016 through the collaborative work of parents, teachers, and administrators at each of our schools sites. The strategic plan, our vision and mission are reflective of the ideals of the community of Englewood as a whole. The strategic plan sets overall goals for Englewood Schools and puts forth a plan to achieve them: Vision Graduating the leaders, thinkers, and explorers of tomorrow Mission Preparing all students for future success through learning, leading, engagement and action
Core Values
High Expectation
Accountability
Integrity
Respect
Community
iii
Factors Affecting Financial Condition State and Local Economy - Below is an excerpt from the Colorado Legislative Councils Economic and revenue Forecast report dated June 20, 2017: “The economy is expected to continue to grow at a moderate pace in 2017 and into 2018. Demographic
change and a tight labor market will make it more difficult for businesses to fill jobs, leading to increased
wages and pressure on corporate profits in some industries. After a slowdown during the summer of 2016,
business investments and new orders for goods and services have rebounded in the first part of 2017 in
tandem with an improving global economy. The strength of the economy is expected to allow the Federal
Reserve to slowly raise interest rates and taper the money supply without triggering a recession. However,
because the economy is operating at or close to its capacity in most markets, risks to the economic outlook
lean more to the downside”.
According to Denver Metro Chamber of Commerce 2017 economic forecast, Metro Denver experienced job growth in each supersector in 2016 for the fourth consecutive year. In 2017 job gains will continue to be broad-based but at a slower 2.4 percent pace as labor market tightens and unemployment remains low. The unemployment rate in Metro Denver is expected to average about 3.6 percent in 2017.
Long-term Financial Planning - The District placed a $1.5 million mill levy override and a $97.5 million bond measure on the November 8, 2016 ballot. The mill levy override is to be used to maintain safe and secure buildings; attracting and retaining highly qualified teachers, support staff and leaders; maintain current instructional resources; providing up-to-date technology; and maintaining district facilities and grounds. The bond is to replace aging and out of date facilities, other improvements and updates as necessary. All four of the District’s elementary schools and early childhood center are more than 60 years old, in dire need of repair, and not in compliance with the American Disability Act. District voters approved both measures enabling the District to start the process of replacing Charles Hay World School and Clayton Elementary in 2016-17. Construction is expected to be completed by late 2019. The State’s K-12 funding continues to be uncertain. Each year the state budget is released by the Governor in January, which determines the annual budget amount allocated to school districts. Over 80% of the Englewood Schools General Operating Fund is received through state budget, property taxes, and Specific Ownership tax. As a result, the state economic outlook is very important to the fiscal health of the District. The District continuously updates long-range financial projections and adjusts the working budget accordingly, which are reviewed by the Board of Education. In 2016-17 the base per pupil funding was increased by 1.22% for K-12 throughout the state. However, the reduction to statewide total program funding to school districts, also known as “Negative Factor” as calculated in School Finance Act was over $2.69 million for the District, which is nearly 10% of the revenue budget. Reduction in state funding coupled with declining enrollment has created on-going budget challenges for the past five years. The District maintains a number of budgetary controls to ensure compliance with legal provisions embodied in the annual appropriated budget approved by the Board. Also, the District’s strategic plan is intended to address long-term goals in all facets of operation including fiscal. The District’s strategic plan outlines the overarching END areas:
1. Learning: Whole Child, Whole Adult 2. People: Assets and Partners 3. Systems: Big Picture Thinking
iv
Big Picture Thinking - comprised of 6 ENDS. ENDS 4 states “demonstrate fiscal responsibility and stewardship in all facets of district financial management”. Budget Process Development of the District’s budget is an on-going, year-round process. Fall enrollment assists in updating enrollment projections for the upcoming years. Budget priorities are gathered from the community. Revenue projections are developed and expenditure adjustments are discussed based on assumptions about funding from the State of Colorado, salary negotiations, employee benefit changes, utility and other expenditure increases. Public budget workshops are held in order to gather additional community input. A preliminary budget is presented to the Board of Education in May of each year followed by a budget hearing and adoption in June. The District’s financial policies also drive the budget process. The District must balance its ongoing expenditures with current revenues and use its reserves wisely. The District has a policy to maintain an emergency reserve of 15% of its expenditures in addition to the 3% reserve required by the State Constitution. Awards and Acknowledgements The Government Finance Officers Association of the United States and Canada (GFOA) awarded a Certificate of Achievement for Excellence in Financial Reporting to Englewood School District for its comprehensive annual financial report for the fiscal year ended June 30, 2016. In order to be awarded a Certificate of Achievement, a government must publish an easily readable and efficiently organized comprehensive annual financial report. This report must satisfy both generally accepted accounting principles and applicable legal requirements. A Certificate of Achievement is valid for a period of one year only. We believe that our current comprehensive annual financial report continues to meet the Certificate of Achievement Program’s requirements and we are submitting it to the GFOA to determine its eligibility for another certificate. The preparation of this document would not have been possible without the dedicated efforts and expertise of the Business Services staff, not only during the reporting process, but also throughout the year. Appreciation and recognition is also extended to our independent audit firm, Swanhorst & Company LLC, and its professional audit staff for the assistance and analysis provided throughout the year. Finally, a big thank you to the Englewood Board of Education and Superintendent Dr. Wendy Rubin for their leadership, support, and dedication. This report provides financial and other related information for the fiscal year 2016-2017 and has been prepared in a manner that is intended to assist management decision makers for the current and future budget years. Respectfully submitted, Sosan Schaller Chief Financial Officer

Chie
f Hum
an
Reso
urce
s &
�
����
���
��
�
Dire
ctor
of P
ost
Seco
ndar
y &
Wor
kFo
rce
Read
ines
sCh
ief F
inan
cial
�
��
�D
irect
or o
f Ass
ess-
men
t & A
nal�
���
Prin
cipa
l at
Cher
rely
nPr
inci
pal a
tBi
shop
Prin
cipa
l at
Char
les
Hay
Prin
cipa
l at
Clay
ton
Prin
cipa
l at
CFH
SC &
ESS
CPr
inci
pal a
tEH
S, E
MS
& E
LA
AP a
t CFH
SC
AP a
t EH
SAD
/AP
at E
HS
Acco
unta
nt
Payr
oll/
AP
���
����
���
���
����
����
��As
sist
ant
Dep
uty
Supe
rinte
nden
t
Supe
rinte
nden
t
����
����
����
����
�
Tena
Pra
nge
Pres
iden
t��
��
���
���
��
1st V
ice
Pres
iden
tKe
vin
Eber
t2n
d Vi
ce P
resi
dent
����
����
���
Secr
etar
y��
���
���
�Tr
easu
rer
����
!�"��
����#
����
� ��$
�����
���
���
����
���
Coor
dina
tor
Syst
em/N
etw
ork
Adm
inis
trat
or
%���
����
���
�'��
$Sp
ecia
list
%���
����
��Sp
ecia
list
Secr
etar
y to
Dire
ctor
Nov
201
7 nd
p
Dire
ctor
at
ECE
AP a
t Cla
yton
AP a
t CFH
SC/E
SSC
(���
����(
����
���
Coor
dina
tor
Men
tal H
ealth
/M
edic
aid
Coor
dina
tor
�)��
����
�*���
����
���
(���
����(
����
���
Secr
etar
y to
Dire
ctor
���
����
����
��As
sist
ant
Gra
nts
Coor
dina
tor
Dat
a An
alys
t
Payr
oll/
AP
Hea
d Ch
ef
AP a
t EM
S
Secr
etar
y to
Dire
ctor
���
���
���
Assis
tant
to D
irect
or
HR
Spec
ialis
t
HR
Spec
ialis
t
Dir
ecto
r o
f Se
curi
ty
& S
afet
y
Secu
rity
Gua
rd
Secu
rity
Gua
rd
Dea
n of
Stu
dent
sD
ean
of S
tude
nts
(��
���
���
��'�
��
���
���
��
�(�
��
����
���
+��
�.�
0��
��
���
��
�
Acco
unts
Pay
able
Acco
unts
Pay
able
����
���
�(��
����
�Co
ordi
nato
r
����
���
�(��
����
��Co
ordi
nato
r
Com
pute
r'�
�$��
����
Com
pute
r'�
�$��
����
�%%
Com
pute
r'�
�$��
����
*���
����
����'
��$�
*��
�
1�2
����
����
Spec
ialis
t
Com
pute
r'�
�$��
����
*���
����
����3
�����
��
v
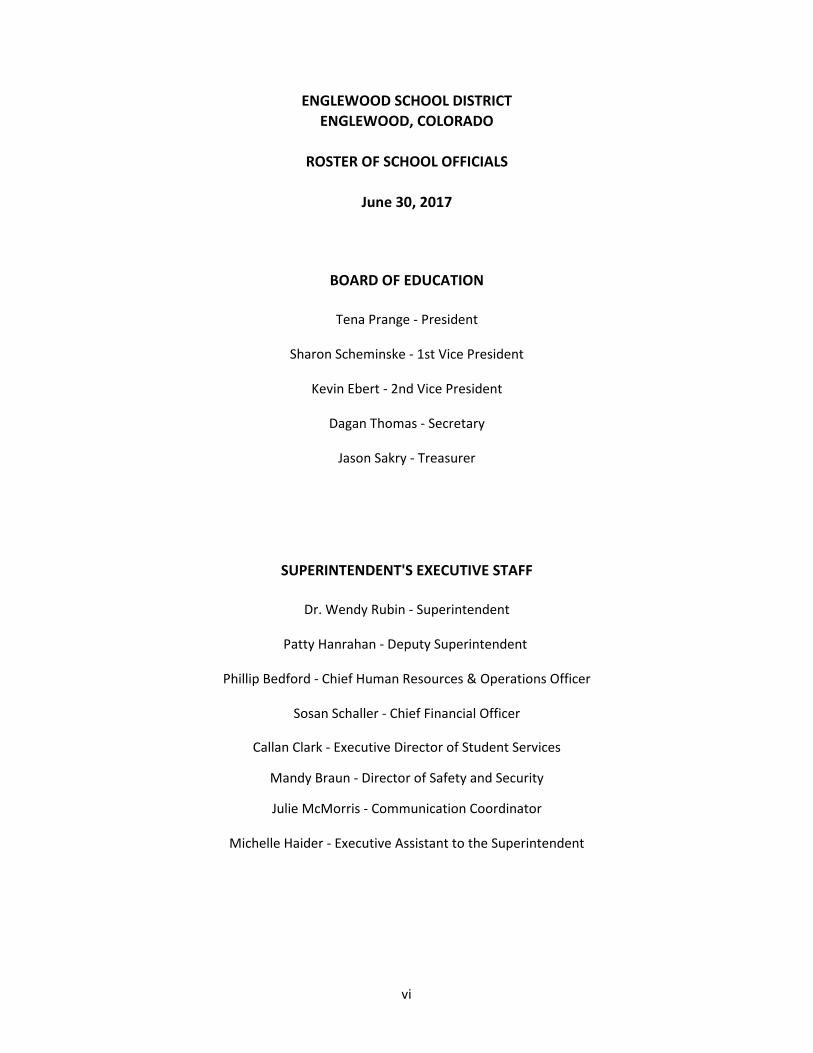
Dr. Wendy Rubin - Superintendent
Patty Hanrahan - Deputy Superintendent
Sosan Schaller - Chief Financial Officer
Julie McMorris - Communication Coordinator
Michelle Haider - Executive Assistant to the Superintendent
Mandy Braun - Director of Safety and Security
Phillip Bedford - Chief Human Resources & Operations Officer
Callan Clark - Executive Director of Student Services
Tena Prange - President
ENGLEWOOD SCHOOL DISTRICT
ENGLEWOOD, COLORADO
ROSTER OF SCHOOL OFFICIALS
June 30, 2017
BOARD OF EDUCATION
Sharon Scheminske - 1st Vice President
Kevin Ebert - 2nd Vice President
Jason Sakry - Treasurer
Dagan Thomas - Secretary
SUPERINTENDENT'S EXECUTIVE STAFF
vi

vii

FINANCIAL SECTION

8400 E. Crescent Parkway • Suite 600 • Greenwood Village, CO 80111 • (720) 528-4306 Fax: (720) 528-4307
Board of EducationEnglewood SchoolsEnglewood, Colorado
INDEPENDENT AUDITORS’ REPORT
Report on the Financial StatementsWe have audited the accompanying financial statements of the governmental activities, each major fund, and theaggregate remaining fund information of Englewood Schools as of and for the year ended June 30, 2017, and therelated notes to the financial statements, which collectively comprise the basic financial statements of EnglewoodSchools, as listed in the table of contents.
Management’s Responsibility for the Financial StatementsManagement is responsible for the preparation and fair presentation of these financial statements in accordance withaccounting principles generally accepted in the United States of America; this includes the design, implementation,and maintenance of internal control relevant to the preparation and fair presentation of financial statements that arefree from material misstatement, whether due to fraud or error.
Auditors’ ResponsibilityOur responsibility is to express opinions on these financial statements based on our audit. We conducted our auditin accordance with auditing standards generally accepted in the United States of America and the standards applicableto financial audits contained in Government Auditing Standards, issued by the Comptroller General of the UnitedStates. Those standards require that we plan and perform the audit to obtain reasonable assurance about whether thefinancial statements are free from material misstatement.
An audit involves performing procedures to obtain audit evidence about the amounts and disclosures in the financialstatements. The procedures selected depend on the auditors’ judgment, including the assessment of the risks ofmaterial misstatement of the financial statements, whether due to fraud or error. In making those risk assessments,the auditor considers internal control relevant to the preparation and fair presentation of the financial statements inorder to design audit procedures that are appropriate in the circumstances, but not for the purpose of expressing anopinion on the effectiveness of the internal control. Accordingly, we express no such opinion. An audit also includesevaluating the appropriateness of accounting policies used and the reasonableness of significant accounting estimatesmade by management, as well as evaluating the overall presentation of the financial statements.
We believe that the audit evidence we have obtained is sufficient and appropriate to provide a basis for our auditopinions.
OpinionsIn our opinion, the financial statements referred to above present fairly, in all material respects, the respectivefinancial position of the governmental activities, each major fund, and the aggregate remaining fund information ofEnglewood Schools as of June 30, 2017, and the respective changes in financial position for the year then ended inaccordance with accounting principles generally accepted in the United States of America.
viii
ix
Emphasis of Matter
As discussed in Note 10 to the financial statements, the financial statements as of and for the year ended June 30,
2016, have been restated to correct misstatements. Our opinion is not modified with respect to this matter.
Other Matters (Required Supplementary Information)
Accounting principles generally accepted in the United States of America require that the management’s discussion
and analysis and the required supplementary information listed in the table of contents be presented to supplement
the basic financial statements. Such information, although not a part of the basic financial statements, is required
by the Governmental Accounting Standards Board, who considers it to be an essential part of financial reporting for
placing the basic financial statements in an appropriate operational, economic, or historical context. We have applied
certain limited procedures to the information in accordance with auditing standards generally accepted in the United
States of America, which consisted of inquiries of management about the methods of preparing the information and
comparing the information for consistency with management’s responses to our inquiries, the basic financial
statements, and other knowledge we obtained during our audit of the basic financial statements. We do not express
an opinion or provide any assurance on the information because the limited procedures do not provide us with
sufficient evidence to express an opinion or provide any assurance.
Other Matters (Other Information)
Our audit was conducted for the purpose of forming opinions on the financial statements that collectively comprise
Englewood Schools’ basic financial statements. The introductory section, supplementary information, statistical
section, and auditors integrity report listed in the table of contents are presented for purposes of additional analysis
and are not a required part of the basic financial statements.
The supplementary information and the auditors integrity report are the responsibility of management and were
derived from and relate directly to the underlying accounting and other records used to prepare the basic financial
statements. Such information has been subjected to the auditing procedures applied in the audit of the basic financial
statements and certain additional procedures, including comparing and reconciling the information directly to the
underlying accounting and other records used to prepare the basic financial statements or to the basic financial
statements themselves, and other additional procedures in accordance with auditing standards generally accepted in
the United States of America. In our opinion, the information is fairly stated, in all material respects, in relation to
the basic financial statements as a whole.
The introductory and statistical sections have not been subjected to the auditing procedures applied in the audit of
the basic financial statements and, accordingly, we do not express an opinion or provide any assurance on them.
Other Reporting Required by Government Auditing Standards
In accordance with Government Auditing Standards, we have also issued our report dated December 7, 2017, on our
consideration of Englewood Schools’ internal control over financial reporting and on our tests of its compliance with
certain provisions of laws, regulations, contracts, and grant agreements and other matters. The purpose of that report
is to describe the scope of our testing of internal control over financial reporting and compliance and the results of
that testing, and not to provide an opinion on internal control over financial reporting or on compliance. That report
is an integral part of an audit performed in accordance with Government Auditing Standards in considering
Englewood Schools’ internal control over financial reporting and compliance.
December 7, 2017
x
Management’s Discussion and Analysis
As management of the Arapahoe County School District One (Englewood Schools or District), we offer readers of Englewood Schools’ financial statements this narrative overview and analysis of the financial activities of Englewood Schools for the fiscal year ended June 30, 2017. We encourage readers to consider the information presented here in conjunction with additional information that we have furnished in our letter of transmittal, which can be found on pages i - iv of this report. Financial Highlights
The District had two successful ballots on the November 8, 2016 General Election with respect to $1.5 million in Mill levy Override and $97.5 million in General Obligation bonds. The net proceeds of the Bonds will be used to fund capital construction projects and capital asset purchases approved by the District voters. The improvement project includes, but is not limited to, the construction of four elementary schools and one early childhood education center. The construction of the first two schools began in mid-2017 and are expected to be completed by June and July 2018, respectively.
The liabilities and deferred inflows of Englewood Schools exceeded its assets and deferred outflows at the close of the most recent fiscal year by $(53,621,351) (net position), a change of $14,670,206 from the previous fiscal year. 2015 saw the implementation of GASB 68 which includes a Net Pension Liability of $133,853,012 as of June 30, 2017. (See Note 7 for additional information). At the close of the fiscal year, Englewood Schools’ governmental funds reported a combined ending fund balance of $126,792,834, an increase of $110,836,046 as a result of the sale of General Obligation Bonds. The general fund ending fund balance was $10,688,691, an increase of $1,424,153 from the prior year. Overview of Financial Statements The government-wide financial statements are designed to provide readers with a broad overview of Englewood Schools’ finances, in a manner similar to a private-sector business. The statement of net position presents information on all of Englewood Schools’ assets and liabilities, with the difference between the two reported as net position. Over time, increases or decreases in net position may serve as a useful indicator of whether the financial position of Englewood Schools is improving or deteriorating. The statement of activities presents information showing how the District’s net position changed during the most recent fiscal year. All changes in net position are reported as soon as the underlying event giving rise to the change occurs, regardless of the timing of related cash flows. Thus, revenues and expenses are reported in this statement for some items that will only result in cash flows in future fiscal periods (e.g., uncollected taxes and earned but unused vacation leave). Prior to 2015, the government-wide financial statements distinguished functions of Englewood Schools that are principally supported by taxes (governmental activities) from other functions that were intended to recover all or a significant portion of their costs through user fees and charges (business-type activities). The governmental activities of Englewood Schools include instruction and support services of the District. In 2015, Englewood Schools switched the 2 business-type activities funds (the food services fund and the tuition programs fund) to special revenue funds, which now fall under the governmental activities functions.
xi
Fund Financial Statements. A fund is a grouping of related accounts that is used to maintain control over resources that have been segregated for specific activities or objectives. Englewood Schools, like other local governments, uses fund accounting to ensure and demonstrate compliance with finance-related legal requirements. All of the funds of Englewood Schools can now be divided into just two categories: governmental funds and fiduciary funds. Governmental Funds. Governmental funds are used to account for essentially the same functions reported as governmental activities in the government-wide financial statements. However, unlike the government-wide financial statements, governmental fund financial statements focus on near-term inflows and outflows of spendable resources, as well on balances of spendable resources available at the end of the fiscal year. Such information may be useful in evaluating the District’s near-term financing requirements. Because the focus of governmental funds is narrower than that of the government-wide financial statements, it is useful to compare the information presented for governmental funds with similar information presented for governmental activities in the government-wide financial statements. By doing so, readers may better understand the long-term impact of the District’s near-term financing decisions. Both the governmental fund balance sheet and the governmental fund statement of revenues, expenditures, and changes in fund balances provide a reconciliation to facilitate this comparison between governmental funds and governmental activities. Englewood Schools maintains eight individual governmental funds. Information is presented separately in the governmental fund balance sheet and in the governmental fund statement of revenue, expenditures, and changes in fund balances for the general fund, the grants fund, bond redemption, building fund, and non-major governmental funds. The non-major governmental funds includes the food service fund, the tuition fund, and the capital reserve fund. Englewood Schools adopts an annual appropriated budget for its general fund. A budgetary comparison statement has been provided for the general fund to demonstrate compliance with this budget. Fiduciary Funds. Fiduciary funds are used to account for resources held for the benefit of parties outside the District. Fiduciary funds are not reflected in the government-wide financial statements because the resources of those funds are not available to support Englewood Schools’ own programs. The accounting used for fiduciary funds is much like that used for proprietary funds. Notes to the Financial Statements. The notes provide additional information that is essential to a full understanding of the data provided in the government-wide and fund financial statements. Required Supplementary Information. In addition to the basic financial statements and accompanying notes, this report also presents certain required supplementary information (RSI) concerning the District. The District adopts an annual appropriated budget for all funds. A budgetary comparison schedule has been provided for the General Fund and the Grants Fund to demonstrate compliance with this budget. Supplemental Information. In addition to the basic financial statements and accompanying notes, this report also presents budget to actual schedules for the District’s other funds and certain reports required by the Single Audit Act of 1984. Other Information. The individual fund statements are presented after the notes to the financial statements.
xii
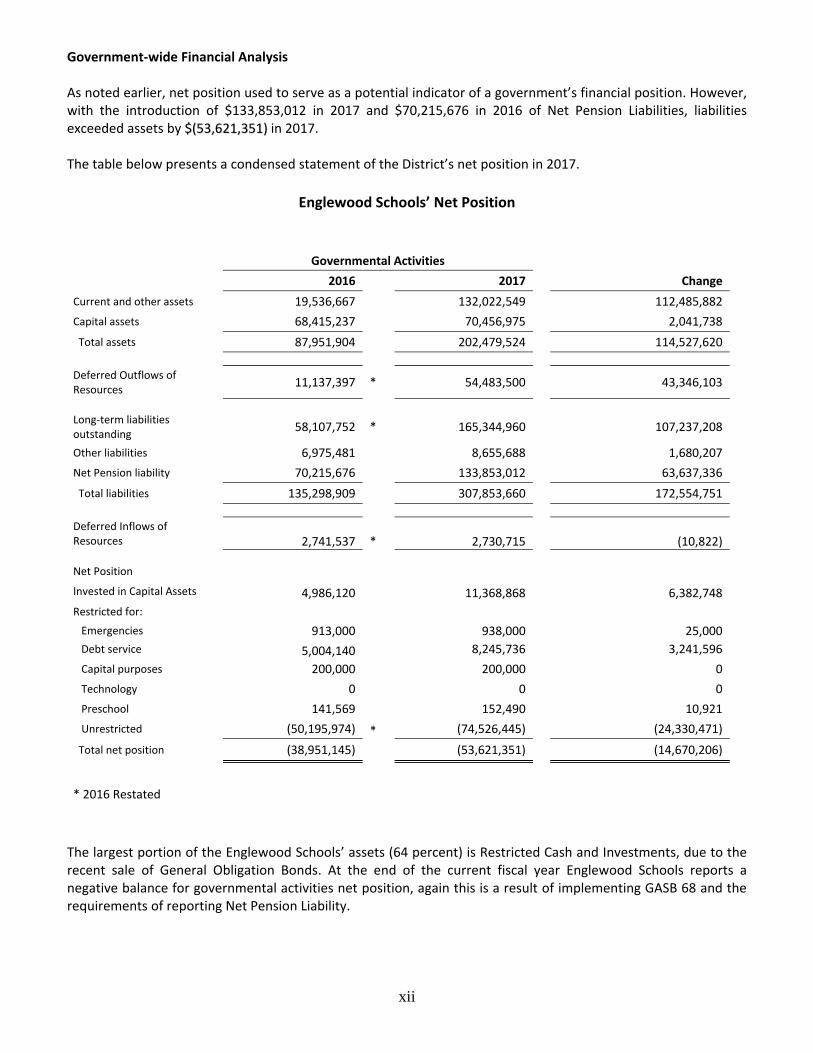
Government-wide Financial Analysis As noted earlier, net position used to serve as a potential indicator of a government’s financial position. However, with the introduction of $133,853,012 in 2017 and $70,215,676 in 2016 of Net Pension Liabilities, liabilities exceeded assets by $$((5533,,662211,,335511)) in 2017. The table below presents a condensed statement of the District’s net position in 2017.
Englewood Schools’ Net Position
Governmental Activities
2016
2017
Change
Current and other assets 19,536,667
132,022,549
112,485,882
Capital assets 68,415,237
70,456,975
2,041,738
Total assets 87,951,904
202,479,524
114,527,620
Deferred Outflows of Resources
11,137,397 * 54,483,500
43,346,103
Long-term liabilities outstanding
58,107,752 * 165,344,960
107,237,208
Other liabilities 6,975,481
8,655,688
1,680,207
Net Pension liability 70,215,676
133,853,012
63,637,336
Total liabilities 135,298,909
307,853,660
172,554,751
Deferred Inflows of Resources 2,741,537 * 2,730,715
(10,822)
Net Position
4,986,120 11,368,868 6,382,748 Invested in Capital Assets
Restricted for:
913,000 938,000 Emergencies
25,000
Debt service 5,004,140
8,245,736
3,241,596
Capital purposes 200,000
200,000
0
Technology 0
0
0
Preschool 141,569
152,490
10,921
Unrestricted (50,195,974) * (74,526,445)
(24,330,471)
Total net position (38,951,145)
(53,621,351)
(14,670,206)
* 2016 Restated
The largest portion of the Englewood Schools’ assets (64 percent) is Restricted Cash and Investments, due to the recent sale of General Obligation Bonds. At the end of the current fiscal year Englewood Schools reports a negative balance for governmental activities net position, again this is a result of implementing GASB 68 and the requirements of reporting Net Pension Liability.
xiii
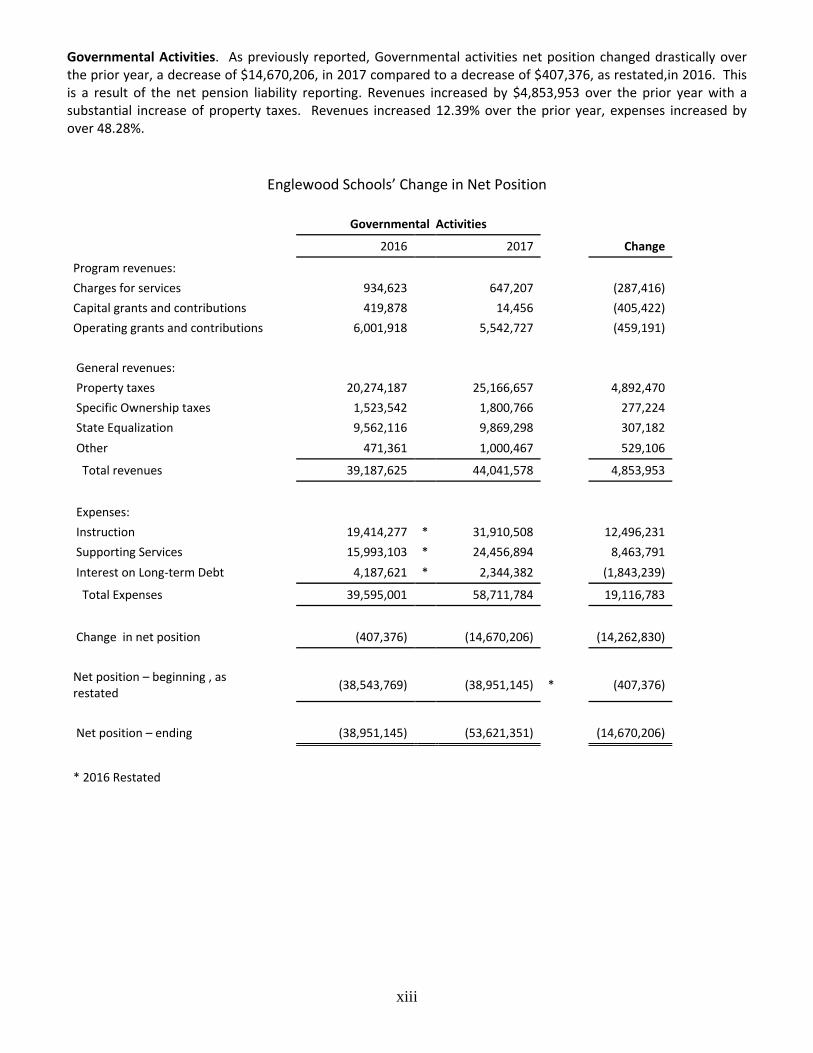
Governmental Activities. As previously reported, Governmental activities net position changed drastically over the prior year, a decrease of $14,670,206, in 2017 compared to a decrease of $407,376, as restated,in 2016. This is a result of the net pension liability reporting. Revenues increased by $4,853,953 over the prior year with a substantial increase of property taxes. Revenues increased 12.39% over the prior year, expenses increased by over 48.28%.
Englewood Schools’ Change in Net Position
Governmental Activities
2016 2017
Change
Program revenues:
Charges for services 934,623
647,207
(287,416)
Capital grants and contributions 419,878
14,456
(405,422)
Operating grants and contributions 6,001,918
5,542,727
(459,191)
General revenues:
Property taxes 20,274,187
25,166,657
4,892,470
Specific Ownership taxes 1,523,542
1,800,766
277,224
State Equalization 9,562,116
9,869,298
307,182
Other 471,361 1,000,467
529,106
Total revenues 39,187,625 44,041,578
4,853,953
Expenses:
Instruction 19,414,277 * 31,910,508
12,496,231
Supporting Services 15,993,103 * 24,456,894
8,463,791
Interest on Long-term Debt 4,187,621 * 2,344,382
(1,843,239)
Total Expenses 39,595,001 58,711,784
19,116,783
Change in net position (407,376) (14,670,206)
(14,262,830)
Net position – beginning , as restated
(38,543,769) (38,951,145) * (407,376)
Net position – ending (38,951,145) (53,621,351)
(14,670,206)
* 2016 Restated
xiv
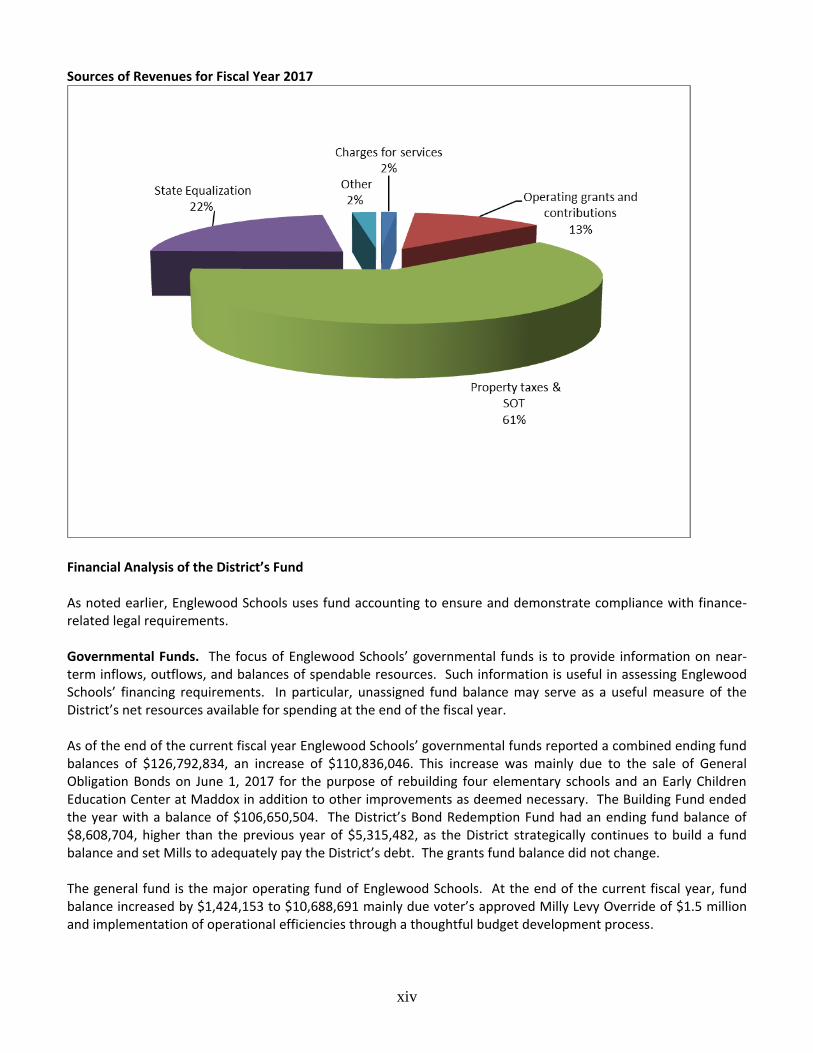
Sources of Revenues for Fiscal Year 2017
Financial Analysis of the District’s Fund As noted earlier, Englewood Schools uses fund accounting to ensure and demonstrate compliance with finance-related legal requirements. Governmental Funds. The focus of Englewood Schools’ governmental funds is to provide information on near-term inflows, outflows, and balances of spendable resources. Such information is useful in assessing Englewood Schools’ financing requirements. In particular, unassigned fund balance may serve as a useful measure of the District’s net resources available for spending at the end of the fiscal year. As of the end of the current fiscal year Englewood Schools’ governmental funds reported a combined ending fund balances of $126,792,834, an increase of $110,836,046. This increase was mainly due to the sale of General Obligation Bonds on June 1, 2017 for the purpose of rebuilding four elementary schools and an Early Children Education Center at Maddox in addition to other improvements as deemed necessary. The Building Fund ended the year with a balance of $106,650,504. The District’s Bond Redemption Fund had an ending fund balance of $8,608,704, higher than the previous year of $5,315,482, as the District strategically continues to build a fund balance and set Mills to adequately pay the District’s debt. The grants fund balance did not change. The general fund is the major operating fund of Englewood Schools. At the end of the current fiscal year, fund balance increased by $1,424,153 to $10,688,691 mainly due voter’s approved Milly Levy Override of $1.5 million and implementation of operational efficiencies through a thoughtful budget development process.
xv
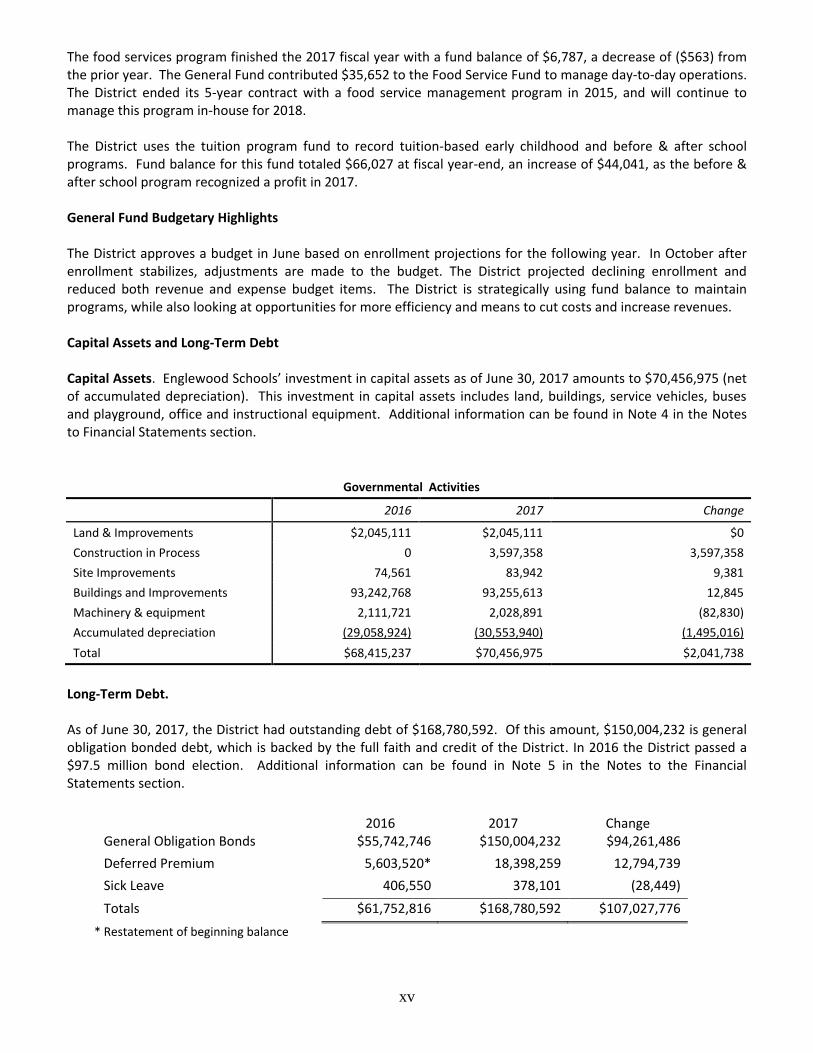
The food services program finished the 2017 fiscal year with a fund balance of $6,787, a decrease of ($563) from the prior year. The General Fund contributed $35,652 to the Food Service Fund to manage day-to-day operations. The District ended its 5-year contract with a food service management program in 2015, and will continue to manage this program in-house for 2018. The District uses the tuition program fund to record tuition-based early childhood and before & after school programs. Fund balance for this fund totaled $66,027 at fiscal year-end, an increase of $44,041, as the before & after school program recognized a profit in 2017. General Fund Budgetary Highlights The District approves a budget in June based on enrollment projections for the following year. In October after enrollment stabilizes, adjustments are made to the budget. The District projected declining enrollment and reduced both revenue and expense budget items. The District is strategically using fund balance to maintain programs, while also looking at opportunities for more efficiency and means to cut costs and increase revenues. Capital Assets and Long-Term Debt Capital Assets. Englewood Schools’ investment in capital assets as of June 30, 2017 amounts to $70,456,975 (net of accumulated depreciation). This investment in capital assets includes land, buildings, service vehicles, buses and playground, office and instructional equipment. Additional information can be found in Note 4 in the Notes to Financial Statements section.
Governmental Activities
2016 2017 Change
Land & Improvements $2,045,111 $2,045,111 $0
Construction in Process 0 3,597,358 3,597,358
Site Improvements 74,561 83,942 9,381
Buildings and Improvements 93,242,768 93,255,613 12,845
Machinery & equipment 2,111,721 2,028,891 (82,830)
Accumulated depreciation (29,058,924) (30,553,940) (1,495,016)
Total $68,415,237 $70,456,975 $2,041,738
Long-Term Debt. As of June 30, 2017, the District had outstanding debt of $168,780,592. Of this amount, $150,004,232 is general obligation bonded debt, which is backed by the full faith and credit of the District. In 2016 the District passed a $97.5 million bond election. Additional information can be found in Note 5 in the Notes to the Financial Statements section.
2016 2017 Change General Obligation Bonds $55,742,746 $150,004,232 $94,261,486
Deferred Premium 5,603,520* 18,398,259 12,794,739
Sick Leave 406,550 378,101 (28,449)
Totals $61,752,816 $168,780,592 $107,027,776
* Restatement of beginning balance
xvi
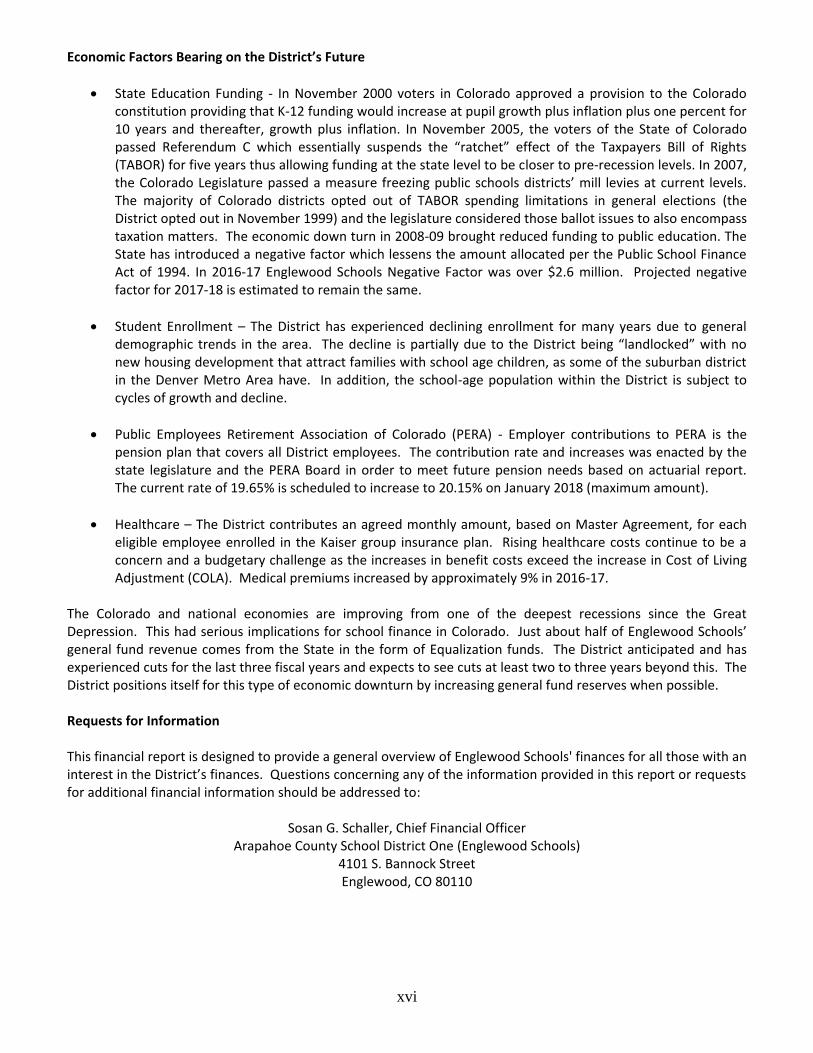
Economic Factors Bearing on the District’s Future
State Education Funding - In November 2000 voters in Colorado approved a provision to the Colorado constitution providing that K-12 funding would increase at pupil growth plus inflation plus one percent for 10 years and thereafter, growth plus inflation. In November 2005, the voters of the State of Colorado passed Referendum C which essentially suspends the “ratchet” effect of the Taxpayers Bill of Rights (TABOR) for five years thus allowing funding at the state level to be closer to pre-recession levels. In 2007, the Colorado Legislature passed a measure freezing public schools districts’ mill levies at current levels. The majority of Colorado districts opted out of TABOR spending limitations in general elections (the District opted out in November 1999) and the legislature considered those ballot issues to also encompass taxation matters. The economic down turn in 2008-09 brought reduced funding to public education. The State has introduced a negative factor which lessens the amount allocated per the Public School Finance Act of 1994. In 2016-17 Englewood Schools Negative Factor was over $2.6 million. Projected negative factor for 2017-18 is estimated to remain the same.
Student Enrollment – The District has experienced declining enrollment for many years due to general demographic trends in the area. The decline is partially due to the District being “landlocked” with no new housing development that attract families with school age children, as some of the suburban district in the Denver Metro Area have. In addition, the school-age population within the District is subject to cycles of growth and decline.
Public Employees Retirement Association of Colorado (PERA) - Employer contributions to PERA is the pension plan that covers all District employees. The contribution rate and increases was enacted by the state legislature and the PERA Board in order to meet future pension needs based on actuarial report. The current rate of 19.65% is scheduled to increase to 20.15% on January 2018 (maximum amount).
Healthcare – The District contributes an agreed monthly amount, based on Master Agreement, for each eligible employee enrolled in the Kaiser group insurance plan. Rising healthcare costs continue to be a concern and a budgetary challenge as the increases in benefit costs exceed the increase in Cost of Living Adjustment (COLA). Medical premiums increased by approximately 9% in 2016-17.
The Colorado and national economies are improving from one of the deepest recessions since the Great Depression. This had serious implications for school finance in Colorado. Just about half of Englewood Schools’ general fund revenue comes from the State in the form of Equalization funds. The District anticipated and has experienced cuts for the last three fiscal years and expects to see cuts at least two to three years beyond this. The District positions itself for this type of economic downturn by increasing general fund reserves when possible. Requests for Information This financial report is designed to provide a general overview of Englewood Schools' finances for all those with an interest in the District’s finances. Questions concerning any of the information provided in this report or requests for additional financial information should be addressed to:
Sosan G. Schaller, Chief Financial Officer Arapahoe County School District One (Englewood Schools)
4101 S. Bannock Street Englewood, CO 80110

BASIC FINANCIAL STATEMENTS
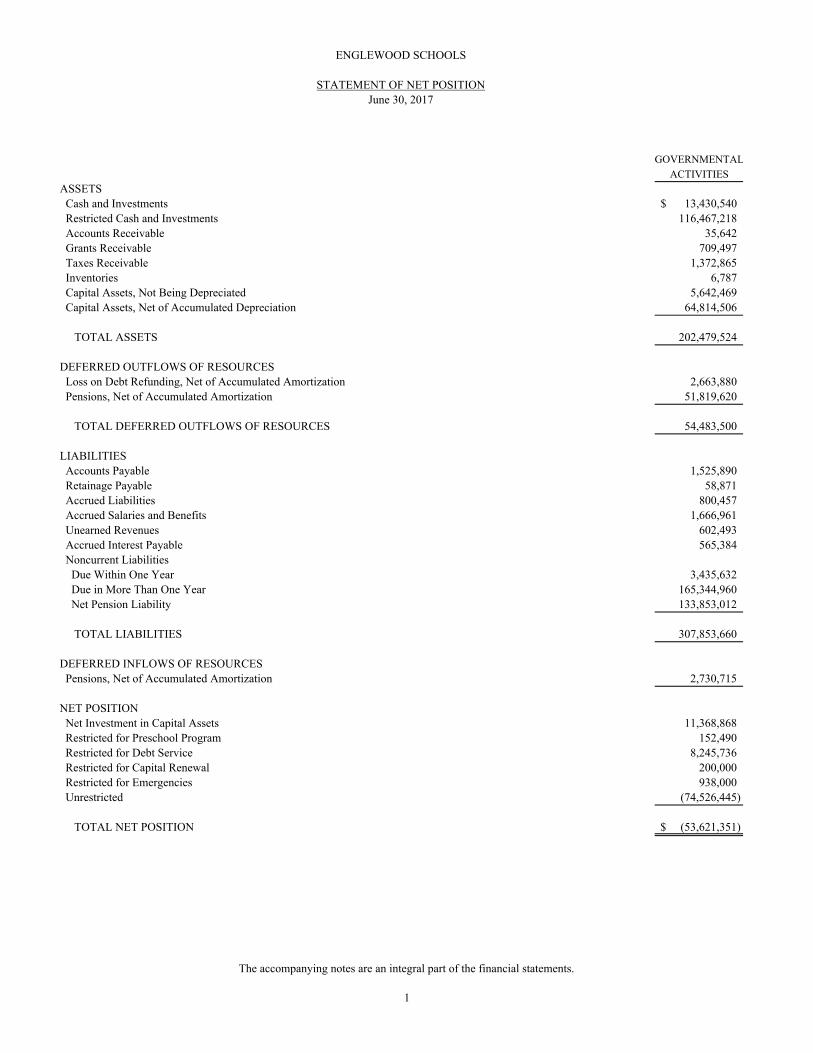
GOVERNMENTAL
ACTIVITIES
ASSETS Cash and Investments 13,430,540$ Restricted Cash and Investments 116,467,218 Accounts Receivable 35,642 Grants Receivable 709,497 Taxes Receivable 1,372,865 Inventories 6,787 Capital Assets, Not Being Depreciated 5,642,469 Capital Assets, Net of Accumulated Depreciation 64,814,506
TOTAL ASSETS 202,479,524
DEFERRED OUTFLOWS OF RESOURCES Loss on Debt Refunding, Net of Accumulated Amortization 2,663,880 Pensions, Net of Accumulated Amortization 51,819,620
TOTAL DEFERRED OUTFLOWS OF RESOURCES 54,483,500
LIABILITIES Accounts Payable 1,525,890 Retainage Payable 58,871 Accrued Liabilities 800,457 Accrued Salaries and Benefits 1,666,961 Unearned Revenues 602,493 Accrued Interest Payable 565,384 Noncurrent Liabilities Due Within One Year 3,435,632 Due in More Than One Year 165,344,960 Net Pension Liability 133,853,012
TOTAL LIABILITIES 307,853,660
DEFERRED INFLOWS OF RESOURCES Pensions, Net of Accumulated Amortization 2,730,715
NET POSITION Net Investment in Capital Assets 11,368,868 Restricted for Preschool Program 152,490 Restricted for Debt Service 8,245,736 Restricted for Capital Renewal 200,000 Restricted for Emergencies 938,000 Unrestricted (74,526,445)
TOTAL NET POSITION (53,621,351)$
ENGLEWOOD SCHOOLS
STATEMENT OF NET POSITIONJune 30, 2017
The accompanying notes are an integral part of the financial statements.
1
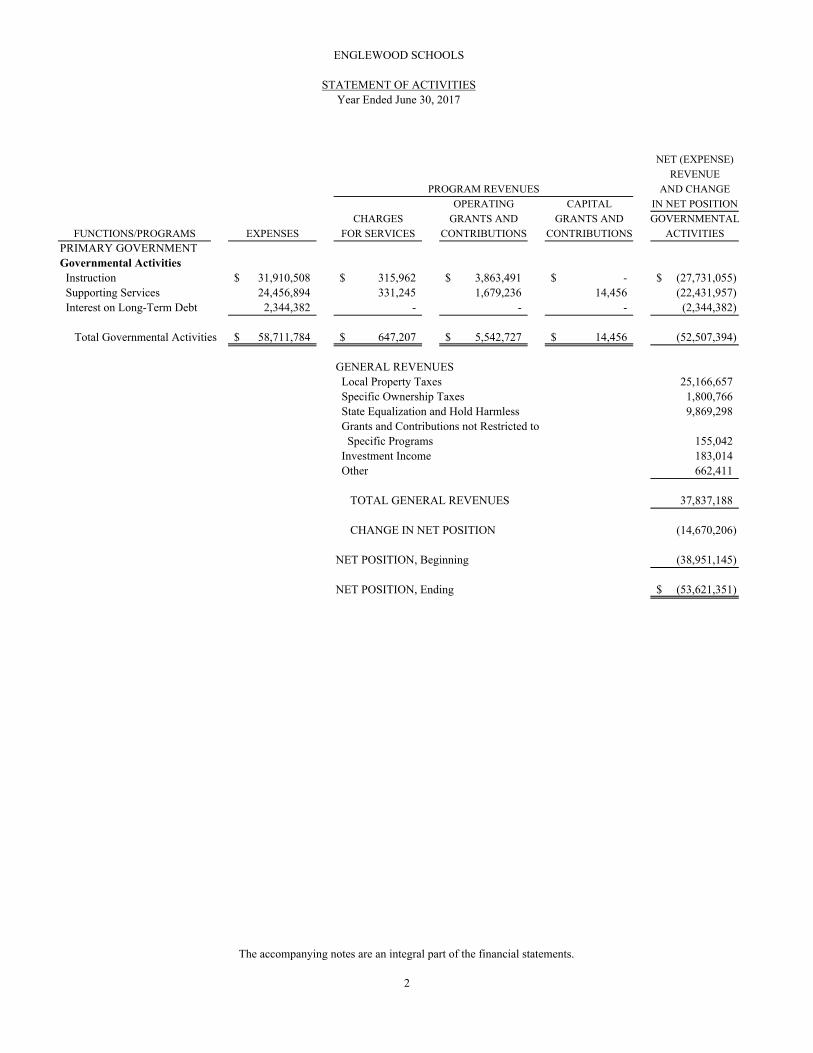
NET (EXPENSE)
REVENUE
AND CHANGE
OPERATING CAPITAL IN NET POSITION
CHARGES GRANTS AND GRANTS AND GOVERNMENTAL
FUNCTIONS/PROGRAMS EXPENSES FOR SERVICES CONTRIBUTIONS CONTRIBUTIONS ACTIVITIES
PRIMARY GOVERNMENTGovernmental Activities Instruction 31,910,508$ 315,962$ 3,863,491$ -$ (27,731,055)$ Supporting Services 24,456,894 331,245 1,679,236 14,456 (22,431,957) Interest on Long-Term Debt 2,344,382 - - - (2,344,382)
Total Governmental Activities 58,711,784$ 647,207$ 5,542,727$ 14,456$ (52,507,394)
GENERAL REVENUES Local Property Taxes 25,166,657 Specific Ownership Taxes 1,800,766 State Equalization and Hold Harmless 9,869,298 Grants and Contributions not Restricted to Specific Programs 155,042 Investment Income 183,014 Other 662,411
TOTAL GENERAL REVENUES 37,837,188
CHANGE IN NET POSITION (14,670,206)
NET POSITION, Beginning (38,951,145)
NET POSITION, Ending (53,621,351)$
PROGRAM REVENUES
ENGLEWOOD SCHOOLS
STATEMENT OF ACTIVITIESYear Ended June 30, 2017
The accompanying notes are an integral part of the financial statements.
2
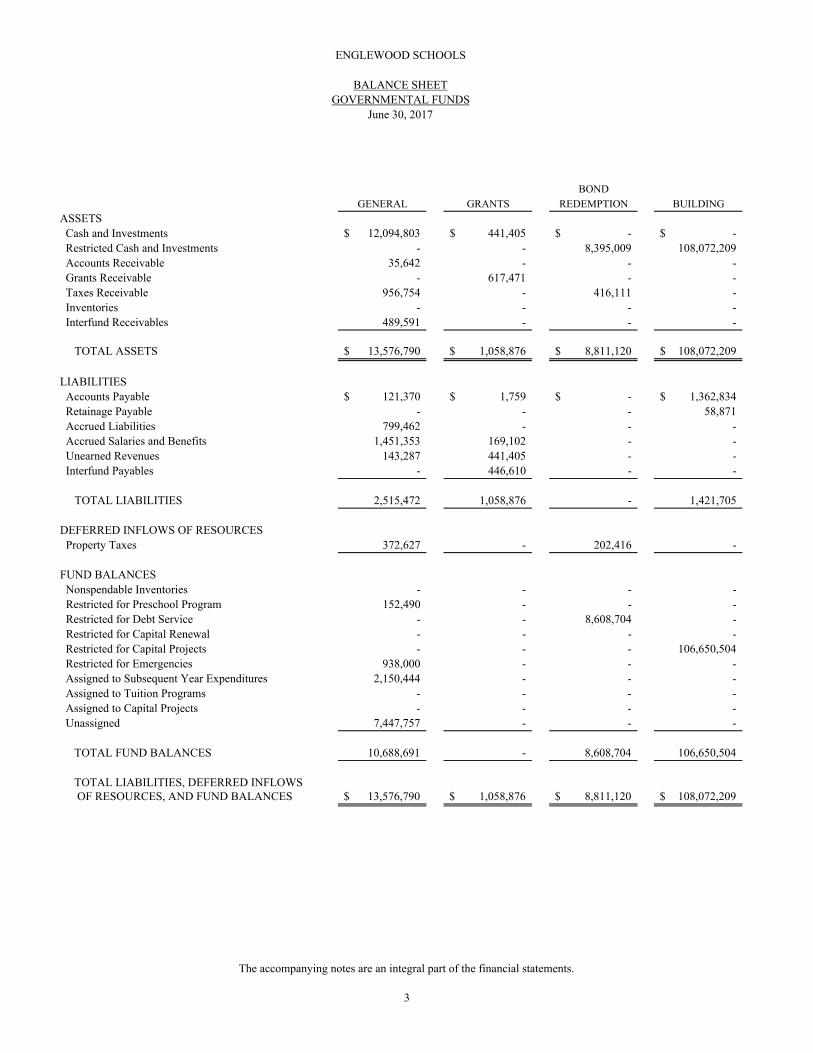
BOND
GENERAL GRANTS REDEMPTION BUILDING
ASSETS Cash and Investments 12,094,803$ 441,405$ -$ -$ Restricted Cash and Investments - - 8,395,009 108,072,209 Accounts Receivable 35,642 - - - Grants Receivable - 617,471 - - Taxes Receivable 956,754 - 416,111 - Inventories - - - - Interfund Receivables 489,591 - - -
TOTAL ASSETS 13,576,790$ 1,058,876$ 8,811,120$ 108,072,209$
LIABILITIES Accounts Payable 121,370$ 1,759$ -$ 1,362,834$ Retainage Payable - - - 58,871 Accrued Liabilities 799,462 - - - Accrued Salaries and Benefits 1,451,353 169,102 - - Unearned Revenues 143,287 441,405 - - Interfund Payables - 446,610 - -
TOTAL LIABILITIES 2,515,472 1,058,876 - 1,421,705
DEFERRED INFLOWS OF RESOURCES Property Taxes 372,627 - 202,416 -
FUND BALANCES Nonspendable Inventories - - - - Restricted for Preschool Program 152,490 - - - Restricted for Debt Service - - 8,608,704 - Restricted for Capital Renewal - - - - Restricted for Capital Projects - - - 106,650,504 Restricted for Emergencies 938,000 - - - Assigned to Subsequent Year Expenditures 2,150,444 - - - Assigned to Tuition Programs - - - - Assigned to Capital Projects - - - - Unassigned 7,447,757 - - -
TOTAL FUND BALANCES 10,688,691 - 8,608,704 106,650,504
TOTAL LIABILITIES, DEFERRED INFLOWS OF RESOURCES, AND FUND BALANCES 13,576,790$ 1,058,876$ 8,811,120$ 108,072,209$
ENGLEWOOD SCHOOLS
June 30, 2017
BALANCE SHEETGOVERNMENTAL FUNDS
The accompanying notes are an integral part of the financial statements.
3
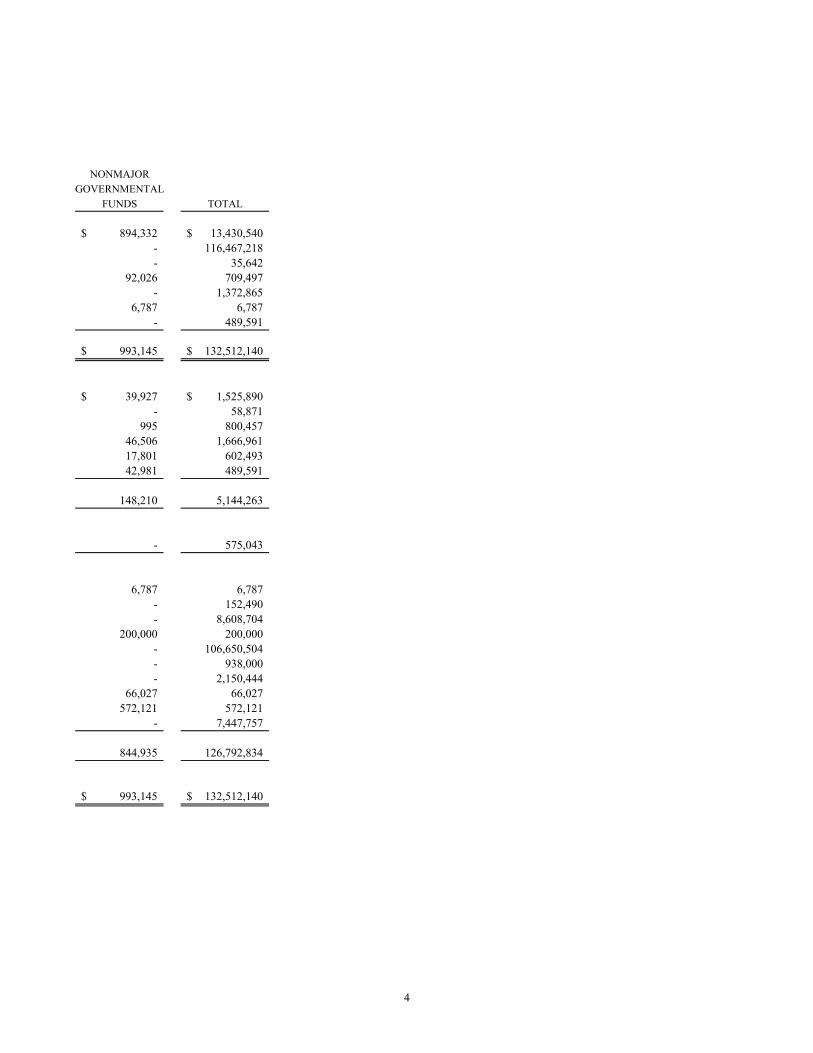
NONMAJOR
GOVERNMENTAL
FUNDS TOTAL
894,332$ 13,430,540$ - 116,467,218 - 35,642
92,026 709,497 - 1,372,865
6,787 6,787 - 489,591
993,145$ 132,512,140$
39,927$ 1,525,890$ - 58,871
995 800,457 46,506 1,666,961 17,801 602,493 42,981 489,591
148,210 5,144,263
- 575,043
6,787 6,787 - 152,490 - 8,608,704
200,000 200,000 - 106,650,504 - 938,000 - 2,150,444
66,027 66,027 572,121 572,121
- 7,447,757
844,935 126,792,834
993,145$ 132,512,140$
4
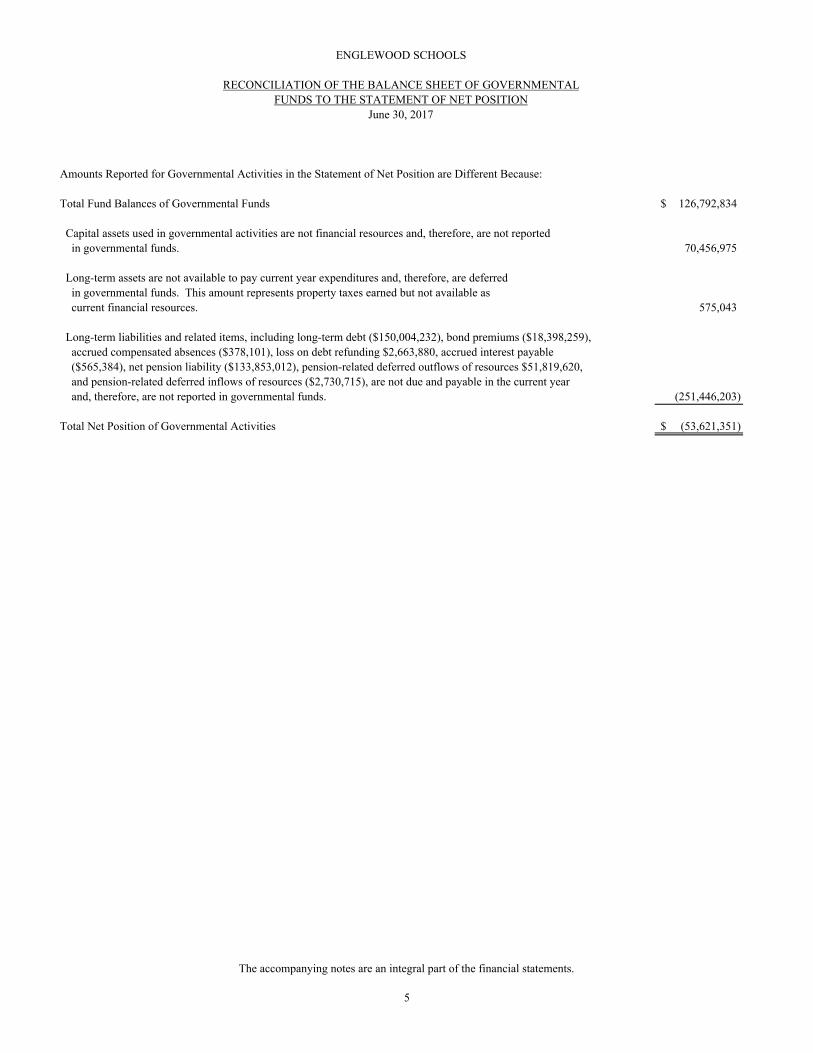
Amounts Reported for Governmental Activities in the Statement of Net Position are Different Because:
Total Fund Balances of Governmental Funds 126,792,834$
Capital assets used in governmental activities are not financial resources and, therefore, are not reported in governmental funds. 70,456,975
Long-term assets are not available to pay current year expenditures and, therefore, are deferred in governmental funds. This amount represents property taxes earned but not available as current financial resources. 575,043
Long-term liabilities and related items, including long-term debt ($150,004,232), bond premiums ($18,398,259), accrued compensated absences ($378,101), loss on debt refunding $2,663,880, accrued interest payable ($565,384), net pension liability ($133,853,012), pension-related deferred outflows of resources $51,819,620, and pension-related deferred inflows of resources ($2,730,715), are not due and payable in the current year and, therefore, are not reported in governmental funds. (251,446,203)
Total Net Position of Governmental Activities (53,621,351)$
ENGLEWOOD SCHOOLS
RECONCILIATION OF THE BALANCE SHEET OF GOVERNMENTALFUNDS TO THE STATEMENT OF NET POSITION
June 30, 2017
The accompanying notes are an integral part of the financial statements.
5

BOND
GENERAL GRANTS REDEMPTION BUILDING
REVENUES Local Sources 19,238,751$ 155,042$ 8,854,778$ 97,127$ County Sources 347 - - - State Sources 11,274,232 513,168 - - Federal Sources - 2,594,433 - -
TOTAL REVENUES 30,513,330 3,262,643 8,854,778 97,127
EXPENDITURES Current Instruction 16,299,959 1,432,148 - - Supporting Services 12,553,566 1,830,495 - - Capital Outlay - - - 3,597,358 Debt Service - Principal - - 3,238,514 - Interest and Fiscal Charges - - 2,323,042 - Debt Issuance Costs - - - 588,725
TOTAL EXPENDITURES 28,853,525 3,262,643 5,561,556 4,186,083
EXCESS OF REVENUES OVER (UNDER) EXPENDITURES 1,659,805 - 3,293,222 (4,088,956)
OTHER FINANCING SOURCES (USES) Debt Issued - - - 97,500,000 Debt Premium - - - 13,239,460 Transfers In - - - - Transfers Out (235,652) - - -
TOTAL OTHER FINANCING SOURCES (USES) (235,652) - - 110,739,460
NET CHANGE IN FUND BALANCES 1,424,153 - 3,293,222 106,650,504 FUND BALANCES, Beginning 9,264,538 - 5,315,482 -
FUND BALANCES, Ending 10,688,691$ -$ 8,608,704$ 106,650,504$
ENGLEWOOD SCHOOLS
STATEMENT OF REVENUES, EXPENDITURESAND CHANGES IN FUND BALANCES
GOVERNMENTAL FUNDSYear Ended June 30, 2017
The accompanying notes are an integral part of the financial statements.
6

NONMAJOR
GOVERNMENTAL
FUNDS TOTAL
254,813$ 28,600,511$ - 347
24,432 11,811,832 1,020,216 3,614,649
1,299,461 44,027,339
57,290 17,789,397 2,009,656 16,393,717
- 3,597,358
- 3,238,514 - 2,323,042 - 588,725
2,066,946 43,930,753
(767,485) 96,586
- 97,500,000 - 13,239,460
235,652 235,652 - (235,652)
235,652 110,739,460
(531,833) 110,836,046
1,376,768 15,956,788
844,935$ 126,792,834$
7
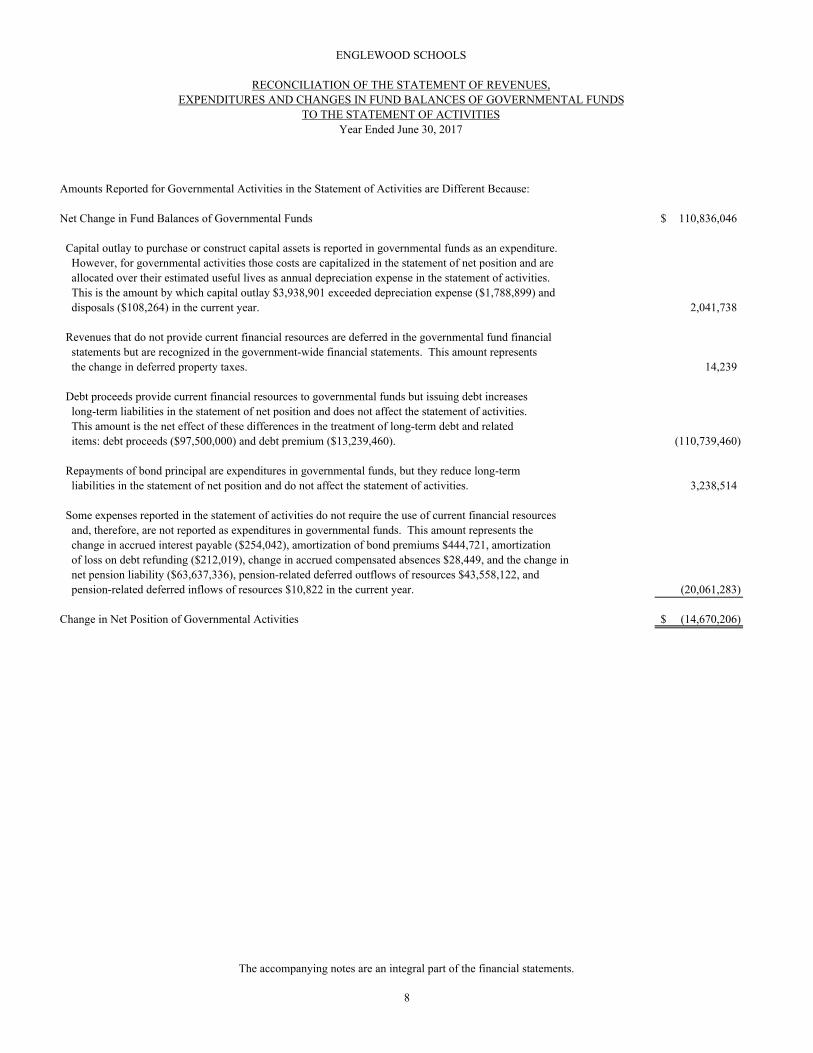
Amounts Reported for Governmental Activities in the Statement of Activities are Different Because:
Net Change in Fund Balances of Governmental Funds 110,836,046$
Capital outlay to purchase or construct capital assets is reported in governmental funds as an expenditure. However, for governmental activities those costs are capitalized in the statement of net position and are allocated over their estimated useful lives as annual depreciation expense in the statement of activities. This is the amount by which capital outlay $3,938,901 exceeded depreciation expense ($1,788,899) and disposals ($108,264) in the current year. 2,041,738 Revenues that do not provide current financial resources are deferred in the governmental fund financial statements but are recognized in the government-wide financial statements. This amount represents the change in deferred property taxes. 14,239
Debt proceeds provide current financial resources to governmental funds but issuing debt increases long-term liabilities in the statement of net position and does not affect the statement of activities. This amount is the net effect of these differences in the treatment of long-term debt and related items: debt proceeds ($97,500,000) and debt premium ($13,239,460). (110,739,460)
Repayments of bond principal are expenditures in governmental funds, but they reduce long-term liabilities in the statement of net position and do not affect the statement of activities. 3,238,514
Some expenses reported in the statement of activities do not require the use of current financial resources and, therefore, are not reported as expenditures in governmental funds. This amount represents the change in accrued interest payable ($254,042), amortization of bond premiums $444,721, amortization of loss on debt refunding ($212,019), change in accrued compensated absences $28,449, and the change in net pension liability ($63,637,336), pension-related deferred outflows of resources $43,558,122, and pension-related deferred inflows of resources $10,822 in the current year. (20,061,283)
Change in Net Position of Governmental Activities (14,670,206)$
ENGLEWOOD SCHOOLS
RECONCILIATION OF THE STATEMENT OF REVENUES,EXPENDITURES AND CHANGES IN FUND BALANCES OF GOVERNMENTAL FUNDS
TO THE STATEMENT OF ACTIVITIESYear Ended June 30, 2017
The accompanying notes are an integral part of the financial statements.
8
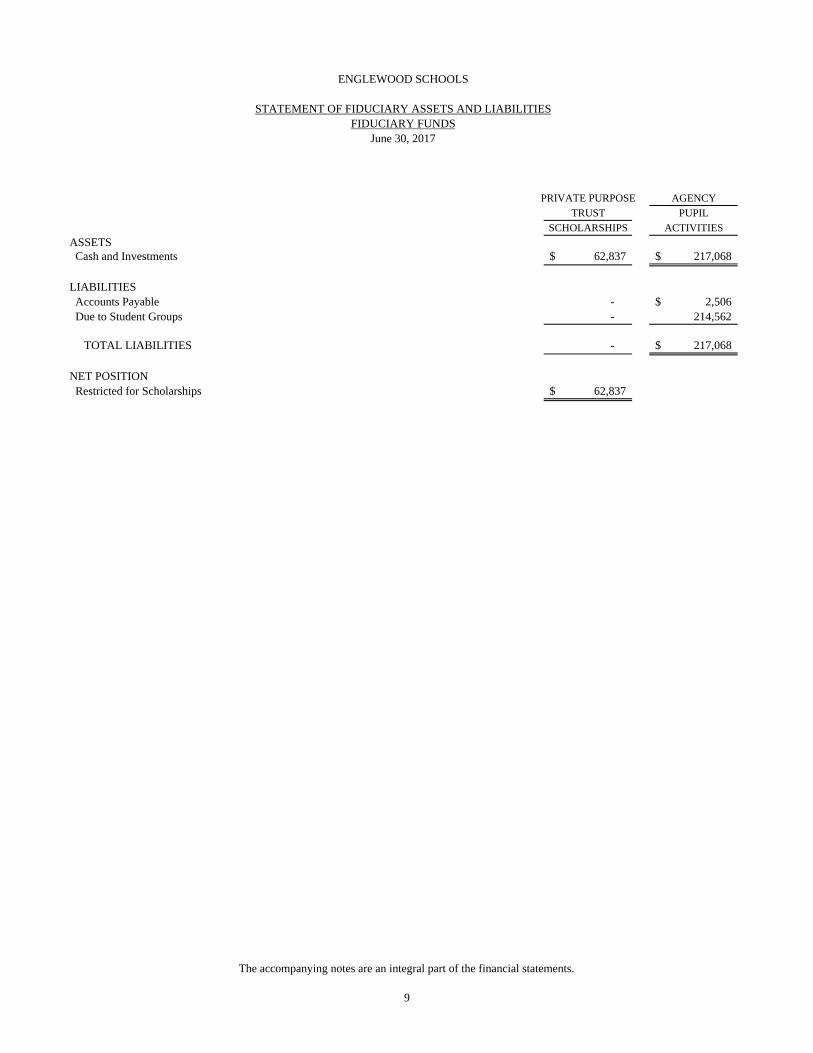
PRIVATE PURPOSE AGENCY
TRUST PUPIL
SCHOLARSHIPS ACTIVITIES
ASSETS Cash and Investments 62,837$ 217,068$
LIABILITIES Accounts Payable - 2,506$ Due to Student Groups - 214,562
TOTAL LIABILITIES - 217,068$
NET POSITION Restricted for Scholarships 62,837$
ENGLEWOOD SCHOOLS
STATEMENT OF FIDUCIARY ASSETS AND LIABILITIESFIDUCIARY FUNDS
June 30, 2017
The accompanying notes are an integral part of the financial statements.
9

SCHOLARSHIPS
ADDITIONS Investment Income 483$
DEDUCTIONS Scholarships 6,000
CHANGE IN NET POSITION (5,517) NET POSITION, Beginning 68,354
NET POSITION, Ending 62,837$
ENGLEWOOD SCHOOLS
STATEMENT OF CHANGES IN NET POSITIONPRIVATE PURPOSE TRUST FUND
Year Ended June 30, 2017
The accompanying notes are an integral part of the financial statements.
10
ENGLEWOOD SCHOOLS
NOTES TO FINANCIAL STATEMENTSJune 30, 2017
11
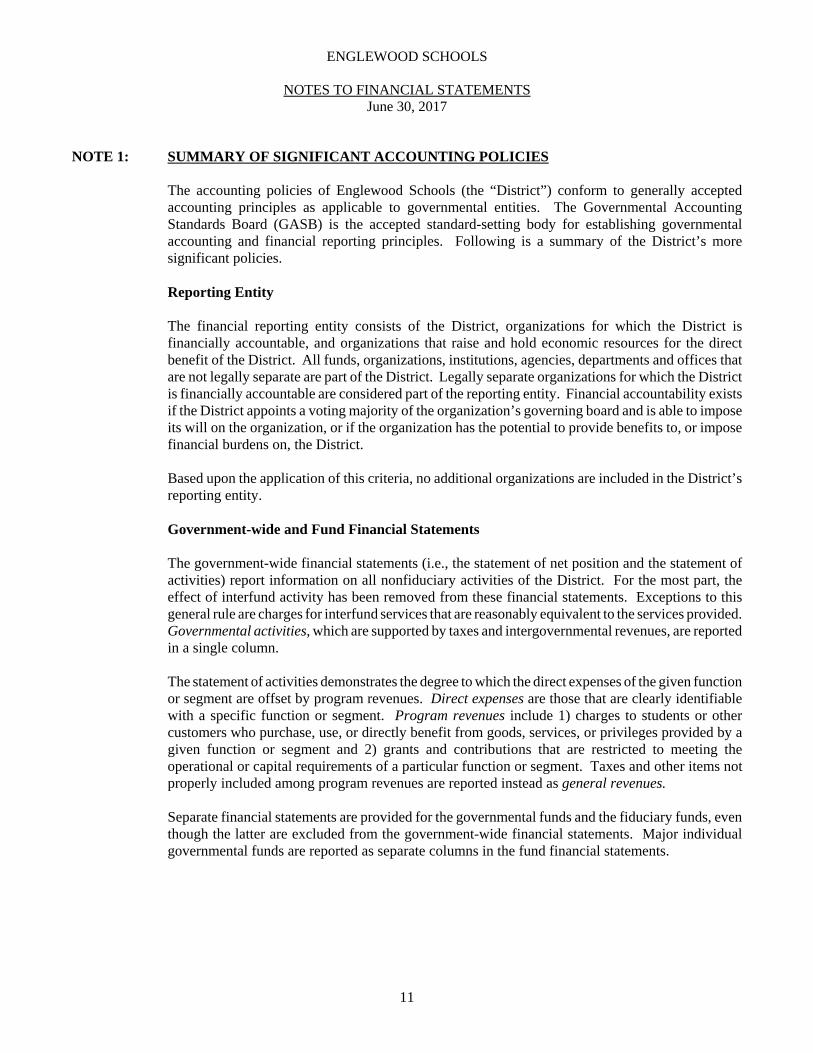
NOTE 1: SUMMARY OF SIGNIFICANT ACCOUNTING POLICIES
The accounting policies of Englewood Schools (the “District”) conform to generally acceptedaccounting principles as applicable to governmental entities. The Governmental AccountingStandards Board (GASB) is the accepted standard-setting body for establishing governmentalaccounting and financial reporting principles. Following is a summary of the District’s moresignificant policies.
Reporting Entity
The financial reporting entity consists of the District, organizations for which the District isfinancially accountable, and organizations that raise and hold economic resources for the directbenefit of the District. All funds, organizations, institutions, agencies, departments and offices thatare not legally separate are part of the District. Legally separate organizations for which the Districtis financially accountable are considered part of the reporting entity. Financial accountability existsif the District appoints a voting majority of the organization’s governing board and is able to imposeits will on the organization, or if the organization has the potential to provide benefits to, or imposefinancial burdens on, the District.
Based upon the application of this criteria, no additional organizations are included in the District’sreporting entity.
Government-wide and Fund Financial Statements
The government-wide financial statements (i.e., the statement of net position and the statement ofactivities) report information on all nonfiduciary activities of the District. For the most part, theeffect of interfund activity has been removed from these financial statements. Exceptions to thisgeneral rule are charges for interfund services that are reasonably equivalent to the services provided.Governmental activities, which are supported by taxes and intergovernmental revenues, are reportedin a single column.
The statement of activities demonstrates the degree to which the direct expenses of the given functionor segment are offset by program revenues. Direct expenses are those that are clearly identifiablewith a specific function or segment. Program revenues include 1) charges to students or othercustomers who purchase, use, or directly benefit from goods, services, or privileges provided by agiven function or segment and 2) grants and contributions that are restricted to meeting theoperational or capital requirements of a particular function or segment. Taxes and other items notproperly included among program revenues are reported instead as general revenues.
Separate financial statements are provided for the governmental funds and the fiduciary funds, eventhough the latter are excluded from the government-wide financial statements. Major individualgovernmental funds are reported as separate columns in the fund financial statements.

ENGLEWOOD SCHOOLS
NOTES TO FINANCIAL STATEMENTSJune 30, 2017
12
NOTE 1: SUMMARY OF SIGNIFICANT ACCOUNTING POLICIES (Continued)
Measurement Focus, Basis of Accounting, and Financial Statement Presentation
In the fund financial statements, the District reports the following major governmental funds:
The General Fund is the District’s primary operating fund. It accounts for all financial resources ofthe District, except those accounted for in another fund.
The Grants Fund accounts for local, state and federal grant revenues and the related expenditures.
The Bond Redemption Fund accounts for property taxes restricted for payment of the District’sgeneral obligation debt.
The Building Fund accounts for debt proceeds used for the acquisition and construction of capitalassets.
Additionally, the District reports the following fund types:
The Private Purpose Trust Fund is used to account for student scholarship programs. The Districtmaintains all resources in accordance with a formal trust agreement.
The Agency Fund is used to account for resources used to support each school’s pupil activities. TheDistrict holds all resources in a purely custodial capacity.
The government-wide financial statements are reported using the economic resources measurementfocus and the accrual basis of accounting, as are the trust fund financial statements. Revenues arerecorded when earned and expenses are recorded when a liability is incurred, regardless of the timingof related cash flows. Property taxes are recognized as revenues in the year for which they are levied.Grants and similar items are recognized as revenue as soon as all eligibility requirements imposedby the provider have been met. The agency fund financial statements are reported using the accrualbasis of accounting.
Governmental fund financial statements are reported using the current financial resourcesmeasurement focus and the modified accrual basis of accounting. Revenues are recognized as soonas they are both measurable and available. Revenues are considered to be available when they arecollected within the current year or soon enough thereafter to pay liabilities of the current year. Forthis purpose, the District considers revenues to be available if they are collected within 60 days ofthe end of the current year.
Taxes, intergovernmental revenues, grants, and interest associated with the current year areconsidered to be susceptible to accrual and have been recognized as revenues of the current year. Allother revenues are considered to be measurable and available only when cash is received by theDistrict.
ENGLEWOOD SCHOOLS
NOTES TO FINANCIAL STATEMENTSJune 30, 2017
13
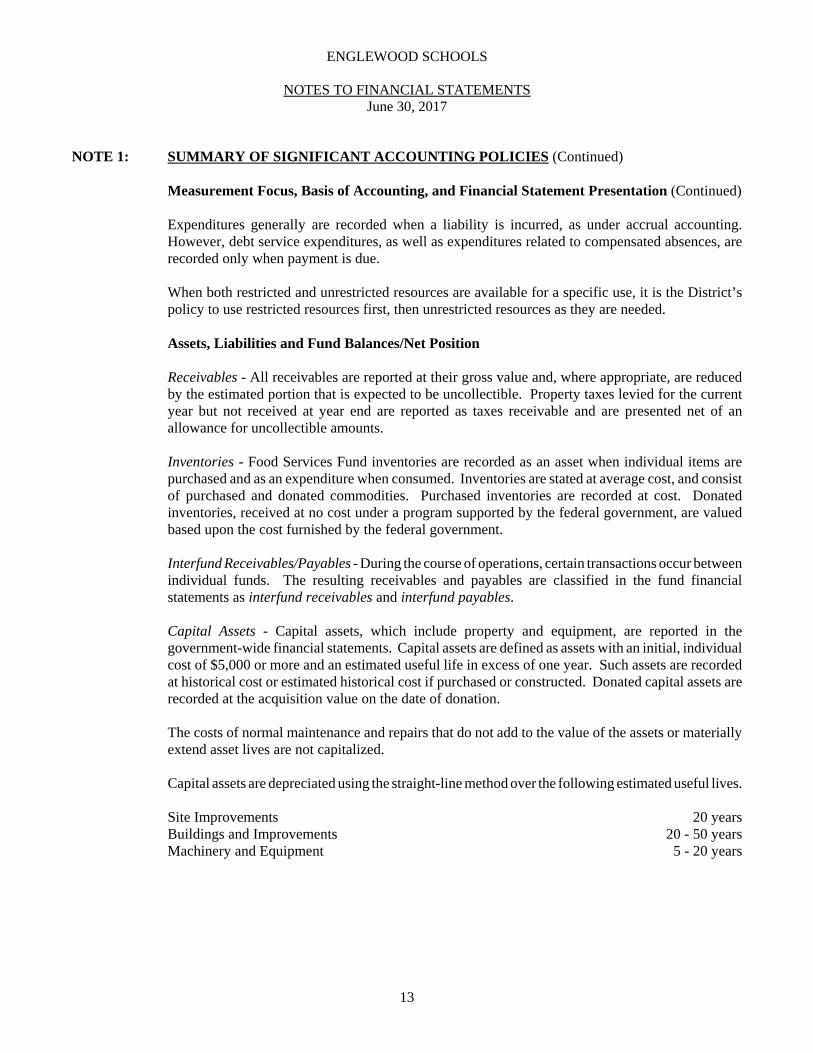
NOTE 1: SUMMARY OF SIGNIFICANT ACCOUNTING POLICIES (Continued)
Measurement Focus, Basis of Accounting, and Financial Statement Presentation (Continued)
Expenditures generally are recorded when a liability is incurred, as under accrual accounting.However, debt service expenditures, as well as expenditures related to compensated absences, arerecorded only when payment is due.
When both restricted and unrestricted resources are available for a specific use, it is the District’spolicy to use restricted resources first, then unrestricted resources as they are needed.
Assets, Liabilities and Fund Balances/Net Position
Receivables - All receivables are reported at their gross value and, where appropriate, are reducedby the estimated portion that is expected to be uncollectible. Property taxes levied for the currentyear but not received at year end are reported as taxes receivable and are presented net of anallowance for uncollectible amounts.
Inventories - Food Services Fund inventories are recorded as an asset when individual items arepurchased and as an expenditure when consumed. Inventories are stated at average cost, and consistof purchased and donated commodities. Purchased inventories are recorded at cost. Donatedinventories, received at no cost under a program supported by the federal government, are valuedbased upon the cost furnished by the federal government.
Interfund Receivables/Payables - During the course of operations, certain transactions occur betweenindividual funds. The resulting receivables and payables are classified in the fund financialstatements as interfund receivables and interfund payables.
Capital Assets - Capital assets, which include property and equipment, are reported in thegovernment-wide financial statements. Capital assets are defined as assets with an initial, individualcost of $5,000 or more and an estimated useful life in excess of one year. Such assets are recordedat historical cost or estimated historical cost if purchased or constructed. Donated capital assets arerecorded at the acquisition value on the date of donation.
The costs of normal maintenance and repairs that do not add to the value of the assets or materiallyextend asset lives are not capitalized.
Capital assets are depreciated using the straight-line method over the following estimated useful lives.
Site Improvements 20 yearsBuildings and Improvements 20 - 50 yearsMachinery and Equipment 5 - 20 years
ENGLEWOOD SCHOOLS
NOTES TO FINANCIAL STATEMENTSJune 30, 2017
14
NOTE 1: SUMMARY OF SIGNIFICANT ACCOUNTING POLICIES (Continued)
Assets, Liabilities and Fund Balances/Net Position (Continued)
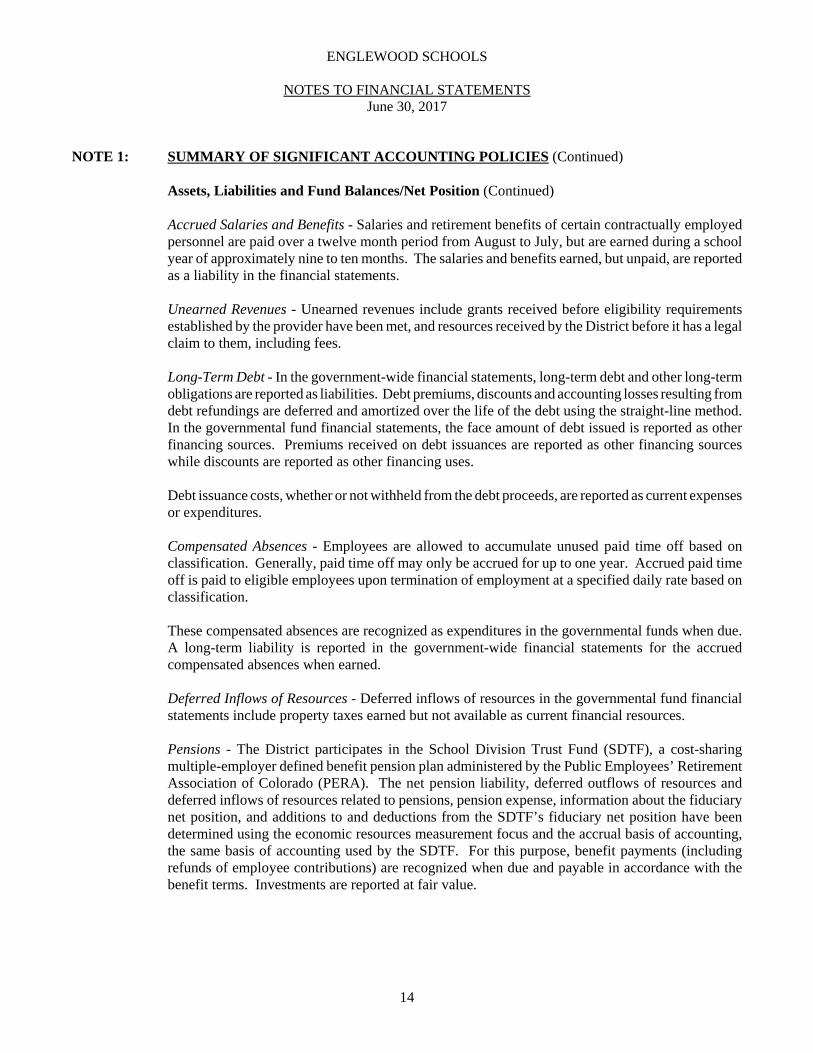
Accrued Salaries and Benefits - Salaries and retirement benefits of certain contractually employedpersonnel are paid over a twelve month period from August to July, but are earned during a schoolyear of approximately nine to ten months. The salaries and benefits earned, but unpaid, are reportedas a liability in the financial statements.
Unearned Revenues - Unearned revenues include grants received before eligibility requirementsestablished by the provider have been met, and resources received by the District before it has a legalclaim to them, including fees.
Long-Term Debt - In the government-wide financial statements, long-term debt and other long-termobligations are reported as liabilities. Debt premiums, discounts and accounting losses resulting fromdebt refundings are deferred and amortized over the life of the debt using the straight-line method.In the governmental fund financial statements, the face amount of debt issued is reported as otherfinancing sources. Premiums received on debt issuances are reported as other financing sourceswhile discounts are reported as other financing uses.
Debt issuance costs, whether or not withheld from the debt proceeds, are reported as current expensesor expenditures.
Compensated Absences - Employees are allowed to accumulate unused paid time off based onclassification. Generally, paid time off may only be accrued for up to one year. Accrued paid timeoff is paid to eligible employees upon termination of employment at a specified daily rate based onclassification.
These compensated absences are recognized as expenditures in the governmental funds when due.A long-term liability is reported in the government-wide financial statements for the accruedcompensated absences when earned.
Deferred Inflows of Resources - Deferred inflows of resources in the governmental fund financialstatements include property taxes earned but not available as current financial resources.
Pensions - The District participates in the School Division Trust Fund (SDTF), a cost-sharingmultiple-employer defined benefit pension plan administered by the Public Employees’ RetirementAssociation of Colorado (PERA). The net pension liability, deferred outflows of resources anddeferred inflows of resources related to pensions, pension expense, information about the fiduciarynet position, and additions to and deductions from the SDTF’s fiduciary net position have beendetermined using the economic resources measurement focus and the accrual basis of accounting,the same basis of accounting used by the SDTF. For this purpose, benefit payments (includingrefunds of employee contributions) are recognized when due and payable in accordance with thebenefit terms. Investments are reported at fair value.
ENGLEWOOD SCHOOLS
NOTES TO FINANCIAL STATEMENTSJune 30, 2017
15
NOTE 1: SUMMARY OF SIGNIFICANT ACCOUNTING POLICIES (Continued)
Assets, Liabilities and Fund Balances/Net Position (Continued)
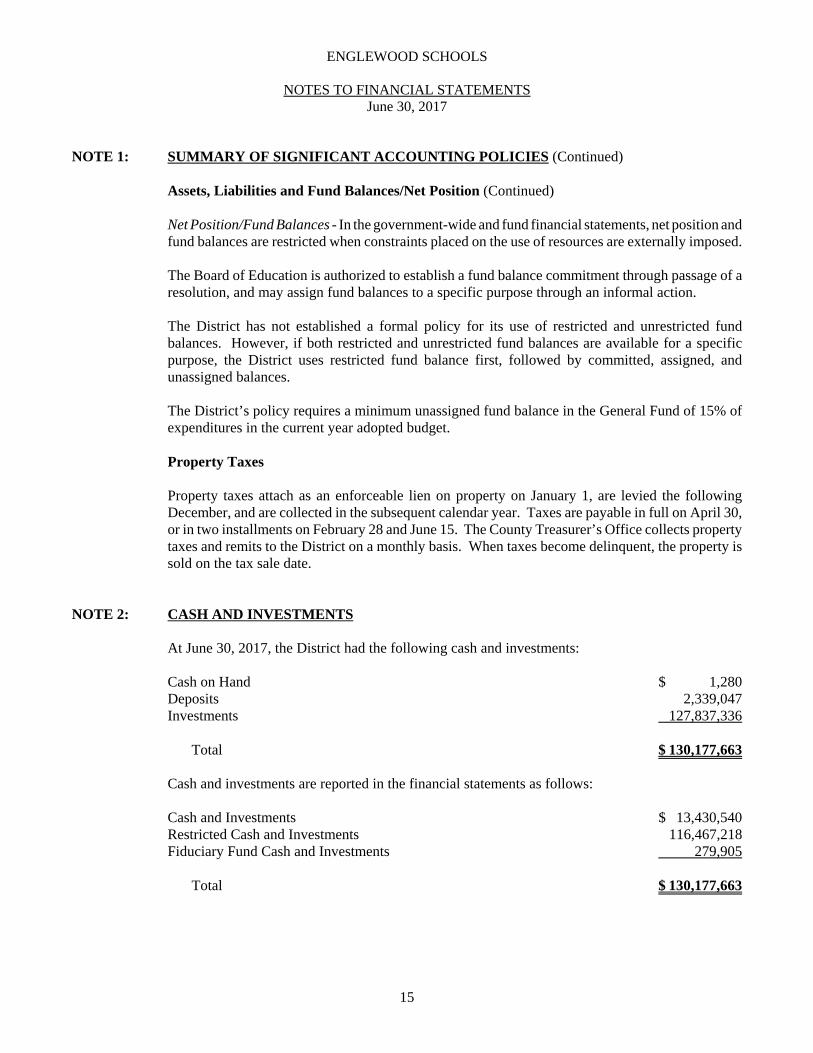
Net Position/Fund Balances - In the government-wide and fund financial statements, net position andfund balances are restricted when constraints placed on the use of resources are externally imposed.
The Board of Education is authorized to establish a fund balance commitment through passage of aresolution, and may assign fund balances to a specific purpose through an informal action.
The District has not established a formal policy for its use of restricted and unrestricted fundbalances. However, if both restricted and unrestricted fund balances are available for a specificpurpose, the District uses restricted fund balance first, followed by committed, assigned, andunassigned balances.
The District’s policy requires a minimum unassigned fund balance in the General Fund of 15% ofexpenditures in the current year adopted budget.
Property Taxes
Property taxes attach as an enforceable lien on property on January 1, are levied the followingDecember, and are collected in the subsequent calendar year. Taxes are payable in full on April 30,or in two installments on February 28 and June 15. The County Treasurer’s Office collects propertytaxes and remits to the District on a monthly basis. When taxes become delinquent, the property issold on the tax sale date.
NOTE 2: CASH AND INVESTMENTS
At June 30, 2017, the District had the following cash and investments:
Cash on Hand $ 1,280Deposits 2,339,047Investments 127,837,336
Total $ 130,177,663
Cash and investments are reported in the financial statements as follows:
Cash and Investments $ 13,430,540Restricted Cash and Investments 116,467,218Fiduciary Fund Cash and Investments 279,905
Total $ 130,177,663
ENGLEWOOD SCHOOLS
NOTES TO FINANCIAL STATEMENTSJune 30, 2017
16
NOTE 2: CASH AND INVESTMENTS (Continued)
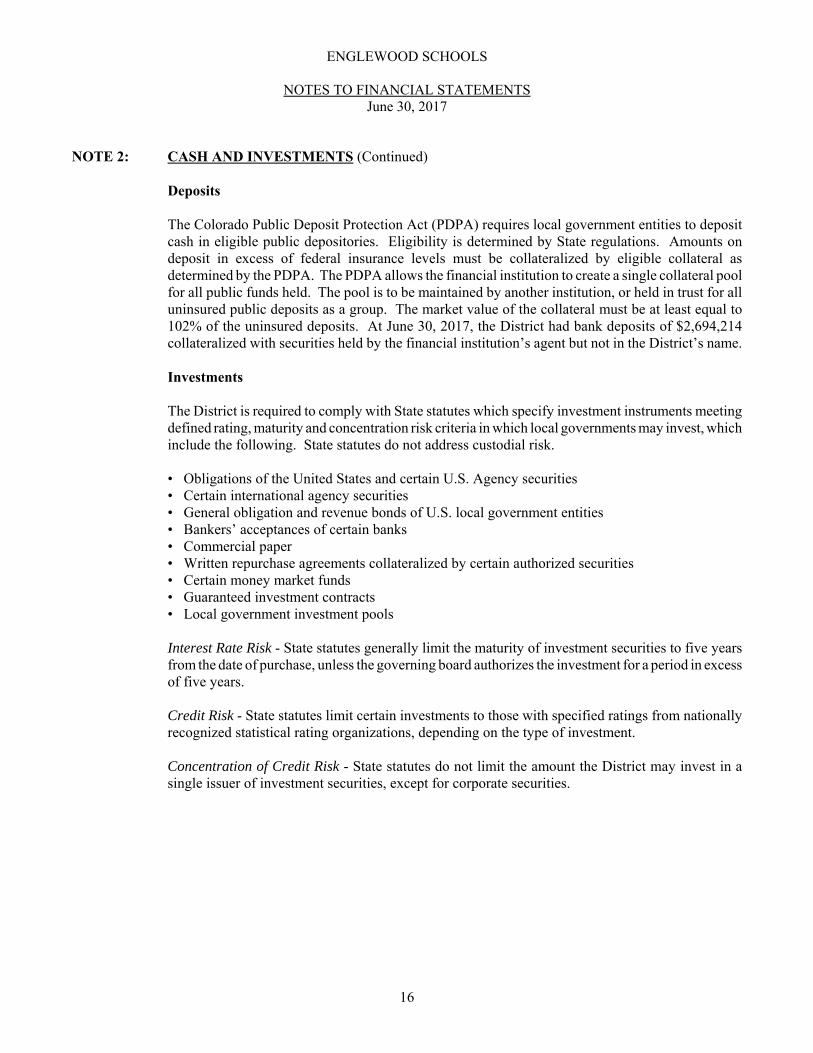
Deposits
The Colorado Public Deposit Protection Act (PDPA) requires local government entities to depositcash in eligible public depositories. Eligibility is determined by State regulations. Amounts ondeposit in excess of federal insurance levels must be collateralized by eligible collateral asdetermined by the PDPA. The PDPA allows the financial institution to create a single collateral poolfor all public funds held. The pool is to be maintained by another institution, or held in trust for alluninsured public deposits as a group. The market value of the collateral must be at least equal to102% of the uninsured deposits. At June 30, 2017, the District had bank deposits of $2,694,214collateralized with securities held by the financial institution’s agent but not in the District’s name.
Investments
The District is required to comply with State statutes which specify investment instruments meetingdefined rating, maturity and concentration risk criteria in which local governments may invest, whichinclude the following. State statutes do not address custodial risk.
• Obligations of the United States and certain U.S. Agency securities• Certain international agency securities• General obligation and revenue bonds of U.S. local government entities• Bankers’ acceptances of certain banks• Commercial paper• Written repurchase agreements collateralized by certain authorized securities• Certain money market funds• Guaranteed investment contracts• Local government investment pools
Interest Rate Risk - State statutes generally limit the maturity of investment securities to five yearsfrom the date of purchase, unless the governing board authorizes the investment for a period in excessof five years.
Credit Risk - State statutes limit certain investments to those with specified ratings from nationallyrecognized statistical rating organizations, depending on the type of investment.
Concentration of Credit Risk - State statutes do not limit the amount the District may invest in asingle issuer of investment securities, except for corporate securities.
ENGLEWOOD SCHOOLS
NOTES TO FINANCIAL STATEMENTSJune 30, 2017
17
NOTE 2: CASH AND INVESTMENTS (Continued)
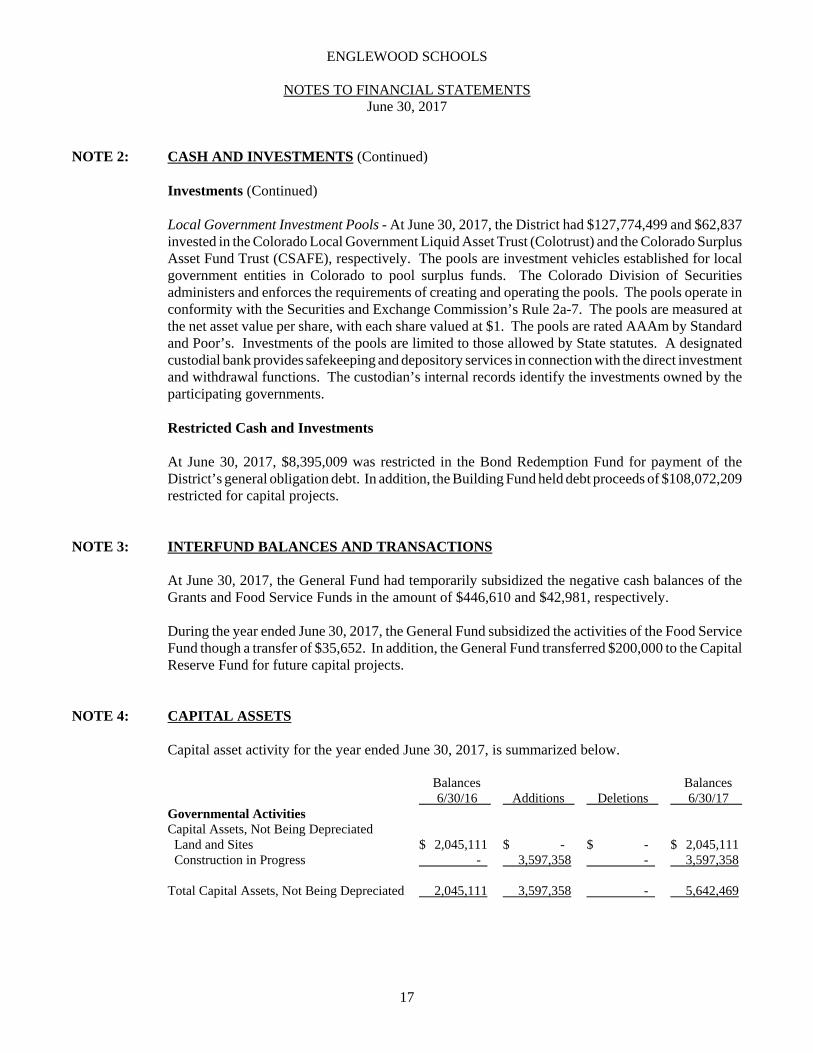
Investments (Continued)
Local Government Investment Pools - At June 30, 2017, the District had $127,774,499 and $62,837invested in the Colorado Local Government Liquid Asset Trust (Colotrust) and the Colorado SurplusAsset Fund Trust (CSAFE), respectively. The pools are investment vehicles established for localgovernment entities in Colorado to pool surplus funds. The Colorado Division of Securitiesadministers and enforces the requirements of creating and operating the pools. The pools operate inconformity with the Securities and Exchange Commission’s Rule 2a-7. The pools are measured atthe net asset value per share, with each share valued at $1. The pools are rated AAAm by Standardand Poor’s. Investments of the pools are limited to those allowed by State statutes. A designatedcustodial bank provides safekeeping and depository services in connection with the direct investmentand withdrawal functions. The custodian’s internal records identify the investments owned by theparticipating governments.
Restricted Cash and Investments
At June 30, 2017, $8,395,009 was restricted in the Bond Redemption Fund for payment of theDistrict’s general obligation debt. In addition, the Building Fund held debt proceeds of $108,072,209restricted for capital projects.
NOTE 3: INTERFUND BALANCES AND TRANSACTIONS
At June 30, 2017, the General Fund had temporarily subsidized the negative cash balances of theGrants and Food Service Funds in the amount of $446,610 and $42,981, respectively.
During the year ended June 30, 2017, the General Fund subsidized the activities of the Food ServiceFund though a transfer of $35,652. In addition, the General Fund transferred $200,000 to the CapitalReserve Fund for future capital projects.
NOTE 4: CAPITAL ASSETS
Capital asset activity for the year ended June 30, 2017, is summarized below.
Balances Balances 6/30/16 Additions Deletions 6/30/17
Governmental ActivitiesCapital Assets, Not Being Depreciated Land and Sites $ 2,045,111 $ - $ - $ 2,045,111 Construction in Progress - 3,597,358 - 3,597,358
Total Capital Assets, Not Being Depreciated 2,045,111 3,597,358 - 5,642,469
ENGLEWOOD SCHOOLS
NOTES TO FINANCIAL STATEMENTSJune 30, 2017
18
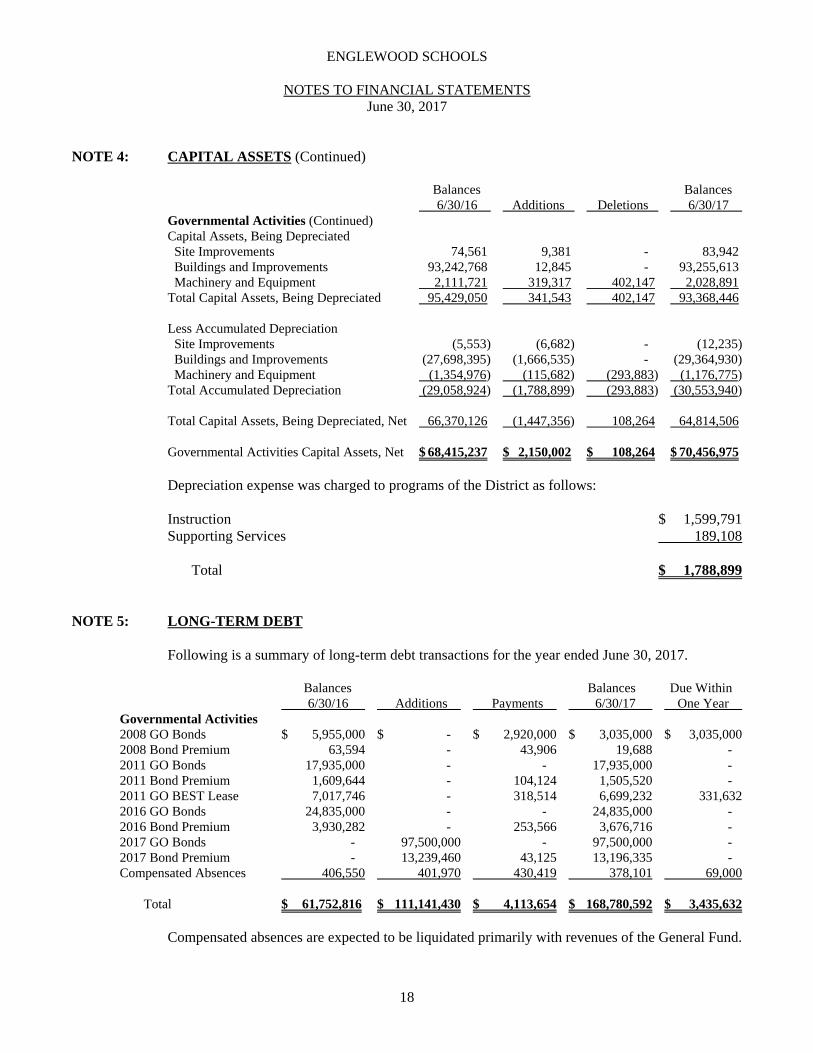
NOTE 4: CAPITAL ASSETS (Continued)
Balances Balances 6/30/16 Additions Deletions 6/30/17
Governmental Activities (Continued)Capital Assets, Being Depreciated Site Improvements 74,561 9,381 - 83,942 Buildings and Improvements 93,242,768 12,845 - 93,255,613 Machinery and Equipment 2,111,721 319,317 402,147 2,028,891 Total Capital Assets, Being Depreciated 95,429,050 341,543 402,147 93,368,446
Less Accumulated Depreciation Site Improvements (5,553) (6,682) - (12,235) Buildings and Improvements (27,698,395) (1,666,535) - (29,364,930) Machinery and Equipment (1,354,976) (115,682) (293,883) (1,176,775)Total Accumulated Depreciation (29,058,924) (1,788,899) (293,883) (30,553,940)
Total Capital Assets, Being Depreciated, Net 66,370,126 (1,447,356) 108,264 64,814,506
Governmental Activities Capital Assets, Net $ 68,415,237 $ 2,150,002 $ 108,264 $ 70,456,975
Depreciation expense was charged to programs of the District as follows:
Instruction $ 1,599,791Supporting Services 189,108
Total $ 1,788,899
NOTE 5: LONG-TERM DEBT
Following is a summary of long-term debt transactions for the year ended June 30, 2017.
Balances Balances Due Within 6/30/16 Additions Payments 6/30/17 One Year
Governmental Activities2008 GO Bonds $ 5,955,000 $ - $ 2,920,000 $ 3,035,000 $ 3,035,0002008 Bond Premium 63,594 - 43,906 19,688 - 2011 GO Bonds 17,935,000 - - 17,935,000 - 2011 Bond Premium 1,609,644 - 104,124 1,505,520 - 2011 GO BEST Lease 7,017,746 - 318,514 6,699,232 331,6322016 GO Bonds 24,835,000 - - 24,835,000 - 2016 Bond Premium 3,930,282 - 253,566 3,676,716 -
2017 GO Bonds - 97,500,000 - 97,500,000 - 2017 Bond Premium - 13,239,460 43,125 13,196,335 - Compensated Absences 406,550 401,970 430,419 378,101 69,000
Total $ 61,752,816 $ 111,141,430 $ 4,113,654 $ 168,780,592 $ 3,435,632
Compensated absences are expected to be liquidated primarily with revenues of the General Fund.
ENGLEWOOD SCHOOLS
NOTES TO FINANCIAL STATEMENTSJune 30, 2017
19
NOTE 5: LONG-TERM DEBT (Continued)
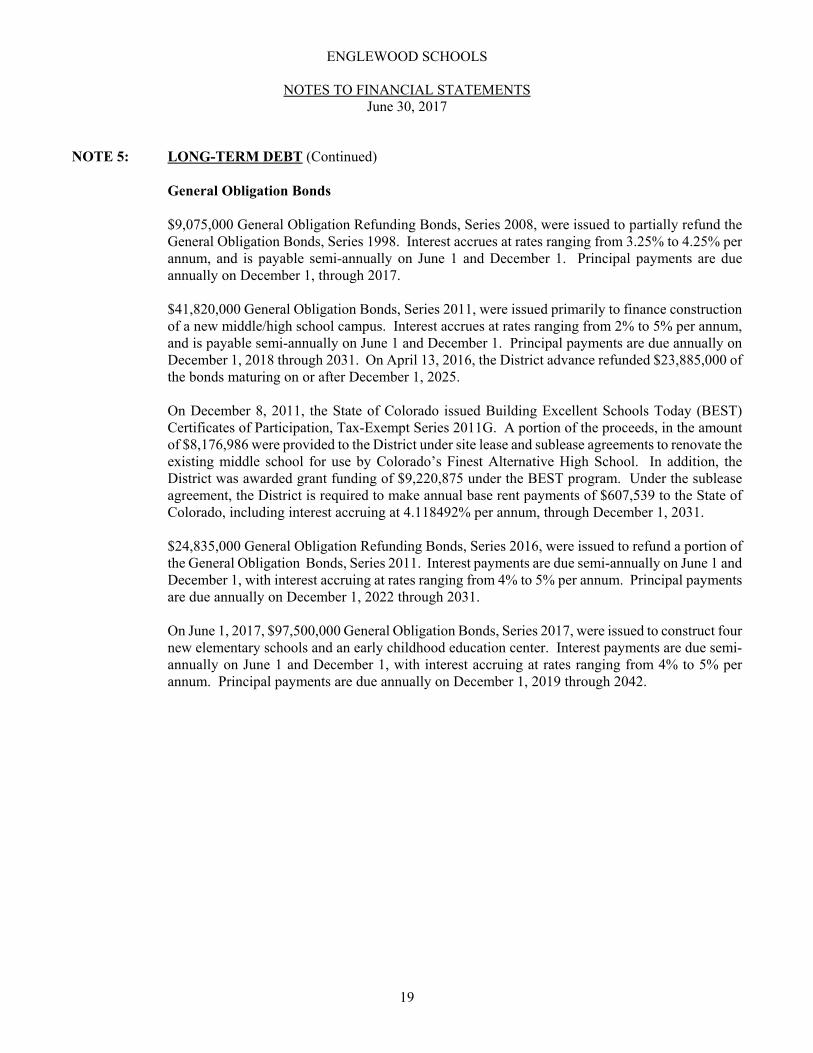
General Obligation Bonds
$9,075,000 General Obligation Refunding Bonds, Series 2008, were issued to partially refund theGeneral Obligation Bonds, Series 1998. Interest accrues at rates ranging from 3.25% to 4.25% perannum, and is payable semi-annually on June 1 and December 1. Principal payments are dueannually on December 1, through 2017.
$41,820,000 General Obligation Bonds, Series 2011, were issued primarily to finance constructionof a new middle/high school campus. Interest accrues at rates ranging from 2% to 5% per annum,and is payable semi-annually on June 1 and December 1. Principal payments are due annually onDecember 1, 2018 through 2031. On April 13, 2016, the District advance refunded $23,885,000 ofthe bonds maturing on or after December 1, 2025.
On December 8, 2011, the State of Colorado issued Building Excellent Schools Today (BEST)Certificates of Participation, Tax-Exempt Series 2011G. A portion of the proceeds, in the amountof $8,176,986 were provided to the District under site lease and sublease agreements to renovate theexisting middle school for use by Colorado’s Finest Alternative High School. In addition, theDistrict was awarded grant funding of $9,220,875 under the BEST program. Under the subleaseagreement, the District is required to make annual base rent payments of $607,539 to the State ofColorado, including interest accruing at 4.118492% per annum, through December 1, 2031.
$24,835,000 General Obligation Refunding Bonds, Series 2016, were issued to refund a portion ofthe General Obligation Bonds, Series 2011. Interest payments are due semi-annually on June 1 andDecember 1, with interest accruing at rates ranging from 4% to 5% per annum. Principal paymentsare due annually on December 1, 2022 through 2031.
On June 1, 2017, $97,500,000 General Obligation Bonds, Series 2017, were issued to construct fournew elementary schools and an early childhood education center. Interest payments are due semi-annually on June 1 and December 1, with interest accruing at rates ranging from 4% to 5% perannum. Principal payments are due annually on December 1, 2019 through 2042.

ENGLEWOOD SCHOOLS
NOTES TO FINANCIAL STATEMENTSJune 30, 2017
20
NOTE 5: LONG-TERM DEBT (Continued)
Debt payments to maturity are as follows.
Year Ended June 30, Principal Interest Total
2018 $ 3,366,632 $ 6,713,284 $ 10,079,9162019 2,655,290 6,603,826 9,259,1162020 3,589,511 6,505,563 10,095,0742021 3,714,317 6,370,926 10,085,2432022 3,859,734 6,221,493 10,081,2272023 - 2027 21,703,072 28,633,383 50,336,4552028 - 2032 26,685,676 23,554,064 50,239,7402033 - 2037 32,870,000 17,123,275 49,993,2752038 - 2042 41,885,000 7,858,625 49,743,6252043 9,675,000 241,875 9,916,875
Total $ 150,004,232 $ 109,826,314 $ 259,830,546
Defeased Debt
In April, 2016, the District deposited bond proceeds in an irrevocable trust with an escrow agent toprovide for all future debt service requirements for $23,885,000 of the General Obligation Bonds,Series 2011, maturing on or after December 1, 2025. As a result, the refunded bonds are considereddefeased and the liability has been removed from the financial statements. The outstanding balanceof the defeased bonds at June 30, 2017, was $23,885,000. The bonds will be called and paid in fullon December 1, 2021.
NOTE 6: RISK MANAGEMENT
The District is exposed to various risks of loss related to torts; theft of, damage to, and destructionof assets; injuries to employees; and natural disasters. The District participates in the ColoradoSchool Districts Self Insurance Pool for all risks of loss except workers compensation, for which itutilizes a commercial insurance carrier.
Colorado School Districts Self Insurance Pool
The Colorado School Districts Self Insurance Pool (CSDSIP) operates as a self-insurance poolcomprised of various school districts and other related public educational entities within the State ofColorado. The CSDSIP is administered by a governing board. The District pays an annual premiumto the CSDSIP for various types of property and liability insurance coverage. The CSDSIP’sagreement provides that the CSDSIP will be self-sustaining through member premiums and willreinsure through a duly authorized insurer. The reinsurance covers claims against the CSDSIP inexcess of specific claim amounts and in the aggregate in an amount and at limits determined by theCSDSIP to be adequate to protect the solvency of the CSDSIP.

ENGLEWOOD SCHOOLS
NOTES TO FINANCIAL STATEMENTSJune 30, 2017
21
NOTE 7: DEFINED BENEFIT PENSION PLAN
General Information
Plan Description - The District contributes to the School Division Trust Fund (SDTF), a cost-sharingmultiple-employer defined benefit pension plan administered by the Public Employees’ RetirementAssociation of Colorado (PERA). All employees of the District participate in the SDTF. Title 24,Article 51 of the Colorado Revised Statutes (CRS) assigns the authority to establish and amend planprovisions to the State Legislature. PERA issues a publicly available financial report that includesinformation on the SDTF. That report may be obtained at www.copera.org/investments/pera-financial-reports.
Benefits Provided - The SDTF provides retirement, disability, and survivor benefits to planparticipants or their beneficiaries. Retirement benefits are determined by the amount of service creditearned or purchased, highest average salary, the benefit structure in place, the benefit option selectedat retirement, and age at retirement. The retirement benefit is the greater of the a) highest averagesalary multiplied by 2.5% and then multiplied by years of service credit, or b) the value of theparticipant’s contribution account plus an equal match on the retirement date, annualized into amonthly amount based on life expectancy and other actuarial factors. In no case can the benefitamount exceed the highest average salary or the amount allowed by applicable federal regulations.
Retirees may elect to withdraw their contributions upon termination of employment, and may beeligible to receive a matching amount if five years of service credit is earned and certain other criteriais met. Retirees who elect to receive a lifetime retirement benefit are generally eligible to receivepost-retirement cost-of-living adjustments (COLAs) as established by State statutes. Retirees whobegan employment before January 1, 2007, receive an annual increase of 2%, unless PERA has anegative investment year, in which case the annual increase for the next three years is the lesser of2% or the average consumer price index for the prior calendar year. Retirees that began employmentafter January 1, 2007, receive an annual increase of the lesser of 2% or the average consumer priceindex for the prior calendar year, with certain limitations.
Disability benefits are available for plan participants once they reach five years of earned servicecredit and meet the definition of a disability. The disability benefit amount is based on the retirementbenefit formula described previously, considering a minimum of twenty years of service credit.
Survivor benefits are determined by several factors, which include the amount of earned servicecredit, highest average salary of the deceased, the benefit structure in place, and the qualified survivorreceiving the benefits.

ENGLEWOOD SCHOOLS
NOTES TO FINANCIAL STATEMENTSJune 30, 2017
22
NOTE 7: DEFINED BENEFIT PENSION PLAN (Continued)
General Information (Continued)
Contributions - The District and eligible employees are required to contribute to the SDTF at ratesestablished by Title 24, Article 51, Part 4 of the CRS. These contribution requirements areestablished and may be amended by the State Legislature. The contribution rate for employees is 8%of covered salaries. The District’s contribution rate for calendar years 2016 and 2017 was 19.15%and 19.65% of covered salaries, respectively. However, a portion of the District’s contribution(1.02% of covered salaries) is allocated to the Health Care Trust Fund (See Note 8). The District’scontributions to the SDTF for the year ended June 30, 2017, were $3,893,443, equal to the requiredcontributions.
Pension Liabilities, Pension Expense, and Deferred Outflows of Resources and DeferredInflows of Resources Related to Pensions
At June 30, 2017, the District reported a net pension liability of $133,853,012, representing itsproportionate share of the net pension liability of the SDTF. The net pension liability was measuredat December 31, 2016, and the total pension liability used to calculate the net pension liability wasdetermined by an actuarial valuation as of December 31, 2015. Standard update procedures wereused to roll forward the total pension liability to December 31, 2016.
The District’s proportion of the net pension liability was based on the District’s contributions to theSDTF for the calendar year ended December 31, 2016, relative to the contributions of allparticipating employers. At December 31, 2016, the District’s proportion was 0.4495654254%,which was a decrease of 0.0095317787% from its proportion measured at December 31, 2015.
For the year ended June 30, 2017, the District recognized pension expense of $24,510,945. At June30, 2017, the District reported deferred outflows of resources and deferred inflows of resourcesrelated to pensions from the following sources:
Deferred Deferred Outflows of Inflows of Resources Resources
Differences between expected and actual experience $ 1,685,324 $ 1,250Changes of assumptions and other inputs 43,432,509 616,411Net difference between projected and actual earnings on plan investments 4,593,847 - Changes in proportion - 2,113,054Contributions subsequent to the measurement date 2,107,940 -
Total $ 51,819,620 $ 2,730,715

ENGLEWOOD SCHOOLS
NOTES TO FINANCIAL STATEMENTSJune 30, 2017
23
NOTE 7: DEFINED BENEFIT PENSION PLAN (Continued)
Pension Liabilities, Pension Expense, and Deferred Outflows of Resources and DeferredInflows of Resources Related to Pensions (Continued)
District contributions subsequent to the measurement date of $2,107,940 will be recognized as areduction of the net pension liability in the subsequent fiscal year. Other amounts reported asdeferred outflows of resources and deferred inflows of resources related to pensions will berecognized as pension expense as follows:
Year Ended June 30,
2018 $ 18,564,3232019 18,824,9572020 9,547,0382021 44,647
Total $ 46,980,965
Actuarial Assumptions - The actuarial valuation as of December 31, 2015, determined the totalpension liability using the following actuarial assumptions and other inputs. On November 18, 2016,PERA’s governing board adopted revised economic and demographic assumptions, which wereeffective on December 31, 2016, and which were reflected in the roll-forward calculation of the totalpension liability from December 31, 2015, to December 31, 2016, as follows:
Revised Assumptions Assumptions
Price inflation 2.8% 2.4%Real wage growth 1.1% 1.1%Wage inflation 3.9% 3.5%Salary increases, including wage inflation 3.9% - 10.1% 3.5% - 9.7%Long-term investment rate of return, net of plan investment expenses, including price inflation 7.5% 7.25%Discount rate 7.5% 5.26%Future post-retirement benefit increases: Hired prior to 1/1/07 2% 2% Hired after 12/31/06 ad hoc ad hoc
Mortality rates were based on the RP-2000 Combined Mortality Table for Males and Females, asappropriate, with adjustments for mortality improvements based on a projection of Scale AA to 2020with males set back one year, and females set back two years. Active member mortality was adjustedto 55 percent of the base rate for males and 40 percent for females. For disabled retirees, the RP-2000 Disabled Retiree Mortality Table was used, set back two years.

ENGLEWOOD SCHOOLS
NOTES TO FINANCIAL STATEMENTSJune 30, 2017
24
NOTE 7: DEFINED BENEFIT PENSION PLAN (Continued)
Pension Liabilities, Pension Expense, and Deferred Outflows of Resources and DeferredInflows of Resources Related to Pensions (Continued)
The actuarial assumptions used in the December 31, 2015, valuation were based on the results of anactuarial experience study for the period January 1, 2008, through December 31, 2011, adopted byPERA’s governing board on November 13, 2012, and an economic assumption study adopted byPERA’s governing board on November 15, 2013, and January 17, 2014.
As a result of a 2016 experience analysis, revised economic and demographic actuarial assumptionswere adopted by PERA’s governing board on November 18, 2016, to more closely reflect PERA’sactual experience. The revised assumptions reflected in the roll-forward of the total pension liabilityincluded healthy mortality assumptions for active members using the RP-2014 White CollarEmployee Mortality Table. The mortality rates incorporate a 70 percent factor applied to male ratesand a 55 percent factor applied to female rates. For disabled retirees, the mortality assumption waschanged to reflect 90 percent of the RP-2014 Disabled Retiree Mortality Table.
The long-term expected rate of return on plan investments was determined using a log-normaldistribution analysis in which best estimate ranges of expected future real rates of return (expectedreturn, net of investment expense and inflation) were developed for each major asset class. Theseranges were combined to produce the long-term expected rate of return by weighting the expectedfuture real rates of return by the target asset allocation percentage and then adding expected inflation.
The most recent analysis of the long-term expected rate of return was adopted by PERA’s governingboard on November 18, 2016, and included the target allocation and best estimates of geometric realrates of return for each major asset class, as follows:
30 Year Expected Geometric Real
Asset Class Target Allocation Rate of Return
U.S. Equity - Large Cap 21.20% 4.30%U.S. Equity - Small Cap 7.42% 4.80%Non U.S. Equity - Developed 18.55% 5.20%Non U.S. Equity - Emerging 5.83% 5.40%Core Fixed Income 19.32% 1.20%High Yield 1.38% 4.30%Non U.S. Fixed Income - Developed 1.84% 0.60%Emerging Market Debt 0.46% 3.90%Core Real Estate 8.50% 4.90%Opportunity Fund 6.00% 3.80%Private Equity 8.50% 6.60%Cash 1.00% 0.20%
Total 100.00%
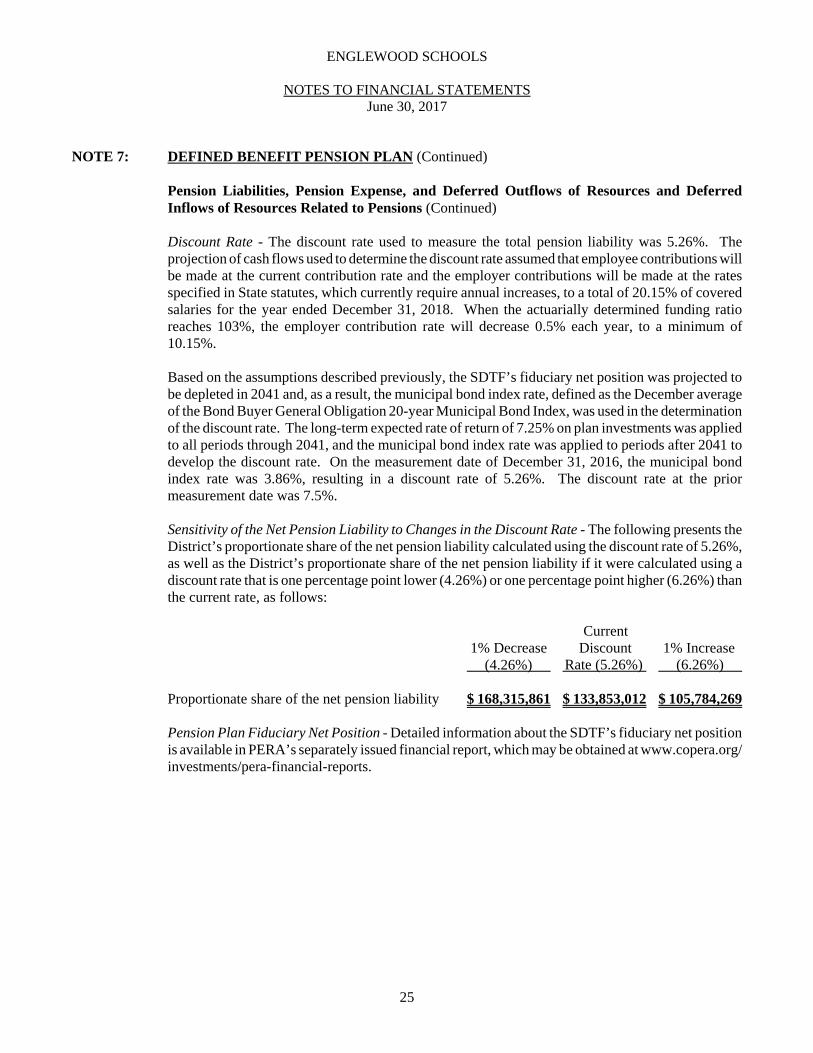
ENGLEWOOD SCHOOLS
NOTES TO FINANCIAL STATEMENTSJune 30, 2017
25
NOTE 7: DEFINED BENEFIT PENSION PLAN (Continued)
Pension Liabilities, Pension Expense, and Deferred Outflows of Resources and DeferredInflows of Resources Related to Pensions (Continued)
Discount Rate - The discount rate used to measure the total pension liability was 5.26%. Theprojection of cash flows used to determine the discount rate assumed that employee contributions willbe made at the current contribution rate and the employer contributions will be made at the ratesspecified in State statutes, which currently require annual increases, to a total of 20.15% of coveredsalaries for the year ended December 31, 2018. When the actuarially determined funding ratioreaches 103%, the employer contribution rate will decrease 0.5% each year, to a minimum of10.15%.
Based on the assumptions described previously, the SDTF’s fiduciary net position was projected tobe depleted in 2041 and, as a result, the municipal bond index rate, defined as the December averageof the Bond Buyer General Obligation 20-year Municipal Bond Index, was used in the determinationof the discount rate. The long-term expected rate of return of 7.25% on plan investments was appliedto all periods through 2041, and the municipal bond index rate was applied to periods after 2041 todevelop the discount rate. On the measurement date of December 31, 2016, the municipal bondindex rate was 3.86%, resulting in a discount rate of 5.26%. The discount rate at the priormeasurement date was 7.5%.
Sensitivity of the Net Pension Liability to Changes in the Discount Rate - The following presents theDistrict’s proportionate share of the net pension liability calculated using the discount rate of 5.26%,as well as the District’s proportionate share of the net pension liability if it were calculated using adiscount rate that is one percentage point lower (4.26%) or one percentage point higher (6.26%) thanthe current rate, as follows:
Current 1% Decrease Discount 1% Increase
(4.26%) Rate (5.26%) (6.26%)
Proportionate share of the net pension liability $ 168,315,861 $ 133,853,012 $ 105,784,269
Pension Plan Fiduciary Net Position - Detailed information about the SDTF’s fiduciary net positionis available in PERA’s separately issued financial report, which may be obtained at www.copera.org/investments/pera-financial-reports.

ENGLEWOOD SCHOOLS
NOTES TO FINANCIAL STATEMENTSJune 30, 2017
26
NOTE 8: POSTEMPLOYMENT HEALTHCARE BENEFITS
Plan Description - The District contributes to the Health Care Trust Fund (HCTF), a cost-sharingmultiple-employer postemployment healthcare plan administered by PERA. The HCTF provides ahealth care premium subsidy to PERA benefit recipients and their eligible beneficiaries. Title 24,Article 51, Part 12 of the CRS, as amended, assigns the authority to establish the HCTF benefitprovisions to the State Legislature. PERA issues a publicly available annual financial report thatincludes financial statements and required supplementary information for the HCTF. That reportmay be obtained as described previously.
Funding Policy - The District is required to contribute at a rate of 1.02% of covered salaries for allPERA participants. No employee contributions are required. The contribution requirements for theDistrict are established under Title 24, Article 51, Part 4 of the CRS, as amended. The apportionmentof the contributions to the HCTF is established under Title 24, Article 51, Section 208 of the CRS,as amended. The District’s apportionment to the HCTF for the years ended June 30, 2017, 2016 and2015 was $204,703, $204,959, and $205,312, respectively, equal to the required amounts for eachyear.
NOTE 9: COMMITMENTS AND CONTINGENCIES
Claims and Judgments
The District participates in a number of federal, state, and local programs that are fully or partiallyfunded by grants received from other governmental entities. Expenditures financed by grants aresubject to audit by the appropriate grantor government. If expenditures are disallowed due tononcompliance with grant program regulations, the District may be required to reimburse the grantorgovernment. At June 30, 2017, significant amounts of grant expenditures have not been audited butmanagement believes that disallowed expenditures, if any, based on subsequent audits will not havea material effect on the overall financial position of the District.
Capital Renewal Reserve
The District was awarded a Building Excellent Schools Today (BEST) grant from the State ofColorado (See Note 5). In accordance with the related State statutes, the District is required toestablish a capital renewal reserve for the purpose of replacing major facility systems such as roofs,interior finishes, electrical systems and heating, ventilating, and air conditioning systems. At aminimum, the District must contribute $100 per pupil in the impacted facilities annually to the capitalrenewal reserve. At June 30, 2017, the reserve was reported as restricted fund balance in the CapitalReserve Fund, in the amount of $200,000.
Construction Commitments
At June 30, 2017, the District had two significant construction contracts for projects at Hay andClayton Elementary Schools totaling $17.7 and $17.5 million, respectively.

ENGLEWOOD SCHOOLS
NOTES TO FINANCIAL STATEMENTSJune 30, 2017
27
NOTE 9: COMMITMENTS AND CONTINGENCIES (Continued)
Tabor Amendment
In November 1992, Colorado voters passed the Tabor Amendment to the State Constitution whichlimits state and local government taxing powers and imposes spending limitations. The District issubject to the Amendment.
In November, 1999, voters within the District authorized the District to collect, retain, and expendall excess revenues and other funds received from every source, without limitation, in the 1999-2000budget year and each subsequent budget year thereafter without future voter approval,notwithstanding the limitations of the Amendment. The Amendment is subject to manyinterpretations, but the District believes it is in substantial compliance with the Amendment.
In accordance with the Amendment, the District has established a reserve for emergencies,representing 3% of qualifying expenditures. At June 30, 2017, the reserve was reported as restrictedfund balance in the General Fund, in the amount of $938,000.
NOTE 10: RESTATEMENTS
During the year ended June 30, 2017, the District corrected errors in the loss on debt refunding andbond premium related to the 2016 debt refunding, and deferred inflows and outflows of resourcesrelated to pensions. Net position at June 30, 2016, was restated to reflect these corrections, asfollows:
Governmental Activities
Balances, June 30, 2016, as Originally Stated $ (42,281,581)
Deferred Outflows of Resources - Loss on Debt Refunding 2,815,101 Deferred Outflows of Resources - Pensions 346,009 Debt Premium 2,143,649
Deferred Inflows of Resources - Pensions (1,974,323)
Balances, June 30, 2016, as Restated $ (38,951,145)

REQUIRED SUPPLEMENTARY INFORMATION

12/31/16 12/31/15 12/31/14 12/31/13
PROPORTIONATE SHARE OF THE NET PENSION LIABILITY District's Proportion of the Net Pension Liability 0.4495654254% 0.4590972041% 0.4764040107% 0.4771716276%
District's Proportionate Share of the Net Pension Liability 133,853,012$ 70,215,676$ 64,568,746$ 60,863,112$
. District's Covered Payroll 20,177,302$ 20,128,645$ 19,957,907$ 19,236,202$
District's Proportionate Share of the Net Pension Liability as a Percentage of Covered Payroll 663% 349% 324% 316%
Plan Fiduciary Net Position as a Percentage of the Total Pension Liability 43% 59% 63% 64%
6/30/17 6/30/16 6/30/15 6/30/14
DISTRICT CONTRIBUTIONS Statutorily Required Contribution 3,688,740$ 3,563,563$ 3,397,776$ 3,148,760$
Contributions in Relation to the Statutorily Required Contribution (3,688,740) (3,563,563) (3,397,776) (3,148,760)
Contribution Deficiency (Excess) -$ -$ -$ -$
District's Covered Payroll 20,068,914$ 20,094,063$ 20,128,645$ 19,701,594$
Contributions as a Percentage of Covered Payroll 18.38% 17.73% 16.88% 15.98%
This schedule is presented to show information for 10 years. Until information for the full 10-year period is available,information will be presented for the years it is available.
June 30, 2017
ENGLEWOOD SCHOOLS
REQUIRED SUPPLEMENTARY INFORMATIONSCHEDULE OF PROPORTIONATE SHARE OF THE NET PENSION LIABILITY
AND CONTRIBUTIONSPUBLIC EMPLOYEES' RETIREMENT ASSOCIATION OF COLORADO SCHOOL DIVISION TRUST FUND
See the accompanying Independent Auditors' Report.
28

VARIANCE
ORIGINAL FINAL Positive
BUDGET BUDGET ACTUAL (Negative)
REVENUESLocal Sources Property Taxes 14,871,025$ 16,230,746$ 16,329,285$ 98,539$ Specific Ownership Taxes 1,400,000 1,471,416 1,800,766 329,350 Tuition and Fees 142,000 216,119 214,631 (1,488) Investment Income 8,000 30,000 46,638 16,638 Rental Income 50,000 154,000 186,643 32,643 Other 199,100 124,059 660,788 536,729 Total Local Sources 16,670,125 18,226,340 19,238,751 1,012,411
County Sources Mineral Lease 500 500 347 (153)
State Sources State Equalization and Hold Harmless 9,908,001 9,871,361 9,869,298 (2,063) Vocational Education 350,000 200,000 169,944 (30,056) Special Education 695,748 695,748 710,223 14,475 Exceptional Children's Education Act 47,815 42,913 42,913 - English Language Proficiency Act (ELPA) 120,000 132,301 132,301 - Transportation 128,008 181,587 183,266 1,679 READ Act 160,000 139,766 139,766 - National Board Certified Educators - - 3,200 3,200 Additional At-Risk Funding - - 23,321 23,321 Total State Sources 11,409,572 11,263,676 11,274,232 10,556
TOTAL REVENUES 28,080,197 29,490,516 30,513,330 1,022,814
EXPENDITURESInstruction 16,859,494 16,115,602 16,299,959 (184,357)
Supporting Services Students 1,936,511 1,958,473 1,833,969 124,504 Instructional Staff 1,501,425 1,470,631 1,574,710 (104,079) General Administration 648,621 568,675 575,454 (6,779) School Administration 1,895,878 2,035,418 2,032,510 2,908 Business Services 401,013 471,040 451,590 19,450 Operations and Maintenance 3,481,001 3,374,879 3,339,565 35,314 Student Transportation 887,603 871,353 744,083 127,270 Central Support 1,642,650 1,767,104 1,820,477 (53,373) Other Support 126,215 137,991 173,763 (35,772) Community Services 8,425 8,984 7,445 1,539 Total Supporting Services 12,529,342 12,664,548 12,553,566 110,982
Reserves 5,745,518 7,792,621 - 7,792,621
TOTAL EXPENDITURES 35,134,354 36,572,771 28,853,525 7,719,246
ENGLEWOOD SCHOOLS
BUDGETARY COMPARISON SCHEDULEGENERAL FUND
Year Ended June 30, 2017
(Continued)
See the accompanying Independent Auditors' Report.
29

VARIANCE
ORIGINAL FINAL Positive
BUDGET BUDGET ACTUAL (Negative)
EXCESS OF REVENUES OVER (UNDER) EXPENDITURES (7,054,157) (7,082,255) 1,659,805 8,742,060
OTHER FINANCING SOURCES (USES) Transfers Out (200,000) (200,000) (235,652) (35,652)
TOTAL OTHER FINANCING SOURCES (USES) (200,000) (200,000) (235,652) (35,652)
NET CHANGE IN FUND BALANCE (7,254,157) (7,282,255) 1,424,153 8,706,408
FUND BALANCE, Beginning 8,069,472 8,069,472 9,264,538 1,195,066
FUND BALANCE, Ending 815,315$ 787,217$ 10,688,691$ 9,901,474$
ENGLEWOOD SCHOOLS
BUDGETARY COMPARISON SCHEDULEGENERAL FUND
Year Ended June 30, 2017
See the accompanying Independent Auditors' Report.
30
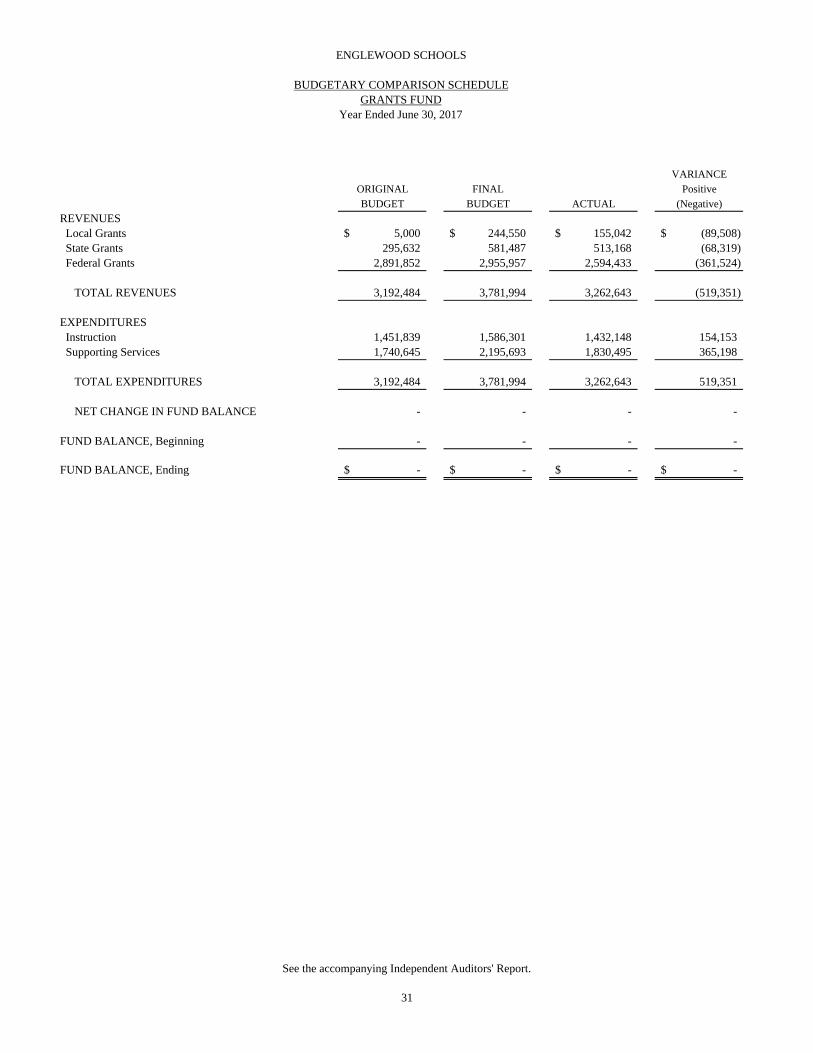
VARIANCE
ORIGINAL FINAL Positive
BUDGET BUDGET ACTUAL (Negative)
REVENUES Local Grants 5,000$ 244,550$ 155,042$ (89,508)$ State Grants 295,632 581,487 513,168 (68,319) Federal Grants 2,891,852 2,955,957 2,594,433 (361,524)
TOTAL REVENUES 3,192,484 3,781,994 3,262,643 (519,351)
EXPENDITURES Instruction 1,451,839 1,586,301 1,432,148 154,153 Supporting Services 1,740,645 2,195,693 1,830,495 365,198
TOTAL EXPENDITURES 3,192,484 3,781,994 3,262,643 519,351
NET CHANGE IN FUND BALANCE - - - -
FUND BALANCE, Beginning - - - -
FUND BALANCE, Ending -$ -$ -$ -$
ENGLEWOOD SCHOOLS
BUDGETARY COMPARISON SCHEDULEGRANTS FUND
Year Ended June 30, 2017
See the accompanying Independent Auditors' Report.
31
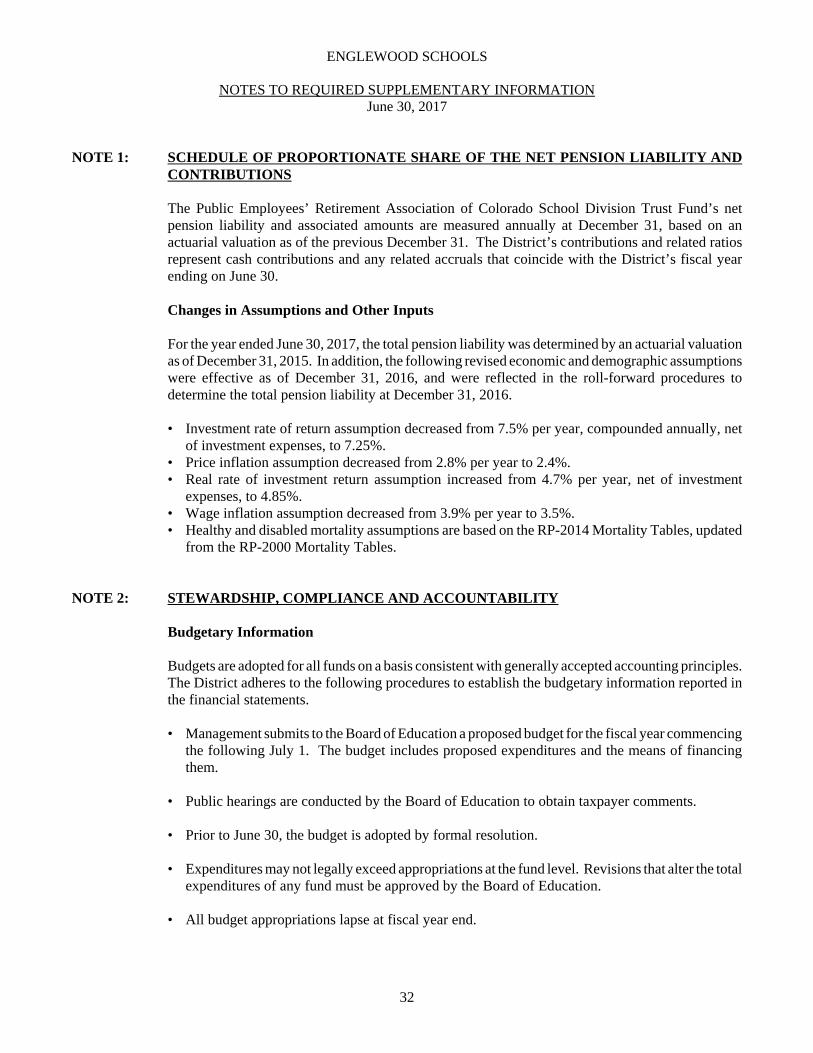
32
ENGLEWOOD SCHOOLS
NOTES TO REQUIRED SUPPLEMENTARY INFORMATIONJune 30, 2017
NOTE 1: SCHEDULE OF PROPORTIONATE SHARE OF THE NET PENSION LIABILITY ANDCONTRIBUTIONS
The Public Employees’ Retirement Association of Colorado School Division Trust Fund’s netpension liability and associated amounts are measured annually at December 31, based on anactuarial valuation as of the previous December 31. The District’s contributions and related ratiosrepresent cash contributions and any related accruals that coincide with the District’s fiscal yearending on June 30.
Changes in Assumptions and Other Inputs
For the year ended June 30, 2017, the total pension liability was determined by an actuarial valuationas of December 31, 2015. In addition, the following revised economic and demographic assumptionswere effective as of December 31, 2016, and were reflected in the roll-forward procedures todetermine the total pension liability at December 31, 2016.
• Investment rate of return assumption decreased from 7.5% per year, compounded annually, netof investment expenses, to 7.25%.
• Price inflation assumption decreased from 2.8% per year to 2.4%.• Real rate of investment return assumption increased from 4.7% per year, net of investment
expenses, to 4.85%.• Wage inflation assumption decreased from 3.9% per year to 3.5%. • Healthy and disabled mortality assumptions are based on the RP-2014 Mortality Tables, updated
from the RP-2000 Mortality Tables.
NOTE 2: STEWARDSHIP, COMPLIANCE AND ACCOUNTABILITY
Budgetary Information
Budgets are adopted for all funds on a basis consistent with generally accepted accounting principles.The District adheres to the following procedures to establish the budgetary information reported inthe financial statements.
• Management submits to the Board of Education a proposed budget for the fiscal year commencingthe following July 1. The budget includes proposed expenditures and the means of financingthem.
• Public hearings are conducted by the Board of Education to obtain taxpayer comments.
• Prior to June 30, the budget is adopted by formal resolution.
• Expenditures may not legally exceed appropriations at the fund level. Revisions that alter the totalexpenditures of any fund must be approved by the Board of Education.
• All budget appropriations lapse at fiscal year end.
SUPPLEMENTARY INFORMATION

CAPITAL
FOOD SERVICE TUITION RESERVE TOTAL
ASSETS Cash and Investments 18,131$ 70,084$ 806,117$ 894,332$ Grants Receivable 92,026 - - 92,026 Inventories 6,787 - - 6,787
TOTAL ASSETS 116,944$ 70,084$ 806,117$ 993,145$
LIABILITIES AND FUND BALANCESLIABILITIES Accounts Payable 6,926$ -$ 33,001$ 39,927$ Accrued Liabilities - - 995 995 Accrued Salaries and Benefits 42,449 4,057 - 46,506 Unearned Revenues 17,801 - - 17,801 Interfund Payables 42,981 - - 42,981
TOTAL LIABILITIES 110,157 4,057 33,996 148,210
FUND BALANCES Nonspendable Inventories 6,787 - - 6,787 Restricted for Capital Renewal - - 200,000 200,000 Assigned to Tuition Programs - 66,027 - 66,027 Assigned to Capital Projects - - 572,121 572,121
TOTAL FUND BALANCES 6,787 66,027 772,121 844,935
TOTAL LIABILITIES AND FUND BALANCES 116,944$ 70,084$ 806,117$ 993,145$
ENGLEWOOD SCHOOLS
COMBINING BALANCE SHEETNONMAJOR GOVERNMENTAL FUNDS
June 30, 2017
See the accompanying Independent Auditors' Report.
33
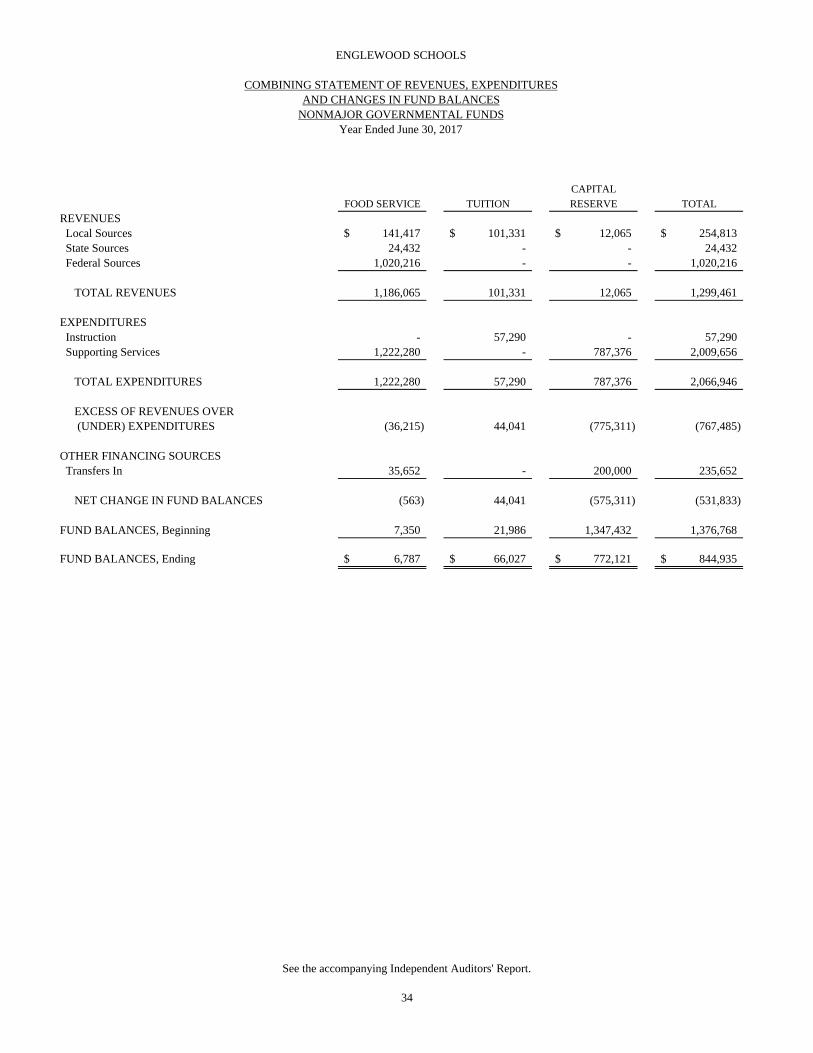
CAPITAL
FOOD SERVICE TUITION RESERVE TOTAL
REVENUES Local Sources 141,417$ 101,331$ 12,065$ 254,813$ State Sources 24,432 - - 24,432 Federal Sources 1,020,216 - - 1,020,216
TOTAL REVENUES 1,186,065 101,331 12,065 1,299,461
EXPENDITURES Instruction - 57,290 - 57,290 Supporting Services 1,222,280 - 787,376 2,009,656
TOTAL EXPENDITURES 1,222,280 57,290 787,376 2,066,946
EXCESS OF REVENUES OVER (UNDER) EXPENDITURES (36,215) 44,041 (775,311) (767,485)
OTHER FINANCING SOURCES Transfers In 35,652 - 200,000 235,652
NET CHANGE IN FUND BALANCES (563) 44,041 (575,311) (531,833)
FUND BALANCES, Beginning 7,350 21,986 1,347,432 1,376,768
FUND BALANCES, Ending 6,787$ 66,027$ 772,121$ 844,935$
ENGLEWOOD SCHOOLS
COMBINING STATEMENT OF REVENUES, EXPENDITURESAND CHANGES IN FUND BALANCES
NONMAJOR GOVERNMENTAL FUNDSYear Ended June 30, 2017
See the accompanying Independent Auditors' Report.
34

ORIGINAL VARIANCE
AND FINAL Positive
BUDGET ACTUAL (Negative)
REVENUES Charges for Services Student Meals 211,255$ 138,172$ (73,083)$ Catering 120,400 300 (120,100) Other - 2,945 2,945 State Sources Grants 21,000 24,432 3,432 Federal Sources Grants 920,000 1,020,216 100,216
TOTAL REVENUES 1,272,655 1,186,065 (86,590)
EXPENDITURES Salaries 531,340 468,881 62,459 Benefits 147,350 161,538 (14,188) Purchased Services 10,507 19,902 (9,395) Supplies and Materials 623,665 571,138 52,527 Property 1,000 821 179 Reserves 30,585 - 30,585
TOTAL EXPENDITURES 1,344,447 1,222,280 122,167
EXCESS OF REVENUES OVER (UNDER) EXPENDITURES (71,792) (36,215) 35,577
OTHER FINANCING SOURCES Transfers In 71,792 35,652 (36,140)
NET CHANGE IN FUND BALANCE - (563) (563)
FUND BALANCE, Beginning - 7,350 7,350
FUND BALANCE, Ending -$ 6,787$ 6,787$
ENGLEWOOD SCHOOLS
BUDGETARY COMPARISON SCHEDULEFOOD SERVICE FUND
Year Ended June 30, 2017
See the accompanying Independent Auditors' Report.
35
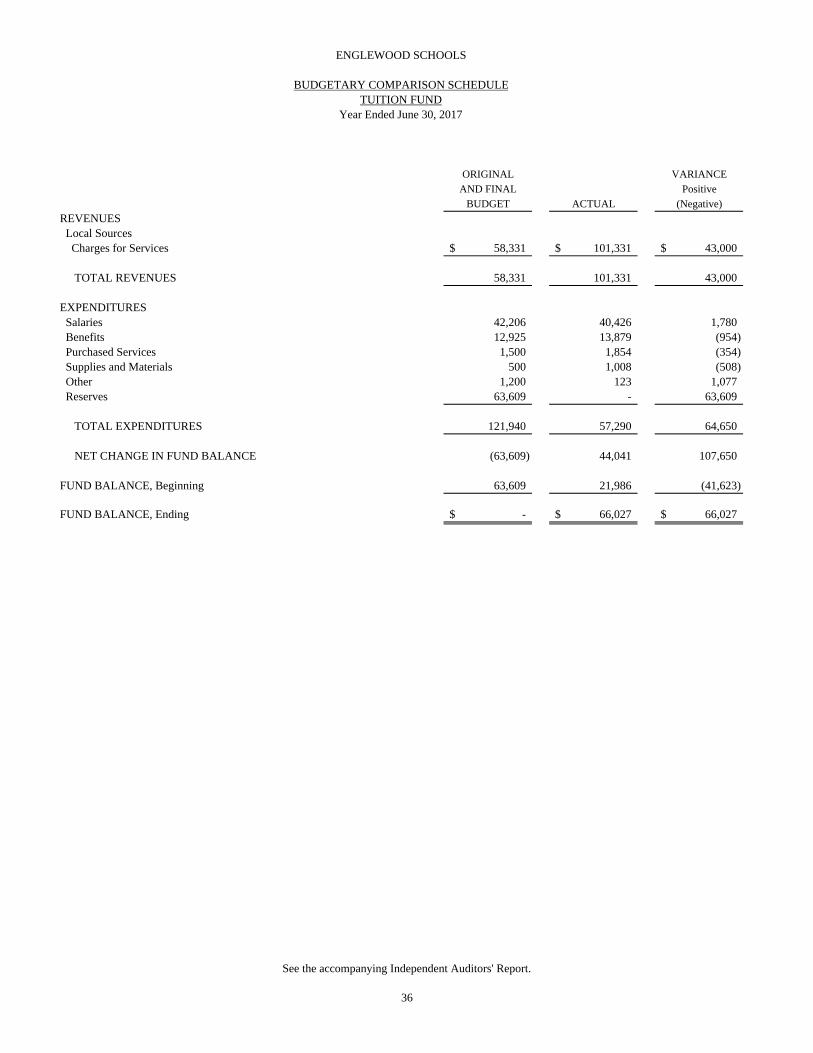
ORIGINAL VARIANCE
AND FINAL Positive
BUDGET ACTUAL (Negative)
REVENUES Local Sources Charges for Services 58,331$ 101,331$ 43,000$
TOTAL REVENUES 58,331 101,331 43,000
EXPENDITURES Salaries 42,206 40,426 1,780 Benefits 12,925 13,879 (954) Purchased Services 1,500 1,854 (354) Supplies and Materials 500 1,008 (508) Other 1,200 123 1,077 Reserves 63,609 - 63,609
TOTAL EXPENDITURES 121,940 57,290 64,650
NET CHANGE IN FUND BALANCE (63,609) 44,041 107,650
FUND BALANCE, Beginning 63,609 21,986 (41,623)
FUND BALANCE, Ending -$ 66,027$ 66,027$
ENGLEWOOD SCHOOLS
BUDGETARY COMPARISON SCHEDULETUITION FUND
Year Ended June 30, 2017
See the accompanying Independent Auditors' Report.
36

ORIGINAL VARIANCE
AND FINAL Positive
BUDGET ACTUAL (Negative)
REVENUES Local Sources Property Taxes 5,205,000$ 8,823,133$ 3,618,133$ Investment Income - 31,645 31,645
TOTAL REVENUES 5,205,000 8,854,778 3,649,778
EXPENDITURES Debt Service Principal 3,238,514 3,238,514 - Interest and Fiscal Charges 2,322,792 2,323,042 (250) Reserves 5,055,512 - 5,055,512
TOTAL EXPENDITURES 10,616,818 5,561,556 5,055,262
NET CHANGE IN FUND BALANCE (5,411,818) 3,293,222 8,705,040
FUND BALANCE, Beginning 5,411,818 5,315,482 (96,336)
FUND BALANCE, Ending -$ 8,608,704$ 8,608,704$
ENGLEWOOD SCHOOLS
BUDGETARY COMPARISON SCHEDULEBOND REDEMPTION FUND
Year Ended June 30, 2017
See the accompanying Independent Auditors' Report.
37

ORIGINAL VARIANCE
AND FINAL Positive
BUDGET ACTUAL (Negative)
REVENUES Local Sources Investment Income -$ 97,127$ 97,127$
TOTAL REVENUES - 97,127 97,127
EXPENDITURES Capital Outlay 3,712,481 3,597,358 115,123 Debt Service Debt Issuance Costs - 588,725 (588,725) Reserves 99,591,081 - 99,591,081
TOTAL EXPENDITURES 103,303,562 4,186,083 99,117,479
EXCESS OF REVENUES OVER (UNDER) EXPENDITURES (103,303,562) (4,088,956) 99,214,606
OTHER FINANCING SOURCES Debt Issued 103,303,562 97,500,000 (5,803,562) Debt Premium - 13,239,460 13,239,460
TOTAL OTHER FINANCING SOURCES 103,303,562 110,739,460 7,435,898
NET CHANGE IN FUND BALANCE - 106,650,504 106,650,504
FUND BALANCE, Beginning - - -
FUND BALANCE, Ending -$ 106,650,504$ 106,650,504$
ENGLEWOOD SCHOOLS
BUDGETARY COMPARISON SCHEDULEBUILDING FUND
Year Ended June 30, 2017
See the accompanying Independent Auditors' Report.
38

ORIGINAL VARIANCE
AND FINAL Positive
BUDGET ACTUAL (Negative)
REVENUES Local Sources Investment Income 2,000$ 7,604$ 5,604$ Rental Income 3,156 3,185 29 Other - 1,276 1,276
TOTAL REVENUES 5,156 12,065 6,909
EXPENDITURES Purchased Services 621,096 576,465 44,631 Property 529,000 210,911 318,089 Reserves 250,110 - 250,110
TOTAL EXPENDITURES 1,400,206 787,376 612,830
EXCESS OF REVENUES OVER (UNDER) EXPENDITURES (1,395,050) (775,311) 619,739
OTHER FINANCING SOURCES Transfers In 200,000 200,000 -
NET CHANGE IN FUND BALANCE (1,195,050) (575,311) 619,739
FUND BALANCE, Beginning 1,195,050 1,347,432 152,382
FUND BALANCE, Ending -$ 772,121$ 772,121$
ENGLEWOOD SCHOOLS
BUDGETARY COMPARISON SCHEDULECAPITAL RESERVE FUND
Year Ended June 30, 2017
See the accompanying Independent Auditors' Report.
39
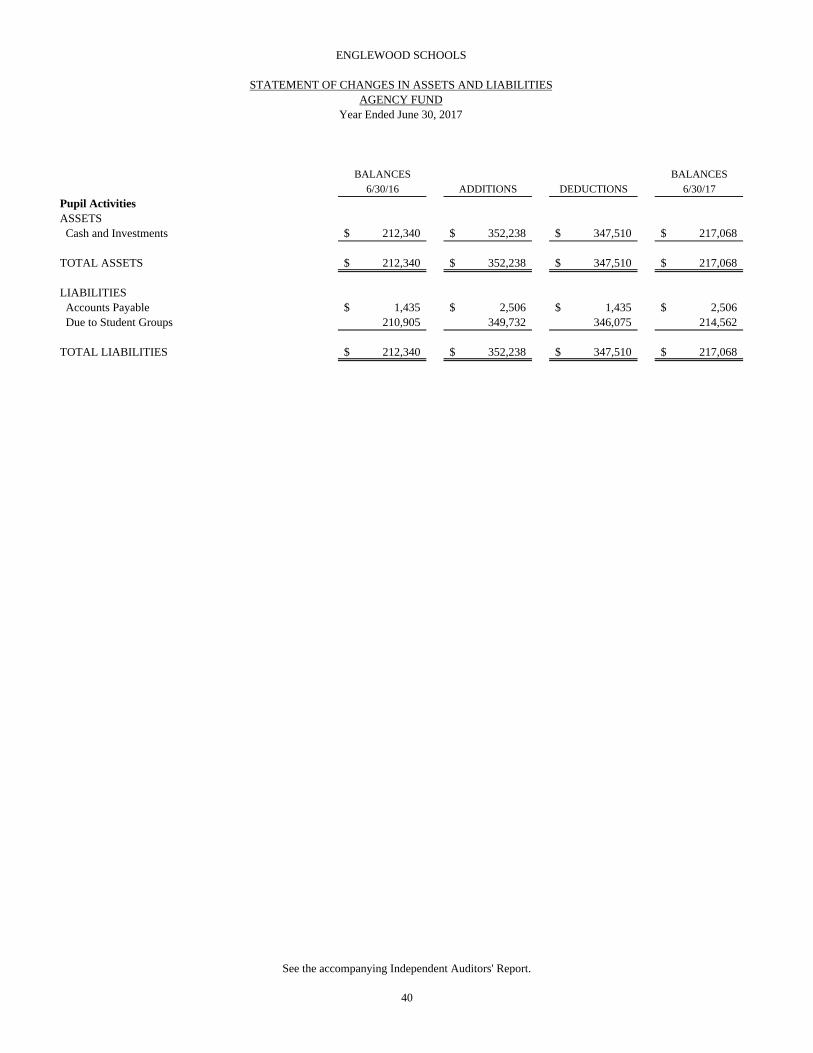
BALANCES BALANCES
6/30/16 ADDITIONS DEDUCTIONS 6/30/17
Pupil ActivitiesASSETS Cash and Investments 212,340$ 352,238$ 347,510$ 217,068$
TOTAL ASSETS 212,340$ 352,238$ 347,510$ 217,068$
LIABILITIES Accounts Payable 1,435$ 2,506$ 1,435$ 2,506$ Due to Student Groups 210,905 349,732 346,075 214,562
TOTAL LIABILITIES 212,340$ 352,238$ 347,510$ 217,068$
ENGLEWOOD SCHOOLS
STATEMENT OF CHANGES IN ASSETS AND LIABILITIESAGENCY FUND
Year Ended June 30, 2017
See the accompanying Independent Auditors' Report.
40

ENGLEWOOD SCHOOLS
Statistical Section
(Unaudited)
This part of Englewood Schools' comprehensive annual financial report presents detailed information
as a context for understanding what the information in the financial statements, note disclosures, and
required supplementary information says about the District's overall financial health.
Contents Page
Financial Trends 41‐44
These schedules contain trend information to help the reader understand
how the District's financial performance and well‐being have changed over time.
Revenue Capacity 45‐48
These schedules contain information to help the reader assess the District's
most significant local revenue source, the property tax.
Debt Capacity 49‐52
These schedules present information to help the reader assess the
affordability of the District's current levels of outstanding debt and the
District's ability to issue additional debt in the future.
Demographic and Economic Information 53‐54
These schedules offer demographic and economic indicators to help the
reader understand the environment within which the District's financial
activities take place.
Operating Information 55‐58
These schedules contain service and infrastructure data to help the reader
understand how the information in the District's financial report relates to the
services the District provides and the activities it performs.
Sources: Unless otherwise noted, the information in these schedules is derived from the
comprehensive annual financial reports for the relevant year. The District implemented GASB
Statement 34 in fiscal year 2003.
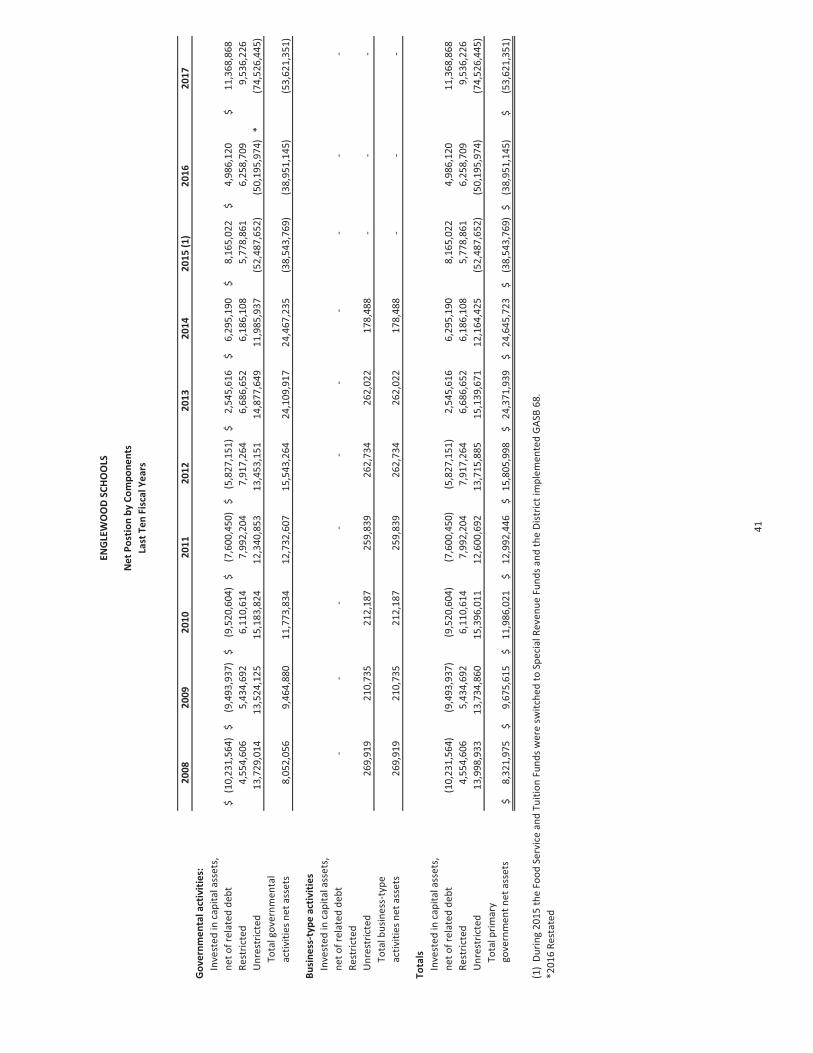
2008
2009
2010
2011
2012
2013
2014
2015
(1)
2016
2017
Gov
ernm
enta
l act
iviti
es:
Inve
sted
in c
apita
l ass
ets,
net o
f rel
ated
deb
t(1
0,23
1,56
4)$
(9
,493
,937
)$
(9,5
20,6
04)
$
(7
,600
,450
)$
(5,8
27,1
51)
$
2,
545,
616
$
6,
295,
190
$
8,
165,
022
$
4,98
6,12
0$
11
,368
,868
$
Rest
ricte
d4,
554,
606
5,
434,
692
6,
110,
614
7,
992,
204
7,
917,
264
6,
686,
652
6,
186,
108
5,
778,
861
6,25
8,70
9
9,
536,
226
U
nres
tric
ted
13,7
29,0
14
13,5
24,1
25
15,1
83,8
24
12,3
40,8
53
13,4
53,1
51
14
,877
,649
11,9
85,9
37
(5
2,48
7,65
2)
(50,
195,
974)
*
(74,
526,
445)
Tota
l gov
ernm
enta
lac
tiviti
es n
et a
sset
s8,
052,
056
9,
464,
880
11
,773
,834
12
,732
,607
15
,543
,264
24,1
09,9
17
24
,467
,235
(38,
543,
769)
(3
8,95
1,14
5)
(53,
621,
351)
Busi
ness
-typ
e ac
tiviti
esIn
vest
ed in
cap
ital a
sset
s,ne
t of r
elat
ed d
ebt
-
-
-
-
-
-
-
-
-
-
Rest
ricte
dU
nres
tric
ted
269,
919
21
0,73
5
212,
187
25
9,83
9
262,
734
262,
022
178,
488
-
-
-
Tota
l bus
ines
s-ty
pe
activ
ities
net
ass
ets
269,
919
21
0,73
5
212,
187
25
9,83
9
262,
734
262,
022
178,
488
-
-
-
Tota
lsIn
vest
ed in
cap
ital a
sset
s,ne
t of r
elat
ed d
ebt
(10,
231,
564)
(9,4
93,9
37)
(9
,520
,604
)
(7,6
00,4
50)
(5
,827
,151
)
2,54
5,61
6
6,29
5,19
0
8,16
5,02
2
4,
986,
120
11,3
68,8
68
Re
stric
ted
4,55
4,60
6
5,43
4,69
2
6,11
0,61
4
7,99
2,20
4
7,91
7,26
4
6,68
6,65
2
6,18
6,10
8
5,77
8,86
1
6,
258,
709
9,53
6,22
6
Unr
estr
icte
d13
,998
,933
13
,734
,860
15
,396
,011
12
,600
,692
13
,715
,885
15,1
39,6
71
12
,164
,425
(52,
487,
652)
(5
0,19
5,97
4)
(74,
526,
445)
Tota
l prim
ary
go
vern
men
t net
ass
ets
8,32
1,97
5$
9,67
5,61
5$
11,9
86,0
21$
12,9
92,4
46$
15,8
05,9
98$
24
,371
,939
$
24,6
45,7
23$
(3
8,54
3,76
9)$
(38,
951,
145)
$
(5
3,62
1,35
1)$
(1)
Durin
g 20
15 th
e Fo
od S
ervi
ce a
nd T
uitio
n Fu
nds w
ere
switc
hed
to S
peci
al R
even
ue F
unds
and
the
Dist
rict i
mpl
emen
ted
GAS
B 68
.*2
016
Rest
ated
ENG
LEW
OO
D SC
HOO
LS
Net
Pos
tion
by C
ompo
nent
sLa
st T
en F
isca
l Yea
rs
41
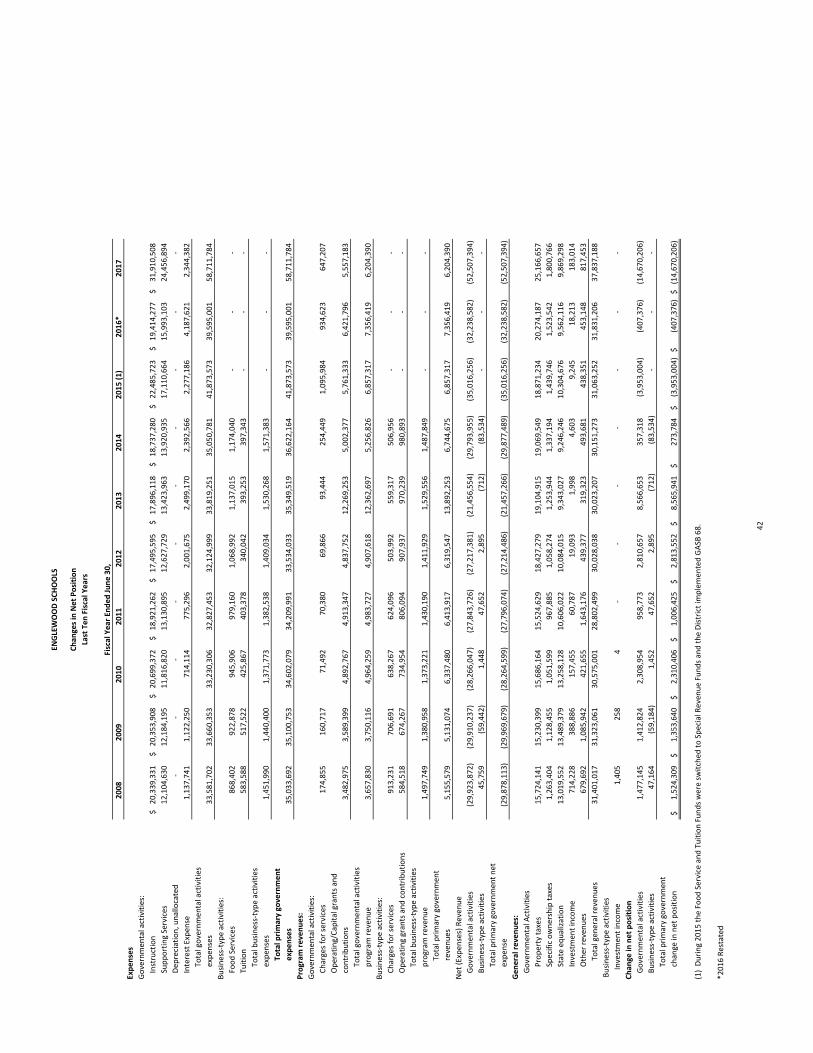
2008
2009
2010
2011
2012
2013
2014
2015 (1)
2016*
2017
Expenses
Governmen
tal activities:
Instruction
20,339,331
$
20,353,908
$
20,699,372
$
18,921,262
$
17,495,595
$
17,896,118
$
18,737,280
$
22,485,723
$
19,414,277
$
31,910,508
$
Supporting Services
12,104,630
12,184,195
11,816,820
13,130,895
12,627,729
13,423,963
13,920,935
17,110,664
15,993,103
24,456,894
Dep
reciation, unallocated
‐
‐
‐
‐
‐
‐
‐
‐
‐
‐
Interest Expen
se1,137,741
1,122,250
714,114
775,296
2,001,675
2,499,170
2,392,566
2,277,186
4,187,621
2,344,382
Total governmen
tal activities
expen
ses
33,581,702
33,660,353
33,230,306
32,827,453
32,124,999
33,819,251
35,050,781
41,873,573
39,595,001
58,711,784
Business‐type activities:
Food Services
868,402
922,878
945,906
979,160
1,068,992
1,137,015
1,174,040
‐
‐
‐
Tuition
583,588
517,522
425,867
403,378
340,042
393,253
397,343
‐
‐
‐
Total business‐type activities
expen
ses
1,451,990
1,440,400
1,371,773
1,382,538
1,409,034
1,530,268
1,571,383
‐
‐
‐
Total primary government
expenses
35,033,692
35,100,753
34,602,079
34,209,991
33,534,033
35,349,519
36,622,164
41,873,573
39,595,001
58,711,784
Program
revenues:
Governmen
tal activities:
Charges for services
174,855
160,717
71,492
70,380
69,866
93,444
254,449
1,095,984
934,623
647,207
Operating/Capital grants and
contributions
3,482,975
3,589,399
4,892,767
4,913,347
4,837,752
12,269,253
5,002,377
5,761,333
6,421,796
5,557,183
Total governmen
tal activities
program
reven
ue
3,657,830
3,750,116
4,964,259
4,983,727
4,907,618
12,362,697
5,256,826
6,857,317
7,356,419
6,204,390
Business‐type activities:
Charges for services
913,231
706,691
638,267
624,096
503,992
559,317
506,956
‐
‐
‐
Operating grants and contributions
584,518
674,267
734,954
806,094
907,937
970,239
980,893
‐
‐
‐
Total business‐type activities
program
reven
ue
1,497,749
1,380,958
1,373,221
1,430,190
1,411,929
1,529,556
1,487,849
‐
‐
‐
Total primary governmen
t
revenues
5,155,579
5,131,074
6,337,480
6,413,917
6,319,547
13,892,253
6,744,675
6,857,317
7,356,419
6,204,390
Net (Expen
ses) Reven
ue
Governmen
tal activities
(29,923,872)
(29,910,237)
(28,266,047)
(27,843,726)
(27,217,381)
(21,456,554)
(29,793,955)
(35,016,256)
(32,238,582)
(52,507,394)
Business‐type activities
45,759
(59,442)
1,448
47,652
2,895
(712)
(83,534)
‐
‐
‐
Total primary governmen
t net
expen
se(29,878,113)
(29,969,679)
(28,264,599)
(27,796,074)
(27,214,486)
(21,457,266)
(29,877,489)
(35,016,256)
(32,238,582)
(52,507,394)
General revenues:
Governmen
tal A
ctivities
Property taxes
15,724,141
15,230,399
15,686,164
15,524,629
18,427,279
19,104,915
19,069,549
18,871,234
20,274,187
25,166,657
Specific ownership taxes
1,263,404
1,128,455
1,051,599
967,885
1,058,274
1,253,944
1,337,194
1,439,746
1,523,542
1,800,766
State eq
ualization
13,019,552
13,489,379
13,258,128
10,606,022
10,084,015
9,343,027
9,246,246
10,304,676
9,562,116
9,869,298
Investmen
t income
714,228
388,886
157,455
60,787
19,093
1,998
4,603
9,245
18,213
183,014
Other reven
ues
679,692
1,085,942
421,655
1,643,176
439,377
319,323
493,681
438,351
453,148
817,453
Total gen
eral reven
ues
31,401,017
31,323,061
30,575,001
28,802,499
30,028,038
30,023,207
30,151,273
31,063,252
31,831,206
37,837,188
Business‐type activities
Investmen
t income
1,405
258
4
‐
‐
‐
‐
‐
‐
‐
Chan
ge in
net position
Governmen
tal activities
1,477,145
1,412,824
2,308,954
958,773
2,810,657
8,566,653
357,318
(3,953,004)
(407,376)
(14,670,206)
Business‐type activities
47,164
(59,184)
1,452
47,652
2,895
(712)
(83,534)
‐
‐
‐
Total primary governmen
t
change in
net position
1,524,309
$
1,353,640
$
2,310,406
$
1,006,425
$
2,813,552
$
8,565,941
$
273,784
$
(3,953,004)
$
(407,376)
$
(14,670,206)
$
(1) During 2015 the Food Service and Tuition Funds were sw
itched
to Special Reven
ue Funds and the District im
plemen
ted GASB
68.
*2016 Restated
Fiscal Year Ended June 30,
ENGLEWOOD SCHOOLS
Chan
ges in Net Position
Last Ten Fiscal Years
42
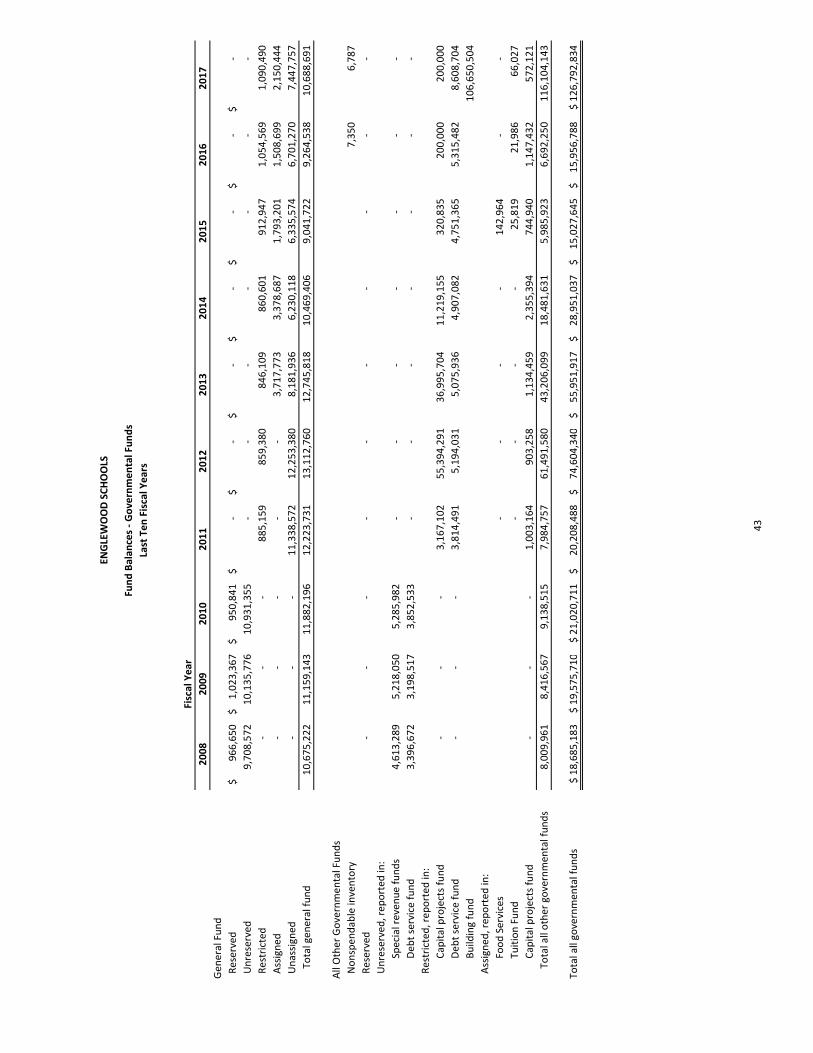
2008
2009
2010
2011
2012
2013
2014
2015
2016
2017
Gen
eral Fund
Reserved
966,650
$
1,023,367
$
950,841
$
‐$
‐$
‐$
‐$
‐$
‐$
‐$
Unreserved
9,708,572
10,135,776
10,931,355
‐
‐
‐
‐
‐
‐
‐
Restricted
‐
‐
‐
885,159
859,380
846,109
860,601
912,947
1,054,569
1,090,490
Assigned
‐
‐
‐
‐
‐
3,717,773
3,378,687
1,793,201
1,508,699
2,150,444
Unassigned
‐
‐
‐
11,338,572
12,253,380
8,181,936
6,230,118
6,335,574
6,701,270
7,447,757
Total gen
eral fund
10,675,222
11,159,143
11,882,196
12,223,731
13,112,760
12,745,818
10,469,406
9,041,722
9,264,538
10,688,691
All Other Governmen
tal Funds
Nonspen
dable inventory
7,350
6,787
Reserved
‐
‐
‐
‐
‐
‐
‐
‐
‐
‐
Unreserved
, rep
orted
in:
Special reven
ue funds
4,613,289
5,218,050
5,285,982
‐
‐
‐
‐
‐
‐
‐
D
ebt service fund
3,396,672
3,198,517
3,852,533
‐
‐
‐
‐
‐
‐
‐
Restricted, rep
orted
in:
Capital projects fund
‐
‐
‐
3,167,102
55,394,291
36,995,704
11,219,155
320,835
200,000
200,000
D
ebt service fund
‐
‐
‐
3,814,491
5,194,031
5,075,936
4,907,082
4,751,365
5,315,482
8,608,704
Building fund
106,650,504
Assigned
, rep
orted
in:
Food Services
‐
‐
‐
‐
142,964
‐
‐
Tuition Fund
‐
‐
‐
‐
25,819
21,986
66,027
Capital projects fund
‐
‐
‐
1,003,164
903,258
1,134,459
2,355,394
744,940
1,147,432
572,121
Total all other governmen
tal funds
8,009,961
8,416,567
9,138,515
7,984,757
61,491,580
43,206,099
18,481,631
5,985,923
6,692,250
116,104,143
Total all governmen
tal funds
18,685,183
$
19,575,710
$
21,020,711
$
20,208,488
$
74,604,340
$
55,951,917
$
28,951,037
$
15,027,645
$
15,956,788
$
126,792,834
$
Fiscal Year
ENGLEWOOD SCHOOLS
Fund Balan
ces ‐ Governmental Funds
Last Ten Fiscal Years
43

2008
2009
2010
2011
2012
2013
2014
2015
2016
2017
Revenues:
Local Sources
18,734,956
$
18,439,858
$
17,268,274
$
17,464,305
$
20,285,110
$
28,630,133
$
21,809,419
$
21,553,630
$
23,390,918
$
28,600,858
$
State Sources
13,963,522
14,641,751
14,623,310
11,868,112
11,562,690
11,227,346
11,060,772
12,693,466
12,056,355
11,811,832
Federal Sources
2,429,715
2,393,389
3,463,266
4,189,730
2,971,123
2,694,954
2,564,495
3,308,204
3,458,189
3,614,649
Charges for Services
‐
‐
‐
‐
‐
‐
‐
501,975
457,757
‐
Total reven
ues
35,128,193
35,474,998
35,354,850
33,522,147
34,818,923
42,552,433
35,434,686
38,057,275
39,363,219
44,027,339
Expenditures:
Instruction
18,408,034
18,739,912
19,344,585
18,287,304
16,967,332
17,102,464
17,897,403
18,538,071
17,874,770
17,789,397
Support services
11,504,378
11,443,495
11,352,707
11,646,452
11,570,619
12,393,421
13,313,628
14,428,450
14,832,617
16,393,717
Capital outlay
863,782
962,147
679,950
1,608,740
2,455,029
26,175,563
27,404,795
13,642,683
804,075
3,597,358
Deb
t service:
Principal
2,314,444
2,494,444
1,699,444
2,394,444
2,444,722
2,797,319
2,892,192
2,998,814
26,995,915
3,238,514
Interest and fiscal charges
749,852
944,473
833,163
797,763
1,660,049
2,786,089
2,680,048
2,551,137
6,960,456
2,323,042
Bond issuance costs
128,697
‐
‐
‐
311,637
‐
‐
‐
‐
588,725
Total expen
ditures
33,969,187
34,584,471
33,909,849
34,734,703
35,409,388
61,254,856
64,188,066
52,159,155
67,467,833
43,930,753
Other Finan
cing Services (Uses)
Bonds issued
9,075,000
‐
‐
‐
49,996,986
‐
‐
‐
24,835,000
97,500,000
Bond premium
439,060
‐
‐
‐
4,964,028
‐
‐
‐
4,198,757
13,239,460
Paymen
ts to escrow agent
(9,378,990)
‐
‐
‐
‐
‐
‐
‐
‐
‐
Capital Lease
‐
‐
‐
‐
‐
‐
‐
‐
‐
‐
Proceed
s from Sale of Capital Assets
‐
‐
‐
400,333
25,303
50,000
1,752,500
‐
‐
‐
Transfers in
774,079
1,068,511
844,564
384,242
200,000
678,674
650,000
900,000
469,194
235,652
Transfers out
(774,079)
(1,068,511)
(844,564)
(384,242)
(200,000)
(678,674)
(650,000)
(900,000)
(469,194)
(235,652)
Total other financing sources (uses)
135,070
‐
‐
400,333
54,986,317
50,000
1,752,500
‐
29,033,757
110,739,460
Net chan
ge in
fund balan
ces
1,294,076
$
890,527
$
1,445,001
$
(812,223)
$
54,395,852
$
(18,652,423)
$
(27,000,880)
$
(14,101,880)
$
929,143
$
110,836,046
$
Debt service as a percentage
of noncapital
expenditures
9.0%
9.9%
7.5%
9.2%
11.6%
9.1%
8.7%
10.6%
50.3%
12.7%
ENGLEWOOD SCHOOLS
Chan
ges in Fund Balan
ces ‐ Governmental Funds
Last Ten Fiscal Years
44

ENGLEWOOD SCHOOLS
Assessed Value and Estim
ated Actual Value of Taxable Property
Last Ten Fiscal Years
(Unau
dited)
Year
Total Taxable
Assessed Value
Total
Direct Tax
Rate
(in m
ills)
Residen
tial
Property
Commercial
Property
Total Estim
ated
Actual Value
Percentage of
Assessed Value to
Estimated
Actual
Value
2008
358,484,270
37.211
2,005,430,059
757,467,138
2,762,897,197
12.97%
2009
421,381,030
37.195
2,015,631,030
709,270,550
2,724,901,580
15.46%
2010
420,770,900
37.199
2,015,443,630
897,670,852
2,913,114,482
14.44%
2011
419,880,340
37.495
1,869,911,551
934,536,232
2,804,447,783
14.97%
2012
404,882,670
45.858
1,818,642,994
896,906,482
2,715,549,476
14.91%
2013
411,108,940
46.719
1,819,669,002
918,095,359
2,737,764,361
15.02%
2014
408,615,730
46.874
1,805,864,441
913,290,625
2,719,155,066
15.03%
2015
406,326,674
47.018
1,815,549,956
902,662,338
2,718,212,294
14.95%
2016
466,336,848
44.268
2,296,133,877
977,831,201
3,273,965,078
14.24%
2017
465,378,090
54.561
2,316,009,395
968,485,752
3,284,495,147
14.17%
Source: A
rapahoe County Assessor's Office
The assessmen
t ratios for all taxable property in
the State of Colorado are as follows:
Year
Residen
tial
Commercial
Valuation Year
2006
7.96%
29.00%
2005
2007
7.96%
29.00%
2006
2008
7.96%
29.00%
2007
2009
7.96%
29.00%
2008
2010
7.96%
29.00%
2009
2011
7.96%
29.00%
2010
2012
7.96%
29.00%
2011
2013
7.96%
29.00%
2012
2014
7.96%
29.00%
2013
2015
7.96%
29.00%
2014
2016
7.96%
29.00%
2015
2017
7.20%
29.00%
2016
Estimated
Actual Value
45
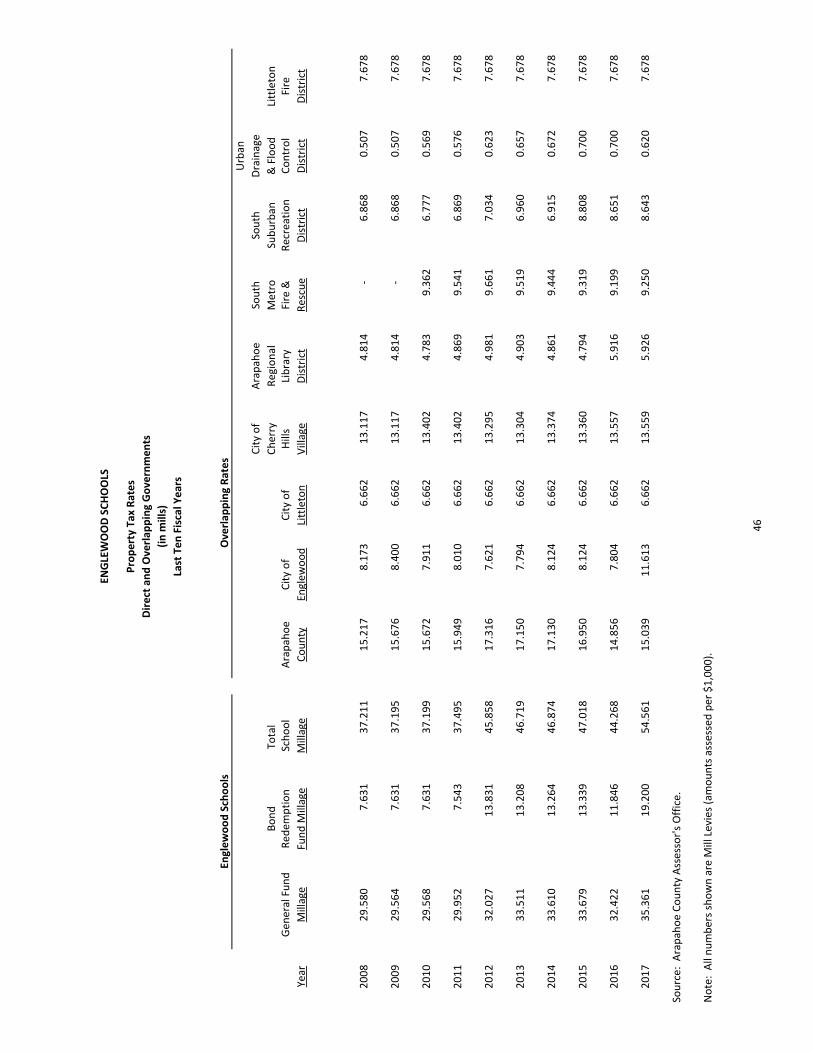
Overlap
ping Rates
Urban
City of
Arapahoe
South
South
Drainage
Bond
Total
Cherry
Regional
Metro
Suburban
& Flood
Littleton
Gen
eral Fund
Red
emption
School
Arapahoe
City of
City of
Hills
Library
Fire &
Recreation
Control
Fire
Year
Millage
Fund M
illage
Millage
County
Englew
ood
Littleton
Village
District
Rescue
District
District
District
2008
29.580
7.631
37.211
15.217
8.173
6.662
13.117
4.814
‐
6.868
0.507
7.678
2009
29.564
7.631
37.195
15.676
8.400
6.662
13.117
4.814
‐
6.868
0.507
7.678
2010
29.568
7.631
37.199
15.672
7.911
6.662
13.402
4.783
9.362
6.777
0.569
7.678
2011
29.952
7.543
37.495
15.949
8.010
6.662
13.402
4.869
9.541
6.869
0.576
7.678
2012
32.027
13.831
45.858
17.316
7.621
6.662
13.295
4.981
9.661
7.034
0.623
7.678
2013
33.511
13.208
46.719
17.150
7.794
6.662
13.304
4.903
9.519
6.960
0.657
7.678
2014
33.610
13.264
46.874
17.130
8.124
6.662
13.374
4.861
9.444
6.915
0.672
7.678
2015
33.679
13.339
47.018
16.950
8.124
6.662
13.360
4.794
9.319
8.808
0.700
7.678
2016
32.422
11.846
44.268
14.856
7.804
6.662
13.557
5.916
9.199
8.651
0.700
7.678
2017
35.361
19.200
54.561
15.039
11.613
6.662
13.559
5.926
9.250
8.643
0.620
7.678
Source: A
rapahoe County Assessor's Office.
Note: All numbers shown are M
ill Levies (amounts assessed per $1,000).
Englewood Schools
ENGLEWOOD SCHOOLS
Property Tax Rates
Direct and Overlap
ping Governments
(in m
ills)
Last Ten Fiscal Years
46
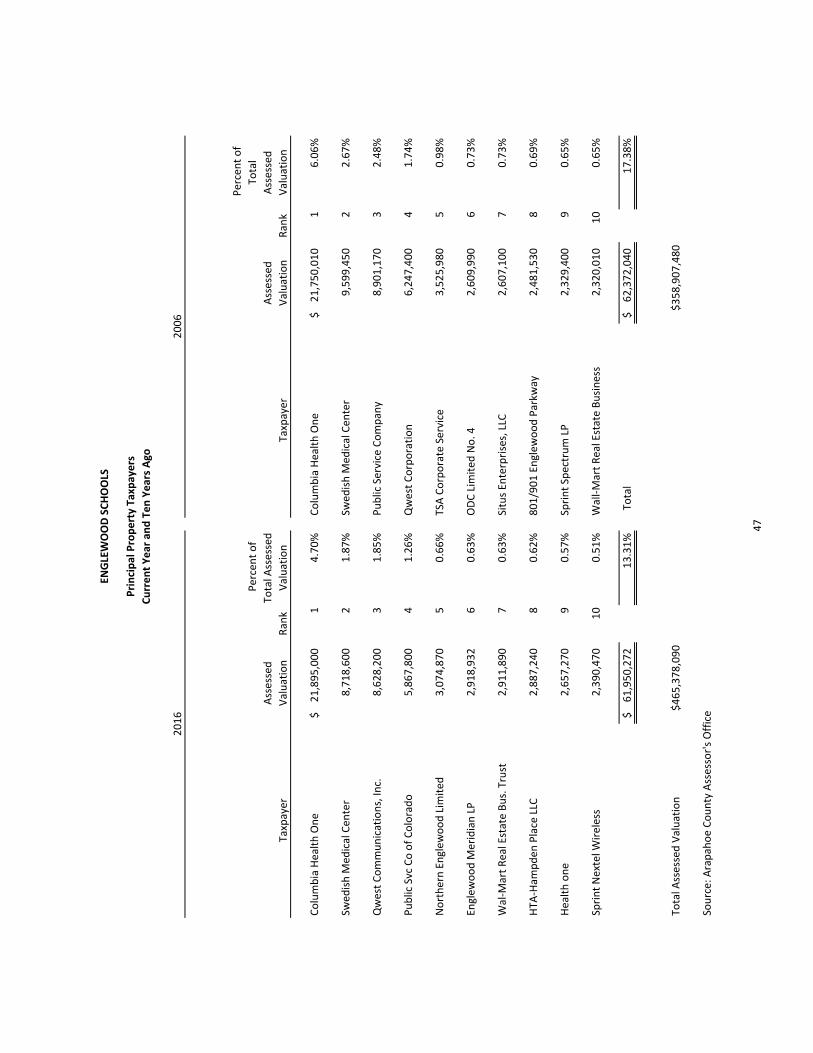
ENGLEWOOD SCHOOLS
Principal Property Taxpayers
Current Year and Ten Years Ago
Taxpayer
Assessed
Valuation
Rank
Percent of
Total A
ssessed
Valuation
Taxpayer
Assessed
Valuation
Rank
Percent of
Total
Assessed
Valuation
Columbia Health One
21,895,000
$
14.70%
Columbia Health One
21,750,010
$
16.06%
Swed
ish M
edical Cen
ter
8,718,600
21.87%
Swed
ish M
edical Cen
ter
9,599,450
22.67%
Qwest Communications, Inc.
8,628,200
31.85%
Public Service Company
8,901,170
32.48%
Public Svc Co of Colorado
5,867,800
41.26%
Qwest Corporation
6,247,400
41.74%
Northern Englew
ood Lim
ited
3,074,870
50.66%
TSA Corporate Service
3,525,980
50.98%
Englew
ood M
eridian LP
2,918,932
60.63%
ODC Lim
ited
No. 4
2,609,990
60.73%
Wal‐M
art Real Estate Bus. Trust
2,911,890
70.63%
Situs Enterprises, LLC
2,607,100
70.73%
HTA
‐Ham
pden
Place LLC
2,887,240
80.62%
801/901 Englew
ood Parkw
ay2,481,530
80.69%
Health one
2,657,270
90.57%
Sprint Spectrum LP
2,329,400
90.65%
Sprint Nextel W
ireless
2,390,470
10
0.51%
Wall‐Mart Real Estate Business
2,320,010
10
0.65%
61,950,272
$
13.31%
Total
62,372,040
$
17.38%
Total A
ssessed Valuation
$465,378,090
$358,907,480
Source: Arapahoe County Assessor's Office
2016
2006
47
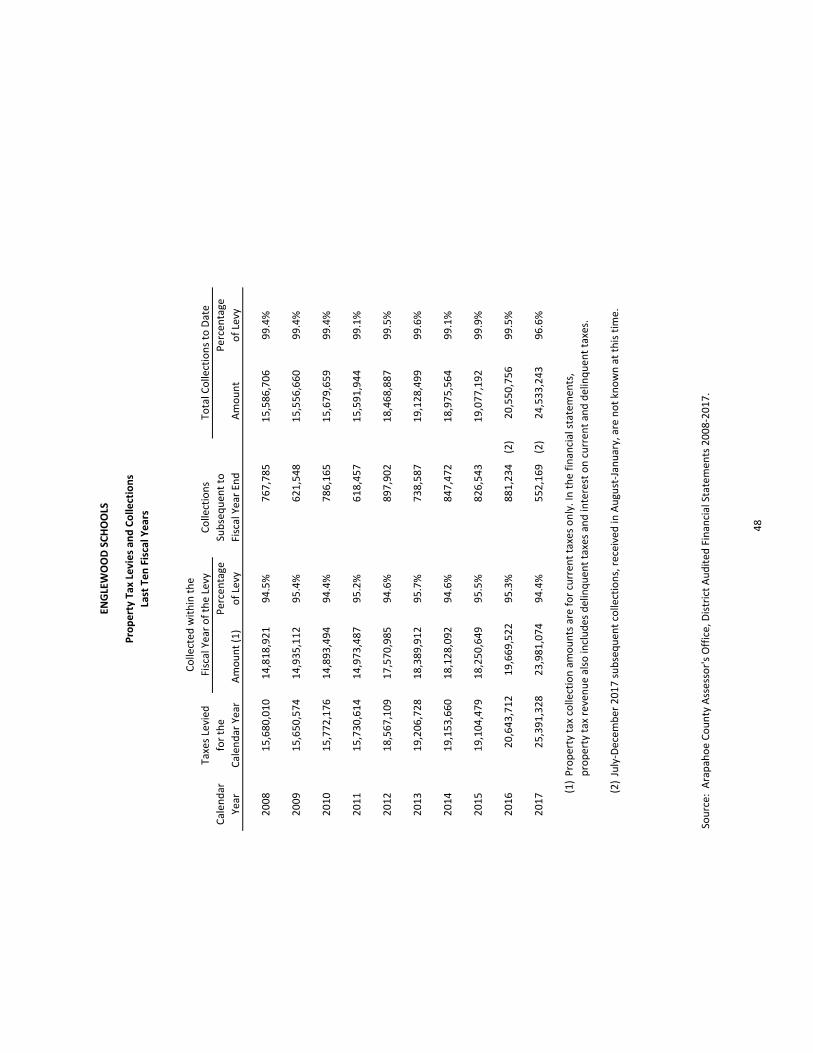
ENGLEWOOD SCHOOLS
Property Tax Levies an
d Collections
Last Ten Fiscal Years
Taxes Levied
Collections
Calen
dar
for the
Percentage
Subsequen
t to
Percentage
Year
Calen
dar Year
Amount (1)
of Levy
Fiscal Year End
Amount
of Levy
2008
15,680,010
14,818,921
94.5%
767,785
15,586,706
99.4%
2009
15,650,574
14,935,112
95.4%
621,548
15,556,660
99.4%
2010
15,772,176
14,893,494
94.4%
786,165
15,679,659
99.4%
2011
15,730,614
14,973,487
95.2%
618,457
15,591,944
99.1%
2012
18,567,109
17,570,985
94.6%
897,902
18,468,887
99.5%
2013
19,206,728
18,389,912
95.7%
738,587
19,128,499
99.6%
2014
19,153,660
18,128,092
94.6%
847,472
18,975,564
99.1%
2015
19,104,479
18,250,649
95.5%
826,543
19,077,192
99.9%
2016
20,643,712
19,669,522
95.3%
881,234
(2)
20,550,756
99.5%
2017
25,391,328
23,981,074
94.4%
552,169
(2)
24,533,243
96.6%
(1)Property tax collection amounts are for curren
t taxes only. In the financial statemen
ts,
property tax reven
ue also includes delinquen
t taxes and interest on curren
t and delinquen
t taxes.
(2)July‐Decem
ber 2017 subsequen
t collections, received in
August‐January, are not known at this tim
e.
Source: A
rapahoe County Assessor's Office, District Audited
Financial Statemen
ts 2008‐2017.
Collected
within the
Fiscal Year of the Levy
Total Collections to Date
48
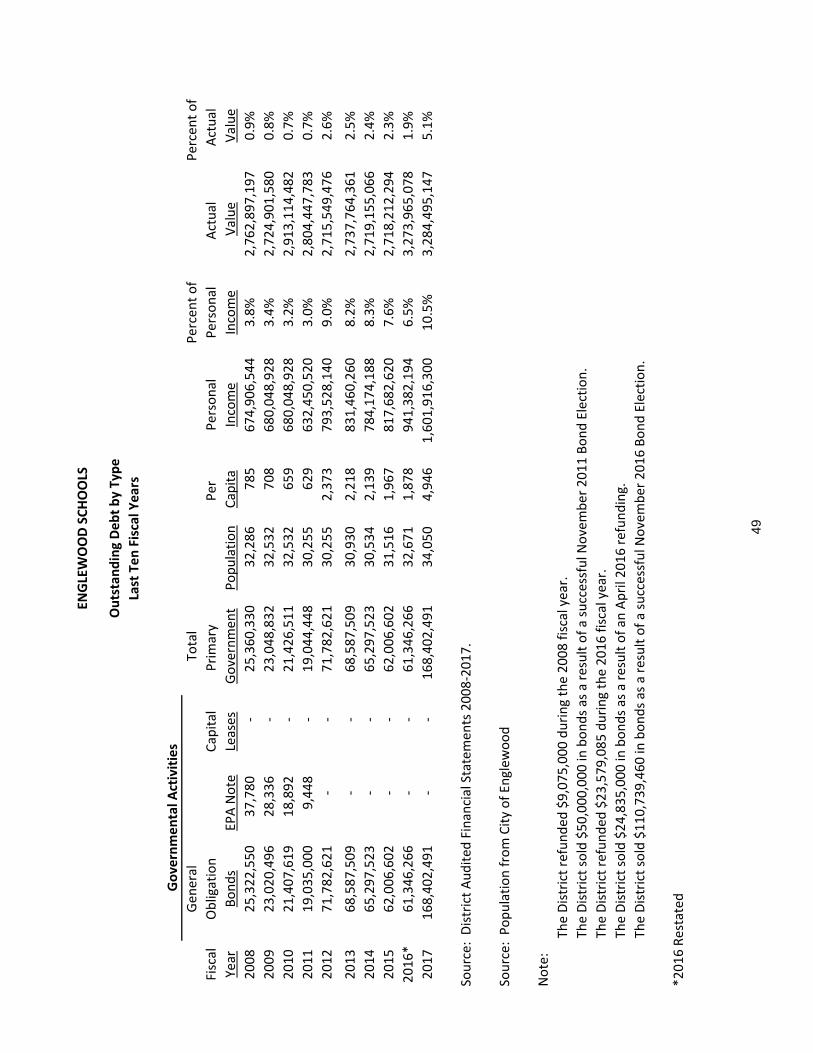
ENGLEWOOD SCHOOLS
Outstanding Debt by Type
Last Ten Fiscal Years
Gen
eral
Total
Percent of
Percent of
Fiscal
Obligation
Capital
Primary
Per
Personal
Personal
Actual
Actual
Year
Bonds
EPA Note
Leases
Governmen
tPopulation
Capita
Income
Income
Value
Value
2008
25,322,550
37,780
‐
25,360,330
32,286
785
674,906,544
3.8%
2,762,897,197
0.9%
2009
23,020,496
28,336
‐
23,048,832
32,532
708
680,048,928
3.4%
2,724,901,580
0.8%
2010
21,407,619
18,892
‐
21,426,511
32,532
659
680,048,928
3.2%
2,913,114,482
0.7%
2011
19,035,000
9,448
‐
19,044,448
30,255
629
632,450,520
3.0%
2,804,447,783
0.7%
2012
71,782,621
‐
‐
71,782,621
30,255
2,373
793,528,140
9.0%
2,715,549,476
2.6%
2013
68,587,509
‐
‐
68,587,509
30,930
2,218
831,460,260
8.2%
2,737,764,361
2.5%
2014
65,297,523
‐
‐
65,297,523
30,534
2,139
784,174,188
8.3%
2,719,155,066
2.4%
2015
62,006,602
‐
‐
62,006,602
31,516
1,967
817,682,620
7.6%
2,718,212,294
2.3%
2016*
61,346,266
‐
‐
61,346,266
32,671
1,878
941,382,194
6.5%
3,273,965,078
1.9%
2017
168,402,491
‐
‐
168,402,491
34,050
4,946
1,601,916,300
10.5%
3,284,495,147
5.1%
Source: D
istrict Audited
Financial Statemen
ts 2008‐2017.
Source: Population from City of Englew
ood
Note:
The District refunded
$9,075,000 during the 2008 fiscal year.
The District sold $50,000,000 in
bonds as a result of a successful N
ovember 2011 Bond Election.
The District refunded
$23,579,085 during the 2016 fiscal year.
The District sold $24,835,000 in
bonds as a result of an
April 2016 refunding.
The District sold $110,739,460 in
bonds as a result of a successful N
ovember 2016 Bond Election.
*2016 Restated
Governmental A
ctivities
49
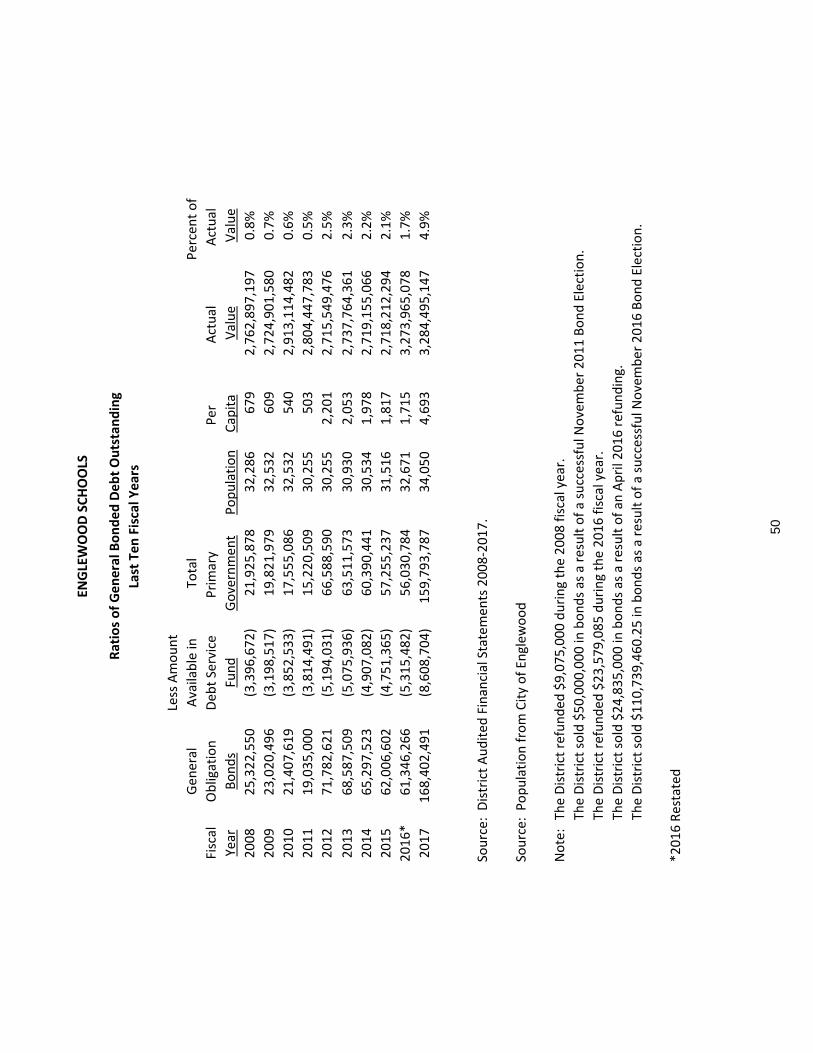
ENGLEWOOD SCHOOLS
Ratios of General B
onded Debt Outstanding
Last Ten Fiscal Years
Less Amount
Gen
eral
Available in
Total
Percent of
Fiscal
Obligation
Deb
t Service
Primary
Per
Actual
Actual
Year
Bonds
Fund
Governmen
tPopulation
Capita
Value
Value
2008
25,322,550
(3,396,672)
21,925,878
32,286
679
2,762,897,197
0.8%
2009
23,020,496
(3,198,517)
19,821,979
32,532
609
2,724,901,580
0.7%
2010
21,407,619
(3,852,533)
17,555,086
32,532
540
2,913,114,482
0.6%
2011
19,035,000
(3,814,491)
15,220,509
30,255
503
2,804,447,783
0.5%
2012
71,782,621
(5,194,031)
66,588,590
30,255
2,201
2,715,549,476
2.5%
2013
68,587,509
(5,075,936)
63,511,573
30,930
2,053
2,737,764,361
2.3%
2014
65,297,523
(4,907,082)
60,390,441
30,534
1,978
2,719,155,066
2.2%
2015
62,006,602
(4,751,365)
57,255,237
31,516
1,817
2,718,212,294
2.1%
2016*
61,346,266
(5,315,482)
56,030,784
32,671
1,715
3,273,965,078
1.7%
2017
168,402,491
(8,608,704)
159,793,787
34,050
4,693
3,284,495,147
4.9%
Source: D
istrict Audited
Financial Statemen
ts 2008‐2017.
Source: Population from City of Englew
ood
Note: The District refunded
$9,075,000 during the 2008 fiscal year.
The District sold $50,000,000 in
bonds as a result of a successful N
ovember 2011 Bond Election.
The District refunded
$23,579,085 during the 2016 fiscal year.
The District sold $24,835,000 in
bonds as a result of an
April 2016 refunding.
The District sold $110,739,460.25 in
bonds as a result of a successful N
ovember 2016 Bond Election.
*2016 Restated
50
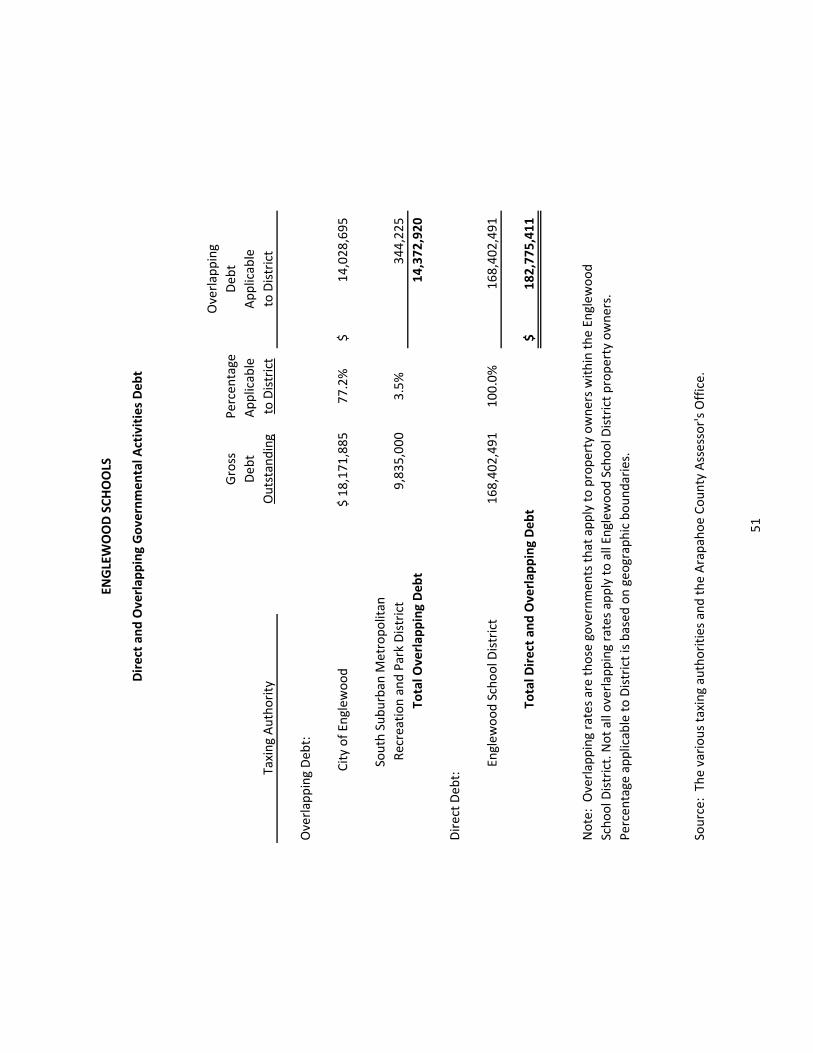
ENGLEWOOD SCHOOLS
Direct an
d Overlap
ping Governmen
tal A
ctivities Deb
t
Overlapping
Gross
Percentage
Deb
t
Debt
Applicable
Applicable
Outstanding
to District
to District
Overlapping Deb
t:
City of Englewood
18,171,885
$
77.2%
14,028,695
$
South Suburban
Metropolitan
Recreation and Park District
9,835,000
3.5%
344,225
Total O
verlap
ping Deb
t14,372,920
Direct Deb
t:
Englewood School D
istrict
168,402,491
100.0%
168,402,491
Total D
irect an
d Overlap
ping Deb
t182,775,411
$
Note: Overlapping rates are those governments that apply to property owners within the Englewood
School D
istrict. Not all overlapping rates apply to all Englewood School D
istrict property owners.
Percentage applicable to District is based on geographic boundaries.
Source: The various taxing authorities and the Arapahoe County Assessor's Office.
Taxing Authority
51
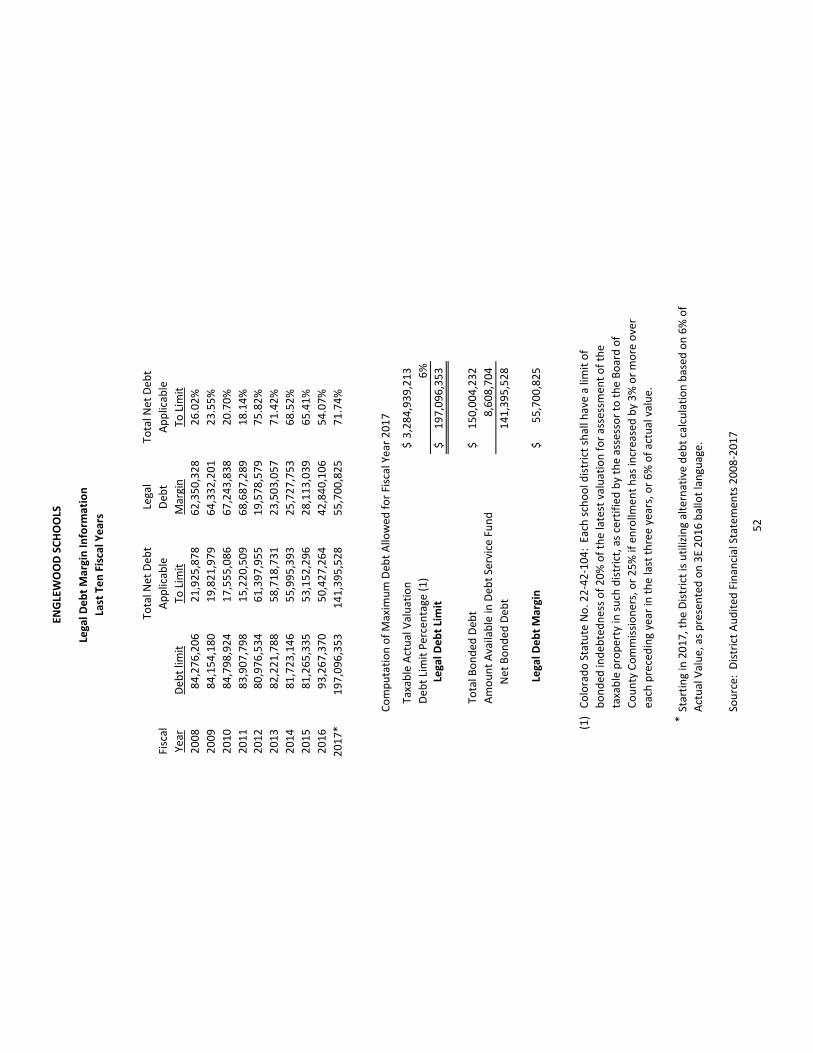
ENGLEWOOD SCHOOLS
Legal D
ebt Margin In
form
ation
Last Ten Fiscal Years
Total N
et Deb
tLegal
Total N
et Deb
t
Fiscal
Applicable
Deb
tApplicable
Year
Deb
t lim
itTo
Lim
itMargin
To Lim
it
2008
84,276,206
21,925,878
62,350,328
26.02%
2009
84,154,180
19,821,979
64,332,201
23.55%
2010
84,798,924
17,555,086
67,243,838
20.70%
2011
83,907,798
15,220,509
68,687,289
18.14%
2012
80,976,534
61,397,955
19,578,579
75.82%
2013
82,221,788
58,718,731
23,503,057
71.42%
2014
81,723,146
55,995,393
25,727,753
68.52%
2015
81,265,335
53,152,296
28,113,039
65.41%
2016
93,267,370
50,427,264
42,840,106
54.07%
2017*
197,096,353
141,395,528
55,700,825
71.74%
Computation of Maxim
um Deb
t Allowed
for Fiscal Year 2017
Taxable Actual Valuation
3,284,939,213
$
Deb
t Limit Percentage (1)
6%
Legal D
ebt Limit
197,096,353
$
To
tal Bonded
Deb
t150,004,232
$
Amount Available in
Deb
t Service Fund
8,608,704
Net Bonded
Deb
t141,395,528
Legal D
ebt Margin
55,700,825
$
(1)Colorado Statute No. 22‐42‐104: Each school district shall have a lim
it of
bonded
indeb
tedness of 20% of the latest valuation for assessmen
t of the
taxable property in
such district, as certified by the assessor to the Board of
County Commissioners, or 25% if enrollm
ent has increased by 3% or more over
each preceding year in
the last three years, or 6% of actual value.
*
Source: D
istrict Audited
Financial Statemen
ts 2008‐2017
Starting in 2017, the District is utilizing alternative deb
t calculation based
on 6% of
Actual Value, as presented on 3E 2016 ballot language.
52

ENGLEWOOD SCHOOLS
Demograp
hic and Economic Statistics
Last Ten Fiscal Years
Per Capita
Fiscal
Englew
ood
Personal
Personal
Med
ian
School
Unem
ploym
ent
Year
Population (1)
Income
Income (2)
Age (1)
Enrollm
ent (3)
Rate (4)
2008
32,286
674,906,544
$
20,904
$
36
3,427
4.5%
2009
32,532
680,048,928
$
20,904
$
36
3,298
6.0%
2010
32,532
680,048,928
$
20,904
$
36
3,124
7.3%
2011
30,255
632,450,520
$
20,904
$
36
2,992
10.1%
2012
30,255
793,528,140
$
26,228
$
37
2,954
9.5%
2013
30,930
831,460,260
$
26,882
$
37
2,981
7.6%
2014
30,534
784,174,188
$
25,682
$
38
2,835
6.1%
2015
31,516
817,682,620
$
25,945
$
37
2,866
4.4%
2016
32,671
941,382,194
$
28,814
$
37
2,854
4.4%
2017
34,050
1,601,916,300
$
47,046
$
37
2,775
3.4%
Sources: (1)
City of Englew
ood
(2)
U.S. Cen
sus Bureau
(3)
Englew
ood Schools
(4)
Colorado Dep
artm
ent of Labor and Employm
ent (data presented for Den
ver Metro area)
53
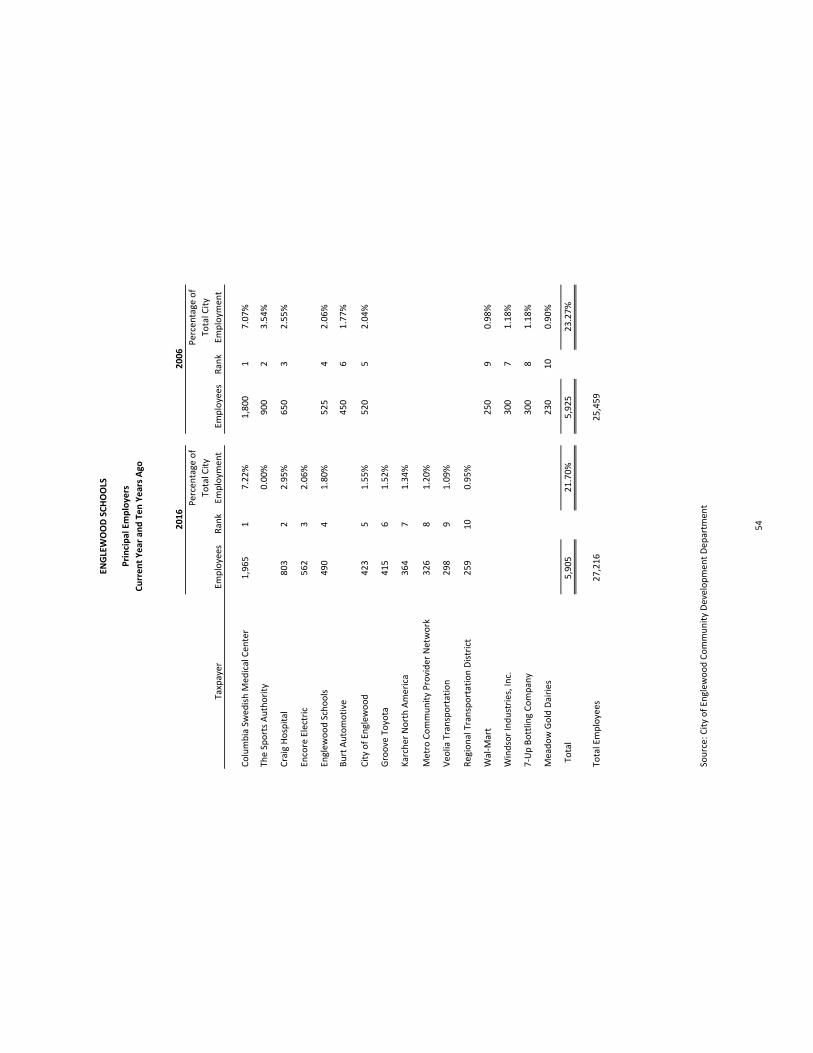
ENGLEWOOD SCHOOLS
Principal Employers
Current Year and Ten Years Ago
Taxpayer
Employees
Rank
Percentage of
Total City
Employm
ent
Employees
Rank
Percentage of
Total City
Employm
ent
Columbia Swed
ish M
edical Cen
ter
1,965
17.22%
1,800
17.07%
The Sports Authority
0.00%
900
23.54%
Craig Hospital
803
22.95%
650
32.55%
Encore Electric
562
32.06%
Englew
ood Schools
490
41.80%
525
42.06%
Burt Automotive
450
61.77%
City of Englew
ood
423
51.55%
520
52.04%
Groove Toyota
415
61.52%
Karcher North America
364
71.34%
Metro Community Provider Network
326
81.20%
Veo
lia Transportation
298
91.09%
Regional Transportation District
259
10
0.95%
Wal‐M
art
250
90.98%
Windsor Industries, Inc.
300
71.18%
7‐Up Bottling Company
300
81.18%
Meadow Gold Dairies
230
10
0.90%
Total
5,905
21.70%
5,925
23.27%
Total Employees
27,216
25,459
Source: City of Englew
ood Community Developmen
t Dep
artm
ent
2016
2006
54
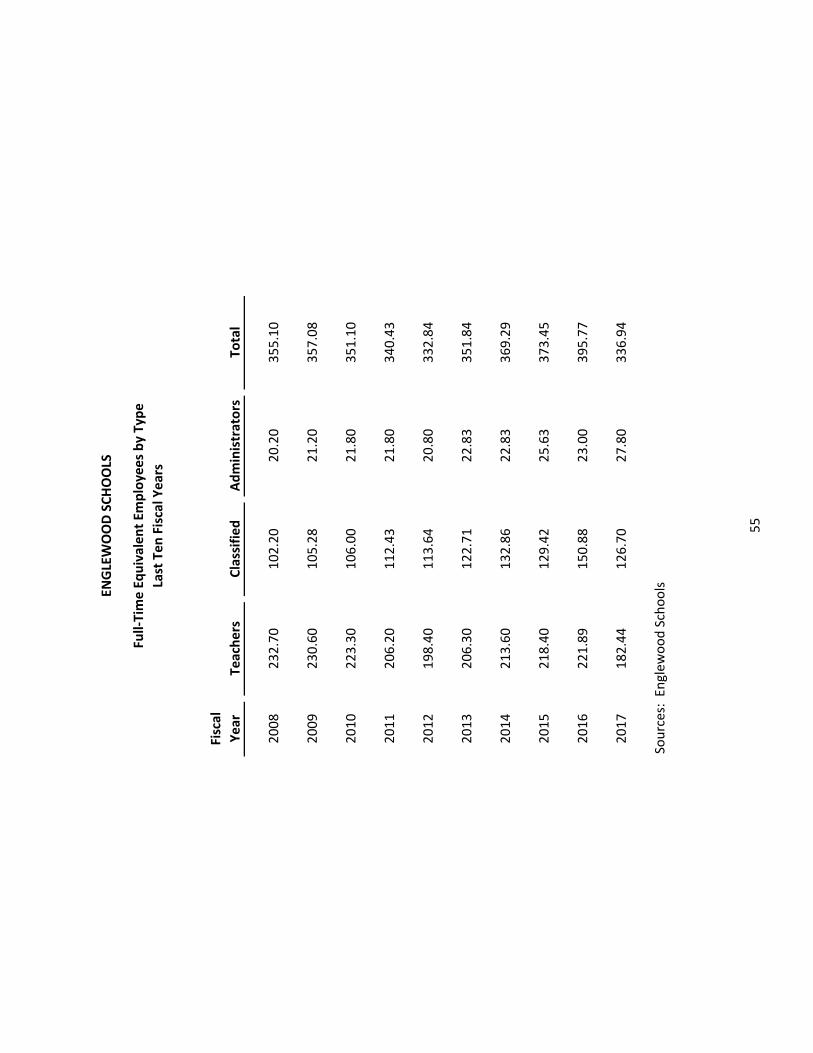
ENGLEWOOD SCHOOLS
Full‐Time Equivalent Em
ployees by Type
Last Ten Fiscal Years
Fiscal
Year
Teachers
Classified
Administrators
Total
2008
232.70
102.20
20.20
355.10
2009
230.60
105.28
21.20
357.08
2010
223.30
106.00
21.80
351.10
2011
206.20
112.43
21.80
340.43
2012
198.40
113.64
20.80
332.84
2013
206.30
122.71
22.83
351.84
2014
213.60
132.86
22.83
369.29
2015
218.40
129.42
25.63
373.45
2016
221.89
150.88
23.00
395.77
2017
182.44
126.70
27.80
336.94
Sources: Englew
ood Schools
55

ENGLEWOOD SCHOOLS
Operating Statistics
Last Ten Fiscal Years
Percentage
of
Students
Operating
Government‐
Government‐
Pupil/
Approved for
Fiscal
Operating
Cost per
Wide
Wide Cost
Teaching
Teacher
Free or Reduced
Year
Enrollm
ent
Expenditures
Pupil
Expenditures
per Pupil
Staff
Ratio
Lunch
2008
3,427
32,443,971
9,467
35,033,702
10,223
232.7
14.7
44.2%
2009
3,298
32,538,103
9,866
35,100,753
10,643
230.6
14.3
49.0%
2010
3,124
32,516,192
10,409
34,602,079
11,076
223.3
14.0
54.9%
2011
2,992
32,052,157
10,713
34,209,991
11,434
206.2
14.5
55.8%
2012
2,954
30,123,324
10,197
33,534,033
11,352
198.4
14.9
57.9%
2013
2,981
31,320,081
10,507
35,349,519
11,858
206.3
14.4
56.1%
2014
2,835
32,658,215
11,520
36,622,164
12,918
213.6
13.3
59.5%
2015 (1)
2,866
39,596,387
13,816
41,873,573
14,610
218.4
13.1
62.6%
2016*
2,779
35,407,380
12,741
39,595,001
14,248
221.9
12.5
62.6%
2017
2,759
56,367,402
20,430
58,711,784
21,280
182.4
15.1
62.6%
(1) During 2015 the Food Service and Tuition Funds were sw
itched
to Special Reven
ue Funds and the District
im
plemen
ted GASB
68.
* 2016 Restated
56

ENGLEWOOD SCHOOLS
Schedule of Insurance
June 30, 2017
07/1/16 ‐
Insurance
Policy
Start
Expire
Amount of
07/1/17
Company
Number
Date
Date
Type of Insurance
Coverage
Premium
CSD
SIP (1)
0301‐01‐00044
07/01/2016
07/01/2017
Comprehen
sive Gen
eral
137,549,836
$
104,850
$
Liability, Including Em
ployee
Ben
efit Program
s and
Athletic Participation
School Leaders Errors
2,000,000
28,970
& Omissions
CSD
SIP
0301‐01‐00044
07/01/2016
07/01/2017
Equipmen
t Breakdown
250,000,000
11,203
CSD
SIP
0301‐01‐00044
07/01/2016
07/01/2017
Employee Blanket Bond
100,000
894
CSD
SIP
0301‐01‐00044
07/01/2016
07/01/2017
Veh
icle Insurance
2,000,000
20,964
166,881
$
(1) Colorado School D
istrict Self‐Insurance Pool.
Source: Englew
ood School D
istrict
Term
of Insurance
57

ENGLEWOOD SCHOOLS
Cap
ital Asset Inform
ation
June 30, 2017
Schools Elementary
Buildings
4
Square feet
187,200
Capacity
1,668
Enrollm
ent
1,330
Percent capacity
80%
Middle / High
Buildings
1
Square feet
238,298
Capacity
1,200
Enrollm
ent
931
Percent capacity
78%
High
Buildings
1
Square feet
99,380
Capacity
704
Enrollm
ent
293
Percent capacity
42%
Early Child
hood Education Center
Buildings
1
Square feet
40,000
Capacity
364
Enrollm
ent
221
Percent capacity
61%
Administration Buildings
1
Square feet
13,800
Operations, m
aintenan
ce and transportation
Buildings
1
Square feet
8,400
Athletics
Athletic stadium
1
Baseb
all fields
1
Running tracks
1
Playgrounds
6
Excess property
Buildings
2
Square feet
44,800
Source: Englew
ood Schools
Note: Statistical section sched
ules norm
ally present ten years of data.
Only one year of statistics is presented here because the number of
facilities, size and capacity are essentially unchanged over that period.
58
COMPLIANCE SECTION

SINGLE AUDIT
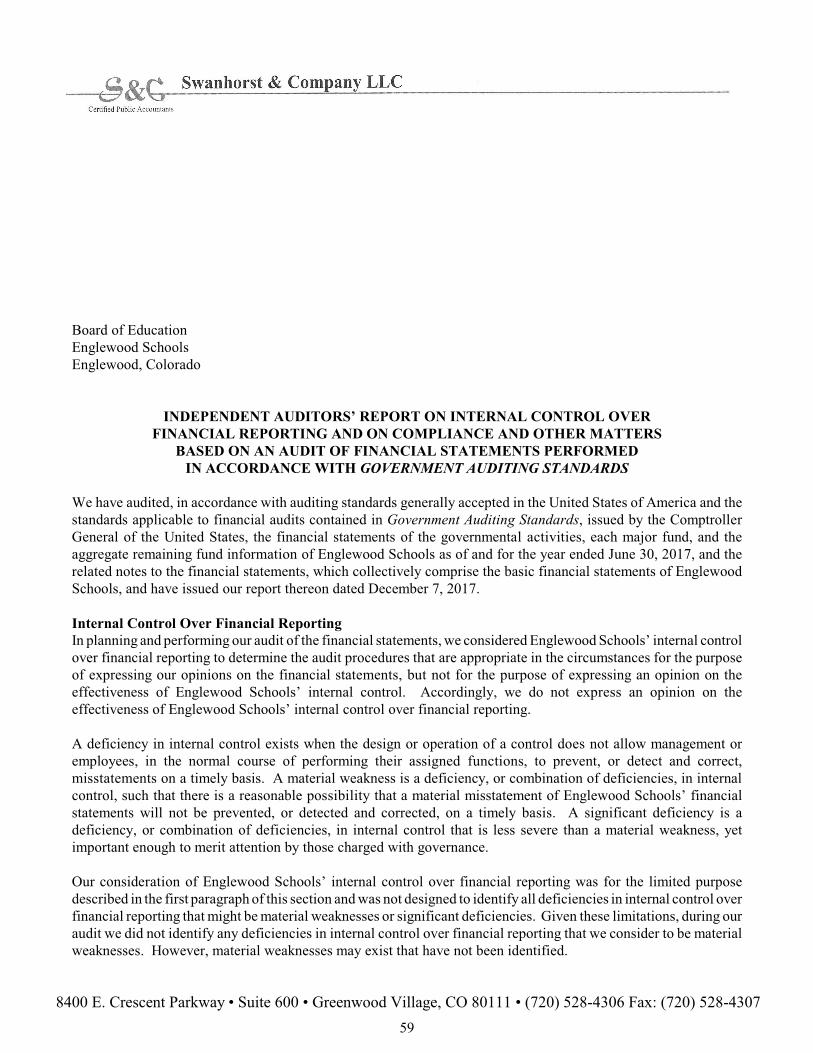
8400 E. Crescent Parkway • Suite 600 • Greenwood Village, CO 80111 • (720) 528-4306 Fax: (720) 528-4307
Board of EducationEnglewood SchoolsEnglewood, Colorado
INDEPENDENT AUDITORS’ REPORT ON INTERNAL CONTROL OVERFINANCIAL REPORTING AND ON COMPLIANCE AND OTHER MATTERS
BASED ON AN AUDIT OF FINANCIAL STATEMENTS PERFORMEDIN ACCORDANCE WITH GOVERNMENT AUDITING STANDARDS
We have audited, in accordance with auditing standards generally accepted in the United States of America and thestandards applicable to financial audits contained in Government Auditing Standards, issued by the ComptrollerGeneral of the United States, the financial statements of the governmental activities, each major fund, and theaggregate remaining fund information of Englewood Schools as of and for the year ended June 30, 2017, and therelated notes to the financial statements, which collectively comprise the basic financial statements of EnglewoodSchools, and have issued our report thereon dated December 7, 2017.
Internal Control Over Financial ReportingIn planning and performing our audit of the financial statements, we considered Englewood Schools’ internal controlover financial reporting to determine the audit procedures that are appropriate in the circumstances for the purposeof expressing our opinions on the financial statements, but not for the purpose of expressing an opinion on theeffectiveness of Englewood Schools’ internal control. Accordingly, we do not express an opinion on theeffectiveness of Englewood Schools’ internal control over financial reporting.
A deficiency in internal control exists when the design or operation of a control does not allow management oremployees, in the normal course of performing their assigned functions, to prevent, or detect and correct,misstatements on a timely basis. A material weakness is a deficiency, or combination of deficiencies, in internalcontrol, such that there is a reasonable possibility that a material misstatement of Englewood Schools’ financialstatements will not be prevented, or detected and corrected, on a timely basis. A significant deficiency is adeficiency, or combination of deficiencies, in internal control that is less severe than a material weakness, yetimportant enough to merit attention by those charged with governance.
Our consideration of Englewood Schools’ internal control over financial reporting was for the limited purposedescribed in the first paragraph of this section and was not designed to identify all deficiencies in internal control overfinancial reporting that might be material weaknesses or significant deficiencies. Given these limitations, during ouraudit we did not identify any deficiencies in internal control over financial reporting that we consider to be materialweaknesses. However, material weaknesses may exist that have not been identified.
59
60
Compliance and Other Matters
As part of obtaining reasonable assurance about whether Englewood Schools’ financial statements are free from
material misstatement, we performed tests of its compliance with certain provisions of laws, regulations, contracts
and grant agreements, noncompliance with which could have a direct and material effect on the determination of
financial statement amounts. However, providing an opinion on compliance with those provisions was not an
objective of our audit and, accordingly, we do not express such an opinion. The results of our tests disclosed no
instances of noncompliance or other matters that are required to be reported under Government Auditing Standards.
Purpose of this Report
The purpose of this report is solely to describe the scope of our testing of internal control and compliance and the
results of that testing, and not to provide an opinion on the effectiveness of Englewood Schools’ internal control or
on compliance. This report is an integral part of an audit performed in accordance with Government Auditing
Standards in considering Englewood Schools’ internal control and compliance. Accordingly, this report is not
suitable for any other purpose.
December 7, 2017
8400 E. Crescent Parkway • Suite 600 • Greenwood Village, CO 80111 • (720) 528-4306 Fax: (720) 528-4307
Board of EducationEnglewood SchoolsEnglewood, Colorado
INDEPENDENT AUDITORS’ REPORT ON COMPLIANCE FOR EACHMAJOR FEDERAL PROGRAM, INTERNAL CONTROL OVER COMPLIANCE,
AND THE SCHEDULE OF EXPENDITURES OF FEDERAL AWARDSREQUIRED BY THE UNIFORM GUIDANCE
Report on Compliance for Each Major Federal ProgramWe have audited Englewood Schools’ compliance with the types of compliance requirements described in the U.S.Office of Management and Budget (OMB) Compliance Supplement that could have a direct and material effect oneach of Englewood Schools’ major federal programs for the year ended June 30, 2017. Englewood Schools’ majorfederal programs are identified in the summary of auditors’ results section of the accompanying schedule of findingsand questioned costs.
Management’s ResponsibilityManagement is responsible for compliance with federal statutes, regulations, and the terms and conditions of thefederal awards applicable to its federal programs.
Auditors’ ResponsibilityOur responsibility is to express an opinion on compliance for each of Englewood Schools’ major federal programsbased on our audit of the types of compliance requirements referred to above. We conducted our audit of compliancein accordance with auditing standards generally accepted in the United States of America; the standards applicableto financial audits contained in Government Auditing Standards, issued by the Comptroller General of the UnitedStates; and the audit requirements of Title 2 U.S. Code of Federal Regulations Part 200, Uniform AdministrativeRequirements, Cost Principles, and Audit Requirements for Federal Awards (Uniform Guidance). Those standardsand the Uniform Guidance require that we plan and perform the audit to obtain reasonable assurance about whethernoncompliance with the types of compliance requirements referred to above that could have a direct and materialeffect on a major federal program occurred. An audit includes examining, on a test basis, evidence about EnglewoodSchools’ compliance with those requirements and performing such other procedures as we considered necessary inthe circumstances.
We believe that our audit provides a reasonable basis for our opinion on compliance for each major federal program.However, our audit does not provide a legal determination of Englewood Schools’ compliance.
61
62
Opinion on Each Major Federal ProgramIn our opinion, Englewood Schools complied, in all material respects, with the types of compliance requirementsreferred to above that could have a direct and material effect on each of its major federal programs for the year endedJune 30, 2017.
Other MattersThe results of our auditing procedures disclosed instances of noncompliance which are required to be reported inaccordance with the Uniform Guidance and which are described in the accompanying schedule of findings andquestioned costs as item 2017-001. Our opinion on each major federal program is not modified with respect to thesematters.
Englewood Schools’ response to the noncompliance finding identified in our audit is described in the accompanyingcorrective action plan. Englewood Schools’ response was not subjected to the auditing procedures applied in theaudit of compliance and, accordingly, we express no opinion on the response.
Report on Internal Control Over ComplianceManagement of Englewood Schools is responsible for establishing and maintaining effective internal control overcompliance with the types of compliance requirements referred to above. In planning and performing our audit ofcompliance, we considered Englewood Schools’ internal control over compliance with the types of requirements thatcould have a direct and material effect on each major federal program to determine the auditing procedures that areappropriate in the circumstances for the purpose of expressing an opinion on compliance for each major federalprogram and to test and report on internal control over compliance in accordance with the Uniform Guidance, butnot for the purpose of expressing an opinion on the effectiveness of internal control over compliance. Accordingly,we do not express an opinion on the effectiveness of Englewood Schools’ internal control over compliance.
A deficiency in internal control over compliance exists when the design or operation of a control over compliancedoes not allow management or employees, in the normal course of performing their assigned functions, to prevent,or detect and correct, noncompliance with a type of compliance requirement of a federal program on a timely basis.A material weakness in internal control over compliance is a deficiency, or combination of deficiencies, in internalcontrol over compliance such that there is a reasonable possibility that material noncompliance with a type ofcompliance requirement of a federal program will not be prevented, or detected and corrected, on a timely basis. Asignificant deficiency in internal control over compliance is a deficiency, or combination of deficiencies, in internalcontrol over compliance with a type of compliance requirement of a federal program that is less severe than a materialweakness in internal control over compliance, yet important enough to merit attention by those charged withgovernance.
Our consideration of Englewood Schools’ internal control over compliance was for the limited purpose describedin the first paragraph of this section and was not designed to identify all deficiencies in internal control overcompliance that might be material weaknesses or significant deficiencies. We did not identify any deficiencies ininternal control over compliance that we consider to be material weaknesses. However, material weaknesses mayexist that have not been identified.
The purpose of this report on internal control over compliance is solely to describe the scope of our testing of internalcontrol over compliance and the results of that testing based on the requirements of the Uniform Guidance.Accordingly, this report is not suitable for any other purpose.

63
Report on Schedule of Expenditures of Federal Awards Required by the Uniform Guidance
We have audited the financial statements of the governmental activities, each major fund, and the aggregate
remaining fund information of Englewood Schools as of and for the year ended June 30, 2017, and the related notes
to the financial statements, which collectively comprise the basic financial statements of Englewood Schools. We
issued our report thereon dated December 7, 2017, which contained unmodified opinions on those financial
statements. Our audit was conducted for the purpose of forming opinions on the financial statements that collectively
comprise Englewood Schools’ basic financial statements. The accompanying schedule of expenditures of federal
awards is presented for purposes of additional analysis as required by the Uniform Guidance and is not a required
part of the basic financial statements. Such information is the responsibility of management and was derived from
and relates directly to the underlying accounting and other records used to prepare the basic financial statements.
The information has been subjected to the auditing procedures applied in the audit of the basic financial statements
and certain additional procedures, including comparing and reconciling the information directly to the underlying
accounting and other records used to prepare the basic financial statements or to the basic financial statements
themselves, and other additional procedures in accordance with auditing standards generally accepted in the United
States of America. In our opinion, the schedule of expenditures of federal awards is fairly stated, in all material
respects, in relation to the basic financial statements as a whole.
December 7, 2017
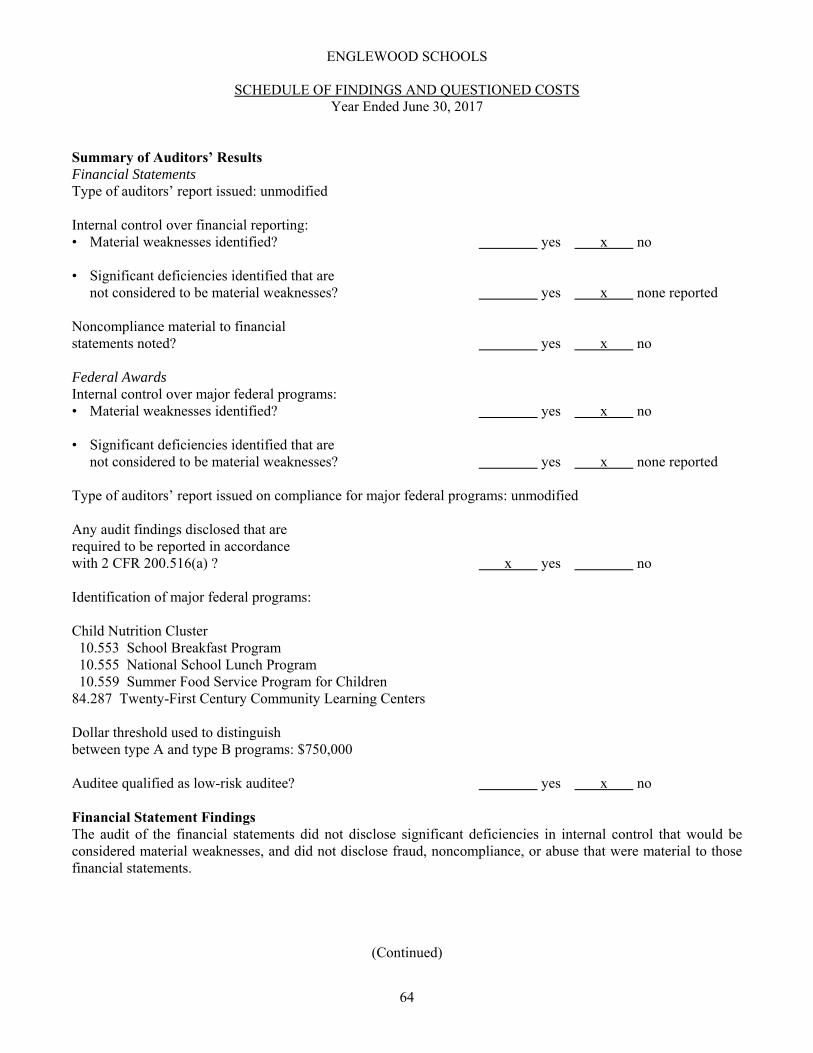
64
ENGLEWOOD SCHOOLS
SCHEDULE OF FINDINGS AND QUESTIONED COSTSYear Ended June 30, 2017
Summary of Auditors’ ResultsFinancial StatementsType of auditors’ report issued: unmodified
Internal control over financial reporting:• Material weaknesses identified? yes x no
• Significant deficiencies identified that arenot considered to be material weaknesses? yes x none reported
Noncompliance material to financialstatements noted? yes x no
Federal AwardsInternal control over major federal programs:• Material weaknesses identified? yes x no
• Significant deficiencies identified that are not considered to be material weaknesses? yes x none reported
Type of auditors’ report issued on compliance for major federal programs: unmodified
Any audit findings disclosed that arerequired to be reported in accordancewith 2 CFR 200.516(a) ? x yes no
Identification of major federal programs:
Child Nutrition Cluster 10.553 School Breakfast Program 10.555 National School Lunch Program 10.559 Summer Food Service Program for Children84.287 Twenty-First Century Community Learning Centers
Dollar threshold used to distinguishbetween type A and type B programs: $750,000
Auditee qualified as low-risk auditee? yes x no
Financial Statement FindingsThe audit of the financial statements did not disclose significant deficiencies in internal control that would beconsidered material weaknesses, and did not disclose fraud, noncompliance, or abuse that were material to thosefinancial statements.
(Continued)
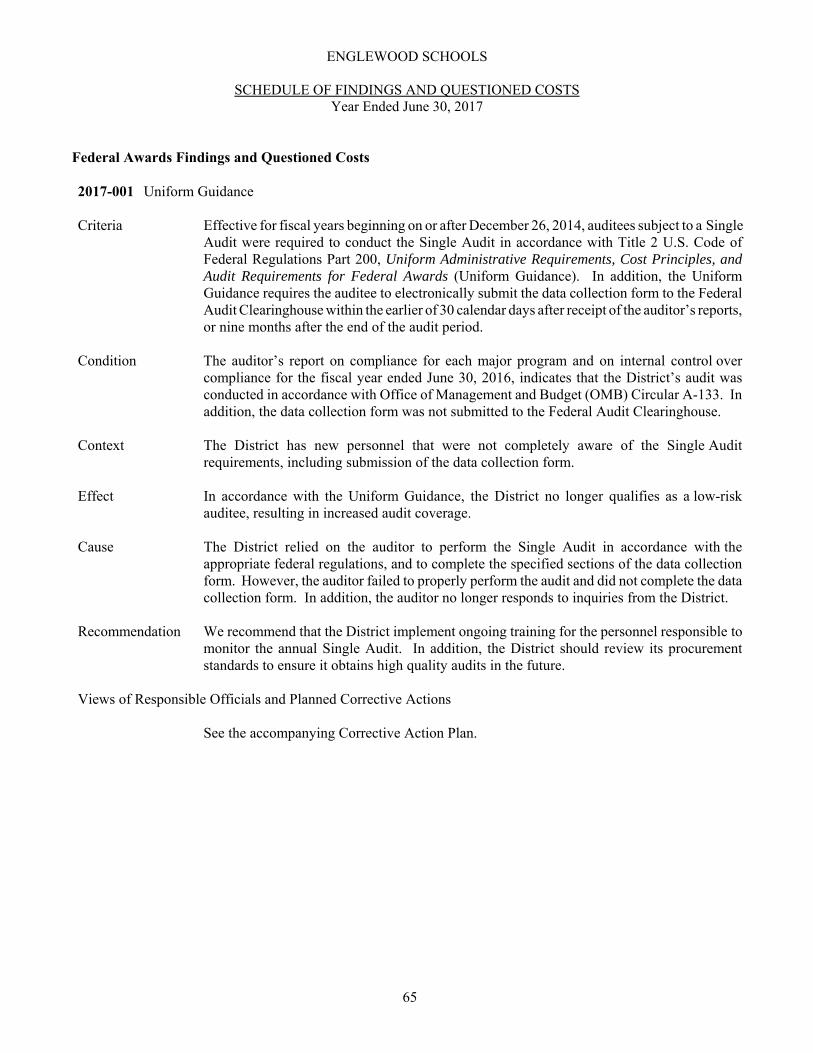
65
ENGLEWOOD SCHOOLS
SCHEDULE OF FINDINGS AND QUESTIONED COSTSYear Ended June 30, 2017
Federal Awards Findings and Questioned Costs
2017-001 Uniform Guidance
Criteria Effective for fiscal years beginning on or after December 26, 2014, auditees subject to a SingleAudit were required to conduct the Single Audit in accordance with Title 2 U.S. Code ofFederal Regulations Part 200, Uniform Administrative Requirements, Cost Principles, andAudit Requirements for Federal Awards (Uniform Guidance). In addition, the UniformGuidance requires the auditee to electronically submit the data collection form to the FederalAudit Clearinghouse within the earlier of 30 calendar days after receipt of the auditor’s reports,or nine months after the end of the audit period.
Condition The auditor’s report on compliance for each major program and on internal control overcompliance for the fiscal year ended June 30, 2016, indicates that the District’s audit wasconducted in accordance with Office of Management and Budget (OMB) Circular A-133. Inaddition, the data collection form was not submitted to the Federal Audit Clearinghouse.
Context The District has new personnel that were not completely aware of the Single Auditrequirements, including submission of the data collection form.
Effect In accordance with the Uniform Guidance, the District no longer qualifies as a low-riskauditee, resulting in increased audit coverage.
Cause The District relied on the auditor to perform the Single Audit in accordance with theappropriate federal regulations, and to complete the specified sections of the data collectionform. However, the auditor failed to properly perform the audit and did not complete the datacollection form. In addition, the auditor no longer responds to inquiries from the District.
Recommendation We recommend that the District implement ongoing training for the personnel responsible tomonitor the annual Single Audit. In addition, the District should review its procurementstandards to ensure it obtains high quality audits in the future.
Views of Responsible Officials and Planned Corrective Actions
See the accompanying Corrective Action Plan.

Englewood Schools
Belong and Thrive
66
Sosan G. Schaller Chief Financial Officer 4101 South Bannock Street Englewood, Colorado 80110 303.806.2014
Federal Audit Finding - Corrective Action Plan
Staff has been made aware of Single Federal Audit reporting requirements and has put into place safeguards to ensure future filing mandates are met in a timely manner.

Pass-Through FederalEntity Identifying CFDA
Federal Grantor/Pass-Through Grantor/Program Title Number Number Disbursements
U.S. Department of EducationPassed through Colorado Department of Education Title I 4010/5010 84.010 737,208$ Special Education Cluster Special Education 4027 84.027 676,596 Special Education Preschool 4173 84.173 26,136 Twenty-First Century Community Learning Centers 5287 84.287 457,829 High School Graduation Initiative 5360 84.360 230 Supporting Effective Instruction 4367 84.367 168,103 English Language Acquisition 4365 84.365 22,088
Passed through Colorado Community College System Career and Technical Education 84.048 23,681
TOTAL U.S. DEPARTMENT OF EDUCATION 2,111,871
U.S. Department of AgricultureChild Nutrition Cluster Passed through Colorado Department of Human Services Food Commodities 10.555 81,274
Passed through Colorado Department of Education School Breakfast Program 4553 10.553 351,940 National School Lunch Program 4555 10.555 556,512 Summer Food Service Program for Children 4559 10.559 14,810 Passed through Colorado Department of Education Fresh Fruit and Vegetable Program 4582 10.582 15,680
TOTAL U.S. DEPARTMENT OF AGRICULTURE 1,020,216
U.S. Department of Health and Human ServicesPassed through Sheridan School District Head Start 93.600 304,093
TOTAL U.S. DEPARTMENT OF HEALTH AND HUMAN SERVICES 304,093
U.S. Department of TransportationPassed through Colorado Department of Transportation Highway Planning and Construction Cluster Highway Planning and Construction 20.205 14,456
TOTAL U.S. DEPARTMENT OF TRANSPORTATION 14,456
TOTAL FEDERAL FINANCIAL ASSISTANCE 3,450,636$
ENGLEWOOD SCHOOLS
SCHEDULE OF EXPENDITURES OF FEDERAL AWARDSYear Ended June 30, 2017
See the accompanying Independent Auditors' Report.
67
68
ENGLEWOOD SCHOOLS
NOTES TO SCHEDULE OF EXPENDITURES OF FEDERAL AWARDSJune 30, 2017
NOTE 1: BASIS OF PRESENTATION
The accompanying schedule of expenditures of federal awards is presented in accordance with therequirements of Title 2 U.S. Code of Federal Regulations Part 200, Uniform AdministrativeRequirements, Cost Principles, and Audit Requirements for Federal Awards, using the accrual basisof accounting. Therefore, some amounts presented in this schedule may differ from amounts presentedin the financial statements. The District does not charge a de minimis indirect cost rate.

STATE COMPLIANCE
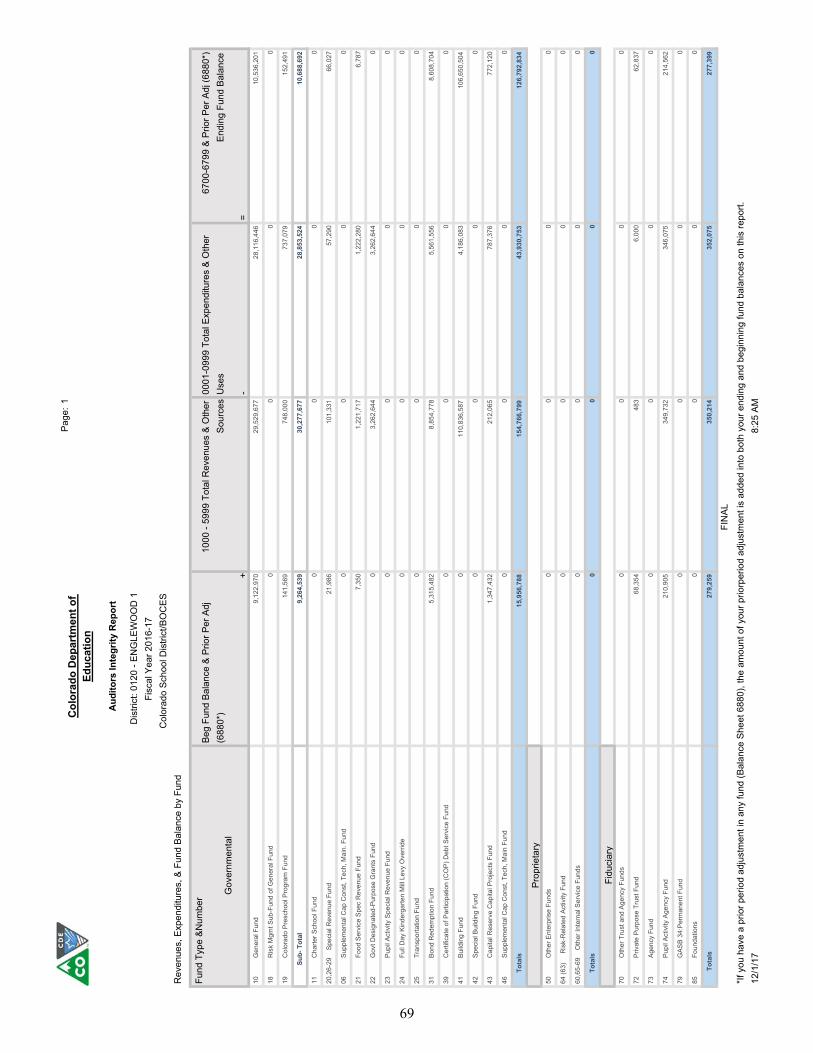
Aud
itors
Inte
grity
Rep
ort
Dis
trict
: 012
0 - E
NG
LEW
OO
D 1
Fisc
al Y
ear 2
016-
17C
olor
ado
Scho
ol D
istri
ct/B
OC
ES
Fund
Typ
e &N
umbe
r Gov
ernm
enta
l+
-=
10
Gen
eral
Fun
d9,
122,
970
29,5
29,6
7728
,116
,446
10,5
36,2
01
18
Ris
k M
gmt S
ub-F
und
of G
ener
al F
und
00
00
19
Col
orad
o Pr
esch
ool P
rogr
am F
und
141,
569
748,
000
737,
079
152,
491
S
ub- T
otal
9,26
4,53
930
,277
,677
28,8
53,5
2410
,688
,692
11
Cha
rter S
choo
l Fun
d0
00
0
20,2
6-29
S
peci
al R
even
ue F
und
21,9
8610
1,33
157
,290
66,0
27
06
Sup
plem
enta
l Cap
Con
st, T
ech,
Mai
n. F
und
00
00
21
Foo
d Se
rvic
e Sp
ec R
even
ue F
und
7,35
01,
221,
717
1,22
2,28
06,
787
22
Gov
t Des
igna
ted-
Purp
ose
Gra
nts
Fund
03,
262,
644
3,26
2,64
40
23
Pup
il Ac
tivity
Spe
cial
Rev
enue
Fun
d0
00
0
24
Ful
l Day
Kin
derg
arte
n M
ill Le
vy O
verri
de0
00
0
25
Tra
nspo
rtatio
n Fu
nd0
00
0
31
Bon
d R
edem
ptio
n Fu
nd5,
315,
482
8,85
4,77
85,
561,
556
8,60
8,70
4
39
Cer
tific
ate
of P
artic
ipat
ion
(CO
P) D
ebt S
ervi
ce F
und
00
00
41
Bui
ldin
g Fu
nd0
110,
836,
587
4,18
6,08
310
6,65
0,50
4
42
Spe
cial
Bui
ldin
g Fu
nd0
00
0
43
Cap
ital R
eser
ve C
apita
l Pro
ject
s Fu
nd1,
347,
432
212,
065
787,
376
772,
120
46
Sup
plem
enta
l Cap
Con
st, T
ech,
Mai
n Fu
nd0
00
0
Tota
ls15
,956
,788
154,
766,
799
43,9
30,7
5312
6,79
2,83
4
Prop
rieta
ry50
O
ther
Ent
erpr
ise
Fund
s0
00
0
64 (6
3)
Ris
k-R
elat
ed A
ctiv
ity F
und
00
00
60,6
5-69
O
ther
Inte
rnal
Ser
vice
Fun
ds0
00
0
Tota
ls0
00
0
Fidu
ciar
y70
O
ther
Tru
st a
nd A
genc
y Fu
nds
00
00
72
Priv
ate
Purp
ose
Trus
t Fun
d68
,354
483
6,00
062
,837
73
Age
ncy
Fund
00
00
74
Pup
il Ac
tivity
Age
ncy
Fund
210,
905
349,
732
346,
075
214,
562
79
GAS
B 34
:Per
man
ent F
und
00
00
85
Fou
ndat
ions
00
00
Tot
als
279,
259
350,
214
352,
075
277,
399
12/1
/17
8:25
AM
FIN
AL
*If y
ou h
ave
a pr
ior p
erio
d ad
just
men
t in
any
fund
(Bal
ance
She
et 6
880)
, the
am
ount
of y
our p
riorp
erio
d ad
just
men
t is
adde
d in
to b
oth
your
end
ing
and
begi
nnin
g fu
nd b
alan
ces
on th
is re
port.
Col
orad
o D
epar
tmen
t of
Educ
atio
n
Page
: 1
Rev
enue
s, E
xpen
ditu
res,
& F
und
Bala
nce
by F
und
Beg
Fund
Bal
ance
& P
rior P
er A
dj
(688
0*)
1000
- 59
99 T
otal
Rev
enue
s &
Oth
er
Sour
ces
0001
-099
9 To
tal E
xpen
ditu
res
& O
ther
U
ses
6700
-679
9 &
Prio
r Per
Adj
(688
0*)
Endi
ng F
und
Bala
nce
69