approach of design influence on air flow rate through the...
TRANSCRIPT
Approach of design influence on air flow rate through the heat
exchangers
Ricardo de Oliveira Silva1, Thaís Piva de Castro2, Paulo Marcel Alves Bandeira1, Diego
Erberelli3, Carlos Teófilo Salinas Sedano4
1Volkswagen do Brasil Indústria de Veículos Automotores Ltda. 2Engbras Software e Projetos Ltda. 3MAHLE Behr Gerenciamento Térmico Brasil Ltda. 4UNICAMP
E-mails: [email protected], [email protected]
[email protected], [email protected],
Abstract
The heat exchangers are responsible by the thermal equilibrium in an internal
combustion engine, but it is important to emphasize, that this property is directly
influenced by the air mass flow rate which passes through heat exchanger, given a
specific coolant flux and heat exchanger geometry. The present work aims to show the
influence of vehicle components, such as air deflectors, fan, radiator’s shroud, grilles
and gaskets on air mass flow rate passing through the heat exchangers and their
consequences on ITD (Inlet Difference Temperature) estimation. This influence was
quantified using CFD (Computational Fluid Dynamics) and 1-D simulation analysis of
vehicle under-hood. The simulations were performed in top speed condition of the
vehicle, which characterizes full throttle of the engine and 50kW of rejected heat. The
analysis allows to state that an increment of air flux was possible reducing leakage and
redirecting the air flux.
1. Introduction
A model of vehicle can show different versions, simply making changes of
radius of the wheels, types of tires, set of grilles and bumpers, hoods and headlights, for
example. These changes can define versions of luxury, sportive, family, off-roader or an
economy car. Furthermore it is important to highlight the possibility of different setups
of powertrain, so that each one of these configurations has significant influence on
thermal management of the vehicle and its employment in a specific climate zone (hot
and temperate lands).
Such premises of operation require some care of sizing of the cooling package.
For a better practice of sizing, it is recommended to use CAE resources like CFD and 1-
D analysis, whenever component like radiators, condensers, fans, shrouds, air flow
deflectors, thermostatic valves, expansion tanks and gaskets are been chosen.
The applicability of the simulation (CFD) allows forecasting the quantity of air
mass flow rate which passes through the radiator, one of the variables in the formula of
the heat gained by the air which can be expressed as:
).(. aoaipaaa TTcmQ Eq. 01
Where:
aQ = Overall heat transfer of the air (kW);
am = air mass flow rate (kg/s);
pac = Specific heat capacity of the air (kJ/kg.K);
aiT = Temperature of the air inlet (K);
aoT = Temperature of the air outlet (K);
The performance of a heat exchanger can be determined by examining the heat
loss and gain that takes place between its working fluids:
The lost by the coolant can be expressed as:
).(. cocipccc TTcmQ Eq. 02
Where:
cQ = Overall heat transfer of the coolant (kW);
cm = coolant mass flow rate (kg/s);
pcc = Specific heat capacity (kJ/kg.K)
ciT = Temperature of the coolant inlet (K);
coT = Temperature of the coolant outlet (K);
The heat loss and gain are calculated by software which uses the concept of
block’s diagram (1-D simulation).
This software uses the following input data:
a) coolant pump map;
b) fan map;
c) the lift curve of the thermostatic valve;
d) the map of rejected heat by the engine in different conditions of operation
(engine speed, torque and power);
e) the geometry of the hoses;
f) the curves of backpressure of the engine jacket;
g) the curves of backpressure of the radiator (air side);
h) the curves of backpressure of the radiator (coolant side);
i) condenser parameters, similar of the radiator;
The 1-D simulation makes a compilation of these data searching or estimating
the point of working of the vehicle.
The parameter ITD is defined by -NTU method of sizing of the heat exchangers
which can be expressed by:
).(min.
.min.
aici TTCQ
ITDCQ
Eq. 03
Where:
= effectiveness;
minC = The smaller capacity rate between air and coolant.
paaa
pccc
cmC
cmC
.
.
Where:
cC = Capacity rate of the coolant side;
cC = Capacity rate of the air side.
The effectiveness is given by:
aici TTCQ
Q
Q
.minmax
max
Where maxQ is the maximum quantity of heat transfer possible.
The parameter of ITD is usually employed to specify if a vehicle and its cooling
system is able to be used in a determinate condition. For top speed condition for
example with 45 °C of ambient temperature and 30% of relative humidity, the
recommended value of ITD is 75K.
More details of -NTU method can be seen in Kanefsky et al. (1999).
The reduction of engineering costs using simulation is widely proved and
represents more one attractive point for its application, mainly during the phase of
development avoiding costs of experimental tests and prototypes.
2. Underhood simulation for cooling system
CFD simulation
In principle it is necessary to know what vehicle (model and version) will be
simulated and the condition which the vehicle will be studied. In our example it is been
studied a vehicle in top-speed (185km/h, with 45°C and 40% of relative humidity).
After, it is prepared the geometry of the vehicle, in order to have a representative
virtual model.
In this phase of the process of simulation, the geometry imported from CAD,
(independently of the software of CAD) are inappropriate for CFD simulation.
In some case these geometric problems are increased when the model are
exported using “.stl” file extension.
Normally these geometries show the following type of surface problems which
can be repaired manually by the own software of CFD:
Free edges.
Zip edges or fill holes with new triangles.
Intersecting surfaces.
Intersect then delete surfaces.
Imprint surfaces and edges onto target surfaces/bodies.
Surfaces can be split and combined to create required boundaries.
The process to clean a surface could expend a lot of time, if this procedure is
usually performed manually, therefore it is recommended to use some resources to
repair surface which is available in the package of the software. The software used for
the proposed simulation is the Star CCM+ which has a resource called wrapping.
The wrapping tool tries to solve every problem found among the cells of the
virtual model.
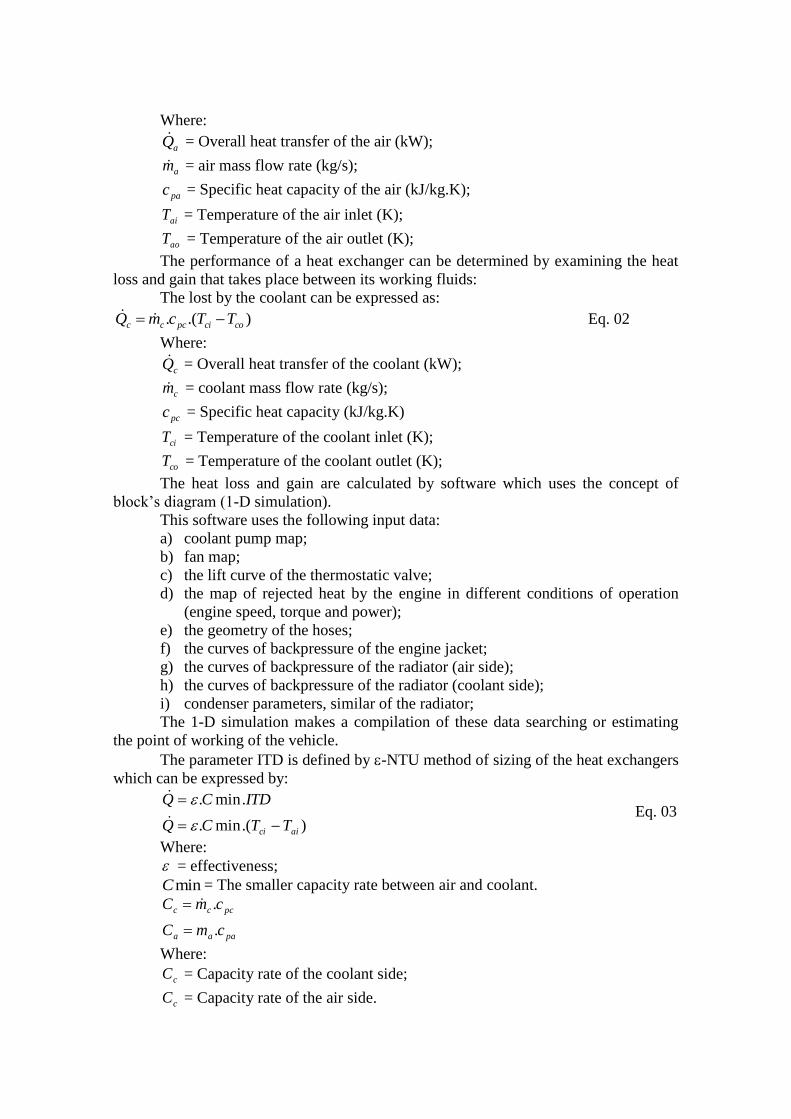
In the fig. 1, extracted from Mouffouk (2014), it is possible to notice the
difference between surfaces after and before the process of wrapping.
Each one of the components of the vehicle receives a specific setup of surface
mesh condition, with a specific surface size.
This procedure is adopted just for the surficial mesh of the vehicle which solves
mainly problems such as:
Pierced faces;
Free edges;
Non-manifold edges;
Non-manifold vertices.
Figure 1 – The difference between the imported CAD surface after wrapper and before the
wrapper [6].
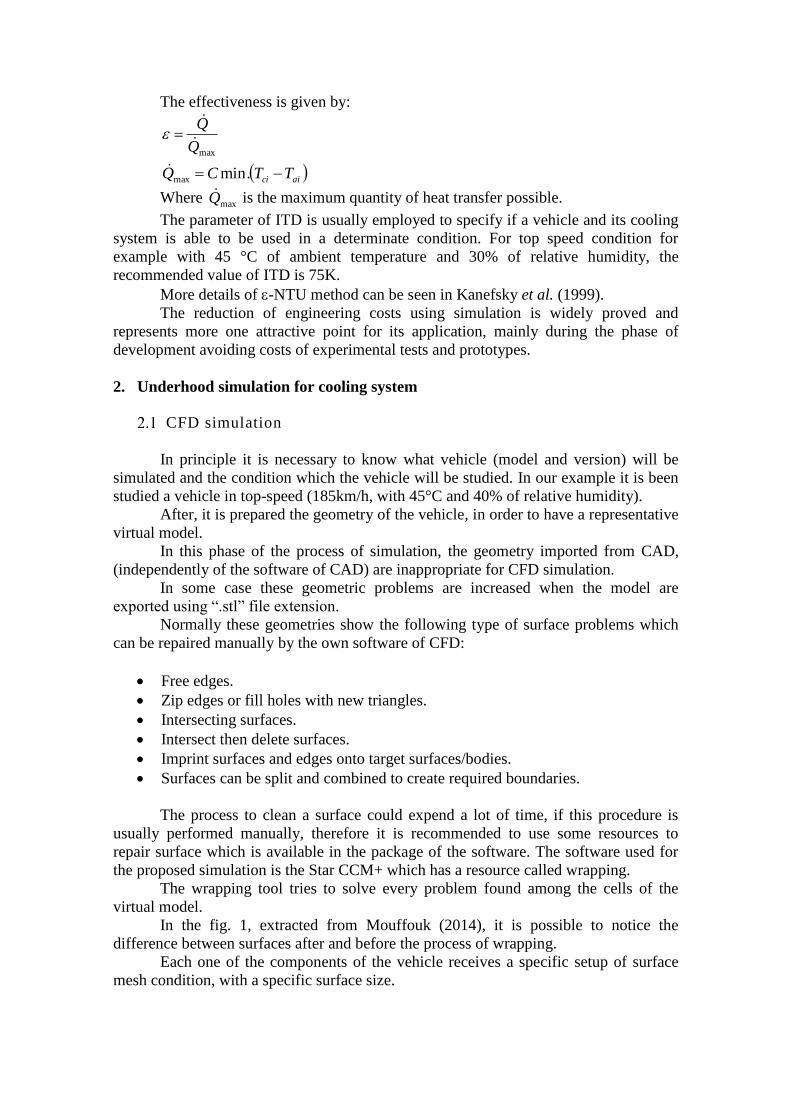
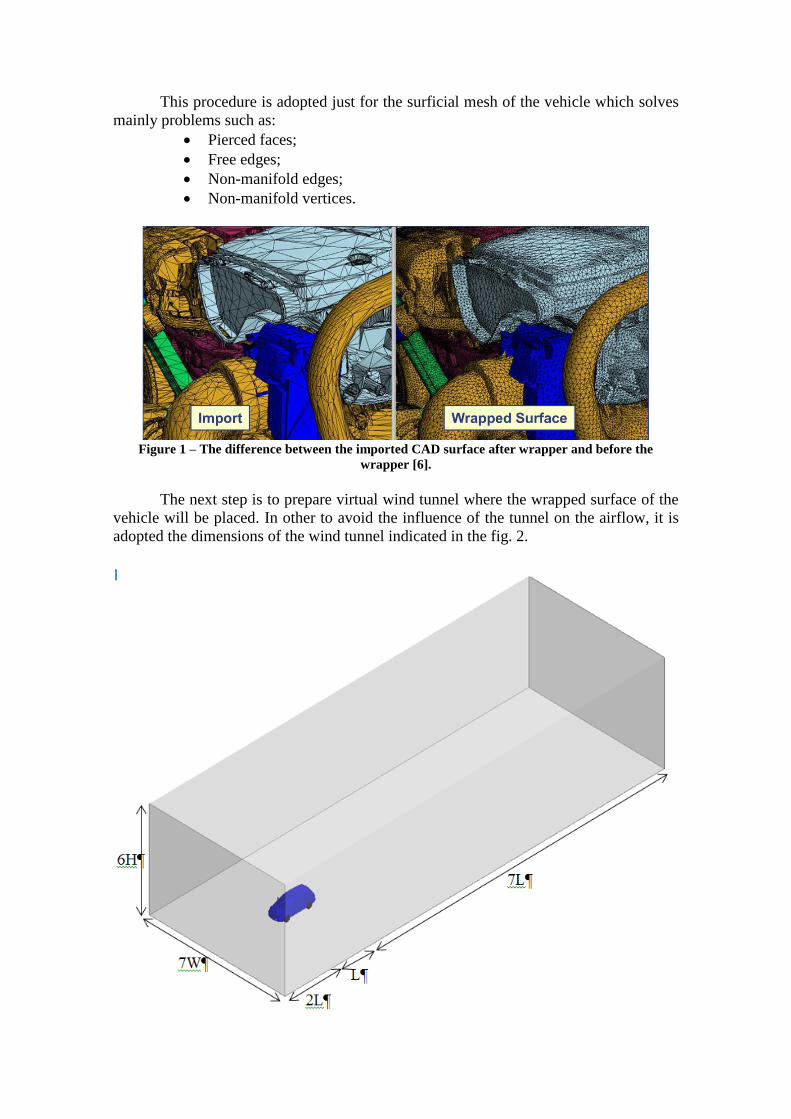
The next step is to prepare virtual wind tunnel where the wrapped surface of the
vehicle will be placed. In other to avoid the influence of the tunnel on the airflow, it is
adopted the dimensions of the wind tunnel indicated in the fig. 2.
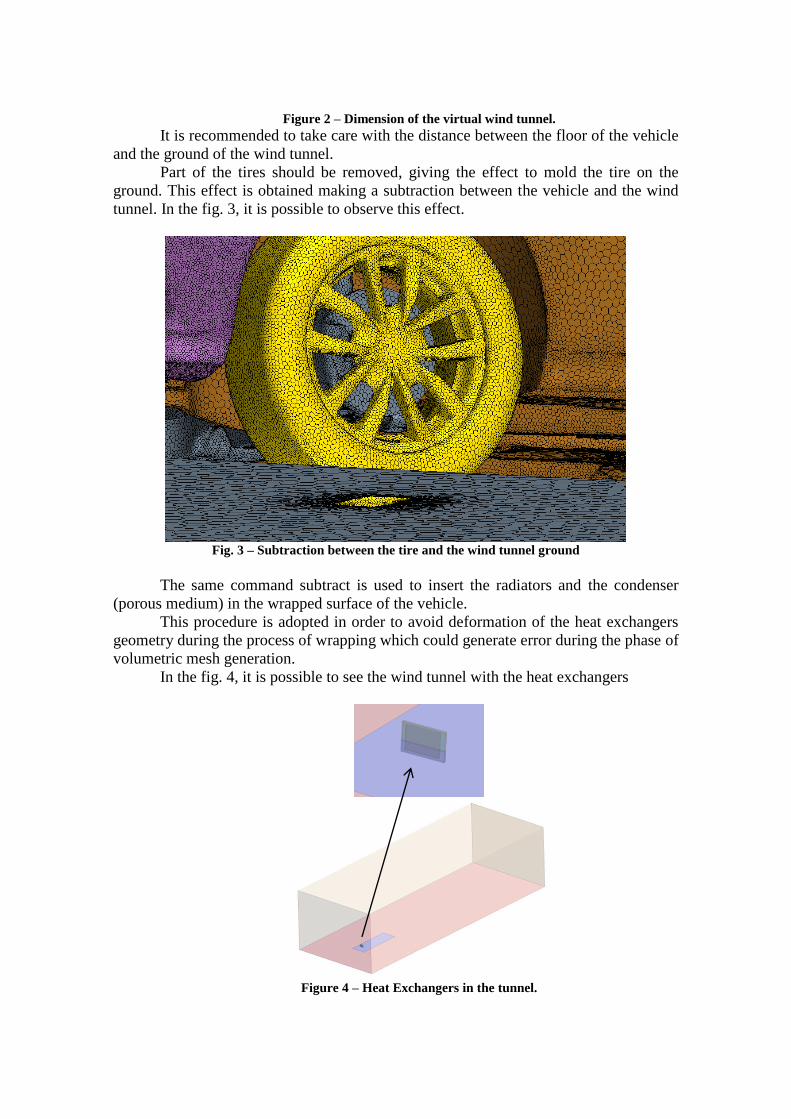
Figure 2 – Dimension of the virtual wind tunnel.
It is recommended to take care with the distance between the floor of the vehicle
and the ground of the wind tunnel.
Part of the tires should be removed, giving the effect to mold the tire on the
ground. This effect is obtained making a subtraction between the vehicle and the wind
tunnel. In the fig. 3, it is possible to observe this effect.
Fig. 3 – Subtraction between the tire and the wind tunnel ground
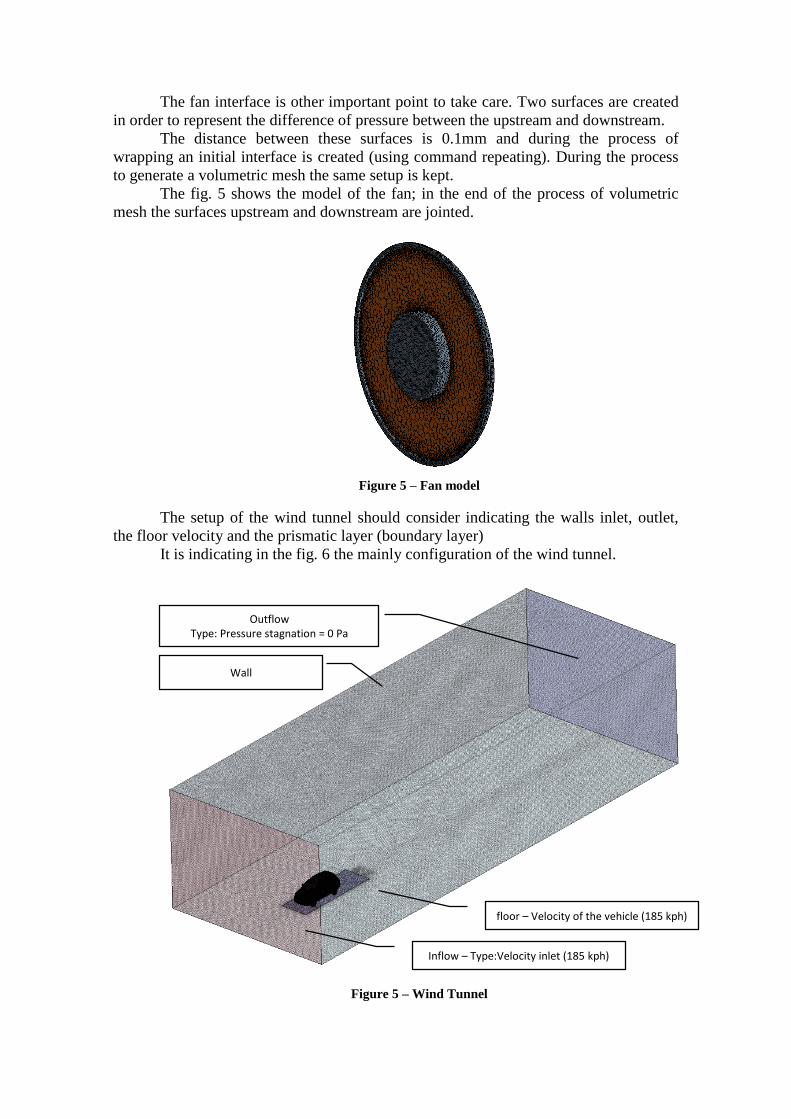
The same command subtract is used to insert the radiators and the condenser
(porous medium) in the wrapped surface of the vehicle.
This procedure is adopted in order to avoid deformation of the heat exchangers
geometry during the process of wrapping which could generate error during the phase of
volumetric mesh generation.
In the fig. 4, it is possible to see the wind tunnel with the heat exchangers
Figure 4 – Heat Exchangers in the tunnel.
The fan interface is other important point to take care. Two surfaces are created
in order to represent the difference of pressure between the upstream and downstream.
The distance between these surfaces is 0.1mm and during the process of
wrapping an initial interface is created (using command repeating). During the process
to generate a volumetric mesh the same setup is kept.
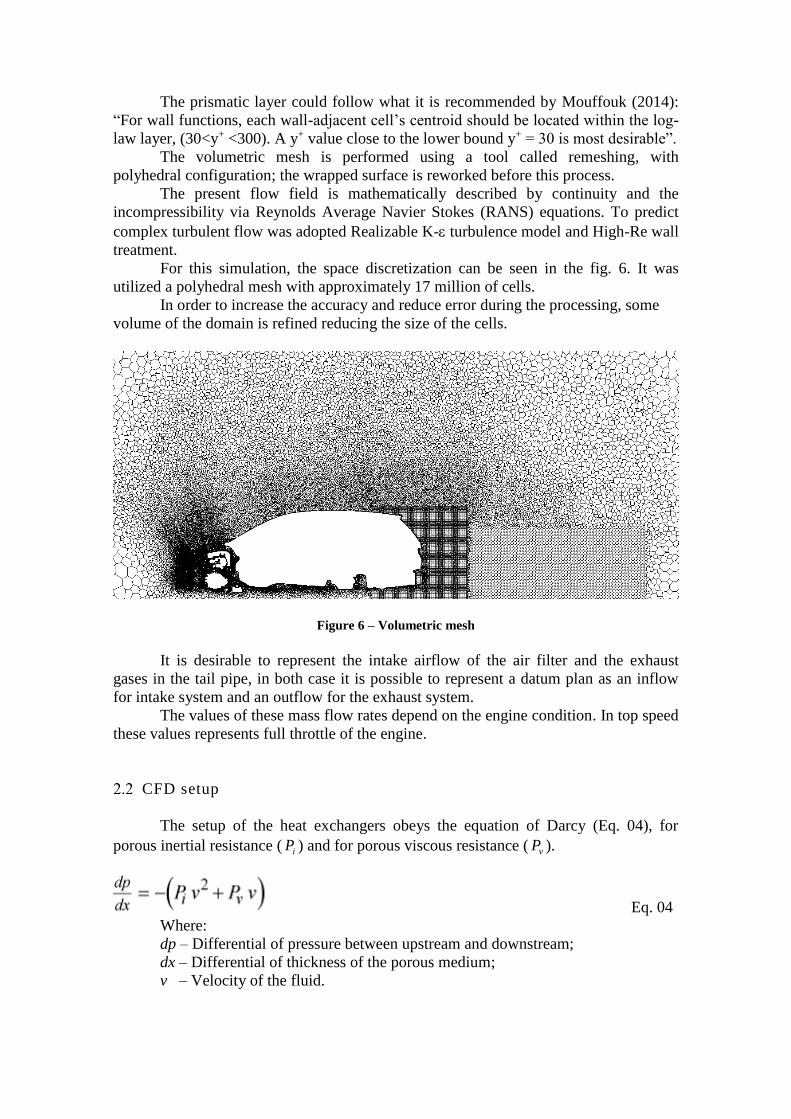
The fig. 5 shows the model of the fan; in the end of the process of volumetric
mesh the surfaces upstream and downstream are jointed.
Figure 5 – Fan model
The setup of the wind tunnel should consider indicating the walls inlet, outlet,
the floor velocity and the prismatic layer (boundary layer)
It is indicating in the fig. 6 the mainly configuration of the wind tunnel.
Figure 5 – Wind Tunnel
Inflow – Type:Velocity inlet (185 kph)
Outflow Type: Pressure stagnation = 0 Pa
floor – Velocity of the vehicle (185 kph)
Wall
The prismatic layer could follow what it is recommended by Mouffouk (2014):
“For wall functions, each wall-adjacent cell’s centroid should be located within the log-
law layer, (30<y+ <300). A y+ value close to the lower bound y+ = 30 is most desirable”.
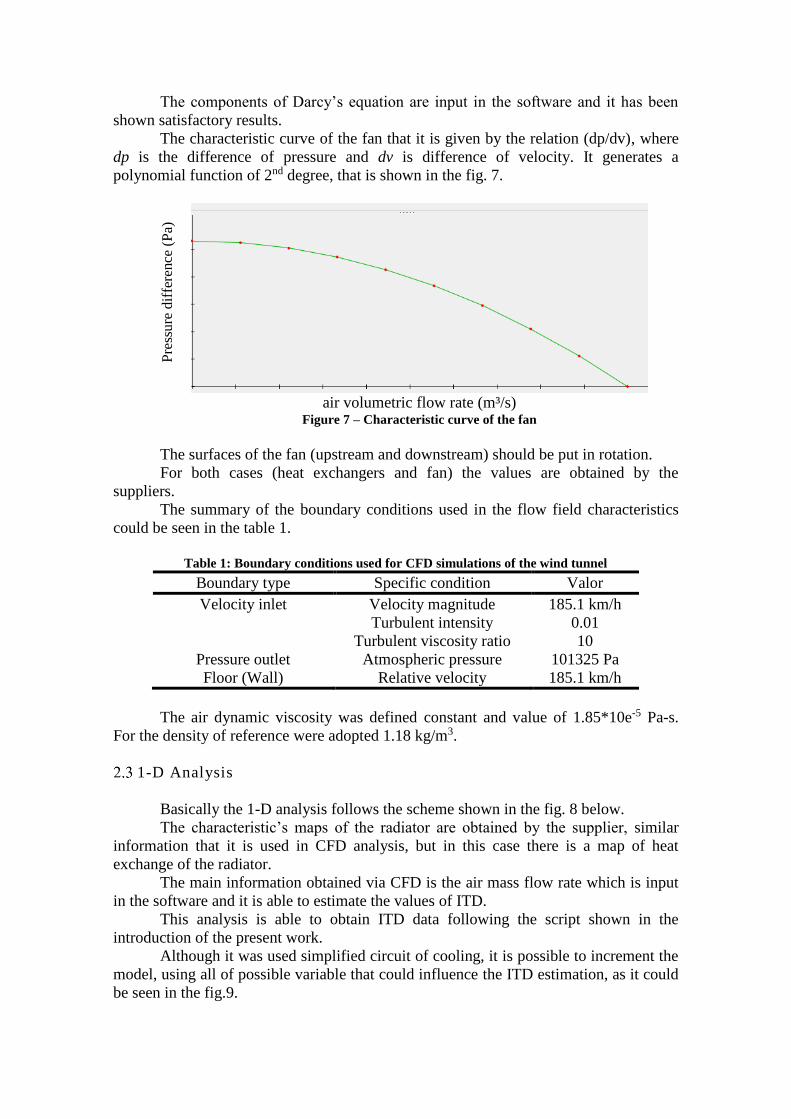
The volumetric mesh is performed using a tool called remeshing, with
polyhedral configuration; the wrapped surface is reworked before this process.
The present flow field is mathematically described by continuity and the
incompressibility via Reynolds Average Navier Stokes (RANS) equations. To predict
complex turbulent flow was adopted Realizable K- turbulence model and High-Re wall
treatment.
For this simulation, the space discretization can be seen in the fig. 6. It was
utilized a polyhedral mesh with approximately 17 million of cells.
In order to increase the accuracy and reduce error during the processing, some
volume of the domain is refined reducing the size of the cells.
Figure 6 – Volumetric mesh
It is desirable to represent the intake airflow of the air filter and the exhaust
gases in the tail pipe, in both case it is possible to represent a datum plan as an inflow
for intake system and an outflow for the exhaust system.
The values of these mass flow rates depend on the engine condition. In top speed
these values represents full throttle of the engine.
CFD setup
The setup of the heat exchangers obeys the equation of Darcy (Eq. 04), for
porous inertial resistance ( iP ) and for porous viscous resistance ( vP ).
Eq. 04
Where:
dp – Differential of pressure between upstream and downstream;
dx – Differential of thickness of the porous medium;
v – Velocity of the fluid.
15m
The components of Darcy’s equation are input in the software and it has been
shown satisfactory results.
The characteristic curve of the fan that it is given by the relation (dp/dv), where
dp is the difference of pressure and dv is difference of velocity. It generates a
polynomial function of 2nd degree, that is shown in the fig. 7.
air volumetric flow rate (m³/s)
Figure 7 – Characteristic curve of the fan
The surfaces of the fan (upstream and downstream) should be put in rotation.
For both cases (heat exchangers and fan) the values are obtained by the
suppliers.
The summary of the boundary conditions used in the flow field characteristics
could be seen in the table 1.
Table 1: Boundary conditions used for CFD simulations of the wind tunnel
Boundary type Specific condition Valor
Velocity inlet Velocity magnitude 185.1 km/h
Turbulent intensity 0.01
Turbulent viscosity ratio 10
Pressure outlet Atmospheric pressure 101325 Pa
Floor (Wall) Relative velocity 185.1 km/h
The air dynamic viscosity was defined constant and value of 1.85*10e-5 Pa-s.
For the density of reference were adopted 1.18 kg/m3.
1-D Analysis
Basically the 1-D analysis follows the scheme shown in the fig. 8 below.
The characteristic’s maps of the radiator are obtained by the supplier, similar
information that it is used in CFD analysis, but in this case there is a map of heat
exchange of the radiator.
The main information obtained via CFD is the air mass flow rate which is input
in the software and it is able to estimate the values of ITD.
This analysis is able to obtain ITD data following the script shown in the
introduction of the present work.
Although it was used simplified circuit of cooling, it is possible to increment the
model, using all of possible variable that could influence the ITD estimation, as it could
be seen in the fig.9.
Pre
ssu
re d
iffe
rence
(P
a)
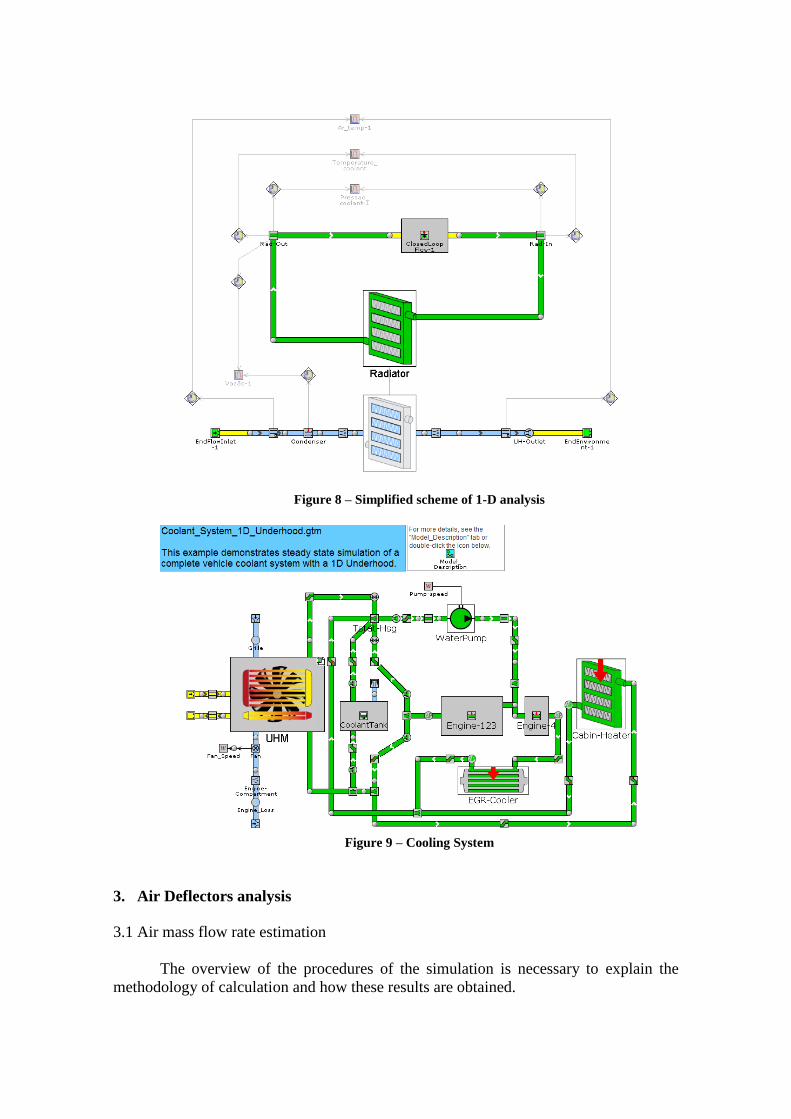
Figure 8 – Simplified scheme of 1-D analysis
Figure 9 – Cooling System
3. Air Deflectors analysis 3.1 Air mass flow rate estimation
The overview of the procedures of the simulation is necessary to explain the
methodology of calculation and how these results are obtained.
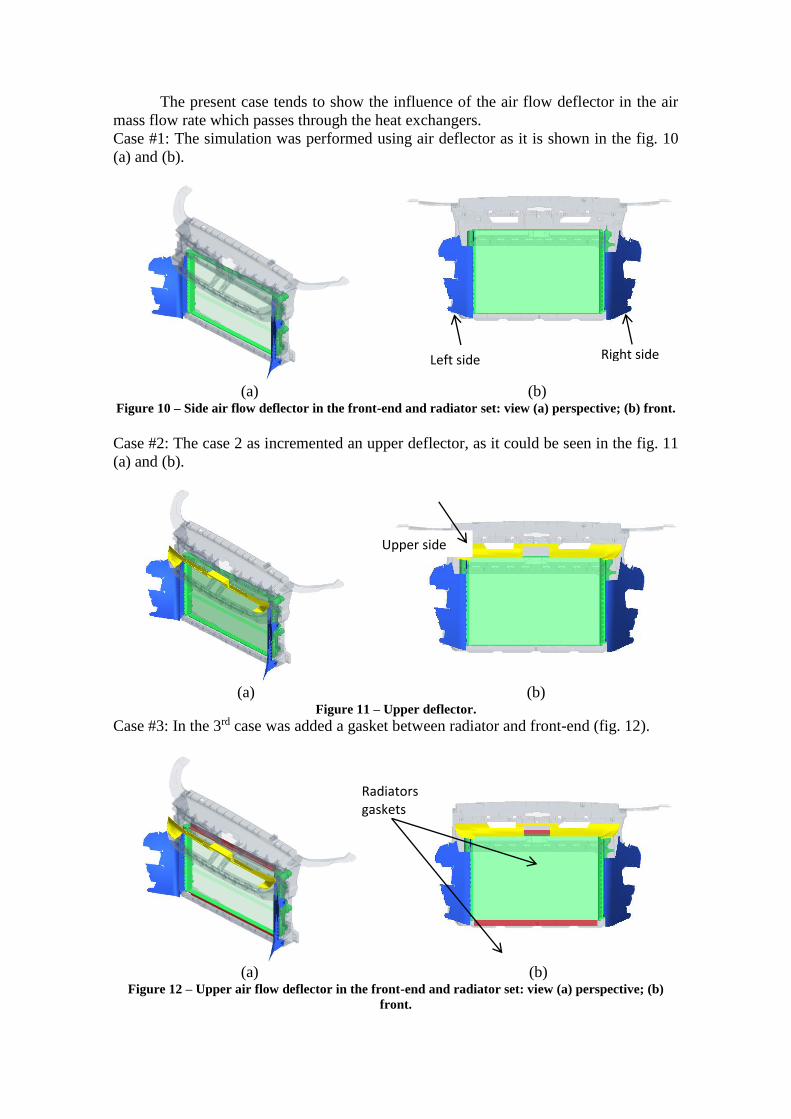
The present case tends to show the influence of the air flow deflector in the air
mass flow rate which passes through the heat exchangers.
Case #1: The simulation was performed using air deflector as it is shown in the fig. 10
(a) and (b).
(a) (b) Figure 10 – Side air flow deflector in the front-end and radiator set: view (a) perspective; (b) front.
Case #2: The case 2 as incremented an upper deflector, as it could be seen in the fig. 11
(a) and (b).
(a) (b) Figure 11 – Upper deflector.
Case #3: In the 3rd case was added a gasket between radiator and front-end (fig. 12).
(a) (b) Figure 12 – Upper air flow deflector in the front-end and radiator set: view (a) perspective; (b)
front.
Right side Left side
Upper side
Radiators gaskets
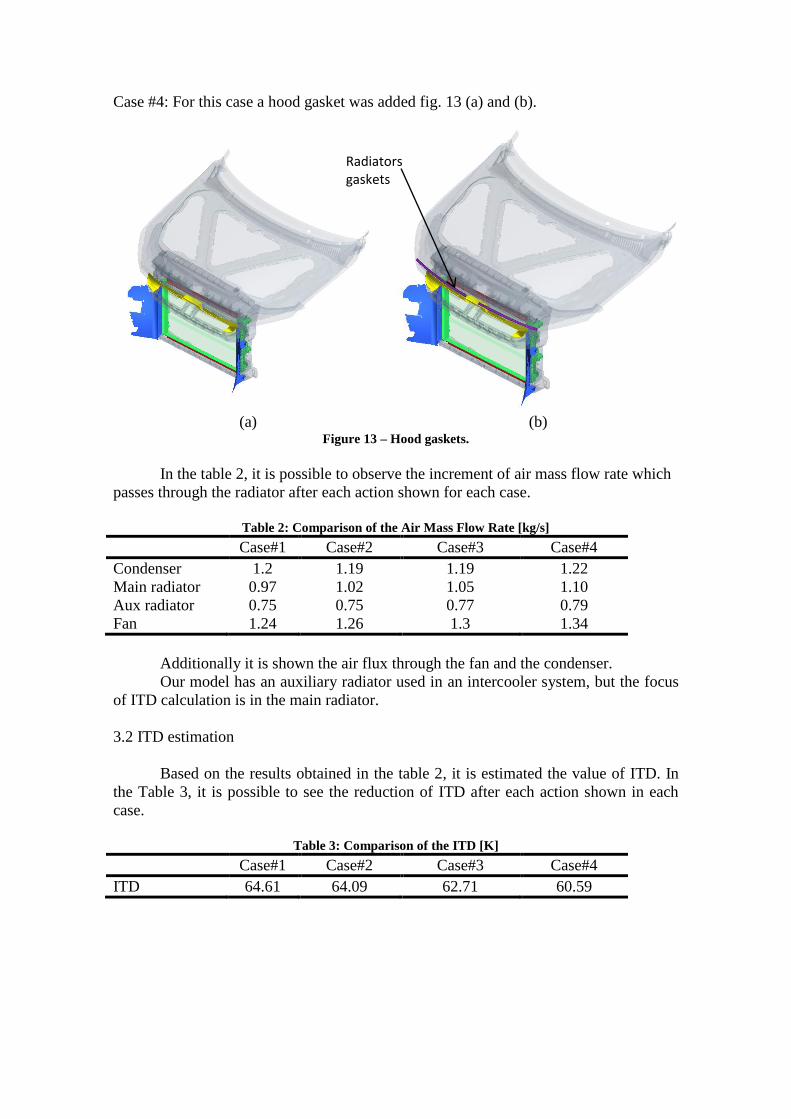
Case #4: For this case a hood gasket was added fig. 13 (a) and (b).
(a) (b) Figure 13 – Hood gaskets.
In the table 2, it is possible to observe the increment of air mass flow rate which
passes through the radiator after each action shown for each case.
Table 2: Comparison of the Air Mass Flow Rate [kg/s]
Case#1 Case#2 Case#3 Case#4
Condenser 1.2 1.19 1.19 1.22
Main radiator 0.97 1.02 1.05 1.10
Aux radiator 0.75 0.75 0.77 0.79
Fan 1.24 1.26 1.3 1.34
Additionally it is shown the air flux through the fan and the condenser.
Our model has an auxiliary radiator used in an intercooler system, but the focus
of ITD calculation is in the main radiator.
3.2 ITD estimation
Based on the results obtained in the table 2, it is estimated the value of ITD. In
the Table 3, it is possible to see the reduction of ITD after each action shown in each
case.
Table 3: Comparison of the ITD [K]
Case#1 Case#2 Case#3 Case#4
ITD 64.61 64.09 62.71 60.59
Radiators gaskets
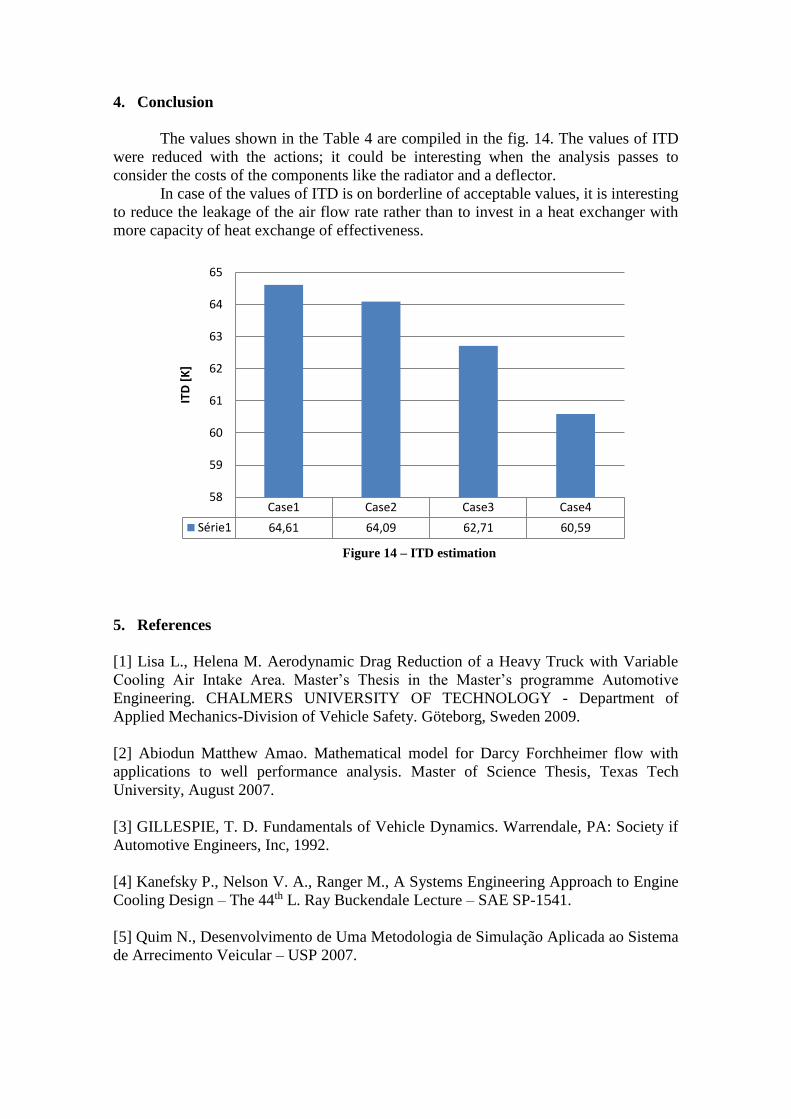
4. Conclusion
The values shown in the Table 4 are compiled in the fig. 14. The values of ITD
were reduced with the actions; it could be interesting when the analysis passes to
consider the costs of the components like the radiator and a deflector.
In case of the values of ITD is on borderline of acceptable values, it is interesting
to reduce the leakage of the air flow rate rather than to invest in a heat exchanger with
more capacity of heat exchange of effectiveness.
Figure 14 – ITD estimation
5. References
[1] Lisa L., Helena M. Aerodynamic Drag Reduction of a Heavy Truck with Variable
Cooling Air Intake Area. Master’s Thesis in the Master’s programme Automotive
Engineering. CHALMERS UNIVERSITY OF TECHNOLOGY - Department of
Applied Mechanics-Division of Vehicle Safety. Göteborg, Sweden 2009.
[2] Abiodun Matthew Amao. Mathematical model for Darcy Forchheimer flow with
applications to well performance analysis. Master of Science Thesis, Texas Tech
University, August 2007.
[3] GILLESPIE, T. D. Fundamentals of Vehicle Dynamics. Warrendale, PA: Society if
Automotive Engineers, Inc, 1992.
[4] Kanefsky P., Nelson V. A., Ranger M., A Systems Engineering Approach to Engine
Cooling Design – The 44th L. Ray Buckendale Lecture – SAE SP-1541.
[5] Quim N., Desenvolvimento de Uma Metodologia de Simulação Aplicada ao Sistema
de Arrecimento Veicular – USP 2007.
Case1 Case2 Case3 Case4
Série1 64,61 64,09 62,71 60,59
58
59
60
61
62
63
64
65
ITD
[K
]

[6] Mouffouk, M. A., Aerodinnamic Development of the Seguracing F1-R01 Prototype
Using CFD- University H.L of Batna Department of Mechanical Engineering Specialty
Aeronautical Engineering– Batma/Alderia 2013/2014